User login
Calquence earns breakthrough designation for CLL monotherapy

The Bruton tyrosine kinase inhibitor is already approved for the treatment of adults with mantle cell lymphoma who have received at least one prior therapy, and multiple trials are underway to evaluate the drug’s use in a variety of B-cell malignancies, according to the drug’s sponsor, AstraZeneca.
The current designation was based on preliminary results from two phase 3 trials – ELEVATE-TN and ASCEND. In the three-arm ELEVATE-TN trial, researchers evaluated acalabrutinib alone or in combination with obinutuzumab versus chlorambucil plus obinutuzumab in previously untreated patients with CLL. In the two-arm ASCEND trial, previously treated patients with CLL were randomized to receive acalabrutinib monotherapy or the physician’s choice of either rituximab plus idelalisib or rituximab plus bendamustine.
Interim analyses of the two trials showed that acalabrutinib alone, or in combination, significantly improved progression-free survival without raising safety concerns.
Breakthrough therapy designation allows for an expedited review by the FDA for treatments aimed at treating serious conditions where there is preliminary clinical evidence showing a substantial improvement over an available therapy or a clinically significant endpoint.
Successful Treatment of Refractory Epidermolysis Bullosa Acquisita With Intravenous Immunoglobulin and Dapsone
To the Editor:
Evidence-based recommendations for optimal medical management of patients with immunobullous diseases prior to elective surgery are sparse.1,2 There is an uncertain balance between the use of immunomodulators and immunosuppressants, and implementation of these agents is heavily weighted against an increased infection risk from both active disease with denuded skin and suboptimal wound healing due to iatrogenic immunosuppression.1-5 Historically, clinical management of epidermolysis bullosa acquisita (EBA) seldomly has resulted in substantial disease resolution.1,3,4 Herein, we describe a case of recalcitrant EBA that was treated with a combination of intravenous immunoglobulin (IVIG) and dapsone, which resulted in a favorable clinical response and successful hip arthroplasty without cutaneous complications.
A 66-year-old man presented to an outside clinic with nonhealing ulcers on the oral mucosa, hands, groin, and feet. He was treated with systemic steroids after a histologic examination suggested bullous pemphigoid, but the lesions did not exhibit any appreciable improvement after several months of treatment. Despite the lack of improvement, the patient was continued on systemic steroids with a waxing and waning disease course.
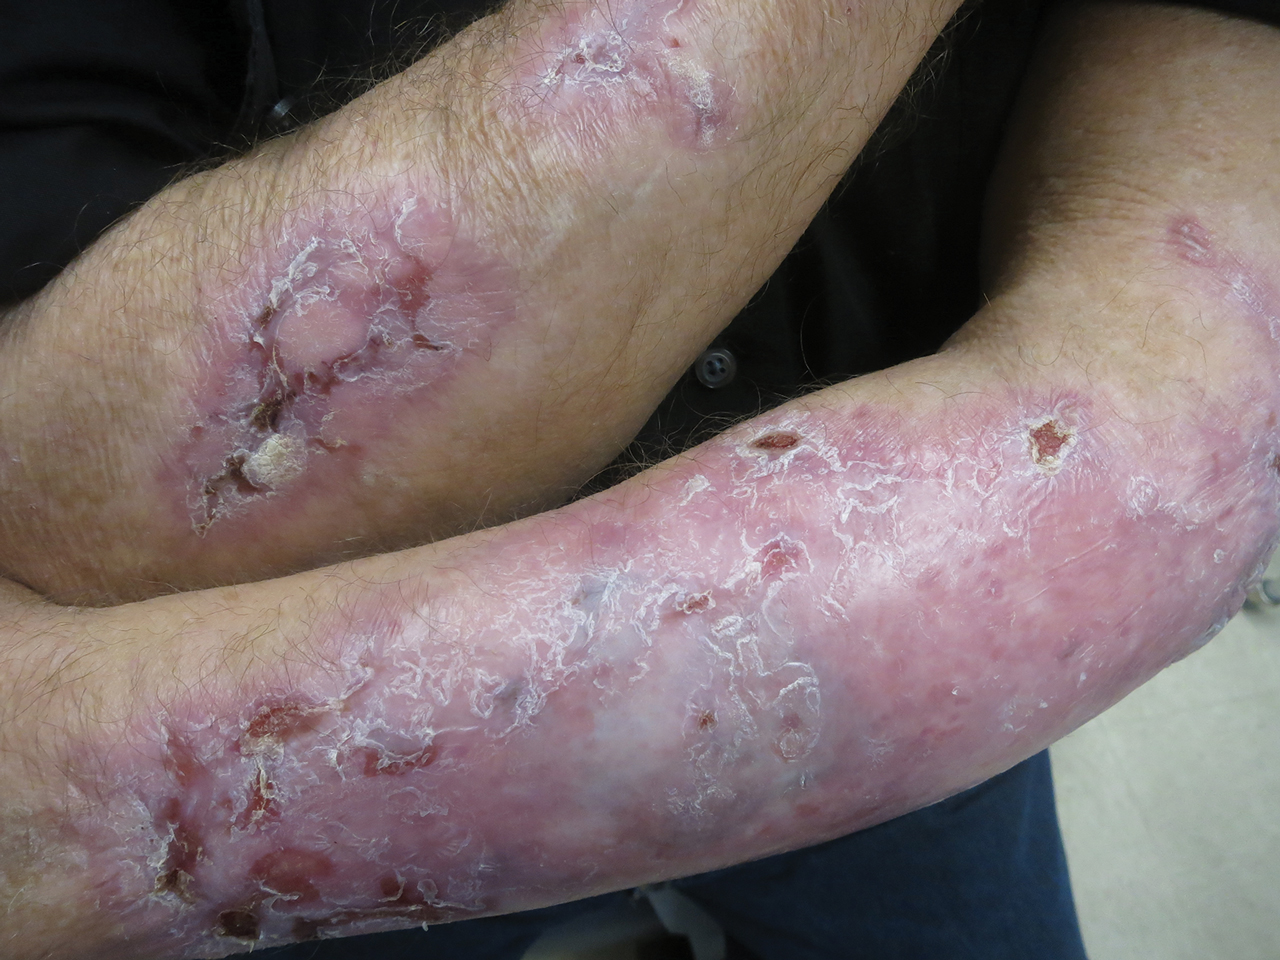
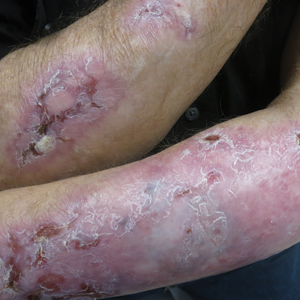
Within a year, the patient presented to an orthopedist at our institution with severe left hip pain that had been limiting his mobility and had become unresponsive to conservative therapy. Radiologic investigations suggested advanced osteoarthritis and avascular necrosis of the left hip. Surgical intervention was delayed, as his orthopedist expressed concern that the extent of the body surface area affected by cutaneous denudation placed him at an unacceptable risk for infection. The orthopedic surgeon then referred the patient to our clinic for evaluation of the lesions. Physical examination revealed numerous crusted erosions in various stages of healing on the oral mucosa, palms, groin, and soles. Repeat biopsy of a denuded ulcer on the patient’s arm was obtained by our providers (nearly 1 year after the first biopsy by the outside physician). Histologic examination showed a pauci-immune subepidermal blister without acantholysis, which in combination with the clinical presentation of tense bullae on trauma-prone surfaces led to a favored diagnosis of EBA.
The patient began trials of several immunomodulatory and immunosuppressive agents, both in isolation and in combination, including systemic steroids, mycophenolate mofetil, four 1000-mg infusions of rituximab, and dapsone. Although results were suboptimal, dapsone 150 mg once daily for 3 months yielded the greatest clinical improvement with subsequent granulation and/or re-epithelialization of the chronic ulcers. After discussion during our department’s Grand Rounds, it was determined that the patient should undergo a trial of IVIG infusions, which were initiated with a loading dose of 2000 mg/kg over 5 consecutive days, followed by once-monthly maintenance infusion doses of 1200 mg/kg for 4 consecutive months. While receiving IVIG, he was maintained on a once-daily dose of dapsone 150 mg
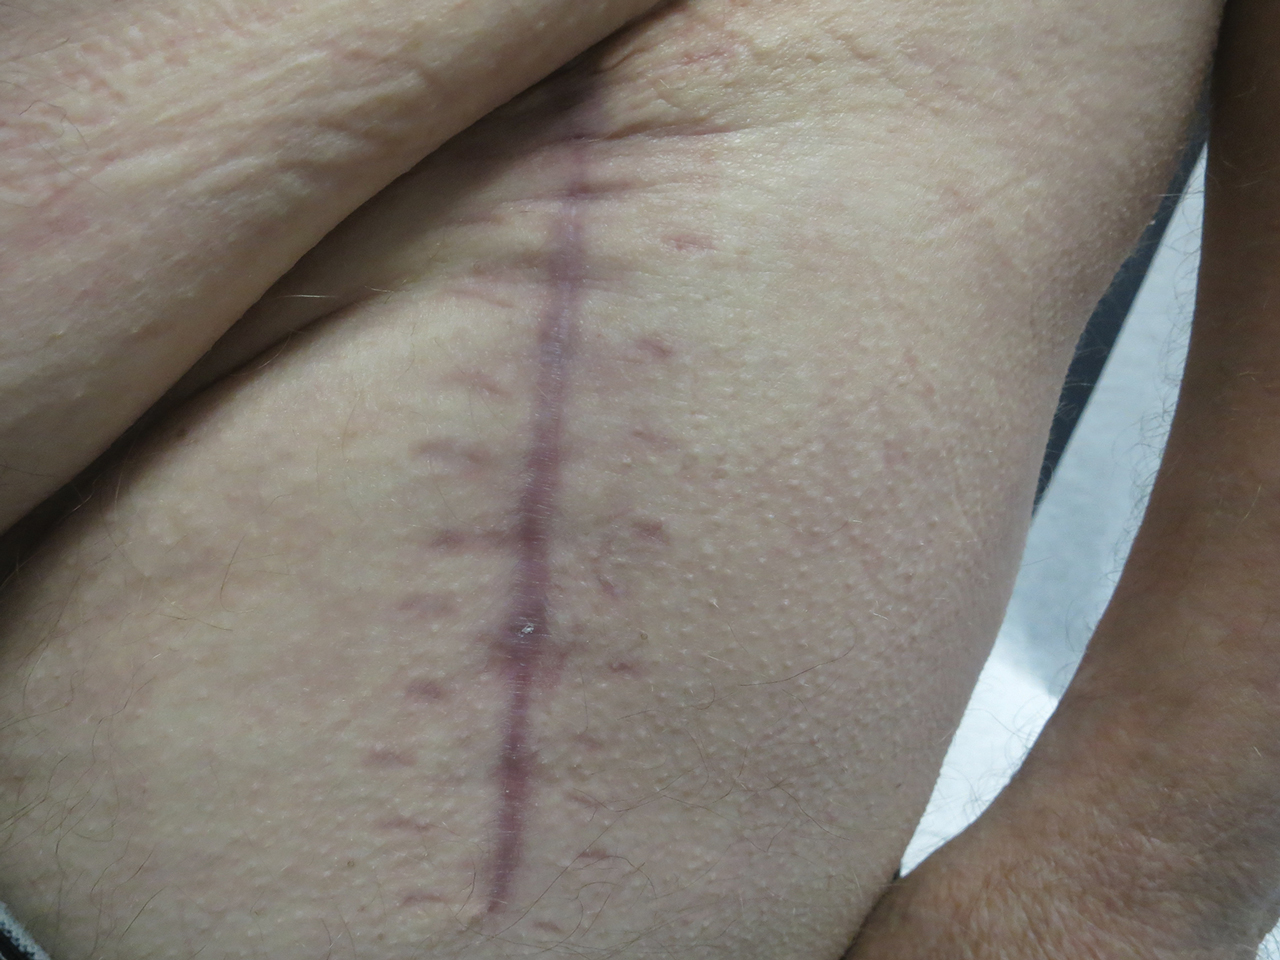
Following this treatment regimen, he was noted to have marked improvement with only few scattered healing erosions. Upon completion of his last IVIG infusion, his cutaneous and mucosal manifestations of EBA were greatly minimized, demonstrating the best level of control that had been achieved during the disease course (Figure 1). This therapy completely cleared the cutaneous and mucosal ulcerations, thus permitting the patient to undergo a total left hip arthroplasty without complications (Figure 2).
Our report is novel in that it supports a combination of IVIG and dapsone as a viable presurgical therapy for patients with EBA, and this treatment also may be applicable for other primary immunobullous disorders.2,5 Our case was particularly challenging in that the severity of the patient’s bullous disease precluded him from an elective orthopedic joint replacement due to the risk for wound dehiscence and surgical site infection.2 We determined that IVIG and dapsone would be the most optimal combination therapy to facilitate superior disease control and concurrently allow for appropriate wound healing without impairing the host immune response. This report is unique from a clinical perspective in that a balance was successfully achieved between immune suppression, with avoidance of associated side effects, and disease activity.
- Ahmed AR, Gürcan HM. Treatment of epidermolysis bullosa acquisita with intravenous immunoglobulin in patients non-responsive to conventional therapy: clinical outcome and post-treatment long-term follow-up [published online August 8, 2011]. J Eur Acad Dermatol Venereol. 2012;26:1074-1083.
- Rubin J, Touloei K, Favreau T, et al. Mohs surgery in patients immunobullous diseases: should prednisone be increased prior to surgery? J Clin Aesthet Dermatol. 2014;7:45-46.
- Ishii N, Hamada T, Dainichi T, et al. Epidermolysis bullosa acquisita: what’s new? J Dermatol. 2010;37:220-230.
- Mosqueira CB, Furlani Lde A, Xavier AF, et al. Intravenous immunoglobulin for treatment of severe acquired bullous epidermolysis refractory to conventional immunosuppressive therapy. An Bras Dermatol. 2010;85:521-524.
- Ludwig RJ. Clinical presentation, pathogenesis, diagnosis, and treatment of EBA. ISRN Dermatology. 2013;2013:812029.
To the Editor:
Evidence-based recommendations for optimal medical management of patients with immunobullous diseases prior to elective surgery are sparse.1,2 There is an uncertain balance between the use of immunomodulators and immunosuppressants, and implementation of these agents is heavily weighted against an increased infection risk from both active disease with denuded skin and suboptimal wound healing due to iatrogenic immunosuppression.1-5 Historically, clinical management of epidermolysis bullosa acquisita (EBA) seldomly has resulted in substantial disease resolution.1,3,4 Herein, we describe a case of recalcitrant EBA that was treated with a combination of intravenous immunoglobulin (IVIG) and dapsone, which resulted in a favorable clinical response and successful hip arthroplasty without cutaneous complications.
A 66-year-old man presented to an outside clinic with nonhealing ulcers on the oral mucosa, hands, groin, and feet. He was treated with systemic steroids after a histologic examination suggested bullous pemphigoid, but the lesions did not exhibit any appreciable improvement after several months of treatment. Despite the lack of improvement, the patient was continued on systemic steroids with a waxing and waning disease course.
Within a year, the patient presented to an orthopedist at our institution with severe left hip pain that had been limiting his mobility and had become unresponsive to conservative therapy. Radiologic investigations suggested advanced osteoarthritis and avascular necrosis of the left hip. Surgical intervention was delayed, as his orthopedist expressed concern that the extent of the body surface area affected by cutaneous denudation placed him at an unacceptable risk for infection. The orthopedic surgeon then referred the patient to our clinic for evaluation of the lesions. Physical examination revealed numerous crusted erosions in various stages of healing on the oral mucosa, palms, groin, and soles. Repeat biopsy of a denuded ulcer on the patient’s arm was obtained by our providers (nearly 1 year after the first biopsy by the outside physician). Histologic examination showed a pauci-immune subepidermal blister without acantholysis, which in combination with the clinical presentation of tense bullae on trauma-prone surfaces led to a favored diagnosis of EBA.
The patient began trials of several immunomodulatory and immunosuppressive agents, both in isolation and in combination, including systemic steroids, mycophenolate mofetil, four 1000-mg infusions of rituximab, and dapsone. Although results were suboptimal, dapsone 150 mg once daily for 3 months yielded the greatest clinical improvement with subsequent granulation and/or re-epithelialization of the chronic ulcers. After discussion during our department’s Grand Rounds, it was determined that the patient should undergo a trial of IVIG infusions, which were initiated with a loading dose of 2000 mg/kg over 5 consecutive days, followed by once-monthly maintenance infusion doses of 1200 mg/kg for 4 consecutive months. While receiving IVIG, he was maintained on a once-daily dose of dapsone 150 mg
Following this treatment regimen, he was noted to have marked improvement with only few scattered healing erosions. Upon completion of his last IVIG infusion, his cutaneous and mucosal manifestations of EBA were greatly minimized, demonstrating the best level of control that had been achieved during the disease course (Figure 1). This therapy completely cleared the cutaneous and mucosal ulcerations, thus permitting the patient to undergo a total left hip arthroplasty without complications (Figure 2).
Our report is novel in that it supports a combination of IVIG and dapsone as a viable presurgical therapy for patients with EBA, and this treatment also may be applicable for other primary immunobullous disorders.2,5 Our case was particularly challenging in that the severity of the patient’s bullous disease precluded him from an elective orthopedic joint replacement due to the risk for wound dehiscence and surgical site infection.2 We determined that IVIG and dapsone would be the most optimal combination therapy to facilitate superior disease control and concurrently allow for appropriate wound healing without impairing the host immune response. This report is unique from a clinical perspective in that a balance was successfully achieved between immune suppression, with avoidance of associated side effects, and disease activity.
- Ahmed AR, Gürcan HM. Treatment of epidermolysis bullosa acquisita with intravenous immunoglobulin in patients non-responsive to conventional therapy: clinical outcome and post-treatment long-term follow-up [published online August 8, 2011]. J Eur Acad Dermatol Venereol. 2012;26:1074-1083.
- Rubin J, Touloei K, Favreau T, et al. Mohs surgery in patients immunobullous diseases: should prednisone be increased prior to surgery? J Clin Aesthet Dermatol. 2014;7:45-46.
- Ishii N, Hamada T, Dainichi T, et al. Epidermolysis bullosa acquisita: what’s new? J Dermatol. 2010;37:220-230.
- Mosqueira CB, Furlani Lde A, Xavier AF, et al. Intravenous immunoglobulin for treatment of severe acquired bullous epidermolysis refractory to conventional immunosuppressive therapy. An Bras Dermatol. 2010;85:521-524.
- Ludwig RJ. Clinical presentation, pathogenesis, diagnosis, and treatment of EBA. ISRN Dermatology. 2013;2013:812029.
Practice Points
- Treatment of epidermolysis bullosa acquisita (EBA) is difficult, and most treatment regimens are based on anecdotal reports.
- Systemic corticosteroids have been the mainstay of therapy for severe or extensive disease but impose an increased risk for postoperative complications including surgical site infections.
- A steroid-sparing regimen of intravenous immunoglobulin and systemic dapsone may be used when rapid clearance of EBA is needed prior to elective surgery.
Blood test may reveal brain injury
researchers reported Aug. 26 in BMJ Paediatrics Open.

“GFAP outperformed UCH-L1 in detecting concussion in both children and adults within 4 hours of injury,” reported lead author Linda Papa, MD, and collaborators. Dr. Papa is an emergency medicine doctor at Orlando Health. “UCH-L1 was expressed at much higher levels than GFAP in those with nonconcussive trauma, particularly in children. Elevations of these biomarkers in nonconcussive head trauma suggest possible subconcussive brain injury. GFAP could be potentially useful to detect concussion for up to a week post injury.”
In 2018 the Food and Drug Administration approved the use of these biomarkers to guide CT scan ordering in adults with mild to moderate traumatic brain injury, but investigators have not established their ability to detect concussion in children or adults. Clinicians lack an objective measure to diagnose concussion acutely.
To assess the ability of GFAP and UCH-L1 to detect concussion, Dr. Papa and colleagues conducted a prospective cohort study. The researchers enrolled trauma patients of all ages at three level I trauma centers in the United States. They included patients with and without head trauma who had a Glasgow Coma Scale score of 15 and who presented within 4 hours of injury. Investigators screened for concussion symptoms, obtained biomarker data from 712 trauma patients, and conducted repeated blood sampling in adults.
They grouped patients by those with concussion (n = 371), those with head trauma without overt signs of concussion (n = 149), and those with peripheral trauma without head trauma or concussion (n = 192). The study included 175 children. Injury mechanisms included car crashes, falls, bicycle accidents, and sports injuries.
Patients with concussion had significantly higher GFAP concentrations, compared with patients with body trauma and patients with nonconcussive head trauma. UCH-L1 levels did not significantly differ between patients with concussion and head trauma controls, however.
“Based on these results, the potential utility of GFAP to distinguish concussion from body trauma controls over 7 days postinjury was fair to excellent,” with area under the receiver operating characteristics curves (AUCs) of 0.75-0.89, the researchers said. “UCH-L1’s ability was guarded and variable with AUCs from poor to good depending on timing of samples.” UCH-L1 demonstrated AUCs that ranged from 0.54 to 0.78; earlier samples performed better.
GFAP elevations in head trauma controls “may represent milder forms of concussion that do not elicit typical signs or symptoms associated with concussion,” the authors wrote. “These injuries may be irrelevant, or they may represent important trauma that is just below the level of clinical detection and referred to as subconcussive trauma. ... Biomarkers (such as GFAP and UCH-L1) could provide a more objective measure of injury and potentially identify those at risk for neurocognitive problems.”
The study was supported by the National Institute of Neurological Disorders and Stroke. Dr. Papa is an unpaid scientific consultant for Banyan Biomarkers, which developed kits to measure the biomarkers, and coauthors receive contract research funding from Banyan Biomarkers.
SOURCE: Papa L et al. BMJ Paediatr Open. 2019 Aug 26. doi: 10.1136/bmjpo-2019-000473.
researchers reported Aug. 26 in BMJ Paediatrics Open.
“GFAP outperformed UCH-L1 in detecting concussion in both children and adults within 4 hours of injury,” reported lead author Linda Papa, MD, and collaborators. Dr. Papa is an emergency medicine doctor at Orlando Health. “UCH-L1 was expressed at much higher levels than GFAP in those with nonconcussive trauma, particularly in children. Elevations of these biomarkers in nonconcussive head trauma suggest possible subconcussive brain injury. GFAP could be potentially useful to detect concussion for up to a week post injury.”
In 2018 the Food and Drug Administration approved the use of these biomarkers to guide CT scan ordering in adults with mild to moderate traumatic brain injury, but investigators have not established their ability to detect concussion in children or adults. Clinicians lack an objective measure to diagnose concussion acutely.
To assess the ability of GFAP and UCH-L1 to detect concussion, Dr. Papa and colleagues conducted a prospective cohort study. The researchers enrolled trauma patients of all ages at three level I trauma centers in the United States. They included patients with and without head trauma who had a Glasgow Coma Scale score of 15 and who presented within 4 hours of injury. Investigators screened for concussion symptoms, obtained biomarker data from 712 trauma patients, and conducted repeated blood sampling in adults.
They grouped patients by those with concussion (n = 371), those with head trauma without overt signs of concussion (n = 149), and those with peripheral trauma without head trauma or concussion (n = 192). The study included 175 children. Injury mechanisms included car crashes, falls, bicycle accidents, and sports injuries.
Patients with concussion had significantly higher GFAP concentrations, compared with patients with body trauma and patients with nonconcussive head trauma. UCH-L1 levels did not significantly differ between patients with concussion and head trauma controls, however.
“Based on these results, the potential utility of GFAP to distinguish concussion from body trauma controls over 7 days postinjury was fair to excellent,” with area under the receiver operating characteristics curves (AUCs) of 0.75-0.89, the researchers said. “UCH-L1’s ability was guarded and variable with AUCs from poor to good depending on timing of samples.” UCH-L1 demonstrated AUCs that ranged from 0.54 to 0.78; earlier samples performed better.
GFAP elevations in head trauma controls “may represent milder forms of concussion that do not elicit typical signs or symptoms associated with concussion,” the authors wrote. “These injuries may be irrelevant, or they may represent important trauma that is just below the level of clinical detection and referred to as subconcussive trauma. ... Biomarkers (such as GFAP and UCH-L1) could provide a more objective measure of injury and potentially identify those at risk for neurocognitive problems.”
The study was supported by the National Institute of Neurological Disorders and Stroke. Dr. Papa is an unpaid scientific consultant for Banyan Biomarkers, which developed kits to measure the biomarkers, and coauthors receive contract research funding from Banyan Biomarkers.
SOURCE: Papa L et al. BMJ Paediatr Open. 2019 Aug 26. doi: 10.1136/bmjpo-2019-000473.
FROM BMJ PAEDIATRICS OPEN
Key clinical point: Levels of glial fibrillary acidic protein (GFAP) and ubiquitin C-terminal hydrolase L1 (UCH-L1) are lowest in patients with nonconcussive body trauma, higher in patients with nonconcussive head trauma, and highest in patients with concussion.
Major finding: GFAP was fair to excellent at distinguishing concussion from body trauma, with area under the receiver operating characteristics curves of 0.75-0.89.
Study details: A prospective cohort study of 712 trauma patients of all ages at three level I trauma centers in the United States. The study included patients with and without head trauma who had a Glasgow Coma Scale score of 15 and presented within 4 hours of injury.
Disclosures: The study was supported by the National Institute of Neurological Disorders and Stroke. Dr. Papa is an unpaid scientific consultant for Banyan Biomarkers, which developed kits to measure the biomarkers. Coauthors receive contract research funding from Banyan Biomarkers.
Source: Papa L et al. BMJ Paediatr Open. 2019 Aug 26. doi: 10.1136/bmjpo-2019-000473.
Perceived discrimination linked to delay in ovarian cancer diagnosis for black women
Perceived everyday discrimination was associated with an extended duration between symptom onset and cancer diagnosis (prolonged symptom duration) in black women with ovarian cancer, according to results from a case-control analysis.
In contrast, another interpersonal factor, trust in physicians, was not associated with prolonged symptom duration.
“We [examined] the association of everyday discrimination and trust in physicians with a prolonged interval between symptom onset and ovarian cancer diagnosis,” wrote Megan A. Mullins, MPH, of the University of Michigan, Ann Arbor, and colleagues. The findings were published in Cancer.
The analysis included 486 cases of black women with newly diagnosed epithelial ovarian cancer, 302 of whom had prolonged symptom duration. Study cases were obtained from the African American Cancer Epidemiology Study that took place from December 2010 to December 2015. Perceived discrimination was evaluated with the five-question version of the Williams Everyday Discrimination Scale.
In the model, adjustments were made for various demographic characteristics, including marital status, body mass index, and age at diagnosis, among other parameters.
After analysis, the researchers found that every 1-unit rise in the frequency of everyday discrimination was associated with a higher likelihood of prolonged symptom duration (odds ratio, 1.74; 95% confidence interval, 1.22-2.49).
No association was found between trust in physicians and prolonged symptom duration (odds ratio, 0.86; 95% CI, 0.66-1.11).
“These results point to the social context in daily life playing a role in receiving optimal ovarian cancer care,” the researchers wrote.
One key limitation of the study was that the data was obtained in a cross-sectional manner, which could introduce bias because of reverse causality.
“This work is a novel first step in understanding the relationship between interpersonal exposures and racial disparities in ovarian cancer care. More equitable access to ovarian cancer care necessitates that women feel comfortable about advocating for their needs and trust their self-assessment of their symptoms,” they concluded.
The study was funded by the National Cancer Institute, the Metropolitan Detroit Cancer Surveillance System, and the Epidemiology Research Core. The authors reported no conflicts of interest.
SOURCE: Mullins MA et al. Cancer. 2019 Aug 15. doi: 10.1002/cncr.32451.
FROM CANCER
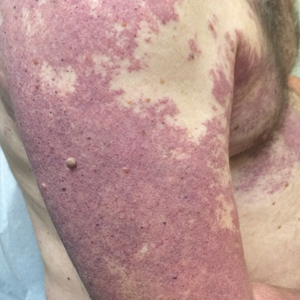
Violaceous Patches on the Arm
The Diagnosis: Phacomatosis Cesioflammea
Phacomatosis pigmentovascularis (PPV) encompasses a group of diseases that have a vascular nevus coupled with a pigmented nevus.1 It is divided into 5 types: Type I is defined by the presence of a vascular malformation and epidermal nevus; type II by a vascular malformation and dermal melanosis with or without nevus anemicus; type III by a vascular malformation and nevus spilus with or without nevus anemicus; type IV by a vascular malformation, dermal melanosis, and nevus spilus with or without nevus anemicus; and type V as cutis marmorata telangiectatica congenita and dermal melanosis.1
Happle2 proposed a descriptive classification system in 2005 that eliminated type I PPV because neither linear epidermal nevus nor Becker nevus are derived from pigmentary cells. An appended "a" denotes a subtype with isolated cutaneous findings, while "b" is associated with extracutaneous manifestations. Phacomatosis cesioflammea (type IIa/b) refers to blue-hued dermal melanocytosis and nevus flammeus. Phacomatosis spilorosea (type IIIa/b) refers to nevus spilus and rose-colored nevus flammeus. Phacomatosis cesiomarmorata (type Va/b) refers to dermal melanocytosis and cutis marmorata telangiectasia congenita. The last group (type IVa/b) is unclassifiable phacomatosis pigmentovascularis.2,3
Phacomatosis pigmentovascularis can be isolated to the skin or have associated extracutaneous findings, including ocular melanocytosis, seizures, or cognitive delay due to intracerebral vascular malformations. Patients also can develop limb and soft-tissue overgrowth.4 Phacomatosis pigmentovascularis has been found to be associated with mutations in the GNA11 and GNAQ genes. The theory behind PPV is twin spotting, resulting from a somatic mutation that leads to mosaic proliferation of 2 different cell lines.5 Phacomatosis pigmentovascularis can occur in isolation or can demonstrate the phenotype of Sturge-Weber syndrome or Klippel-Trenaunay syndrome. In Sturge-Weber syndrome, capillary malformations involve the face and underlying leptomeninges and cerebral cortex. Glaucoma and epilepsy also may be present. In Klippel-Trenaunay syndrome, capillary malformations involve the extremities (usually the legs) in association with varicose veins, soft-tissue hypertrophy, and skeletal overgrowth.6-9 Tuberous sclerosis is an autosomal-dominant neurocutaneous disease in which patients develop hamartomas throughout the body, including the brain, skin, eyes, kidneys, heart, and lungs. Cutaneous manifestations include facial angiofibromas, ungual fibromas, hypomelanotic macules (ash leaf spots, confetti-like lesions), shagreen patches or connective tissue hamartomas, and fibrous plaques on the forehead. Tuberous sclerosis does not include vascular malformations.10
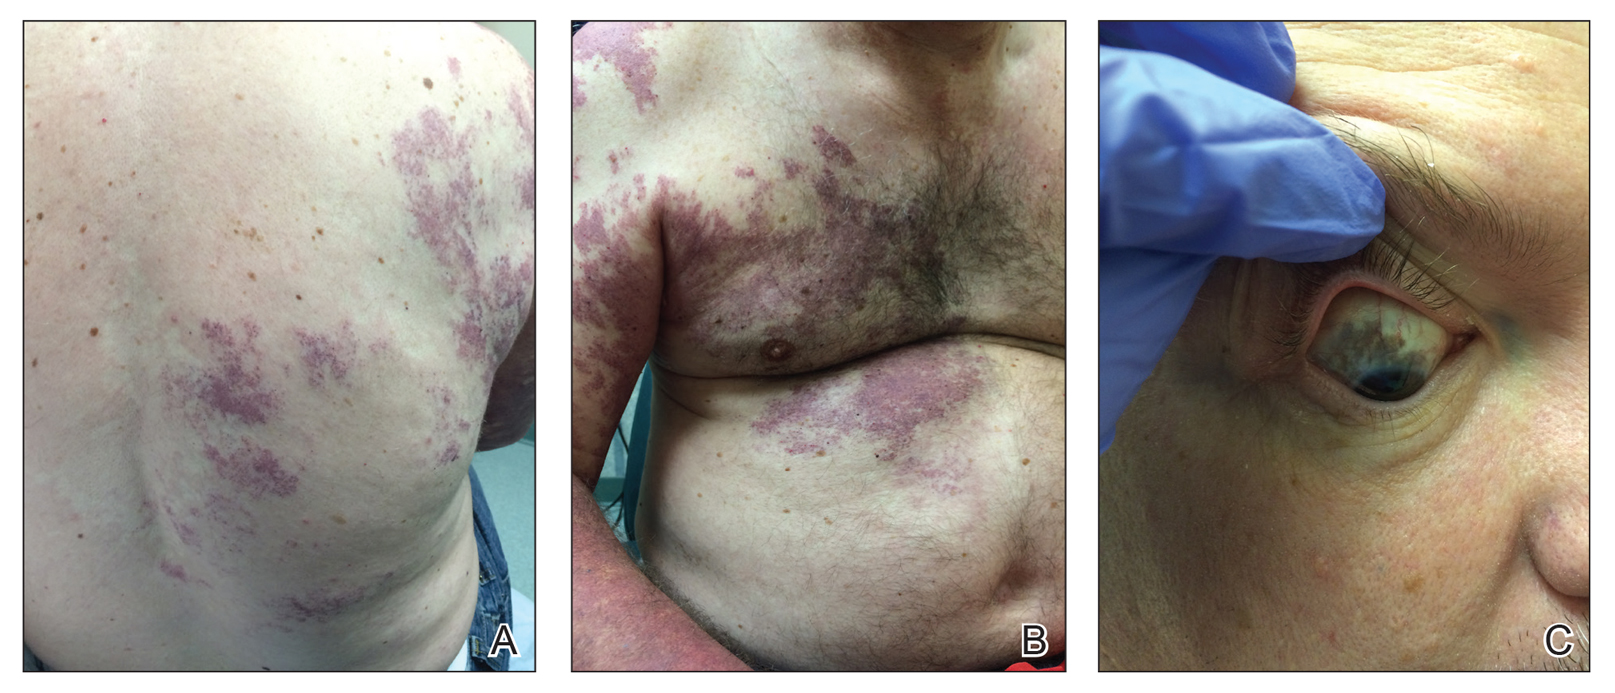
Our patient was diagnosed with PPV type IIb, or phacomatosis cesioflammea. He had a large port-wine stain involving the right upper arm, back (Figure, A), and chest (Figure, B) with involvement of the bilateral conjunctivae (Figure, C). Our case is unique because our patient did not have dermal melanocytosis, only ocular melanocytosis.
Once underlying neurologic and vascular anomalies have been ruled out, port-wine stains can be treated cosmetically. Pulsed dye laser is the gold standard therapy for capillary malformations, especially when instituted early. Follow-up with ophthalmology is advised to monitor ocular involvement. Shields et al11 suggested dilated fundoscopy for patients with port-wine stains because choroidal pigmentation often is the only ocular change seen. Ocular melanocytosis can progress to pigmented glaucoma or choroidal melanoma.
- Fernandez-Guarino M, Boixeda P, De las Heras E, et al. Phakomatosis pigmentovascularis: clinical findings in 15 patients and review of the literature. J Am Acad Dermatol. 2008;58:88-93.
- Happle R. Phacomatosis pigmentovascularis revisited and reclassified. Arch Dermatol. 2005;141:385-388.
- Villarreal DJ, Leal F. Phacomatosis pigmentovascularis of cesioflammea type. An Bras Dermatol. 2016;91(5 suppl 1):54-56.
- Thomas AC, Zeng Z, Riviere JB, et al. Mosaic activating mutations in GNA11 and GNAQ are associated with phakomatosis pigmentovascularis and extensive dermal melanocytosis. J Invest Dermatol. 2016;136:770-778.
- Krema H, Simpson R, McGowan H. Choroidal melanoma in phacomatosis pigmentovascularis cesioflammea. Can J Ophthalmol. 2013;48:E41-E42.
- Wu CY, Chen PH, Chen GS. Phacomatosis cesioflammea associated with pectus excavatum. Acta Derm Venereol. 2009;89:301-310.
- Pradhan S, Patnaik S, Padhi T, et al. Phakomatosis pigmentovascularis type IIb, Sturge-Weber syndrome and cone shaped tongue: an unusual association. Indian J Dermatol Venereol Leprol. 2015;81:614-616.
- Turk BG, Turkmen M, Tuna A, et al. Phakomatosis pigmentovascularis type IIb associated with Klippel-Trenaunay syndrome and congenital triangular alopecia. J Am Acad Dermatol. 2011;65:E46-E49.
- Sen S, Bala S, Halder C, et al. Phakomatosis pigmentovascularis presenting with Sturge-Weber syndrome and Klippel-Trenaunay syndrome. Indian J Dermatol. 2015;60:77-79.
- Schwartz RA, Fernandez G, Kotulska K, et al. Tuberous sclerosis complex: advances in diagnosis, genetics, and management. J Am Acad Dermatol. 2007;57:189-202.
- Shields CL, Kligman BE, Suriano M, et al. Phacomatosis pigmentovascularis of cesioflammea type in 7 patients: combination of ocular pigmentation (melanocytosis or melanosis) and nevus flammeus with risk for melanoma. Arch Ophthalmol. 2011;129:746-750.
The Diagnosis: Phacomatosis Cesioflammea
Phacomatosis pigmentovascularis (PPV) encompasses a group of diseases that have a vascular nevus coupled with a pigmented nevus.1 It is divided into 5 types: Type I is defined by the presence of a vascular malformation and epidermal nevus; type II by a vascular malformation and dermal melanosis with or without nevus anemicus; type III by a vascular malformation and nevus spilus with or without nevus anemicus; type IV by a vascular malformation, dermal melanosis, and nevus spilus with or without nevus anemicus; and type V as cutis marmorata telangiectatica congenita and dermal melanosis.1
Happle2 proposed a descriptive classification system in 2005 that eliminated type I PPV because neither linear epidermal nevus nor Becker nevus are derived from pigmentary cells. An appended "a" denotes a subtype with isolated cutaneous findings, while "b" is associated with extracutaneous manifestations. Phacomatosis cesioflammea (type IIa/b) refers to blue-hued dermal melanocytosis and nevus flammeus. Phacomatosis spilorosea (type IIIa/b) refers to nevus spilus and rose-colored nevus flammeus. Phacomatosis cesiomarmorata (type Va/b) refers to dermal melanocytosis and cutis marmorata telangiectasia congenita. The last group (type IVa/b) is unclassifiable phacomatosis pigmentovascularis.2,3
Phacomatosis pigmentovascularis can be isolated to the skin or have associated extracutaneous findings, including ocular melanocytosis, seizures, or cognitive delay due to intracerebral vascular malformations. Patients also can develop limb and soft-tissue overgrowth.4 Phacomatosis pigmentovascularis has been found to be associated with mutations in the GNA11 and GNAQ genes. The theory behind PPV is twin spotting, resulting from a somatic mutation that leads to mosaic proliferation of 2 different cell lines.5 Phacomatosis pigmentovascularis can occur in isolation or can demonstrate the phenotype of Sturge-Weber syndrome or Klippel-Trenaunay syndrome. In Sturge-Weber syndrome, capillary malformations involve the face and underlying leptomeninges and cerebral cortex. Glaucoma and epilepsy also may be present. In Klippel-Trenaunay syndrome, capillary malformations involve the extremities (usually the legs) in association with varicose veins, soft-tissue hypertrophy, and skeletal overgrowth.6-9 Tuberous sclerosis is an autosomal-dominant neurocutaneous disease in which patients develop hamartomas throughout the body, including the brain, skin, eyes, kidneys, heart, and lungs. Cutaneous manifestations include facial angiofibromas, ungual fibromas, hypomelanotic macules (ash leaf spots, confetti-like lesions), shagreen patches or connective tissue hamartomas, and fibrous plaques on the forehead. Tuberous sclerosis does not include vascular malformations.10
Our patient was diagnosed with PPV type IIb, or phacomatosis cesioflammea. He had a large port-wine stain involving the right upper arm, back (Figure, A), and chest (Figure, B) with involvement of the bilateral conjunctivae (Figure, C). Our case is unique because our patient did not have dermal melanocytosis, only ocular melanocytosis.
Once underlying neurologic and vascular anomalies have been ruled out, port-wine stains can be treated cosmetically. Pulsed dye laser is the gold standard therapy for capillary malformations, especially when instituted early. Follow-up with ophthalmology is advised to monitor ocular involvement. Shields et al11 suggested dilated fundoscopy for patients with port-wine stains because choroidal pigmentation often is the only ocular change seen. Ocular melanocytosis can progress to pigmented glaucoma or choroidal melanoma.
- Fernandez-Guarino M, Boixeda P, De las Heras E, et al. Phakomatosis pigmentovascularis: clinical findings in 15 patients and review of the literature. J Am Acad Dermatol. 2008;58:88-93.
- Happle R. Phacomatosis pigmentovascularis revisited and reclassified. Arch Dermatol. 2005;141:385-388.
- Villarreal DJ, Leal F. Phacomatosis pigmentovascularis of cesioflammea type. An Bras Dermatol. 2016;91(5 suppl 1):54-56.
- Thomas AC, Zeng Z, Riviere JB, et al. Mosaic activating mutations in GNA11 and GNAQ are associated with phakomatosis pigmentovascularis and extensive dermal melanocytosis. J Invest Dermatol. 2016;136:770-778.
- Krema H, Simpson R, McGowan H. Choroidal melanoma in phacomatosis pigmentovascularis cesioflammea. Can J Ophthalmol. 2013;48:E41-E42.
- Wu CY, Chen PH, Chen GS. Phacomatosis cesioflammea associated with pectus excavatum. Acta Derm Venereol. 2009;89:301-310.
- Pradhan S, Patnaik S, Padhi T, et al. Phakomatosis pigmentovascularis type IIb, Sturge-Weber syndrome and cone shaped tongue: an unusual association. Indian J Dermatol Venereol Leprol. 2015;81:614-616.
- Turk BG, Turkmen M, Tuna A, et al. Phakomatosis pigmentovascularis type IIb associated with Klippel-Trenaunay syndrome and congenital triangular alopecia. J Am Acad Dermatol. 2011;65:E46-E49.
- Sen S, Bala S, Halder C, et al. Phakomatosis pigmentovascularis presenting with Sturge-Weber syndrome and Klippel-Trenaunay syndrome. Indian J Dermatol. 2015;60:77-79.
- Schwartz RA, Fernandez G, Kotulska K, et al. Tuberous sclerosis complex: advances in diagnosis, genetics, and management. J Am Acad Dermatol. 2007;57:189-202.
- Shields CL, Kligman BE, Suriano M, et al. Phacomatosis pigmentovascularis of cesioflammea type in 7 patients: combination of ocular pigmentation (melanocytosis or melanosis) and nevus flammeus with risk for melanoma. Arch Ophthalmol. 2011;129:746-750.
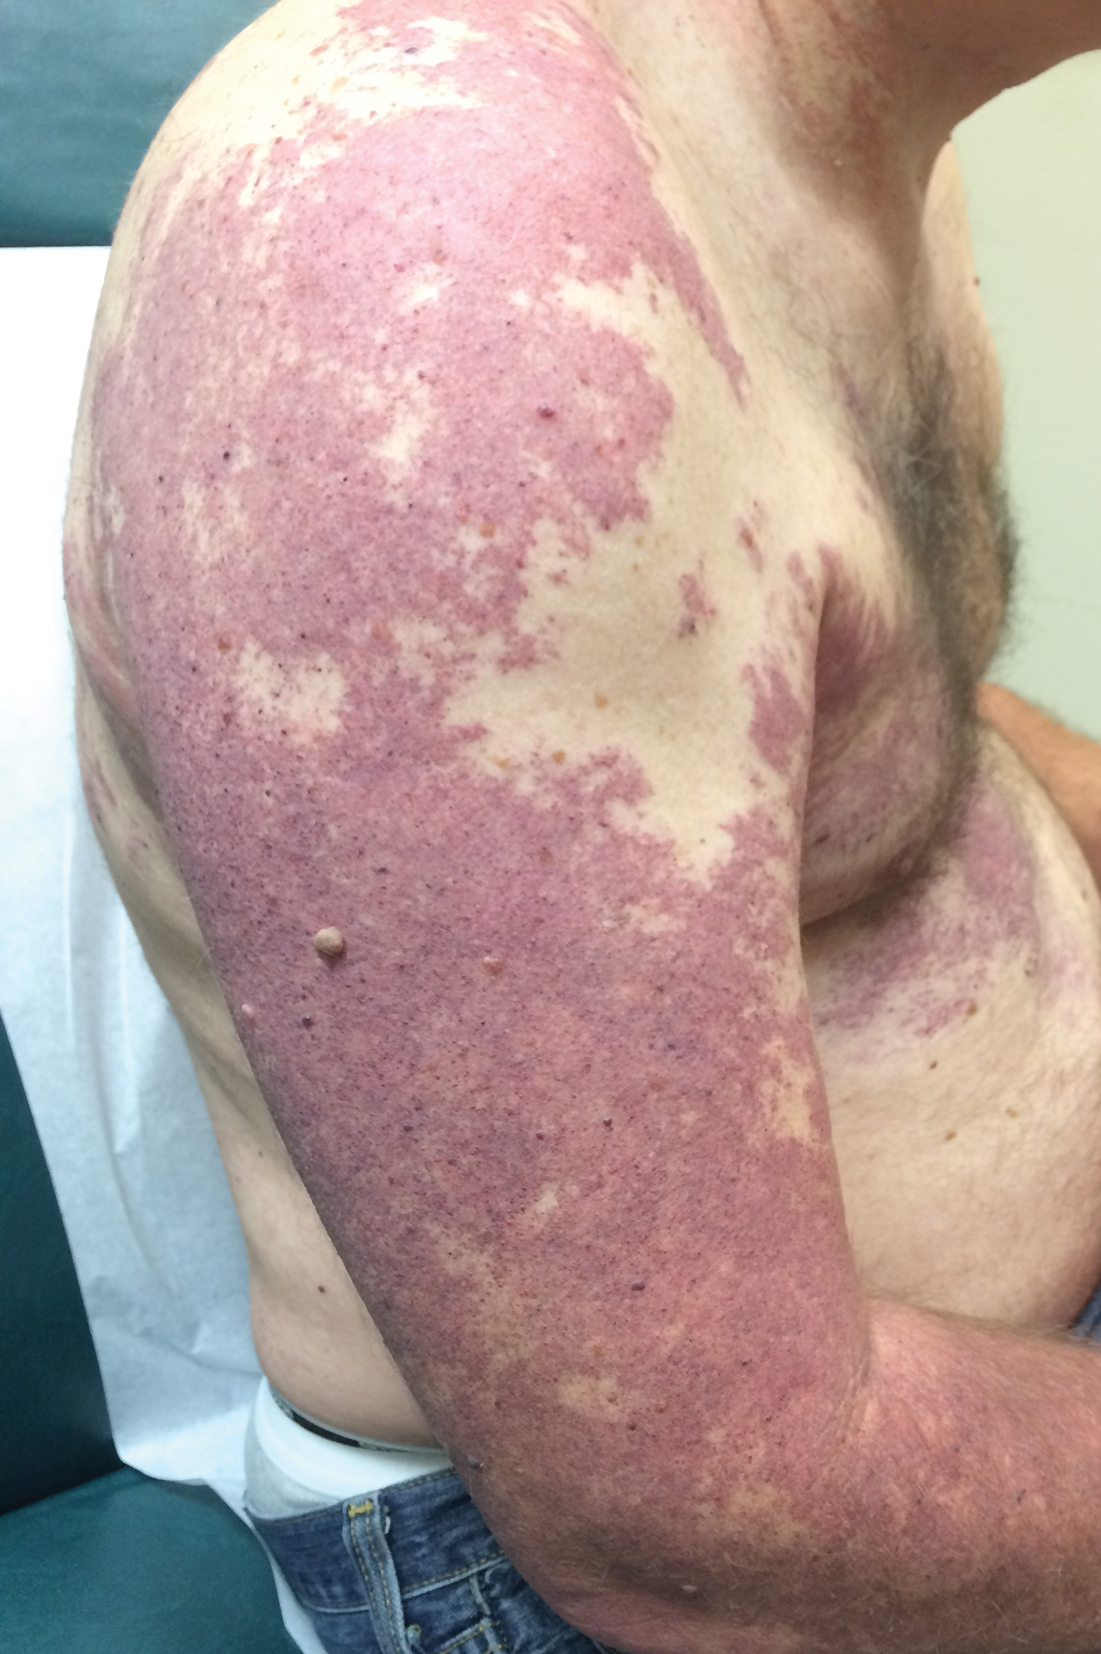
A 55-year-old man presented with red-violet patches on the right arm and chest that had been present since birth. The patches were asymptomatic and stable in size and shape. He denied any personal or family history of glaucoma or epilepsy. Physical examination demonstrated nonblanchable, violaceous to red patches on the right arm, back, and chest. No thrills or bruits were appreciable, and the right and left arms were of equal circumference and length. Further examination revealed hyperpigmented patches on the bilateral conjunctivae.
USPSTF issues draft recommendation statement for HCV screening in adults
and now suggests that all adults aged 18-79 years receive screening.

This proposal represents an update and expansion of its current recommendation for screening for HCV infection. The draft recommendation incorporates new evidence and would replace the recommendation made in 2013, which calls for screening in persons at high risk for infection and one-time screening in adults born between 1945 and 1965 (Grade B).
“Today, more people are infected with hepatitis C than there were a decade ago, but there are now better treatments available. The evidence now shows more people can benefit from screening; therefore, we are recommending to screen all adults ages 18-79 for hepatitis C,” task force chair Douglas K. Owens, MD, MS, said in a bulletin issued by the USPSTF.
To update the previous recommendation, the USPSTF conducted a systematic review that included a total of 97 studies. No direct evidence was found regarding the benefits of HCV screening versus no screening or repeat versus one-time screening, and no new studies analyzed the psychological and social consequences of HCV screening.
Evidence concerning direct-acting antiviral (DAA) treatment was more compelling given that 49 trials found DAA therapy to be associated with pooled sustained virologic response (SVR) rates between 95.5% and 98.9% across genotypes. The rate of serious adverse events caused by DAA treatment was 1.9%, and the discontinuation of treatment because of adverse events was 0.4%. In seven trials involving adolescents, SVR rates after antiviral treatment were similar to those in adults.
Achieving an SVR after DAA treatment was associated with a decreased risk in those treated of all-cause mortality (hazard ratio, 0.40; 95% confidence interval, 0.28-0.56), liver mortality (HR, 0.11; 95% CI, 0.04-0.27), cirrhosis (HR, 0.36; 95% CI, 0.33-0.40), and hepatocellular carcinoma (HR, 0.29; 95% CI, 0.23-0.38), compared with those who did not respond.
Because of the evidence collected, the USPSTF issued a B recommendation for HCV screening in adults and recommended screening for all people aged 18-79 years in the draft recommendation statement. “Clinicians may want to consider screening in adolescents younger than age 18 years and in adults older than age 79 years who are at high risk [for HCV],” the proposal says.
The draft recommendation statement and evidence review is available at www.uspreventiveservicestaskforce.org. The public comment period will last until Sept. 23, 2019.
Help educate your patients about hepatitis C, their risks and treatment options using AGA patient education, which can be found in the GI Patient Center at https://www.gastro.org/practice-guidance/gi-patient-center/topic/hepatitis-c-hcv.
and now suggests that all adults aged 18-79 years receive screening.
This proposal represents an update and expansion of its current recommendation for screening for HCV infection. The draft recommendation incorporates new evidence and would replace the recommendation made in 2013, which calls for screening in persons at high risk for infection and one-time screening in adults born between 1945 and 1965 (Grade B).
“Today, more people are infected with hepatitis C than there were a decade ago, but there are now better treatments available. The evidence now shows more people can benefit from screening; therefore, we are recommending to screen all adults ages 18-79 for hepatitis C,” task force chair Douglas K. Owens, MD, MS, said in a bulletin issued by the USPSTF.
To update the previous recommendation, the USPSTF conducted a systematic review that included a total of 97 studies. No direct evidence was found regarding the benefits of HCV screening versus no screening or repeat versus one-time screening, and no new studies analyzed the psychological and social consequences of HCV screening.
Evidence concerning direct-acting antiviral (DAA) treatment was more compelling given that 49 trials found DAA therapy to be associated with pooled sustained virologic response (SVR) rates between 95.5% and 98.9% across genotypes. The rate of serious adverse events caused by DAA treatment was 1.9%, and the discontinuation of treatment because of adverse events was 0.4%. In seven trials involving adolescents, SVR rates after antiviral treatment were similar to those in adults.
Achieving an SVR after DAA treatment was associated with a decreased risk in those treated of all-cause mortality (hazard ratio, 0.40; 95% confidence interval, 0.28-0.56), liver mortality (HR, 0.11; 95% CI, 0.04-0.27), cirrhosis (HR, 0.36; 95% CI, 0.33-0.40), and hepatocellular carcinoma (HR, 0.29; 95% CI, 0.23-0.38), compared with those who did not respond.
Because of the evidence collected, the USPSTF issued a B recommendation for HCV screening in adults and recommended screening for all people aged 18-79 years in the draft recommendation statement. “Clinicians may want to consider screening in adolescents younger than age 18 years and in adults older than age 79 years who are at high risk [for HCV],” the proposal says.
The draft recommendation statement and evidence review is available at www.uspreventiveservicestaskforce.org. The public comment period will last until Sept. 23, 2019.
Help educate your patients about hepatitis C, their risks and treatment options using AGA patient education, which can be found in the GI Patient Center at https://www.gastro.org/practice-guidance/gi-patient-center/topic/hepatitis-c-hcv.
USPSTF issues draft recommendation statement for HCV screening in adults
and now suggests that all adults aged 18-79 years receive screening.
This proposal represents an update and expansion of its current recommendation for screening for HCV infection. The draft recommendation incorporates new evidence and would replace the recommendation made in 2013, which calls for screening in persons at high risk for infection and one-time screening in adults born between 1945 and 1965 (Grade B).
“Today, more people are infected with hepatitis C than there were a decade ago, but there are now better treatments available. The evidence now shows more people can benefit from screening; therefore, we are recommending to screen all adults ages 18-79 for hepatitis C,” task force chair Douglas K. Owens, MD, MS, said in a bulletin issued by the USPSTF.
To update the previous recommendation, the USPSTF conducted a systematic review that included a total of 97 studies. No direct evidence was found regarding the benefits of HCV screening versus no screening or repeat versus one-time screening, and no new studies analyzed the psychological and social consequences of HCV screening.
Evidence concerning direct-acting antiviral (DAA) treatment was more compelling given that 49 trials found DAA therapy to be associated with pooled sustained virologic response (SVR) rates between 95.5% and 98.9% across genotypes. The rate of serious adverse events caused by DAA treatment was 1.9%, and the discontinuation of treatment because of adverse events was 0.4%. In seven trials involving adolescents, SVR rates after antiviral treatment were similar to those in adults.
Achieving an SVR after DAA treatment was associated with a decreased risk in those treated of all-cause mortality (hazard ratio, 0.40; 95% confidence interval, 0.28-0.56), liver mortality (HR, 0.11; 95% CI, 0.04-0.27), cirrhosis (HR, 0.36; 95% CI, 0.33-0.40), and hepatocellular carcinoma (HR, 0.29; 95% CI, 0.23-0.38), compared with those who did not respond.
Because of the evidence collected, the USPSTF issued a B recommendation for HCV screening in adults and recommended screening for all people aged 18-79 years in the draft recommendation statement. “Clinicians may want to consider screening in adolescents younger than age 18 years and in adults older than age 79 years who are at high risk [for HCV],” the proposal says.
The draft recommendation statement and evidence review is available at www.uspreventiveservicestaskforce.org. The public comment period will last until Sept. 23, 2019.
High-dose vitamin D for bone health may do more harm than good

In fact, rather than a hypothesized increase in volumetric bone mineral density (BMD) with doses well above the recommended dietary allowance, a negative dose-response relationship was observed, Lauren A. Burt, PhD, of the McCaig Institute for Bone and Joint Health at the University of Calgary (Alta.) and colleagues found.
The total volumetric radial BMD was significantly lower in 101 and 97 study participants randomized to receive daily vitamin D3 doses of 10,000 IU or 4,000 IU for 3 years, respectively (–7.5 and –3.9 mg of calcium hydroxyapatite [HA] per cm3), compared with 105 participants randomized to a reference group that received 400 IU (mean percent changes, –3.5%, –2.4%, and –1.2%, respectively). Total volumetric tibial BMD was also significantly lower in the 10,000 IU arm, compared with the reference arm (–4.1 mg HA per cm3; mean percent change –1.7% vs. –0.4%), the investigators reported Aug. 27 in JAMA.
There also were no significant differences seen between the three groups for the coprimary endpoint of bone strength at either the radius or tibia.
Participants in the double-blind trial were community-dwelling healthy men and women aged 55-70 years (mean age, 62.2 years) without osteoporosis and with baseline levels of 25-hydroxyvitamin D (25[OH]D) of 30-125 nmol/L. They were enrolled from a single center between August 2013 and December 2017 and treated with daily oral vitamin D3 drops at the assigned dosage for 3 years and with calcium supplementation if dietary calcium intake was less than 1,200 mg daily.
Mean supplementation adherence was 99% among the 303 participants who completed the trial (out of 311 enrolled), and adherence was similar across the groups.
Baseline 25(OH)D levels in the 400 IU group were 76.3 nmol/L at baseline, 76.7 nmol/L at 3 months, and 77.4 nmol/L at 3 years. The corresponding measures for the 4,000 IU group were 81.3, 115.3, and 132.2 nmol/L, and for the 10,000 IU group, they were 78.4, 188.0, and 144.4, the investigators said, noting that significant group-by-time interactions were noted for volumetric BMD.
Bone strength decreased over time, but group-by-time interactions for that measure were not statistically significant, they said.
A total of 44 serious adverse events occurred in 38 participants (12.2%), and one death from presumed myocardial infarction occurred in the 400 IU group. Of eight prespecified adverse events, only hypercalcemia and hypercalciuria had significant dose-response effects; all episodes of hypercalcemia were mild and had resolved at follow-up, and the two hypercalcemia events, which occurred in one participant in the 10,000 IU group, were also transient. No significant difference in fall rates was seen in the three groups, they noted.
Vitamin D is considered beneficial for preventing and treating osteoporosis, and data support supplementation in individuals with 25(OH)D levels less than 30 nmol/L, but recent meta-analyses did not find a major treatment benefit for osteoporosis or for preventing falls and fractures, the investigators said.
Further, while most supplementation recommendations call for 400-2,000 IU daily, with a tolerable upper intake level of 4,000-10,000 IU, 3% of U.S. adults in 2013-2014 reported intake of at least 4,000 IU per day, but few studies have assessed the effects of doses at or above the upper intake level for 12 months or longer, they noted, adding that this study was “motivated by the prevalence of high-dose vitamin D supplementation among healthy adults.”
“It was hypothesized that a higher dose of vitamin D has a positive effect on high-resolution peripheral quantitative CT measures of volumetric density and strength, perhaps via suppression of parathyroid hormone (PTH)–mediated bone turnover,” they wrote.
However, based on the significantly lower radial BMD seen with both 4,000 and 10,000 IU, compared with 400 IU; the lower tibial BMD with 10,000 IU, compared with 400 IU; and the lack of a difference in bone strength at the radius and tibia, the findings do not support a benefit of high-dose vitamin D supplementation for bone health, they said, noting that additional study is needed to determine whether such doses are harmful.
“Because these results are in the opposite direction of the research hypothesis, this evidence of high-dose vitamin D having a negative effect on bone should be regarded as hypothesis generating, requiring confirmation with further research,” they concluded.
SOURCE: Burt L et al. JAMA. 2019 Aug 27;322(8):736-45.
FROM JAMA
FDA’s low-risk TAVR okay set to propel case volume
With the Food and Drug Administration’s approval of two different pairs of transcatheter aortic valve replacement systems for patients at low surgical risk, U.S. case volume for the procedure should markedly rise given that patients at low surgical risk form the largest risk subgroup among patients with aortic stenosis severe enough to warrant valve replacement.

But even as transcatheter aortic valve replacement (TAVR) now becomes the predominant approach for fixing severely stenotic aortic valves regardless of a patient’s risk level, the procedure remains less optimal than surgical aortic valve replacement (SAVR) in selected patients, putting an onus on clinicians to identify and alert patients for whom the transcatheter approach is questionable.
The anticipated surge in TAVR cases for low-risk patients after the FDA’s Aug. 16, 2019, decision will also likely lead to more hospitals offering TAVR. That development will test whether recently enacted rules from the Centers for Medicare & Medicaid Services on procedure-volume minimums for TAVR programs – at least 20 cases a year (or 40 within 2 years) at centers that also perform at least 300 percutaneous coronary interventions annually – lead to outcomes at lower-volume centers that come reasonably close to the outcomes at higher-volume programs for low-risk patients.
“The paradigm has definitely shifted from SAVR as the gold standard to TAVR as the primary treatment for aortic stenosis. This opens TAVR to the vast majority of patients with aortic stenosis,” roughly three-quarters of patients with aortic valve stenosis severe enough to need valve replacement, said Joseph C. Cleveland Jr., MD, a cardiothoracic surgeon and professor of surgery at the University of Colorado at Denver, Aurora.

The actual, immediate increase in TAVR patients may not be quite as large as this fraction suggests. That’s in part because many patients in the low-risk category based on their surgical risk score already have been judged to have higher-risk features by heart-valve teams that has allowed such patients to undergo TAVR, said John D. Carroll, MD, professor of medicine and director of interventional cardiology at the University of Colorado.
For several years, U.S. rates of TAVR have exceeded SAVR, he noted, and in 2018 U.S. programs performed roughly 58,000 TAVR procedures and about 25,000 SAVRs, according to data collected by the Transcatheter Valve Therapy (TVT) Registry run by the Society of Thoracic Surgeons and the American College of Cardiology. Dr. Carroll is vice chair of the steering committee for this registry, which was mandated by the FDA in 2011 when the agency first allowed TAVR onto the U.S. market and is designed to capture every TAVR case performed in routine U.S. practice.
Despite this caveat, “there will be substantial growth in TAVR. Going forward, there will be more of a shift from SAVR to TAVR. That is what the results of the low-risk trials did,” Dr. Carroll predicted. In addition, the coming growth in TAVR numbers will stem from more than just low-risk patients whom a month ago would have undergone SAVR but now undergo TAVR instead. The availability of TAVR as an option for a wider range of patients should help boost public awareness that a nonsurgical way exists to treat severe aortic stenosis, plus the aging of baby boomers is on the verge of generating a substantial wave of new patients, a wave so high that Dr. Carroll called it a looming “tsunami” of patients needing TAVR.
How will low-risk TAVR affect lower-volume sites?
More TAVR patients will inevitably mean more U.S. sites offering the procedure, experts agreed. “We anticipate more low-volume programs,” Dr. Carroll said.
“Approval of TAVR for low-risk patients will result in a significant increase in the number of programs offering it. Approximately 1,100 U.S. programs offer SAVR, and as of now about 600 of these programs also offer TAVR. Health systems face the risk of losing patients if they don’t offer TAVR now that low-risk patients can be treated,” observed Sreekanth Vemulapalli, MD, a cardiologist at Duke University, Durham, N.C. who has run several studies using TVT Registry data and serves as liaison between the registry and its analytic center at Duke.
One of these studies, published earlier in 2019, showed that, among more than 96,000 registry patients who underwent transfemoral TAVR during 2015-2017 at 554 U.S. centers, those treated at sites that fell into the bottom quartile for case volume had an adjusted 30-day mortality rate that was 21% higher relative to patients treated at centers in the top quartile, a statistically significant difference (N Engl J Med. 2019 Jun 27;380[26]:2541-50). The absolute difference in adjusted 30-day mortality between the lowest and highest quartiles was 0.54%, roughly 1 additional death for every 200 patients. The TAVR centers in the lowest-volume quartile performed 5-36 cases/year, averaging 27 TAVRs/year; those in the highest quartile performed 86-371 TAVRs annually with an overall quartile average of 143 procedures/year.
Dr. Vemulapalli and others cautioned that TAVR case volume is currently serving as a surrogate, and imperfect, marker for program quality until TAVR programs generate enough data to allow a directly measured, risk-adjusted, outcome-driven assessment of performance. In the study he and his associates published in June, the 140 TAVR programs in the lowest-volume quartile showed a “high” level of variability in their adjusted mortality rates. Despite this limitation, the prospect that new TAVR programs will soon open to meet growing TAVR demand from low-risk patients poses the question of how these programs will perform during their start-up days (and possibly beyond), when case volumes may be light, especially if sites open in more remote sections of the United States.
“Will the real-world results of TAVR in low-risk patients match the fantastic results in the two low-risk TAVR trials?” wondered Dr. Carroll, referring to the PARTNER 3 (N Engl J Med. 2019 May 2;380[18]:1695-1705) and Evolut Low-Risk Patients trial (N Engl J Med. 2019 May 2;380[18]:1706-15). “It’s unknown whether a site just starting to do TAVRs will get the same results. The sites that participated in the low-risk trials were mostly high-volume sites.” On the other hand, TVT Registry data have shown that patients with surgical risk that was judged prohibitive, high, or intermediate all have had overall real-world outcomes that match what was seen in the relevant TAVR trials.
In addition, some experts view a modest drop in 30-day survival among patients treated at lower-volume TAVR sites as a reasonable trade-off for easier access for patients seeking this life-changing treatment.
“We need to ensure that patients have access to this treatment option,” said Catherine M. Otto, MD, professor of medicine and director of the Heart Valve Clinic at the University of Washington, Seattle. The potentially better outcomes produced at larger TAVR programs “need to be balanced against having a greater number of programs to ensure access for more patients and allow patients to be treated closer to home,” she said in an interview. She suggested that the potential exists to use telemedicine to link larger and more experienced TAVR programs with smaller and newer programs to help boost their performance.

“There is no perfect solution or metric to ensure high quality while also allowing for adequate access. As indications for TAVR expand we need to maintain vigilance and accountability as the therapy is dispersed to more patients at more centers,” said Brian R. Lindman, MD, medical director of the Structural Heat and Valve Center at Vanderbilt University, Nashville, Tenn. “We also need to insure that certain groups of patients have adequate access to this therapy. Adequate access to TAVR and high-quality clinical outcomes are both important goals.”
Plus, “the volume relationship may be less important,” in lower-risk patients, suggested Dr. Cleveland in an interview. Low-risk patients are younger and have fewer comorbidities and less vascular disease. “Low-volume centers should be able to treat these patients,” he said. Despite that, he personally supported the higher volume minimum for TAVR of 50 cases/year that the ACC, STS, and other U.S. professional societies recommended to CMS during public comment on the proposed rules. “We’ll see whether the increased access is worth this volume minimum.”
Who still gets SAVR?
Given the inherent attraction TAVR holds over SAVR for patients, heart-valve teams will need to convey the right message to patients who may be better served with surgical replacement despite the added trauma and recovery time it produces.

“The decision to perform TAVR or SAVR should now be based on a patient’s expected longevity as well as patient preferences and values, and not on the patient’s estimated surgical risk, except for the highest-risk patients in whom TAVR is recommended,” said Dr. Otto. A patient’s age, comorbidities, and overall life expectancy now move to center stage when deciding the TAVR or SAVR question, along with individual anatomic considerations, the possible need for concurrent procedures, and of course what the patient prefers including their willingness and ability to remain on lifelong anticoagulation if they receive a durable mechanical valve. Dr. Otto outlined this new landscape of the heart-valve team’s decision making process in an editorial she recently published (N Engl J Med. 2019 May 2;380[18]: 1769-70) that accompanied publication of PARTNER 3 and the Evolut Low-Risk Patients trial.
“For some patients there will be clear benefit from one approach, but for many patients, particularly those at low surgical risk, both TAVR and SAVR are technically feasible. For these patients it’s essential that the heart-valve team provide unbiased information to guide patients,” Dr. Otto said. The ideal person to provide this unbiased presentation of the pros and cons would be a cardiologist experienced with valve disease but not actively involved in performing valve-replacement procedures.
A big issue younger patients must confront is what remains unknown about long-term durability of TAVR valves. Dr. Otto called this “the most important missing piece of information. We only have robust data out to about 5 years. If TAVR valve will be durable for 15-20 years, then TAVR will become preferred even in younger patients.”
Even after TAVR became available to intermediate-risk patients in 2016, the median age of U.S. patients undergoing TAVR hardly budged, and has recently stood at about 81 years, Dr. Carroll noted. “With low-risk patients, we expect to see this change,” as more patients now who are in their 70s, 60s, and younger start to routinely undergo TAVR. As more younger patients with life expectancies on the order of 30 years consider TAVR, issues of valve durability “enter the discussion,” he said. “We need data to 10, 15 years,” and in its low-risk approval the FDA mandated manufacturers to follow these patients for at least 10 years. Although valve-in-valve replacement of failed TAVR valves is an option, it’s not always a smooth fix with the potential for prosthesis-patient mismatch (J Am Coll Cardiol. 2018 Dec 4;72[22]:2701-11) and resulting hemodynamic problems, Dr. Carroll said.
Bicuspid-valve replacement with TAVR is another big unknown, largely because these patients were excluded from the TAVR trials. A recently published analysis of the 2,726 patients with a bicuspid aortic valve who underwent TAVR anyway in routine U.S. practice between June 2015 and November 2018 and were in the TVT Registry (about 3% of all TAVR patients during this period) showed that these patients had similar mortality, compared with the tricuspid-valve patients, but a significantly increased stroke rate (JAMA. 2019 Jun 11;321[22]:2193-202). The authors concluded that a prospective, randomized study of TAVR, compared with SAVR, is needed for these patients, and many others in the field agree.
As availability of TAVR grows and public awareness increases, heart-valve teams may find it challenging sometimes to help patients understand the upsides of SAVR for their individual clinical needs when TAVR is superficially so much more attractive.
“The desire to avoid the prolonged hospitalization and recovery from SAVR is a huge driver of patient preference,” noted Dr. Carroll.
“It’s hard to tell a 55 year old to think about another procedure they may need when they are 65 or 70 if they undergo TAVR now rather than SAVR. They don’t want open-heart surgery; I hear that all the time,” Dr. Cleveland said. “If I were a 55-year-old aortic valve patient I’d strongly consider TAVR, too.”
Financial consideration at the site performing the interventions can also be a factor. “Differential costs and payments associated with SAVR and TAVR create different financial incentives for health systems between these two procedures,” noted Dr. Vemulapalli. “There likely needs to be a system that creates equal incentives to do SAVR or TAVR so that the decision between them can come down to just the patient and heart-valve team. We need further data and decision aids to help better define which patients will likely do better with SAVR and which with TAVR.”
What now?
Since the first large TAVR trials started in 2007, their main thrust has been to prove the efficacy and safety of TAVR in patients at sequentially less risk of undergoing SAVR. Now that this series of comparisons has ended, where will TAVR research turn its attention?
In addition to the big outstanding issues of TAVR-valve long-term durability, and the efficacy and safety of TAVR for replacing bicuspid valves, other big questions and issues loom. They include the optimal anticoagulant regimen for preventing leaflet thrombosis, reducing the need for pacemakers, reducing strokes, the applicability of TAVR to patients with less severe aortic stenosis, the impact of treating severe but asymptomatic aortic valve obstruction, optimizing valve-in-valve outcomes, and further improvements to valve design, hemodynamics, and delivery. In short, the question of TAVR’s suitability for patients regardless of their surgical risk may have now been answered, but many questions remain about the best way to use and to optimize this technology.
Dr. Cleveland and Dr. Carroll have participated in TAVR trials but had no personal financial disclosures. Dr. Otto had no disclosures. Dr. Vemulapalli has received personal fees from Janssen, Novella, Premiere, and Zafgen, and research funding from Boston Scientific and Abbott Vascular. Dr. Lindman has been a consultant to Medtronic, has served as an advisor to Roche, and has received research funding from Edwards Lifesciences.
With the Food and Drug Administration’s approval of two different pairs of transcatheter aortic valve replacement systems for patients at low surgical risk, U.S. case volume for the procedure should markedly rise given that patients at low surgical risk form the largest risk subgroup among patients with aortic stenosis severe enough to warrant valve replacement.
But even as transcatheter aortic valve replacement (TAVR) now becomes the predominant approach for fixing severely stenotic aortic valves regardless of a patient’s risk level, the procedure remains less optimal than surgical aortic valve replacement (SAVR) in selected patients, putting an onus on clinicians to identify and alert patients for whom the transcatheter approach is questionable.
The anticipated surge in TAVR cases for low-risk patients after the FDA’s Aug. 16, 2019, decision will also likely lead to more hospitals offering TAVR. That development will test whether recently enacted rules from the Centers for Medicare & Medicaid Services on procedure-volume minimums for TAVR programs – at least 20 cases a year (or 40 within 2 years) at centers that also perform at least 300 percutaneous coronary interventions annually – lead to outcomes at lower-volume centers that come reasonably close to the outcomes at higher-volume programs for low-risk patients.
“The paradigm has definitely shifted from SAVR as the gold standard to TAVR as the primary treatment for aortic stenosis. This opens TAVR to the vast majority of patients with aortic stenosis,” roughly three-quarters of patients with aortic valve stenosis severe enough to need valve replacement, said Joseph C. Cleveland Jr., MD, a cardiothoracic surgeon and professor of surgery at the University of Colorado at Denver, Aurora.
The actual, immediate increase in TAVR patients may not be quite as large as this fraction suggests. That’s in part because many patients in the low-risk category based on their surgical risk score already have been judged to have higher-risk features by heart-valve teams that has allowed such patients to undergo TAVR, said John D. Carroll, MD, professor of medicine and director of interventional cardiology at the University of Colorado.
For several years, U.S. rates of TAVR have exceeded SAVR, he noted, and in 2018 U.S. programs performed roughly 58,000 TAVR procedures and about 25,000 SAVRs, according to data collected by the Transcatheter Valve Therapy (TVT) Registry run by the Society of Thoracic Surgeons and the American College of Cardiology. Dr. Carroll is vice chair of the steering committee for this registry, which was mandated by the FDA in 2011 when the agency first allowed TAVR onto the U.S. market and is designed to capture every TAVR case performed in routine U.S. practice.
Despite this caveat, “there will be substantial growth in TAVR. Going forward, there will be more of a shift from SAVR to TAVR. That is what the results of the low-risk trials did,” Dr. Carroll predicted. In addition, the coming growth in TAVR numbers will stem from more than just low-risk patients whom a month ago would have undergone SAVR but now undergo TAVR instead. The availability of TAVR as an option for a wider range of patients should help boost public awareness that a nonsurgical way exists to treat severe aortic stenosis, plus the aging of baby boomers is on the verge of generating a substantial wave of new patients, a wave so high that Dr. Carroll called it a looming “tsunami” of patients needing TAVR.
How will low-risk TAVR affect lower-volume sites?
More TAVR patients will inevitably mean more U.S. sites offering the procedure, experts agreed. “We anticipate more low-volume programs,” Dr. Carroll said.
“Approval of TAVR for low-risk patients will result in a significant increase in the number of programs offering it. Approximately 1,100 U.S. programs offer SAVR, and as of now about 600 of these programs also offer TAVR. Health systems face the risk of losing patients if they don’t offer TAVR now that low-risk patients can be treated,” observed Sreekanth Vemulapalli, MD, a cardiologist at Duke University, Durham, N.C. who has run several studies using TVT Registry data and serves as liaison between the registry and its analytic center at Duke.
One of these studies, published earlier in 2019, showed that, among more than 96,000 registry patients who underwent transfemoral TAVR during 2015-2017 at 554 U.S. centers, those treated at sites that fell into the bottom quartile for case volume had an adjusted 30-day mortality rate that was 21% higher relative to patients treated at centers in the top quartile, a statistically significant difference (N Engl J Med. 2019 Jun 27;380[26]:2541-50). The absolute difference in adjusted 30-day mortality between the lowest and highest quartiles was 0.54%, roughly 1 additional death for every 200 patients. The TAVR centers in the lowest-volume quartile performed 5-36 cases/year, averaging 27 TAVRs/year; those in the highest quartile performed 86-371 TAVRs annually with an overall quartile average of 143 procedures/year.
Dr. Vemulapalli and others cautioned that TAVR case volume is currently serving as a surrogate, and imperfect, marker for program quality until TAVR programs generate enough data to allow a directly measured, risk-adjusted, outcome-driven assessment of performance. In the study he and his associates published in June, the 140 TAVR programs in the lowest-volume quartile showed a “high” level of variability in their adjusted mortality rates. Despite this limitation, the prospect that new TAVR programs will soon open to meet growing TAVR demand from low-risk patients poses the question of how these programs will perform during their start-up days (and possibly beyond), when case volumes may be light, especially if sites open in more remote sections of the United States.
“Will the real-world results of TAVR in low-risk patients match the fantastic results in the two low-risk TAVR trials?” wondered Dr. Carroll, referring to the PARTNER 3 (N Engl J Med. 2019 May 2;380[18]:1695-1705) and Evolut Low-Risk Patients trial (N Engl J Med. 2019 May 2;380[18]:1706-15). “It’s unknown whether a site just starting to do TAVRs will get the same results. The sites that participated in the low-risk trials were mostly high-volume sites.” On the other hand, TVT Registry data have shown that patients with surgical risk that was judged prohibitive, high, or intermediate all have had overall real-world outcomes that match what was seen in the relevant TAVR trials.
In addition, some experts view a modest drop in 30-day survival among patients treated at lower-volume TAVR sites as a reasonable trade-off for easier access for patients seeking this life-changing treatment.
“We need to ensure that patients have access to this treatment option,” said Catherine M. Otto, MD, professor of medicine and director of the Heart Valve Clinic at the University of Washington, Seattle. The potentially better outcomes produced at larger TAVR programs “need to be balanced against having a greater number of programs to ensure access for more patients and allow patients to be treated closer to home,” she said in an interview. She suggested that the potential exists to use telemedicine to link larger and more experienced TAVR programs with smaller and newer programs to help boost their performance.
“There is no perfect solution or metric to ensure high quality while also allowing for adequate access. As indications for TAVR expand we need to maintain vigilance and accountability as the therapy is dispersed to more patients at more centers,” said Brian R. Lindman, MD, medical director of the Structural Heat and Valve Center at Vanderbilt University, Nashville, Tenn. “We also need to insure that certain groups of patients have adequate access to this therapy. Adequate access to TAVR and high-quality clinical outcomes are both important goals.”
Plus, “the volume relationship may be less important,” in lower-risk patients, suggested Dr. Cleveland in an interview. Low-risk patients are younger and have fewer comorbidities and less vascular disease. “Low-volume centers should be able to treat these patients,” he said. Despite that, he personally supported the higher volume minimum for TAVR of 50 cases/year that the ACC, STS, and other U.S. professional societies recommended to CMS during public comment on the proposed rules. “We’ll see whether the increased access is worth this volume minimum.”
Who still gets SAVR?
Given the inherent attraction TAVR holds over SAVR for patients, heart-valve teams will need to convey the right message to patients who may be better served with surgical replacement despite the added trauma and recovery time it produces.
“The decision to perform TAVR or SAVR should now be based on a patient’s expected longevity as well as patient preferences and values, and not on the patient’s estimated surgical risk, except for the highest-risk patients in whom TAVR is recommended,” said Dr. Otto. A patient’s age, comorbidities, and overall life expectancy now move to center stage when deciding the TAVR or SAVR question, along with individual anatomic considerations, the possible need for concurrent procedures, and of course what the patient prefers including their willingness and ability to remain on lifelong anticoagulation if they receive a durable mechanical valve. Dr. Otto outlined this new landscape of the heart-valve team’s decision making process in an editorial she recently published (N Engl J Med. 2019 May 2;380[18]: 1769-70) that accompanied publication of PARTNER 3 and the Evolut Low-Risk Patients trial.
“For some patients there will be clear benefit from one approach, but for many patients, particularly those at low surgical risk, both TAVR and SAVR are technically feasible. For these patients it’s essential that the heart-valve team provide unbiased information to guide patients,” Dr. Otto said. The ideal person to provide this unbiased presentation of the pros and cons would be a cardiologist experienced with valve disease but not actively involved in performing valve-replacement procedures.
A big issue younger patients must confront is what remains unknown about long-term durability of TAVR valves. Dr. Otto called this “the most important missing piece of information. We only have robust data out to about 5 years. If TAVR valve will be durable for 15-20 years, then TAVR will become preferred even in younger patients.”
Even after TAVR became available to intermediate-risk patients in 2016, the median age of U.S. patients undergoing TAVR hardly budged, and has recently stood at about 81 years, Dr. Carroll noted. “With low-risk patients, we expect to see this change,” as more patients now who are in their 70s, 60s, and younger start to routinely undergo TAVR. As more younger patients with life expectancies on the order of 30 years consider TAVR, issues of valve durability “enter the discussion,” he said. “We need data to 10, 15 years,” and in its low-risk approval the FDA mandated manufacturers to follow these patients for at least 10 years. Although valve-in-valve replacement of failed TAVR valves is an option, it’s not always a smooth fix with the potential for prosthesis-patient mismatch (J Am Coll Cardiol. 2018 Dec 4;72[22]:2701-11) and resulting hemodynamic problems, Dr. Carroll said.
Bicuspid-valve replacement with TAVR is another big unknown, largely because these patients were excluded from the TAVR trials. A recently published analysis of the 2,726 patients with a bicuspid aortic valve who underwent TAVR anyway in routine U.S. practice between June 2015 and November 2018 and were in the TVT Registry (about 3% of all TAVR patients during this period) showed that these patients had similar mortality, compared with the tricuspid-valve patients, but a significantly increased stroke rate (JAMA. 2019 Jun 11;321[22]:2193-202). The authors concluded that a prospective, randomized study of TAVR, compared with SAVR, is needed for these patients, and many others in the field agree.
As availability of TAVR grows and public awareness increases, heart-valve teams may find it challenging sometimes to help patients understand the upsides of SAVR for their individual clinical needs when TAVR is superficially so much more attractive.
“The desire to avoid the prolonged hospitalization and recovery from SAVR is a huge driver of patient preference,” noted Dr. Carroll.
“It’s hard to tell a 55 year old to think about another procedure they may need when they are 65 or 70 if they undergo TAVR now rather than SAVR. They don’t want open-heart surgery; I hear that all the time,” Dr. Cleveland said. “If I were a 55-year-old aortic valve patient I’d strongly consider TAVR, too.”
Financial consideration at the site performing the interventions can also be a factor. “Differential costs and payments associated with SAVR and TAVR create different financial incentives for health systems between these two procedures,” noted Dr. Vemulapalli. “There likely needs to be a system that creates equal incentives to do SAVR or TAVR so that the decision between them can come down to just the patient and heart-valve team. We need further data and decision aids to help better define which patients will likely do better with SAVR and which with TAVR.”
What now?
Since the first large TAVR trials started in 2007, their main thrust has been to prove the efficacy and safety of TAVR in patients at sequentially less risk of undergoing SAVR. Now that this series of comparisons has ended, where will TAVR research turn its attention?
In addition to the big outstanding issues of TAVR-valve long-term durability, and the efficacy and safety of TAVR for replacing bicuspid valves, other big questions and issues loom. They include the optimal anticoagulant regimen for preventing leaflet thrombosis, reducing the need for pacemakers, reducing strokes, the applicability of TAVR to patients with less severe aortic stenosis, the impact of treating severe but asymptomatic aortic valve obstruction, optimizing valve-in-valve outcomes, and further improvements to valve design, hemodynamics, and delivery. In short, the question of TAVR’s suitability for patients regardless of their surgical risk may have now been answered, but many questions remain about the best way to use and to optimize this technology.
Dr. Cleveland and Dr. Carroll have participated in TAVR trials but had no personal financial disclosures. Dr. Otto had no disclosures. Dr. Vemulapalli has received personal fees from Janssen, Novella, Premiere, and Zafgen, and research funding from Boston Scientific and Abbott Vascular. Dr. Lindman has been a consultant to Medtronic, has served as an advisor to Roche, and has received research funding from Edwards Lifesciences.
FDA approves Taltz for treatment of ankylosing spondylitis
(AS), according to a press release from Eli Lilly.

AS is the third indication for ixekizumab, along with moderate to severe plaque psoriasis in adult patients who are candidates for systemic therapy or phototherapy and active psoriatic arthritis in adults.
Approval of the humanized interleukin-17A antagonist was based on results from a pair of randomized, double-blind, placebo-controlled, phase 3 studies involving 657 adult patients with active AS: the COAST-V trial in those naive to biologic disease-modifying antirheumatic drugs (bDMARDs) and the COAST-W trial in those who were intolerant or had inadequate response to tumor necrosis factor (TNF) inhibitors. The primary endpoint in both trials was achievement of 40% improvement in Assessment of Spondyloarthritis International Society criteria (ASAS40) at 16 weeks, compared with placebo.
In COAST-V, 48% of patients who received ixekizumab achieved ASAS40, compared with 18% of controls (P less than .0001). In COAST-W, 25% of patients who received ixekizumab achieved ASAS40 versus 13% of controls (P less than .05). The adverse events reported during both trials were consistent with the safety profile in patients who receive ixekizumab for the treatment of plaque psoriasis, including injection-site reactions, upper respiratory tract infections, nausea, and tinea infections.
“Results from the phase 3 clinical trial program in ankylosing spondylitis show that Taltz helped reduce pain and inflammation and improve function in patients who had never been treated with a bDMARD as well as those who previously failed TNF inhibitors. This approval is an important milestone for patients and physicians who are looking for a much-needed alternative to address symptoms of AS,” said Philip Mease, MD, of Providence St. Joseph Health and the University of Washington, both in Seattle.
(AS), according to a press release from Eli Lilly.
AS is the third indication for ixekizumab, along with moderate to severe plaque psoriasis in adult patients who are candidates for systemic therapy or phototherapy and active psoriatic arthritis in adults.
Approval of the humanized interleukin-17A antagonist was based on results from a pair of randomized, double-blind, placebo-controlled, phase 3 studies involving 657 adult patients with active AS: the COAST-V trial in those naive to biologic disease-modifying antirheumatic drugs (bDMARDs) and the COAST-W trial in those who were intolerant or had inadequate response to tumor necrosis factor (TNF) inhibitors. The primary endpoint in both trials was achievement of 40% improvement in Assessment of Spondyloarthritis International Society criteria (ASAS40) at 16 weeks, compared with placebo.
In COAST-V, 48% of patients who received ixekizumab achieved ASAS40, compared with 18% of controls (P less than .0001). In COAST-W, 25% of patients who received ixekizumab achieved ASAS40 versus 13% of controls (P less than .05). The adverse events reported during both trials were consistent with the safety profile in patients who receive ixekizumab for the treatment of plaque psoriasis, including injection-site reactions, upper respiratory tract infections, nausea, and tinea infections.
“Results from the phase 3 clinical trial program in ankylosing spondylitis show that Taltz helped reduce pain and inflammation and improve function in patients who had never been treated with a bDMARD as well as those who previously failed TNF inhibitors. This approval is an important milestone for patients and physicians who are looking for a much-needed alternative to address symptoms of AS,” said Philip Mease, MD, of Providence St. Joseph Health and the University of Washington, both in Seattle.