User login
Mysterious vaping lung injuries may have flown under regulatory radar
It was the arrival of the second man in his early 20s gasping for air that alarmed Dixie Harris, MD. Young patients rarely get so sick, so fast, with a severe lung illness, and this was her second case in a matter of days.

Then she saw three more patients at her Utah telehealth clinic with similar symptoms. They did not have infections, but all had been vaping. When Dr. Harris heard several teenagers in Wisconsin had been hospitalized in similar cases, she quickly alerted her state health department.
As patients in hospitals across the country combat a mysterious illness linked to e-cigarettes, federal and state investigators are frantically trying to trace the outbreaks to specific vaping products that, until recently, were virtually unregulated.
As of Aug. 22, 2019, 193 potential vaping-related illnesses in 22 states had been reported to the Centers for Disease Control and Prevention. Wisconsin, which first put out an alert in July, has at least 16 confirmed and 15 suspected cases. Illinois has reported 34 patients, 1 of whom has died. Indiana is investigating 24 cases.
Lung doctors said they had seen warning signs for years that vaping could be hazardous as they treated patients. Medically it seemed problematic since it often involved inhaling chemicals not normally inhaled into the lungs. Despite that, assessing the safety of a new product storming the market fell between regulatory cracks, leaving doctors unsure where to register concerns before the outbreak. The Food and Drug Administration took years to regulate e-cigarettes once a court determined it had the authority to do so.
“You don’t know what you’re putting into your lungs when you vape,” said Dr. Harris, a critical care pulmonologist. “It’s purported to be safe, but how do you know if it’s safe? To me, it’s a very dangerous thing.”
Off the radar
When e-cigarettes came to market about a decade ago, they fell into a regulatory no man’s land. They are not a food, not a drug, and not a medical device, any of which would have put them immediately in the FDA’s purview. And, until a few years ago, they weren’t even lumped in with tobacco products.
As a result, billions of dollars of vaping products have been sold online, at big-box retailers, and in corner stores without going through the FDA’s rigorous review process to assess their safety. Companies like Juul, Blu, and NJoy quickly established their brands of devices and cartridges, or pods. And thousands of related products are sold, sometimes on the black market, over the Internet, or beyond.
“It makes it really tough because we don’t know what we’re looking for,” said Ruth Lynfield, MD, the state epidemiologist for Minnesota, where several patients were admitted to the ICU as a result of the illness. She added that, if it turns out that the products in question were sold by unregistered retailers and manufacturers “on the street,” outbreak sleuths will have a harder time figuring out exactly what is in them.
With e-cigarettes, people can vape – or smoke – nicotine products, selecting flavorings like mint, mango, blueberry crème brûlée, or cookies and milk. They can also inhale cannabis products. Many are hopeful that e-cigarettes might be useful smoking cessation tools, but some research has called that into question.
The mysterious pulmonary disease cases have been linked to vaping, but it’s unclear whether there is a common device or chemical. In some states, including California and Utah, all of the patients had vaped cannabis products. One or more substances could be involved, health officials have said. The products used by several victims are being tested to see what they contained.
And this has apparently been the case for years.
Multiple doctors described seeing earlier cases of severe lung problems linked to vaping that were not officially reported or included in the current CDC count.
Laura Crotty Alexander, MD, a pulmonologist and researcher with the University of California, San Diego, said she saw her first case about 2 years ago. A young man had been vaping for months with the same device but developed acute lung injury when he switched flavors. She strongly suspected a link, but did not report the illness anywhere.
“It wasn’t that I didn’t want to report it, it’s that there’s no pathway” to do so, Dr. Alexander said.
She said she’s concerned that many physicians haven’t been asking patients about e-cigarette use and that there’s no way to document a case like this in the medical coding system.
John E. Parker, MD, of West Virginia University, Morgantown, said he saw his first patient with pneumonia tied to vaping in 2015. Doctors there were intrigued enough to report on the case at the annual meeting of the American College of Chest Physicians. Dr. Parker and his team didn’t contact a federal agency, and Dr. Parker said it was unclear whom to call.
Numerous other cases have been reported in medical journals and at professional conferences in the years since. The FDA’s voluntary system for reporting tobacco-related health problems included 96 seizures and only 1 lung ailment tied to e-cigarettes between April and June 2019. The system appears to be utilized most by concerned citizens, rather than manufacturers or health care professionals.
But several lung specialists said that due to the patchwork nature of regulatory oversight over the years, the true scope of the problem is yet to be identified.
“We do know that e-cigarettes do not emit a harmless aerosol,” said Brian King, PhD, MPH, a deputy director in the Office on Smoking and Health at the CDC in a call with media on Aug. 23 about the outbreak. “It is possible that some of these cases were already occurring but we were not picking them up.”
Regulatory limits
The FDA has had limited authority to regulate e-cigarettes over the years.
In 2009, Congress passed the Family Smoking Prevention and Tobacco Control Act, empowering the FDA to oversee the safety and sale of tobacco products. But e-cigarettes, still new, were not top of mind.
Later that year, the FDA tried to block imports of e-cigarettes, saying the combination drug-device products were unapproved and therefore illegal for sale in the United States. Two vaping companies, Smoking Everywhere and NJoy, sued, and a federal judge ruled in 2010 that the FDA should regulate e-cigarettes as tobacco products.
It took the agency 6 years to finalize what’s become known as the “deeming rule,” in which it formally began regulating e-cigarettes and e-liquids.
By then, it was May 2016, and the e-cigarette market had swelled to an estimated $4.1 billion, Wells Fargo Securities analyst Bonnie Herzog said at the time. Market researchers now project that the global industry could reach $48 billion by 2023.
Critics say the FDA took too long to act.
“I think the fact that FDA has been dillydallying [has made] figuring out what’s going on [with this outbreak] much harder,” said Stanton Glantz, PhD, a University of California, San Francisco, professor in its Center for Tobacco Control Research and Education. “No question.”
The agency began by banning e-cigarette sales to minors and requiring all new vaping products to submit applications for authorization before they could come to market. Companies and retailers with thousands of products already on the market were granted 2 years to submit applications, and the FDA would get an additional year to evaluate the applications. Meanwhile, existing products could still be sold.
But when Scott Gottlieb, MD, arrived as the new FDA commissioner in 2017, the rule hadn’t been implemented and there was no formal guidance for companies to file applications, he said. As a result, he pushed the deadline back to 2022, drawing ire from public health advocates, who called foul over his previous ties to an e-cigarette retailer called Kure.
“I thought e-cigarettes at the time – and I still believe – that they represent an opportunity for currently addicted adult smokers to transition off of combustible tobacco,” he said in an interview, adding that other parts of the deeming rule went into effect as planned. “All I did was delay the application deadline.”
Dr. Gottlieb’s thinking changed the following year, when a national survey showed a sharp rise in teen vaping, which he called an “epidemic.” He announced that the agency would rethink the extended deadline and weigh whether to take flavors that appeal to kids off the market.
A judge ruled last month that e-cigarette makers would have only 10 more months to submit applications to the FDA. They’re now due in May 2020.
Asked about the lung injuries appearing now, Dr. Gottlieb, who left the FDA in April 2019, said he suspected counterfeit pods are to blame, given the geographic clustering of cases and the fact that, overall, the FDA is inspecting registered e-cigarette makers and retailers to make sure they’re complying with existing regulations.
“I think the manufacturers are culpable if their products are being used, whether the liquids are counterfeit or real,” he said. “Ultimately, they’re responsible for keeping their products out of the hands of kids.”
Juul, the leading e-cigarette maker, agreed that children shouldn’t be able to vape its products, and said curtailing access should be done “through significant regulation” and “enforcement.”
“When people say ‘Why aren’t these being regulated?’ They actually are all being regulated,” Dr. Gottlieb said.
For example, companies are required to label their products as potentially addictive, sell only to adults and comply with manufacturing standards. The agency has conducted thousands of inspections of e-cigarette manufacturers and retailers and taken enforcement actions against companies selling e-cigarettes that look like juice boxes, and against a company that was putting the ingredients found in erectile dysfunction drugs into its vape liquid.
Health departments investigating the outbreak told Kaiser Health News that e-cigarettes’ niche as a tobacco product instead of a drug has presented challenges. Most weren’t aware that adverse events could be reported to a database that tracks problems with tobacco products. And, because e-cigarettes never went through the FDA’s “gold-standard” approval process for drugs, doctors can’t readily look up a detailed list of known side effects.
But like other arms of the FDA, the tobacco office has tools and a team to investigate a public health threat just as the teams for drugs and devices do, Dr. Gottlieb said. It may even be better equipped because of its funding.
“I don’t think FDA is operating in any way with hands tied behind its back because of the way that the statute is set up,” he said.
Teen vaping has exploded during this regulatory tussle. In 2011, 1.5% of high school students reported vaping. By 2018, it was 20.8%, according to a CDC report.
Unknown components
Still, doctors and researchers are concerned about the ingredients in e-cigarettes and how little the public knows about the risks of vaping.
In Juul’s terms and conditions, posted on its website, it says, “We encourage consumers to do their own research regarding vapor products and what is right for them.” Many ingredients in e-cigarette products, however, are protected as trade secrets.
Since at least 2013, the flavor industry has expressed concern about the use of flavoring chemicals in vaping products.
The vast majority of the chemicals have been tested only by ingesting them in small quantities because they’re encountered in foods. For most of these chemicals, there have been no tests to determine whether it is safe to inhale them, as happens daily by millions when they use e-cigarettes.
“Many of the ingredients of vaping products, including flavoring substances, have not been tested for … the exposure one would get from using a vaping device,” said John Hallagan, a senior adviser to the Flavor and Extract Manufacturers Association. The group has sent cease-and-desist letters to e-cigarette companies in previous years for using the food safety certification of the flavor industry to imply that the chemicals are also safe in e-cigarettes.
Some flavor chemicals are thought to be harmful when inhaled in high doses. Research suggests that cinnamaldehyde, the main component of many cinnamon flavors, may impair lung function when inhaled. Sven-Eric Jordt, PhD, a professor at Duke University, Durham, N.C., says he presented evidence of its dangers at an FDA meeting in 2015 — and its relative abundance in many e-cigarette vaping liquids. In response, one major e-cigarette liquid seller, Tasty Vapor, voluntarily took its cinnamon-flavored liquid off the shelves.
In 2017, when Dr. Gottlieb delayed the FDA application deadline, the product was back. A company email to its customers put it this way: “Two years ago, Tasty Vapor allowed itself to be intimidated by scaremongering tactics. … We lost a lot of sales as well as a good number of long-time customers. We no long see reason to disappoint our customers hostage for these shady tactics.”
At the time of publication, Tasty Vapor’s owner did not reply to a request for comment.
Dr. Jordt said he is frustrated by the delays in the regulatory approval process.
“As a parent, I would say that the government has not acted on this,” he said. “You’re basically left to act alone with your addicted kid. It’s kind of terrifying that this was allowed to happen. The industry needs to be held to account.”
Kaiser Health News correspondents Cara Anthony, Markian Hawryluk, and Lauren Weber, as well as reporter Victoria Knight contributed to this report. This story first published on California Healthline, a service of the California Health Care Foundation.
Kaiser Health News is a national health policy news service. It is an editorially independent program of the Henry J. Kaiser Family Foundation which is not affiliated with Kaiser Permanente.
It was the arrival of the second man in his early 20s gasping for air that alarmed Dixie Harris, MD. Young patients rarely get so sick, so fast, with a severe lung illness, and this was her second case in a matter of days.
Then she saw three more patients at her Utah telehealth clinic with similar symptoms. They did not have infections, but all had been vaping. When Dr. Harris heard several teenagers in Wisconsin had been hospitalized in similar cases, she quickly alerted her state health department.
As patients in hospitals across the country combat a mysterious illness linked to e-cigarettes, federal and state investigators are frantically trying to trace the outbreaks to specific vaping products that, until recently, were virtually unregulated.
As of Aug. 22, 2019, 193 potential vaping-related illnesses in 22 states had been reported to the Centers for Disease Control and Prevention. Wisconsin, which first put out an alert in July, has at least 16 confirmed and 15 suspected cases. Illinois has reported 34 patients, 1 of whom has died. Indiana is investigating 24 cases.
Lung doctors said they had seen warning signs for years that vaping could be hazardous as they treated patients. Medically it seemed problematic since it often involved inhaling chemicals not normally inhaled into the lungs. Despite that, assessing the safety of a new product storming the market fell between regulatory cracks, leaving doctors unsure where to register concerns before the outbreak. The Food and Drug Administration took years to regulate e-cigarettes once a court determined it had the authority to do so.
“You don’t know what you’re putting into your lungs when you vape,” said Dr. Harris, a critical care pulmonologist. “It’s purported to be safe, but how do you know if it’s safe? To me, it’s a very dangerous thing.”
Off the radar
When e-cigarettes came to market about a decade ago, they fell into a regulatory no man’s land. They are not a food, not a drug, and not a medical device, any of which would have put them immediately in the FDA’s purview. And, until a few years ago, they weren’t even lumped in with tobacco products.
As a result, billions of dollars of vaping products have been sold online, at big-box retailers, and in corner stores without going through the FDA’s rigorous review process to assess their safety. Companies like Juul, Blu, and NJoy quickly established their brands of devices and cartridges, or pods. And thousands of related products are sold, sometimes on the black market, over the Internet, or beyond.
“It makes it really tough because we don’t know what we’re looking for,” said Ruth Lynfield, MD, the state epidemiologist for Minnesota, where several patients were admitted to the ICU as a result of the illness. She added that, if it turns out that the products in question were sold by unregistered retailers and manufacturers “on the street,” outbreak sleuths will have a harder time figuring out exactly what is in them.
With e-cigarettes, people can vape – or smoke – nicotine products, selecting flavorings like mint, mango, blueberry crème brûlée, or cookies and milk. They can also inhale cannabis products. Many are hopeful that e-cigarettes might be useful smoking cessation tools, but some research has called that into question.
The mysterious pulmonary disease cases have been linked to vaping, but it’s unclear whether there is a common device or chemical. In some states, including California and Utah, all of the patients had vaped cannabis products. One or more substances could be involved, health officials have said. The products used by several victims are being tested to see what they contained.
And this has apparently been the case for years.
Multiple doctors described seeing earlier cases of severe lung problems linked to vaping that were not officially reported or included in the current CDC count.
Laura Crotty Alexander, MD, a pulmonologist and researcher with the University of California, San Diego, said she saw her first case about 2 years ago. A young man had been vaping for months with the same device but developed acute lung injury when he switched flavors. She strongly suspected a link, but did not report the illness anywhere.
“It wasn’t that I didn’t want to report it, it’s that there’s no pathway” to do so, Dr. Alexander said.
She said she’s concerned that many physicians haven’t been asking patients about e-cigarette use and that there’s no way to document a case like this in the medical coding system.
John E. Parker, MD, of West Virginia University, Morgantown, said he saw his first patient with pneumonia tied to vaping in 2015. Doctors there were intrigued enough to report on the case at the annual meeting of the American College of Chest Physicians. Dr. Parker and his team didn’t contact a federal agency, and Dr. Parker said it was unclear whom to call.
Numerous other cases have been reported in medical journals and at professional conferences in the years since. The FDA’s voluntary system for reporting tobacco-related health problems included 96 seizures and only 1 lung ailment tied to e-cigarettes between April and June 2019. The system appears to be utilized most by concerned citizens, rather than manufacturers or health care professionals.
But several lung specialists said that due to the patchwork nature of regulatory oversight over the years, the true scope of the problem is yet to be identified.
“We do know that e-cigarettes do not emit a harmless aerosol,” said Brian King, PhD, MPH, a deputy director in the Office on Smoking and Health at the CDC in a call with media on Aug. 23 about the outbreak. “It is possible that some of these cases were already occurring but we were not picking them up.”
Regulatory limits
The FDA has had limited authority to regulate e-cigarettes over the years.
In 2009, Congress passed the Family Smoking Prevention and Tobacco Control Act, empowering the FDA to oversee the safety and sale of tobacco products. But e-cigarettes, still new, were not top of mind.
Later that year, the FDA tried to block imports of e-cigarettes, saying the combination drug-device products were unapproved and therefore illegal for sale in the United States. Two vaping companies, Smoking Everywhere and NJoy, sued, and a federal judge ruled in 2010 that the FDA should regulate e-cigarettes as tobacco products.
It took the agency 6 years to finalize what’s become known as the “deeming rule,” in which it formally began regulating e-cigarettes and e-liquids.
By then, it was May 2016, and the e-cigarette market had swelled to an estimated $4.1 billion, Wells Fargo Securities analyst Bonnie Herzog said at the time. Market researchers now project that the global industry could reach $48 billion by 2023.
Critics say the FDA took too long to act.
“I think the fact that FDA has been dillydallying [has made] figuring out what’s going on [with this outbreak] much harder,” said Stanton Glantz, PhD, a University of California, San Francisco, professor in its Center for Tobacco Control Research and Education. “No question.”
The agency began by banning e-cigarette sales to minors and requiring all new vaping products to submit applications for authorization before they could come to market. Companies and retailers with thousands of products already on the market were granted 2 years to submit applications, and the FDA would get an additional year to evaluate the applications. Meanwhile, existing products could still be sold.
But when Scott Gottlieb, MD, arrived as the new FDA commissioner in 2017, the rule hadn’t been implemented and there was no formal guidance for companies to file applications, he said. As a result, he pushed the deadline back to 2022, drawing ire from public health advocates, who called foul over his previous ties to an e-cigarette retailer called Kure.
“I thought e-cigarettes at the time – and I still believe – that they represent an opportunity for currently addicted adult smokers to transition off of combustible tobacco,” he said in an interview, adding that other parts of the deeming rule went into effect as planned. “All I did was delay the application deadline.”
Dr. Gottlieb’s thinking changed the following year, when a national survey showed a sharp rise in teen vaping, which he called an “epidemic.” He announced that the agency would rethink the extended deadline and weigh whether to take flavors that appeal to kids off the market.
A judge ruled last month that e-cigarette makers would have only 10 more months to submit applications to the FDA. They’re now due in May 2020.
Asked about the lung injuries appearing now, Dr. Gottlieb, who left the FDA in April 2019, said he suspected counterfeit pods are to blame, given the geographic clustering of cases and the fact that, overall, the FDA is inspecting registered e-cigarette makers and retailers to make sure they’re complying with existing regulations.
“I think the manufacturers are culpable if their products are being used, whether the liquids are counterfeit or real,” he said. “Ultimately, they’re responsible for keeping their products out of the hands of kids.”
Juul, the leading e-cigarette maker, agreed that children shouldn’t be able to vape its products, and said curtailing access should be done “through significant regulation” and “enforcement.”
“When people say ‘Why aren’t these being regulated?’ They actually are all being regulated,” Dr. Gottlieb said.
For example, companies are required to label their products as potentially addictive, sell only to adults and comply with manufacturing standards. The agency has conducted thousands of inspections of e-cigarette manufacturers and retailers and taken enforcement actions against companies selling e-cigarettes that look like juice boxes, and against a company that was putting the ingredients found in erectile dysfunction drugs into its vape liquid.
Health departments investigating the outbreak told Kaiser Health News that e-cigarettes’ niche as a tobacco product instead of a drug has presented challenges. Most weren’t aware that adverse events could be reported to a database that tracks problems with tobacco products. And, because e-cigarettes never went through the FDA’s “gold-standard” approval process for drugs, doctors can’t readily look up a detailed list of known side effects.
But like other arms of the FDA, the tobacco office has tools and a team to investigate a public health threat just as the teams for drugs and devices do, Dr. Gottlieb said. It may even be better equipped because of its funding.
“I don’t think FDA is operating in any way with hands tied behind its back because of the way that the statute is set up,” he said.
Teen vaping has exploded during this regulatory tussle. In 2011, 1.5% of high school students reported vaping. By 2018, it was 20.8%, according to a CDC report.
Unknown components
Still, doctors and researchers are concerned about the ingredients in e-cigarettes and how little the public knows about the risks of vaping.
In Juul’s terms and conditions, posted on its website, it says, “We encourage consumers to do their own research regarding vapor products and what is right for them.” Many ingredients in e-cigarette products, however, are protected as trade secrets.
Since at least 2013, the flavor industry has expressed concern about the use of flavoring chemicals in vaping products.
The vast majority of the chemicals have been tested only by ingesting them in small quantities because they’re encountered in foods. For most of these chemicals, there have been no tests to determine whether it is safe to inhale them, as happens daily by millions when they use e-cigarettes.
“Many of the ingredients of vaping products, including flavoring substances, have not been tested for … the exposure one would get from using a vaping device,” said John Hallagan, a senior adviser to the Flavor and Extract Manufacturers Association. The group has sent cease-and-desist letters to e-cigarette companies in previous years for using the food safety certification of the flavor industry to imply that the chemicals are also safe in e-cigarettes.
Some flavor chemicals are thought to be harmful when inhaled in high doses. Research suggests that cinnamaldehyde, the main component of many cinnamon flavors, may impair lung function when inhaled. Sven-Eric Jordt, PhD, a professor at Duke University, Durham, N.C., says he presented evidence of its dangers at an FDA meeting in 2015 — and its relative abundance in many e-cigarette vaping liquids. In response, one major e-cigarette liquid seller, Tasty Vapor, voluntarily took its cinnamon-flavored liquid off the shelves.
In 2017, when Dr. Gottlieb delayed the FDA application deadline, the product was back. A company email to its customers put it this way: “Two years ago, Tasty Vapor allowed itself to be intimidated by scaremongering tactics. … We lost a lot of sales as well as a good number of long-time customers. We no long see reason to disappoint our customers hostage for these shady tactics.”
At the time of publication, Tasty Vapor’s owner did not reply to a request for comment.
Dr. Jordt said he is frustrated by the delays in the regulatory approval process.
“As a parent, I would say that the government has not acted on this,” he said. “You’re basically left to act alone with your addicted kid. It’s kind of terrifying that this was allowed to happen. The industry needs to be held to account.”
Kaiser Health News correspondents Cara Anthony, Markian Hawryluk, and Lauren Weber, as well as reporter Victoria Knight contributed to this report. This story first published on California Healthline, a service of the California Health Care Foundation.
Kaiser Health News is a national health policy news service. It is an editorially independent program of the Henry J. Kaiser Family Foundation which is not affiliated with Kaiser Permanente.
‘No Surprises Act’ clears House committee
In welcomed news, the House Energy and Commerce Committee approved legislation that would address surprise bills by protecting patients when they access care and aren’t aware that a provider is outside of their insurance network.
The No Surprises Act, H.R. 3630, would allow providers to appeal a federal benchmark payment to an arbiter in cases when the median in-network payment to physicians or hospitals exceeds $1,250. This arbitration provision was included in the bill at the last minute by Reps. Raul Ruiz, D-Calif., and Larry Buschon, R-Ind., to address provider concerns. Without an option for arbitration, physicians would be at a severe disadvantage when negotiating contracts with insurers. AGA supports and will continue to advocate for provisions that give physicians an opportunity to go to arbitration similar to the effective New York state model.
The No Surprises Act also requires the Department of Health and Human Services to study the impact of the legislation, including the adequacy of provider networks, and to establish an audit process for medical contracted rates.
Addressing surprise medical bills and protecting patients has been a priority on Capitol Hill and one that has strong bipartisan support in both chambers of Congress and from President Trump. Since this new House bill also has jurisdiction from the Ways and Means Committee and the Education and Labor Committee, both committees will need to address the bill before it can advance. AGA will keep you updated on the status of this important legislation.
Top AGA Community patient cases
Physicians with difficult patient scenarios regularly bring their questions to the AGA Community to seek advice from colleagues about therapy and disease management options, best practices, and diagnoses. In case you missed it, here are the most popular clinical discussions shared in the forum recently:
1. Combination therapy with Entyvio – The GI community shared their experiences with combination therapy of Entyvio and immunomodulators in patients with ulcerative colitis who have developed antibodies to anti-TNF therapy.
2. Small bowel ulcerations in anemic patient with rheumatoid arthritis – Read an update on this patient with rheumatoid arthritis who was experiencing recurrent abdominal pain associated with iron-deficiency anemia diagnosed with multiple small bowel ulcers.
3. When losing weight is too difficult – How do you approach NAFLD patients who have a difficult time committing to a weight-loss treatment plan?
Access these clinical cases and more discussions at https://community.gastro.org/discussions.
Prior authorization and step therapy: My visit to Capitol Hill
As an early-career gastroenterologist, I have become increasingly aware of the impact of advocacy in championing legislation important to our patients. Initially naive about health care advocacy, I owe much to AGA in preparing and arranging for opportunities to speak with elected officials and their staff on GI-related priorities and bills. As a member of the AGA Congressional Advocates Program, I received training and support in visiting Capitol Hill, discussing specific legislation and upcoming bills, writing op-eds, and hosting site visits.
Most recently, AGA sponsored my attendance at the Alliance of Specialty Medicine Annual Advocacy Fly In. With colleagues from around the country – in specialties ranging from ophthalmology to dermatology – we listened to invited congressional representatives and senators on important bills that can directly affect the care we provide to our patients. We had the opportunity to ask questions of these legislators, many of whom were fellow physicians, and gain advice on effective advocacy, as well as build camaraderie with our colleagues in other specialties who face similar issues.
With colleagues from Texas, and assisted by Kathleen Teixeira, AGA vice president, government affairs, we visited the offices of our congressional representatives and senators throughout the afternoon. During our meetings with congressional staff, we stressed the importance of making changes to current prior authorization and step-therapy approaches to make it easier for our patients to access the right treatments as soon as possible. We also discussed the importance of supporting graduate medical education to ensure we have a future cohort of gastroenterologists and other specialists to meet the rising demands of our population. We were well received, and the briefs prepared by the alliance and AGA, as well as tips on effectively communicating our positions, made the whole process seamless. Discussing our own personal experiences and sharing patient stories, we found our meetings to be productive and insightful.
Now, I hope to host my congresswoman, Rep. Lizzie Fletcher, D-Tex., for a site visit locally at Baylor, after a successful meeting with her aide on Capitol Hill.
None of this would have been possible without AGA’s support in arranging these presentations, meetings, and physically supporting us throughout the process. I encourage all of you to utilize AGA in advocating for our patients. It is fun, high impact, and incredibly insightful!
How to get involved in advocacy
Interested in advocacy but not sure how or whether you have time in your busy schedule? AGA has an array of options for how you can be active in advocacy. Some take as little as 5 minutes.
Letter writing. AGA uses GovPredict, an online advocacy platform that allows members to contact their member of Congress with just a few clicks. AGA develops messages on significant pieces of legislation, key efforts in Congress or on issues being advanced by federal agencies that have a great effect on gastroenterology. AGA’s ongoing letter writing campaigns can always be found on gastro.org, but be sure to keep an eye out for advocacy emails, AGA eDigest, and social media, so you do not miss your opportunity to take action on timely issues. AGA encourages its members to share letter writing campaigns with their colleagues, as well as posting them on social media.
Meetings with your member of Congress. In-person meetings are an excellent opportunity to share with your member of Congress, or their staff, how the issues that affect gastroenterology affect you, your patients, and your practice. AGA has a plethora of resources to help you set up a meeting with your member of Congress, including up-to-date issue briefs, tips and tricks for productive meetings, and webinars on how to host an on-site visit. AGA staff is always more than happy to help you arrange a meeting either in Washington, DC, or your home state. If you are interested in arranging a meeting with your member of Congress, please contact AGA Public Policy Coordinator, Jonathan Sollish, at [email protected] or 240-482-3228.
AGA PAC. AGA PAC is a voluntary, nonpartisan political organization affiliated with and supported by AGA. The only political action committee supported by a national gastroenterology society, its mission is to give gastroenterologists a greater presence on Capitol Hill and a more effective voice in policy discussions. AGA PAC supports candidates who support our policy priorities, such as fair reimbursement, cutting regulatory red tape, supporting patient protections and access to specialty care, and sustained federal funding of digestive disease research. If you are interested in learning more, contact AGA Government and Political Affairs Manager, Navneet Buttar, at [email protected] or 240-482-3221.
Congressional Advocates Program. This grassroots program is aimed at establishing a stronger foundation for our current and future advocacy initiatives by creating state teams to work on advocacy on the local, state, and national levels. Participation can include a wide variety of activities, ranging from creating educational posts on social media to meeting with members of Congress. Members of the Congressional Advocates Program are mentored and receive advocacy training by AGA leadership and staff. Participating members receive an AGA Congressional Advocate Program Certificate, a Digestive Disease Week® (DDW) badge ribbon, policy badge on the AGA Community, and recognition on AGA’s website. Applications for the next cycle will be released in 2019.
ACOG advises bleeding disorder screening for teens with heavy menstruation
Adolescent girls with heavy menstrual bleeding should be assessed for bleeding disorders, according to a Committee Opinion issued by the American College of Obstetricians and Gynecologists.
A bleeding disorder is secondary only to anovulation as a cause of heavy menstrual bleeding in adolescents.
Bleeding disorders affect 1%-2% of the general population, but are “found in approximately 20% of adolescent girls who present for evaluation of heavy menstrual bleeding and in 33% of adolescent girls hospitalized for heavy menstrual bleeding,” wrote Oluyemisi Adeyemi-Fowode, MD, and Judith Simms-Cendan, MD, and members of the ACOG Committee on Adolescent Health Care in the opinion, published in Obstetrics & Gynecology.
The committee advised that physical examination of teens with acute heavy menstrual bleeding should include assessment of hemodynamic stability with orthostatic blood pressure and pulse measurements. A speculum exam is not usually needed in teen girls with heavy menstrual bleeding. Evaluation should include screening for anemia attributable to blood loss with serum ferritin, endocrine disorders, and bleeding disorders. In suspected cases of bleeding disorders, laboratory evaluation and medical management should be done in consultation with a hematologist.
Those who are actively bleeding or hemodynamically unstable should be hospitalized for medical management, they said.
Ultrasonography is not necessary for an initial work-up of teens with heavy menstrual bleeding, but could be useful in patients who fail to respond to medical management.
Adolescent girls without contraindications to estrogen can be treated with hormone therapy in various forms including intravenous conjugated estrogen every 4-6 hours or oral 30-50 mg ethinyl estradiol every 6-8 hours until cessation of bleeding. Antifibrinolytics also can be used to stop bleeding.
Maintenance therapy after correction of acute heavy bleeding can include a combination of treatments such as hormonal contraceptives, oral and injectable progestins, and levonorgestrel-releasing intrauterine devices, the committee wrote. They also recommended oral iron replacement therapy for all women of reproductive age with anemia caused by menstrual bleeding.
If a patient fails to respond to medical therapy, nonmedical options or surgery may be considered, according to the committee. In addition, all teen girls with bleeding disorders should be advised about safe medication use, including the use of aspirin or NSAIDs only on the recommendation of a hematologist.
Patients and their families need education on menstrual issues including possible options for surgery in the future if heavy menstruation does not resolve. If a patient has a known bleeding disorder and is considering surgery, preoperative evaluation should include a consultation with a hematologist and an anesthesiologist, the committee noted.
Melissa Kottke, MD, MPH, said in an interview, “Every ob.gyn. will see a young patient with ‘heavy menstrual bleeding.’ And it becomes part of the art and challenge to work with the patient and family to collectively explore if this is, indeed, ‘heavy’ and of concern … or is it is a ‘normal’ menstrual period and simply reflects a newer life experience that would benefit from some education? And the stakes are high. Young people who have heavy menstrual cycles are much more likely to have an underlying bleeding disorder than the general population (20% vs. 1%-2%), and 75%-80% of adolescents with bleeding disorders report heavy menses as the most common clinical manifestation of their disorder.
“Fortunately, Committee Opinion 785, ‘Screening and Management of Bleeding Disorders in Adolescents with Heavy Menstrual Bleeding’ from the ACOG Committee on Adolescent Health Care is detailed and pragmatic. It outlines how to translate everyday conversations with young people about their menses into a quantifiable estimate of bleeding, including a very teen-friendly Pictorial Blood Loss Assessment Chart. It also gives ob.gyns. ever-important guidance about what to do next for evaluation and diagnosis. This committee opinion nicely outlines how to help manage heavy bleeding in an adolescent with a detailed algorithm. And very importantly, it gives clear management guidance and encourages ob.gyns. to avoid frequently unnecessary (speculum exams and ultrasounds) and excessive (early transfusion or surgical interventions) approaches to management for the young patient. I think it will be a great resource for any provider who is taking care of heavy menstrual bleeding for a young person,” said Dr. Kottke, who is director of the Jane Fonda Center for Adolescent Reproductive Health and associate professor of gynecology and obstetrics, both at Emory University, Atlanta. Dr. Kottke is not a member of the ACOG Committee on Adolescent Health and was asked to comment on the opinion.*
The complete opinion, ACOG Committee Opinion number 785, includes recommended laboratory tests, an eight-question screening tool, and a management algorithm.
The committee members had no financial conflicts to disclose. Dr. Kottke said she had no relevant financial disclosures.
SOURCE: Adeyemi-Fowode O and Simms-Cendan J. Obstet Gynecol. 2019 Sep. 134:e71-83.
*This article was updated on 9/9/2019.
FROM OBSTETRICS AND GYNECOLOGY
Purchase VAM on Demand
All who attended the 2019 Vascular Annual Meeting can review sessions they attended, as well as “attend” those that they missed. Those who weren’t at VAM can now experience all they missed. Slides and audio presentations of nearly every session are included in VAM on Demand. The cost for one year of access is $199 for VAM attendees and $499 for non-attendees. Those who purchased VAM on Demand before the meeting ended can visit this site to gain access by logging in with their SVS credentials.
All who attended the 2019 Vascular Annual Meeting can review sessions they attended, as well as “attend” those that they missed. Those who weren’t at VAM can now experience all they missed. Slides and audio presentations of nearly every session are included in VAM on Demand. The cost for one year of access is $199 for VAM attendees and $499 for non-attendees. Those who purchased VAM on Demand before the meeting ended can visit this site to gain access by logging in with their SVS credentials.
All who attended the 2019 Vascular Annual Meeting can review sessions they attended, as well as “attend” those that they missed. Those who weren’t at VAM can now experience all they missed. Slides and audio presentations of nearly every session are included in VAM on Demand. The cost for one year of access is $199 for VAM attendees and $499 for non-attendees. Those who purchased VAM on Demand before the meeting ended can visit this site to gain access by logging in with their SVS credentials.
In vasculitis, the skin tells the story
MILAN – , Robert Micheletti, MD, said at the World Congress of Dermatology.

In granulomatous vasculitis, histiocytes and giant cells can play a significant role, explained Dr. Micheletti, director of the cutaneous vasculitis clinic at the University of Pennsylvania, Philadelphia. The condition may be secondary to an autoimmune disease such as lupus erythematosus or RA; a granulomatous disease such as Crohn’s disease or sarcoidosis; infections such as tuberculosis, a fungal disease, or herpes or zoster viruses, or lymphoma, Dr. Micheletti said.
However, a primary systemic vasculitis such as granulomatosis with polyangiitis (GPA; formerly known as Wegener’s polyangiitis) or eosinophilic granulomatosis with polyangiitis (EGPA; also known as Churg-Strauss vasculitis), giant cell arteritis, or Takayasu arteritis may also be responsible, he said. Occasionally, the culprit can also be a drug-induced vasculitis.
The physical examination gives clues to the size of involved vessels, which in turn helps to classify the vasculitis, Dr. Micheletti said.
When vasculitis affects small vessels, the skin findings will be palpable purpura, urticarial papules, vesicles, and petechiae, he said, adding that “The small vessel involvement accounts for the small size of the lesions, and complement cascade and inflammation account for the palpability of the lesions and the symptomatology.” As red blood cells extravasate from the affected vessels, nonblanching purpura develop, and gravity’s effect on the deposition of immune complex material dictates how lesions are distributed.
“Manifestations more typical of medium vessel vasculitis include subcutaneous nodules, livedo reticularis, retiform purpura, larger hemorrhagic bullae, and more significant ulceration and necrosis,” he said. “If such lesions are seen, suspect medium-vessel vasculitis or vasculitis overlapping small and medium vessels.” Cutaneous or systemic polyarteritis nodosa, antineutrophilic cytoplasmic autoantibody (ANCA)–associated vasculitis, and cryoglobulinemic vasculitis are examples, he added.
The particularities of renal manifestations of vasculitis also offer clues to the vessels involved. When a vasculitis patient has glomerulonephritis, suspect small-vessel involvement, Dr. Micheletti said. However, vasculitis affecting medium-sized vessels will cause renovascular hypertension and, potentially renal arterial aneurysms.
Nerves are typically spared in small-vessel vasculitis, while wrist or foot drop can be seen in mononeuritis multiplex.
Recently, the Diagnostic and Classification Criteria in Vasculitis Study (DCVAS) looked at more than 6,800 patients at over 130 sites around the world, proposing new classification criteria for ANCA-associated vasculitis (AAV) and large-vessel vasculitis. The study found that skin findings are common in AAV, with 30%-50% of cases presenting initially with skin lesions. Petechiae and/or purpura are the most common of the skin manifestations, he said. By contrast, for EGPA, allergic and nonspecific findings were the most common findings.
Although skin biopsy can confirm the diagnosis in up to 94% of AAV cases, it’s underutilized and performed in less than half (24%-44%) of cases, Dr. Micheletti said. The study’s findings “demonstrate the importance of a good skin exam, as well as its utility for diagnosis” of vasculitis, he said.
An additional finding form the DCVAS study was that skin lesions can give clues to severity of vasculitis: “Among 1,184 patients with ANCA-associated vasculitis, those with cutaneous involvement were more likely to have systemic manifestations of disease, more likely to have such severe manifestations as glomerulonephritis, alveolar hemorrhage, and mononeuritis,” said Dr. Micheletti, with a hazard ratio of 2.0 among those individuals who had EGPA or GPA.
“Skin findings have diagnostic and, potentially, prognostic importance,” he said. “Use the physician exam and your clinical acumen to your advantage,” but always confirm vasculitis with a biopsy. “Clinicopathologic correlation is key.” A simple urinalysis will screen for renal involvement, and is of “paramount importance,” he added.
Dr. Micheletti reported that he had no relevant disclosures.
MILAN – , Robert Micheletti, MD, said at the World Congress of Dermatology.
In granulomatous vasculitis, histiocytes and giant cells can play a significant role, explained Dr. Micheletti, director of the cutaneous vasculitis clinic at the University of Pennsylvania, Philadelphia. The condition may be secondary to an autoimmune disease such as lupus erythematosus or RA; a granulomatous disease such as Crohn’s disease or sarcoidosis; infections such as tuberculosis, a fungal disease, or herpes or zoster viruses, or lymphoma, Dr. Micheletti said.
However, a primary systemic vasculitis such as granulomatosis with polyangiitis (GPA; formerly known as Wegener’s polyangiitis) or eosinophilic granulomatosis with polyangiitis (EGPA; also known as Churg-Strauss vasculitis), giant cell arteritis, or Takayasu arteritis may also be responsible, he said. Occasionally, the culprit can also be a drug-induced vasculitis.
The physical examination gives clues to the size of involved vessels, which in turn helps to classify the vasculitis, Dr. Micheletti said.
When vasculitis affects small vessels, the skin findings will be palpable purpura, urticarial papules, vesicles, and petechiae, he said, adding that “The small vessel involvement accounts for the small size of the lesions, and complement cascade and inflammation account for the palpability of the lesions and the symptomatology.” As red blood cells extravasate from the affected vessels, nonblanching purpura develop, and gravity’s effect on the deposition of immune complex material dictates how lesions are distributed.
“Manifestations more typical of medium vessel vasculitis include subcutaneous nodules, livedo reticularis, retiform purpura, larger hemorrhagic bullae, and more significant ulceration and necrosis,” he said. “If such lesions are seen, suspect medium-vessel vasculitis or vasculitis overlapping small and medium vessels.” Cutaneous or systemic polyarteritis nodosa, antineutrophilic cytoplasmic autoantibody (ANCA)–associated vasculitis, and cryoglobulinemic vasculitis are examples, he added.
The particularities of renal manifestations of vasculitis also offer clues to the vessels involved. When a vasculitis patient has glomerulonephritis, suspect small-vessel involvement, Dr. Micheletti said. However, vasculitis affecting medium-sized vessels will cause renovascular hypertension and, potentially renal arterial aneurysms.
Nerves are typically spared in small-vessel vasculitis, while wrist or foot drop can be seen in mononeuritis multiplex.
Recently, the Diagnostic and Classification Criteria in Vasculitis Study (DCVAS) looked at more than 6,800 patients at over 130 sites around the world, proposing new classification criteria for ANCA-associated vasculitis (AAV) and large-vessel vasculitis. The study found that skin findings are common in AAV, with 30%-50% of cases presenting initially with skin lesions. Petechiae and/or purpura are the most common of the skin manifestations, he said. By contrast, for EGPA, allergic and nonspecific findings were the most common findings.
Although skin biopsy can confirm the diagnosis in up to 94% of AAV cases, it’s underutilized and performed in less than half (24%-44%) of cases, Dr. Micheletti said. The study’s findings “demonstrate the importance of a good skin exam, as well as its utility for diagnosis” of vasculitis, he said.
An additional finding form the DCVAS study was that skin lesions can give clues to severity of vasculitis: “Among 1,184 patients with ANCA-associated vasculitis, those with cutaneous involvement were more likely to have systemic manifestations of disease, more likely to have such severe manifestations as glomerulonephritis, alveolar hemorrhage, and mononeuritis,” said Dr. Micheletti, with a hazard ratio of 2.0 among those individuals who had EGPA or GPA.
“Skin findings have diagnostic and, potentially, prognostic importance,” he said. “Use the physician exam and your clinical acumen to your advantage,” but always confirm vasculitis with a biopsy. “Clinicopathologic correlation is key.” A simple urinalysis will screen for renal involvement, and is of “paramount importance,” he added.
Dr. Micheletti reported that he had no relevant disclosures.
AT WCD2019
Attend Symposium on Pediatric Renovascular Hypertension
Attend the first ever International Symposium on Pediatric Renovascular Hypertension Nov. 11-12 at the University of Michigan in Ann Arbor. This conference will bring multi-disciplinary experts together to identify best practices in clinical management of unique pediatric patients. An array of distinguished physicians and researchers will highlight the best practices in patient care, recent discovery and ongoing research. Conference admission is free; breakfast, lunch and coffee breaks will be served. Register today.
Attend the first ever International Symposium on Pediatric Renovascular Hypertension Nov. 11-12 at the University of Michigan in Ann Arbor. This conference will bring multi-disciplinary experts together to identify best practices in clinical management of unique pediatric patients. An array of distinguished physicians and researchers will highlight the best practices in patient care, recent discovery and ongoing research. Conference admission is free; breakfast, lunch and coffee breaks will be served. Register today.
Attend the first ever International Symposium on Pediatric Renovascular Hypertension Nov. 11-12 at the University of Michigan in Ann Arbor. This conference will bring multi-disciplinary experts together to identify best practices in clinical management of unique pediatric patients. An array of distinguished physicians and researchers will highlight the best practices in patient care, recent discovery and ongoing research. Conference admission is free; breakfast, lunch and coffee breaks will be served. Register today.
It’s PAD Month: Here’s a Gift for You and Your Patients
September is PAD month. Did you know that the SVS Foundation offers free patient education fliers that you can easily customize with your own office name and contact information? We have one on PAD, one on Smoking and Vascular Disease, and seven others on various vascular-related topics. All are free and available for download in English and Spanish. Visit this page to view and celebrate PAD month with some patient education.
September is PAD month. Did you know that the SVS Foundation offers free patient education fliers that you can easily customize with your own office name and contact information? We have one on PAD, one on Smoking and Vascular Disease, and seven others on various vascular-related topics. All are free and available for download in English and Spanish. Visit this page to view and celebrate PAD month with some patient education.
September is PAD month. Did you know that the SVS Foundation offers free patient education fliers that you can easily customize with your own office name and contact information? We have one on PAD, one on Smoking and Vascular Disease, and seven others on various vascular-related topics. All are free and available for download in English and Spanish. Visit this page to view and celebrate PAD month with some patient education.
Dapagliflozin-Induced Sweet Syndrome
To the Editor:
A 75-year-old woman with a history of hypertension, gout, and adult-onset diabetes mellitus was started on dapagliflozin (5 mg) for glycemic control (hemoglobin A1c, 7.9 [reference range, 4–7]). Within 1 week of starting the medication, she developed a fine papular eruption in a photodistributed area on the neck and chest with associated malaise. The rash progressed over the next 2 weeks, evolving into edematous papules and plaques, some with vesicles involving the neck, chest, postauricular areas, and nose. Approximately 3 weeks after starting dapagliflozin, the patient also developed bilateral painful, hemorrhagic, bullous plaques (10×3 cm overall) without satellite lesions on the dorsal aspects of the hands. The borders of the bullae had rapidly expanding geographic margins and were extremely painful. The patient’s primary care physician advised to discontinue dapagliflozin, as this medication was thought to be triggering the eruption. She was administered triamcinolone (40 mg intramuscularly) and advised to take ibuprofen as needed. She had malaise and reported that she felt hot but had no known fever. No laboratory tests were ordered.
The lesions on the neck and chest began to fade within 1 week of stopping the medication and administering corticosteroids; however, the hand lesions continued to progress and began to involve the base of the digits (Figure 1). The patient was then seen by a dermatologist who biopsied the hand lesions. Histopathology was characteristic of Sweet syndrome, also known as acute febrile neutrophilic dermatosis and Gomm-Button disease. Notably, there was a dense nodular infiltrate of neutrophils, papillary dermal edema, and leukocytoclastic debris without leukocytoclastic vasculitis (Figure 2).
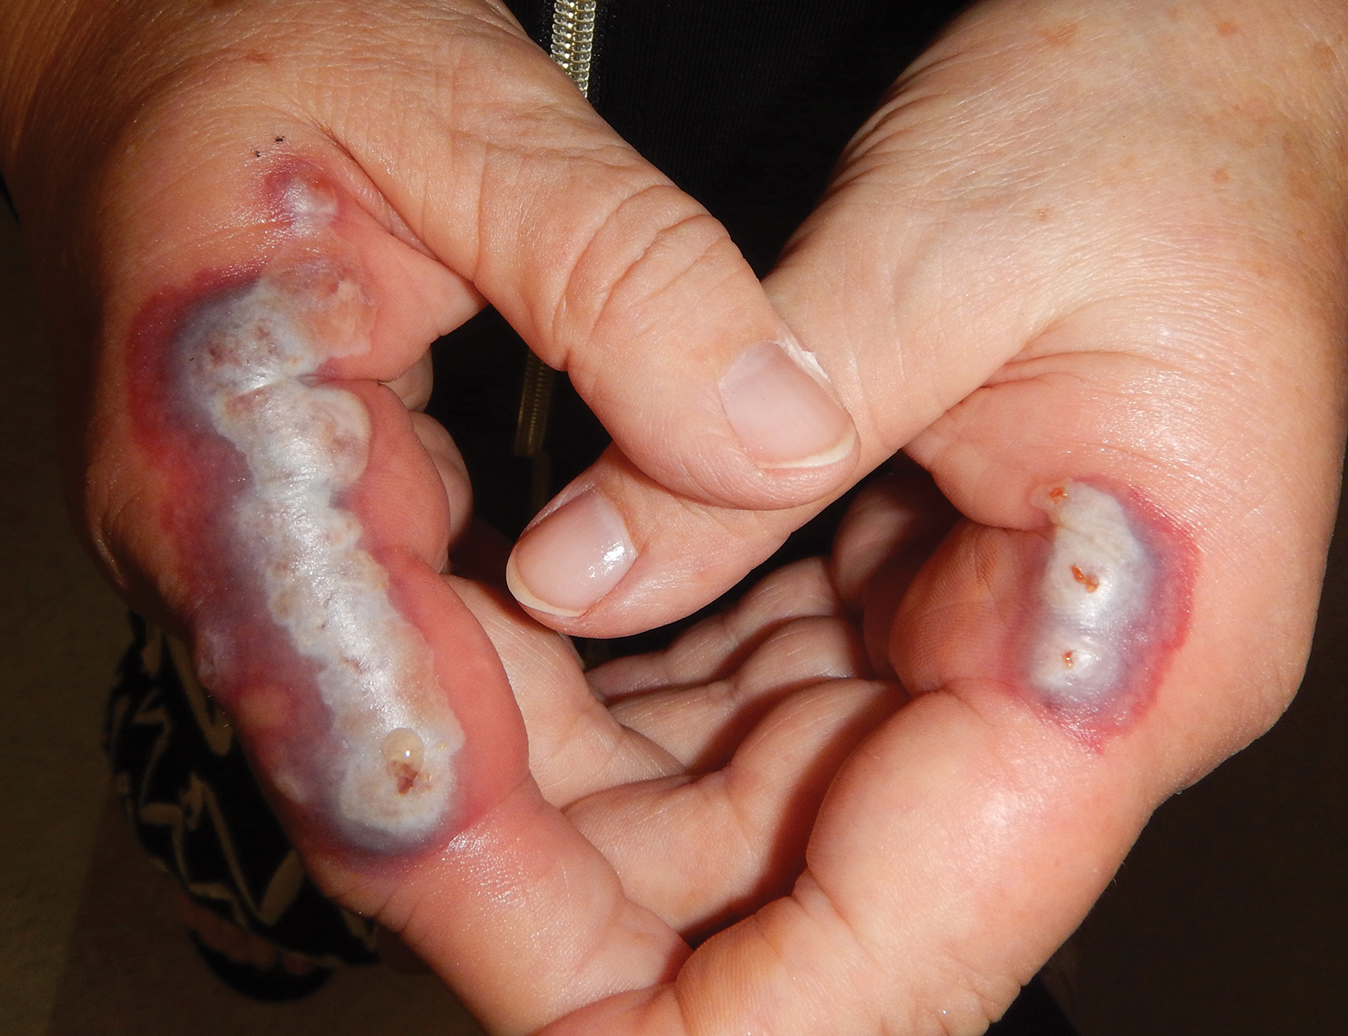
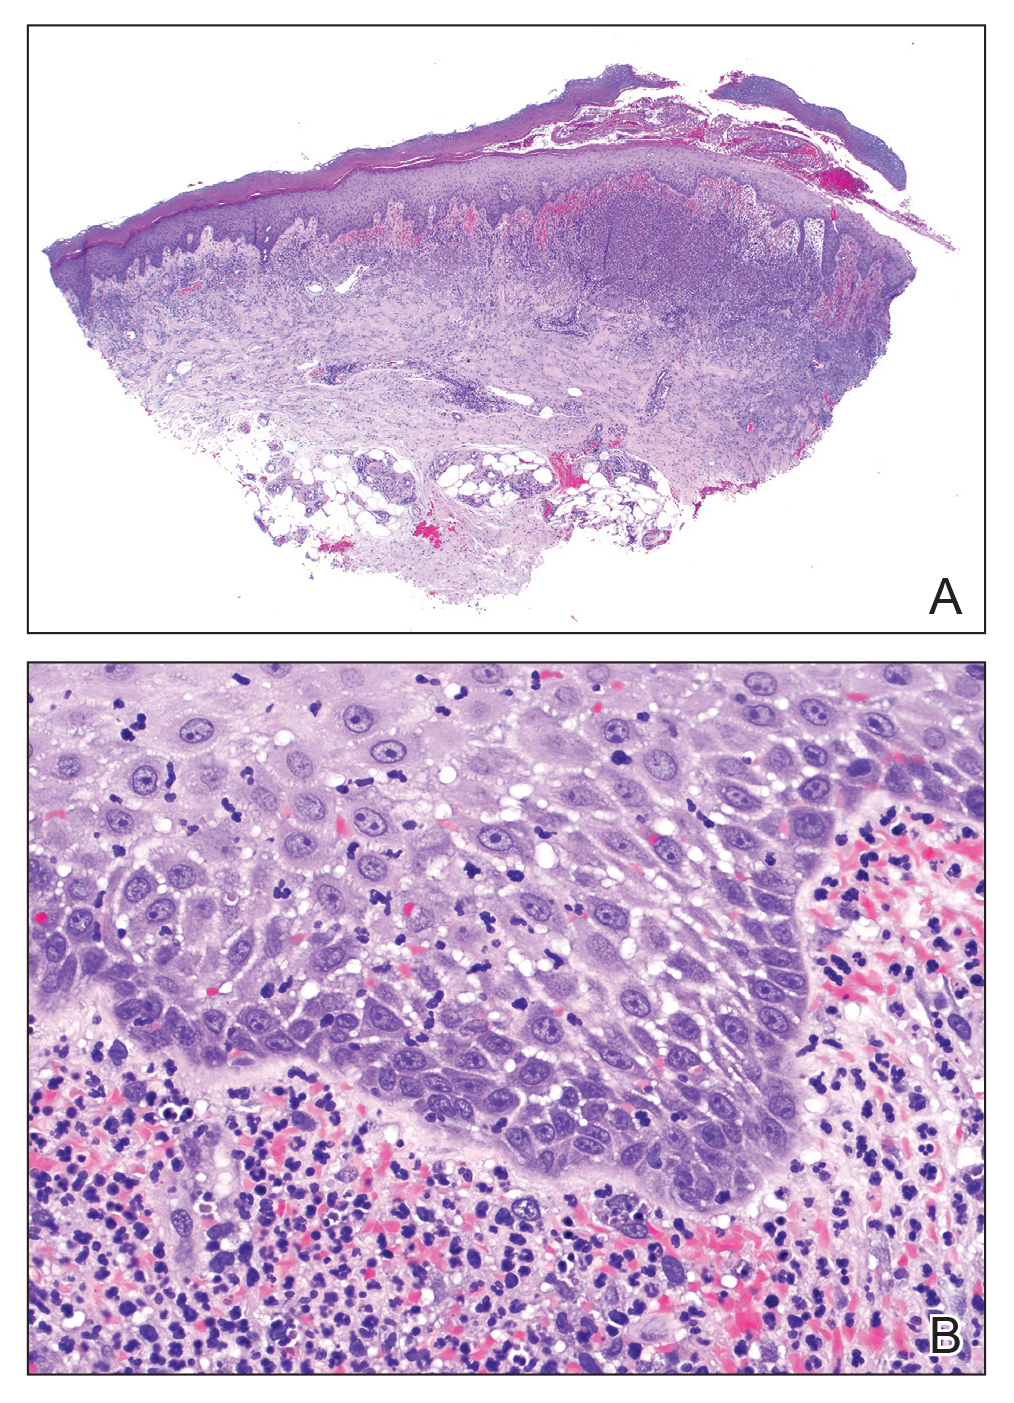
The following therapies in addition to gentle wound care were prescribed: betamethasone injectable suspension (9 mg intramuscularly), oral prednisone (60 mg daily for 5 days, tapering off over 2 months), clobetasol ointment 0.05% twice daily, and tacrolimus ointment 0.1% twice daily. The patient responded well to therapy, with complete resolution and healing of the skin lesions except for mild postinflammatory pigment alteration. The systemic steroids were slowly tapered over 2 months, and the patient remained free of symptoms or recurrences more than 3 years after discontinuation of the medication.
Dapagliflozin is a member of a new class of medications (gliflozins) used for the treatment of type 2 diabetes mellitus.3,4 The medication lowers blood glucose by inhibiting the sodium-glucose cotransport protein 2, thus lowering the blood glucose levels by increasing urinary excretion of glucose. Because many patients with type 2 diabetes mellitus are overweight, these medications are poised to gain popularity for weight loss and decreased blood pressure side effects. Three other medications in this class also have been approved by US Food and Drug Administration: empagliflozin, canagliflozin, and ertugliflozin.
Sweet syndrome consists of 4 cardinal features that were first described in 1964: fever, leukocytosis, tender red plaques, and a dermal neutrophilic infiltrate.5 Since then, Su and Liu6 proposed guidelines consisting of major and minor criteria. In 1996, Walker and Cohen7 suggested a set of diagnostic criteria specifically for drug-induced Sweet syndrome, including painful erythematous plaques, histopathologic neutrophilic infiltrate, and fever. Additional criteria included a temporal relationship between drug ingestion and clinical presentation as well as resolution of lesions after drug withdrawal or treatment with systemic corticosteroids.7 The lesions of drug-induced Sweet syndrome often are described as painful red papules that can form plaques, may appear vesicular, and are more common in women. These lesions classically appear on the upper extremities, as well as the head, neck, trunk, and back.8 Clinically, symptoms most commonly include fever and musculoskeletal involvement, both of which were experienced by the patient who described herself as feeling feverish when the lesions first appeared and reported malaise. Our patient experienced all of these features, and although a fever was not measured in the acute stage of presentation, she reported feeling hot. Other symptoms that may occur include arthralgia, headache, and myalgia.9 Microscopically, there is a nodular infiltrate of neutrophils, papillary dermal edema, and leukocytoclastic debris. The pathogenesis of Sweet syndrome remains unclear but can be associated with malignancy, pregnancy, autoimmune disorders, and drug reactions.10 Many different classes of medications have been reported to cause drug-induced Sweet syndrome and are listed in the Table.1,8,11 The recommended treatment of Sweet syndrome is systemic corticosteroids.12
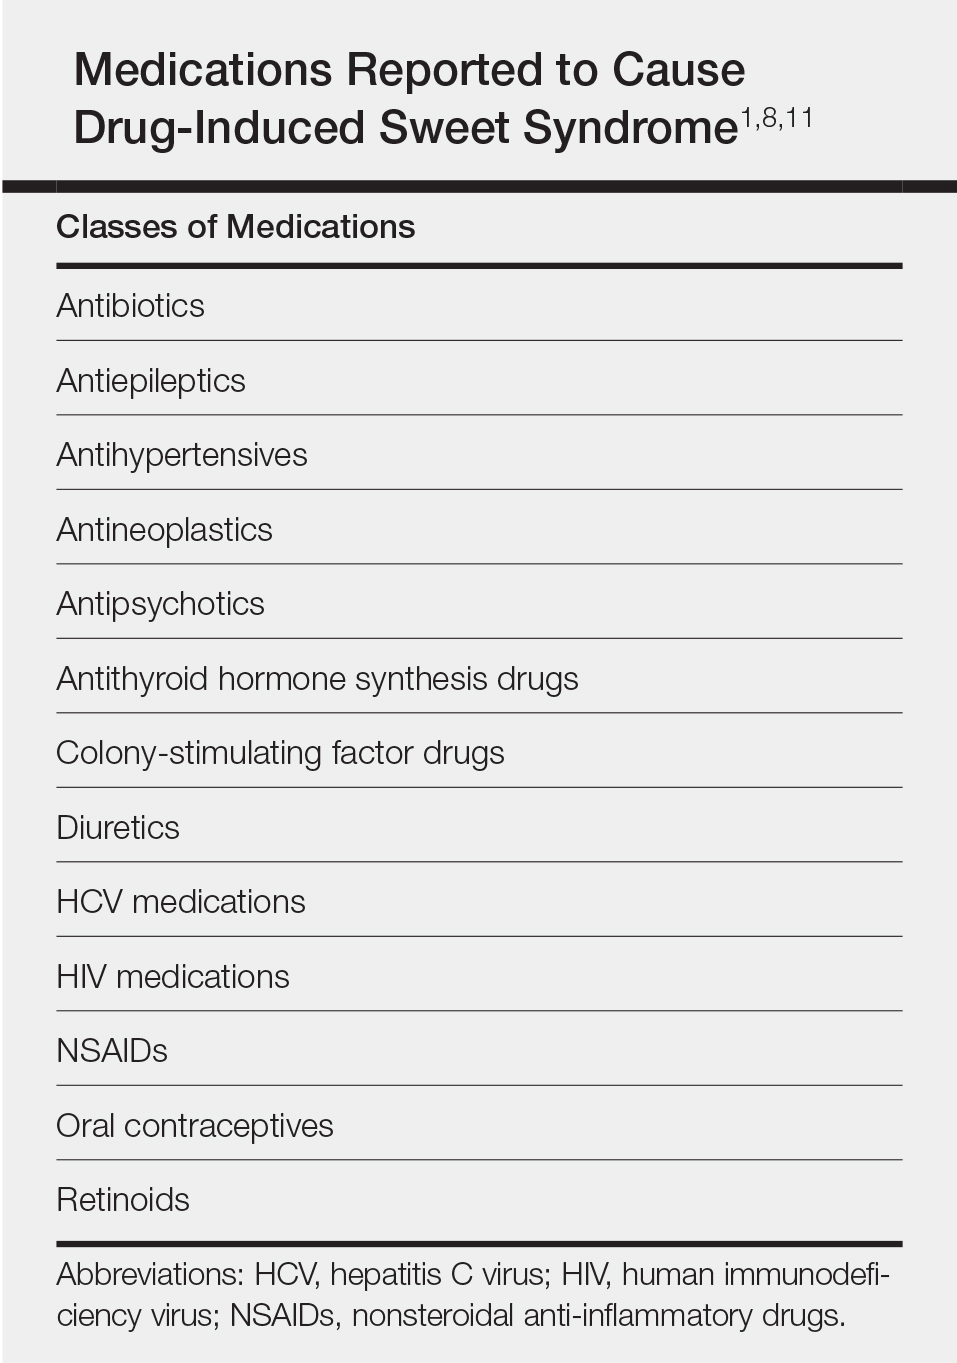
The temporal use of dapagliflozin and appearance of the hand lesions, along with the histology, favored drug-induced Sweet syndrome to dapagliflozin as the cause of the plaques. Our patient did not seek medical attention at the onset of the initial chest and neck rash but did so several weeks after the painful hand lesions that were consistent with Sweet syndrome had appeared. Discontinuation of dapagliflozin and treatment with immunosuppressive medications resulted in resolution of the skin lesions on the hands. This scenario raises the question whether or not she would have developed the inflammatory hand lesions if she had stopped the medication earlier. Because dapagliflozin is a relatively new medication and boasts the potentially beneficial side effects of reducing body weight and blood pressure in addition to glucose control, we expect additional cases may occur, especially if use of this medication notably increases. Furthermore, this reaction may be a drug-class side effect and not one specific to dapagliflozin.
- Weedon D. The vasculopathic reaction pattern. Weedon’s Skin Pathology. 3rd ed. Oxford, UK: Churchill Livingstone; 2010:218-225.
- Walling HW, Snipes CJ, Gerami P, et al. The relationship between neutrophilic dermatosis of the dorsal hands and Sweet syndrome: report of 9 cases and comparison to atypical pyoderma gangrenosum. Arch Dermatol. 2006;142:57-63.
- Dapagliflozin (Farxiga) for type 2 diabetes. Med Lett Drugs Ther. 2014;56:13-15.
- Aylsworth A, Dean Z, VanNorman C, et al. Dapagliflozin for the treatment of type 2 diabetes mellitus [published online June 20, 2014]. Ann Pharmacother. 2014;48:1202-1208.
- Sweet RD. An acute febrile neutrophilic dermatosis. Br J Dermatol. 1964;76:349-356.
- Su WP, Liu HN. Diagnostic criteria for Sweet’s syndrome. Cutis. 1986;37:167-174.
- Walker DC, Cohen PR. Trimethoprim-sulfamethoxazole-associated acute febrile neutrophilic dermatosis: case report and review of drug-induced Sweet’s syndrome. J Am Acad Dermatol. 1996;34(5 pt 2):918-923.
- Cohen PR. Sweet’s syndrome—a comprehensive review of an acute febrile neutrophilic dermatosis. Orphanet J Rare Dis. 2007;2:34.
- Cohen PR, Kurzrock R. Sweet’s syndrome. a neutrophilic dermatosis classically associated with acute onset and fever. Clin Dermatol. 2000;18:265-282.
- Fett DL, Gibson LE, Su WP. Sweet’s syndrome: systemic signs and symptoms and associated disorders. Mayo Clin Proc. 1995;70:234-240.
- Thompson DF, Montarella KE. Drug-induced Sweet’s syndrome. Ann Pharmacother. 2007;41:802-811.
- Cohen PR, Kurzrock R. Sweet’s syndrome revisited: a review of disease concepts. Int J Dermatol. 2003;42:761-778.
To the Editor:
A 75-year-old woman with a history of hypertension, gout, and adult-onset diabetes mellitus was started on dapagliflozin (5 mg) for glycemic control (hemoglobin A1c, 7.9 [reference range, 4–7]). Within 1 week of starting the medication, she developed a fine papular eruption in a photodistributed area on the neck and chest with associated malaise. The rash progressed over the next 2 weeks, evolving into edematous papules and plaques, some with vesicles involving the neck, chest, postauricular areas, and nose. Approximately 3 weeks after starting dapagliflozin, the patient also developed bilateral painful, hemorrhagic, bullous plaques (10×3 cm overall) without satellite lesions on the dorsal aspects of the hands. The borders of the bullae had rapidly expanding geographic margins and were extremely painful. The patient’s primary care physician advised to discontinue dapagliflozin, as this medication was thought to be triggering the eruption. She was administered triamcinolone (40 mg intramuscularly) and advised to take ibuprofen as needed. She had malaise and reported that she felt hot but had no known fever. No laboratory tests were ordered.
The lesions on the neck and chest began to fade within 1 week of stopping the medication and administering corticosteroids; however, the hand lesions continued to progress and began to involve the base of the digits (Figure 1). The patient was then seen by a dermatologist who biopsied the hand lesions. Histopathology was characteristic of Sweet syndrome, also known as acute febrile neutrophilic dermatosis and Gomm-Button disease. Notably, there was a dense nodular infiltrate of neutrophils, papillary dermal edema, and leukocytoclastic debris without leukocytoclastic vasculitis (Figure 2).
The following therapies in addition to gentle wound care were prescribed: betamethasone injectable suspension (9 mg intramuscularly), oral prednisone (60 mg daily for 5 days, tapering off over 2 months), clobetasol ointment 0.05% twice daily, and tacrolimus ointment 0.1% twice daily. The patient responded well to therapy, with complete resolution and healing of the skin lesions except for mild postinflammatory pigment alteration. The systemic steroids were slowly tapered over 2 months, and the patient remained free of symptoms or recurrences more than 3 years after discontinuation of the medication.
Dapagliflozin is a member of a new class of medications (gliflozins) used for the treatment of type 2 diabetes mellitus.3,4 The medication lowers blood glucose by inhibiting the sodium-glucose cotransport protein 2, thus lowering the blood glucose levels by increasing urinary excretion of glucose. Because many patients with type 2 diabetes mellitus are overweight, these medications are poised to gain popularity for weight loss and decreased blood pressure side effects. Three other medications in this class also have been approved by US Food and Drug Administration: empagliflozin, canagliflozin, and ertugliflozin.
Sweet syndrome consists of 4 cardinal features that were first described in 1964: fever, leukocytosis, tender red plaques, and a dermal neutrophilic infiltrate.5 Since then, Su and Liu6 proposed guidelines consisting of major and minor criteria. In 1996, Walker and Cohen7 suggested a set of diagnostic criteria specifically for drug-induced Sweet syndrome, including painful erythematous plaques, histopathologic neutrophilic infiltrate, and fever. Additional criteria included a temporal relationship between drug ingestion and clinical presentation as well as resolution of lesions after drug withdrawal or treatment with systemic corticosteroids.7 The lesions of drug-induced Sweet syndrome often are described as painful red papules that can form plaques, may appear vesicular, and are more common in women. These lesions classically appear on the upper extremities, as well as the head, neck, trunk, and back.8 Clinically, symptoms most commonly include fever and musculoskeletal involvement, both of which were experienced by the patient who described herself as feeling feverish when the lesions first appeared and reported malaise. Our patient experienced all of these features, and although a fever was not measured in the acute stage of presentation, she reported feeling hot. Other symptoms that may occur include arthralgia, headache, and myalgia.9 Microscopically, there is a nodular infiltrate of neutrophils, papillary dermal edema, and leukocytoclastic debris. The pathogenesis of Sweet syndrome remains unclear but can be associated with malignancy, pregnancy, autoimmune disorders, and drug reactions.10 Many different classes of medications have been reported to cause drug-induced Sweet syndrome and are listed in the Table.1,8,11 The recommended treatment of Sweet syndrome is systemic corticosteroids.12
The temporal use of dapagliflozin and appearance of the hand lesions, along with the histology, favored drug-induced Sweet syndrome to dapagliflozin as the cause of the plaques. Our patient did not seek medical attention at the onset of the initial chest and neck rash but did so several weeks after the painful hand lesions that were consistent with Sweet syndrome had appeared. Discontinuation of dapagliflozin and treatment with immunosuppressive medications resulted in resolution of the skin lesions on the hands. This scenario raises the question whether or not she would have developed the inflammatory hand lesions if she had stopped the medication earlier. Because dapagliflozin is a relatively new medication and boasts the potentially beneficial side effects of reducing body weight and blood pressure in addition to glucose control, we expect additional cases may occur, especially if use of this medication notably increases. Furthermore, this reaction may be a drug-class side effect and not one specific to dapagliflozin.
- Weedon D. The vasculopathic reaction pattern. Weedon’s Skin Pathology. 3rd ed. Oxford, UK: Churchill Livingstone; 2010:218-225.
- Walling HW, Snipes CJ, Gerami P, et al. The relationship between neutrophilic dermatosis of the dorsal hands and Sweet syndrome: report of 9 cases and comparison to atypical pyoderma gangrenosum. Arch Dermatol. 2006;142:57-63.
- Dapagliflozin (Farxiga) for type 2 diabetes. Med Lett Drugs Ther. 2014;56:13-15.
- Aylsworth A, Dean Z, VanNorman C, et al. Dapagliflozin for the treatment of type 2 diabetes mellitus [published online June 20, 2014]. Ann Pharmacother. 2014;48:1202-1208.
- Sweet RD. An acute febrile neutrophilic dermatosis. Br J Dermatol. 1964;76:349-356.
- Su WP, Liu HN. Diagnostic criteria for Sweet’s syndrome. Cutis. 1986;37:167-174.
- Walker DC, Cohen PR. Trimethoprim-sulfamethoxazole-associated acute febrile neutrophilic dermatosis: case report and review of drug-induced Sweet’s syndrome. J Am Acad Dermatol. 1996;34(5 pt 2):918-923.
- Cohen PR. Sweet’s syndrome—a comprehensive review of an acute febrile neutrophilic dermatosis. Orphanet J Rare Dis. 2007;2:34.
- Cohen PR, Kurzrock R. Sweet’s syndrome. a neutrophilic dermatosis classically associated with acute onset and fever. Clin Dermatol. 2000;18:265-282.
- Fett DL, Gibson LE, Su WP. Sweet’s syndrome: systemic signs and symptoms and associated disorders. Mayo Clin Proc. 1995;70:234-240.
- Thompson DF, Montarella KE. Drug-induced Sweet’s syndrome. Ann Pharmacother. 2007;41:802-811.
- Cohen PR, Kurzrock R. Sweet’s syndrome revisited: a review of disease concepts. Int J Dermatol. 2003;42:761-778.
Practice Points
- Sweet syndrome consists of 4 cardinal features: fever, leukocytosis, tender red plaques, and a dermal neutrophilic infiltrate.
- In drug-induced Sweet syndrome, there is a temporal relationship between drug ingestion and clinical presentation as well as resolution of lesions after drug withdrawal or treatment with systemic corticosteroids.
- Microscopic findings of Sweet syndrome include a nodular infiltrate of neutrophils, papillary dermal edema, and leukocytoclastic debris.
- Dapagliflozin is a member of a new class of medications (gliflozins) used for treatment of type 2 diabetes mellitus, which may cause drug-induced Sweet syndrome.