User login
Nominate Someone for the Excellence in Community Service Award
The Society for Vascular Surgery (SVS) Excellence in Community Service Award is an honor the SVS bestows on a member who has exhibited outstanding leadership within their community as a practicing vascular surgeon. Selection for this honor recognizes an individual’s sustained contributions to patients and their community, as well as exemplary professional practice and leadership.
Nominations are due February 1. More information is available here.
Multiple Facial Papules
The Diagnosis: Birt-Hogg-Dubé Syndrome
Histopathologic examination revealed a collection of bland spindle cells with perifollicular fibrosis consistent with a fibrofolliculoma, confirming the diagnosis of Birt-Hogg-Dubé syndrome (Figure). Cosmetic treatment with ablative therapy was offered, but the patient declined.
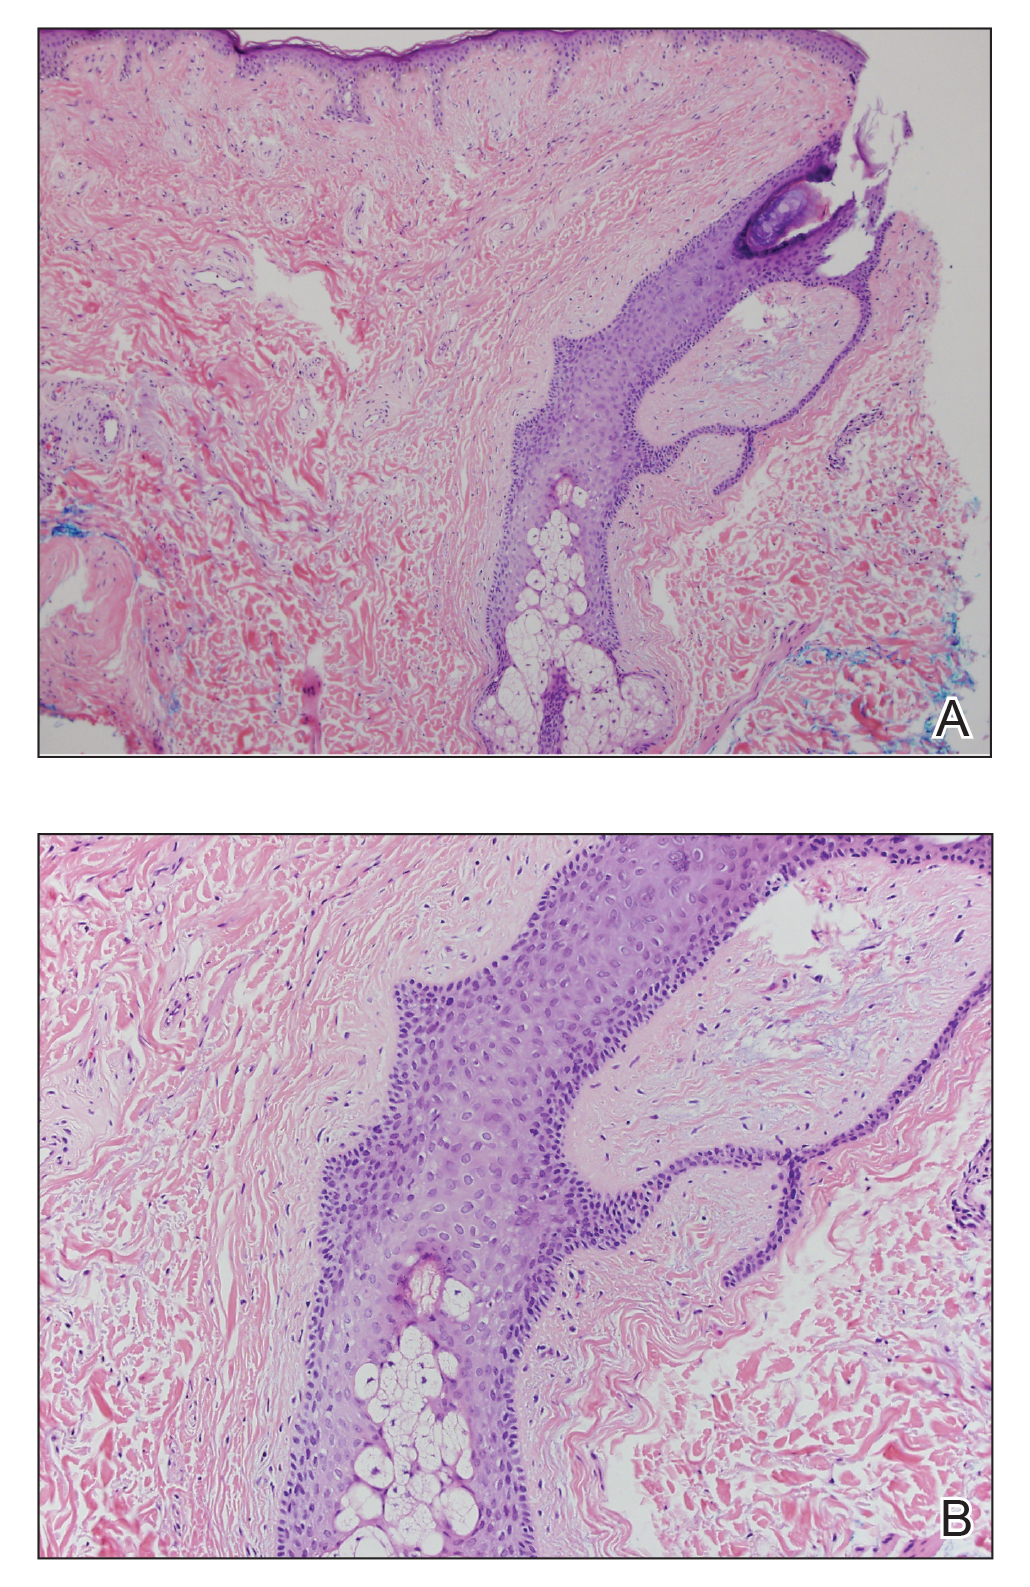
Birt-Hogg-Dubé syndrome is an autosomal-dominant genodermatosis caused by a loss-of-function mutation in the folliculin gene, FLCN, on chromosome arm 17p11.2.1 Cutaneous findings include benign follicular hamartomas, such as fibrofolliculomas and trichodiscomas. Angiofibromas, perifollicular fibromas, oral papillomas, and acrochordons also can be present.1 Cutaneous lesions usually appear on the head and neck in the third decade of life.
Patients with Birt-Hogg-Dubé syndrome are at an increased risk for pneumothorax and renal cancer, specifically hybrid oncocytic-chromophobe renal cell carcinomas.2 In a study of 89 patients with a FLCN mutation, 90% (80/89) of patients had cutaneous lesions, 84% (34/89) had pulmonary cysts, and 34% (30/89) had kidney tumors. Affected individuals were at a higher risk for pneumothorax and kidney tumors if there was a family history of these tumors.2
Proposed diagnostic criteria include any 1 of the following: 2 or more skin lesions clinically consistent with fibrofolliculomas and 1 histologically confirmed fibrofolliculoma; multiple bilateral pulmonary cysts in the basilar lung with or without pneumothorax before 40 years of age; bilateral multifocal chromophobe renal carcinomas or hybrid oncocytic tumors; combination of cutaneous, pulmonary, or renal manifestation in the patient and family; or a FLCN mutation.3
Current recommendations for the workup of a patient with Birt-Hogg-Dubé syndrome include referral to genetic counseling for the patient and family, a baseline computed tomography of the chest to evaluate for pulmonary cysts, and gadolinium-enhanced abdominal magnetic resonance imaging starting at 20 years of age and repeated every 3 to 4 years to screen for renal tumors.1 Pulmonary function tests can be considered if the patient is symptomatic or has a high cyst burden. Patients should be advised against smoking and scuba diving.
The differential diagnosis of multiple facial papules includes Cowden syndrome, tuberous sclerosis, Brooke-Spiegler syndrome, and Muir-Torre syndrome. Cowden syndrome is caused by a mutation in the protein tyrosine phosphatase gene, PTEN.4 The characteristic cutaneous findings on the face are trichilemmomas, which appear as flesh-colored papules that may have a verrucous surface.
Tuberous sclerosis is caused by mutations in hamartin (TSC1) or tuberin (TSC2). Angiofibromas are most commonly found on the face and appear as flesh-colored to red-brown papules. Fibrous plaques, periungual fibromas, gingival fibromas, hypopigmented macules, and connective tissue nevi also are found in tuberous sclerosis.5
Brooke-Spiegler syndrome is caused by a mutation in the CYLD lysine 63 deubiquitinase gene, CYLD. Trichoepitheliomas, cylindromas, and spiradenomas are caused by the CYLD mutation and appear on the head and neck. Trichoepitheliomas are flesh-colored to pink papules found on the face, often concentrated in the nasolabial folds.6 Cylindromas and spiradenomas are flesh-colored to pink papules or nodules most commonly found on the scalp.6
Muir-Torre syndrome is caused by a mutation in DNA mismatch repair genes MSH2 and/or MLH1.7 Sebaceous neoplasms, including sebaceous adenomas, sebaceomas, and less frequently sebaceous carcinomas, are characteristic cutaneous findings and appear as pink to yellow papules commonly found on the head and neck.
Careful history taking, physical examination, and histopathologic analysis are important in recognizing the features of Birt-Hogg-Dubé syndrome. Accurate and timely diagnosis is essential for the appropriate care of patients and their families, given the syndrome's systemic implications.
- Gupta N, Sunwoo BY, Kotloff RM. Birt-Hogg-Dubé syndrome. Clin Chest Med. 2016;37:475-486.
- Toro JR, Wei MH, Glenn GM, et al. BHD mutations, clinical and molecular genetic investigations of Birt-Hogg-Dubé syndrome: a new series of 50 families and a review of published reports. J Med Genet. 2008;45:321-331.
- Schmidt LS, Linehan WM. Molecular genetics and clinical features of Birt-Hogg-Dubé syndrome. Nat Rev Urol. 2015;12:558-569.
- Marsh D, Kum JB, Lunetta KL, et al. PTEN mutation spectrum and genotype-phenotype correlations in Bannayan-Riley-Ruvalcaba syndrome suggest a single entity with Cowden syndrome. Hum Mol Genet. 1999;8:1461-1472.
- Wataya-Kaneda M, Uemura M, Fujita K, et al. Tuberous sclerosis complex: recent advances in manifestations and therapy. Int J Urol. 2017;24:681-691.
- Kazakov DV. Brooke-Spiegler syndrome and phenotypic variants: an update. Head Neck Pathol. 2016;10:125-130.
- Mahalingam M. MSH6, Past and present and Muir-Torre syndrome--connecting the dots. Am J Dermatopathol. 2017;39:239-249.
The Diagnosis: Birt-Hogg-Dubé Syndrome
Histopathologic examination revealed a collection of bland spindle cells with perifollicular fibrosis consistent with a fibrofolliculoma, confirming the diagnosis of Birt-Hogg-Dubé syndrome (Figure). Cosmetic treatment with ablative therapy was offered, but the patient declined.
Birt-Hogg-Dubé syndrome is an autosomal-dominant genodermatosis caused by a loss-of-function mutation in the folliculin gene, FLCN, on chromosome arm 17p11.2.1 Cutaneous findings include benign follicular hamartomas, such as fibrofolliculomas and trichodiscomas. Angiofibromas, perifollicular fibromas, oral papillomas, and acrochordons also can be present.1 Cutaneous lesions usually appear on the head and neck in the third decade of life.
Patients with Birt-Hogg-Dubé syndrome are at an increased risk for pneumothorax and renal cancer, specifically hybrid oncocytic-chromophobe renal cell carcinomas.2 In a study of 89 patients with a FLCN mutation, 90% (80/89) of patients had cutaneous lesions, 84% (34/89) had pulmonary cysts, and 34% (30/89) had kidney tumors. Affected individuals were at a higher risk for pneumothorax and kidney tumors if there was a family history of these tumors.2
Proposed diagnostic criteria include any 1 of the following: 2 or more skin lesions clinically consistent with fibrofolliculomas and 1 histologically confirmed fibrofolliculoma; multiple bilateral pulmonary cysts in the basilar lung with or without pneumothorax before 40 years of age; bilateral multifocal chromophobe renal carcinomas or hybrid oncocytic tumors; combination of cutaneous, pulmonary, or renal manifestation in the patient and family; or a FLCN mutation.3
Current recommendations for the workup of a patient with Birt-Hogg-Dubé syndrome include referral to genetic counseling for the patient and family, a baseline computed tomography of the chest to evaluate for pulmonary cysts, and gadolinium-enhanced abdominal magnetic resonance imaging starting at 20 years of age and repeated every 3 to 4 years to screen for renal tumors.1 Pulmonary function tests can be considered if the patient is symptomatic or has a high cyst burden. Patients should be advised against smoking and scuba diving.
The differential diagnosis of multiple facial papules includes Cowden syndrome, tuberous sclerosis, Brooke-Spiegler syndrome, and Muir-Torre syndrome. Cowden syndrome is caused by a mutation in the protein tyrosine phosphatase gene, PTEN.4 The characteristic cutaneous findings on the face are trichilemmomas, which appear as flesh-colored papules that may have a verrucous surface.
Tuberous sclerosis is caused by mutations in hamartin (TSC1) or tuberin (TSC2). Angiofibromas are most commonly found on the face and appear as flesh-colored to red-brown papules. Fibrous plaques, periungual fibromas, gingival fibromas, hypopigmented macules, and connective tissue nevi also are found in tuberous sclerosis.5
Brooke-Spiegler syndrome is caused by a mutation in the CYLD lysine 63 deubiquitinase gene, CYLD. Trichoepitheliomas, cylindromas, and spiradenomas are caused by the CYLD mutation and appear on the head and neck. Trichoepitheliomas are flesh-colored to pink papules found on the face, often concentrated in the nasolabial folds.6 Cylindromas and spiradenomas are flesh-colored to pink papules or nodules most commonly found on the scalp.6
Muir-Torre syndrome is caused by a mutation in DNA mismatch repair genes MSH2 and/or MLH1.7 Sebaceous neoplasms, including sebaceous adenomas, sebaceomas, and less frequently sebaceous carcinomas, are characteristic cutaneous findings and appear as pink to yellow papules commonly found on the head and neck.
Careful history taking, physical examination, and histopathologic analysis are important in recognizing the features of Birt-Hogg-Dubé syndrome. Accurate and timely diagnosis is essential for the appropriate care of patients and their families, given the syndrome's systemic implications.
- Gupta N, Sunwoo BY, Kotloff RM. Birt-Hogg-Dubé syndrome. Clin Chest Med. 2016;37:475-486.
- Toro JR, Wei MH, Glenn GM, et al. BHD mutations, clinical and molecular genetic investigations of Birt-Hogg-Dubé syndrome: a new series of 50 families and a review of published reports. J Med Genet. 2008;45:321-331.
- Schmidt LS, Linehan WM. Molecular genetics and clinical features of Birt-Hogg-Dubé syndrome. Nat Rev Urol. 2015;12:558-569.
- Marsh D, Kum JB, Lunetta KL, et al. PTEN mutation spectrum and genotype-phenotype correlations in Bannayan-Riley-Ruvalcaba syndrome suggest a single entity with Cowden syndrome. Hum Mol Genet. 1999;8:1461-1472.
- Wataya-Kaneda M, Uemura M, Fujita K, et al. Tuberous sclerosis complex: recent advances in manifestations and therapy. Int J Urol. 2017;24:681-691.
- Kazakov DV. Brooke-Spiegler syndrome and phenotypic variants: an update. Head Neck Pathol. 2016;10:125-130.
- Mahalingam M. MSH6, Past and present and Muir-Torre syndrome--connecting the dots. Am J Dermatopathol. 2017;39:239-249.

A 50-year-old man presented with facial papules on the cheeks that had appeared approximately 1.5 years prior and gradually spread over the face and neck. They were occasionally pruritic but otherwise were asymptomatic. His mother and brother reportedly had similar clinical findings. Family history was notable for a maternal uncle who had died in his 30s of an unknown type of renal cancer. Physical examination revealed innumerable white-gray papules that measured 1 to 5 mm and were scattered across the face and neck. Punch biopsies were obtained. Computed tomography of the chest showed multiple bibasilar pulmonary cysts. Magnetic resonance imaging was negative for renal tumors.

Tanezumab posts higher safety event rate than NSAIDs over 1 year in hip, knee OA
ATLANTA – as part of a recent randomized, double-blind, active-controlled, phase 3 study.

Although patients who switched from NSAIDs to 5 mg subcutaneous tanezumab every 8 weeks reported significantly improved Western Ontario and McMaster Universities (WOMAC) index pain and function scores at 16 weeks, the difference was no longer statistically significant at 56 weeks; there was an increase in the number of joint safety events in both low- and high-dose tanezumab groups when compared with patients who continued on NSAIDs, Marc C. Hochberg, MD, of the University of Maryland, Baltimore, said in his presentation at the annual meeting of the American College of Rheumatology.
“Despite prior stable doses of NSAIDs, tanezumab subcutaneously administered every 8 weeks was associated with significantly more joint safety events than NSAIDs in a dose-dependent fashion,” he said.
Dr. Hochberg and colleagues conducted a phase 3 study of tanezumab in response to a Food and Drug Administration hold on the drug in 2010 in response to reports of osteonecrosis in patients taking tanezumab. “An adjudication committee was set up at that time to review all the records of individuals who participated in those studies who had been reported to have adverse joint related events, including osteonecrosis, as well as all the elected total joint replacements,” Dr. Hochberg explained. Only 4-month safety and efficacy data for tanezumab had been reported prior to these new data with at least 1 year of follow-up.
The study comprised 2,996 patients with hip or knee osteoarthritis (OA) from 446 centers in 18 countries, where patients were randomized to receive 2.5 mg of subcutaneous tanezumab (1,002 patients), tanezumab at 5 mg (998 patients) or NSAIDs (996 patients) for up to 80 weeks. Approximately two-thirds of the patients were women, and about 70% were white. About 85% of all patients had knee OA. The most common NSAIDs were celecoxib, diclofenac, and naproxen.
Less than 1% had Kellgren-Lawrence grade 0-1 at baseline, while about 30% had grade 2, 47% grade 3, and 22% grade 4. Patients had a mean 7.0 or 7.1 score on the WOMAC pain and function subscales, and a mean Patient’s Global Assessment of OA (PGA-OA) score of 7.4 or 7.5. Baseline radiographs were taken, as well as at safety follow-ups at 24 weeks, 56 weeks, and 80 weeks.
The researchers examined rapidly progressive OA (RPOA) type 1, classified as loss of 2 mm or more of joint space width within 1 year, and type 2, which was defined as abnormal bone loss or destruction, including limited or total collapse of at least one subchondral surface. Other primary joint safety endpoints examined were primary osteonecrosis, subchondral insufficiency fracture, and pathologic fracture. Each of these was reported individually in addition to the rate of total joint replacement. If an event was discovered, it was sent to an adjudication committee, Dr. Hochberg said. “You have either investigator-reported joint safety events, possible joint safety events or identified from the central raters’ assessment of imaging, or the reported total joint replacement reviewed blindly by the adjudication committee, blinded to treatment allocation, and then the adjudication results are those that are used for the analysis,” he said.
Overall, 447 patients who received tanezumab at 2.5 mg, 419 patients who received tanezumab at 5 mg, and 446 patients who continued receive NSAIDs completed treatment. There were 71 joint safety events in the tanezumab 5-mg group (7.1%) per 1,000 person-years, compared with 39 events per 1,000 person-years in the 2.5-mg group (3.9%), and 15 events per 1,000 person-years in the NSAIDs group (1.5%). The rate of joint safety events was significantly higher in both tanezumab groups, compared with the NSAIDs group (both P less than or equal to .001). Among patients with RPOA type 1, 4.9% of patients in the 5-mg group and 2.9% of patients in the 2.5-mg tanezumab group experienced joint safety events, compared with 1.1% of patients in the NSAIDs group. While RPOA type 2, primary osteonecrosis, and subchondral insufficiency fractures were uncommon in the study, Dr. Hochberg noted there was a statistically significant difference in joint safety events between the 5-mg tanezumab group and the NSAID group for patients with RPOA type 2 (1.4% vs. 0.1%; P less than or equal to .001).
The relationship between total joint replacement and tanezumab was dose-dependent: In the 5-mg group, 8.0% of patients underwent total joint replacement, while 5.3% of patients underwent total joint replacement in the 2.5-mg group, compared with 2.6% of patients in the NSAID group. “Most of the total joint replacements were due to normal progression of osteoarthritis,” Dr. Hochberg said.
When asked if he believed there is a role for tanezumab in the management of patients with OA, Dr. Hochberg said moderate to severe symptomatic hip or knee OA, including polyarticular OA, are potential areas where tanezumab and other nerve growth factor inhibitors could be beneficial.
“There is a tremendous unmet need in this population, and these are patients who have either had an inadequate response to, are intolerant of, or have contraindications to nonsteroidal anti-inflammatory drugs, have not responded well to intra-articular therapy, or have multiple joint involvement,” he said. There is also a role for tanezumab in OA patients who don’t want to take weaker opioid analgesics such as tramadol, he added.
This study was funded by Pfizer and Lilly, and the companies sponsored the summarization of the study. The authors reported various ties with these and other companies.
SOURCE: Hochberg MC et al. Arthritis Rheumatol. 2019;71(suppl 10), Abstract 1302 and Abstract 2756.
ATLANTA – as part of a recent randomized, double-blind, active-controlled, phase 3 study.
Although patients who switched from NSAIDs to 5 mg subcutaneous tanezumab every 8 weeks reported significantly improved Western Ontario and McMaster Universities (WOMAC) index pain and function scores at 16 weeks, the difference was no longer statistically significant at 56 weeks; there was an increase in the number of joint safety events in both low- and high-dose tanezumab groups when compared with patients who continued on NSAIDs, Marc C. Hochberg, MD, of the University of Maryland, Baltimore, said in his presentation at the annual meeting of the American College of Rheumatology.
“Despite prior stable doses of NSAIDs, tanezumab subcutaneously administered every 8 weeks was associated with significantly more joint safety events than NSAIDs in a dose-dependent fashion,” he said.
Dr. Hochberg and colleagues conducted a phase 3 study of tanezumab in response to a Food and Drug Administration hold on the drug in 2010 in response to reports of osteonecrosis in patients taking tanezumab. “An adjudication committee was set up at that time to review all the records of individuals who participated in those studies who had been reported to have adverse joint related events, including osteonecrosis, as well as all the elected total joint replacements,” Dr. Hochberg explained. Only 4-month safety and efficacy data for tanezumab had been reported prior to these new data with at least 1 year of follow-up.
The study comprised 2,996 patients with hip or knee osteoarthritis (OA) from 446 centers in 18 countries, where patients were randomized to receive 2.5 mg of subcutaneous tanezumab (1,002 patients), tanezumab at 5 mg (998 patients) or NSAIDs (996 patients) for up to 80 weeks. Approximately two-thirds of the patients were women, and about 70% were white. About 85% of all patients had knee OA. The most common NSAIDs were celecoxib, diclofenac, and naproxen.
Less than 1% had Kellgren-Lawrence grade 0-1 at baseline, while about 30% had grade 2, 47% grade 3, and 22% grade 4. Patients had a mean 7.0 or 7.1 score on the WOMAC pain and function subscales, and a mean Patient’s Global Assessment of OA (PGA-OA) score of 7.4 or 7.5. Baseline radiographs were taken, as well as at safety follow-ups at 24 weeks, 56 weeks, and 80 weeks.
The researchers examined rapidly progressive OA (RPOA) type 1, classified as loss of 2 mm or more of joint space width within 1 year, and type 2, which was defined as abnormal bone loss or destruction, including limited or total collapse of at least one subchondral surface. Other primary joint safety endpoints examined were primary osteonecrosis, subchondral insufficiency fracture, and pathologic fracture. Each of these was reported individually in addition to the rate of total joint replacement. If an event was discovered, it was sent to an adjudication committee, Dr. Hochberg said. “You have either investigator-reported joint safety events, possible joint safety events or identified from the central raters’ assessment of imaging, or the reported total joint replacement reviewed blindly by the adjudication committee, blinded to treatment allocation, and then the adjudication results are those that are used for the analysis,” he said.
Overall, 447 patients who received tanezumab at 2.5 mg, 419 patients who received tanezumab at 5 mg, and 446 patients who continued receive NSAIDs completed treatment. There were 71 joint safety events in the tanezumab 5-mg group (7.1%) per 1,000 person-years, compared with 39 events per 1,000 person-years in the 2.5-mg group (3.9%), and 15 events per 1,000 person-years in the NSAIDs group (1.5%). The rate of joint safety events was significantly higher in both tanezumab groups, compared with the NSAIDs group (both P less than or equal to .001). Among patients with RPOA type 1, 4.9% of patients in the 5-mg group and 2.9% of patients in the 2.5-mg tanezumab group experienced joint safety events, compared with 1.1% of patients in the NSAIDs group. While RPOA type 2, primary osteonecrosis, and subchondral insufficiency fractures were uncommon in the study, Dr. Hochberg noted there was a statistically significant difference in joint safety events between the 5-mg tanezumab group and the NSAID group for patients with RPOA type 2 (1.4% vs. 0.1%; P less than or equal to .001).
The relationship between total joint replacement and tanezumab was dose-dependent: In the 5-mg group, 8.0% of patients underwent total joint replacement, while 5.3% of patients underwent total joint replacement in the 2.5-mg group, compared with 2.6% of patients in the NSAID group. “Most of the total joint replacements were due to normal progression of osteoarthritis,” Dr. Hochberg said.
When asked if he believed there is a role for tanezumab in the management of patients with OA, Dr. Hochberg said moderate to severe symptomatic hip or knee OA, including polyarticular OA, are potential areas where tanezumab and other nerve growth factor inhibitors could be beneficial.
“There is a tremendous unmet need in this population, and these are patients who have either had an inadequate response to, are intolerant of, or have contraindications to nonsteroidal anti-inflammatory drugs, have not responded well to intra-articular therapy, or have multiple joint involvement,” he said. There is also a role for tanezumab in OA patients who don’t want to take weaker opioid analgesics such as tramadol, he added.
This study was funded by Pfizer and Lilly, and the companies sponsored the summarization of the study. The authors reported various ties with these and other companies.
SOURCE: Hochberg MC et al. Arthritis Rheumatol. 2019;71(suppl 10), Abstract 1302 and Abstract 2756.
REPORTING FROM ACR 2019
OA management guidelines forgo treatment hierarchy or order but emphasize severity, patient risk factors
ATLANTA – New guidelines for management of osteoarthritis of the hand, knee, and hip from the American College of Rheumatology and the Arthritis Foundation lay out a wide range of treatment options without an algorithm or hierarchy, making strong recommendations for nondrug interventions and for tailoring plans to individual patient-level factors.

Since the ACR last released OA management guidelines in 2012, a number of recommendations have been added, changed, and removed, and the structure of the guidelines has also changed. For instance, the new OA guidelines include a broad list of management options, Sharon L. Kolasinski, MD, chair of the ACR guidelines panel and professor of clinical medicine in the division of rheumatology at the University of Pennsylvania, Philadelphia, said in a presentation at the annual meeting of the American College of Rheumatology.
“The new guideline emphasizes comprehensive management of patients with OA, rather than a stepwise algorithm in a linear manner,” she said.
There is also no hierarchy to the recommendations, apart from the strength of the recommendation. “For any individual patient, a single option may be chosen at a particular time point, perhaps with or without other options, and may be reused in the future. For a given intervention, there might be a period of time over which it’s useful, and then the option might be changed,” Dr. Kolasinski noted.
Dr. Kolasinski advised making treatment decisions based on a patient’s disease severity, whether the patient uses medical devices, and in consideration of patient risk factors. “A history of injuries, surgical history, access to care, personal beliefs and preferences should all be brought to bear on decision making for osteoarthritis management,” she said.
The guidelines also advise considering a patient’s overall well-being and factors related to a patient’s perception of pain and function, such as mood disorders, altered sleep, chronic pain, impaired coping measures, and stress level. “Comprehensive management requires a broad assessment of how pain and function are affecting the patient with OA as a whole and recognizing that multiple options are available. They might be used in combination or change over time,” Dr. Kolasinski said.
The new guidelines place a strong emphasis on educational, behavioral, psychosocial, mind-body, and physical approaches. There are strong recommendations for the use of exercise, including aerobic, strengthening, neuromuscular, and aquatic exercise. Weight loss also carries a strong recommendation for patients with hip and knee OA, with a focus on group-based exercise, education, fitness and exercise goals, and a multidisciplinary approach using self-efficacy and self-management programs. The panels made a strong recommendation for tai chi to improve hip and knee OA. There are also strong recommendations for orthoses; aids and assistive devices such as canes, first carpometacarpal (CMC) orthoses, and tibiofemoral knee braces. Other interventions, such as Kinesio tape for first CMC joint and knee OA, hand orthoses, and patellofemoral knee braces, carried a conditional recommendation. Other conditional recommendations made by the panel were for acupuncture, thermal interventions, and radiofrequency ablation for patients with knee OA. Balance training for hip and knee OA, yoga for knee OA, and cognitive-behavioral therapy all were conditionally recommended by the panel.
The panel strongly recommended against the use of transcutaneous nerve stimulation for hip and knee OA, Dr. Kolasinski noted. The panel also conditionally recommended against use of modified shoes and pulsed vibration therapy in knee OA; lateral or medial wedged insoles, massage, and manual therapy with exercise in hip or knee OA; and iontophoresis in first CMC OA.

Tuhina Neogi, MD, PhD, chief of rheumatology at Boston University and member of the core team that developed the guidelines, said in her presentation the panel chose not to use the term “nonpharmacologic” in the guidelines because it may give patients a false impression that they are not receiving a treatment. “We really need to change our language and change the way in which we approach these conversations with our patients so that they don’t feel that they are not getting a treatment when we’re giving these recommendations,” she said.
Recommendations for, against pharmacologic approaches
The ACR has changed conditional recommendations for topical NSAIDs for knee and hand OA, oral NSAIDs, and intra-articular steroids for knee and hip OA into strong recommendations for the 2019 guidelines, Dr. Kolasinski said. While the 2012 guidelines conditionally recommended against topical capsaicin for knee OA, the new guidelines conditionally recommend it.
Other pharmacologic conditional recommendations included topical NSAIDs, chondroitin sulfate, and intra-articular corticosteroid injections for hand OA, acetaminophen, and duloxetine for knee OA.
With the new recommendations come changes that some rheumatologists and health care providers may find controversial. “I think that the practicing rheumatologist may be surprised that we have a recommendation against the use of hyaluronic acid in the knee as a conditional recommendation,” Dr. Kolasinski said. “The assessment of the literature at this point really reveals that there is equivalence between intra-articular hyaluronic acid injection and intra-articular saline injection, and so it was the feeling of the panel that, really, this was worth changing the recommendation from the 2012 guideline.”
The panel made strong recommendations against use of the following pharmacologic interventions:
- Bisphosphonates.
- Glucosamine sulfate.
- Combination glucosamine sulfate-chondroitin sulfate products.
- Hydroxychloroquine.
- Methotrexate.
- Intra-articular hyaluronic acid injections in hip OA.
- Chondroitin sulfate, platelet-rich plasma injections, and stem cell injections in hip and knee OA.
- Tumor necrosis factor (TNF) inhibitors.
- Interleukin-1–receptor antagonists.
Additionally, the panel made a conditional recommendation against topical capsaicin on the hand, colchicine, fish oil, vitamin D, intra-articular hyaluronic acid injections in the first CMC, and intra-articular botulinum toxin and prolotherapy in hip and knee OA.
The panel did not recommend for or against use of yoga for hip and hand OA, topical lidocaine, pregabalin, gabapentin, selective serotonin reuptake inhibitors, serotonin norepinephrine reuptake inhibitors apart from duloxetine, tricyclic antidepressants, and anti-nerve growth factor agents.
While the panel conditionally recommended against use of opioids, they made a conditional recommendation for use of tramadol opioids, and there was “a heated discussion about that distinction,” Dr. Neogi noted in a discussion session at the meeting. “There was a recent observational study that indicated that tramadol may have an increased risk of [all-cause] mortality, but there are lots of issues of confounding by indication in that study.”
The patient panel also raised strong concerns about the ACR and the Arthritis Foundation coming out against opioids for OA management in their guidelines. “They don’t want to damn opioids, but they’re also concerned about a specialty society coming out strongly against opioids in the concern that their physicians may limit their access to opioids if they’re in a situation where nothing else is helping them,” Dr. Neogi said.
Dr. Kolasinski noted the guidelines will be published online in Arthritis & Rheumatology in December, and will appear in print in February of next year.
Dr. Kolasinski reported no relevant financial disclosures. Dr. Neogi reported relationships with EMD Serono, Merck, and Pfizer.
ATLANTA – New guidelines for management of osteoarthritis of the hand, knee, and hip from the American College of Rheumatology and the Arthritis Foundation lay out a wide range of treatment options without an algorithm or hierarchy, making strong recommendations for nondrug interventions and for tailoring plans to individual patient-level factors.
Since the ACR last released OA management guidelines in 2012, a number of recommendations have been added, changed, and removed, and the structure of the guidelines has also changed. For instance, the new OA guidelines include a broad list of management options, Sharon L. Kolasinski, MD, chair of the ACR guidelines panel and professor of clinical medicine in the division of rheumatology at the University of Pennsylvania, Philadelphia, said in a presentation at the annual meeting of the American College of Rheumatology.
“The new guideline emphasizes comprehensive management of patients with OA, rather than a stepwise algorithm in a linear manner,” she said.
There is also no hierarchy to the recommendations, apart from the strength of the recommendation. “For any individual patient, a single option may be chosen at a particular time point, perhaps with or without other options, and may be reused in the future. For a given intervention, there might be a period of time over which it’s useful, and then the option might be changed,” Dr. Kolasinski noted.
Dr. Kolasinski advised making treatment decisions based on a patient’s disease severity, whether the patient uses medical devices, and in consideration of patient risk factors. “A history of injuries, surgical history, access to care, personal beliefs and preferences should all be brought to bear on decision making for osteoarthritis management,” she said.
The guidelines also advise considering a patient’s overall well-being and factors related to a patient’s perception of pain and function, such as mood disorders, altered sleep, chronic pain, impaired coping measures, and stress level. “Comprehensive management requires a broad assessment of how pain and function are affecting the patient with OA as a whole and recognizing that multiple options are available. They might be used in combination or change over time,” Dr. Kolasinski said.
The new guidelines place a strong emphasis on educational, behavioral, psychosocial, mind-body, and physical approaches. There are strong recommendations for the use of exercise, including aerobic, strengthening, neuromuscular, and aquatic exercise. Weight loss also carries a strong recommendation for patients with hip and knee OA, with a focus on group-based exercise, education, fitness and exercise goals, and a multidisciplinary approach using self-efficacy and self-management programs. The panels made a strong recommendation for tai chi to improve hip and knee OA. There are also strong recommendations for orthoses; aids and assistive devices such as canes, first carpometacarpal (CMC) orthoses, and tibiofemoral knee braces. Other interventions, such as Kinesio tape for first CMC joint and knee OA, hand orthoses, and patellofemoral knee braces, carried a conditional recommendation. Other conditional recommendations made by the panel were for acupuncture, thermal interventions, and radiofrequency ablation for patients with knee OA. Balance training for hip and knee OA, yoga for knee OA, and cognitive-behavioral therapy all were conditionally recommended by the panel.
The panel strongly recommended against the use of transcutaneous nerve stimulation for hip and knee OA, Dr. Kolasinski noted. The panel also conditionally recommended against use of modified shoes and pulsed vibration therapy in knee OA; lateral or medial wedged insoles, massage, and manual therapy with exercise in hip or knee OA; and iontophoresis in first CMC OA.
Tuhina Neogi, MD, PhD, chief of rheumatology at Boston University and member of the core team that developed the guidelines, said in her presentation the panel chose not to use the term “nonpharmacologic” in the guidelines because it may give patients a false impression that they are not receiving a treatment. “We really need to change our language and change the way in which we approach these conversations with our patients so that they don’t feel that they are not getting a treatment when we’re giving these recommendations,” she said.
Recommendations for, against pharmacologic approaches
The ACR has changed conditional recommendations for topical NSAIDs for knee and hand OA, oral NSAIDs, and intra-articular steroids for knee and hip OA into strong recommendations for the 2019 guidelines, Dr. Kolasinski said. While the 2012 guidelines conditionally recommended against topical capsaicin for knee OA, the new guidelines conditionally recommend it.
Other pharmacologic conditional recommendations included topical NSAIDs, chondroitin sulfate, and intra-articular corticosteroid injections for hand OA, acetaminophen, and duloxetine for knee OA.
With the new recommendations come changes that some rheumatologists and health care providers may find controversial. “I think that the practicing rheumatologist may be surprised that we have a recommendation against the use of hyaluronic acid in the knee as a conditional recommendation,” Dr. Kolasinski said. “The assessment of the literature at this point really reveals that there is equivalence between intra-articular hyaluronic acid injection and intra-articular saline injection, and so it was the feeling of the panel that, really, this was worth changing the recommendation from the 2012 guideline.”
The panel made strong recommendations against use of the following pharmacologic interventions:
- Bisphosphonates.
- Glucosamine sulfate.
- Combination glucosamine sulfate-chondroitin sulfate products.
- Hydroxychloroquine.
- Methotrexate.
- Intra-articular hyaluronic acid injections in hip OA.
- Chondroitin sulfate, platelet-rich plasma injections, and stem cell injections in hip and knee OA.
- Tumor necrosis factor (TNF) inhibitors.
- Interleukin-1–receptor antagonists.
Additionally, the panel made a conditional recommendation against topical capsaicin on the hand, colchicine, fish oil, vitamin D, intra-articular hyaluronic acid injections in the first CMC, and intra-articular botulinum toxin and prolotherapy in hip and knee OA.
The panel did not recommend for or against use of yoga for hip and hand OA, topical lidocaine, pregabalin, gabapentin, selective serotonin reuptake inhibitors, serotonin norepinephrine reuptake inhibitors apart from duloxetine, tricyclic antidepressants, and anti-nerve growth factor agents.
While the panel conditionally recommended against use of opioids, they made a conditional recommendation for use of tramadol opioids, and there was “a heated discussion about that distinction,” Dr. Neogi noted in a discussion session at the meeting. “There was a recent observational study that indicated that tramadol may have an increased risk of [all-cause] mortality, but there are lots of issues of confounding by indication in that study.”
The patient panel also raised strong concerns about the ACR and the Arthritis Foundation coming out against opioids for OA management in their guidelines. “They don’t want to damn opioids, but they’re also concerned about a specialty society coming out strongly against opioids in the concern that their physicians may limit their access to opioids if they’re in a situation where nothing else is helping them,” Dr. Neogi said.
Dr. Kolasinski noted the guidelines will be published online in Arthritis & Rheumatology in December, and will appear in print in February of next year.
Dr. Kolasinski reported no relevant financial disclosures. Dr. Neogi reported relationships with EMD Serono, Merck, and Pfizer.
REPORTING FROM ACR 2019
Metformin after GDM: Lessons from landmark diabetes prevention trial
WASHINGTON – Metformin’s role in preventing or delaying the onset of type 2 diabetes in women with a history of gestational diabetes mellitus has been firmly established by the Diabetes Prevention Program (DPP) trial – most recently, by 15-year follow-up data reported this year – and the drug should be front and center for clinicians who hope to stave off the “remarkable” incidence of type 2 diabetes after GDM, Robert E. Ratner, MD, maintained at the biennial meeting of the Diabetes in Pregnancy Study Group of North America.

The DPP included “the single largest population of women with a history of GDM that’s been looked at in a randomized controlled trial,” and considering its multiethnic population, the trial offers a reliable representative sample to ponder today when evaluating long-term use of metformin after GDM, said Dr. Ratner, a principal investigator of the National Institutes of Health–sponsored DPP and the DPP Outcomes Study and a former chief scientific & medical officer for the American Diabetes Association.
The drug stacked up equally to lifestyle interventions among DPP participants who had a history of GDM, but it’s important to appreciate that these interventions were intensive and that metformin is inexpensive, well tolerated, and “has a long safety record,” he said.
Results of follow-up out to 15 years
Of the more than 3,000 men and women enrolled in the landmark DPP, conducted during 1996-2001, 350 were women with a documented history of GDM and over 1,400 were women who had deliveries but no history of GDM. All participants had impaired glucose tolerance – defined for the trial as having both a fasting plasma glucose value of 95-125 mg/dL and a 2-hour value of 140-199 mg/dL after a 75-g glucose load – and were randomized to placebo, metformin, or intensive lifestyle intervention.
Metformin therapy reduced the incidence of diabetes by approximately 50% in women with a history of GDM, compared with the placebo group – as did lifestyle – over 3 years. The number needed to treat to prevent one case of diabetes was five. Women without a history of GDM, on the other hand, saw only a 14% reduction with metformin when compared with placebo (and a 49% reduction with lifestyle).
“In women with a history of GDM ... one pill twice a day for $4 a month worked as well as intensive lifestyle [change],” Dr. Ratner said, referring to the initial GDM-specific analysis of DPP data published in 2008 (J Clin Endocrinol Metab. 2008;93[12]:4774-9).
In a 10-year postrandomization follow-up, published in 2015, both metformin and lifestyle continued to be equally effective for the GDM group, reducing the progression to diabetes by 40% and 35%, respectively (J Clin Endocrinol Metab. 2015;100:1646-53). The number needed to treat to prevent one case of diabetes was seven. (Among women without a history of GDM, metformin did not reduce progression to diabetes.)
A recent DPP Outcomes Study analysis of metformin’s impact on diabetes prevention at 15 years, moreover, showed a 41% risk reduction among women with a history of GDM (Diabetes Care. 2019;42[4]:601-8).
Advice on prescribing metformin prophylactically
Asked after his presentation whether women with a history of GDM and either an elevated fasting plasma glucose value or an elevated 2-hour oral glucose tolerance test (GTT) value – or neither of the two – would benefit from taking metformin, Dr. Ratner said that “we’re stuck with inclusion criteria of the DPP, in which they had to meet both criteria ... What I’d say, though, is that not everyone with a history of GDM needs to be on metformin prophylactically. But [for women who have] prediabetes as defined by the ADA, the cost-benefit analysis points toward metformin.”
And with respect to early initiation and long-term use of the drug, “I would have absolutely no qualms about medicating a 25-year-old who had developed GDM and who in the postpartum period has prediabetes,” Dr. Ratner said during an open discussion. “She’s actually at the highest risk for developing type 2 very early.”
Kim Boggess, MD, who also presented on long-term use of metformin after GDM, said in the discussion period that she is often quick to recommend metformin therapy to her patients who have an elevated fasting plasma glucose value in the postpartum period, even when a 75-g oral GTT has not yet been performed. (The ADA and the American College of Obstetricians and Gynecologists recommend completion of an oral GTT at 4-12 weeks postpartum after GDM.)
“I start them [on metformin] especially if they’ve had a cesarean section. Even 2, 3, 4 weeks of profound hyperglycemia could have potentially deleterious effects,” said Dr. Boggess, professor and maternal-fetal medicine program director at the University of North Carolina, Chapel Hill. “If someone comes in [shortly after] and looks like they have pristine control, then it might be worth stopping the metformin for 3-5 days (and retesting).”
Dr. Ratner said that, in this clinical scenario, he would first ensure that the fasting glucose value “is a true fasting glucose” and “if it’s substantially elevated – I’m talking 100, 105, 110 mg/dL – I’d start metformin, and I’m not even sure I’d do the GTT.” But, he advised, “if you’re going to do the GTT, I’d stop the metformin the day before.”
In her presentation, Dr. Boggess pointed out that metformin wasn’t shown to be superior to lifestyle interventions in the DPP for preventing progression to type 2 DM, and that some women are more motivated for intensive lifestyle change than others. The ADA recommends, in fact, that either metformin or lifestyle interventions be prescribed to women with a history of GDM who are found to have prediabetes.

There are no data to support the use of metformin either during or after pregnancy to improve weight loss or reduce weight retention following pregnancy, but at least several studies have shown that lifestyle interventions are effective, she noted.
What is needed, Dr. Boggess said, are more data on the effects of metformin on cardiovascular disease risk, as well as larger studies of metformin in the postpartum period “to help us determine the best dose.” Some research on metformin use in the postpartum period has reported gastrointestinal side effects and dissatisfaction, she noted.
Dr. Ratner said that metformin’s main drawback is the need for occasional testing of B12 levels. Regarding weight loss and what was observed in the DPP, he said, women with a history of GDM who were randomized to intensive lifestyle interventions did not lose as much weight as women without a history of GDM.
Women who entered the DPP with a GDM history, he noted in his presentation, were essentially a “cohort of survivors.” They had an average age of 43 (compared with 52 years in the parous women without GDM) and a mean interval from the index GDM pregnancy of 11 years, which means that women with the highest risk of diabetes conversion were excluded, Dr. Ratner said.
Age was the only significantly different baseline characteristic between parous women with and without GDM, he noted. Women with a history of GDM who were randomized to placebo had a 71% higher incidence of diabetes than women without such a history – a striking natural history, Dr. Ratner said.
He and Dr. Boggess each reported that they have no financial or other interests that pose a conflict of interest.
WASHINGTON – Metformin’s role in preventing or delaying the onset of type 2 diabetes in women with a history of gestational diabetes mellitus has been firmly established by the Diabetes Prevention Program (DPP) trial – most recently, by 15-year follow-up data reported this year – and the drug should be front and center for clinicians who hope to stave off the “remarkable” incidence of type 2 diabetes after GDM, Robert E. Ratner, MD, maintained at the biennial meeting of the Diabetes in Pregnancy Study Group of North America.
The DPP included “the single largest population of women with a history of GDM that’s been looked at in a randomized controlled trial,” and considering its multiethnic population, the trial offers a reliable representative sample to ponder today when evaluating long-term use of metformin after GDM, said Dr. Ratner, a principal investigator of the National Institutes of Health–sponsored DPP and the DPP Outcomes Study and a former chief scientific & medical officer for the American Diabetes Association.
The drug stacked up equally to lifestyle interventions among DPP participants who had a history of GDM, but it’s important to appreciate that these interventions were intensive and that metformin is inexpensive, well tolerated, and “has a long safety record,” he said.
Results of follow-up out to 15 years
Of the more than 3,000 men and women enrolled in the landmark DPP, conducted during 1996-2001, 350 were women with a documented history of GDM and over 1,400 were women who had deliveries but no history of GDM. All participants had impaired glucose tolerance – defined for the trial as having both a fasting plasma glucose value of 95-125 mg/dL and a 2-hour value of 140-199 mg/dL after a 75-g glucose load – and were randomized to placebo, metformin, or intensive lifestyle intervention.
Metformin therapy reduced the incidence of diabetes by approximately 50% in women with a history of GDM, compared with the placebo group – as did lifestyle – over 3 years. The number needed to treat to prevent one case of diabetes was five. Women without a history of GDM, on the other hand, saw only a 14% reduction with metformin when compared with placebo (and a 49% reduction with lifestyle).
“In women with a history of GDM ... one pill twice a day for $4 a month worked as well as intensive lifestyle [change],” Dr. Ratner said, referring to the initial GDM-specific analysis of DPP data published in 2008 (J Clin Endocrinol Metab. 2008;93[12]:4774-9).
In a 10-year postrandomization follow-up, published in 2015, both metformin and lifestyle continued to be equally effective for the GDM group, reducing the progression to diabetes by 40% and 35%, respectively (J Clin Endocrinol Metab. 2015;100:1646-53). The number needed to treat to prevent one case of diabetes was seven. (Among women without a history of GDM, metformin did not reduce progression to diabetes.)
A recent DPP Outcomes Study analysis of metformin’s impact on diabetes prevention at 15 years, moreover, showed a 41% risk reduction among women with a history of GDM (Diabetes Care. 2019;42[4]:601-8).
Advice on prescribing metformin prophylactically
Asked after his presentation whether women with a history of GDM and either an elevated fasting plasma glucose value or an elevated 2-hour oral glucose tolerance test (GTT) value – or neither of the two – would benefit from taking metformin, Dr. Ratner said that “we’re stuck with inclusion criteria of the DPP, in which they had to meet both criteria ... What I’d say, though, is that not everyone with a history of GDM needs to be on metformin prophylactically. But [for women who have] prediabetes as defined by the ADA, the cost-benefit analysis points toward metformin.”
And with respect to early initiation and long-term use of the drug, “I would have absolutely no qualms about medicating a 25-year-old who had developed GDM and who in the postpartum period has prediabetes,” Dr. Ratner said during an open discussion. “She’s actually at the highest risk for developing type 2 very early.”
Kim Boggess, MD, who also presented on long-term use of metformin after GDM, said in the discussion period that she is often quick to recommend metformin therapy to her patients who have an elevated fasting plasma glucose value in the postpartum period, even when a 75-g oral GTT has not yet been performed. (The ADA and the American College of Obstetricians and Gynecologists recommend completion of an oral GTT at 4-12 weeks postpartum after GDM.)
“I start them [on metformin] especially if they’ve had a cesarean section. Even 2, 3, 4 weeks of profound hyperglycemia could have potentially deleterious effects,” said Dr. Boggess, professor and maternal-fetal medicine program director at the University of North Carolina, Chapel Hill. “If someone comes in [shortly after] and looks like they have pristine control, then it might be worth stopping the metformin for 3-5 days (and retesting).”
Dr. Ratner said that, in this clinical scenario, he would first ensure that the fasting glucose value “is a true fasting glucose” and “if it’s substantially elevated – I’m talking 100, 105, 110 mg/dL – I’d start metformin, and I’m not even sure I’d do the GTT.” But, he advised, “if you’re going to do the GTT, I’d stop the metformin the day before.”
In her presentation, Dr. Boggess pointed out that metformin wasn’t shown to be superior to lifestyle interventions in the DPP for preventing progression to type 2 DM, and that some women are more motivated for intensive lifestyle change than others. The ADA recommends, in fact, that either metformin or lifestyle interventions be prescribed to women with a history of GDM who are found to have prediabetes.
There are no data to support the use of metformin either during or after pregnancy to improve weight loss or reduce weight retention following pregnancy, but at least several studies have shown that lifestyle interventions are effective, she noted.
What is needed, Dr. Boggess said, are more data on the effects of metformin on cardiovascular disease risk, as well as larger studies of metformin in the postpartum period “to help us determine the best dose.” Some research on metformin use in the postpartum period has reported gastrointestinal side effects and dissatisfaction, she noted.
Dr. Ratner said that metformin’s main drawback is the need for occasional testing of B12 levels. Regarding weight loss and what was observed in the DPP, he said, women with a history of GDM who were randomized to intensive lifestyle interventions did not lose as much weight as women without a history of GDM.
Women who entered the DPP with a GDM history, he noted in his presentation, were essentially a “cohort of survivors.” They had an average age of 43 (compared with 52 years in the parous women without GDM) and a mean interval from the index GDM pregnancy of 11 years, which means that women with the highest risk of diabetes conversion were excluded, Dr. Ratner said.
Age was the only significantly different baseline characteristic between parous women with and without GDM, he noted. Women with a history of GDM who were randomized to placebo had a 71% higher incidence of diabetes than women without such a history – a striking natural history, Dr. Ratner said.
He and Dr. Boggess each reported that they have no financial or other interests that pose a conflict of interest.
REPORTING FROM THE DPSG-NA 2019
Colchicine cut post-MI CVD events
PHILADELPHIA – The proof of concept shown by the CANTOS study in 2017 that an anti-inflammatory drug could cut the incidence of cardiovascular events has now been replicated in a study with more than 4,700 post-MI patients who received the much more affordable oral anti-inflammatory drug colchicine.

Daily treatment with a single, 0.5-mg/day colchicine tablet cut cardiovascular disease events by a statistically significant 23%, compared with placebo patients during nearly 20 months on treatment when colchicine was added on top of a regimen that included aspirin, a second antiplatelet drug, a statin, and in many patients a beta-blocking drug, Jean-Claude Tardif, MD, said at the American Heart Association scientific sessions.
Adding colchicine to the treatment of patients within 30 days of having a MI led to an absolute reduction in the study’s primary endpoint of 1.6% during a median 19.6 months on treatment. In a secondary analysis that looked at total cardiovascular events and not just first events, adding colchicine to background therapy was associated with a relative 34% decline, said Dr. Tardif, professor of medicine at the University of Montreal and director of the Research Centre at the Montreal Heart Institute. In addition to his report at the meeting, the results also appeared concurrently in an article published online (N Engl J Med. 2019 Nov 16. doi: 10.1056/NEJMoa1912388).
The dramatic efficacy and overall safety shown by colchicine in COLCOT (Colchicine Cardiovascular Outcomes Trial) appeared to replicate the benefit seen with the relatively expensive monoclonal antibody canakinumab (Ilaris) in CANTOS (Canakinumab Anti-Inflammatory Thrombosis Outcome Study), where a canakinumab injection every 3 months led to a 15% reduction in the incidence of cardiovascular events, compared with placebo, during a median 3.7 years of follow-up in a study with just over 10,000 post-MI patients (N Engl J Med. 2017 Sep 21;377[12]:1119-31).
“One of the limitations of CANTOS was that canakinumab is a very expensive, injectable drug. We followed in the footsteps of CANTOS with a less expensive, oral drug,” Dr. Tardif explained during a press briefing. “Colchicine is a known, potent anti-inflammatory drug,” and as of November 2019, the average U.S. cost of a 30-day supply of 0.6-mg capsules was $147. The colchicine formulation used in COLCOT delivered a 0.5-mg daily dose to patients, a formulation that’s not currently on the U.S. market.
“Having a safe drug that’s easily available; it will be hard to hold this one back,” commented Donald M. Lloyd-Jones, MD, professor and chairman of preventive medicine at Northwestern University in Chicago. “What the guidelines will need to wrestle with is there are five drugs” already recommended to use after an MI; “is colchicine number six?” The existing guideline-directed drugs for post-MI patients include aspirin, a second antiplatelet agent, a statin, a beta-blocker, and an angiotensin-converting enzyme inhibitor, Dr. Lloyd-Jones noted. The incremental benefit from adding colchicine to background regimen was “modest, but statistically significant,” he said, and “importantly, this was not an industry-sponsored trial.” Dr. Lloyd-Jones said that he has recently heard from a patient of his in the Chicago area who takes colchicine for gout that the monthly cost for the drug has risen to as high as $270. By comparison, the price in Montreal is less than $9/month, Dr. Tardif said.
COLCOT enrolled 4,745 patients at a median of about 13.5 days following an acute MI at 167 centers in 12 countries. The study’s primary endpoint was the combination of death from cardiovascular causes, resuscitated cardiac arrest, MI, stroke, or urgent hospitalization for angina leading to coronary revascularization in a time-to-event analysis. The combined endpoint occurred in 5.5% of the patients on colchicine and 7.1% of those on placebo during a median of nearly 20 months on treatment. The adverse effects data showed generally similarly rates among patients on colchicine and in the control group, including their rates of gastrointestinal effects. The one exception was the rate of serious pneumonias, which were more than double in the colchicine recipients, a statistically significant difference.
COLCOT received no commercial support. Dr. Tardif has received honoraria from Amarin, DalCor, Sanofi, and Servier; he has an ownership interest in DalCor; and he has received research funding from Amarin, AstraZeneca, DalCor, Esperion, Ionis, RegenxBio, Sanofi, and Servier. Dr. Lloyd-Jones had no disclosures.
SOURCE: Tardif J-C et al. AHA 2019, Abstract.
The landmark results from COLCOT confirm that managing inflammation reduces cardiovascular risk, and the results successfully repurpose colchicine, a broadly available and relatively safe branded generic drug for a new application. Colchicine was also generally well tolerated for measured adverse effects, but we do not know whether unmeasured adverse effects may cause discontinuations that would limit long-term adherence. Clinicians should exercise caution using colchicine in patients with chronic kidney disease because of its renal clearance, and the 0.5-mg daily dosage used in COLCOT does not exactly align with the 0.6-mg colchicine formulation that’s available on the U.S. market.
The adverse effect profile of colchicine showed a concerning, statistically significant increased rate of serious pneumonia infections, which occurred at a 0.9% rate among patients on colchicine and a 0.4% rate among patients on placebo. But the patients on colchicine showed no excess of fatal infections or episodes of septic shock. This increase in the rate of serious pneumonias may be the price paid for using an anti-inflammatory drug in these patients.
A similar, earlier study of methotrexate designed to follow on the CANTOS findings with a less expensive and easier to administer drug failed to show significant benefit. CIRT (Cardiovascular inflammation reduction trial) enrolled 4,786 patients with either a prior MI or multivessel coronary disease plus diabetes or metabolic syndrome, and the CIRT results highlight that not all anti-inflammatory drugs work the same way or have similar effects on cardiovascular disease. The COLCOT findings need replication, and three large studies now in progress are also assessing colchicine in patients with cardiovascular disease. Cardiologists will need to learn how to use colchicine, but the COLCOT results are promising and show an overall low level of adverse effects.
The COLCOT findings followed a prior report from a study without a placebo control that showed a rather dramatic, 67% reduction in cardiovascular events with colchicine treatment in 532 patients with stable coronary disease (J Amer Coll Cardiol. 2013 Jan 29;61[4]:404-10).
Aruna D. Pradhan, MD , is a medical epidemiologist at Brigham and Women’s Hospital in Boston. She has received research funding from Kowa. She made these comments as designated discussant for the COLCOT report.
PHILADELPHIA – The proof of concept shown by the CANTOS study in 2017 that an anti-inflammatory drug could cut the incidence of cardiovascular events has now been replicated in a study with more than 4,700 post-MI patients who received the much more affordable oral anti-inflammatory drug colchicine.
Daily treatment with a single, 0.5-mg/day colchicine tablet cut cardiovascular disease events by a statistically significant 23%, compared with placebo patients during nearly 20 months on treatment when colchicine was added on top of a regimen that included aspirin, a second antiplatelet drug, a statin, and in many patients a beta-blocking drug, Jean-Claude Tardif, MD, said at the American Heart Association scientific sessions.
Adding colchicine to the treatment of patients within 30 days of having a MI led to an absolute reduction in the study’s primary endpoint of 1.6% during a median 19.6 months on treatment. In a secondary analysis that looked at total cardiovascular events and not just first events, adding colchicine to background therapy was associated with a relative 34% decline, said Dr. Tardif, professor of medicine at the University of Montreal and director of the Research Centre at the Montreal Heart Institute. In addition to his report at the meeting, the results also appeared concurrently in an article published online (N Engl J Med. 2019 Nov 16. doi: 10.1056/NEJMoa1912388).
The dramatic efficacy and overall safety shown by colchicine in COLCOT (Colchicine Cardiovascular Outcomes Trial) appeared to replicate the benefit seen with the relatively expensive monoclonal antibody canakinumab (Ilaris) in CANTOS (Canakinumab Anti-Inflammatory Thrombosis Outcome Study), where a canakinumab injection every 3 months led to a 15% reduction in the incidence of cardiovascular events, compared with placebo, during a median 3.7 years of follow-up in a study with just over 10,000 post-MI patients (N Engl J Med. 2017 Sep 21;377[12]:1119-31).
“One of the limitations of CANTOS was that canakinumab is a very expensive, injectable drug. We followed in the footsteps of CANTOS with a less expensive, oral drug,” Dr. Tardif explained during a press briefing. “Colchicine is a known, potent anti-inflammatory drug,” and as of November 2019, the average U.S. cost of a 30-day supply of 0.6-mg capsules was $147. The colchicine formulation used in COLCOT delivered a 0.5-mg daily dose to patients, a formulation that’s not currently on the U.S. market.
“Having a safe drug that’s easily available; it will be hard to hold this one back,” commented Donald M. Lloyd-Jones, MD, professor and chairman of preventive medicine at Northwestern University in Chicago. “What the guidelines will need to wrestle with is there are five drugs” already recommended to use after an MI; “is colchicine number six?” The existing guideline-directed drugs for post-MI patients include aspirin, a second antiplatelet agent, a statin, a beta-blocker, and an angiotensin-converting enzyme inhibitor, Dr. Lloyd-Jones noted. The incremental benefit from adding colchicine to background regimen was “modest, but statistically significant,” he said, and “importantly, this was not an industry-sponsored trial.” Dr. Lloyd-Jones said that he has recently heard from a patient of his in the Chicago area who takes colchicine for gout that the monthly cost for the drug has risen to as high as $270. By comparison, the price in Montreal is less than $9/month, Dr. Tardif said.
COLCOT enrolled 4,745 patients at a median of about 13.5 days following an acute MI at 167 centers in 12 countries. The study’s primary endpoint was the combination of death from cardiovascular causes, resuscitated cardiac arrest, MI, stroke, or urgent hospitalization for angina leading to coronary revascularization in a time-to-event analysis. The combined endpoint occurred in 5.5% of the patients on colchicine and 7.1% of those on placebo during a median of nearly 20 months on treatment. The adverse effects data showed generally similarly rates among patients on colchicine and in the control group, including their rates of gastrointestinal effects. The one exception was the rate of serious pneumonias, which were more than double in the colchicine recipients, a statistically significant difference.
COLCOT received no commercial support. Dr. Tardif has received honoraria from Amarin, DalCor, Sanofi, and Servier; he has an ownership interest in DalCor; and he has received research funding from Amarin, AstraZeneca, DalCor, Esperion, Ionis, RegenxBio, Sanofi, and Servier. Dr. Lloyd-Jones had no disclosures.
SOURCE: Tardif J-C et al. AHA 2019, Abstract.
REPORTING FROM AHA 2019
Naturopaths emphasize role of diet in atopic dermatitis
, based on data from a small survey of the two.
Data from previous studies show that more than half of patients with AD have used complementary and alternative medicine in addition to allopathic care, but providers may be unaware of each other’s treatment approaches and confuse patients, wrote Julie Dhossche, MD, of Oregon Health & Science University, Portland, and her colleagues.
In a study published in Pediatric Dermatology, the researchers assessed results of an 11-question, free-text survey of 30 allopathic providers and 21 naturopathic providers about AD. The survey included questions on patient education and evaluation, skin care, and treatment.
Overall, both allopathic and naturopathic providers recommended skin care protocols involving moisturization and “soak and seal” bathing. However, allopathic providers were more likely to prescribe topical corticosteroids for mild to moderate disease (100% vs. 19%), followed by phototherapy and systemic treatments in more severe cases. Naturopathic providers were more likely than allopathic providers to choose topical botanicals, oils, or probiotics (52% vs. 0%) for mild to moderate disease, as well stress relief and acupuncture. Naturopathic providers favored topical corticosteroids and referrals to dermatologists for second- or third-line treatment.
Of note, 85% of naturopathic providers said they thought diet had a probable or definite role in AD, compared with 3% of allopathic providers.
In addition, naturopathic providers differed in their response to an optional question on the use of additional education about food and diet. A total of 11 of 19 naturopathic providers (58%) recommended dietary changes, including “remove potential food allergens/reduce sugar” and “emphasize anti-inflammatory diet,” the researchers said.
“Confusion regarding the role of food in AD management is a common source of frustration for patients, and perhaps a consensus statement from both fields regarding the role of food allergy in AD management could be aspired toward in the name of reducing patient confusion,” they wrote.
The study findings were limited by several factors, including the small sample size and self-selection bias, as well as the subjective nature of an open-ended survey, the researchers noted. However, the results provide evidence of differences in treatment approaches between allopathic and naturopathic providers and suggest that “respectful collaboration between allopathic and naturopathic providers will help practitioners find common ground, decrease patient confusion, and improve patient outcomes,” they concluded.
The researchers had no financial conflicts to disclose.
SOURCE: Dhossche J et al. Ped Dermatol. 2019 Nov 19. doi: 10.1111/pde.14036.
FROM PEDIATRIC DERMATOLOGY
Pediatric dermatology update: New research offers insight into psoriasis, alopecia
LAS VEGAS – Recent research is offering new insights into psoriasis and alopecia in the pediatric population, a dermatologist told colleagues, and it’s time to be on the lookout for psoriasis linked to treatment with tumor necrosis factor (TNF) inhibitors.

Lawrence F. Eichenfield, MD, professor of dermatology and pediatrics, at the University of California, San Diego, offered these tips and comments in a presentation at Skin Disease Education Foundation’s annual Las Vegas Dermatology Seminar:
Psoriasis
It’s a brand new day for adult psoriasis sufferers, but it seems to be only a brand new morning for their pediatric counterparts. “Kids and teenagers were left behind in the biologic revolution,” Dr. Eichenfield said. “Only two systemic biologics have been approved for psoriasis in children.” They are ustekinumab (Stelara), approved by the Food and Drug Administration for treating psoriasis in children aged 12 years and older, and etanercept, approved for aged 4 years and older.
The good news, he said, is that “our new biologic agents are now being studied in children.”
Research is also providing new insight into pediatric psoriasis, said Dr. Eichenfield, who is also chief of pediatric and adolescent dermatology at Rady Children’s Hospital in San Diego. It’s now clear that “there’s a lot more facial involvement, and a high involvement of scalp and nail,” he noted.
It’s also clear, he said, that inflammation begins early in pediatric psoriasis. That raises the question of whether it’s a good idea to launch aggressive treatment to stop the “psoriatic march” toward cardiovascular and other medical problems down the line, he commented.
“Keep an open mind to getting aggressive in therapy,” he advised, although he acknowledged that “it’s hard to get beyond the two biologics, and only one is approved for children under 12.”
Dr. Eichenfield advised colleagues to keep an eye out for TNF inhibitor–induced psoriasis. “We’re seeing it pretty regularly,” he said, commonly in children who are treated with TNF inhibitors for rheumatoid arthritis or Crohn’s disease.
The lesions “look like dermatitis but are very psoriasiform,” he said, and research suggests this can appear after a single dose or after as many as 63 months of treatment. Topical and light therapy can be helpful. But if those treatments do not help, he said, it’s time to consider changing the biologic that the patient is taking. “Is the biologic adequately controlling their underlying disease? If not, you can help find one that would be great for their underlying disease and clear up their psoriasis.”
Alopecia
Pediatric alopecia “is a problem I see pretty regularly in practice,” Dr. Eichenfield said. When he sees patients with alopecia, he says that, “‘if your child doesn’t have 50% hair loss, you’re in the good group. It will generally heal up and never come back again.’ ”
He referred to a recent study, where investigators at the Children’s Hospital of Philadelphia retrospectively studied 125 children under age 4 years who were diagnosed with alopecia areata and followed for 2 years. Over time, those children with over 50% of hair loss initially were more likely to have worsening Severity of Alopecia Tool (SALT) scores over the follow-up period. But a high proportion of those with mild alopecia initially continued to have mild alopecia at follow-up (Pediatr Dermatol. 2019 Aug 29. doi: 10.1111/pde.13990).
Dr. Eichenfield noted that the study found that 41% of the patients also had atopic dermatitis.
He also highlighted two other recent studies on pediatric alopecia: One found that while vitamin D levels were low in a majority of children with alopecia in the study, the proportion who had a deficiency was similar to the proportion in a larger pediatric population, at about 22% in both groups (J Am Acad Dermatol. 2018 Sep;79(3):e43-e44). Supplementation doesn’t seem to help. “It’s not important to test levels,” he said.
Another study examined whether it’s a good idea to test patients for celiac disease in children with alopecia (Pediatr Dermatol. 2018 Jul;35[4]:535-8). Some parents may ask this question, but the answer, he said, is generally no.
What’s next? “We were hoping oral and topical JAK inhibitors would work well” in this population, Dr. Eichenfield said, but study findings haven’t been promising.
Still, oral tofacitinib (Xeljanz) showed some “pretty impressive” success in a recent study in four children, he noted. Based on the results, the authors wrote that “we suggest that, after proper counseling regarding the risks, including severe infection and malignancy, the use of tofacitinib may be considered for preadolescent children with AA [alopecia areata] who are experiencing psychosocial impairment” (J Am Acad Dermatol. 2019 Feb;80[2]:568-70).
In general, Dr. Eichenfield said, research on pediatric alopecia “will be secondary, especially with JAK inhibitors because of the risk of side effects. But [children will] probably tolerate them better than adults do because they have fewer medical problems.”
Meanwhile, he added, controversy continues to swirl around how to treat children over age 10 years who have lost 50% or more of their hair. “I’ve seen hundreds of kids with alopecia areata,” he said, “and I can’t predict what the course may be.”
Dr. Eichenfield reports multiple relationships (consultant or investigator) with various pharmaceutical companies, including Abbvie, Allergan, Lilly, Novartis, and others. SDEF and this news organization are owned by the same parent company.
LAS VEGAS – Recent research is offering new insights into psoriasis and alopecia in the pediatric population, a dermatologist told colleagues, and it’s time to be on the lookout for psoriasis linked to treatment with tumor necrosis factor (TNF) inhibitors.
Lawrence F. Eichenfield, MD, professor of dermatology and pediatrics, at the University of California, San Diego, offered these tips and comments in a presentation at Skin Disease Education Foundation’s annual Las Vegas Dermatology Seminar:
Psoriasis
It’s a brand new day for adult psoriasis sufferers, but it seems to be only a brand new morning for their pediatric counterparts. “Kids and teenagers were left behind in the biologic revolution,” Dr. Eichenfield said. “Only two systemic biologics have been approved for psoriasis in children.” They are ustekinumab (Stelara), approved by the Food and Drug Administration for treating psoriasis in children aged 12 years and older, and etanercept, approved for aged 4 years and older.
The good news, he said, is that “our new biologic agents are now being studied in children.”
Research is also providing new insight into pediatric psoriasis, said Dr. Eichenfield, who is also chief of pediatric and adolescent dermatology at Rady Children’s Hospital in San Diego. It’s now clear that “there’s a lot more facial involvement, and a high involvement of scalp and nail,” he noted.
It’s also clear, he said, that inflammation begins early in pediatric psoriasis. That raises the question of whether it’s a good idea to launch aggressive treatment to stop the “psoriatic march” toward cardiovascular and other medical problems down the line, he commented.
“Keep an open mind to getting aggressive in therapy,” he advised, although he acknowledged that “it’s hard to get beyond the two biologics, and only one is approved for children under 12.”
Dr. Eichenfield advised colleagues to keep an eye out for TNF inhibitor–induced psoriasis. “We’re seeing it pretty regularly,” he said, commonly in children who are treated with TNF inhibitors for rheumatoid arthritis or Crohn’s disease.
The lesions “look like dermatitis but are very psoriasiform,” he said, and research suggests this can appear after a single dose or after as many as 63 months of treatment. Topical and light therapy can be helpful. But if those treatments do not help, he said, it’s time to consider changing the biologic that the patient is taking. “Is the biologic adequately controlling their underlying disease? If not, you can help find one that would be great for their underlying disease and clear up their psoriasis.”
Alopecia
Pediatric alopecia “is a problem I see pretty regularly in practice,” Dr. Eichenfield said. When he sees patients with alopecia, he says that, “‘if your child doesn’t have 50% hair loss, you’re in the good group. It will generally heal up and never come back again.’ ”
He referred to a recent study, where investigators at the Children’s Hospital of Philadelphia retrospectively studied 125 children under age 4 years who were diagnosed with alopecia areata and followed for 2 years. Over time, those children with over 50% of hair loss initially were more likely to have worsening Severity of Alopecia Tool (SALT) scores over the follow-up period. But a high proportion of those with mild alopecia initially continued to have mild alopecia at follow-up (Pediatr Dermatol. 2019 Aug 29. doi: 10.1111/pde.13990).
Dr. Eichenfield noted that the study found that 41% of the patients also had atopic dermatitis.
He also highlighted two other recent studies on pediatric alopecia: One found that while vitamin D levels were low in a majority of children with alopecia in the study, the proportion who had a deficiency was similar to the proportion in a larger pediatric population, at about 22% in both groups (J Am Acad Dermatol. 2018 Sep;79(3):e43-e44). Supplementation doesn’t seem to help. “It’s not important to test levels,” he said.
Another study examined whether it’s a good idea to test patients for celiac disease in children with alopecia (Pediatr Dermatol. 2018 Jul;35[4]:535-8). Some parents may ask this question, but the answer, he said, is generally no.
What’s next? “We were hoping oral and topical JAK inhibitors would work well” in this population, Dr. Eichenfield said, but study findings haven’t been promising.
Still, oral tofacitinib (Xeljanz) showed some “pretty impressive” success in a recent study in four children, he noted. Based on the results, the authors wrote that “we suggest that, after proper counseling regarding the risks, including severe infection and malignancy, the use of tofacitinib may be considered for preadolescent children with AA [alopecia areata] who are experiencing psychosocial impairment” (J Am Acad Dermatol. 2019 Feb;80[2]:568-70).
In general, Dr. Eichenfield said, research on pediatric alopecia “will be secondary, especially with JAK inhibitors because of the risk of side effects. But [children will] probably tolerate them better than adults do because they have fewer medical problems.”
Meanwhile, he added, controversy continues to swirl around how to treat children over age 10 years who have lost 50% or more of their hair. “I’ve seen hundreds of kids with alopecia areata,” he said, “and I can’t predict what the course may be.”
Dr. Eichenfield reports multiple relationships (consultant or investigator) with various pharmaceutical companies, including Abbvie, Allergan, Lilly, Novartis, and others. SDEF and this news organization are owned by the same parent company.
EXPERT ANALYSIS FROM SDEF LAS VEGAS DERMATOLOGY SEMINAR
In psoriasis, methotrexate and other older drugs can still be useful
LAS VEGAS – While biologics have dramatically changed the picture, drugs like , a dermatologist told colleagues.
However, caution is necessary, especially when the drugs are used in combination with biologics, Bruce E. Strober, MD, PhD, of Yale University, New Haven, Conn., and Central Connecticut Dermatology, Cromwell, Conn., said at Skin Disease Education Foundation’s annual Las Vegas Dermatology Seminar.
Dr. Strober offered these tips about the proper use of these four drugs in psoriasis patients:
Acitretin (Soriatane). “This was used as monotherapy initially, but at this point in history, fewer and fewer patients are getting it as monotherapy,” he said. A dose of 25 mg/day appears to provide the best mix of efficacy and side-effect control, “although it’s not a high-efficacy drug, especially at 25 mg a day. It’s a slow-acting drug, and you may need 4 if not 6 months to see the maximum effect before you give up on it.”
What about using acitretin in combination with other therapies? Studies examining its use with phototherapy haven’t been promising, Dr. Strober said. The drug can be used with methotrexate, he said, even though the combination will worry pharmacists. “Follow the liver, and you’ll be fine” he noted. “That combination can be successful. Laboratory monitoring is not onerous: Discontinue after a few months if you’ve not seen any movement.” The drug can also be used with biologics, he said.
Apremilast (Otezla). This drug will bring about a third of patients to a Psoriasis Area and Severity Index (PASI) 75. “That’s not the most impressive efficacy. Rarely do we clear patients with this drug, and it has tolerability issues in some patients,” Dr. Strober said. Side effects can include diarrhea, nausea, headache, and depression. “Warn patients of these possibilities,” he added.
Methotrexate. “It’s very helpful and not a drug to be feared if it’s monitored correctly,” Dr. Strober said. “It’s certainly not a biologic, but it’s not a bad drug from an efficacy standpoint, and it does have efficacy in psoriatic arthritis.”
The drug’s low cost can make it a good alternative to biologics in patients with limited insurance options – such as those on Medicare – or those who don’t have insurance, he said.
“Psoriasis is often controlled at a mean dose of 15 mg/week [orally], with no test dose; start at 15-mg weekly,” he said. “It’s an interesting drug that allows you to dose weekly and still get efficacy,” especially when dosed subcutaneously.
Beware the many contraindications such as pregnancy, possible pregnancy, and high alcohol intake, he added. Dr. Strober doesn’t recommend liver biopsies to monitor hepatic effects. “It’s a poor test with risk and sampling error,” he said.
Cyclosporine. This drug is best “in severe patients in need of a quick response,” said Dr. Strober, who added that biologics are often a better option even in patients who are sensitive to price since samples and free-drug programs are available. “It’s in and out of the body quickly, and most people skip doses and get recurrence of their disease quickly,” he said.
Blood tests are a hassle for patients, he said, and “people often don’t feel great on the drug,” said Dr. Strober, who added, however, that he still does occasionally use it.
Dr. Strober reported multiple disclosures including consultant/advisory board (AbbVie, Amgen, Lilly, Pfizer, among others) and investigator relationships. SDEF and this news organization are owned by the same parent company.
REPORTING FROM SDEF LAS VEGAS DERMATOLOGY SEMINAR
Large population-based study underscores link between gout, CVD event risk
ATLANTA – Gout is associated with an increased risk of both fatal and nonfatal cardiovascular disease events, according to a large population-based health data linkage study in New Zealand.
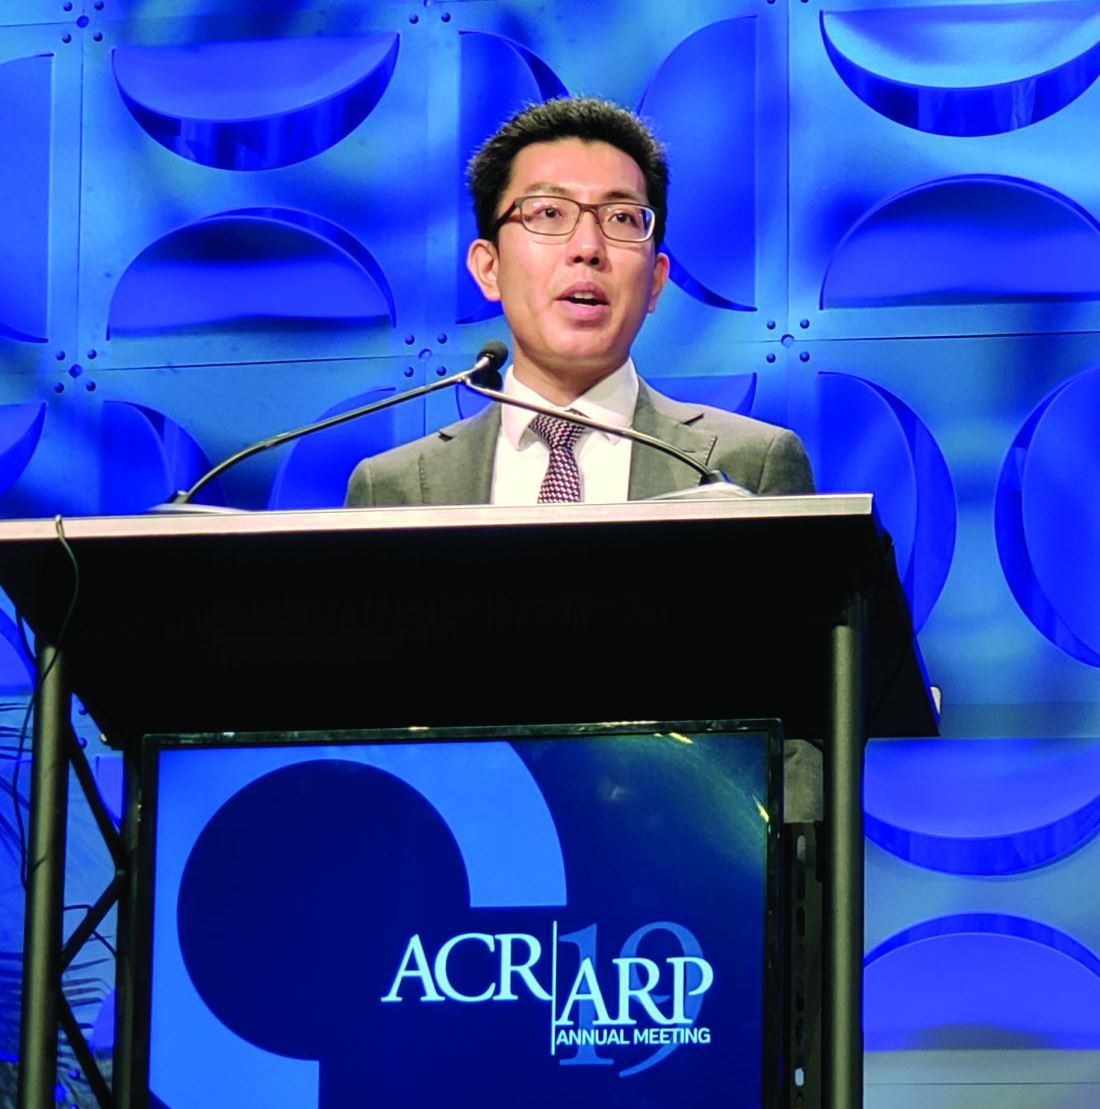
“Overall, the survival was quite good within both cohorts, but ... there is a clear and statistically significant difference in the survival between the people with gout and those without gout,” Ken Cai, MBBS, reported at the annual meeting of the American College of Rheumatology, noting that a similarly “significant and clear” difference was seen in nonfatal CVD events between the groups.
Of 968,387 individuals included in the analysis, 34,056 had gout, said Dr. Cai, a rheumatology clinical fellow at the University of Auckland (New Zealand). After adjusting for population-level estimated 5-year CVD risk for cardiovascular death, nonfatal myocardial infarction, stroke, or other vascular event, the adjusted hazard ratios were 1.20 for fatal and 1.32 for nonfatal first CVD events in patients with gout. The CVD risk score used in the analysis accounted for age, gender, ethnicity, level of social deprivation, diabetes status, previous hospitalization for atrial fibrillation, and baseline dispensing of blood pressure–lowering, lipid-lowering, and antiplatelet/anticoagulant medications.
“To allow for any other differences between the gout and nongout cohorts with respect to gender, age, ethnicity, and social deprivation, we further adjusted for these factors again, even though they had been accounted for within our CVD risk score,” he said, noting that “gout continued to demonstrate an increased adjusted hazard ratio” for fatal and nonfatal events after that adjustment (HRs, 1.40 and 1.35, respectively)
Additional analysis in the gout patients showed that CVD risk was similarly increased both in those who had been dispensed allopurinol at least once in the prior 5 years and those who had not (adjusted HRs for fatal events, 1.41 and 1.33; and for nonfatal, first CVD events, 1.34 and 1.38, respectively), and “there was no significant difference between these two groups, compared to people without gout,” he said.
Adjustment for serum urate levels in gout patients also showed similarly increased risk for fatal and nonfatal events for those with levels less than 6 mg/dL and those with levels of 6 mg/dL or greater (adjusted HRs of 1.32 and 1.42 for fatal events, and 1.27 and 1.43 for nonfatal first CVD events, respectively).
Again, no significant difference was seen in the risk of events between these two groups and those without gout, Dr. Cai said, noting that patients with no serum urate monitoring also had an increased risk of events (adjusted HR of 1.41 for fatal events and 1.29 for nonfatal, first CVD events).
Gout and hyperuricemia have previously been reported to be independent risk factors for CVD and CVD events, and urate-lowering therapy such as allopurinol have been thought to potentially be associated with reduced risk of CVD, he said, noting that the relationships are of particular concern in New Zealand, where gout affects more than 4% of the adult population.
“Maori, who are the indigenous people of New Zealand, and Pasifika people are disproportionately affected by gout; 8.5% of Maori, and 13.9% of Pasifika adults have gout,” he said, adding that an estimated one-third of Maori and Pasifika adults over age 65 years have gout.
To further assess the relationships between gout and CVD risk, he and his colleagues used validated population-level risk-prediction equations and linked National Health Identifier (NHI) data, he said.
National registries of medicines dispensing data, hospitalization, and death were linked to the Auckland/Northland regional repository of laboratory results from Jan. 1, 2012 to Dec. 31, 2016.
“We included all New Zealand residents aged 20 years or older who were in contact with publicly funded services in 2011 and were alive at the end of December, 2011,” he said, adding that those with a previous hospitalization for CVD or heart failure prior to the end of December 2011 were excluded, as were those with primary residence outside of the region for the prior 3 years and those missing predictor variable data.
Although the findings are limited by an inability to adjust for smoking status, body mass index, and blood pressure – as such data are not collected at the national level, and by the population-based nature of the study, which does not allow determination about causation, they nevertheless reinforce the association between gout and an increased estimated risk of CVD events, Dr. Cai said.
“Even after adjustment for estimated 5-year CVD risk and the additional weighting of risk factors within it, gout independently increased the hazard ratio for fatal and nonfatal events,” he said. “In our study, this effect was not ameliorated by allopurinol use or serum urate lowering to treatment target.”
Similar studies are needed in other populations, he said.
Dr. Cai reported grant support from Arthritis Australia.
SOURCE: Cai K et al. Arthritis Rheumatol. 2019;71(suppl 10), Abstract 2732.
ATLANTA – Gout is associated with an increased risk of both fatal and nonfatal cardiovascular disease events, according to a large population-based health data linkage study in New Zealand.
“Overall, the survival was quite good within both cohorts, but ... there is a clear and statistically significant difference in the survival between the people with gout and those without gout,” Ken Cai, MBBS, reported at the annual meeting of the American College of Rheumatology, noting that a similarly “significant and clear” difference was seen in nonfatal CVD events between the groups.
Of 968,387 individuals included in the analysis, 34,056 had gout, said Dr. Cai, a rheumatology clinical fellow at the University of Auckland (New Zealand). After adjusting for population-level estimated 5-year CVD risk for cardiovascular death, nonfatal myocardial infarction, stroke, or other vascular event, the adjusted hazard ratios were 1.20 for fatal and 1.32 for nonfatal first CVD events in patients with gout. The CVD risk score used in the analysis accounted for age, gender, ethnicity, level of social deprivation, diabetes status, previous hospitalization for atrial fibrillation, and baseline dispensing of blood pressure–lowering, lipid-lowering, and antiplatelet/anticoagulant medications.
“To allow for any other differences between the gout and nongout cohorts with respect to gender, age, ethnicity, and social deprivation, we further adjusted for these factors again, even though they had been accounted for within our CVD risk score,” he said, noting that “gout continued to demonstrate an increased adjusted hazard ratio” for fatal and nonfatal events after that adjustment (HRs, 1.40 and 1.35, respectively)
Additional analysis in the gout patients showed that CVD risk was similarly increased both in those who had been dispensed allopurinol at least once in the prior 5 years and those who had not (adjusted HRs for fatal events, 1.41 and 1.33; and for nonfatal, first CVD events, 1.34 and 1.38, respectively), and “there was no significant difference between these two groups, compared to people without gout,” he said.
Adjustment for serum urate levels in gout patients also showed similarly increased risk for fatal and nonfatal events for those with levels less than 6 mg/dL and those with levels of 6 mg/dL or greater (adjusted HRs of 1.32 and 1.42 for fatal events, and 1.27 and 1.43 for nonfatal first CVD events, respectively).
Again, no significant difference was seen in the risk of events between these two groups and those without gout, Dr. Cai said, noting that patients with no serum urate monitoring also had an increased risk of events (adjusted HR of 1.41 for fatal events and 1.29 for nonfatal, first CVD events).
Gout and hyperuricemia have previously been reported to be independent risk factors for CVD and CVD events, and urate-lowering therapy such as allopurinol have been thought to potentially be associated with reduced risk of CVD, he said, noting that the relationships are of particular concern in New Zealand, where gout affects more than 4% of the adult population.
“Maori, who are the indigenous people of New Zealand, and Pasifika people are disproportionately affected by gout; 8.5% of Maori, and 13.9% of Pasifika adults have gout,” he said, adding that an estimated one-third of Maori and Pasifika adults over age 65 years have gout.
To further assess the relationships between gout and CVD risk, he and his colleagues used validated population-level risk-prediction equations and linked National Health Identifier (NHI) data, he said.
National registries of medicines dispensing data, hospitalization, and death were linked to the Auckland/Northland regional repository of laboratory results from Jan. 1, 2012 to Dec. 31, 2016.
“We included all New Zealand residents aged 20 years or older who were in contact with publicly funded services in 2011 and were alive at the end of December, 2011,” he said, adding that those with a previous hospitalization for CVD or heart failure prior to the end of December 2011 were excluded, as were those with primary residence outside of the region for the prior 3 years and those missing predictor variable data.
Although the findings are limited by an inability to adjust for smoking status, body mass index, and blood pressure – as such data are not collected at the national level, and by the population-based nature of the study, which does not allow determination about causation, they nevertheless reinforce the association between gout and an increased estimated risk of CVD events, Dr. Cai said.
“Even after adjustment for estimated 5-year CVD risk and the additional weighting of risk factors within it, gout independently increased the hazard ratio for fatal and nonfatal events,” he said. “In our study, this effect was not ameliorated by allopurinol use or serum urate lowering to treatment target.”
Similar studies are needed in other populations, he said.
Dr. Cai reported grant support from Arthritis Australia.
SOURCE: Cai K et al. Arthritis Rheumatol. 2019;71(suppl 10), Abstract 2732.
REPORTING FROM ACR 2019