User login
Milestone Match Day sees record highs; soar in DO applicants
Unifying allopathic (MD) and osteopathic (DO) applicants for the first time in a single matching program, 2020’s Match Day results underscored the continuing growth of DOs in the field, boosting numbers in primary care medicine and the Match as a whole.
The 2020 Main Residency Match bested 2019’s record as the largest in the history of the National Resident Matching Program (NRMP), with 40,084 applicants submitting program choices for 37,256 positions. This compares with 38,376 applicants vying for 35,185 positions last year.
It’s the seventh consecutive year in which overall match numbers are up, according to the NRMP. Although the number of applicants increased, so did the number of positions, resulting in a slight drop in the percent of positions filled during 2019-2020.
Available first-year (PGY-1) positions rose to 34,266, an increase of 2,072 (6.4%) over 2019. “This was, in part, due to the last migration of osteopathic program positions into the Main Residency Match,” Donna L. Lamb, DHSc, NRMP president and CEO, said in an interview. An agreement the Accreditation Council for Graduate Medical Education, American Osteopathic Association and American Association of Colleges of Osteopathic Medicine reached in 2014 recognized ACGME as the primary accrediting body for graduate medical education programs by 2020.
This led to the first single match for U.S. MD and DO senior students and graduates and the inclusion of DO senior students as sponsored applicants in 2020, Dr. Lamb noted.
Gains, trends in 2020 match
Growth in U.S. DO senior participation also pushed this year’s Match to record highs. There were 6,581 U.S. DO medical school seniors who submitted rank order lists, 1,103 more than in 2019. Among those seniors, 90.7% matched to PGY-1 positions, driving the match rate for U.S. DO seniors up 2.6 percentage points from 2019.
Since 2016, the number of U.S. DO seniors seeking positions has risen by 3,599 or 120%. “Of course, the number of U.S. MD seniors who submitted program choices was also record-high: 19,326, an increase of 401 over 2019. The 93.7% match rate to first-year positions for this group has remained very consistent for many years,” Dr. Lamb said.
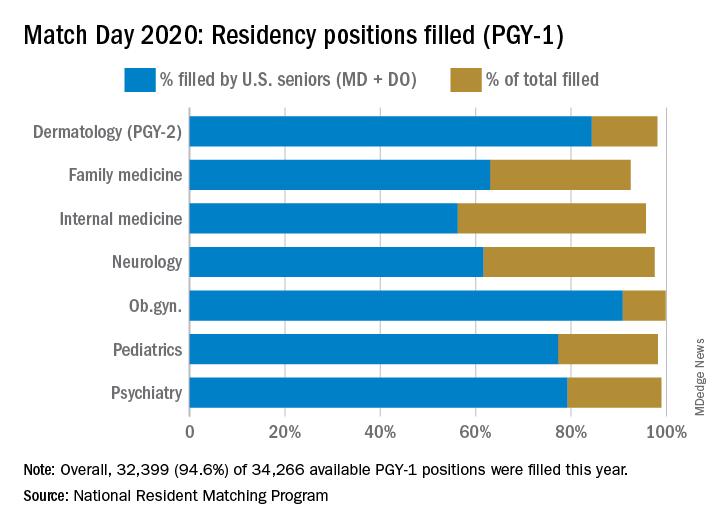
Among individual specialties, the NRMP reported extremely high fill rates for dermatology, medicine-emergency medicine, neurological surgery, physical medicine and rehabilitation (categorical), integrated plastic surgery, and thoracic surgery. Other competitive specialties included medicine-pediatrics, orthopedic surgery, otolaryngology, and vascular surgery.
Participation of international medical school students and graduates (IMGs) went up in 2020, breaking a 3-year cycle of decline. More than 61% matched to first-year positions, 2.5 percentage points higher than 2019 – and the highest match rate since 1990. “IMGs generally are having the most success matching to primary care specialties, including internal medicine, family medicine, and pediatrics,” Dr. Lamb said.
Primary care benefits from DO growth
DO candidates also helped drive up the numbers in primary care.
Internal medicine offered 8,697 categorical positions, 581 more than in 2019, reflecting a fill rate of 95.7%. More than 40% of these slots were filled by U.S. MD seniors, a category that’s seen decreases over the last 5 years, due in part to administrative and financial burdens associated with primary care internal medicine.
“In addition, the steady growth of internal medicine has increased the overall number of training positions available, and with the growth of other specialties in parallel, it has also likely had some effect on decreasing the percentage of U.S. graduates entering the field,” Phil Masters, MD, vice president of membership and global engagement at the American College of Physicians, said in an interview.
However, fill rates for U.S. DO seniors reached 16% in 2020, a notable rise from 6.9% in 2016. “As the number of osteopathic trainees increases, we are happy that more are choosing internal medicine as a career path,” Dr. Masters said, adding that the slightly different training and practice orientation of osteopathic physicians “complements that of their allopathic colleagues, and add richness to the many different practice settings that internal medicine encompasses.”
A record number of DO seniors also matched in family medicine (1,392), accounting for nearly 30% of all applicants. The single match led to an important net increase in filled family medicine residency positions, Clif Knight, MD, senior vice president for education at the American Academy of Family Physicians, said in an interview.
Overall, family medicine filled 92.5% of its 4,662 positions, 555 more than in 2019. The results show that family medicine and primary care are on solid footing, Dr. Knight said. “We are excited that the number of filled family medicine residency positions increased from last year. This is important as we work to meet the significant primary care workforce shortage,” he added.
In other specialties:
- Pediatrics filled more than 98% of its 2,864 categorical positions, 17 more than in 2019. U.S. MD seniors filled 1,731 (60.4%) of those slots. “We’re very excited about our newly matched pediatricians,” Sara “Sally” H. Goza, MD, president of the American Academy of Pediatrics, said in an interview. “The coronavirus outbreak has shown us how valuable the pediatric workforce is and how much we’re needed.’’
- Dermatology offered 478 positions, achieving a fill rate of 98.1%. “Looking at our own program’s Match results, I feel very satisfied that we are accomplishing our specific aim to serve rural populations and to create a diverse workforce in dermatology,” Erik Stratman, MD, an expert on dermatologic education in U.S. medical schools/residency programs, and a member of the American Academy of Dermatology, said in an interview. “It’s nice to see the fruits of the specialty’s expanding efforts to get the right people in the specialty who reflect those populations we serve.”
- Obstetrics-gynecology offered 1,433 first-year positions – 48 more than in 2019 – achieving a fill rate of 99.8%, with U.S. MD seniors filling more than 75% of those slots.
- Neurology filled more than 97.5% of 682 offered positions in 2020. However, U.S. MD seniors represented just under half of those filled positions (46.5%).
- Psychiatry offered 1,858 positions in 2020, achieving an overall fill rate of 98.9%, 61.2% for U.S. MD seniors.
- Emergency Medicine filled 99.5% of the 2,665 positions offered this year. In this profession, the U.S. MD fill rate was 64.3%. These new interns are sorely needed at a time when EM physicians are on the front lines of a pandemic, Hannah R. Hughes, MD, president of the Emergency Medicine Residents’ Association, said in an interview.
Unifying allopathic (MD) and osteopathic (DO) applicants for the first time in a single matching program, 2020’s Match Day results underscored the continuing growth of DOs in the field, boosting numbers in primary care medicine and the Match as a whole.
The 2020 Main Residency Match bested 2019’s record as the largest in the history of the National Resident Matching Program (NRMP), with 40,084 applicants submitting program choices for 37,256 positions. This compares with 38,376 applicants vying for 35,185 positions last year.
It’s the seventh consecutive year in which overall match numbers are up, according to the NRMP. Although the number of applicants increased, so did the number of positions, resulting in a slight drop in the percent of positions filled during 2019-2020.
Available first-year (PGY-1) positions rose to 34,266, an increase of 2,072 (6.4%) over 2019. “This was, in part, due to the last migration of osteopathic program positions into the Main Residency Match,” Donna L. Lamb, DHSc, NRMP president and CEO, said in an interview. An agreement the Accreditation Council for Graduate Medical Education, American Osteopathic Association and American Association of Colleges of Osteopathic Medicine reached in 2014 recognized ACGME as the primary accrediting body for graduate medical education programs by 2020.
This led to the first single match for U.S. MD and DO senior students and graduates and the inclusion of DO senior students as sponsored applicants in 2020, Dr. Lamb noted.
Gains, trends in 2020 match
Growth in U.S. DO senior participation also pushed this year’s Match to record highs. There were 6,581 U.S. DO medical school seniors who submitted rank order lists, 1,103 more than in 2019. Among those seniors, 90.7% matched to PGY-1 positions, driving the match rate for U.S. DO seniors up 2.6 percentage points from 2019.
Since 2016, the number of U.S. DO seniors seeking positions has risen by 3,599 or 120%. “Of course, the number of U.S. MD seniors who submitted program choices was also record-high: 19,326, an increase of 401 over 2019. The 93.7% match rate to first-year positions for this group has remained very consistent for many years,” Dr. Lamb said.
Among individual specialties, the NRMP reported extremely high fill rates for dermatology, medicine-emergency medicine, neurological surgery, physical medicine and rehabilitation (categorical), integrated plastic surgery, and thoracic surgery. Other competitive specialties included medicine-pediatrics, orthopedic surgery, otolaryngology, and vascular surgery.
Participation of international medical school students and graduates (IMGs) went up in 2020, breaking a 3-year cycle of decline. More than 61% matched to first-year positions, 2.5 percentage points higher than 2019 – and the highest match rate since 1990. “IMGs generally are having the most success matching to primary care specialties, including internal medicine, family medicine, and pediatrics,” Dr. Lamb said.
Primary care benefits from DO growth
DO candidates also helped drive up the numbers in primary care.
Internal medicine offered 8,697 categorical positions, 581 more than in 2019, reflecting a fill rate of 95.7%. More than 40% of these slots were filled by U.S. MD seniors, a category that’s seen decreases over the last 5 years, due in part to administrative and financial burdens associated with primary care internal medicine.
“In addition, the steady growth of internal medicine has increased the overall number of training positions available, and with the growth of other specialties in parallel, it has also likely had some effect on decreasing the percentage of U.S. graduates entering the field,” Phil Masters, MD, vice president of membership and global engagement at the American College of Physicians, said in an interview.
However, fill rates for U.S. DO seniors reached 16% in 2020, a notable rise from 6.9% in 2016. “As the number of osteopathic trainees increases, we are happy that more are choosing internal medicine as a career path,” Dr. Masters said, adding that the slightly different training and practice orientation of osteopathic physicians “complements that of their allopathic colleagues, and add richness to the many different practice settings that internal medicine encompasses.”
A record number of DO seniors also matched in family medicine (1,392), accounting for nearly 30% of all applicants. The single match led to an important net increase in filled family medicine residency positions, Clif Knight, MD, senior vice president for education at the American Academy of Family Physicians, said in an interview.
Overall, family medicine filled 92.5% of its 4,662 positions, 555 more than in 2019. The results show that family medicine and primary care are on solid footing, Dr. Knight said. “We are excited that the number of filled family medicine residency positions increased from last year. This is important as we work to meet the significant primary care workforce shortage,” he added.
In other specialties:
- Pediatrics filled more than 98% of its 2,864 categorical positions, 17 more than in 2019. U.S. MD seniors filled 1,731 (60.4%) of those slots. “We’re very excited about our newly matched pediatricians,” Sara “Sally” H. Goza, MD, president of the American Academy of Pediatrics, said in an interview. “The coronavirus outbreak has shown us how valuable the pediatric workforce is and how much we’re needed.’’
- Dermatology offered 478 positions, achieving a fill rate of 98.1%. “Looking at our own program’s Match results, I feel very satisfied that we are accomplishing our specific aim to serve rural populations and to create a diverse workforce in dermatology,” Erik Stratman, MD, an expert on dermatologic education in U.S. medical schools/residency programs, and a member of the American Academy of Dermatology, said in an interview. “It’s nice to see the fruits of the specialty’s expanding efforts to get the right people in the specialty who reflect those populations we serve.”
- Obstetrics-gynecology offered 1,433 first-year positions – 48 more than in 2019 – achieving a fill rate of 99.8%, with U.S. MD seniors filling more than 75% of those slots.
- Neurology filled more than 97.5% of 682 offered positions in 2020. However, U.S. MD seniors represented just under half of those filled positions (46.5%).
- Psychiatry offered 1,858 positions in 2020, achieving an overall fill rate of 98.9%, 61.2% for U.S. MD seniors.
- Emergency Medicine filled 99.5% of the 2,665 positions offered this year. In this profession, the U.S. MD fill rate was 64.3%. These new interns are sorely needed at a time when EM physicians are on the front lines of a pandemic, Hannah R. Hughes, MD, president of the Emergency Medicine Residents’ Association, said in an interview.
Emergency Rule: Docs can bill for telehealth and COVID-19 tests. Here’s how
Many medical practices have long wanted to use telehealth to perform office visits and other evaluation and management (E/M) services. The technology readily exists and many electronic health records are set up to do telehealth visits. The problem has been getting paid for those visits. Medicare limited telehealth services to patients in underserved areas, and commercial insurances wouldn’t pay. But amid the COVID-19 crisis, things have changed.
On March 17, Congress passed a law allowing Medicare to waive some telehealth restrictions during a government state of emergency only, which we are in now. Specifically, the patient no longer needs to be in a medically underserved area and no longer needs to go to an originating site, such as a hospital. The patient can be located anywhere in the country and be in their own home.
Further, the Centers for Medicare & Medicaid is waiving the requirement that the practitioner use a HIPAA-compliant platform for the telehealth service. The service must still be provided using a real-time audiovisual platform, but that could be via FaceTime or Skype, both of which are readily available via a patient’s smartphone or home computer. Audio alone – that is, phone calls between physician and patient – is still insufficient.
Billing for telemedicine
There are two lists of services that you can bill for telehealth. One of the lists is in Medicare’s telehealth fact sheet and includes both CPT and HCPCS codes. The second is in your CPT book, Appendix P, and lists only CPT codes.
Practices may bill all of the Medicare-covered telehealth services using these new rules. This includes new and established patient visits 99201–99215. It includes inpatient and skilled nursing services, for which CMS uses HCPCS codes in place of CPT codes.
Some notable additional services that you may bill via telehealth are: smoking cessation, transitional care management, advanced care planning, psychiatric diagnostic interviews and psychotherapy, and initial and subsequent Medicare wellness visits. The Welcome to Medicare visit is not on the list.
Report these services to Medicare with the correct CPT code and use place of service 02 (telehealth) on the claim. There is a CPT modifier for telehealth (Modifier -95 Synchronous Telemedicine Service Rendered Via a Real-Time Interactive Audio and Video Telecommunications System) but Medicare does not require it.
If you perform an office visit and also do smoking cessation, document those just as you would if you saw the patient in person. Document the history; observational exam, if relevant; and the assessment and plan. Note the additional time spent in smoking cessation counseling. If it was a level three established patient, code 99213-25 and 99406 (smoking and tobacco use cessation counseling visit, intermediate, 3-10 minutes).
The Office of Inspector General is allowing practices to reduce or waive copays and patient due amounts. However, a practice is not required to waive the copay or patient due amount for a telehealth service.
Medicare Advantage plans are required to cover all services that original Medicare covers. State Medicaid plans and Medicaid managed care organizations can set their own rules.
What about commercial payers?
While CMS has issued its Medicare guidelines, commercial insurance companies can also set their own rules about covering telehealth services. Many of them have rushed to update their policies to allow office visits to be billed via telehealth.
Unfortunately, each payer can set its own rules about whether to cover telehealth and if the place of service 02 and/or modifier -95 is needed. UnitedHealthcare is covering telehealth visits for all of its Medicare Advantage, Medicaid, and commercial accounts.
Humana also is covering telemedicine for urgent care needs. Some private insurers are continuing to offer virtual visits with their contracted telehealth provider, not with the patient’s own physician. It is likely that this will change in the days ahead, but it means practices must check their payer policies and pay attention to the emails they receive from the payers. If patient foot traffic is slow, this may be a good time to call each payer to not only find out their telehealth rules, but to also learn what else is being suspended during the COVID-19 pandemic.
This would also be a good job for an employee to do from home versus coming into the practice.
None of the payers are limiting the diagnosis code for telemedicine services. The patient does not need to have a cough or fever to have telemedicine covered. Any diagnosis or condition is eligible to be billed via telehealth.
The waived restrictions by Medicare are in place only as long as the government state of emergency. Commercial payers are also describing these as temporary. However, it may be hard to put the genie back in the bottle. Medical practices and patients may find that these visits are just what the doctor ordered.
COVID-19 testing
Although testing is still not widely available, the American Medical Association has developed a CPT code for the test:
- 87635: Infectious agent detection by nucleic acid (DNA or RNA); severe acute respiratory syndrome coronavirus 2 (SARS-CoV-2) (Coronavirus disease [COVID-19]), amplified probe technique
CMS has also developed codes for testing for this new coronavirus. One (U0001) is specifically for tests done in the CDC lab. The second (U0002) was for other labs, but it seems likely that the CPT code will replace it.
In February, the U.S. Food and Drug Administration issued a new policy for certain labs to develop their own validated COVID-19 diagnostics. This second HCPCS code could be used for such tests when submitting claims to Medicare or other insurers.
The hope by CMS is that having these specific codes will encourage further testing and improve tracking of the virus.
This article first appeared on Medscape.com.
New ASAM guideline released amid COVID-19 concerns
Home-based buprenorphine induction deemed safe for OUD
The American Society of Addiction Medicine has released an updated practice guideline for patients with opioid use disorder.
The guideline, called a focused update, advances ASAM’s 2015 National Practice Guidelines for the Treament of Opioid Use Disorder. “During the ongoing COVID-19 pandemic and the associated need for social distancing, it is especially important that clinicians and health care providers across the country take steps to ensure that individuals with OUD can continue to receive evidence-based care,” said Paul H. Earley, MD, president of ASAM, in a press release announcing the new guideline.
The guideline specifies that home-based buprenorphine induction is safe and effective for treatment of opioid use disorder and that no individual entering the criminal justice system should be subjected to opioid withdrawal.
“The research is clear, providing methadone or buprenorphine, even without psychosocial treatment, reduces the patient’s risk of death,” said Kyle Kampman, MD, chair of the group’s Guideline Writing Committee, in the release. “Ultimately, keeping patients with the disease of addiction alive and engaged to become ready for recovery is absolutely critical in the context of the deadly overdose epidemic that has struck communities across our country.”
The society released this focused update to reflect new medications and formulations, published evidence, and clinical guidance related to treatment of OUD. This update includes the addition of 13 new recommendations and major revisions to 35 existing recommendations. One concern the society has is how to help patients being treated for OUD who are limited in their ability to leave their homes. Because of these same concerns, the Substance Abuse and Mental Health Services Administration relaxed regulations on March 16 regarding patient eligibility for take-home medications, such as buprenorphine and methadone, which dovetails with the society’s guidance regarding home-based induction.
, continuing on to pharmacologic treatment even if the patient declines recommended psychosocial treatment, keeping naloxone kits available in correctional facilities, and more. Additional information about this update can be found on ASAM’s website.
Home-based buprenorphine induction deemed safe for OUD
Home-based buprenorphine induction deemed safe for OUD
The American Society of Addiction Medicine has released an updated practice guideline for patients with opioid use disorder.
The guideline, called a focused update, advances ASAM’s 2015 National Practice Guidelines for the Treament of Opioid Use Disorder. “During the ongoing COVID-19 pandemic and the associated need for social distancing, it is especially important that clinicians and health care providers across the country take steps to ensure that individuals with OUD can continue to receive evidence-based care,” said Paul H. Earley, MD, president of ASAM, in a press release announcing the new guideline.
The guideline specifies that home-based buprenorphine induction is safe and effective for treatment of opioid use disorder and that no individual entering the criminal justice system should be subjected to opioid withdrawal.
“The research is clear, providing methadone or buprenorphine, even without psychosocial treatment, reduces the patient’s risk of death,” said Kyle Kampman, MD, chair of the group’s Guideline Writing Committee, in the release. “Ultimately, keeping patients with the disease of addiction alive and engaged to become ready for recovery is absolutely critical in the context of the deadly overdose epidemic that has struck communities across our country.”
The society released this focused update to reflect new medications and formulations, published evidence, and clinical guidance related to treatment of OUD. This update includes the addition of 13 new recommendations and major revisions to 35 existing recommendations. One concern the society has is how to help patients being treated for OUD who are limited in their ability to leave their homes. Because of these same concerns, the Substance Abuse and Mental Health Services Administration relaxed regulations on March 16 regarding patient eligibility for take-home medications, such as buprenorphine and methadone, which dovetails with the society’s guidance regarding home-based induction.
, continuing on to pharmacologic treatment even if the patient declines recommended psychosocial treatment, keeping naloxone kits available in correctional facilities, and more. Additional information about this update can be found on ASAM’s website.
Coronavirus resources from AAD target safe office practices, new telemedicine guidance
The American Academy of Dermatology (
The guidance pages are publicly viewable. Additionally, AAD has made a collection of COVID-19 articles from the Journal of the American Academy of Dermatology freely available for the next 6 months.
George Hruza, MD, AAD president, detailed regulatory updates and other federal actions as well as guidance regarding telemedicine and clinical practice in a message to AAD members.
“While many questions still need answers, I have appointed an Ad Hoc Task Force to assess dermatology’s needs, share knowledge, and provide ongoing guidance and information throughout the crisis,” Dr. Hruza wrote.
“The situation is changing rapidly, and we are committed to keeping you updated with reliable and practical information to help you adapt to the circumstances,” he noted, referring dermatologists to the AAD’s information hub for the coronavirus outbreak. “We are keeping this page updated frequently, and it will serve as your primary source for what we know now,” he noted.
The Centers for Medicare & Medicaid Services has recently relaxed key regulations regarding technology to provide telemedicine so that physicians and patients can use existing platforms such as FaceTime and Skype for virtual visits. The usual fines for HIPAA noncompliance have been waived. Additionally, telemedicine visits can now be reimbursed at the same rate as in-person visits.
Private payers are beginning to follow suit, said Dr. Hruza, noting that the AAD Association is working to harmonize private coverage with public reimbursement. The AAD also is tracking which payers are coming in line with federal policies on its teledermatology page.
These changes in regulation around telemedicine apply to patient encounters for any purpose, not just coronavirus-related encounters, noted Dr. Hruza. “The good news is that the government has taken action to make it much easier for us to provide virtual consults to patients. Dermatology has always been a leader in telemedicine, and it will be an important way to offer care to patients who can’t or don’t need to come into the office or clinic,” he added.
Importantly, said Dr. Hruza, CMS is allowing practices to have discretion over whether copays are collected, or collected in full, so that these payments don’t present a barrier to patient care in the current crisis environment.
For dermatologists who are new to telemedicine, AAD has created an online resource that includes information about various telemedicine platforms, updated guidance regarding regulations, and best practices for accurate coding and documentation of telemedicine visits.
The Academy has also been developing dermatology-specific guidance, including how to address the concerns of patients who are receiving biologic therapies and how to conserve personal protective equipment while still protecting physicians, staff, and patients from COVID-19 infection.
For patients on biologic therapy who show no sign of coronavirus infection, the decision to continue or stop biologics should be made on a case-by-case basis. Factors to be considered include patient age, comorbidities, and the severity of the original indication for biologic use.
Initiation of biologics should only be done after a similar risk-benefit analysis, with a recommendation to consider deferring initiation for patients 60 and older and those with comorbidities that may portend a worse course in the event of coronavirus infection. Biologics should be discontinued for patients who test positive for COVID-19.
Dr. Hruza outlined some of the federal measures taken that may affect the business side of dermatology practices. These include a $20 million transfer to the Small Business Administration to offset administrative expenses associated with increased loan volumes related to the coronavirus outbreak. Eligible expenses for loans may include new devices and environmental adjustments to accommodate telehealth services.
Additionally, it is anticipated that as employers are required to provide paid sick and family leave, a payroll tax credit will be issued to employers. Some self-employed individuals will also be able to claim a tax credit for sick and family leave.
A recent news release from the AAD encourages the public to use high-emollient moisturizers after handwashing. The release also provides other tips, such as using petrolatum at bedtime for hands that are particularly dry and focusing on the fingertips when moisturizing, as these areas are prone to cracking. The release also reaffirms that the most effective way to clean hands is soap and water, and that moisturizing after handwashing does not negate the antiviral effects of cleansing, contrary to some social media reports.
[email protected]
DIY masks: Worth the risk? Researchers are conflicted
In the midst of the rapidly spreading COVID-19 pandemic, hospitals and clinics are running out of masks. Health care workers are going online to beg for more, the hashtags #GetMePPE and #WeNeedPPE are trending on Twitter, and some hospitals have even put out public calls for mask donations. Health providers are working scared: They know that the moment the masks run out, they’re at increased risk for disease. So instead of waiting for mask shipments that may be weeks off, some people are making their own.
Using a simple template, they cut green surgical sheeting into half-moons, which they pin and sew before attaching elastic straps. Deaconess Health System in Evansville, Indiana, has posted instructions for fabric masks on their website and asked the public to step up and sew.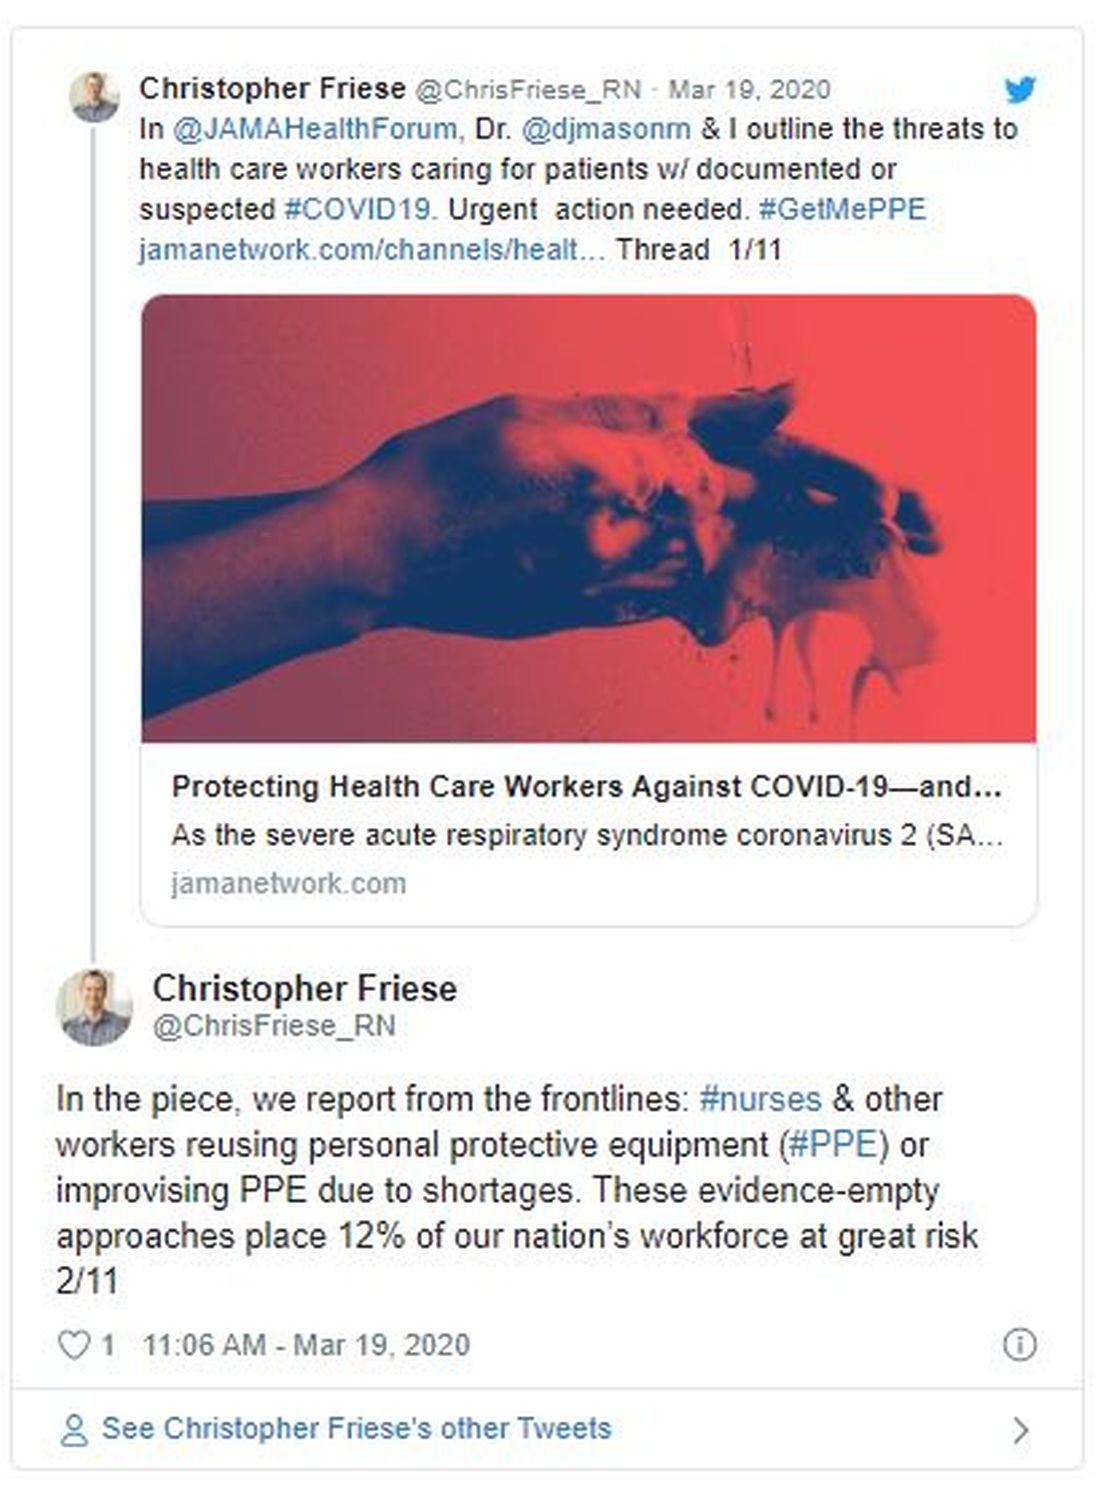
Elsewhere, health care workers have turned to diapers, maxi pads and other products to create masks. Social media channels are full of tips and sewing patterns. It’s an innovative strategy that is also contentious. Limited evidence suggests that homemade masks can offer some protection. But the DIY approach has also drawn criticism for providing a false sense of security, potentially putting wearers at risk.
The conflict points to an immediate need for more protective equipment, says Christopher Friese, PhD, RN, professor of nursing and public health at the University of Michigan, Ann Arbor. Also needed, he says, are new ideas for reducing strain on limited supplies, like adopting gear from other industries and finding innovative ways to provide care so that less protective gear is needed.
“We don’t want clinicians inventing and ‘MacGyvering’ their own device because we don’t want to put them at risk if we can avoid it,” says Friese, referring to the TV character who could build and assemble a vast array of tools/devices. “We have options that have been tested, and we have experience, maybe not in health care, but in other settings. We want to try that first before that frontline doctor, nurse, respiratory therapist decides to take matters into their own hands.
Increasingly, though, health care workers are finding they have no other choice — something even the CDC has acknowledged. In new guidelines, the agency recommends a bandanna, scarf, or other type of covering in cases where face masks are not available.
N95 respirators or surgical masks?
There are two main types of masks generally used in health care. N95 respirators filter out 95% of airborne particles, including bacteria and viruses. The lighter surgical or medical face masks are made to prevent spit and mucous from getting on patients or equipment.
Both types reduce rates of infection among health care workers, though comparisons (at least for influenza) have yet to show that one is superior to the other. One 2020 review by Chinese researchers, for example, analyzed six randomly controlled trials that included more than 9000 participants and found no added benefits of N95 masks over ordinary surgical masks for health care providers treating patients with the flu.
But COVID-19 is not influenza, and evidence suggests it may require more intensive protection, says Friese, who coauthored a blog post for JAMA about the country’s unpreparedness for protecting health care workers during a pandemic. The virus can linger in the air for hours, suggesting that N95 respirators are health care providers’ best option when treating infected patients.
The problem is there’s not enough to go around — of either mask type. In a March 5 survey, National Nurses United reported that just 30% of more than 6500 US respondents said their organizations had enough PPE to respond to a surge in patients. Another 38% did not know if their organizations were prepared. In a tweet, Friese estimated that 12% of nurses and other providers are at risk from reusing equipment or using equipment that is not backed by evidence.
Physicians and providers around the world have been sharing strategies online for how to make their own masks. Techniques vary, as do materials and plans for how to use the homemade equipment. At Phoebe Putney Health, DIY masks are intended to be worn over N95 respirators and then disposed of so that the respirators can be reused more safely, says Amanda Clements, the hospital’s public relations coordinator. Providers might also wear them to greet people at the front door.
Some evidence suggests that homemade masks can help in a pinch, at least for some illnesses. For a 2013 study by researchers in the UK, volunteers made surgical masks from cotton T-shirts, then put them on and coughed into a chamber that measured how much bacterial content got through. The team also assessed the aerosol-filtering ability of a variety of household materials, including scarfs, antimicrobial pillowcases, vacuum-cleaner bags, and tea towels. They tested each material with an aerosol containing two types of bacteria similar in size to influenza.
Commercial surgical masks performed three times better than homemade ones in the filtration test. Surgical masks worked twice as well at blocking droplets on the cough test. But all the makeshift materials — which also included silk, linen, and regular pillowcases — blocked some microbes. Vacuum-cleaner bags blocked the most bacteria, but their stiffness and thickness made them unsuitable for use as masks, the researchers reported. Tea towels showed a similar pattern. But pillowcases and cotton T-shirts were stretchy enough to fit well, thereby reducing the particles that could get through or around them.
Homemade masks should be used only as a last resort if commercial masks become unavailable, the researchers concluded. “Probably something is better than nothing for trained health care workers — for droplet contact avoidance, if nothing else,” says Anna Davies, BSc, a research facilitator at the University of Cambridge, UK, who is a former public health microbiologist and one of the study’s authors.
She recommends that members of the general public donate any stockpiles they have to health care workers, and make their own if they want masks for personal use. She is working with collaborators in the US to develop guidance for how best to do it.
“If people are quarantined and looking for something worthwhile to do, it probably wouldn’t be the worst thing to apply themselves to,” she wrote by email. “My suggestion would be for something soft and cotton, ideally with a bit of stretch (although it’s a pain to sew), and in two layers, marked ‘inside’ and ‘outside.’ ”
The idea that something is better than nothing was also the conclusion of a 2008 study by researchers in the Netherlands and the US. The study enlisted 28 healthy individuals who performed a variety of tasks while wearing N95 masks, surgical masks, or homemade masks sewn from teacloths. Effectiveness varied among individuals, but over a 90-second period, N95 masks worked best, with 25 times more protection than surgical masks and about 50 times more protection than homemade ones. Surgical masks were twice as effective as homemade masks. But the homemade masks offered at least some protection against large droplets.
Researchers emphasize that it’s not yet clear whether those findings are applicable to aerosolized COVID-19. In an influenza pandemic, at least, the authors posit that homemade masks could reduce transmission for the general public enough for some immunity to build. “It is important not to focus on a single intervention in case of a pandemic,” the researchers write, “but to integrate all effective interventions for optimal protection.”
For health care workers on the frontlines of COVID-19, Friese says, homemade masks might do more than nothing but they also might not work. Instead, he would rather see providers using construction or nuclear-engineering masks. And his best suggestion is something many providers are already doing: reducing physical contact with patients through telemedicine and other creative solutions, which is cutting down the overwhelming need for PPE.
Homemade mask production emphasizes the urgent need for more supplies, Friese adds.
“The government needs to step up and do a variety of things to increase production, and that needs to happen now, immediately,” he says. “We don’t we don’t want our clinicians to have to come up with these decisions.”
This article first appeared on Medscape.com.
Conscious sedation during TAVR best for most patients
From the Society for Thoracic Surgeons (STS)/ACC Transcatheter Valve Therapy (TVT) Registry, the group identified 120,080 patients who had TAVR at 559 US sites, from January 2016 to March 2019.
During this time, the percentage of procedures that were done using conscious sedation almost doubled, plateauing in the final 6 months.
And the proportion of sites using any conscious sedation during TAVR increased from 50% to 76%.
The use of this procedure varied widely among the sites: 26% performed >80% of TAVR with conscious sedation, and 13% did not perform any TAVR cases with conscious sedation.
In hospitals in the lowest and highest quartiles of use of conscious sedation during TAVR, this type of sedation was used in a median of 0% of TAVR cases and 91% of cases, respectively.
The researchers used instrumental variable analysis to compare outcomes in patients whose type of anesthesia would differ if they went to a hospital with high or low use of conscious sedation.
Using this method, the use of conscious sedation was associated with a 0.2% absolute risk difference in in-hospital death, the primary study endpoint (P = .010).
And compared with general anesthesia, conscious sedation during TAVR was also associated with a lower rate of 30-day death (2.0% vs 2.5%, respectively), fewer days in the hospital (3.5 vs 4.3 days), and a higher rate of being discharged to home (88.9% vs 86.1%, all P < .001).
“Our results would not apply to those patients who always receive general anesthesia, even at high conscious sedation use centers (eg, patients with severe lung disease on oxygen or significant right ventricular dysfunction),” the authors caution.
Study limitations, next steps
A study limitation is that the registry data did not specify the type of conscious sedation that was used, Cohen acknowledged.
This could vary. For example, a patient could be given a very powerful sedative such as propofol (Diprivan), and his or her respiration and oxygen saturation would be monitored, and an anesthesiologist would be always present. Or the patient could receive sedation like that for angioplasty — diazepam (Valium) or midazolam (Versed) and a narcotic — without an anesthesiologist.
It would be useful to look at the TAVR volumes and compare outcomes within different TAVR volume quartiles, Tang suggested.
In low-volume centers, the anesthesiologist may be uncomfortable with complex cases, whereas larger academic centers would perform more complex procedures and may paradoxically have a slightly higher rate of complications, he speculated.
Future research should investigate what drives the differences in the use of conscious sedation, the authors suggest.
Cohen reports institutional grant support and consulting fees from Edwards Lifesciences, Medtronic, Boston Scientific, and Abbott. Butala is funded by the John S. LaDue Memorial Fellowship at Harvard Medical School and reports consulting fees and ownership interest in HiLabs, outside the submitted work. The disclosures of the other authors are listed with the original article.
This article first appeared on Medscape.com.
Dramatic rise in hypertension-related deaths in the United States
There has been a dramatic rise in hypertension-related deaths in the United States between 2007 and 2017, a new study shows. The authors, led by Lakshmi Nambiar, MD, Larner College of Medicine, University of Vermont, Burlington, analyzed data from the Centers for Disease Control and Prevention, which collates information from every death certificate in the country, amounting to more than 10 million deaths.
They found that age-adjusted hypertension-related deaths had increased from 18.3 per 100,000 in 2007 to 23.0 per 100,000 in 2017 (P < .001 for decade-long temporal trend).
Nambiar reported results of the study at an American College of Cardiology 2020/World Congress of Cardiology press conference on March 19. It was also published online on the same day in the Journal of the American College of Cardiology.
She noted that death rates due to cardiovascular disease have been falling over the past 20 years largely attributable to statins to treat high cholesterol and stents to treat coronary artery disease. But since 2011, the rate of decline in cardiovascular deaths has slowed. One contributing factor is an increase in heart failure-related deaths but there hasn’t been any data in recent years on hypertension-related deaths.
“Our data show an increase in hypertension-related deaths in all age groups, in all regions of the United States, and in both sexes. These findings are alarming and warrant further investigation, as well as preventative efforts,” Nambiar said. “This is a public health emergency that has not been fully recognized,” she added.
“We were surprised to see how dramatically these deaths were increasing, and we think this is related to the rise in diabetes, obesity, and the aging of the population. We need targeted public health measures to address some of those factors,” Nambiar told Medscape Medical News.
“We are winning the battle against coronary artery disease with statins and stents but we are not winning the battle against hypertension,” she added.
Worst Figures in Rural South
Results showed that hypertension-related deaths increased in both rural and urban regions, but the increase was much steeper in rural areas — a 72% increase over the decade compared with a 20% increase in urban areas.
The highest death risk was identified in the rural South, which demonstrated an age-adjusted 2.5-fold higher death rate compared with other regions (P < .001).
The urban South also demonstrated increasing hypertension-related cardiovascular death rates over time: age-adjusted death rates in the urban South increased by 27% compared with all other urban regions (P < .001).
But the absolute mortality rates and slope of the curves demonstrate the highest risk in patients in the rural South, the researchers report. Age-adjusted hypertension-related death rates increased in the rural South from 23.9 deaths per 100,000 in 2007 to 39.5 deaths per 100,000 in 2017.
Nambiar said the trends in the rural South could be related to social factors and lack of access to healthcare in the area, which has been exacerbated by failure to adopt Medicaid expansion in many of the states in this region.
“When it comes to the management of hypertension you need to be seen regularly by a primary care doctor to get the best treatment and regular assessments,” she stressed.
Chair of the ACC press conference at which the data were presented, Martha Gulati, MD, University of Arizona School of Medicine, Phoenix, said: “In this day and time, there is less smoking, which should translate into lower rates of hypertension, but these trends reported here are very different from what we would expect and are probably associated with the rise in other risk factors such as diabetes and obesity, especially in the rural South.”
Nambiar praised the new ACC/AHA hypertension guidelines that recommend a lower diagnostic threshold, “so more people now fit the criteria for raised blood pressure and need treatment.”
“It is important for all primary care physicians and cardiologists to recognize the new threshold and treat people accordingly,” she said. “High blood pressure is the leading cause of cardiovascular disease. If we can control it better, we may be able to control some of this increased mortality we are seeing.”
This article first appeared on Medscape.com.

COVID-19 prompts ‘lifesaving’ policy change for opioid addiction
In the face of the US COVID-19 pandemic, the US Substance Abuse and Mental Health Services Administration (SAMHSA) has announced policy changes to allow some patients in opioid treatment programs (OTP) to take home their medication.
According to the agency, states may request “blanket exceptions” for all stable patients in an OTP to receive a 28-day supply of take-home doses of medications such as methadone and buprenorphine, which are used to treat opioid use disorder (OUD).
States may request up to 14 days of take-home medication for patients who are less stable but who can, in the judgment of OTP clinicians, safely handle this level of take-home medication.
“SAMHSA recognizes the evolving issues surrounding COVID-19 and the emerging needs OTPs continue to face,” the agency writes in its updated guidance.
“SAMHSA affirms its commitment to supporting OTPs in any way possible during this time. As such, we are expanding our previous guidance to provide increased flexibility,” the agency said.
A ‘Lifesaving’ Decision
Commenting on the SAMHSA policy change, Richard Saitz, MD, professor and chair of the department of community health sciences, Boston University School of Public Health, said, the policy “is not only a good idea, it is critical and lifesaving.”
“This approach had to be done now. With the reduction in face-to-face visits, patients with opioid use disorder need a way to access treatment. If they cannot get opioid agonists, they would withdraw and return to illicit opioid use and high overdose risk and it would be cruel,” said Saitz.
“It is possible that there will be some diversion and some risk of overdose or misuse, but even for less stable patients the benefit likely far outweighs the risk,” he told Medscape Medical News.
Saitz believes policy changes like this should have been made before a crisis.
“Honestly, this is perhaps a silver lining of the crisis” and could lead to permanent change in how OUD is treated in the US, he said.
“Just like we are learning what can be done without a medical in-person visit, we will learn that it is perfectly fine to treat patients with addiction more like we treat patients with other chronic diseases who take medication that has risks and benefits,” Saitz said.
in cases when a patient is quarantined because of coronavirus.
Typically, only licensed practitioners can dispense or administer OUD medications to patients, but during the COVID-19 crisis, treatment program staff members, law enforcement officers, and national guard personnel will be allowed to deliver OUD medications to an approved “lockbox” at the patient’s doorstep. The change applies only while the coronavirus public health emergency lasts.
“This is also an excellent idea,” Saitz said.
ASAM Also Responds
In addition, the American Society of Addiction Medicine (ASAM) released a focused update to its National Practice Guideline for the Treatment of Opioid Use Disorder (NPG).
The update is “especially critical in the context of the ongoing COVID-19 emergency, which threatens to curtail patient access to evidence-based treatment,” the organization said in a news release. The new document updates the 2015 NPG. It includes 13 new recommendations and major revisions to 35 existing recommendations.
One new recommendation states that comprehensive assessment of a patient is critical for treatment planning, but completing all assessments should not delay or preclude initiating pharmacotherapy for OUD. Another new recommendation states that there is no recommended time limit for pharmacotherapy.
ASAM continues to recommend that patients’ psychosocial needs be assessed and psychosocial treatment offered. However, if patients can’t access psychosocial treatment because they are in isolation or have other risk factors that preclude external interactions, clinicians should not delay initiation of medication for the treatment of addiction.
Expanding the use of telemedicine might also be appropriate for many patients, ASAM announced.
They note that the NPG is the first to address in a single document all medications currently approved by the US Food and Drug Administration to treat OUD and opioid withdrawal, including all available buprenorphine formulations.
“All of the updated recommendations are designed to both improve the quality and consistency of care and reduce barriers to access to care for Americans living with OUD. The updated recommendations aim to support initiation of buprenorphine treatment in the emergency department and other urgent care settings,” the society said in the release.
“In addition, [the recommendations] provide greater flexibility on dosing during the initiation of buprenorphine treatment and for initiation of buprenorphine at home (which is also an important change in the midst of the COVID-19 crisis).”
The full document is available online.
This article first appeared on Medscape.com.
Expect to encounter more rheumatology/primary immunodeficiency overlap
MAUI, HAWAII – An underlying primary immunodeficiency is far more common among patients in rheumatologists’ offices than is generally appreciated, Anna Postolova, MD, said at the 2020 Rheumatology Winter Clinical Symposium.

“Autoimmunity and immunodeficiency are often incorrectly thought to be mutually exclusive, but I hope to convey to you that they actually run together more than we think, and more than you realize. In the immunodeficiency community, we’re now realizing that autoimmunity can be the first presentation of an immunodeficiency disease,” according to Dr. Postolova, a dual rheumatologist and allergist/immunologist at Stanford (Calif.) University.
She cited a major retrospective study of 2,183 consecutive patients with primary immunodeficiencies (PIDs), mean age 25.8 years, enrolled in a French national PID registry. Of these patients, 26% had at least one autoimmune or inflammatory condition. The French investigators, all immunologists, categorized 12.8% of the PID patients as having rheumatologic disorders, but Dr. Postolova is convinced this figure would have been substantially higher had a rheumatologist been on the research team. That’s because vasculitis and inflammatory eye disorders weren’t included in the rheumatologic disease category, and psoriatic arthritis was probably present but undiagnosed in some psoriasis patients grouped in the skin disease category.
“Our results demonstrate that autoimmune and inflammatory diseases are much more frequent by a factor of at least 10 in patients with PIDs than in the general population,” the French investigators observed.
Indeed, the relative risks of vasculitis, inflammatory eye disease, and skin disease in patients with PID were increased 13-, 7-, and 10-fold, respectively. French children with PID were at 40-fold increased risk for rheumatoid arthritis and 80-fold elevated risk for inflammatory bowel disease.
Among the PID patients with at least one autoimmune or inflammatory condition, 31.6% had more than one. And therein lies a clue for rheumatologists.
“You might have some patients in your panel who have both arthritis and vasculitis, for example. It’s not that common for our patients to have two of our diseases, but those are the ones who might have an immune dysregulatory inborn error of metabolism mutation that’s driving their disease – and we’re now able to look into that,” Dr. Postolova explained.
At present, more than 300 identified single-gene inborn errors of immunity have been identified, some of which can manifest variously as systemic lupus erythematosus (SLE), arthritis, vasculitis, and/or cytopenias, she noted.
In the French study, onset of autoimmune or inflammatory manifestations of PID occurred across the age spectrum. The age of onset was earlier with T-cell and innate immunity deficiencies than in patients with B-cell deficiencies. The prevalence of an autoimmune or inflammatory disorder was greater than 40% in PID patients age 50 years or older.
“What I want to hammer home is these patients with PID are no longer succumbing to their infections. They’re being identified as having an immunodeficiency, they’re going on antibiotics, they’re strictly monitored, and they’re growing older. And as their aberrant immune system fights an infection, they have more and more time to dysregulate and develop one of our diseases. So in the coming years I think you’re going to see a lot more of these patients show up in your rheumatology clinic because they are getting older,” Dr. Postolova said.
Red flags for underlying PID
Recurrent infections are a hallmark of PIDs. And mutations that cause increased infections can alter central and peripheral tolerance, affecting cell growth, signaling, and survival, which in turn affects immunity.
“As we use biologics in our patients with rheumatologic diseases, I think there’s a cohort of patients we’re starting to identify who are getting very serious recurrent infections. It’s not every patient. But that patient who’s had three or four serious infections, that’s the patient who I think we’ll be able to identify in our clinics through an immunodeficiency evaluation. Likewise, the patients who are not responding to multiple different drugs, that’s where I’d stop and think about an underlying immune deficiency,” she said.
A show of hands indicated only about 25% of her audience of rheumatologists routinely ask new patients if they have a personal or family history of recurrent infections. That should be routine practice, in Dr. Postolova’s view. The 10 warning signs of PID for adults put forth by the Jeffrey Modell Foundation focus on a family or personal history of recurrent ear or sinus infections, deep skin abscesses, pneumonia, viral infections, persistent thrush, or chronic diarrhea with weight loss.
Testing for PID
It’s “absolutely appropriate” to start a work-up for suspected immunodeficiency in a rheumatology clinic, according to Dr. Postolova.
“I think every allergist/immunologist would be grateful if you can just order a quantitative immunoglobulin panel as well as specific antibody titer responses to tetanus, diphtheria, pneumococcal vaccine, and an IgG subclass analysis. That’s half of an immunologist’s initial assessment,” she said.
Corticosteroids and other disease-modifying antirheumatic drugs (DMARDs) affect flow cytometry test results. It’s best to hold off on testing until after a patient has been off therapy for 2-3 months. Similarly, treatment with intravenous immunoglobulin (IVIg) will confound measurement of vaccine antibody titers, so it’s recommended to wait for 3-6 months off IVIg before testing.
Genetic testing for PID has become a lot simpler and more affordable. Numerous companies have developed test kits featuring relatively small panels of selected genes of interest. Dr. Postolova often uses Invitae, a Bay Area company that has a 207-gene panel covered by most insurers with an out-of-pocket cost to the patient of $250.
“Upfront when I have a complicated patient where I am concerned about the possibility of immunodeficiency, I will ask if that’s something they can afford and if they want to move forward with it. Also, Invitae has a patient assistance program. I’ve found this helpful in some of my very complicated patients,” she said.
Get to know your local allergist/immunologist
Many allergist/immunologists have overcome their traditional reservations about immunosuppressing an immunosuppressed individual and are now treating PID/autoimmune disease–overlap patients with the very drugs rheumatologists use every day, including standard DMARDs, rituximab, abatacept, anakinra, and tumor necrosis factor inhibitors.
“I encourage you to work with your allergist/immunologist for these patients because they’re going to need help,” according to Dr. Postolova. “The people in this room are the most equipped to treat the overlap patients because allergists and immunologists don’t really have the training to use these drugs. A lot of them do use them, but you have a better handle on these drugs than other people.”
Dr. Postolova reported having no financial conflicts regarding her presentation.
MAUI, HAWAII – An underlying primary immunodeficiency is far more common among patients in rheumatologists’ offices than is generally appreciated, Anna Postolova, MD, said at the 2020 Rheumatology Winter Clinical Symposium.
“Autoimmunity and immunodeficiency are often incorrectly thought to be mutually exclusive, but I hope to convey to you that they actually run together more than we think, and more than you realize. In the immunodeficiency community, we’re now realizing that autoimmunity can be the first presentation of an immunodeficiency disease,” according to Dr. Postolova, a dual rheumatologist and allergist/immunologist at Stanford (Calif.) University.
She cited a major retrospective study of 2,183 consecutive patients with primary immunodeficiencies (PIDs), mean age 25.8 years, enrolled in a French national PID registry. Of these patients, 26% had at least one autoimmune or inflammatory condition. The French investigators, all immunologists, categorized 12.8% of the PID patients as having rheumatologic disorders, but Dr. Postolova is convinced this figure would have been substantially higher had a rheumatologist been on the research team. That’s because vasculitis and inflammatory eye disorders weren’t included in the rheumatologic disease category, and psoriatic arthritis was probably present but undiagnosed in some psoriasis patients grouped in the skin disease category.
“Our results demonstrate that autoimmune and inflammatory diseases are much more frequent by a factor of at least 10 in patients with PIDs than in the general population,” the French investigators observed.
Indeed, the relative risks of vasculitis, inflammatory eye disease, and skin disease in patients with PID were increased 13-, 7-, and 10-fold, respectively. French children with PID were at 40-fold increased risk for rheumatoid arthritis and 80-fold elevated risk for inflammatory bowel disease.
Among the PID patients with at least one autoimmune or inflammatory condition, 31.6% had more than one. And therein lies a clue for rheumatologists.
“You might have some patients in your panel who have both arthritis and vasculitis, for example. It’s not that common for our patients to have two of our diseases, but those are the ones who might have an immune dysregulatory inborn error of metabolism mutation that’s driving their disease – and we’re now able to look into that,” Dr. Postolova explained.
At present, more than 300 identified single-gene inborn errors of immunity have been identified, some of which can manifest variously as systemic lupus erythematosus (SLE), arthritis, vasculitis, and/or cytopenias, she noted.
In the French study, onset of autoimmune or inflammatory manifestations of PID occurred across the age spectrum. The age of onset was earlier with T-cell and innate immunity deficiencies than in patients with B-cell deficiencies. The prevalence of an autoimmune or inflammatory disorder was greater than 40% in PID patients age 50 years or older.
“What I want to hammer home is these patients with PID are no longer succumbing to their infections. They’re being identified as having an immunodeficiency, they’re going on antibiotics, they’re strictly monitored, and they’re growing older. And as their aberrant immune system fights an infection, they have more and more time to dysregulate and develop one of our diseases. So in the coming years I think you’re going to see a lot more of these patients show up in your rheumatology clinic because they are getting older,” Dr. Postolova said.
Red flags for underlying PID
Recurrent infections are a hallmark of PIDs. And mutations that cause increased infections can alter central and peripheral tolerance, affecting cell growth, signaling, and survival, which in turn affects immunity.
“As we use biologics in our patients with rheumatologic diseases, I think there’s a cohort of patients we’re starting to identify who are getting very serious recurrent infections. It’s not every patient. But that patient who’s had three or four serious infections, that’s the patient who I think we’ll be able to identify in our clinics through an immunodeficiency evaluation. Likewise, the patients who are not responding to multiple different drugs, that’s where I’d stop and think about an underlying immune deficiency,” she said.
A show of hands indicated only about 25% of her audience of rheumatologists routinely ask new patients if they have a personal or family history of recurrent infections. That should be routine practice, in Dr. Postolova’s view. The 10 warning signs of PID for adults put forth by the Jeffrey Modell Foundation focus on a family or personal history of recurrent ear or sinus infections, deep skin abscesses, pneumonia, viral infections, persistent thrush, or chronic diarrhea with weight loss.
Testing for PID
It’s “absolutely appropriate” to start a work-up for suspected immunodeficiency in a rheumatology clinic, according to Dr. Postolova.
“I think every allergist/immunologist would be grateful if you can just order a quantitative immunoglobulin panel as well as specific antibody titer responses to tetanus, diphtheria, pneumococcal vaccine, and an IgG subclass analysis. That’s half of an immunologist’s initial assessment,” she said.
Corticosteroids and other disease-modifying antirheumatic drugs (DMARDs) affect flow cytometry test results. It’s best to hold off on testing until after a patient has been off therapy for 2-3 months. Similarly, treatment with intravenous immunoglobulin (IVIg) will confound measurement of vaccine antibody titers, so it’s recommended to wait for 3-6 months off IVIg before testing.
Genetic testing for PID has become a lot simpler and more affordable. Numerous companies have developed test kits featuring relatively small panels of selected genes of interest. Dr. Postolova often uses Invitae, a Bay Area company that has a 207-gene panel covered by most insurers with an out-of-pocket cost to the patient of $250.
“Upfront when I have a complicated patient where I am concerned about the possibility of immunodeficiency, I will ask if that’s something they can afford and if they want to move forward with it. Also, Invitae has a patient assistance program. I’ve found this helpful in some of my very complicated patients,” she said.
Get to know your local allergist/immunologist
Many allergist/immunologists have overcome their traditional reservations about immunosuppressing an immunosuppressed individual and are now treating PID/autoimmune disease–overlap patients with the very drugs rheumatologists use every day, including standard DMARDs, rituximab, abatacept, anakinra, and tumor necrosis factor inhibitors.
“I encourage you to work with your allergist/immunologist for these patients because they’re going to need help,” according to Dr. Postolova. “The people in this room are the most equipped to treat the overlap patients because allergists and immunologists don’t really have the training to use these drugs. A lot of them do use them, but you have a better handle on these drugs than other people.”
Dr. Postolova reported having no financial conflicts regarding her presentation.
EXPERT ANALYSIS FROM RWCS 2020
Steven, Linda, and predictive processing
Steven, a 45-year-old engineer, and Linda, a 40-year-old data processor, have been married for 12 years and have a 10-year-old child. In 2018, Steven was fired from his job after he exploded at his boss, who he felt had gone out of his way to humiliate Steven.
He was having difficulty finding a new job. Linda had to pick up extra hours at work and became annoyed with Steven. “What do you do all day? Why can’t you finish all these half-done house projects? What is the matter with you?” Linda felt that he was only half-heartedly looking for a new job and wondered whether he preferred letting her be the breadwinner and the boss.
Steven agreed to seek individual therapy to assuage his wife’s concerns. After several sessions, Steven realized that his father had criticized him in a way similar to the way his wife did, and that this was similar to his perception of his former boss. He began to discuss his parents’ backgrounds to try to understand their behavior. Steven began to change his behavior, looking for work more seriously and finishing up home projects. However, Linda did not accept that these changes were “real” and continued to berate him. She stated that he was doing this only temporarily to appease his therapist. Steven tried to explain why he had changed, with descriptions of his father’s behavior toward him. Months went by, and despite securing an interview for a job and having finished the projects at home, Linda remained steadfast in denying his change. Steven and Linda were referred to couples therapy.
In the first session, Steven complained that Linda had to have everything done exactly her way, and he opined that she liked to be the dominant force in the relationship. Linda countered with: “One time on TV there was this woman complaining about the glass ceiling.” Meanwhile, he said things such as “women seem to think that men work because they like to work.” She countered: “I think he got himself fired on purpose!”
Predictive models
Linda had formed a mental model of her husband based on her experience of his repetitive behavior over the 15 years that they had known each other. She had long ago decided that she needed to nag him to get him to do anything productive. This had occurred early in their relationship, and it was her fixed belief about her husband.
Steven entered their relationship believing that Linda would be critical of him, regardless of what he did. This belief was not a conscious belief, more of an expectation based on his prior relationship with his father. He ignored her nagging until it became so persistent than he would eventually do what she asked. When Steven began to resolve his anger toward his father more effectively, he became less begrudging of others and more self-motivated. Linda’s continued nagging made Steven wonder whether it was “worth it” to make self-improvement changes, as Linda did not appreciate his efforts to change.
When we get to “know someone” in a coupled relationship, our experience of the other person falls into predictive patterns. We expect the “usual” responses from them: We “know” how they will respond. This predictability makes it easy for us to understand the other person, so that we do not have to continually analyze and reanalyze each utterance or behavior as a new experience.
Steven’s predictive model of Linda reflects his predictive model of the other as indicative of the fact that he will be always berated. He, at some level, expects others to berate him. Linda prefers to maintain her current model of her husband and believe that his changes are not real, rather than do the work of changing her internal model – work that she does not think is necessary. In their couples therapy, predictive modeling “explains” how Linda and Steven use their internal models of each other to direct their interactions.
Couples therapy helps them describe the change they both want. As Linda approaches Steven, her internal model must now change to incorporate his new interactional style. Of course, she will be suspicious that he might “relapse.” But understanding that he desires to interact with her in this new way, and that she actually would prefer to stop nagging him, helps her to develop a new model of interaction with him.
Relational theories are numerous: Why add one more?
Predictive processing is a paradigm shift in psychiatry. This shift moves psychiatry away from psychodynamic explanations of behavior to explanations that are brain based. Psychodynamic explanations are how our prior experiences in the world get played out in the current world. Predictive processing explains how the brain incorporates the dynamics of child rearing and prior relational interactions into internal models that we use to reduce the work of repeatedly reinterpreting people’s behavior.
The historical explanations that create internal models are interesting, especially to Steven, who felt there was a connection between his prior experiences and his current experiences. Acknowledging the psychodynamic cause is helpful, but it is the how of relational change that is the work of couples therapy.
The positives of predictive modeling
or built a certain way or that the other person lacks the will to change. A neuroscience-based visualization of our internal models of other people helps us more neutrally describe the iterative process that occurs. Other systemic family models use their own languages to achieve the same end, but as Carlos E. Sluzki, MD, opines: We need to update our models to keep up with the times!
Dr. Heru is professor of psychiatry at the University of Colorado at Denver, Aurora. She is editor of “Working With Families in Medical Settings: A Multidisciplinary Guide for Psychiatrists and Other Health Professionals” (Routledge, 2013). She has no conflicts of interest to disclose. The case, which was changed to protect patients’ confidentiality, was provided by David M. Allen, MD, professor of psychiatry emeritus at the University of Tennessee Health Science Center, Memphis. Dr. Allen is author of three books, “Coping with Critical, Demanding, and Dysfunctional Parents” (New Harbinger Publications, 2018); “How Dysfunctional Families Spur Mental Disorders” (Praeger, 2010); and “Psychotherapy with Borderline Patients: An Integrated Approach” (Lawrence Erlbaum Associates, 2003).
References
Friston K. Entropy (Basel). 2012 Nov;14(11):2100-21.
Sluzki CE. Fam Process. 2007;46(2):173-84.