User login
Waiting for the COVID 19 vaccine, or not?
A shot of relief. A shot of hope. Those are the words used to describe COVID-19 vaccines on a television commercial running in prime time in Kentucky.
“We all can’t get the vaccine at once,” the announcer says solemnly, “but we’ll all get a turn.”
For some of us, that turn came quickly. In December, the Advisory Committee on Immunization Practices recommended that health care personnel (HCP) and long-term care facility residents be the first to be immunized with COVID-19 vaccines (see table). 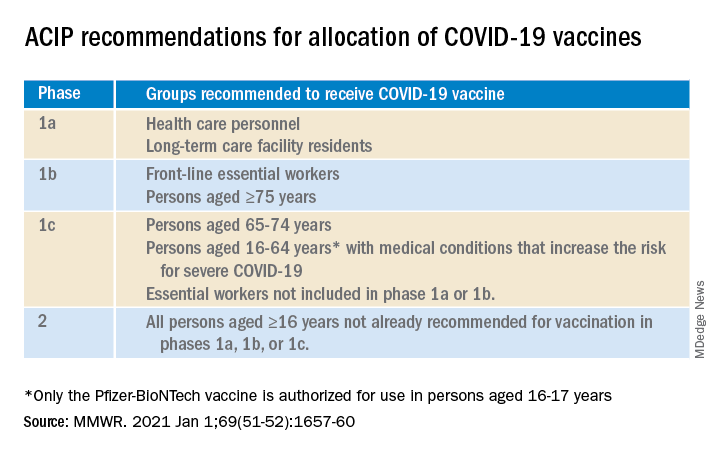
On Dec. 14, 2020, Sandra Lindsay, a nurse and director of patient care services in the intensive care unit at Long Island Jewish Medical Center, was the first person in the United States to receive a COVID-19 vaccine outside a clinical trial.
In subsequent days, social media sites were quickly flooded with photos of HCP rolling up their sleeves or flashing their immunization cards. There was jubilation ... and perhaps a little bit of jealousy. There were tears of joy and some tears of frustration.
There are more than 21 million HCP in the United States and to date, there have not been enough vaccines nor adequate infrastructure to immunize all of them. According to the Centers for Disease Control and Prevention Data Tracker, as of Jan. 7, 2021, 21,419,800 doses of vaccine had been distributed to states to immunize everyone identified in phase 1a, but only 5,919,418 people had received a first dose. Limited supply has necessitated prioritization of subgroups of HCP; those in the front of the line have varied by state, and even by hospital or health care systems within states. Both the American Academy of Pediatrics and the American Academy of Family Physicians have noted that primary care providers not employed by a hospital may have more difficulty accessing vaccine.

The mismatch between supply and demand has created an intense focus on improving supply and distribution. Soon though, we’re going to shift our attention to how we increase demand. We don’t have good data on those who being are offered COVID-19 vaccine and declining, but several studies that predate the Emergency Use Authorization for the Pfizer-BioNTech and Moderna vaccines suggest significant COVID-19 vaccine hesitancy among adults in the United States.
One large, longitudinal Internet-based study of U.S. adults found that the proportion who reported they were “somewhat or very likely” to receive COVID-19 vaccine declined from 74% in early April to 56% in early December.
In the Understanding America Study, self-reported likelihood of being vaccinated with COVID-19 vaccine was lower among Black compared to White respondents (38% vs. 59%; aRR, 0.7 [95% confidence interval, 0.6-0.8]), and lower among women compared to men (51% vs. 62%; aRR, 0.9 [95% CI, 0.8-0.9]). Those 65 years of age and older were more likely to report a willingness to be vaccinated than were those 18-49 years of age, as were those with at least a bachelor’s degree compared to those with a high school education or less.
A study conducted by the Pew Research Center in November – before any COVID-19 vaccines were available – found that only 60% of American adults said they would “definitely or probably get a vaccine for coronavirus” if one were available. That was an increase from 51% in September, but and overall decrease of 72% in May. Of the remaining 40%, just over half said they did not intend to get vaccinated and were “pretty certain” that more information would not change their minds.
Concern about acquiring a serious case of COVID-19 and trust in the vaccine development process were associated with an intent to receive vaccine, as was a personal history of receiving a flu shot annually. Willingness to be vaccinated varied by age, race, and family income, with Black respondents, women, and those with a lower family incomes less likely to accept a vaccine.
To date, few data are available about HCP and willingness to receive COVID-19 vaccine. A preprint posted at medrxiv.org reports on a cross-sectional study of more than 3,400 HCP surveyed between Oct. 7 and Nov. 9, 2020. In that study, only 36% of respondents voiced a willingness to be immunized as soon as vaccine is available. Vaccine acceptance increased with increasing age, income level, and education. As in other studies, self-reported willingness to accept vaccine was lower in women and Black individuals. While vaccine acceptance was higher in direct medical care providers than others, it was still only 49%.
So here’s the paradox: Even as limited supplies of vaccine are available and many are frustrated about lack of access, we need to promote the value of immunization to those who are hesitant. Pediatricians are trusted sources of vaccine information and we are in a good position to educate our colleagues, our staff, the parents of our patients and the community at-large.
A useful resource for those ready to take that step it is the CDC’s COVID-19 Vaccination Communication Toolkit. While this collection is designed to build vaccine confidence and promote immunization among health care providers, many of the strategies will be easily adapted for use with patients.
It’s not clear when we might have a COVID 19 vaccine for most children. The Pfizer-BioNTech vaccine emergency use authorization includes those as young as 16 years of age, and 16- and 17-year-olds with high risk medical conditions are included in phase 1c of vaccine allocation. Pfizer is currently enrolling children as young as 12 years of age in clinical trials, and Moderna and Janssen are poised to do the same. It is conceivable but far from certain that we could have a vaccine for children late this year. Are parents going to be ready to vaccinate their children?
Limited data about parental acceptance of vaccine for their children mirrors what was seen in the Understanding America Study and the Pew Research Study. In December 2020, the National Parents Union surveyed 1,008 parents of public school students enrolled in kindergarten through 12th grade. Sixty percent of parents said they would allow their children to receive a COVID-19 vaccine, while 25% would not and 15% were unsure. This suggests that now is the time to begin building vaccine confidence with parents. One conversation starter might be, “I am going to be vaccinated as soon as the vaccine is available.” Ideally, many of you will soon be able to say what I do: “I am excited to tell you that I have been immunized with the COVID-19 vaccine. I did this to protect myself, my family, and our community. I’m hopeful that vaccine will soon be available for all of us.”
Dr. Bryant is a pediatrician specializing in infectious diseases at the University of Louisville (Ky.) and Norton Children’s Hospital, also in Louisville. She said she had no relevant financial disclosures. Email her at [email protected].
A shot of relief. A shot of hope. Those are the words used to describe COVID-19 vaccines on a television commercial running in prime time in Kentucky.
“We all can’t get the vaccine at once,” the announcer says solemnly, “but we’ll all get a turn.”
For some of us, that turn came quickly. In December, the Advisory Committee on Immunization Practices recommended that health care personnel (HCP) and long-term care facility residents be the first to be immunized with COVID-19 vaccines (see table).
On Dec. 14, 2020, Sandra Lindsay, a nurse and director of patient care services in the intensive care unit at Long Island Jewish Medical Center, was the first person in the United States to receive a COVID-19 vaccine outside a clinical trial.
In subsequent days, social media sites were quickly flooded with photos of HCP rolling up their sleeves or flashing their immunization cards. There was jubilation ... and perhaps a little bit of jealousy. There were tears of joy and some tears of frustration.
There are more than 21 million HCP in the United States and to date, there have not been enough vaccines nor adequate infrastructure to immunize all of them. According to the Centers for Disease Control and Prevention Data Tracker, as of Jan. 7, 2021, 21,419,800 doses of vaccine had been distributed to states to immunize everyone identified in phase 1a, but only 5,919,418 people had received a first dose. Limited supply has necessitated prioritization of subgroups of HCP; those in the front of the line have varied by state, and even by hospital or health care systems within states. Both the American Academy of Pediatrics and the American Academy of Family Physicians have noted that primary care providers not employed by a hospital may have more difficulty accessing vaccine.
The mismatch between supply and demand has created an intense focus on improving supply and distribution. Soon though, we’re going to shift our attention to how we increase demand. We don’t have good data on those who being are offered COVID-19 vaccine and declining, but several studies that predate the Emergency Use Authorization for the Pfizer-BioNTech and Moderna vaccines suggest significant COVID-19 vaccine hesitancy among adults in the United States.
One large, longitudinal Internet-based study of U.S. adults found that the proportion who reported they were “somewhat or very likely” to receive COVID-19 vaccine declined from 74% in early April to 56% in early December.
In the Understanding America Study, self-reported likelihood of being vaccinated with COVID-19 vaccine was lower among Black compared to White respondents (38% vs. 59%; aRR, 0.7 [95% confidence interval, 0.6-0.8]), and lower among women compared to men (51% vs. 62%; aRR, 0.9 [95% CI, 0.8-0.9]). Those 65 years of age and older were more likely to report a willingness to be vaccinated than were those 18-49 years of age, as were those with at least a bachelor’s degree compared to those with a high school education or less.
A study conducted by the Pew Research Center in November – before any COVID-19 vaccines were available – found that only 60% of American adults said they would “definitely or probably get a vaccine for coronavirus” if one were available. That was an increase from 51% in September, but and overall decrease of 72% in May. Of the remaining 40%, just over half said they did not intend to get vaccinated and were “pretty certain” that more information would not change their minds.
Concern about acquiring a serious case of COVID-19 and trust in the vaccine development process were associated with an intent to receive vaccine, as was a personal history of receiving a flu shot annually. Willingness to be vaccinated varied by age, race, and family income, with Black respondents, women, and those with a lower family incomes less likely to accept a vaccine.
To date, few data are available about HCP and willingness to receive COVID-19 vaccine. A preprint posted at medrxiv.org reports on a cross-sectional study of more than 3,400 HCP surveyed between Oct. 7 and Nov. 9, 2020. In that study, only 36% of respondents voiced a willingness to be immunized as soon as vaccine is available. Vaccine acceptance increased with increasing age, income level, and education. As in other studies, self-reported willingness to accept vaccine was lower in women and Black individuals. While vaccine acceptance was higher in direct medical care providers than others, it was still only 49%.
So here’s the paradox: Even as limited supplies of vaccine are available and many are frustrated about lack of access, we need to promote the value of immunization to those who are hesitant. Pediatricians are trusted sources of vaccine information and we are in a good position to educate our colleagues, our staff, the parents of our patients and the community at-large.
A useful resource for those ready to take that step it is the CDC’s COVID-19 Vaccination Communication Toolkit. While this collection is designed to build vaccine confidence and promote immunization among health care providers, many of the strategies will be easily adapted for use with patients.
It’s not clear when we might have a COVID 19 vaccine for most children. The Pfizer-BioNTech vaccine emergency use authorization includes those as young as 16 years of age, and 16- and 17-year-olds with high risk medical conditions are included in phase 1c of vaccine allocation. Pfizer is currently enrolling children as young as 12 years of age in clinical trials, and Moderna and Janssen are poised to do the same. It is conceivable but far from certain that we could have a vaccine for children late this year. Are parents going to be ready to vaccinate their children?
Limited data about parental acceptance of vaccine for their children mirrors what was seen in the Understanding America Study and the Pew Research Study. In December 2020, the National Parents Union surveyed 1,008 parents of public school students enrolled in kindergarten through 12th grade. Sixty percent of parents said they would allow their children to receive a COVID-19 vaccine, while 25% would not and 15% were unsure. This suggests that now is the time to begin building vaccine confidence with parents. One conversation starter might be, “I am going to be vaccinated as soon as the vaccine is available.” Ideally, many of you will soon be able to say what I do: “I am excited to tell you that I have been immunized with the COVID-19 vaccine. I did this to protect myself, my family, and our community. I’m hopeful that vaccine will soon be available for all of us.”
Dr. Bryant is a pediatrician specializing in infectious diseases at the University of Louisville (Ky.) and Norton Children’s Hospital, also in Louisville. She said she had no relevant financial disclosures. Email her at [email protected].
U.S. cancer death rates drop for second year in a row
The study was published online Jan. 12 in CA: A Cancer Journal for Clinicians.
“Mortality rates are a better indicator of progress against cancer than incidence or survival because they are less affected by biases resulting from changes in detection practices,” wrote the authors, led by Rebecca Siegel, MPH, American Cancer Society, Atlanta.
“The overall drop of 31% as of 2018 [since the early 1990s] translates to an estimated 3,188,500 fewer cancer deaths (2,170,700 in men and 1,017,800 in women) than what would have occurred if mortality rates had remained at their peak,” the researchers added.
Lung cancer accounted for 46% of the total decline in cancer mortality in the past 5 years, with a record, single-year drop of 2.4% between 2017 and 2018.
The recent and rapid reductions in lung cancer mortality reflect better treatments for NSCLC, the authors suggested. For example, survival rates at 2 years have increased from 34% for patients diagnosed with NSCLC between 2009 and 2010 to 42% for those diagnosed during 2015 and 2016 – an absolute gain of 5%-6% in survival odds for every stage of diagnosis.
On a more somber note, the authors warned that COVID-19 is predicted to have a negative impact on both the diagnosis and outcomes of patients with cancer in the near future.
“We anticipate that disruptions in access to cancer care in 2020 will lead to downstream increases in advanced stage diagnoses that may impede progress in reducing cancer mortality rates in the years to come,” Ms. Siegel said in a statement.
New cancer cases
The report provides an estimated number of new cancer cases and deaths in 2021 in the United States (nationally and state-by-state) based on the most current population-based data for cancer incidence through 2017 and for mortality through 2018. “An estimated 608,570 Americans will die from cancer in 2021, corresponding to more than 1600 deaths per day,” Ms. Siegel and colleagues reported.
The greatest number of deaths are predicted to be from the most common cancers: Lung, prostate, and colorectal cancer in men and lung, breast, and colorectal cancer in women, they added. However, the mortality rates for all four cancers are continuing to fall.
As of 2018, the death rate from lung cancer had dropped by 54% among males and by 30% among females over the past few decades, the investigators noted.
Mortality from female breast cancer has dropped by 41% since 1989; by 52% for prostate cancer since 1993; and by 53% and 59% for colorectal cancer for men (since 1980) and women (since 1969), respectively.
“However, in recent years, mortality declines have slowed for breast cancer and [colorectal cancer] and have halted for prostate cancer,” the researchers noted.
In contrast, the pace of the annual decline in lung cancer mortality doubled among men from 3.1% between 2009 and 2013 to 5.5% between 2014 and 2018, and from 1.8% to 4.4% among women during the same time intervals.
Increase in incidence at common sites
Despite the steady progress in mortality for most cancers, “rates continue to increase for some common sites,” Ms. Siegel and colleagues reported.
For example, death rates from uterine corpus cancer have accelerated from the late 1990s at twice the pace of the increase in its incidence. Death rates also have increased for cancers of the oral cavity and pharynx – although in this cancer, increases in mortality parallel an increase in its incidence.
“Pancreatic cancer death rates [in turn] continued to increase slowly in men ... but remained stable in women, despite incidence [rates] rising by about 1% per year in both sexes,” the authors observed.
Meanwhile, the incidence of cervical cancer, although declining for decades overall, is increasing for patients who present with more distant-stage disease as well as cervical adenocarcinoma, both of which are often undetected by cytology.
“These findings underscore the need for more targeted efforts to increase both HPV [human papillomavirus] vaccination among all individuals aged [26 and younger] and primary HPV testing or HPV/cytology co-testing every 5 years among women beginning at age 25,” the authors emphasized.
On a more positive note, the long-term increase in mortality from liver cancer has recently slowed among women and has stabilized among men, they added.
Once again, disparities in both cancer occurrence and outcomes varied considerably between racial and ethnic groups. For example, cancer is the leading cause of death in people who are Hispanic, Asian American, and Alaska Native. Survival rates at 5 years for almost all cancers are still higher for White patients than for Black patients, although the disparity in cancer mortality between Black persons and White persons has declined to 13% from a peak of 33% in 1993.
Geographic disparities in cancer mortality rates still prevail; the rates are largest for preventable cancers such as lung and cervical cancer, for which mortality varies by as much as fivefold across states.
And although cancer remains the second most common cause of death among children, death rates from cancer have continuously declined over time among both children and adolescents, largely the result of dramatic declines in death rates from leukemia in both age groups.
The study authors have disclosed no relevant financial relationships.
A version of this article first appeared on Medscape.com.
Asthma-COPD overlap: Patients have high disease burden
Patients with asthma–chronic obstructive pulmonary disease overlap (ACO) experienced a higher burden of disease than patients with either asthma or COPD alone, a recent study has found.
Approximately 20% of chronic obstructive airway disease cases are ACO, but data on these patients are limited, as they are often excluded from clinical trials, wrote Sarah A. Hiles, MD, of the University of Newcastle (Australia) and colleagues.
“Comparing the burden of eosinophilic ACO, eosinophilic severe asthma, and eosinophilic COPD may also help contextualize findings from phenotype-targeted treatments in different diagnostic groups, such as the limited success of anti-IL [interleukin]–5 monoclonal antibodies as therapy in eosinophilic COPD,” they said.
In a cross-sectional, observational study published in Respirology the researchers recruited patients aged 18 years and older with a confirmed diagnosis of COPD only (153) severe asthma only (64), or ACO (106). Patients were assessed for demographic and clinical factors including health-related quality of life, past-year exacerbation, and other indicators of disease burden. In addition, patients were identified as having eosinophilic airway disease based on a blood eosinophil count of at least 0.3x10⁹/L.
Overall, eosinophilic airway disease was present in 41% of the patients; 55%, 44%, and 29% for those with ACO, severe asthma, and COPD, respectively. Reports of poor health-related quality of life and past-year exacerbations were similar for eosinophilic patients across all three conditions.
However, patients with eosinophilic ACO experienced significantly more past-year exacerbations, notably those requiring oral corticosteroids, compared with patients with asthma alone. In addition, the cumulative number of past-year exacerbations in patient with eosinophilic disease was 164 in those with ACO, compared with severe asthma alone (44) and COPD alone (59).
Patients with ACO also had significantly higher disease burden based on the St. George’s Respiratory Questionnaire (SGRQ), which assessed functional limitation. “For 100 patients, the cumulative SGRQ score attributable to eosinophilic airways disease in ACO was 2,872.8, which was higher than in severe asthma (1,942.5) or COPD (1,638.1),” the researchers said.
The study was limited by several factors including the cross-sectional design and use of a single measurement to classify eosinophilia, the researchers noted. “The non-eosinophilic group likely included a mix of patients with treated eosinophilia and patients without eosinophilia, regardless of treatment, which is a limitation to consider when interpreting the disease burden estimates in this group,” they added.
However, the results add to the understanding of blood eosinophils in airway disease and the study “supports eosinophilia as a phenotype that spans across disease labels of severe asthma and COPD, and their overlap,” they concluded.
The study was supported by AstraZeneca; lead author Dr. Hiles received a salary through a grant from AstraZeneca to the University of Newcastle while conducting the study. Other coauthors disclosed relationships with companies including AstraZeneca, GlaxoSmithKline, Menarini, and Novartis.
FROM RESPIROLOGY
CVD deaths rose, imaging declined during pandemic
While the direct toll of the COVID-19 pandemic is being tallied and shared on the nightly news, the indirect effects will undoubtedly take years to fully measure.

In two papers published online Jan. 11 in the Journal of the American College of Cardiology, researchers have started the process of quantifying the impact of the pandemic on the care of patients with cardiovascular disease (CVD).
In the first study, Rishi Wadhera, MD, MPP, MPhil, and colleagues from the Beth Israel Deaconess Medical Center and Harvard Medical School in Boston examined population-level data to determine how deaths from cardiovascular causes changed in the United States in the early months of the pandemic relative to the same periods in 2019.
In a second paper, Andrew J. Einstein, MD, PhD, from Columbia University Irving Medical Center/New York–Presbyterian Hospital and colleagues looked at the pandemic’s international impact on the diagnosis of heart disease.
Using data from the National Center for Health Statistics, Dr. Wadhera and colleagues compared death rates from cardiovascular causes in the United States from March 18, 2020, to June 2, 2020, (the first wave of the pandemic) and from Jan. 1, 2020, to March 17, 2020, (the period just before the pandemic started) and compared them to the same periods in 2019. ICD codes were used to identify underlying causes of death.
Relative to 2019, they found a significant increase in deaths from ischemic heart disease nationally (1.11; 95% confidence interval, 1.04-1.18), as well as an increase in deaths caused by hypertensive disease (1.17; 95% CI, 1.09-1.26). There was no apparent increase in deaths from heart failure, cerebrovascular disease, or other diseases of the circulatory system.
When they looked just at New York City, the area hit hardest during the early part of the pandemic, the relative increases in deaths from ischemic heart disease were more pronounced.
Deaths from ischemic heart disease or hypertensive diseases jumped 139% and 164%, respectively, between March 18, 2020, and June 2, 2020.
More modest increases in deaths were seen in the remainder of New York state, New Jersey, Michigan and Illinois, while Massachusetts and Louisiana did not see a change in cardiovascular deaths.
Several studies from different parts of the world have indicated a 40%-50% drop in hospitalization for myocardial infarction in the initial months of the pandemic, said Dr. Wadhera in an interview.
“We wanted to understand where did all the heart attacks go? And we worried that patients with urgent heart conditions were not seeking the medical care they needed. I think our data suggest that this may have been the case,” reported Dr. Wadhera.
“This very much reflects the reality of what we’re seeing on the ground,” he told this news organization. “After the initial surge ended, when hospital volumes began to return to normal, we saw patients come into the hospital who clearly had a heart attack during the surge months – and were now experiencing complications of that event – because they had initially not come into the hospital due to concerns about exposure to the virus.”
A limitation of their data, he stressed, is whether some deaths coded as CVD deaths were really deaths from undiagnosed COVID-19. “It’s possible that some portion of the increased deaths we observed really reflect the cardiovascular complications of undiagnosed COVID-19, because we know that testing was quite limited during the early first surge of cases.”
“I think that basically three factors – patients avoiding the health care system because of fear of getting COVID, health care systems being strained and overwhelmed leading to the deferral of cardiovascular care and semi-elective procedures, and the cardiovascular complications of COVID-19 itself – all probably collectively contributed to the rise in cardiovascular deaths that we observed,” said Dr. Wadhera.
In an accompanying editorial, Michael N. Young, MD, Geisel School of Medicine at Dartmouth, Lebanon, N.H., and colleagues write that these data, taken together with an earlier study showing an increase in out-of-hospital cardiac arrests at the pandemic peak in New York City, “support the notion of excess fatalities due to unattended comorbid illnesses.” That said, attribution of death in the COVID era “remains problematic.”
In the second article, Andrew Einstein, MD, PhD, and the INCAPS COVID Investigators Group took a broader approach and looked at the impact of COVID-19 on cardiac diagnostic procedures in over 100 countries.
The INCAPS (International Atomic Energy Agency Noninvasive Cardiology Protocols Study) group has for the past decade conducted numerous studies addressing the use of best practices and worldwide practice variation in CVD diagnosis.
For this effort, they sent a survey link to INCAPS participants worldwide, ultimately including 909 survey responses from 108 countries in the final analysis.
Compared with March 2019, overall procedure volume decreased 42% in March 2020 and 64% in April 2020.
The greatest decreases were seen in stress testing (78%) and transesophageal echocardiography (76%), both procedures, noted Dr. Einstein, associated with a greater risk of aerosolization.
“Whether as we reset after COVID we return to the same place in terms of the use of cardiovascular diagnostic testing remains to be seen, but it certainly poses an opportunity to improve our utilization of various modes of testing,” said Dr. Einstein.
Using regression analysis, Dr. Einstein and colleagues were able to see that sites located in low-income and lower-middle-income countries saw an additional 22% reduction in cardiac procedures and less availability of personal protective equipment (PPE) and telehealth.
Fifty-two percent of survey respondents reported significant shortages of N95 masks early in the pandemic, with fewer issues in supplies of gloves, gowns, and face shields. Lower-income countries were more likely to face significant PPE shortages and less likely to be able to implement telehealth strategies to make up for reduced in-person care. PPE shortage itself, however, was not related to lower procedural volume on multivariable regression.
“It all really begs the question of whether there is more that the world can do to help out the developing world in terms of managing the pandemic in all its facets,” said Dr. Einstein in an interview, adding he was “shocked” to learn how difficult it was for some lower-income countries to get sufficient PPE.
Did shutdowns go too far?
Calling this a “remarkable study,” an editorial written by Darryl P. Leong, MBBS, PhD, John W. Eikelboom, MBBS, and Salim Yusuf, MBBS, DPhil, all from McMaster University, Hamilton, Ont., suggests that perhaps health systems in some places went too far in closing down during the first wave of the pandemic, naming specifically Canada, Eastern Europe, and Saudi Arabia as examples.
“Although these measures were taken to prepare for the worst, overwhelming numbers of patients with COVID-19 did not materialize during the first wave of the pandemic in these countries. It is possible that delaying so-called nonessential services may have been unnecessary and potentially harmful, because it likely led to delays in providing care for the treatment of serious non–COVID-19 illnesses.”
Since then, more experience and more data have largely allowed hospital systems to “tackle the ebb and flow” of COVID-19 cases in ways that limit shutdowns of important health services, they said.
Given the more pronounced effect in low- and middle-income countries, they stressed the need to focus resources on ways to promote prevention and treatment that do not rely on diagnostic procedures.
“This calls for more emphasis on developing efficient systems of telehealth, especially in poorer countries or in remote settings in all countries,” Dr. Leong and colleagues conclude.
Dr. Wadhera has reported research support from the National Heart, Lung, and Blood Institute, along with fellow senior author Robert W. Yeh, MD, MBA, who has also received personal fees and grants from several companies not related to the submitted work. Dr. Einstein, Dr. Leong, Dr. Eikelboom, and Dr. Yusuf have reported no relevant financial relationships.
A version of this article first appeared on Medscape.com.
While the direct toll of the COVID-19 pandemic is being tallied and shared on the nightly news, the indirect effects will undoubtedly take years to fully measure.
In two papers published online Jan. 11 in the Journal of the American College of Cardiology, researchers have started the process of quantifying the impact of the pandemic on the care of patients with cardiovascular disease (CVD).
In the first study, Rishi Wadhera, MD, MPP, MPhil, and colleagues from the Beth Israel Deaconess Medical Center and Harvard Medical School in Boston examined population-level data to determine how deaths from cardiovascular causes changed in the United States in the early months of the pandemic relative to the same periods in 2019.
In a second paper, Andrew J. Einstein, MD, PhD, from Columbia University Irving Medical Center/New York–Presbyterian Hospital and colleagues looked at the pandemic’s international impact on the diagnosis of heart disease.
Using data from the National Center for Health Statistics, Dr. Wadhera and colleagues compared death rates from cardiovascular causes in the United States from March 18, 2020, to June 2, 2020, (the first wave of the pandemic) and from Jan. 1, 2020, to March 17, 2020, (the period just before the pandemic started) and compared them to the same periods in 2019. ICD codes were used to identify underlying causes of death.
Relative to 2019, they found a significant increase in deaths from ischemic heart disease nationally (1.11; 95% confidence interval, 1.04-1.18), as well as an increase in deaths caused by hypertensive disease (1.17; 95% CI, 1.09-1.26). There was no apparent increase in deaths from heart failure, cerebrovascular disease, or other diseases of the circulatory system.
When they looked just at New York City, the area hit hardest during the early part of the pandemic, the relative increases in deaths from ischemic heart disease were more pronounced.
Deaths from ischemic heart disease or hypertensive diseases jumped 139% and 164%, respectively, between March 18, 2020, and June 2, 2020.
More modest increases in deaths were seen in the remainder of New York state, New Jersey, Michigan and Illinois, while Massachusetts and Louisiana did not see a change in cardiovascular deaths.
Several studies from different parts of the world have indicated a 40%-50% drop in hospitalization for myocardial infarction in the initial months of the pandemic, said Dr. Wadhera in an interview.
“We wanted to understand where did all the heart attacks go? And we worried that patients with urgent heart conditions were not seeking the medical care they needed. I think our data suggest that this may have been the case,” reported Dr. Wadhera.
“This very much reflects the reality of what we’re seeing on the ground,” he told this news organization. “After the initial surge ended, when hospital volumes began to return to normal, we saw patients come into the hospital who clearly had a heart attack during the surge months – and were now experiencing complications of that event – because they had initially not come into the hospital due to concerns about exposure to the virus.”
A limitation of their data, he stressed, is whether some deaths coded as CVD deaths were really deaths from undiagnosed COVID-19. “It’s possible that some portion of the increased deaths we observed really reflect the cardiovascular complications of undiagnosed COVID-19, because we know that testing was quite limited during the early first surge of cases.”
“I think that basically three factors – patients avoiding the health care system because of fear of getting COVID, health care systems being strained and overwhelmed leading to the deferral of cardiovascular care and semi-elective procedures, and the cardiovascular complications of COVID-19 itself – all probably collectively contributed to the rise in cardiovascular deaths that we observed,” said Dr. Wadhera.
In an accompanying editorial, Michael N. Young, MD, Geisel School of Medicine at Dartmouth, Lebanon, N.H., and colleagues write that these data, taken together with an earlier study showing an increase in out-of-hospital cardiac arrests at the pandemic peak in New York City, “support the notion of excess fatalities due to unattended comorbid illnesses.” That said, attribution of death in the COVID era “remains problematic.”
In the second article, Andrew Einstein, MD, PhD, and the INCAPS COVID Investigators Group took a broader approach and looked at the impact of COVID-19 on cardiac diagnostic procedures in over 100 countries.
The INCAPS (International Atomic Energy Agency Noninvasive Cardiology Protocols Study) group has for the past decade conducted numerous studies addressing the use of best practices and worldwide practice variation in CVD diagnosis.
For this effort, they sent a survey link to INCAPS participants worldwide, ultimately including 909 survey responses from 108 countries in the final analysis.
Compared with March 2019, overall procedure volume decreased 42% in March 2020 and 64% in April 2020.
The greatest decreases were seen in stress testing (78%) and transesophageal echocardiography (76%), both procedures, noted Dr. Einstein, associated with a greater risk of aerosolization.
“Whether as we reset after COVID we return to the same place in terms of the use of cardiovascular diagnostic testing remains to be seen, but it certainly poses an opportunity to improve our utilization of various modes of testing,” said Dr. Einstein.
Using regression analysis, Dr. Einstein and colleagues were able to see that sites located in low-income and lower-middle-income countries saw an additional 22% reduction in cardiac procedures and less availability of personal protective equipment (PPE) and telehealth.
Fifty-two percent of survey respondents reported significant shortages of N95 masks early in the pandemic, with fewer issues in supplies of gloves, gowns, and face shields. Lower-income countries were more likely to face significant PPE shortages and less likely to be able to implement telehealth strategies to make up for reduced in-person care. PPE shortage itself, however, was not related to lower procedural volume on multivariable regression.
“It all really begs the question of whether there is more that the world can do to help out the developing world in terms of managing the pandemic in all its facets,” said Dr. Einstein in an interview, adding he was “shocked” to learn how difficult it was for some lower-income countries to get sufficient PPE.
Did shutdowns go too far?
Calling this a “remarkable study,” an editorial written by Darryl P. Leong, MBBS, PhD, John W. Eikelboom, MBBS, and Salim Yusuf, MBBS, DPhil, all from McMaster University, Hamilton, Ont., suggests that perhaps health systems in some places went too far in closing down during the first wave of the pandemic, naming specifically Canada, Eastern Europe, and Saudi Arabia as examples.
“Although these measures were taken to prepare for the worst, overwhelming numbers of patients with COVID-19 did not materialize during the first wave of the pandemic in these countries. It is possible that delaying so-called nonessential services may have been unnecessary and potentially harmful, because it likely led to delays in providing care for the treatment of serious non–COVID-19 illnesses.”
Since then, more experience and more data have largely allowed hospital systems to “tackle the ebb and flow” of COVID-19 cases in ways that limit shutdowns of important health services, they said.
Given the more pronounced effect in low- and middle-income countries, they stressed the need to focus resources on ways to promote prevention and treatment that do not rely on diagnostic procedures.
“This calls for more emphasis on developing efficient systems of telehealth, especially in poorer countries or in remote settings in all countries,” Dr. Leong and colleagues conclude.
Dr. Wadhera has reported research support from the National Heart, Lung, and Blood Institute, along with fellow senior author Robert W. Yeh, MD, MBA, who has also received personal fees and grants from several companies not related to the submitted work. Dr. Einstein, Dr. Leong, Dr. Eikelboom, and Dr. Yusuf have reported no relevant financial relationships.
A version of this article first appeared on Medscape.com.
To fast or not? The new dieting dilemma
Cardiologist Ethan J. Weiss, MD, followed an intermittent-fasting diet for 7 years. He lost about 3.6 kg (8 lb) and began recommending the approach to friends and patients who wanted to lose weight.
“I liked the way the diet was so simple,” said Dr. Weiss, an associate professor at the Cardiovascular Research Institute, University of California, San Francisco. But he also felt “it was too good to be true because you can eat what you want as long as it’s within a narrow window.”
So when, last year, he conducted a randomized, controlled trial, TREAT, testing such an approach – eating during just 8 hours a day, fasting for the remaining 16 hours – versus an eating plan of three meals a day without restrictions, he was somewhat dismayed to find the group of people who fasted didn’t lose any more weight than the other group.
The approach used in this study is known as time-restricted eating. It involves designating periods of time within the day when people can consume whatever they want; they then “fast” at times outside those eating windows. Other methods include alternate-day fasting, or the well-known 5:2 diet. In the latter, people eat a “normal” amount of around 2,000 calories per day on 5 days of the week, but for the other 2 days, they restrict caloric intake to 500 calories per day.
Intermittent fasting is an umbrella term encompassing all of these different approaches.
Dr. Weiss’s work builds on more than a decade of research into this type of eating plan by scientists, including Krista Varady, PhD, professor of nutrition at the University of Illinois at Chicago, who presented an overview of her own studies last fall at the virtual annual meeting of the European Association for the Study of Diabetes.
Although much of the work has suggested that the shorter duration of eating period in this type of diet leads to lower calorie intake and weight loss while avoiding the need for the tedious calorie-counting of conventional diets, Dr. Weiss’s data – published last year – throws a spanner in the works and now complicates the evidence base.
A promise of simplicity: ‘All you have to do is watch the clock’
Dr. Varady said she, too, is intrigued by the simplicity of intermittent-fasting diets.
In 2018, Dr. Varady and colleagues tested the weight-loss efficacy of 12 weeks of time-restricted feeding in a pilot study of 23 people with obesity.
Participants were permitted an 8-hour eating window (10 a.m. to 6 p.m.) followed by water-only fasting of 16 hours (6 p.m. to 10 a.m.) the next day (sometimes referred to as the 16:8 diet). Researchers measured weight loss and fat mass, as well as metabolic parameters, and compared the active group with 23 matched-control participants who ate freely.
There were no restrictions on type or quantity of food consumed by the control group during the 8-hour period, but individuals in the time-restricted feeding group consumed around 350 calories less than the comparator group.
Dr. Varady thinks this is most likely because of the fact that people normally eat during a 14-hour window and time-restricted feeding cuts that down by 6 hours.
“One of the most beautiful things about time-restricted feeding is that it doesn’t require calorie monitoring,” she explained. “People get burnt out with having to constantly monitor calories. All you have to do is watch the clock.”
Adherence was quite high, she reported, although most people skipped 1 day, often a Saturday, likely because of social engagements.
Weight loss in the time-restricted feeding group was mild to moderate. After 3 months, mean body weight decreased by 2.6%, or approximately 3 kg (7-8 lb), relative to those who ate freely, but this was a significant difference (P < .05).
But the researchers observed little change in metabolic disease risk factors between the groups.
In the time-restricted feeding group, systolic blood pressure dropped from 128 mm Hg to 121 mm Hg over the 12-week period, which was significant relative to the control group (P < .05) but there were no significant changes in fasting glucose, fasting lipids, fasting insulin, or insulin resistance relative to the comparator group.
In contrast to Dr. Varady’s findings, Dr. Weiss’s randomized TREAT trial, which used a similar 16:8 period of time-restricted versus unrestricted eating in 116 individuals with overweight or obesity, did not find greater weight loss in the group restricted to eating within the 8-hour window.
As previously reported by this news organization, those who fasted for 16 hours of each day (n = 59) did lose some weight, compared with the control group (n = 57) over 12 weeks, but the difference in weight loss between the groups was not significant (−0.26 kg; P = .63).
And there were no significant differences in any of the secondary outcomes of fat mass, fasting insulin, fasting glucose, hemoglobin A1c levels, estimated energy intake, total energy expenditure, and resting energy expenditure between the time-restricted eating and regular feeding groups.
“I don’t claim time-restricted eating is dead,” Dr. Weiss said, “but the hope that you can eat for a limited time each day and solve metabolic disease is not there.”
Does the length of the eating window matter?
Following her pilot study of an 8-hour eating window, Dr. Varady conducted further research with 4- or 6-hour eating windows to see if even shorter periods would precipitate greater weight loss, ideally a clinically significant loss of 5% of body weight.
She ran a 2-month randomized, controlled study in people with obesity, published in 2020, which was the first to examine both a 4-hour (3 p.m. to 7 p.m.; n = 19) or 6-hour (1 p.m to 7 p.m.; n = 20) eating window versus a diet without any food restrictions as a control (n = 19) (Cell Metab. 2020;32:366-78.e3).
Dr. Varady explained that they decided to shift the eating window to later in the day for this trial (in contrast to the earlier 8-hour study) to allow people to eat dinner at a sociable time, and thereby hopefully reduce dropouts from the study.
“Unlike with alternate-day fasting, most people find time-restricted feeding easy to incorporate into their lifestyles,” she remarked.
Both the 4- and 6-hour eating window groups experienced a mean 3.2% body weight loss, compared with controls, and this correlated with a 550-calorie reduction in their daily consumption, compared with their baseline calorie intake.
In terms of other outcomes – and in contrast to the 8-hour window study which showed very little changed other than a minor decrease in blood pressure – researchers saw some changes in metabolic risk factors with the 4- and 6-hour eating windows, Dr. Varady reported.
Compared with the control group, fasting insulin decreased in both time-restricted feeding groups by a mean of 15% (P < .05). Insulin resistance also decreased by 25% in the 4-hour group and by 15% in the 6-hour group, compared with the control group. Fasting glucose did not change in either group, however.
The researchers did not observe any effect on blood pressure or plasma lipids in the 4- or 6-hour eating window groups, compared with controls. However, measures of oxidative stress and inflammation decreased in both groups versus controls by approximately 35% (P < .05).
“These findings suggest that this form of severe time-restricted feeding is achievable and can help adults with obesity lose weight, without having to count calories,” Dr. Varady and colleagues conclude.
Is intermittent fasting better for weight loss than calorie restriction?
Ultimately, if weight loss is the primary goal, many want to know how time-restricted feeding compares with conventional daily calorie restriction.
Back in 2017, Dr. Varady published a year-long randomized, controlled study that compared alternate-day fasting with a calorie-restriction diet and a conventional/usual diet among 100 participants with obesity who were otherwise healthy.
Participants on the alternate-day fasting plan (n = 34) consumed 500 calories on fasting days for the first 6 months for weight loss (approximately 25% of energy needs) followed by 125% of energy needs on alternating “feast days”. For an additional 6 months, they ate 1,000 calories on fasting days – aimed at weight maintenance.
Those following the calorie-restriction diet (n = 35) reduced energy intake by 25% (approximately 500 kcal) for the first 6 months for weight loss, followed by enough calories sufficient for weight maintenance (so no further loss nor gain).
However, the study showed alternate-day fasting did not produce better weight loss than conventional calorie counting.
“Over the first 6 months [during the weight-loss period] both groups lost an average of 6% body weight. After 12 months it crept back to 5% weight loss,” reported Dr. Varady.
“Realistically, if the study continued for 2 or 3 years, they probably would have regained much of their weight,” she admitted.
Dr. Varady suspects it might be better for the alternate-day fasting participants to continue eating only 500 calories on their fast day during the weight-loss maintenance period rather than increasing calorie intake during this phase.
Heart rate and blood pressure did not change in either group, while triglycerides decreased in the alternate-day fasting group, and LDL cholesterol decreased in the calorie-restriction group.
Glucose level decreased in the calorie-restriction group but not the alternate-day fasting group, and insulin and HOMA-IR were unaffected in both groups, reported Dr. Varady, noting that these findings were in healthy people with obesity.
In people with obesity and insulin resistance – evaluated as a subgroup in a separate study by Dr. Varady of alternate-day fasting versus daily calorie restriction published in 2019 – she noted that when insulin levels and HOMA-IR were measured, there was a greater reduction in both variables in the fasting group, compared with the calorie-restriction group.
“For people at risk of diabetes, maybe fasting produces more potent effects on glycemic control?” she ventured.
Who fares best with which fasting diets?
Summing up, Dr. Varady provided some practical pointers regarding who she feels is best suited to intermittent fasting and who should avoid it.
Those who binge eat, shift-workers, and frequent snackers do not do well with fasting, she said.
The first 10 days of intermittent fasting are rough, she pointed out, with the most common complaint being headaches.
“Eventually, people do feel an energy boost on fast days, and they say they concentrate better and have lots of energy. People won’t feel lethargic. Also, eating protein on fast days has been shown to keep hunger at bay.”
She cautiously concluded that weight loss with “alternate-day fasting” is quicker than some other methods, at 4.5-7 kg (10-15 lb) in 3 months, but is harder to follow and requires some calorie counting.
“In comparison, with time-restricted feeding, for which there have been very few ... studies to date, weight loss is slower at 2-4.5 kg (5-10 lb) in 3 months, but it is easier to follow and tolerable because you don’t need to count calories.”
Dr. Weiss has reported no relevant financial relationships. Dr. Varady has reported receiving author fees from Hachette for her book, “Every Other Day Diet.” (New York: Hachette, 2013)
A version of this article first appeared on Medscape.com.
Eliminating hepatitis by 2030: HHS releases new strategic plan
In an effort to counteract alarming trends in rising hepatitis infections, the U.S. Department of Health and Human Services has developed and released its Viral Hepatitis National Strategic Plan 2021-2025, which aims to eliminate viral hepatitis infection in the United States by 2030.
An estimated 3.3 million people in the United States were chronically infected with hepatitis B (HBV) and hepatitis C (HCV) as of 2016. In addition, the country “is currently facing unprecedented hepatitis A (HAV) outbreaks, while progress in preventing hepatitis B has stalled, and hepatitis C rates nearly tripled from 2011 to 2018,” according to the HHS.
The new plan, “A Roadmap to Elimination for the United States,” builds upon previous initiatives the HHS has made to tackle the diseases and was coordinated by the Office of the Assistant Secretary for Health through the Office of Infectious Disease and HIV/AIDS Policy.
The plan focuses on HAV, HBV, and HCV, which have the largest impact on the health of the nation, according to the HHS. The plan addresses populations with the highest burden of viral hepatitis based on nationwide data so that resources can be focused there to achieve the greatest impact. Persons who inject drugs are a priority population for all three hepatitis viruses. HAV efforts will also include a focus on the homeless population. HBV efforts will also focus on Asian and Pacific Islander and the Black, non-Hispanic populations, while HCV efforts will include a focus on Black, non-Hispanic people, people born during 1945-1965, people with HIV, and the American Indian/Alaska Native population.
Goal-setting
There are five main goals outlined in the plan, according to the HHS:
- Prevent new hepatitis infections.
- Improve hepatitis-related health outcomes of people with viral hepatitis.
- Reduce hepatitis-related disparities and health inequities.
- Improve hepatitis surveillance and data use.
- Achieve integrated, coordinated efforts that address the viral hepatitis epidemics among all partners and stakeholders.
“The United States will be a place where new viral hepatitis infections are prevented, every person knows their status, and every person with viral hepatitis has high-quality health care and treatment and lives free from stigma and discrimination. This vision includes all people, regardless of age, sex, gender identity, sexual orientation, race, ethnicity, religion, disability, geographic location, or socioeconomic circumstance,” according to the HHS vision statement.
NEWS FROM HHS
Overdiagnosis and overtreatment of COPD appears rampant
Background: COPD is a highly morbid disease, and there is a need for a better understanding of the true prevalence. Little is known regarding overdiagnosis of COPD. According to the Global Initiative for Chronic Obstructive Lung Disease (GOLD), airflow limitation by spirometry is a key criteria for diagnosis.

Study design: Population-based survey.
Setting: Altogether, 23 sites in 20 countries worldwide were included.
Synopsis: The Burden of Obstructive Lung Disease (BOLD) study recruited community-dwelling adults who underwent questionnaires, as well as spirometry. Of the 16,717 participants, 919 self-reported a COPD diagnosis. Of these, more than half were found to not meet obstructive lung disease criteria on spirometry, and therefore were misdiagnosed: 62% when defined as forced expiratory volume in 1 second to forced vital capacity (FEV1/FVC) ratio less than the lower limit of normal and 55% when using the GOLD definition of FEV1/FVC less than 0.7. After patients with reported asthma were excluded, 34% of participants with false-positive COPD were found to be treated with respiratory medications as outpatients.
Overdiagnosis of COPD was noted to be more prevalent in high-income countries than they were in low- to middle-income countries (4.9% versus 1.9% of the participants sampled).
The self-reporting of the diagnosis of COPD is a limitation of the study because it may have artificially inflated the rate of false positives.
Bottom line: Patient-reported diagnoses of COPD should be taken with a degree of caution because of high rates of overdiagnosis and overtreatment.
Citation: Sator L et al. Overdiagnosis of COPD in subjects with unobstructed spirometry. Chest. 2019 Aug;156(2):277-88.
Dr. Gordon is a hospitalist at Maine Medical Center in Portland.
Background: COPD is a highly morbid disease, and there is a need for a better understanding of the true prevalence. Little is known regarding overdiagnosis of COPD. According to the Global Initiative for Chronic Obstructive Lung Disease (GOLD), airflow limitation by spirometry is a key criteria for diagnosis.
Study design: Population-based survey.
Setting: Altogether, 23 sites in 20 countries worldwide were included.
Synopsis: The Burden of Obstructive Lung Disease (BOLD) study recruited community-dwelling adults who underwent questionnaires, as well as spirometry. Of the 16,717 participants, 919 self-reported a COPD diagnosis. Of these, more than half were found to not meet obstructive lung disease criteria on spirometry, and therefore were misdiagnosed: 62% when defined as forced expiratory volume in 1 second to forced vital capacity (FEV1/FVC) ratio less than the lower limit of normal and 55% when using the GOLD definition of FEV1/FVC less than 0.7. After patients with reported asthma were excluded, 34% of participants with false-positive COPD were found to be treated with respiratory medications as outpatients.
Overdiagnosis of COPD was noted to be more prevalent in high-income countries than they were in low- to middle-income countries (4.9% versus 1.9% of the participants sampled).
The self-reporting of the diagnosis of COPD is a limitation of the study because it may have artificially inflated the rate of false positives.
Bottom line: Patient-reported diagnoses of COPD should be taken with a degree of caution because of high rates of overdiagnosis and overtreatment.
Citation: Sator L et al. Overdiagnosis of COPD in subjects with unobstructed spirometry. Chest. 2019 Aug;156(2):277-88.
Dr. Gordon is a hospitalist at Maine Medical Center in Portland.
Natural immunity from COVID-19 ‘may last months’
Infection with the SARS-CoV-2 virus may provide some immunity for at least 5 months, interim results from a study has found.
The first report from the Sarscov2 Immunity & Reinfection Evaluation (SIREN) study suggested that antibodies from people who had recovered from COVID-19 gave at least 83% protection against reinfection compared with people who had not had the disease before.
However, Public Health England (PHE) researchers said some people with antibodies may still be able to carry and transmit the SARS-CoV-2 virus.
‘Strongly encouraged’
Susan Hopkins, PhD, senior medical advisor at PHE, who is leading the study, said the overall findings were good news. She told a briefing hosted by the Science Media Centre: “I am strongly encouraged that people have immunity that is lasting much more than the few months that was speculated before the summer.”
She added: “It allows people to feel that their prior infection will protect them from future infections but at the same time it is not complete protection, and therefore they still need to be careful when they are out and about.”
PHE scientists said they would continue to assess whether protection might last longer than 5 months.
Eleanor Riley, PhD, professor of immunology and infectious disease at the University of Edinburgh, said the report suggested that “natural infection provides short-term protection against COVID-19 that is very similar to that conferred by vaccination.”
Simon Clarke, PhD, associate professor in cellular microbiology at the University of Reading, said: “The concerning finding is that some people who have COVID antibodies appear to still be able to carry the coronavirus and could spread it to others. This means that the vast majority of the population will either need to have natural immunity or have been immunised for us to fully lift restrictions on our lives.”
The analysis took place before the new variant of SARS-CoV-2 became widespread in the UK. The PHE scientists said that further work was underway to establish whether and to what extent antibodies also provide protection from the VOC202012/01 variant.
Healthcare Workers
The SIREN preprint analysed data from 20,787 health care workers from 102 NHS trusts who had undergone antibody and PCR testing from June 18 to November 9, 2020.
Of those, 6614 tested positive for COVID-19 antibodies.
Of the 44 potential reinfections identified, two were designated ‘probable’ and 42 ‘possible’, based on available evidence.
Both of the two individuals classified as probable reinfections reported having experienced COVID-19 symptoms during the first wave of the pandemic but were not tested at the time. Both reported that their symptoms were less severe the second time.
None of the 44 potential reinfection cases were PCR tested during the first wave, but all tested positive for COVID-19 antibodies at the time they were recruited to the study.
Tom Wingfield, PhD, senior clinical lecturer at the Liverpool School of Tropical Medicine, said that given the high risk of SARS-CoV-2 infection for frontline NHS staff, it was “vital that we do all that we can to understand, predict, and prevent risk of SARS-CoV-2 amongst healthcare workers”.
The study will continue to follow participants for 12 months to explore how long any immunity may last, the effectiveness of vaccines, and to what extent people with immunity are able to carry and transmit the virus.
A version of this article first appeared on Medscape.com.
Left-handed cardiology trainees face unique challenges
Left-handed cardiology trainees face unique challenges when it comes to learning how to perform common procedures, according to a new report.
About 10% of the world’s population is left-handed, and rates of left-handedness among medical students and practicing physicians is believed to be similar.
“Extrapolating this to 3,017 active general cardiovascular fellowship positions and 339 interventional cardiology fellowship positions for the year 2018-2019, it is estimated there are more than 300 LH [left-handed] trainees in U.S. cardiovascular fellowship programs at any given time. Despite this, any standard clinical setting is designed to be convenient for RH [right-handed] providers, thereby creating a variable amount of impediment for LH trainees,” wrote Prashant Patel, MD, and Mandira Patel, DO, from University of California, Riverside.
“With about 10% prevalence, left-handedness is far more common, including among cardiology trainees, than most people realize. Most of the procedural set-up is designed for the right-hand majority, and it may cause a variable amount of impediment for the left-handed trainees. It is very important for the academic cardiology community to recognize this,” Dr. Prashant Patel said in an interview.
The findings were published in the Jan.5 issue of the Journal of the American College of Cardiology.
Dr. Prashant Patel, who is left-handed, said he was prompted to look into the issue because of his own experience.
“In my first procedural rotation several years ago, I noticed that I was positioning myself somewhat differently than my attendings due to my preference for using my left hand for fine motor control,” he said. “I started looking up existing literature to see what other left-handed cardiologists have done in the past, but realized that nothing along this line was published.
“I started discussions with my colleagues and superiors and found that our small cardiology fellowship program contains about 20%-40% of left-handed trainees at any given time, and we felt it was important to elaborate on this,” he added.
Practice makes perfect, and repeated practice eventually leads to automation of motor procedures, but the learning curve may be more protracted for left-handed trainees. “Acquisition of procedural skills is a function of time and repetition. Eventually, most practicing left-handed cardiologists see that as a nonissue and do not even realize they may have gone through a differential learning curve based on their hand dominance,” Dr. Prashant Patel noted.
“South-paw” cardiology trainees face their first challenge in the examination room.
Physicians typically examine patients from the right-hand side of the bed. The majority of clinic offices are set up for the right-handed provider, with the examining table placed with the head of the bed distal from the door and the left side of the bed aligned in close proximity to the wall, leaving examination on the right side of the patient as the only option. In the hospital setting, monitors and intravenous poles are usually placed on the patient’s left-hand side of the bed.
“This practice, more than anything else, is born out of tradition. The same clinical examination can potentially be performed with the same accuracy and efficacy from the left-hand side,” said Dr. Prashant Patel.
In the echocardiography lab, some facilities perform transthoracic echocardiography from the right side of the patient, thereby requiring the operator to get the right scanning hand over and across the patient.
“This is ergonomically disadvantageous, as one has to sit on the table, reach over the patient, and twist the torso. Scanning from the left side of the patient is ergonomically superior in preventing back injuries and may be advantageous for the left-handed person as the probe is held in the dominant hand,” noted Dr. Prashant Patel.
In the cath lab, the difficulty for left-handed cardiologists starts with establishing arterial or venous access.
“The two most frequently used arterial-access sites are right radial and right femoral. Both of them pose unique challenges in terms of positioning for most left-handed trainees in the early part of their training. The right arm is kept adducted and externally rotated in a standard setup, which is difficult to access for a left-handed operator, and would require the operator to use their nondominant right hand awkwardly to gain access,” he said.
A solution could be to reposition the patient’s arm using a radial board into abduction of the arm at about 45 degrees, with external rotation.
“This creates room for the left-handed operator to stand caudal to the patient’s arm and approach the radial access site conveniently using their dominant hand,” Dr. Prashant Patel suggested.
For the femoral approach, the left-handed operator could stand left of the patient and either get left femoral access or reach out across to the right groin of the patient and obtain access in this manner, or alternatively, the operator could resort to using their right hand to gain right femoral access.
“The large size of the femoral vessels allows even the strongly left-handed operators to get accustomed to using their nondominant hand with practice. This may be preferable to switching to the left side,” he said.
There are also some advantages to being left-handed, Dr. Prashant Patel said.
This is true “especially in the cath lab, for example, establishing antegrade right femoral access for peripheral interventions,” he noted. “Having a left-handed operator can also come in handy when two operators need to simultaneously and quickly work on both groins, as is often the case in complex coronary or structural interventions. Left-handed operators are also at ease obtaining left radial access, which has been shown to have certain advantages over right radial access.”
“We hope to raise awareness among the academic cardiology community about left-handedness,” Dr. Prashant Patel added. “We hope that acknowledgment, support, and minor modifications in work flow will allow a lot of young trainees in the early part of their career to stay on course and realize their full potential in this procedural specialty.”
An insightful paper
“This paper by Dr. Prashant Patel and Dr. Mandira Patel is most insightful about the unique challenges and occasional opportunities for the left-handed cardiologist,” wrote Simon Kendall, MBBS, president of the Society for Cardiothoracic Surgery Great Britain and Ireland, London, in an accompanying response.
“As a left-handed cardiac surgeon, I am embarrassed not to have considered such significant issues for my cardiology colleagues: the edict of examining a patient from the right side, performing echocardiography with the right hand, and the complex arena of catheter laboratory that is designed around the right-handed majority. Before reading this paper, I had not appreciated that for my whole career I have had to use my less-favored right hand when inserting a balloon pump,” Dr. Kendall wrote.
“Dr. Patel and Dr. Patel have written very sensible conclusions, such as that left-handedness should be acknowledged and adapted for and the training environment has to help access the specific tips and tricks from others, as shared in cardiac surgery, for instance. They rightly describe this as not a binary phenomenon and that there is a spectrum of laterality, so that some left-handers will adapt with ease and others will need more time and patience to learn the necessary skills,” he wrote. “We are fortunate to live in an era of increasing awareness and tolerance. Left-handedness is one small example of such progress.”
A version of this article first appeared on Medscape.com.
Liver disease associated with worse COVID-19 outcomes
A growing body of evidence suggests that patients with COVID-19 and preexisting liver disease face increased risks of decompensation and mortality, according to a review of recent literature.
The review aimed to bring together the best approaches for caring for patients with preexisting liver conditions based on recommendations from three major hepatology societies. Findings in included studies could guide clinical decision-making, but a reliable framework for patient management has yet to be established, most likely because of limited research, according to lead author Abdul Mohammed, MD, of Case Western Reserve University, Cleveland, and colleagues.
The relationship between chronic liver diseases and “COVID-19 is not well documented in the literature,” Dr. Mohammed and colleagues wrote in the Journal of Clinical Gastroenterology. “The intricate interplay between immune dysfunction in preexisting liver diseases and the immune dysregulation triggered by the SARS-CoV-2 virus needs further evaluation.”
Such knowledge gaps likely explain the inconsistencies in recommendations between major hepatology societies, including clinical guidance from the American Association for the Study of Liver Disease, the European Association for the Study of the Liver, and the Asian Pacific Association for the Study of the Liver.
Both the literature review and the societal guidance address nonalcoholic fatty liver disease (NAFLD), hepatitis B virus (HBV) infection, autoimmune hepatitis, hepatocellular carcinoma (HCC), cirrhosis, and liver transplantation.
Dr. Mohammed and colleagues first offered an update of the relationship between COVID-19 and liver pathology. While it is clear that SARS-CoV-2 gains hepatic access through binding to ACE2 receptors in bile duct epithelial cells, it remains unclear whether this results in direct hepatic injury or indirect damage from virus-mediated cytokine release. Regardless, more than 90% of patients hospitalized for COVID-19 may develop increased levels of ALT and AST, and these elevations “appear to mirror disease severity,” the investigators wrote.
They noted that severity of COVID-19 appears to correlate with type of preexisting liver disease. For example, one study in the review associated NAFLD with a significantly increased risk of progressive COVID-19 (odds ratio, 6.4; 95% confidence interval, 1.5-31.2), and it also found that patients with NAFLD had longer duration of viral shedding than those without (17 vs. 12 days). Although the AASLD and APASL give no specific recommendations, the EASL recommends prioritizing COVID-19 patients with NAFLD.
Cirrhosis has been associated with a fourfold increased risk of mortality (relative risk, 4.6; 95% CI, 2.6-8.3) According to data from two international self-reporting registries, COVIDHep.net and COVIDCirrhosis.org, likelihood of death appears to move in tandem with Child-Turcotte-Pugh scores. Decompensated cirrhosis appears to predispose patients to having pulmonary complications, but more studies exploring this correlation need to be performed, according to the review authors. One study found that acute-on-chronic liver failure or acute decompensation occurred in 20% of patients who had COVID-19 and cirrhosis. It’s little surprise, then, that both the AASLD and the EASL recommend prioritizing in person evaluation for patients with decompensated cirrhosis.
Chronic HBV infection has also been associated with a higher COVID-19 mortality rate, although Dr. Mohammed and colleagues suggested that “larger studies are needed.” The review notes that the three societies recommend initiating HBV treatment only if there is clinical suspicion of hepatitis flare.
Findings are also cloudy among patients with autoimmune hepatitis and liver transplant recipients; however, the investigators noted that COVID-19 causes tissue damage primarily through cytokine release, and suggested that “immunosuppression can potentially curb this response.” Even so, recommendations from leading hepatology societies allude to a safe middle ground of immunosuppression, albeit with indistinct borders. All three caution against withdrawing immunosuppression, but the societies each describe tailoring regimens in different ways and for different patients, emphasizing continued corticosteroid treatments, according to the review.
Guidance also varies for management of HCC. “Since the tumor doubling time is 4-8 months and current guidelines recommend screening every 6 months, in patients at lower risk for developing HCC, a 2-month delay in ultrasound surveillance has been suggested by the AASLD,” the review authors noted. “In patients with a high risk of developing HCC, 6-month interval screening should be continued.” The AASLD recommends proceeding with treatment with newly diagnosed HCC, the EASL suggests that checkpoint inhibitors should be withheld and locoregional therapies should be postponed, and the APASL calls for a less frequent schedule of tyrosine kinase inhibitors and immunotherapy.
“COVID-19 patients with the preexisting liver disease face a higher risk of decompensation and mortality,” the review authors concluded. “We presented the most up-to-date literature on preexisting liver disease and its interaction with COVID-19.”

While such discrepancies may remain unresolved until further data are available, Wajahat Mehal, MD, PhD, director of the fatty liver disease program at Yale University, New Haven, Conn., suggested that clinicians remain vigilant for nonalcoholic steatohepatitis (NASH), which is common among overweight and obese individuals, an overrepresented group among those hospitalized for COVID-19.
“This is of great significance because patients with various forms of liver disease have a worse outcome with COVID-19,” Dr. Mehal said. “When seeing a patient with COVID-19 it is therefore important to ask if they have underlying liver disease, with attention paid to NASH. This can be approached by seeing if they have any evidence of abnormal liver function tests before the onset of COVID and any evidence of abnormal liver imaging. The Fib-4 test is a good screening tool for the presence of advanced liver fibrosis and a positive result should lead to more specific tests of liver fibrosis status such as fibroscan.”
The investigators reported no conflicts of interest. Dr. Mehal reported having nothing to disclose.
For the latest clinical guidance, education, research and physician resources about coronavirus, visit the AGA COVID-19 Resource Center at www.gastro.org/COVID.
A growing body of evidence suggests that patients with COVID-19 and preexisting liver disease face increased risks of decompensation and mortality, according to a review of recent literature.
The review aimed to bring together the best approaches for caring for patients with preexisting liver conditions based on recommendations from three major hepatology societies. Findings in included studies could guide clinical decision-making, but a reliable framework for patient management has yet to be established, most likely because of limited research, according to lead author Abdul Mohammed, MD, of Case Western Reserve University, Cleveland, and colleagues.
The relationship between chronic liver diseases and “COVID-19 is not well documented in the literature,” Dr. Mohammed and colleagues wrote in the Journal of Clinical Gastroenterology. “The intricate interplay between immune dysfunction in preexisting liver diseases and the immune dysregulation triggered by the SARS-CoV-2 virus needs further evaluation.”
Such knowledge gaps likely explain the inconsistencies in recommendations between major hepatology societies, including clinical guidance from the American Association for the Study of Liver Disease, the European Association for the Study of the Liver, and the Asian Pacific Association for the Study of the Liver.
Both the literature review and the societal guidance address nonalcoholic fatty liver disease (NAFLD), hepatitis B virus (HBV) infection, autoimmune hepatitis, hepatocellular carcinoma (HCC), cirrhosis, and liver transplantation.
Dr. Mohammed and colleagues first offered an update of the relationship between COVID-19 and liver pathology. While it is clear that SARS-CoV-2 gains hepatic access through binding to ACE2 receptors in bile duct epithelial cells, it remains unclear whether this results in direct hepatic injury or indirect damage from virus-mediated cytokine release. Regardless, more than 90% of patients hospitalized for COVID-19 may develop increased levels of ALT and AST, and these elevations “appear to mirror disease severity,” the investigators wrote.
They noted that severity of COVID-19 appears to correlate with type of preexisting liver disease. For example, one study in the review associated NAFLD with a significantly increased risk of progressive COVID-19 (odds ratio, 6.4; 95% confidence interval, 1.5-31.2), and it also found that patients with NAFLD had longer duration of viral shedding than those without (17 vs. 12 days). Although the AASLD and APASL give no specific recommendations, the EASL recommends prioritizing COVID-19 patients with NAFLD.
Cirrhosis has been associated with a fourfold increased risk of mortality (relative risk, 4.6; 95% CI, 2.6-8.3) According to data from two international self-reporting registries, COVIDHep.net and COVIDCirrhosis.org, likelihood of death appears to move in tandem with Child-Turcotte-Pugh scores. Decompensated cirrhosis appears to predispose patients to having pulmonary complications, but more studies exploring this correlation need to be performed, according to the review authors. One study found that acute-on-chronic liver failure or acute decompensation occurred in 20% of patients who had COVID-19 and cirrhosis. It’s little surprise, then, that both the AASLD and the EASL recommend prioritizing in person evaluation for patients with decompensated cirrhosis.
Chronic HBV infection has also been associated with a higher COVID-19 mortality rate, although Dr. Mohammed and colleagues suggested that “larger studies are needed.” The review notes that the three societies recommend initiating HBV treatment only if there is clinical suspicion of hepatitis flare.
Findings are also cloudy among patients with autoimmune hepatitis and liver transplant recipients; however, the investigators noted that COVID-19 causes tissue damage primarily through cytokine release, and suggested that “immunosuppression can potentially curb this response.” Even so, recommendations from leading hepatology societies allude to a safe middle ground of immunosuppression, albeit with indistinct borders. All three caution against withdrawing immunosuppression, but the societies each describe tailoring regimens in different ways and for different patients, emphasizing continued corticosteroid treatments, according to the review.
Guidance also varies for management of HCC. “Since the tumor doubling time is 4-8 months and current guidelines recommend screening every 6 months, in patients at lower risk for developing HCC, a 2-month delay in ultrasound surveillance has been suggested by the AASLD,” the review authors noted. “In patients with a high risk of developing HCC, 6-month interval screening should be continued.” The AASLD recommends proceeding with treatment with newly diagnosed HCC, the EASL suggests that checkpoint inhibitors should be withheld and locoregional therapies should be postponed, and the APASL calls for a less frequent schedule of tyrosine kinase inhibitors and immunotherapy.
“COVID-19 patients with the preexisting liver disease face a higher risk of decompensation and mortality,” the review authors concluded. “We presented the most up-to-date literature on preexisting liver disease and its interaction with COVID-19.”
While such discrepancies may remain unresolved until further data are available, Wajahat Mehal, MD, PhD, director of the fatty liver disease program at Yale University, New Haven, Conn., suggested that clinicians remain vigilant for nonalcoholic steatohepatitis (NASH), which is common among overweight and obese individuals, an overrepresented group among those hospitalized for COVID-19.
“This is of great significance because patients with various forms of liver disease have a worse outcome with COVID-19,” Dr. Mehal said. “When seeing a patient with COVID-19 it is therefore important to ask if they have underlying liver disease, with attention paid to NASH. This can be approached by seeing if they have any evidence of abnormal liver function tests before the onset of COVID and any evidence of abnormal liver imaging. The Fib-4 test is a good screening tool for the presence of advanced liver fibrosis and a positive result should lead to more specific tests of liver fibrosis status such as fibroscan.”
The investigators reported no conflicts of interest. Dr. Mehal reported having nothing to disclose.
For the latest clinical guidance, education, research and physician resources about coronavirus, visit the AGA COVID-19 Resource Center at www.gastro.org/COVID.
FROM THE JOURNAL OF CLINICAL GASTROENTEROLOGY