User login
Metformin tied to longer gestation in women with preterm preeclampsia
Metformin extended gestation by nearly a week in women with preterm preeclampsia and was also linked to a shorter neonatal hospital stay, according to findings from a study presented Jan. 28 at the virtual Society for Maternal-Fetal Medicine 2021 Annual Pregnancy Meeting.
The causes of preeclampsia have continued to elude researchers, but most agree the placenta plays a key role, explained Cathy Cluver, PhD, director of the preeclampsia research unit and an associate professor at Stellenbosch University, Cape Town. Past trials have tested sildenafil, antithrombin, pravastatin, and esomeprazole, but the drugs either did not show promise, had unacceptable side effects, or need further study.
“This trial provides proof of concept that preterm preeclampsia can be treated and that we can slow the progression of preterm preeclampsia,” Dr. Cluver said.
In this trial, the researchers enrolled 180 women with preterm preeclampsia between 26 and 31 weeks of gestation. All the women were taking hypertensives. They were randomly assigned to receive 3 g oral metformin XR or placebo daily. The intention-to-treat analysis included 87 women who received metformin and 84 who received placebo, with baseline characteristics similar in both groups.
Women in the metformin group gave birth a median 16.2 days after randomization, which was 6.7 days longer than the 9.5 days postrandomization delivery of women in the placebo group. The differences, however, narrowly missed statistical significance (P =.056).
But when the researchers took compliance and dose into account, the effect of the metformin increased, showing a dose-dependent effect, and did reach statistical significance. Among the 147 women who continued treatment until delivery, those in the metformin group delivered a median 8.4 days later than those in the placebo group (16.2 vs. 7.4 days; P =.026). Further, when the analysis was further restricted to just the 100 women who continued taking the full dose until delivery, the difference was even greater (16.2 vs. 4.8 days; P =.008). In accordance with the safety profile of metformin, women taking the drug had more diarrhea and a trend toward more nausea than those taking the placebo.
There were no differences between the groups in composite maternal or neonatal outcomes, but the infants were an average 136 g (4.8 ounces) heavier in the metformin group, albeit the difference did not reach statistical significance. The 6-day–shorter neonatal stay at the study site facility for infants of the metformin group also did not reach statistical significance, but there was a significant difference between the groups on overall stay, including transfers to other facilities. Infants in the metformin group averaged 26 days vs. 34 days for infants in the placebo group (P =.007).
“We have shown that metformin XR may be a treatment for preterm preeclampsia. We now plan to do a larger study to hopefully confirm these findings, which will be powered to both prolongation of pregnancy and neonatal outcomes,” Dr. Cluver told this news organization. “We have also shown that one can prolong pregnancy in preterm preeclampsia, and we hope that this will encourage others in our field to continue researching therapeutics for preterm preeclampsia.”
In response to questions from attendees, Dr. Cluver reported that her team did not collect histological data from placentas in this study, and lack of funding is limiting their ability to evaluate longer-term outcomes.
The findings of prolonged gestation were certainly exciting, but they warrant caution before any changes in clinical practice, Michelle Y. Owens, MD, professor and chief of maternal-fetal medicine at the University of Mississippi Medical Center, Jackson, said in an interview.
“While the findings of this study are promising, the sample size was small, the dosing exceeds what we typically use in the U.S., and this was undertaken in Cape Town, South Africa, all of which may render this study less generalizable to our population and others across the globe,” said Dr. Owens, who moderated the oral abstract session.
She also pointed out a possible conflicting effect on birth weight brought on by using metformin to extend gestation.
“If larger studies are undertaken, I believe it is quite possible that, with extended gestation, there will be bigger babies,” she said. “However, metformin also helps control blood glucose and in so doing, may contribute to lower birth weights over time, compared with women not exposed to the drug.”
Dr. Cluver and Dr. Owens have disclosed no relevant financial relationships.
A version of this article first appeared on Medscape.com.
*This story was updated on 2/9/2021.
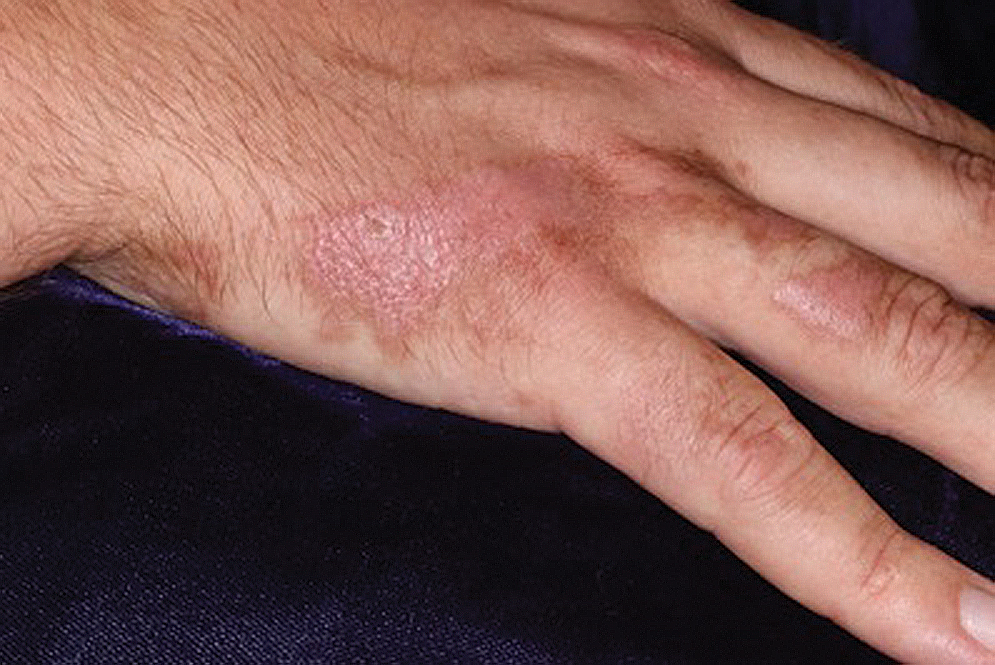
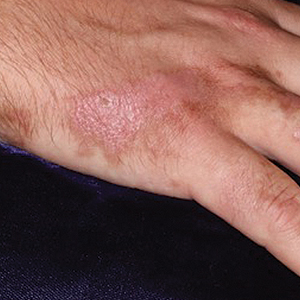
Pink Patches With a Hyperpigmented Rim
The Diagnosis: Phytophotodermatitis
A more detailed patient history revealed that there was beer with limes on the boat, but the partygoers neglected to bring a knife. The patient volunteered to tear the limes apart with his bare hands. Because he was clad only in swim trunks, lime juice splattered over various regions of his body.
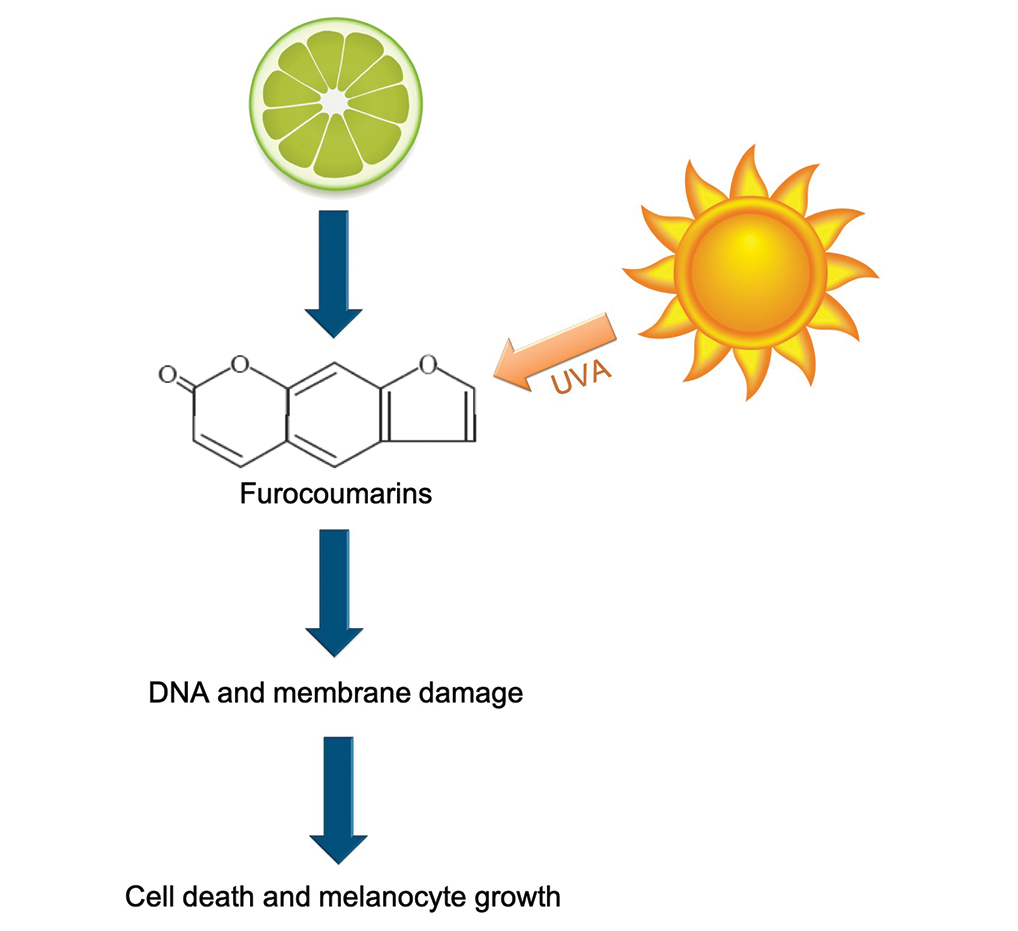
Phytophotodermatitis is a phototoxic blistering rash that follows topical exposure to plant-derived furocoumarins and sunlight. (Figure) Furocoumarins are photosensitizing substances produced by certain plants, possibly as a defense mechanism against predators.1 They cause a nonimmunologic phototoxic reaction when deposited on the skin and exposed to UVA radiation. Exposure to limes is the most common precipitant of phytophotodermatitis, but other potential culprits include lemons, grapefruit, figs, carrots, parsnips, celery, and dill.2
Lesions associated with phytophotodermatitis classically present as painful erythematous patches and bullae in regions of furocoumarin exposure. Affected areas are well demarcated and irregularly shaped and heal with a characteristic hyperpigmented rim. They often have a downward streak pattern from the dripping juice.3 If the furocoumarins are transferred by touch, lesions can appear in the shape of handprints, which may raise alarms for physical abuse in children.4
Photochemical reactions caused by activated furocoumarins cross-link nuclear DNA and damage cell membranes. These changes lead to cellular death resulting in edema and destruction of the epidermis. Other effects include an increase in keratin and thickening of the stratum corneum. The hyperpigmentation is a result of increased concentration of melanosomes and stimulation of melanocytes by activated furocoumarins.5
Management of phytophotodermatitis depends on the severity of skin injury. Mild cases may not require any treatment, whereas the most severe ones require admission to a burn unit for wound care. Anti-inflammatory medications are the mainstay of therapy. Our patient was prescribed desonide cream 0.05% for application to the affected areas. Sunscreen should be applied to prevent worsening of hyperpigmentation, which may take months to years to fade naturally. If hyperpigmentation is cosmetically troubling to the patient, bleaching agents such as hydroquinone and retinoids or Nd:YAG laser can be used to accelerate the resolution of pigment.5
Phototoxicity differs from less common photoallergic reactions caused by preformed antibodies or a delayed cell-mediated response to a trigger. The classic presentation of photoallergy is apruritic, inflammatory, bullous eruption in a sensitized individual.6 Allergic contact dermatitis more commonly is associated with pruritus than pain, and it presents as a papulovesicular eruption that evolves into lichenified plaques.7 Porphyria cutanea tarda would likely be accompanied by other cutaneous features such as hypertrichosis and sclerodermoid plaques with dystrophic calcification, in addition to wine-colored urine-containing porphyrins.8 Bullous fixed drug eruptions develop within 48 hours of exposure to a causative agent. The patient typically would experience pruritus and burning at the site of clearly demarcated erythematous lesions that healed with hyperpigmentation.9 Lesions of bullous lupus erythematosus may appear in areas without sun exposure, and they would be more likely to leave behind hypopigmentation rather than hyperpigmentation.10
- Pathak MA. Phytophotodermatitis. Clin Dermatol. 1986;4:102-121.
- Egan CL, Sterling G. Phytophotodermatitis: a visit to Margaritaville. Cutis. 1993;51:41-42.
- Hankinson A, Lloyd B, Alweis R. Lime-induced phytophotodermatitis [published online ahead of print September 29, 2014]. J Community Hosp Intern Med Perspect. doi:10.3402/jchimp.v4.25090
- Fitzpatrick JK, Kohlwes J. Lime-induced phytophotodermatitis. J Gen Intern Med. 2018;33:975.
- Weber IC, Davis CP, Greeson DM. Phytophotodermatitis: the other "lime" disease. J Emerg Med. 1999;17:235-237.
- Monteiro AF, Rato M, Martins C. Drug-induced photosensitivity: photoallergic and phototoxic reactions. Clin Dermatol. 2016;34:571-581.
- Tan CH, Rasool S, Johnston GA. Contact dermatitis: allergic and irritant. Clin Dermatol. 2014;32:116-124.
- Dawe R. An overview of the cutaneous porphyrias. F1000Res. 2017;6:1906.
- Bandino JP, Wohltmann WE, Bray DW, et al. Naproxen-induced generalized bullous fixed drug eruption. Dermatol Online J. 2009;15:4.
- Contestable JJ, Edhegard KD, Meyerle JH. Bullous systemic lupus erythematosus: a review and update to diagnosis and treatment. Am J Clin Dermatol. 2014;15:517-524.
The Diagnosis: Phytophotodermatitis
A more detailed patient history revealed that there was beer with limes on the boat, but the partygoers neglected to bring a knife. The patient volunteered to tear the limes apart with his bare hands. Because he was clad only in swim trunks, lime juice splattered over various regions of his body.
Phytophotodermatitis is a phototoxic blistering rash that follows topical exposure to plant-derived furocoumarins and sunlight. (Figure) Furocoumarins are photosensitizing substances produced by certain plants, possibly as a defense mechanism against predators.1 They cause a nonimmunologic phototoxic reaction when deposited on the skin and exposed to UVA radiation. Exposure to limes is the most common precipitant of phytophotodermatitis, but other potential culprits include lemons, grapefruit, figs, carrots, parsnips, celery, and dill.2
Lesions associated with phytophotodermatitis classically present as painful erythematous patches and bullae in regions of furocoumarin exposure. Affected areas are well demarcated and irregularly shaped and heal with a characteristic hyperpigmented rim. They often have a downward streak pattern from the dripping juice.3 If the furocoumarins are transferred by touch, lesions can appear in the shape of handprints, which may raise alarms for physical abuse in children.4
Photochemical reactions caused by activated furocoumarins cross-link nuclear DNA and damage cell membranes. These changes lead to cellular death resulting in edema and destruction of the epidermis. Other effects include an increase in keratin and thickening of the stratum corneum. The hyperpigmentation is a result of increased concentration of melanosomes and stimulation of melanocytes by activated furocoumarins.5
Management of phytophotodermatitis depends on the severity of skin injury. Mild cases may not require any treatment, whereas the most severe ones require admission to a burn unit for wound care. Anti-inflammatory medications are the mainstay of therapy. Our patient was prescribed desonide cream 0.05% for application to the affected areas. Sunscreen should be applied to prevent worsening of hyperpigmentation, which may take months to years to fade naturally. If hyperpigmentation is cosmetically troubling to the patient, bleaching agents such as hydroquinone and retinoids or Nd:YAG laser can be used to accelerate the resolution of pigment.5
Phototoxicity differs from less common photoallergic reactions caused by preformed antibodies or a delayed cell-mediated response to a trigger. The classic presentation of photoallergy is apruritic, inflammatory, bullous eruption in a sensitized individual.6 Allergic contact dermatitis more commonly is associated with pruritus than pain, and it presents as a papulovesicular eruption that evolves into lichenified plaques.7 Porphyria cutanea tarda would likely be accompanied by other cutaneous features such as hypertrichosis and sclerodermoid plaques with dystrophic calcification, in addition to wine-colored urine-containing porphyrins.8 Bullous fixed drug eruptions develop within 48 hours of exposure to a causative agent. The patient typically would experience pruritus and burning at the site of clearly demarcated erythematous lesions that healed with hyperpigmentation.9 Lesions of bullous lupus erythematosus may appear in areas without sun exposure, and they would be more likely to leave behind hypopigmentation rather than hyperpigmentation.10
- Pathak MA. Phytophotodermatitis. Clin Dermatol. 1986;4:102-121.
- Egan CL, Sterling G. Phytophotodermatitis: a visit to Margaritaville. Cutis. 1993;51:41-42.
- Hankinson A, Lloyd B, Alweis R. Lime-induced phytophotodermatitis [published online ahead of print September 29, 2014]. J Community Hosp Intern Med Perspect. doi:10.3402/jchimp.v4.25090
- Fitzpatrick JK, Kohlwes J. Lime-induced phytophotodermatitis. J Gen Intern Med. 2018;33:975.
- Weber IC, Davis CP, Greeson DM. Phytophotodermatitis: the other "lime" disease. J Emerg Med. 1999;17:235-237.
- Monteiro AF, Rato M, Martins C. Drug-induced photosensitivity: photoallergic and phototoxic reactions. Clin Dermatol. 2016;34:571-581.
- Tan CH, Rasool S, Johnston GA. Contact dermatitis: allergic and irritant. Clin Dermatol. 2014;32:116-124.
- Dawe R. An overview of the cutaneous porphyrias. F1000Res. 2017;6:1906.
- Bandino JP, Wohltmann WE, Bray DW, et al. Naproxen-induced generalized bullous fixed drug eruption. Dermatol Online J. 2009;15:4.
- Contestable JJ, Edhegard KD, Meyerle JH. Bullous systemic lupus erythematosus: a review and update to diagnosis and treatment. Am J Clin Dermatol. 2014;15:517-524.
A 25-year-old man presented with a rash on the right hand, chest, abdomen, right thigh, and ankles of 2 weeks’ duration. He reported that the eruption began with bullous lesions following a boat trip. The bullae ruptured over the next several days, and the lesions evolved to the current appearance. Although the patient had experienced pain at the site of active blisters, he denied any current pain, itching, or bleeding from the lesions. No other medical comorbidities were present.
Cannabis tied to self-harm, death in youth with mood disorders
Adolescents and young adults with mood disorders and cannabis use disorder (CUD) are at significantly increased risk for self-harm, all-cause mortality, homicide, and death by unintentional overdose, new research suggests.

Investigators found the risk for self-harm was three times higher, all-cause mortality was 59% higher, unintentional overdose was 2.5 times higher, and homicide was more than three times higher in those with versus without CUD.
“The take-home message of these findings is that we need to be aware of the perception that cannabis use is harmless, when it’s actually not,” lead author Cynthia Fontanella, PhD, associate professor of psychiatry, Ohio State University Wexner Medical Center, Columbus, said in an interview.
“We need to educate parents and clinicians that there are risks associated with cannabis, including increased risk for self-harm and death, and we need to effectively treat both cannabis use disorder and mood disorders,” she said.
The study was published online Jan. 19, 2021, in JAMA Pediatrics.
Little research in youth
“There has been very little research conducted on CUD in the adolescent population, and most studies have been conducted with adults,” Dr. Fontanella said.
Research on adults has shown that, even in people without mood disorders, cannabis use is associated with the early onset of mood disorders, psychosis, and anxiety disorders and has also been linked with suicidal behavior and increased risk for motor vehicle accidents, Dr. Fontanella said.
“We were motivated to conduct this study because we treat kids with depression and bipolar disorder and we noticed a high prevalence of CUD in this population, so we were curious about what its negative effects might be,” Dr. Fontanella recounted.
The researchers analyzed 7-year data drawn from Ohio Medicaid claims and linked to data from death certificates in 204,780 youths between the ages of 10 and 24 years (mean age was 17.2 years at the time of mood disorder diagnosis). Most were female, non-Hispanic White, enrolled in Medicaid because of poverty, and living in a metropolitan area (65.0%, 66.9%, 87.6%, and 77.1%, respectively).
Participants were followed up to 1 year from diagnosis until the end of enrollment, a self-harm event, or death.
Researchers included demographic, clinical, and treatment factors as covariates.
Close to three-quarters (72.7%) of the cohort had a depressive disorder, followed by unspecified/persistent mood disorder and bipolar disorder (14.9% and 12.4%, respectively). Comorbidities included ADHD (12.4%), anxiety disorder (12.3%), and other mental disorders (13.1%).
One -tenth of the cohort (10.3%) were diagnosed with CUD.
CUD treatment referrals
“Although CUD was associated with suicide in the unadjusted model, it was not significantly associated in adjusted models,” the authors reported.
Dr. Fontanella noted that the risk for these adverse outcomes is greater among those who engage in heavy, frequent use or who use cannabis that has higher-potency tetrahydrocannabinol (THC) content.
Reasons why CUD might be associated with these adverse outcomes are that it can increase impulsivity, poor judgment, and clouded thinking, which may in turn increase the risk for self-harm behaviors, she said.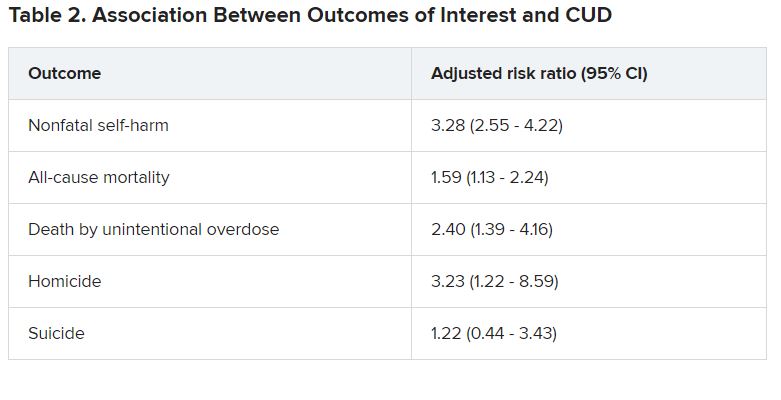
She recommended that clinicians refer youth with CUD for “effective treatments,” including family-based models and individual approaches, such as cognitive behavioral therapy and motivational enhancement therapy.
Open dialogue
In a comment, Wilfrid Noel Raby, MD, PhD, adjunct clinical professor, Albert Einstein College of Medicine, New York, noted that psychosis can occur in patients with CUD and mood disorders – especially bipolar disorder – but was not included as a study outcome. “I would have liked to see more data about that,” he said.
However, “The trend is that cannabis use is starting at younger and younger ages, which has all kinds of ramifications in terms of cerebral development.”
Christopher Hammond, MD, PhD, assistant professor of psychiatry, Johns Hopkins University, Baltimore, said: “Three major strengths of the study are the size of the sample, its longitudinal analysis, and that the authors controlled for a number of potential confounding variables.”
In light of the findings, Dr. Hammond recommended clinicians and other health professionals who work with young people “should screen for cannabis-related problems in youth with mood disorders.”
Dr. Hammond, who is the director of the Co-occurring Disorders in Adolescents and Young Adults Clinical and Research Program, Johns Hopkins Bayview Medical Center, Baltimore, and was not involved with the study, recommended counseling youth with mood disorders and their parents and families “regarding the potential adverse health effects related to cannabis use.”
He also recommended “open dialogue with youth with and without mental health conditions about misleading reports in the national media and advertising about cannabis’ health benefits.”
The study was funded by the National Institute of Mental Health. Dr. Fontanella reported receiving grants from the National Institute of Mental Health during the conduct of the study. Dr. Raby reported no relevant financial relationships. Dr. Hammond reported receiving research grant funding from the National Institutes of Health, the American Academy of Child & Adolescent Psychiatry, Substance Abuse Mental Health Services Administration, the National Network of Depression Centers, and the Armstrong Institute at Johns Hopkins Bayview and serves as a scientific adviser for the National Courts and Science Institute and as a subject matter expert for SAMHSA related to co-occurring substance use disorders and severe emotional disturbance in youth.
A version of this article first appeared on Medscape.com.
Adolescents and young adults with mood disorders and cannabis use disorder (CUD) are at significantly increased risk for self-harm, all-cause mortality, homicide, and death by unintentional overdose, new research suggests.
Investigators found the risk for self-harm was three times higher, all-cause mortality was 59% higher, unintentional overdose was 2.5 times higher, and homicide was more than three times higher in those with versus without CUD.
“The take-home message of these findings is that we need to be aware of the perception that cannabis use is harmless, when it’s actually not,” lead author Cynthia Fontanella, PhD, associate professor of psychiatry, Ohio State University Wexner Medical Center, Columbus, said in an interview.
“We need to educate parents and clinicians that there are risks associated with cannabis, including increased risk for self-harm and death, and we need to effectively treat both cannabis use disorder and mood disorders,” she said.
The study was published online Jan. 19, 2021, in JAMA Pediatrics.
Little research in youth
“There has been very little research conducted on CUD in the adolescent population, and most studies have been conducted with adults,” Dr. Fontanella said.
Research on adults has shown that, even in people without mood disorders, cannabis use is associated with the early onset of mood disorders, psychosis, and anxiety disorders and has also been linked with suicidal behavior and increased risk for motor vehicle accidents, Dr. Fontanella said.
“We were motivated to conduct this study because we treat kids with depression and bipolar disorder and we noticed a high prevalence of CUD in this population, so we were curious about what its negative effects might be,” Dr. Fontanella recounted.
The researchers analyzed 7-year data drawn from Ohio Medicaid claims and linked to data from death certificates in 204,780 youths between the ages of 10 and 24 years (mean age was 17.2 years at the time of mood disorder diagnosis). Most were female, non-Hispanic White, enrolled in Medicaid because of poverty, and living in a metropolitan area (65.0%, 66.9%, 87.6%, and 77.1%, respectively).
Participants were followed up to 1 year from diagnosis until the end of enrollment, a self-harm event, or death.
Researchers included demographic, clinical, and treatment factors as covariates.
Close to three-quarters (72.7%) of the cohort had a depressive disorder, followed by unspecified/persistent mood disorder and bipolar disorder (14.9% and 12.4%, respectively). Comorbidities included ADHD (12.4%), anxiety disorder (12.3%), and other mental disorders (13.1%).
One -tenth of the cohort (10.3%) were diagnosed with CUD.
CUD treatment referrals
“Although CUD was associated with suicide in the unadjusted model, it was not significantly associated in adjusted models,” the authors reported.
Dr. Fontanella noted that the risk for these adverse outcomes is greater among those who engage in heavy, frequent use or who use cannabis that has higher-potency tetrahydrocannabinol (THC) content.
Reasons why CUD might be associated with these adverse outcomes are that it can increase impulsivity, poor judgment, and clouded thinking, which may in turn increase the risk for self-harm behaviors, she said.
She recommended that clinicians refer youth with CUD for “effective treatments,” including family-based models and individual approaches, such as cognitive behavioral therapy and motivational enhancement therapy.
Open dialogue
In a comment, Wilfrid Noel Raby, MD, PhD, adjunct clinical professor, Albert Einstein College of Medicine, New York, noted that psychosis can occur in patients with CUD and mood disorders – especially bipolar disorder – but was not included as a study outcome. “I would have liked to see more data about that,” he said.
However, “The trend is that cannabis use is starting at younger and younger ages, which has all kinds of ramifications in terms of cerebral development.”
Christopher Hammond, MD, PhD, assistant professor of psychiatry, Johns Hopkins University, Baltimore, said: “Three major strengths of the study are the size of the sample, its longitudinal analysis, and that the authors controlled for a number of potential confounding variables.”
In light of the findings, Dr. Hammond recommended clinicians and other health professionals who work with young people “should screen for cannabis-related problems in youth with mood disorders.”
Dr. Hammond, who is the director of the Co-occurring Disorders in Adolescents and Young Adults Clinical and Research Program, Johns Hopkins Bayview Medical Center, Baltimore, and was not involved with the study, recommended counseling youth with mood disorders and their parents and families “regarding the potential adverse health effects related to cannabis use.”
He also recommended “open dialogue with youth with and without mental health conditions about misleading reports in the national media and advertising about cannabis’ health benefits.”
The study was funded by the National Institute of Mental Health. Dr. Fontanella reported receiving grants from the National Institute of Mental Health during the conduct of the study. Dr. Raby reported no relevant financial relationships. Dr. Hammond reported receiving research grant funding from the National Institutes of Health, the American Academy of Child & Adolescent Psychiatry, Substance Abuse Mental Health Services Administration, the National Network of Depression Centers, and the Armstrong Institute at Johns Hopkins Bayview and serves as a scientific adviser for the National Courts and Science Institute and as a subject matter expert for SAMHSA related to co-occurring substance use disorders and severe emotional disturbance in youth.
A version of this article first appeared on Medscape.com.
Regular medical masks no different than N95 respirator masks in preventing flu transmission
Background: While it is recognized that N95 respirator masks are better than regular medical masks at preventing the inhalation of aerosols, the question of whether they are better at preventing the transmission of infectious viral micro-organisms has never been studied in a robust randomized trial. Prior studies have shown mixed results, from noninferiority of medical masks to superiority of N95 masks, but these studies were stopped early or calibrated to detect outcomes of questionable clinical significance.

Study design: Cluster randomized, investigator-blinded pragmatic effectiveness study.
Setting: Seven outpatient health systems throughout the United States.
Synopsis: Data from 2,862 participants from 137 sites were gathered during the 12 weeks of peak influenza season during 2011-2015. Following analysis, there was no difference in objective laboratory evidence (by polymerase chain reaction or serum influenza seroconversion not attributable to vaccination) between the groups randomized to N95 masks and the groups randomized to regular medical masks. No significant difference in self-reported “flulike illness” or self-reported adherence to the intervention was noted between groups. Participants self-reported “never” adhering to the intervention about 10% of the time in both groups and adhering only “sometimes” about 25% of the time.
The study limitations included: most testing for infection occurred for self-reported symptoms with only a minor component of testing occurring at random; the self-reporting of secondary outcomes; and the somewhat high rate of nonadherence to either intervention. Although these are likely necessary trade-offs in a pragmatic trial.
Bottom line: N95 respirator masks are no better than regular medical masks are at preventing the transmission of influenza and other viral respiratory illnesses.
Citation: Radonovich LJ et al. N95 respirators vs. medical masks for preventing influenza among health care personnel: A randomized clinical trial. JAMA. 2019 Sep 3;322(9):824-33.
Dr. Porter is chief quality and safety resident at the Rocky Mountain Veterans Affairs Regional Medical Center, Aurora, Colo.
Background: While it is recognized that N95 respirator masks are better than regular medical masks at preventing the inhalation of aerosols, the question of whether they are better at preventing the transmission of infectious viral micro-organisms has never been studied in a robust randomized trial. Prior studies have shown mixed results, from noninferiority of medical masks to superiority of N95 masks, but these studies were stopped early or calibrated to detect outcomes of questionable clinical significance.
Study design: Cluster randomized, investigator-blinded pragmatic effectiveness study.
Setting: Seven outpatient health systems throughout the United States.
Synopsis: Data from 2,862 participants from 137 sites were gathered during the 12 weeks of peak influenza season during 2011-2015. Following analysis, there was no difference in objective laboratory evidence (by polymerase chain reaction or serum influenza seroconversion not attributable to vaccination) between the groups randomized to N95 masks and the groups randomized to regular medical masks. No significant difference in self-reported “flulike illness” or self-reported adherence to the intervention was noted between groups. Participants self-reported “never” adhering to the intervention about 10% of the time in both groups and adhering only “sometimes” about 25% of the time.
The study limitations included: most testing for infection occurred for self-reported symptoms with only a minor component of testing occurring at random; the self-reporting of secondary outcomes; and the somewhat high rate of nonadherence to either intervention. Although these are likely necessary trade-offs in a pragmatic trial.
Bottom line: N95 respirator masks are no better than regular medical masks are at preventing the transmission of influenza and other viral respiratory illnesses.
Citation: Radonovich LJ et al. N95 respirators vs. medical masks for preventing influenza among health care personnel: A randomized clinical trial. JAMA. 2019 Sep 3;322(9):824-33.
Dr. Porter is chief quality and safety resident at the Rocky Mountain Veterans Affairs Regional Medical Center, Aurora, Colo.

FDA extends review period for anticipated Alzheimer’s drug
the drug’s manufacturers have announced. The updated prescription drug user fee act (PDUFA) action date has been pushed forward from March 7 to June 7, 2021.
“As part of the ongoing review, Biogen submitted a response to an information request by the FDA, including additional analyses and clinical data, which the FDA considered a major amendment to the application that will require additional time for review,” Biogen and Eisai said in a statement.
“We are committed to working with the FDA as it completes its review of the aducanumab application. We want to thank the FDA for its continued diligence during the review,” said Biogen CEO Michel Vounatsos.
Biogen submitted the aducanumab application for approval to the FDA in July 2020. The FDA accepted it in August and granted priority review.
Aducanumab is a recombinant human monoclonal antibody targeting beta-amyloid (Abeta). If approved, it would be the first disease-modifying treatment for Alzheimer’s disease.
However, the road to approval has been bumpy. In November, despite high expectations and pleas from patients, caregivers, and advocacy groups, an FDA advisory panel declined to recommend approval of aducanumab.
As previously reported by this news organization, members of the FDA’s Peripheral and Central Nervous System Drugs Advisory Committee determined that results from Biogen’s one large positive trial did not provide strong enough evidence of efficacy for the treatment of Alzheimer’s disease.
A version of this article first appeared on Medscape.com.
Oily fish linked to lower risk of diabetes in largest study to date
People who report regularly eating oily fish had a significantly reduced risk for developing type 2 diabetes in a prospective, observational study of nearly 400,000 UK residents.

The results also show a significant, but weaker, positive link between regular use of fish oil supplements and a drop in the incidence of type 2 diabetes, Qibin Qi, PhD, and colleagues wrote in a report published in Diabetes Care. Their analysis failed to show a significant link between consumption of non-oily fish and type 2 diabetes onset.
The study is notable for being “the largest so far” to examine the link between fish consumption and type 2 diabetes incidence, and the first to establish a clear, significant association between regularly eating oily fish and a drop in the incidence of diabetes, said Dr. Qi, an epidemiologist at Albert Einstein College of Medicine in New York.
“At present, it is prudent to recommend fresh oily fish as a part of a healthy dietary pattern instead of fish oil supplements for diabetes prevention,” said Dr. Qi and coauthors.
The study included just over 392,000 adults without type 2 diabetes or cardiovascular disease at baseline enrolled in the UK Biobank. Median follow-up was just over 10 years, during which 7,262 participants developed diabetes.
Participants who ate either one, or two or more, servings of oily fish weekly each had a significant 22% lower rate of incident type 2 diabetes than that of those who ate no oily fish, after adjustment for multiple confounders. Those who reported regularly taking a fish oil supplement had a significant 9% lower incidence of type 2 diabetes than that of those who didn’t.
Evidence growing to add oily fish to diet to prevent type 2 diabetes
“Many current dietary guidelines recommend consumption of two servings of fish, preferably oily, per week, primarily based on cardiovascular benefits,” Dr. Qi said in an interview.
“No prior statements recommended oily fish for prevention of type 2 diabetes,” he explained, adding: “Our findings support future recommendations, but the evidence is not strong enough to make a [formal] recommendation now. We need evidence from clinical trials.”
Jason Wu, PhD, an epidemiologist at the University of New South Wales in Sydney, Australia, who specializes in this field but was not involved with the current study, said it “is a very well-conducted study, and certainly generates important new evidence supporting the potential benefits of regular consumption of oily fish.”
But he agrees that the evidence remains too preliminary for any official recommendations on eating oily fish for preventing the development of type 2 diabetes, including targeting advice to high-risk subgroups such as those with prediabetes or people who are obese.
Before any groups make recommendations, “we need to thoroughly review all the literature in this space to appraise the overall body of evidence,” Dr. Wu noted in an interview.
Oily fish: Solid evidence for prevention of CVD events
In contrast, the case for including oily fish in the diet to prevent CVD events seems settled. In 2018, a panel assembled by the American Heart Association to address the issue released a statement that concluded: “Current scientific evidence strongly supports the recommendation that seafood be an integral component of a heart-healthy dietary pattern.” It added that “a large body of evidence supports the recommendation to consume nonfried seafood, especially species higher in long-chain n-3 fatty acids, one to two times per week for cardiovascular benefits, including reduced risk of cardiac death, coronary heart disease, and ischemic stroke.”
The statement highlighted that “cold-water oily fish such as salmon, anchovies, herring, mackerel (Atlantic and Pacific), tuna (bluefin and albacore), and sardines have the highest levels” of long-chain n-3 fatty acids, notably eicosapentaenoic acid and docosahexaenoic acid, also collectively known as omega-3 fatty acids.
These fish types were among the oily fishes tallied in the UK Biobank data used by Dr. Qi and colleagues.
The case for fish oil supplements for preventing CVD events is much rockier, as summarized in a 2019 editorial, with some studies reporting no discernible effect while others indicate efficacy.
A second commentary from December 2020 highlighted how results from the REDUCE-IT trial showed clear benefit for preventing CVD using a highly purified form of fish oil, icosapent ethyl (Vascepa, Amarin). However, findings from two other recent reports, the STRENGTH and OMENI studies, failed to show CVD benefits from more conventional fish oil formulations.
Composite CVD and diabetes prevention effects?
The new findings by Dr. Qi and colleagues “highlight the need to specifically test the effect of fish oil supplements on glucose metabolism in people who cannot or choose not to regularly eat oily fish,” said Dr. Wu, a researcher at the George Institute for Global Health in Newtown, Australia.
“If eventually there is really strong evidence that fish, fish oil, or both have independent effects on both CVD and type 2 diabetes” it would be reasonable to integrate both outcomes into a single, composite, efficacy endpoint for the purpose of future studies, he added.
Dr. Qi agreed on both points. “A randomized, controlled trial of fish oil on type 2 diabetes as a primary outcome is needed. Most existing data are based on secondary analyses in the randomized trials for CVD,” he explained.
But, he added, “our results suggest a potential beneficial effect from fish oil supplements,” which implies that these may be “better than nothing” for people who can’t add oily fish to their regular diet.
The means by which fish and fish oil might slow or stop progression to type 2 diabetes remains uncertain.
The mechanisms for preventing both diabetes and CVD events may overlap, Dr. Qi noted, such as anti-inflammatory effects and improved insulin sensitivity, both of which have been observed in animal studies.
Evidence is “still lacking from human studies,” he explained, but if such mechanisms were at play, Dr. Wu said that would “add biologic plausibility” to a possible causal link between oily fish consumption and diabetes prevention.
“But we can’t assume that omega-3 fatty acids alone will have the same effect as oily fish, which obviously contains many other components.”
The study received no commercial funding. Dr. Qi and Dr. Wu have reported no relevant financial relationships.
A version of this article first appeared on Medscape.com.
People who report regularly eating oily fish had a significantly reduced risk for developing type 2 diabetes in a prospective, observational study of nearly 400,000 UK residents.
The results also show a significant, but weaker, positive link between regular use of fish oil supplements and a drop in the incidence of type 2 diabetes, Qibin Qi, PhD, and colleagues wrote in a report published in Diabetes Care. Their analysis failed to show a significant link between consumption of non-oily fish and type 2 diabetes onset.
The study is notable for being “the largest so far” to examine the link between fish consumption and type 2 diabetes incidence, and the first to establish a clear, significant association between regularly eating oily fish and a drop in the incidence of diabetes, said Dr. Qi, an epidemiologist at Albert Einstein College of Medicine in New York.
“At present, it is prudent to recommend fresh oily fish as a part of a healthy dietary pattern instead of fish oil supplements for diabetes prevention,” said Dr. Qi and coauthors.
The study included just over 392,000 adults without type 2 diabetes or cardiovascular disease at baseline enrolled in the UK Biobank. Median follow-up was just over 10 years, during which 7,262 participants developed diabetes.
Participants who ate either one, or two or more, servings of oily fish weekly each had a significant 22% lower rate of incident type 2 diabetes than that of those who ate no oily fish, after adjustment for multiple confounders. Those who reported regularly taking a fish oil supplement had a significant 9% lower incidence of type 2 diabetes than that of those who didn’t.
Evidence growing to add oily fish to diet to prevent type 2 diabetes
“Many current dietary guidelines recommend consumption of two servings of fish, preferably oily, per week, primarily based on cardiovascular benefits,” Dr. Qi said in an interview.
“No prior statements recommended oily fish for prevention of type 2 diabetes,” he explained, adding: “Our findings support future recommendations, but the evidence is not strong enough to make a [formal] recommendation now. We need evidence from clinical trials.”
Jason Wu, PhD, an epidemiologist at the University of New South Wales in Sydney, Australia, who specializes in this field but was not involved with the current study, said it “is a very well-conducted study, and certainly generates important new evidence supporting the potential benefits of regular consumption of oily fish.”
But he agrees that the evidence remains too preliminary for any official recommendations on eating oily fish for preventing the development of type 2 diabetes, including targeting advice to high-risk subgroups such as those with prediabetes or people who are obese.
Before any groups make recommendations, “we need to thoroughly review all the literature in this space to appraise the overall body of evidence,” Dr. Wu noted in an interview.
Oily fish: Solid evidence for prevention of CVD events
In contrast, the case for including oily fish in the diet to prevent CVD events seems settled. In 2018, a panel assembled by the American Heart Association to address the issue released a statement that concluded: “Current scientific evidence strongly supports the recommendation that seafood be an integral component of a heart-healthy dietary pattern.” It added that “a large body of evidence supports the recommendation to consume nonfried seafood, especially species higher in long-chain n-3 fatty acids, one to two times per week for cardiovascular benefits, including reduced risk of cardiac death, coronary heart disease, and ischemic stroke.”
The statement highlighted that “cold-water oily fish such as salmon, anchovies, herring, mackerel (Atlantic and Pacific), tuna (bluefin and albacore), and sardines have the highest levels” of long-chain n-3 fatty acids, notably eicosapentaenoic acid and docosahexaenoic acid, also collectively known as omega-3 fatty acids.
These fish types were among the oily fishes tallied in the UK Biobank data used by Dr. Qi and colleagues.
The case for fish oil supplements for preventing CVD events is much rockier, as summarized in a 2019 editorial, with some studies reporting no discernible effect while others indicate efficacy.
A second commentary from December 2020 highlighted how results from the REDUCE-IT trial showed clear benefit for preventing CVD using a highly purified form of fish oil, icosapent ethyl (Vascepa, Amarin). However, findings from two other recent reports, the STRENGTH and OMENI studies, failed to show CVD benefits from more conventional fish oil formulations.
Composite CVD and diabetes prevention effects?
The new findings by Dr. Qi and colleagues “highlight the need to specifically test the effect of fish oil supplements on glucose metabolism in people who cannot or choose not to regularly eat oily fish,” said Dr. Wu, a researcher at the George Institute for Global Health in Newtown, Australia.
“If eventually there is really strong evidence that fish, fish oil, or both have independent effects on both CVD and type 2 diabetes” it would be reasonable to integrate both outcomes into a single, composite, efficacy endpoint for the purpose of future studies, he added.
Dr. Qi agreed on both points. “A randomized, controlled trial of fish oil on type 2 diabetes as a primary outcome is needed. Most existing data are based on secondary analyses in the randomized trials for CVD,” he explained.
But, he added, “our results suggest a potential beneficial effect from fish oil supplements,” which implies that these may be “better than nothing” for people who can’t add oily fish to their regular diet.
The means by which fish and fish oil might slow or stop progression to type 2 diabetes remains uncertain.
The mechanisms for preventing both diabetes and CVD events may overlap, Dr. Qi noted, such as anti-inflammatory effects and improved insulin sensitivity, both of which have been observed in animal studies.
Evidence is “still lacking from human studies,” he explained, but if such mechanisms were at play, Dr. Wu said that would “add biologic plausibility” to a possible causal link between oily fish consumption and diabetes prevention.
“But we can’t assume that omega-3 fatty acids alone will have the same effect as oily fish, which obviously contains many other components.”
The study received no commercial funding. Dr. Qi and Dr. Wu have reported no relevant financial relationships.
A version of this article first appeared on Medscape.com.
TBI beats chemoconditioning for ALL transplants in children
The investigators sought to answer a question many physicians have raised: With improvements in human leukocyte antigen typing, better graft-versus-host disease prophylaxis, and other advances, can myeloablative chemotherapy conditioning replace TBI, which is more toxic?
The downstream effects of TBI can include secondary malignancies and cataracts, as well as impaired growth and impaired gonadal and cognitive function.
But the answer to that question is no, or at least, not yet.
The phase 3 trial included individuals with ALL who were aged 4-21 years at time of transplant. They were randomly assigned to receive either fractionated TBI at 12 Gy plus etoposide or chemotherapy based on a myeloablative regimen: fludarabine, thiotepa, and either busulfan or treosulfan.
The trial was stopped after 413 patients had undergone randomization – quite a bit short of the 1,000-patient goal. The trial was terminated because TBI proved clearly superior on an interim analysis at a median follow-up of 2.1 years.
The results showed that 72% of the TBI group – but only 51% of the chemotherapy arm – were relapse free at 2 years with no graft-versus-host disease (P = .0003).
The 2-year treatment-related mortality rate was 2% in the TBI group but 9% with chemotherapy conditioning (P = .03).
The study was published Feb. 1, 2020, in the Journal of Clinical Oncology.
“We recommend TBI plus etoposide conditioning for patients [aged over] 4 years old with high-risk ALL undergoing allogeneic HSCT [hematopoietic stem cell transplant],” they concluded. The investigators were led by Christina Peters, MD, a pediatrics professor at the St. Anna Children’s Cancer Research Institute, Vienna.
The benefits of TBI held on multivariate analysis and across subgroups, including children in their first and second remissions and among those with high-risk cytogenetics. Relapse risk factors, such as age at transplant, leukemic phenotype, and molecular aberrations, did not significantly affect outcomes, the authors reported.
Given that relapses plateaued with TBI at 2.5 years but were still on the upswing for patients who underwent chemoconditioning, “it is unlikely that secondary malignancies after TBI could jeopardize the survival advantage,” they wrote.
“So does this mean that the HCT community is forever chained to TBI as a standard of care? Certainly, it means that without very sound rationale to deviate, a TBI-based preparative regimen is the preferred therapy at present,” Michael Pulsipher, MD, head of blood and marrow transplantation at Children’s Hospital Los Angeles, commented in an accompanying editorial.
However, “there are approaches under study currently that may define patients who do not need TBI for high rates of cure,” he suggested. Those approaches include selecting patients with the deepest remissions and using KIR-favorable haplotype to harness natural killer cell activity.
“In our new world of chimeric antigen receptor T-cells and immunotherapies, surely we can find safer paths to success,” Dr. Pulsipher wrote.
With regard to patient selection, the investigators noted that a recent review that included more than 3,000 children with ALL found no overall survival benefit with TBI versus chemoconditioning for patients in first complete remission but worse outcomes with chemoconditioning among patients in second complete remission. “A similar trend was observed in our subgroup analyses; however, our study was not powered to assess statistical significance in a sample size of 413 patients,” they wrote.
Minimal residual disease did not influence survival outcomes, probably because the investigators were aggressive in inducing deep remission in their patients before transplant, so for most patients, MRD was undetectable or very low beforehand.
The study was funded by Amgen, Jazz Pharmaceuticals, Neovii, Medac, and others. Dr. Peters and coauthors, as well as Dr. Pulsipher have disclosed numerous ties with those and/or other companies.
A version of this article first appeared on Medscape.com.
EHR data harnessed to spot new risk factors for early-onset CRC

The models found that hypertension, cough, and asthma, among other factors, were important in explaining the risk of early-onset CRC. For some factors, associations emerged up to 5 years before diagnosis.
These findings were reported at the AACR Virtual Special Conference: Artificial Intelligence, Diagnosis, and Imaging (Abstract PR-10).
“The incidence of early-onset CRC has been rising 2% annually since 1994,” noted Michael B. Quillen, one of the study authors and a medical student at the University of Florida, Gainesville.
Inherited genetic syndromes and predisposing conditions such as inflammatory bowel disease account for about half of cases in this age group, but factors explaining the other half remain a mystery.
To shed light in this area, the investigators undertook a study of patients aged 50 years or younger from the OneFlorida Clinical Research Consortium who had at least 2 years of EHR data. This included 783 cases with CRC and 8,981 incidence density-matched controls, with both groups having a mean age of 36 years.
The patients were split into colon cancer and rectal cancer cohorts, and then further divided into four prediction windows, Mr. Quillen explained. Each prediction window started with the patient’s first recorded encounter date in the EHR and ended at 0, 1, 3, or 5 years before the date of diagnosis.
The investigators used machine-learning models to determine what features (e.g., diagnoses, procedures, demographics) were important in determining risk.
Results were expressed in charts that ranked the features by their SHAP (Shapley Additive Explanations) values, which reflect the average impact of a feature on the magnitude of model output.
Results: Top models and features
The top-performing models had areas under the curve of 0.61-0.75 for colon cancer risk, and 0.62-0.73 for rectal cancer risk, reported T. Maxwell Parker, another study author and medical student at the University of Florida, Gainesville.
For colon cancer, the top features for the 0-year cohort included some highly specific symptoms that would be expected in patients close to the diagnostic date: abdominal pain, anemia, blood in the stool, and various procedures such as CT scans. “These do not need a machine learning algorithm to identify,” Mr. Parker acknowledged.
However, there were also two noteworthy features present – cough and primary hypertension – that became the top features in the 1-year and 3-year cohorts, then dropped out in the 5-year cohort.
Other features that became important moving farther out from the diagnostic date of colon cancer, across the windows studied, were chronic sinusitis, atopic dermatitis, asthma, and upper-respiratory infection.
For rectal cancer, some previously identified factors – immune conditions related to infectious disease (HIV and anogenital warts associated with human papillomavirus) as well as amoxicillin therapy – were prominent in the 0-year cohort and became increasingly important going farther out from the diagnostic date.
Obesity was the top feature in the 3-year cohort, and asthma became important in that cohort as well.
None of the rectal cancer models tested performed well at identifying important features in the 5-year cohort.
The investigators are exploring hypotheses to explain how the identified features, especially the new ones such as hypertension and cough, might contribute to CRC carcinogenesis in young adults, according to Mr. Parker. As inclusion of older patients could confound associations, research restricted to those aged 50 years and younger may be necessary.
“We would like to validate these model findings in a second independent data set, and if they are validated, we would consider a prospective cohort study with those features,” Mr. Parker said. The team also plans to refine the models with the aim of improving their areas under the curve.
Thereafter, the team hopes to explore ways for implementing the findings clinically to support screening, which will require consideration of the context, Mr. Parker concluded. “Should we use high-sensitivity or low-specificity models for screening, or do we use the balance of both? Also, different models may be suitable for different situations,” he said.
Mr. Parker and Mr. Quillen disclosed no conflicts of interest. The study did not receive specific funding.
FROM AACR: AI, DIAGNOSIS, AND IMAGING 2021
The Match and COVID-19: Stolen interviews, swag bags, and stress
The final numbers won’t look much different, but the 2021 Match results will be unlike any before. As of mid-January, only 16 more institutions were confirmed to be participating in Match Day this year, resulting in about 800 more positions, said Donna Lamb, president and CEO of the National Resident Matching Program (NRMP). The Electronic Residency Application Service reported about 50,000 individual applicant submissions, a slight increase from prior years.
The stats may be similar, but the current residency application cycle may lead to wildly different results after the pandemic forced interviews to be conducted virtually and caused the cancellation of most away clinical rotations. Troy Amen, a fifth-year MD-MBA student at Harvard Medical School, Boston, and copresident of his student class, says the lack of on-campus, in-person experiences means students feel more in the dark than ever. The same is true for institutions. “The programs are also suffering because now they don’t know which students are a good ‘cultural fit’ for them,” he said.
Standing out has always been a concern for prospective residents, but Mr. Amen says fears are even higher this year. “[Institutions are] struggling to vet out 850 applicants, and they have no connection to us.”
Organizations have scrambled to keep the process as fair and informative as possible. “Everyone is trying to do the right thing here,” said Alison J. Whelan, MD, chief academic officer of the Association of American Medical Colleges (AAMC). She says that although the process has significantly changed, the heart of it remains the same. “The bottom line is directors really want to fill their intern class, and schools and students really want to match.”
Since the NRMP was established in 1952, it has never had to contend with a pandemic of this scale. The unprecedented circumstances have led to some much-feared and some unexpected changes, like top candidates “stealing” interview slots, “swag bags” sent to entice residents, beefed-up online profiles, as well as “Zoom fatigue,” a spike in home-field advantage for institutions, and massive anxiety for those students staking their future to a city they may have never seen in person.
What was lost and what was gained
“It’s really hard to get a real feel for the program when you’ve not been there in person,” said Christopher Smith, MD, director of the internal medicine residency program at Beth Israel Deaconess Medical Center in Boston. Dr. Smith recalled interviewing for residencies 25 years ago. His wife, a teacher, took time off to travel with him.
“She would ‘interview the town’ while I interviewed the program, and we compared notes at night,” he said. Because of COVID-19-related travel restrictions, just physically seeing the city in which they may live for years wasn’t an option for many. “I have a lot of sympathy for students applying right now,” Dr. Smith said.
For the residency class of 2021, the first shoe really dropped last March, when the AAMC issued guidance strongly recommending that programs pause clinical rotations away from their home schools. As established doctors know well, and as graduating medical students confirmed, these rotations are crucial to understanding a program’s culture and gaining experience that can boost candidacy. “I’m applying to orthopedic surgery, where away rotations are the gold standard for impressing attendees and residents at institutions away from home,” said Mr. Amen.
The pandemic completely cut off that key source of information to determine the right fit. It also meant applicants couldn’t have as diverse a portfolio of recommendation letters, something many worry may be detrimental to their soon-to-be-released Match rankings.
Unlike the loss of away rotations, the forced shift from in-person to virtual interviews had some meaningful benefits. Students no longer incurred expenses for airline flights, hotel rooms, and rental cars. Many organizations and programs have been trying for years to figure out how to lower the financial burden of interviews to make the process more equitable for those at economic or other disadvantage.
“The equity piece of this is huge – decreasing barriers and leveling the field a little bit is a really huge advantage,” said Kate Shaw, MD, residency program director and associate chair of education for the obstetrics and gynecology program at Stanford (Calif.) University. In some ways, this latest change is an extension of a strategy Dr. Shaw and others had already begun implementing.
“Over the last 5 to 10 years, we’ve been working to address the implicit bias in the application process, so we’ve gone to a holistic review of applicants, where we don’t have score cutoffs. We look at the whole person,” she said. “And we did that in an effort to increase diversity and equity.” Dr. Shaw and others hope that the accidental positive changes from COVID restrictions may be intentionally preserved long after the pandemic ends.
Home-field advantage vs. swag bags
Many medical students applying to residencies this year say they have given greater weight to their home programs than they might have without the pandemic. “I didn’t get a sense of anyone’s culture other than my home institution,” said Alex Skidmore, a fourth-year medical student at Washington University in St. Louis. “I definitely am ranking Wash-U higher.”
The desire to emphasize the known quality of a student’s home institution isn’t surprising to program directors. Dr. Shaw said she thinks this year’s Match could well end with a higher percentage of students matching either in their home programs or in programs close to loved ones. “The value of being close to family has come up in our conversations, where students are considering the right program for them but also the other life factors,” she said.
To overcome this home-field advantage, many programs have beefed up their websites, including providing video tours of their facilities. They also “upped their social media game” and encouraged residents to create online groups for prospective residents to share information about programs and life outside of work. Some residents even offered video tours of their personal apartments to applicants.
Without in-person access to facilities and staff, a program’s online presence became a deciding factor, applicants said. “If you have a bad website, it’s like having a dirty building to interview applicants in,” Mr. Skidmore said. For many prospective residents, an institution’s Internet presence was a “make or break” factor. “It’s the only thing I saw for many programs, and when we are doing the amount of research we are doing remotely, when I saw a program with a bad website, it made me not like the program as much,” he said.
Some programs, hoping to woo candidates as well as to provide them with more insight into what they and their cities have to offer, sent “swag bags” to candidates. These included things like gift cards for food delivery and offerings from local businesses. Washington University’s pediatrics residency program sent gooey butter cakes – a St. Louis staple – along with other treats from small businesses and copies of magazines that showcased the city’s dining and entertainment scene.
Other programs, even those at the same medical institution, felt quite strongly that those types of packages shouldn’t be sent. “We interviewed almost 500 applicants, so there was no way we could have afforded that,” said Dominique Cosco, MD, director of Washington University’s internal medicine residency program. “Our normal recruitment budget is almost $100,000 in a normal year, and that got cut because of COVID. For us, it was thinking about allocations of resources.”
Interview slot theft and zoom fatigue
Remote interviewing also meant that applicants could accept more interviews, something that raised a big concern. Without expenses or travel time, would top-tier candidates take more interviews than normal and thus take limited interview spots from other qualified candidates? Maybe so, says the AAMC’s Dr. Whelan.
“We didn’t have systematic data, but we heard from enough schools and programs ... that students who were maybe not the top-top ranked students in the class but in every way solid were receiving fewer interviews than previous years,” Dr. Whelan said. This is despite guidance that recommended programs add interview slots to serve as a counterbalance.
Some students say they accepted more interview slots in the beginning of the interview season, partly because they could, and partly because some thought of early interviews as “practice” for later interviews. However, as video interviews piled up, some of them described feeling “Zoom fatigue” and said they later canceled interviews with programs they didn’t anticipate joining.
More SOAP, less clarity
As for what comes next, the NRMP is preparing for a longer-than-normal Supplemental Offer and Acceptance Program (SOAP) than in years past. SOAP usually offers three rounds of matches after the initial Match Day; Ms. Lamb said things are different this year.
“SOAP will be the same number of days, but we’ve added an additional round on Thursday afternoon,” she said. Will it be unnecessary or not enough? Nobody knows. “How big SOAP actually is going to be is one of the things that we really don’t have a sense of right now and probably aren’t going to have a sense of until the Match.”
Uncertainty is the name of the game. More than any other Match before, programs and applicants won’t know how results from this pandemic year stack up for a few months at the very least. “I really want to see what this looks like on the other side,” Dr. Smith said. “Are applicants happy with the way it looks when they come here? Do they feel like they matched with the right place?”
Whether this unprecedented year will be remembered more for positive changes moving forward, including more flexibility on remote interviews, or for less-informed decisions that result in dissatisfied participants is also unclear.
“I think after the Match is over, we’ll be talking to everyone to get more perspective on what people who are applying now would tell the next class, and how programs can adjust,” said Kathy Diemer, MD, assistant dean for career counseling at Washington University. At the very least, those who are involved in this year after year can start thinking about what the future should look like.
“We’re going to need to do some kind of debriefing after this is over, both program directors and our students as well, so we can determine how to move forward next year and beyond.”
A version of this article first appeared on Medscape.com.
Nature or nurture in primary care?
Does the name Bruce Lipton sound familiar to you? Until a few years ago the only bell that it rang with me was that I had a high school classmate named Bruce Lipton. I recall that his father owned the local grocery store and he was one of the most prolific pranksters in a class with a long history of prank playing. If the name dredges up any associations for you it may because you have heard of a PhD biologist who has written and lectured extensively on epigenetics. You may have even read his most widely published book, “The Biology of Belief.” It turns out the Epigenetics Guy and my high school prankster classmate are one and the same.

After decades of separation – he is in California and I’m here in Maine – we have reconnected via Zoom mini reunions that our class has organized to combat the isolation that has descended on us with the pandemic. While I haven’t read his books, I have watched and listened to some of his podcasts and lectures. The devilish twinkle in his eye in the 1950s and 1960s has provided the scaffolding on which he has built a charismatic and persuasive presentation style.
Bruce was no dummy in school but his early career as a cell biologist doing research in stem-cell function was a surprise to all of us. But then high school reunions are often full of surprises and should serve as good reminders of the danger of profiling and pigeon-holing adolescents.
Professor Lipton’s take on epigenetics boils down to the notion that our genome should merely be considered a blueprint and not the final determinant of who we are and what illnesses befall us. His research and observations suggest to him that there are an uncountable number extragenomic factors, including environmental conditions and our belief systems, that can influence how that blueprint is read and the resulting expression of the genes we have inherited.
At face value, Bruce’s basic premise falls very close to some of the conclusions I have toyed with in an attempt to explain what I have observed doing primary care pediatrics. For example, I have trouble blaming the meteoric rise of the ADHD phenomenon on a genetic mutation. I suspect there are likely to be extragenomic forces coming into play, such as sleep deprivation and changing child-rearing practices. In my Oct. 9, 2020, Letters from Maine column I referred to a Swedish twins study that suggested children from a family with a strong history of depression were more likely to develop depression when raised in an adopted family that experienced domestic turmoil. His philosophy also fits with my sense that I have more control over my own health outcomes than many other people.
However, Professor Lipton and I part company (just philosophically that is) when he slips into hyperbole and applies what he terms as the New Biology too broadly. He may be correct that the revolutionary changes which came in the wake of Watson and Crick’s double helix discovery have resulted in a view of pathophysiology that is overly focused on what we are learning about our genome. On the other hand it is refreshing to hear someone with his charismatic and persuasive skills question the status quo.
If you haven’t listened to what he has to say I urge you to browse the Internet and sample some of his talks. I am sure you will find what he has to say stimulating. I doubt you will buy his whole package but I suspect you may find some bits you can agree with.
It still boils down to the old nature versus nurture argument. He’s all in for nurture. I’m still more comfortable straddling the fence.
Dr. Wilkoff practiced primary care pediatrics in Brunswick, Maine for nearly 40 years. He has authored several books on behavioral pediatrics, including “How to Say No to Your Toddler.” Other than a Littman stethoscope he accepted as a first-year medical student in 1966, Dr. Wilkoff reports having nothing to disclose. Email him at [email protected].
Does the name Bruce Lipton sound familiar to you? Until a few years ago the only bell that it rang with me was that I had a high school classmate named Bruce Lipton. I recall that his father owned the local grocery store and he was one of the most prolific pranksters in a class with a long history of prank playing. If the name dredges up any associations for you it may because you have heard of a PhD biologist who has written and lectured extensively on epigenetics. You may have even read his most widely published book, “The Biology of Belief.” It turns out the Epigenetics Guy and my high school prankster classmate are one and the same.
After decades of separation – he is in California and I’m here in Maine – we have reconnected via Zoom mini reunions that our class has organized to combat the isolation that has descended on us with the pandemic. While I haven’t read his books, I have watched and listened to some of his podcasts and lectures. The devilish twinkle in his eye in the 1950s and 1960s has provided the scaffolding on which he has built a charismatic and persuasive presentation style.
Bruce was no dummy in school but his early career as a cell biologist doing research in stem-cell function was a surprise to all of us. But then high school reunions are often full of surprises and should serve as good reminders of the danger of profiling and pigeon-holing adolescents.
Professor Lipton’s take on epigenetics boils down to the notion that our genome should merely be considered a blueprint and not the final determinant of who we are and what illnesses befall us. His research and observations suggest to him that there are an uncountable number extragenomic factors, including environmental conditions and our belief systems, that can influence how that blueprint is read and the resulting expression of the genes we have inherited.
At face value, Bruce’s basic premise falls very close to some of the conclusions I have toyed with in an attempt to explain what I have observed doing primary care pediatrics. For example, I have trouble blaming the meteoric rise of the ADHD phenomenon on a genetic mutation. I suspect there are likely to be extragenomic forces coming into play, such as sleep deprivation and changing child-rearing practices. In my Oct. 9, 2020, Letters from Maine column I referred to a Swedish twins study that suggested children from a family with a strong history of depression were more likely to develop depression when raised in an adopted family that experienced domestic turmoil. His philosophy also fits with my sense that I have more control over my own health outcomes than many other people.
However, Professor Lipton and I part company (just philosophically that is) when he slips into hyperbole and applies what he terms as the New Biology too broadly. He may be correct that the revolutionary changes which came in the wake of Watson and Crick’s double helix discovery have resulted in a view of pathophysiology that is overly focused on what we are learning about our genome. On the other hand it is refreshing to hear someone with his charismatic and persuasive skills question the status quo.
If you haven’t listened to what he has to say I urge you to browse the Internet and sample some of his talks. I am sure you will find what he has to say stimulating. I doubt you will buy his whole package but I suspect you may find some bits you can agree with.
It still boils down to the old nature versus nurture argument. He’s all in for nurture. I’m still more comfortable straddling the fence.
Dr. Wilkoff practiced primary care pediatrics in Brunswick, Maine for nearly 40 years. He has authored several books on behavioral pediatrics, including “How to Say No to Your Toddler.” Other than a Littman stethoscope he accepted as a first-year medical student in 1966, Dr. Wilkoff reports having nothing to disclose. Email him at [email protected].