User login
Richard Franki is the associate editor who writes and creates graphs. He started with the company in 1987, when it was known as the International Medical News Group. In his years as a journalist, Richard has worked for Cap Cities/ABC, Disney, Harcourt, Elsevier, Quadrant, Frontline, and Internet Brands. In the 1990s, he was a contributor to the ill-fated Indications column, predecessor of Livin' on the MDedge.
Oregon lowest in obesity among children aged 10-17 years
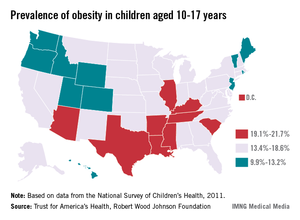
Oregon had the lowest rate of obesity in children aged 10-17 years in 2011, while Mississippi had the highest rate, the Trust for America’s Health and the Robert Wood Johnson Foundation reported.
In Oregon, 9.9% of children aged 10-17 were obese (defined as a body mass index in the 95th to 98th percentile for age group). At 10.0%, New Jersey had the next-lowest rate, followed by Idaho (10.6%), Wyoming (10.7%), and Colorado (10.9%), according to "F as in Fat: How Obesity Threatens America’s Future 2013."
In Mississippi, 21.7% of children aged 10-17 years were obese, with South Carolina second highest at 21.5%. The District of Columbia had the third-highest rate at 21.4%, followed by Louisiana at 21.1% and Tennessee at 20.5%, according to the report.
The data on childhood obesity are from the National Survey of Children's Health – conducted by the U.S. Health Resources and Services Administration – and involved 95,677 completed child-level interviews.

Almost 70% of Louisiana adults are overweight or obese
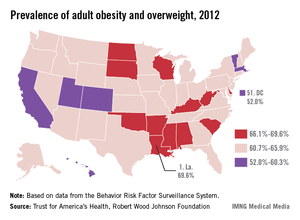
Louisiana had the highest combined rate of adult obesity and overweight in the United States in 2012, the Trust for America’s Health and the Robert Wood Johnson Foundation reported.
Just under 70% of the state’s adult population was either overweight or obese, slightly more than Mississippi’s 69.0% rate and Arkansas’ 68.8%, according to "F as in Fat: How Obesity Threatens America’s Future 2013."
On the other end of the scale, the lowest combined rate of obesity and overweight was in the District of Columbia, where 52.0% of adults had a body mass index of 25-29.9 kg/m2 (overweight) or 30 or more (obese). The next lowest rate was in Colorado, with 55.7%, followed by Hawaii (56.1%), Utah (57.8%), and Massachusetts (58.8%), the report noted.

Approximately 25% of young, white women report indoor tanning
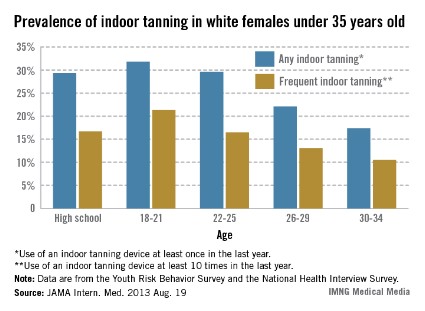
Almost one-third of white female high school students and one-quarter of white women aged 18-34 years used indoor tanning devices over a 12-month period, researchers at the Centers for Disease Control and Prevention reported.
Data from the 2011 Youth Risk Behavior Survey showed that 29.3% of the 2,527 non-Hispanic white female high school respondents reported using a sunlamp, sun bed, or tanning booth in the previous 12 months, and 16.7% reported frequent (at least 10 times in the previous year) use of tanning devices, said Gery P. Guy Jr., Ph.D., of the CDC’s Division of Cancer Prevention and Control and his associates (JAMA Intern. Med. 2013 Aug. 19 [doi:10.1001/jamainternmed.2013.10013]).
Among white women aged 18-34 years, 24.9% had used a tanning device at least once in the previous 12 months and 15.1% had used one at least 10 times, according to data from the 2010 National Health Interview Survey. The younger women in that age range were more likely to use tanning devices; 31.8% of women aged 18-21 years reported any use and 21.3% reported frequent use, compared with 17.4% and 10.7%, respectively, in women aged 30-34 years, the investigators wrote.
FROM JAMA INTERNAL MEDICINE
Oregon has highest rate of kindergarten vaccine exemptions
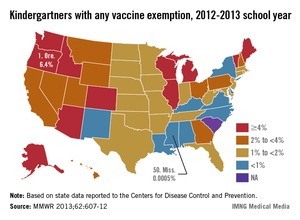
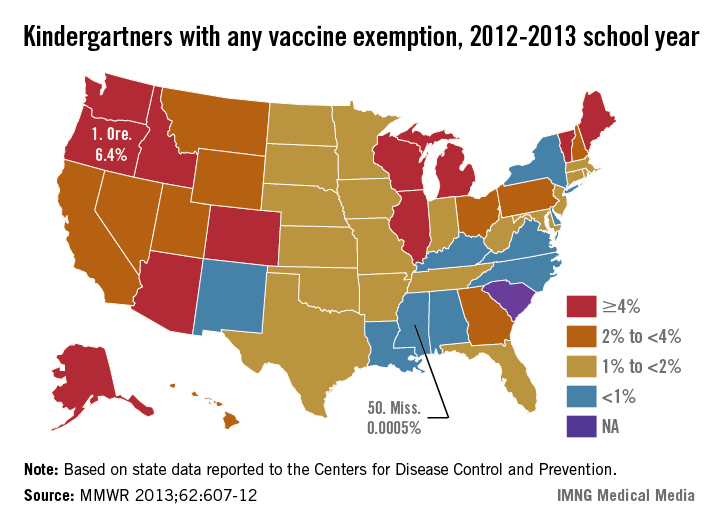
Oregon has the highest percentage of children enrolled in kindergarten who have been exempted from receiving at least one vaccine, the Centers for Disease Control and Prevention reported.
For the 2012-2013 school year, the state’s kindergarten students had a vaccine exemption rate of 6.4%. Illinois and Vermont were tied for second at 6.1%, with Idaho and Michigan next at 5.9%. Alaska, which had the highest rate last year at 7.0%, dropped to 5.6% this year, the CDC said.
Mississippi, at 0.0005%, had the lowest rate of kindergartners with vaccine exemptions. New Mexico had the second-lowest rate (0.4%), followed by Virginia at 0.5% and Alabama, Delaware, Kentucky, Louisiana, and New York (all at 0.7%), according to the CDC.
The median rate for the 49 states (and the District of Columbia) that reported exemptions was 1.8%. The CDC noted that "an exemption does not necessarily imply a child was not vaccinated."
Few states meet palliative care benchmark
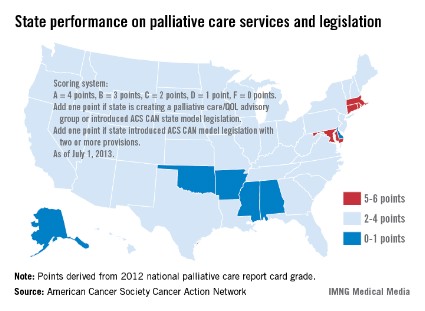
Only four states have effective strategies in place to improve access to and knowledge of palliative care services, the American Cancer Society Cancer Action Network reported.
The ACS CAN awarded top scores (5-6 points) to Connecticut, Maryland, Massachusetts, and Rhode Island using a scoring system that combines grades from the Center to Advance Palliative Care’s national palliative care report card with actions on model legislation.
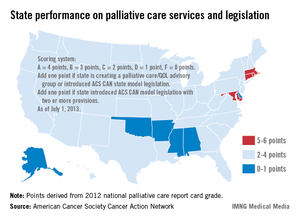
The four states passed laws "this session that focus on improving patient quality of life through palliative care," the ACS CAN noted, with Maryland finally crossing "the finish line with a palliative care bill after a 3-year effort."
The six states on the low end of the scoring range (0-1 points) were Alabama, Alaska, Arkansas, Delaware, Mississippi, and Oklahoma, the ACS CAN said in its report.
Palliative care is 1 of 10 legislative priority areas – including comprehensive smoke-free laws, tobacco taxes, restrictions on tanning bed use by minors, improved access to Medicaid, balanced pain policies, and time requirements for physical education in schools – measured by the ACS CAN. The network said that 38 states have reached benchmarks in three or fewer of the 10 areas, and that no states met the benchmarks in more than six areas.
"Many state legislatures are missing opportunities to enact laws and policies that could not only generate new revenue and long-term health savings, but also save lives," the ACS CAN said in a statement.
Only four states have effective strategies in place to improve access to and knowledge of palliative care services, the American Cancer Society Cancer Action Network reported.
The ACS CAN awarded top scores (5-6 points) to Connecticut, Maryland, Massachusetts, and Rhode Island using a scoring system that combines grades from the Center to Advance Palliative Care’s national palliative care report card with actions on model legislation.
The four states passed laws "this session that focus on improving patient quality of life through palliative care," the ACS CAN noted, with Maryland finally crossing "the finish line with a palliative care bill after a 3-year effort."
The six states on the low end of the scoring range (0-1 points) were Alabama, Alaska, Arkansas, Delaware, Mississippi, and Oklahoma, the ACS CAN said in its report.
Palliative care is 1 of 10 legislative priority areas – including comprehensive smoke-free laws, tobacco taxes, restrictions on tanning bed use by minors, improved access to Medicaid, balanced pain policies, and time requirements for physical education in schools – measured by the ACS CAN. The network said that 38 states have reached benchmarks in three or fewer of the 10 areas, and that no states met the benchmarks in more than six areas.
"Many state legislatures are missing opportunities to enact laws and policies that could not only generate new revenue and long-term health savings, but also save lives," the ACS CAN said in a statement.
Excessive alcohol use costs $2.9 billion per state
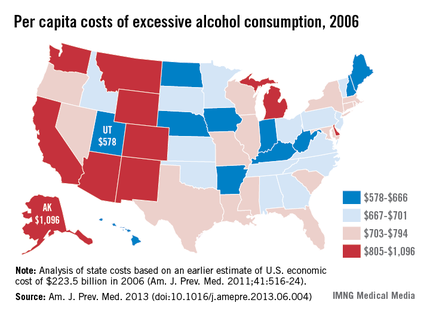
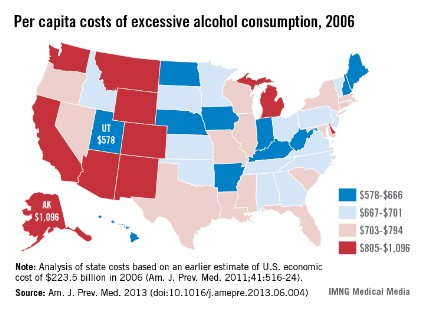
Excessive alcohol consumption, mainly binge drinking, cost each state a median of $2.9 billion in 2006, according to a new study released Aug. 13 by the Centers for Disease Control and Prevention.
Eight of the 10 states with the highest per capita costs were in the West, with Alaska leading at $1,096. New Mexico was second at $960, and Wyoming was third, with a cost of $909 per person, reported Dr. Jeffrey J. Sacks of Sue Binder Consulting and his associates (Am. J. Prev. Med. 2013 [doi: 10.1016/j.amepre.2013.06.004]).
The state on the bottom rung of the excessive alcohol consumption cost ladder was Utah, with a per capita cost of $578 in 2006. Next up were West Virginia ($621), Iowa ($622), Nebraska ($632), and Hawaii ($639), the investigators said.
Binge drinking – five or more drinks consumed on one occasion for men and four for women – was responsible for a median of 76.6% of the excessive alcohol use–related costs, with underage drinking responsible for 11.2%, they noted.
"Excessive alcohol use has devastating impacts on individuals, families, communities, and the economy," CDC Director Tom Frieden said in a statement. "In addition to injury, illness, disease, and death, it costs our society billions of dollars through reduced work productivity, increased criminal justice expenses, and higher health care costs."
This analysis used data from an earlier CDC study, which put the national economic cost of excessive alcohol use at $223.5 billion (Am. J. Prev. Med. 2011;41:516-24). The current study was supported by the CDC. No financial disclosures were reported by the authors.
FROM AMERICAN JOURNAL OF PREVENTIVE MEDICINE
Esophageal cancer deaths down for blacks, up for whites
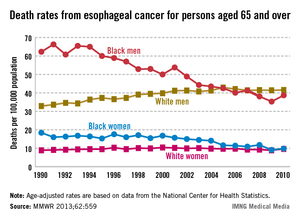
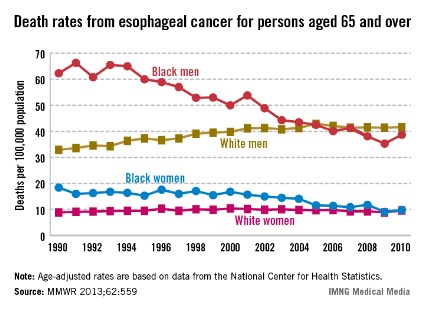
Among Americans aged 65 years and older, the death rate from esophageal cancer decreased by 47% for black women and 38% for black men from 1990 to 2010 while increasing by 26% among white men, according to the Centers for Disease Control and Prevention.
The death rate for white women aged 65 years and older went up about 8% over that same time period.
The age-adjusted death rate for black men took the largest absolute drop – from 62.3 deaths/100,000 population in 1990 to 38.7 in 2010. For black women, the rate dropped from 18.4/100,000 in 1990 to 9.8 in 2010. The corresponding increases took white men from 32.9 to 41.6 deaths/100,000 – with a peak of 42.9 in 2005 – and white women from 8.9 to 9.6, which was down from the peak of 10.4 in 2000, the CDC reported (MMWR 2013;62:559).
U.S. first in obesity among developed countries
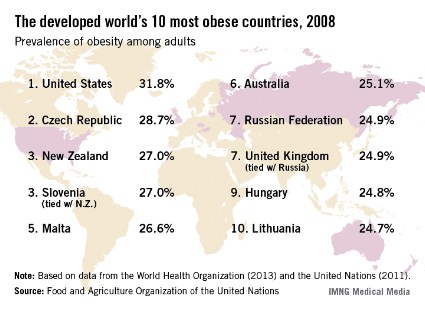
With an adult obesity rate of 31.8%, the United States is the most obese of the world’s developed countries, according to a report by the Food and Agriculture Organization of the United Nations.
As of 2008 – the year considered in the report – the Czech Republic was second in obesity among the developed world, with an adult obesity rate of 28.7%, the Food and Agriculture Organization said in "The State of Food and Agriculture 2013."
The most obese country in the developing world – in the entire world, in fact – was the Pacific island nation of Nauru, with an adult obesity rate of 71.1% and an overall population of around 10,000. The second-most obese country in the world was another tropical Pacific nation, the Cook Islands, with an adult obesity rate of 64.1%.
The report defined obesity as a body mass index of 30 kg/m2 or higher and considered adults to be anyone over age 20. The United Nations categorizes approximately 25% of countries as the developed world, which consists of all of Europe, northern America (Bermuda, Canada, Greenland, Saint Pierre and Miquelon, and the United States), Australia, Japan, and New Zealand.
Deaths from lightning down 78% since 1968
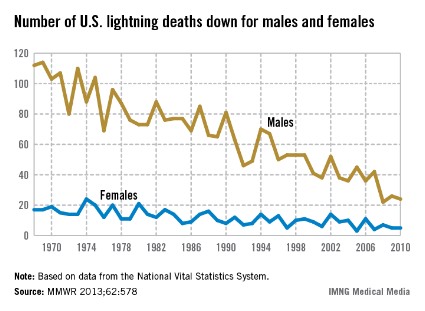
The number of deaths caused annually by lightning in the United States has dropped by almost 78% since 1968, according to the Centers for Disease Control and Prevention.
The total number of deaths in 2010 – the last year for which data are available – was 29, compared with 129 in 1968. There were 24 deaths among males in 2010, a drop of 78.6% from the 112 deaths in 1968. Among women, the number of deaths decreased by 70.6% – from 17 deaths in 1968 to 5 in 2010, the CDC reported (MMWR 2013;62:578).
During the 43-year period from 1968 to 2010, a total of 3,389 deaths were caused by lightning, with 85% occurring in males, the CDC said.
FROM MMWR
Injuries/poisonings the leading cause of pediatric ED visits
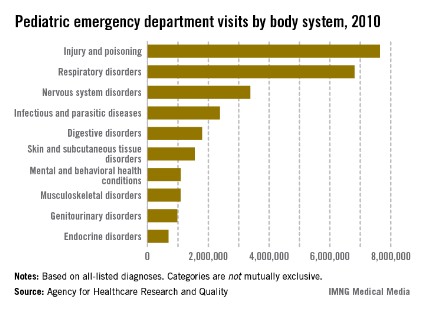
Injuries and poisonings were the most common reason for children to end up in the emergency department in 2010, accounting for over 7.6 million visits, the Agency for Healthcare Research and Quality reported.
There were a total of over 25.5 million ED visits by children under age 18 in 2010, with respiratory disorders being the second most common all-listed condition (6.8 million visits). The next most common reason was nervous system disorders (3.4 million visits), followed by infectious and parasitic diseases (2.4 million) and digestive disorders (1.8 million), according to the AHRQ.
Because the Healthcare Cost and Utilization Project – source of the AHRQ data – tracks all of a patient’s listed diagnoses, the body system categories are not mutually exclusive.