User login
Richard Franki is the associate editor who writes and creates graphs. He started with the company in 1987, when it was known as the International Medical News Group. In his years as a journalist, Richard has worked for Cap Cities/ABC, Disney, Harcourt, Elsevier, Quadrant, Frontline, and Internet Brands. In the 1990s, he was a contributor to the ill-fated Indications column, predecessor of Livin' on the MDedge.
More hospitals providing palliative care
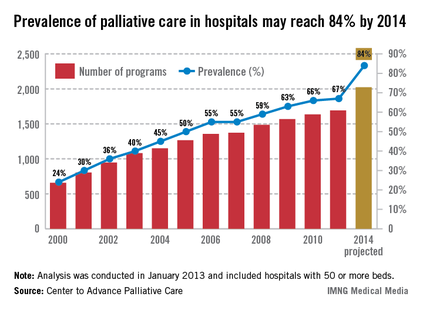
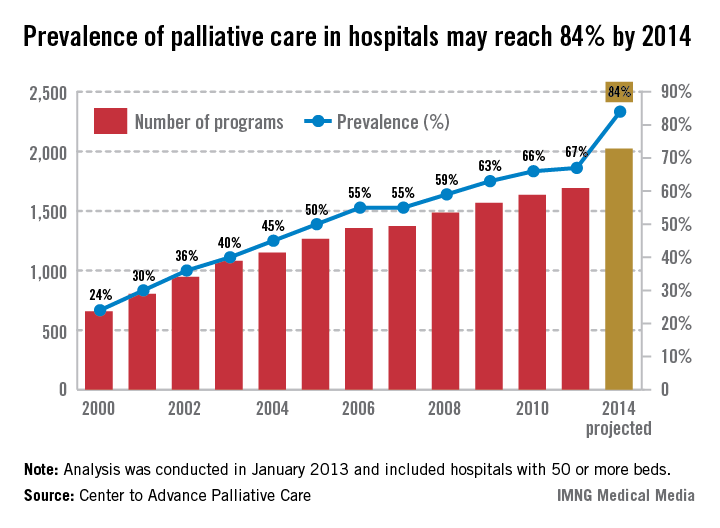
The prevalence of palliative care programs in U.S. hospitals is expected to reach 84% by 2014, according to an analysis from the Center to Advance Palliative Care.
From 2000 to 2011, the number of hospitals with 50 or more beds that had a palliative care program went from 658 to 1,692, an increase of 157%. If that trend continues, there should be 2,023 hospitals – approximately 84% – providing palliative care in the United States by 2014, the CAPC reported.
The CAPC analysis, conducted in January 2013, involved data from the American Hospital Association and the center’s own National Palliative Care Registry.
Gastroenterologists generating less revenue for hospitals
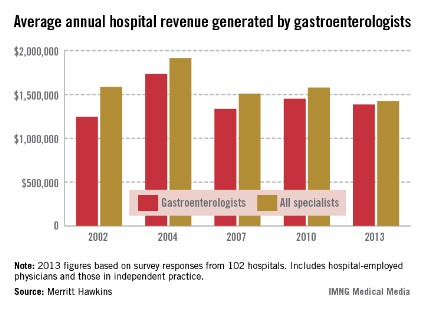
Average annual hospital revenue generated by gastroenterologists dropped 4.5% from 2010 to 2013, according to a survey by physician job placement firm Merritt Hawkins.
Average revenue of $1.39 million was reported for gastroenterologists in 2013, down from $1.45 million in 2010.
The 4.5% drop for gastroenterologists is smaller, however, than the decreases reported for all specialists (–9.7%) and all physicians (–6.2%). Mean hospital revenue generated in 2013 for all specialists was $1.42 million, which is the lowest Merritt Hawkins has reported since it started the survey in 2002, the report noted.
The average net revenue generated for all physicians was $1.45 million, which is, again, the lowest average since 2002, Merritt Hawkins said in its analysis.
The survey was sent to more than 3,000 hospitals in January 2013 and was completed by 102 hospital chief financial officers.
Ob.gyns. generating more revenue for hospitals
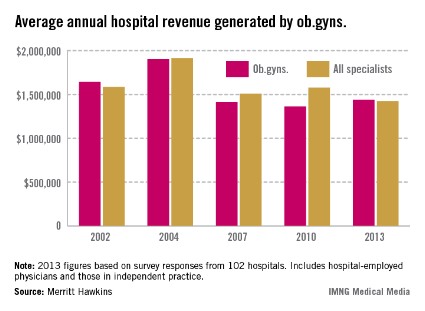
Average annual hospital revenue generated by ob.gyns. increased 5.5% from 2010 to 2013, bucking the trend of declining revenue among specialists, according to a survey by physician job placement firm Merritt Hawkins.
Average revenue of $1.44 million was reported for ob.gyns. in 2013, up from $1.36 million in 2010.
That rise compares favorably with revenue decreases reported for all specialists (–9.7%) and all physicians (–6.2%). Hospital revenue generated was $1.42 million for all specialists in 2013. The specialists’ average is the lowest Merritt Hawkins has reported since it started the survey in 2002, the report noted.
The average net revenue generated for all physicians was $1.45 million – down from 1.54 million in 2010 and, again, the lowest average since the survey began, Merritt Hawkins said in its analysis.
The survey was sent to more than 3,000 hospitals in January 2013 and was completed by 102 hospital chief financial officers.
Johns Hopkins named top hospital for 2013-14
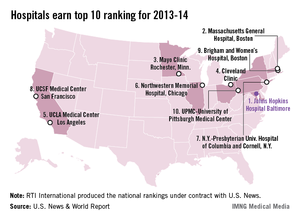
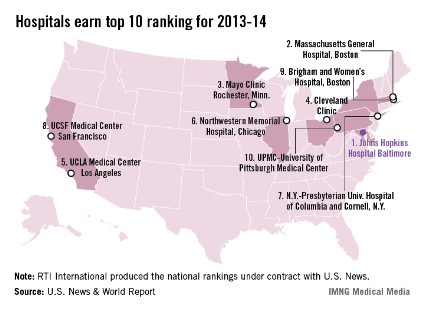
Johns Hopkins Hospital in Baltimore regained the top spot in the annual ranking of U.S. hospitals conducted by U.S. News and World Report after finishing second to Massachusetts General Hospital in Boston last year.
Massachusetts General was second this year, with the Mayo Clinic (Rochester, Minn.) ranked third, the Cleveland Clinic fourth, and the UCLA Medical Center in Los Angeles fifth, U.S. News reported.
The number six hospital, Northwestern Memorial in Chicago, made the biggest jump from last year among the top hospitals, moving up from 12th place. Also moving up six places was UCSF Medical Center in San Francisco, which went from 13th to 7th. Dropping out of the top 10 this year were Barnes-Jewish Hospital/Washington University (dropping from 6th to 15th) in St. Louis and Duke University Medical Center (from 8th to 12th) in Durham, N.C.
The ranking process initially considered 4,806 nonfederal hospitals, which were rated in 12 data-driven specialties and four reputation-only specialties. In the 12 data-driven specialties, scores were based on four elements: reputation with specialists (32.5%), survival (32.5%), patient safety (5%), and other care-related indicators (30%). The research organization RTI International conducted the physician survey and produced the Best Hospitals methodology and national rankings under contract with U.S. News.
Neurologists generating less revenue for hospitals
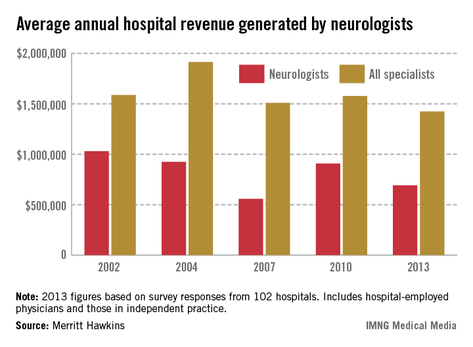
Average annual hospital revenue generated by neurologists decreased almost 24% from 2010 to 2013, according to a survey by physician job placement firm Merritt Hawkins.
Average revenue of $691,000 was reported for neurologists in 2013, down from $907,000 in 2010.
The 24% drop is even larger than the decreases reported for all specialists (–9.7%) and all physicians (–6.2%). Mean hospital revenue generated in 2013 for all specialists was $1.42 million, which is the lowest Merritt Hawkins has reported since it started the survey in 2002, the report noted.
The average net revenue generated for all physicians was $1.45 million – down from $1.54 million in 2010 and, again, the lowest average since the survey began, Merritt Hawkins said in its analysis.
The survey was sent to more than 3,000 hospitals in January 2013 and was completed by 102 hospital chief financial officers.

Oncologists generating more revenue for hospitals
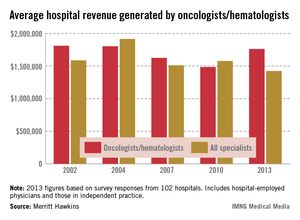
Average annual hospital revenue generated by oncologists and hematologists rose 18.5% from 2010 to 2013, according to a survey by physician job placement firm Merritt Hawkins.
Although "services provided by hematologists/oncologists have seen significant cuts" in the last few years, the survey authors noted, "new, more sophisticated and more expensive chemotherapy drugs have come into use, and Medicare generally does not deny payment for the use of these drugs."
Average revenue of $1.76 million was reported for hematologists/oncologists in 2013. That compares with almost $1.42 million for all specialists and $1.57 million for all primary care physicians. The specialists’ average is the lowest Merritt Hawkins has reported since it started the survey in 2002 and is lower than the primary care average for the first time ever, the report noted.
The average net revenue generated for all physicians was $1.45 million – a drop of 6.2% from 2010 and, again, the lowest average since 2002, Merritt Hawkins said in its analysis.
The survey was sent to 5,500 hospitals in January 2013 and completed by 102 hospital chief financial officers.

Psychiatrists generating slightly more hospital revenue
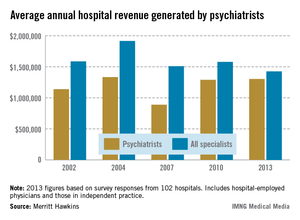
Average annual hospital revenue generated by psychiatrists increased 1% from 2010 to 2013, bucking the trend of declining revenue among specialists, according to a survey by physician job placement firm Merritt Hawkins.
Average revenue of $1.3 million was reported for psychiatrists in 2013, up from $1.29 million in 2010.
That small rise compares favorably with revenue decreases reported for all specialists (–9.7%) and all physicians (–6.2%). Hospital revenue generated was $1.42 million for all specialists in 2013. The specialists’ average is the lowest Merritt Hawkins has reported since it started the survey in 2002, the report noted.
The average net revenue generated for all physicians was $1.45 million – down from 1.54 million in 2010 and, again, the lowest average since the survey began, Merritt Hawkins said in its analysis.
The survey was sent to 5,500 hospitals in January 2013 and was completed by 102 hospital chief financial officers.

General surgeons and specialties generating less revenue for hospitals
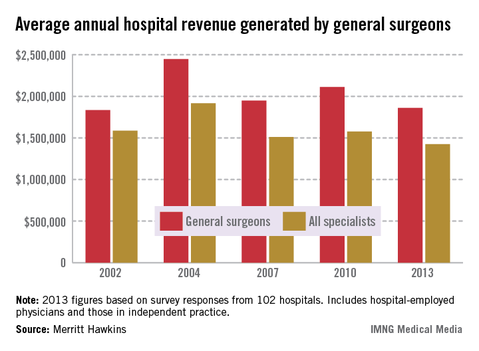
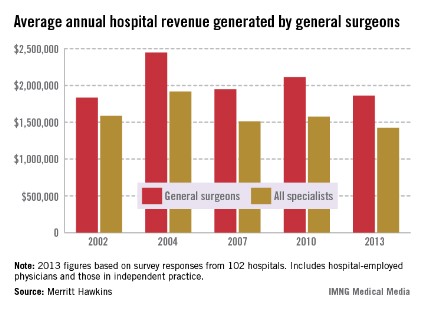
Average annual hospital revenue generated by general surgeons dropped 11.9% from 2010 to 2013, according to a survey by physician job placement firm Merritt Hawkins.
The decrease is in line with the overall picture of net revenue earned by hospitals. The average net revenue generated for all physicians was $1.45 million – a drop of 6.2% from 2010 and, again, the lowest average since 2002, Merritt Hawkins said in its analysis.
The trend of dropping revenue "may be tied to changing venues of care as urgent care centers and occupational medicine centers absorb general surgery work previously done in hospitals," the survey authors wrote.
Average revenue of $1.86 million was reported for general surgeons in 2013, down from $2.11 million in 2010. By comparison, hospital revenue generated was almost $1.42 million for all specialists and $1.57 for all primary care physicians in 2013. The specialists’ average is the lowest Merritt Hawkins has reported since it started the survey in 2002 and is lower than the primary care average for the first time ever, the report noted.
The survey was sent to 5,500 hospitals in January 2013 and was completed by 102 hospital chief financial executives.
Pediatricians generating less revenue for hospitals
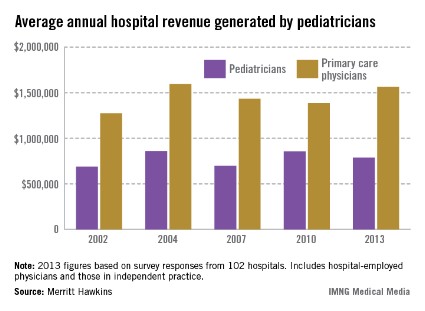
Average annual hospital revenue generated by pediatricians dropped 8% from 2010 to 2013, according to a survey by physician job placement firm Merritt Hawkins.
Average revenue of $788,000 was reported for pediatricians in 2013, down from $856,000 in 2010.
That drop came despite gains among primary care physicians overall. Family physicians and internists are more likely than pediatricians to work for hospitals, the survey authors noted, and "as primary care physicians become hospital employees, they may be more likely to divert tests, therapies, and other services ‘in-house’ to their hospital employer, rather than to outside resources such as radiology groups or labs."
By comparison, hospital revenue generated was $1.57 million for all primary care physicians and $1.42 million for all specialists in 2013. The specialists’ average is the lowest Merritt Hawkins has reported since it started the survey in 2002 and is lower than the primary care average for the first time ever, the report noted.
The average net revenue generated for all physicians was $1.45 million – a drop of 6.2% from 2010 and, again, the lowest average since the survey began, Merritt Hawkins said in its analysis.
The survey was sent to 5,500 hospitals in January 2013 and was completed by 102 hospital chief financial officers.
Family physicians generating more revenue for hospitals
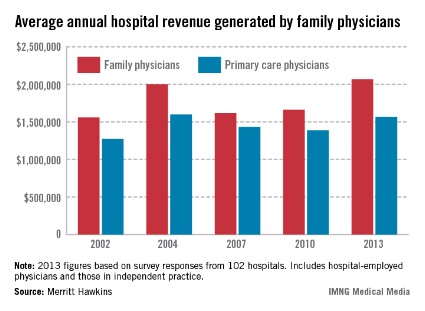
Average annual hospital revenue generated by family physicians rose more than 24% from 2010 to 2013, according to a survey by physician job placement firm Merritt Hawkins.
This increase "may be a result of the recent trend toward hospital employment of doctors," the survey authors noted, adding that primary care physicians employed by hospitals "may be more likely to divert tests, therapies, and other services ‘in-house’ to their hospital employer, rather than to outside resources such as radiology groups or labs."
Average revenue of $2.07 million was reported for family physicians in 2013, up from $1.66 million in 2010 and the highest seen since the survey began. By comparison, hospital revenue generated was $1.57 million for all primary care physicians and almost $1.42 million for all specialists in 2013. The specialists’ average is the lowest Merritt Hawkins has reported since it started the survey in 2002 and is lower than the primary care average for the first time ever, the report noted.
The average net revenue generated for all physicians was $1.45 million – a drop of 6.2% from 2010 and, again, the lowest average since the survey began, Merritt Hawkins said in its analysis.
The survey was sent to 5,500 hospitals in January 2013 and was completed by 102 hospital chief financial executives.