User login
Richard Franki is the associate editor who writes and creates graphs. He started with the company in 1987, when it was known as the International Medical News Group. In his years as a journalist, Richard has worked for Cap Cities/ABC, Disney, Harcourt, Elsevier, Quadrant, Frontline, and Internet Brands. In the 1990s, he was a contributor to the ill-fated Indications column, predecessor of Livin' on the MDedge.
Hospital revenue generated by cardiologists continues to drop
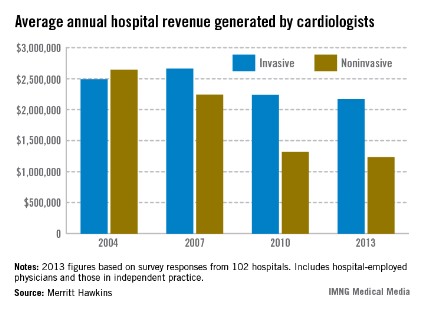
Average annual hospital revenue generated by invasive cardiologists dropped 3.2% from 2010 to 2013, while the revenue generated by noninvasive cardiologists dropped 6.6%, according to a survey by physician job placement firm Merritt Hawkins.
"In the last several years, some services provided by cardiologists have been considered reimbursement ‘outliers’ by Medicare and have been targeted for significant" cuts, the survey authors noted, adding that "revenues generated by invasive cardiologists for hospitals can be expected to decline in coming years."

Average revenue of $2.17 million was reported for invasive cardiologists and just under $1.23 million for noninvasive cardiologists in 2013. That compares with almost $1.42 million for all specialists and $1.57 for all primary care physicians. The specialists’ average is the lowest Merritt Hawkins has reported since it started the survey in 2002 and is lower than the primary care average for the first time ever, the report noted.
The average net revenue generated for all physicians was $1.45 million – a drop of 6.2% from 2010 and, again, the lowest average since 2002, Merritt Hawkins said in its analysis.
The survey was sent to 5,500 hospitals in January 2013 and completed by 102 hospital chief financial officers.
Average annual hospital revenue generated by invasive cardiologists dropped 3.2% from 2010 to 2013, while the revenue generated by noninvasive cardiologists dropped 6.6%, according to a survey by physician job placement firm Merritt Hawkins.
"In the last several years, some services provided by cardiologists have been considered reimbursement ‘outliers’ by Medicare and have been targeted for significant" cuts, the survey authors noted, adding that "revenues generated by invasive cardiologists for hospitals can be expected to decline in coming years."
Average revenue of $2.17 million was reported for invasive cardiologists and just under $1.23 million for noninvasive cardiologists in 2013. That compares with almost $1.42 million for all specialists and $1.57 for all primary care physicians. The specialists’ average is the lowest Merritt Hawkins has reported since it started the survey in 2002 and is lower than the primary care average for the first time ever, the report noted.
The average net revenue generated for all physicians was $1.45 million – a drop of 6.2% from 2010 and, again, the lowest average since 2002, Merritt Hawkins said in its analysis.
The survey was sent to 5,500 hospitals in January 2013 and completed by 102 hospital chief financial officers.
Medicare uses more brand-name drugs than does VA
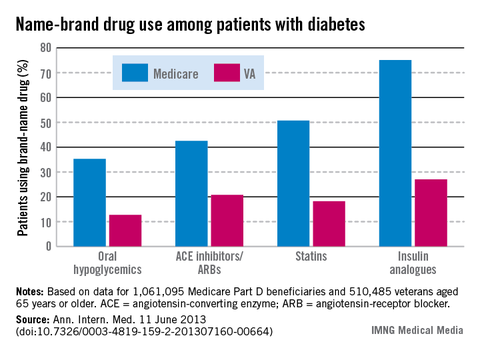
Among patients with diabetes, use of brand-name drugs was two to three times higher for Medicare than for the Department of Veterans Affairs in 2008, according to a new study in Annals of Internal Medicine.
That led to increased costs "at a time when the U.S. government is facing substantial budget pressures," wrote Dr. Walid F. Gellad of the Veterans Affairs Center for Heath Equity Research and Promotion, Pittsburgh, and his associates (Ann. Intern. Med. 2013 June 11 [doi:10.7326/0003-4819-159-2-201307160-00664]).
The investigators calculated the percentage of diabetes patients using brand name drugs for four common medication classes: oral hypoglycemics (35% for Medicare vs. 13% for VA), angiotensin-converting enzyme (ACE) inhibitors and angiotensin-receptor blockers (43% for Medicare vs. 21% for VA), statins (51% vs. 18%), and insulin analogues (75% vs. 27%).
Had Medicare used generic drugs at a level comparable with the VA system, it would have saved over $1 billion on the diabetes population alone, the investigators noted.
The study was funded by the Department of Veterans Affairs, the National Institutes of Health, and the Robert Wood Johnson Foundation.
FROM ANNALS OF INTERNAL MEDICINE

Teen birth rate down almost 50% since 1991
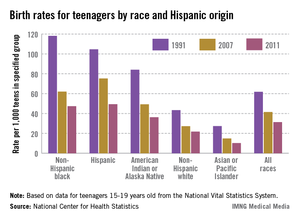
The birth rate among teenagers in the United States dropped by nearly half from 1991 to 2011, with declines seen among all of the largest population groups, the National Center for Health Statistics reported.
The birth rate for women aged 15-19 years was 31.3 per 1,000 – a record low – in 2011, down just over 49% from the rate of 61.8 per 1,000 teenagers in 1991. Childbearing fell by 50% or more for non-Hispanic white, Hispanic, and American Indian/Alaska native teenagers over that time period, and dropped at least 60% for non-Hispanic black and Asian/Pacific Islander teens, the NCHS said.
Data from the National Vital Statistics System’s Natality Date File, which includes information on all births in the United States, show that a brief increase in births occurred among teenagers aged 15-19 years in 2006 and 2007. Since then, Hispanic teenagers have had the largest decline (34%), followed by non-Hispanic blacks (24%) and non-Hispanic whites (20%).
The declines in the teen birth rate over the last two decades "are sustained, widespread, and broad-based," the NCHS said, noting that "3.6 million more births to teenagers would have occurred from 1992 through 2011" if the rates "had remained at their 1991 levels."

Doctor fees drop for Botox, hair removal
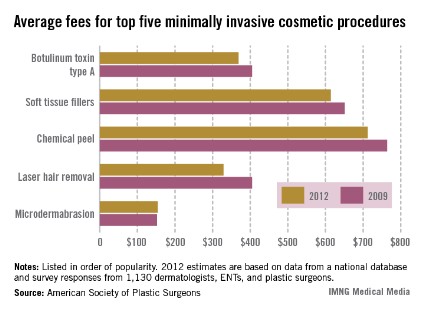
The average physician fee for the most popular form of minimally invasive cosmetic surgery, the injection of botulinum toxin type A, dropped nearly 9% from 2009 to 2012, according to data from the American Society of Plastic Surgeons.
The average fees for four of the five most popular minimally invasive surgeries fell during that period. Laser hair removal showed the greatest decline (18.7%), followed by botulinum toxin A (8.9%). Average fees also fell for chemical peels (6.8%) and soft tissue fillers (5.7%). However, the average fee for microdermabrasion went up 1.3%, the ASPS data showed.
The average physician fees for 2012 were $369 for botulinum injection, $614 for soft tissue fillers, $712 for chemical peels, $329 for laser hair removal, and $154 for microdermabrasion.
An estimated 6.1 million botulinum toxin A injections were performed in 2012, which was almost half of the 13 million minimally invasive procedures performed for the year. The next-most-popular procedure was soft tissue filler injections, which accounted for almost 2 million procedures, the ASPS reported.
Alzheimer's mortality varies widely between states
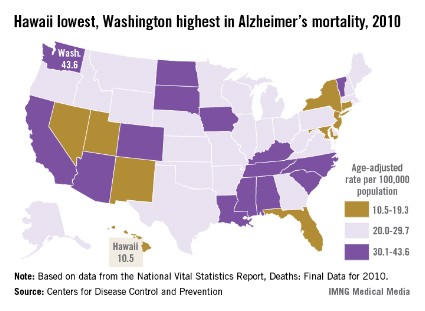
The age-adjusted death rate for Alzheimer’s disease in Washington State was more than four times higher than the rate in Hawaii for 2010, according to a report from the Centers for Disease Control and Prevention.
Washington had a U.S.-leading rate of 43.6 per 100,000 population, compared with 10.5 per 100,000 in Hawaii that year, the latest for which final data are available. The national death rate for Alzheimer’s was 25.1 per 100,000, the CDC said.
Tennessee had the next-highest rate (38.5) after Washington, followed by North Dakota (37.2), South Dakota (35.9), and Arizona (35.3). After Hawaii, the lowest death rates were in New York (11.3), Nevada (14.2), Maryland (16.8), and New Mexico (16.8).
Alzheimer’s was the sixth-leading cause of death in the United States in 2010, with a total of 83,494 deaths. Heart disease was the leading cause, with 597,689 deaths and an age-adjusted death rate of 179.1 per 100,000, according to the National Vital Statistics Report.
Texas led U.S. in neuroinvasive West Nile virus in 2012
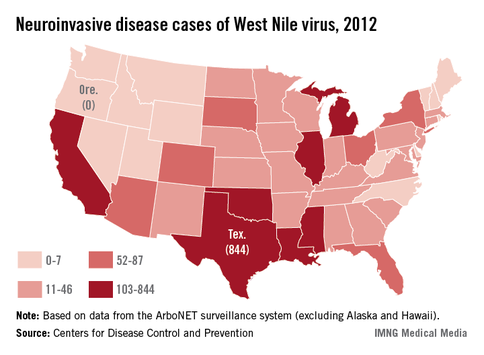
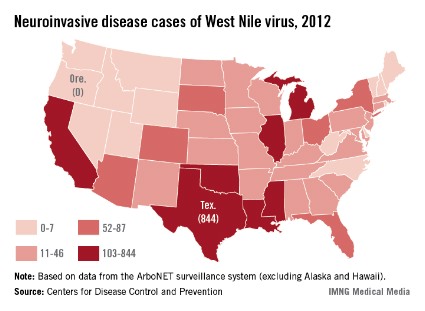
Texas reported 844 neuroinvasive disease cases of West Nile virus in 2012, almost 30% of all cases in the United States, the Centers for Disease Control and Prevention reported.
In all, 2,873 neuroinvasive cases were reported last year, with approximately 64% concentrated in just seven states – California (297 cases), Illinois (187), Louisiana (155), Michigan (141), Mississippi (103), Oklahoma (103), and Texas, according to the CDC. Besides Alaska and Hawaii, which have never reported a case of West Nile virus, Oregon was the only state with no cases of neuroinvasive disease last year.
The cases of neuroinvasive disease – such as meningitis, encephalitis, or acute flaccid paralysis – represent 51% of all West Nile virus cases reported in people. There were 286 deaths attributed to West Nile virus in 2012, the highest number for a single year since the virus was first detected in 1999, the CDC said.
West Nile virus cases spiked in 2012
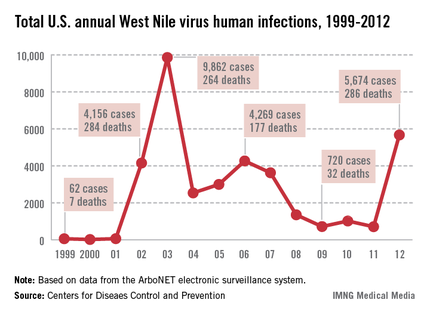
After being fairly stable for 3 years, the number of human cases of West Nile virus jumped almost 700% in 2012, according to data released by the Centers for Disease Control and Prevention.
There were 5,674 total cases reported in 2012 – up 697% from 712 in 2011 and the highest since the peak year of 2003, when there were 9,862 cases. The 286 deaths due to West Nile virus that occurred in 2012 were the most in any year in the United States. The previous high was 284 in 2002. The 2,873 cases of neuroinvasive disease also were the highest since 2003, the CDC said.
"Last summer’s outbreak likely resulted from many factors, including higher-than-normal temperatures that influenced mosquito and bird abundance, the replication of the virus in its host mosquitoes, and interactions of birds and mosquitoes in hard-hit areas," the CDC noted.

No overall change in youths' smokeless tobacco use since 2000
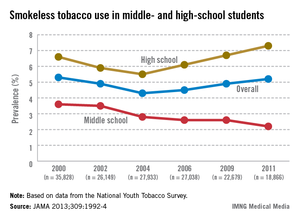
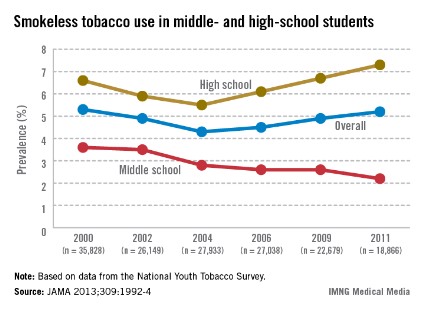
Use of smokeless tobacco products has declined among middle-school students, but increased use by high schoolers leaves overall use at about the same level since 2000.
The overall prevalence of smokeless tobacco use was 5.3% in 2000 and 5.2% in 2011, according to an analysis of data from the National Youth Tobacco Survey by Dr. Israel T. Agaku of Harvard School of Public Health, Boston, and his associates (JAMA 2013;309:1992-4).
In middle-school students, use of smokeless products dropped from 3.6% in 2000 to 2.2% in 2011, the investigators said, while prevalence among high-school students rose from 6.6% in 2000 to 7.3% in 2011.
The study was funded by grants from the National Cancer Institute. One coauthor reported serving on speakers bureaus for Pfizer. None of the other investigators reported any conflicts.
FROM JAMA
Memory loss in older adults varies by race/ethnicity
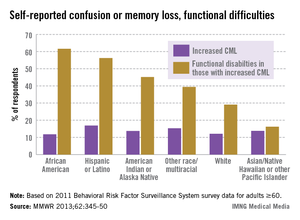
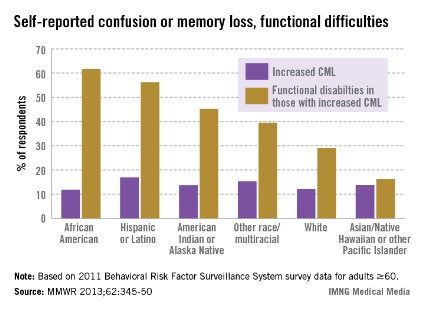
Self-reported rates of confusion or memory loss and of related functional difficulties in adults aged 60 years and older varied considerably by race/ethnicity, according to a report from the Centers for Disease Control and Prevention.
In 2011, 16.9% of Hispanic or Latino respondents said that they had experienced confusion or memory loss (CML), which was significantly higher than the 12.1% reported by whites. African Americans were the only group with a CML rate (11.8%) lower than that of whites, the CDC said (MMWR 2013;62:345-50).
When it comes to functional difficulties reported by those with CML, however, the rate among African Americans was significantly higher (61.6%) than for whites (29.1%) or for Asians/Native Hawaiians or other Pacific Islanders (16.2%), the CDC reported.
The data used in the CDC analysis come from 21 states that administered an optional module of the 2011 Behavioral Risk Factor Surveillance System survey.
FROM MORBIDITY AND MORTALITY WEEKLY REPORT
Brand-drug costs rising faster than inflation
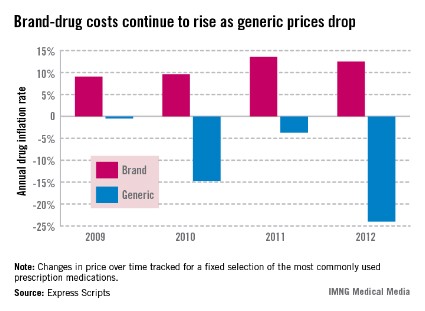
The cost of brand drugs increased 12.5% last year, far outpacing inflation overall, Express Scripts said in its annual Drug Trend Report.
The overall U.S. inflation rate, according to the Bureau of Labor Statistics, was only 1.7% in 2012.
From January 2008 to December 2012, the cost of an "unchanged market basket of brand drugs rose from $100 to $165.44," Express Scripts said in the report, while the Consumer Price Index, which measures a broad selection of goods and services, went from $100 to $108.80.
The cost of an unchanged selection of generic drugs did the opposite over the same 5-year period, dropping to $57.38 by the end of 2012, according to the report. All dollar values have been adjusted to 2008 dollars.
In 2012 alone, the cost of generic drugs dropped by 24.4%, following decreases of 3.7% in 2011, 14.7% in 2010, and 0.5% in 2009. The price of brand drugs rose 13.6% in 2011, 9.6% in 2010, and 9.1% in 2009, the report noted.