User login
Richard Franki is the associate editor who writes and creates graphs. He started with the company in 1987, when it was known as the International Medical News Group. In his years as a journalist, Richard has worked for Cap Cities/ABC, Disney, Harcourt, Elsevier, Quadrant, Frontline, and Internet Brands. In the 1990s, he was a contributor to the ill-fated Indications column, predecessor of Livin' on the MDedge.
Hip, knee replacement costs highest in United States
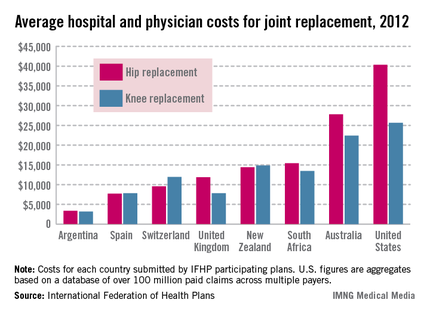
The costs of hip and knee replacement surgeries were considerably higher in the United States than in other industrialized countries in 2012, according to a report from the International Federation of Health Plans.
The U.S. average for all hospital and physician costs was $40,364 for hip replacement and $25,637 for knee replacement. The next most expensive country for both surgeries was Australia, where the total cost averaged $27,810 for hip replacement and $22,421 for knee replacement. The least most expensive country included in the survey was Argentina, where hip replacement cost $3,365 and knee replacement averaged $3,192 last year, according to the IFHP.
The IFHP consists of over 80 companies in 25 countries. For the survey, costs for each country were submitted by participating member plans. Some are drawn from the public sector, some from the private, and some from both. Costs for the United States are aggregates based on a database of over 100 million claims paid by multiple health plans.

U.S. Cymbalta cost highest in international comparison
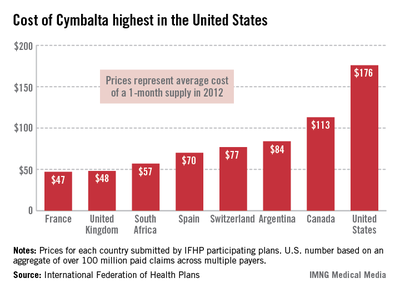
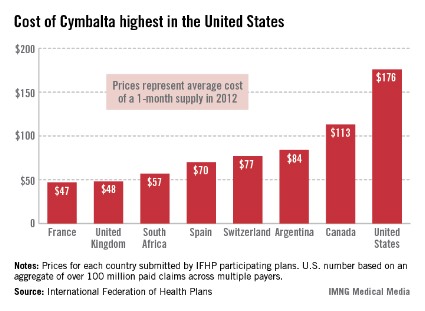
The cost of duloxetine is considerably higher in the United States than in other industrialized countries, according to a report from the International Federation of Health Plans.
The average price for a 1-month supply of duloxetine (Cymbalta) was $176 in the United States, which is 56% higher than in Canada ($113) and 274% higher than in France, where the cost was lowest at $47, the IFHP said. Duloxetine is used to treat depression, anxiety, and pain.
The IFHP consists of more than 80 companies in 25 countries. For the survey, the price of duloxetine for each country was submitted by participating member plans. Some prices are drawn from the public sector, some from the private, and some from both. Estimates for the United States are aggregates based on over 100 million claims paid by multiple health plans.
Social inhibition stings rosacea patients
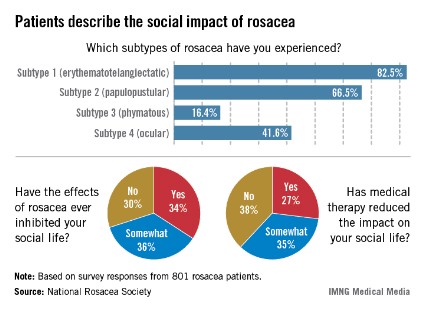
The phymatous form of rosacea (subtype 3) has the most profound negative effect on patients’ social lives, compared with other subtypes, according to a survey by the National Rosacea Society.
More than 82% of those surveyed said that they had experienced erythematotelangiectatic rosacea (subtype 1), compared with 66.5% reporting symptoms of papulopustular (subtype 2), 16.4% reporting phymatous (subtype 3), and 41.6% reporting ocular (subtype 4) rosacea, the society said.

When analyzed by subtype, those patients with subtype 3 were most likely (85%) to have their social lives negatively affected. Those with subtype 2 were the next most likely to be negatively affected (77%), followed by subtype 4 (71%) and subtype 1 (61%), according to the survey data.
However, approximately two-thirds (62%) of the respondents said that medical therapy had at least somewhat reduced the negative impact of rosacea on their social lives.
The phymatous form of rosacea (subtype 3) has the most profound negative effect on patients’ social lives, compared with other subtypes, according to a survey by the National Rosacea Society.
More than 82% of those surveyed said that they had experienced erythematotelangiectatic rosacea (subtype 1), compared with 66.5% reporting symptoms of papulopustular (subtype 2), 16.4% reporting phymatous (subtype 3), and 41.6% reporting ocular (subtype 4) rosacea, the society said.
When analyzed by subtype, those patients with subtype 3 were most likely (85%) to have their social lives negatively affected. Those with subtype 2 were the next most likely to be negatively affected (77%), followed by subtype 4 (71%) and subtype 1 (61%), according to the survey data.
However, approximately two-thirds (62%) of the respondents said that medical therapy had at least somewhat reduced the negative impact of rosacea on their social lives.
More than 23% of uninsured didn't take medications as prescribed
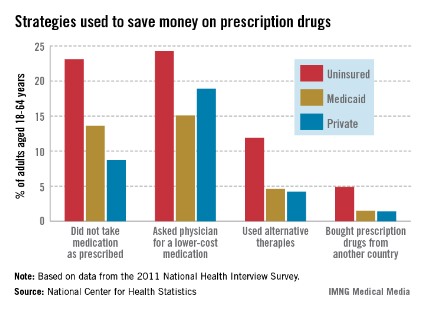
To save money, almost a quarter of uninsured American adults did not take medications as prescribed or asked physicians for lower-cost medications, according to a report from the National Center for Health Statistics.
Data from the 2011 National Health Interview Survey show that 23.1% of uninsured respondents aged 18-64 years skipped doses, took less medicine, or delayed filling prescriptions and that 24.3% asked a doctor for a lower-cost alternative. Among the uninsured, 11.9% used alternative therapies to save money and 4.9% bought prescription drugs from another country, the NCHS said.
Among respondents aged 18-64 years with private insurance, 18.9% asked a doctor for a lower-cost medication, compared with 15.1% of those on Medicaid; however, more Medicaid recipients (13.6%) did not take medication as prescribed, compared with those who had private coverage (8.7%), the report noted.
Lung cancer rates highest in West Virginia
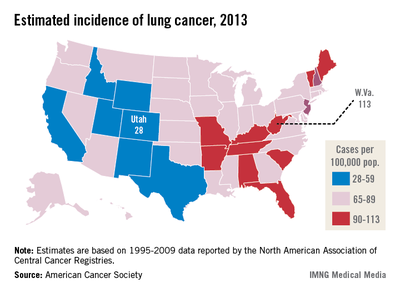
The incidence of lung cancer in the United States for 2013 is expected to be highest in West Virginia and lowest in Utah, according to the American Cancer Society.
The estimated incidence is approximately 113 cases per 100,000 population in West Virginia and 28 cases per 100,000 in Utah. Nationally, it is estimated that there will be approximately 228,190 new cases in 2013, for an incidence of about 73 cases per 100,000 people, according to the ACS data.
Dermatology's Match Day growth spurt
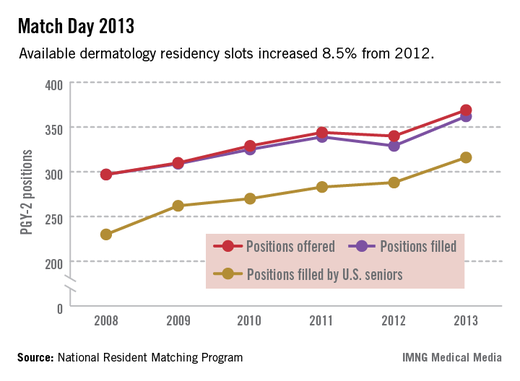
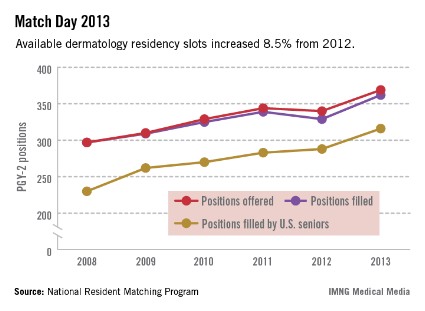
Dermatology residencies saw increases in total positions offered and filled, as well as in the number of slots filled by U.S. medical school seniors, according to data from the National Resident Matching Program.
Compared with 2012, when the number of residency slots dropped slightly, the number of dermatology positions offered increased by 8.5% in 2013. The number of slots filled increased by slightly more than 10%, and the number of U.S. seniors taking dermatology residency positions increased slightly less than 10%, the NRMP data showed.
Prevalence of repeat births in teens at 18.3% in 2010
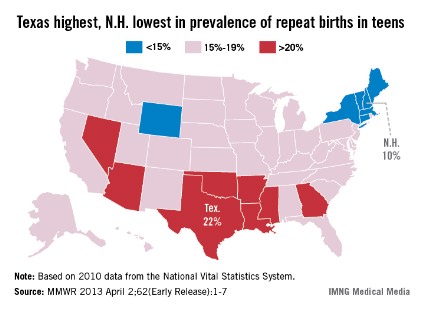
Births to teenage mothers continue to decline, but nearly one in five teen births is a repeat birth, the Centers for Disease Control and Prevention reported.
In 2010, more than 365,000 teens aged 15-19 years gave birth, and 18.3% (66,761) of those were repeat births. Most (85.7%) were second births, but almost 8,400 (12.6%) teens had a third child and more than 1,100 (1.7%) had a fourth-to-sixth child, according to the CDC (MMWR 2013 April 2;62[Early Release];1-7).
The percentage of births that were repeat births has declined 6.2% since 2007, when it was 19.5%.
"Teen birth rates in the United States have declined to a record low, which is good news," CDC director Thomas R. Frieden, M.D., said in a statement. "But rates are still far too high. Repeat births can negatively impact the mother’s education and job opportunities as well as the health of the next generation."
Repeat teen births showed geographic and racial/ethnic disparities. In 2010, prevalence was highest in eight southern and western states and lowest in six northeastern states and Wyoming. The prevalence was highest in American Indian/Alaska natives (21.6%), followed by Hispanics (20.9%), non-Hispanic blacks (20.4%), Asians/Pacific Islanders (17.6%), and whites (14.8%) according to the data from the National Vital Statistics System.
Physicians' spouses/partners satisfied with relationships
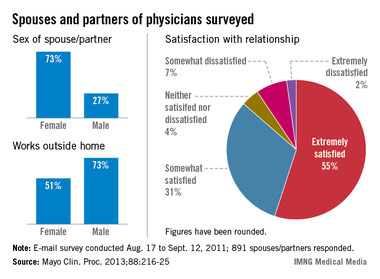
Almost 87% of physicians’ spouses or partners said that they were satisfied with their relationships, according to a survey of 891 individuals.
More than 55% of the spouses and partners of physicians who responded said that they were "extremely satisfied" with their relationships and more than 31% said they were "somewhat satisfied," reported Dr. Tait D. Shanafelt of the Mayo Clinic, Rochester, Minn., and his associates.
Almost 81% of the respondents said that, knowing what they know now, they would choose a physician spouse or partner again, the investigators noted (Mayo Clin. Proc. 2013;88:216-25).
Approximately 73% of the respondents were women, but the men who responded were more likely to be employed outside the home: 73% vs. 51% of female spouses/partners. About 10% of respondents who worked outside the home were physicians themselves, and almost 31% were nonphysician health care professionals, Dr. Shanafelt and his associates said.
The survey, conducted from Aug. 17 to Sept. 11, 2011, involved a national sample of physicians from all specialties taken from the American Medical Association’s Physician Masterfile. The study was funded by the AMA and the Mayo Clinic’s Program on Physician Well-Being.
FROM MAYO CLINIC PROCEEDINGS

Pediatrics rebounds in this year's resident match
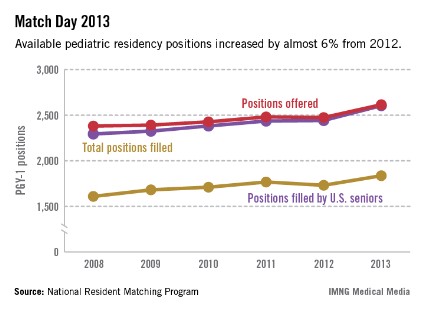
After dropping last year, the number of U.S. seniors filling pediatric residency positions went up 6% in 2013, according to data from the National Resident Matching Program.
The number of slots offered rose by nearly 6%, and the total number of pediatric residency positions filled was up by almost 7%, the NRMP data show.
Psychiatry does well on Match Day
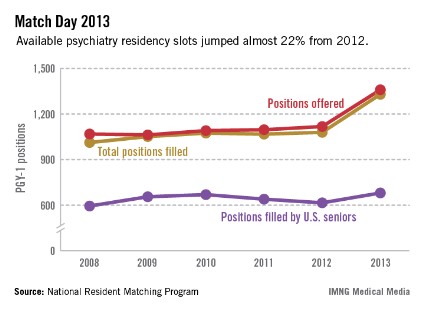
Psychiatry residencies saw large increases in total positions offered and filled and in the number of slots filled by U.S. seniors, according to data from the National Resident Matching Program.
The number of positions offered was up by almost 22% from 2012 and the number of slots filled rose 23%, while the 10.5% rise in the number of U.S. seniors taking psychiatry residency positions reversed a 2-year decline, the NRMP data show.