User login
Richard Franki is the associate editor who writes and creates graphs. He started with the company in 1987, when it was known as the International Medical News Group. In his years as a journalist, Richard has worked for Cap Cities/ABC, Disney, Harcourt, Elsevier, Quadrant, Frontline, and Internet Brands. In the 1990s, he was a contributor to the ill-fated Indications column, predecessor of Livin' on the MDedge.
Match Day 2013: Upward trend continues for ob.gyn.
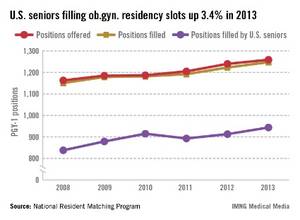
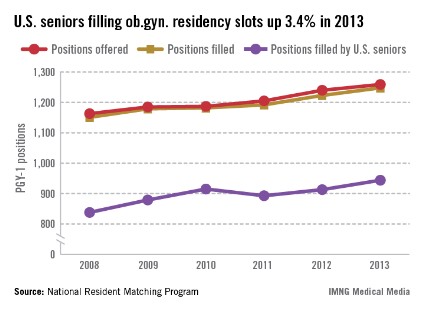
Obstetrics and gynecology experienced steady but unspectacular increases in the 2013 residency match, according to data from the National Resident Matching Program.
The number of ob.gyn. positions offered was up 1.5%, the total number of residency slots filled rose 2%, and the number of positions filled by U.S. seniors increased 3.4%, the NRMP reported.
Family medicine does well on Match Day
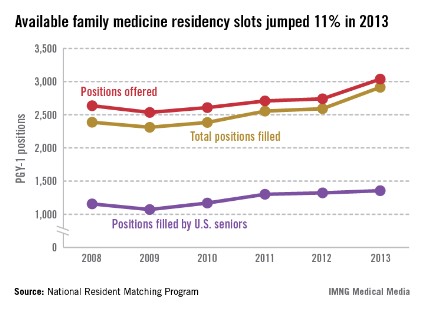
The number of available residency slots in family medicine was up 11% in 2013, increasing for the fourth year in a row, according to data from the National Resident Matching Program.
The number of medical students choosing family practice residencies rose over 12%, compared with last year’s match, but the number of U.S. seniors was only up by 2.5%, the data show.
Botulinum toxin type A procedures top 4.1 million
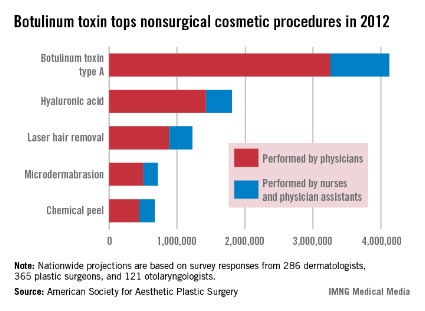
Injection of botulinum toxin type A was the most popular type of minimally invasive cosmetic surgery in the United States in 2012, with more than 4.1 million procedures performed, according to a survey by the American Society for Aesthetic Plastic Surgery (ASPAS).
More than 20% (867,266) of the botulinum toxin type A (including Botox and Dysport) injections were performed by physician assistants and nurses, ASPAS estimated. The data were based on responses from 772 board-certified dermatologists, plastic surgeons, and otolaryngologists in active practice.
The second most popular type of minimally invasive surgery was injection of hyaluronic acid – including Juvederm, Perlane/Restylane, Belotero, Prevelle, and Elevess – with 1.8 million procedures in 2012, according to the ASPAS.
Almost 8.5 million minimally invasive cosmetic procedures were performed overall last year, an increase of more than 10% from 2011, according to the survey, which was compiled and analyzed by Industry Insights, an independent research firm.
Bipolar disorder hospitalization rates for children soar
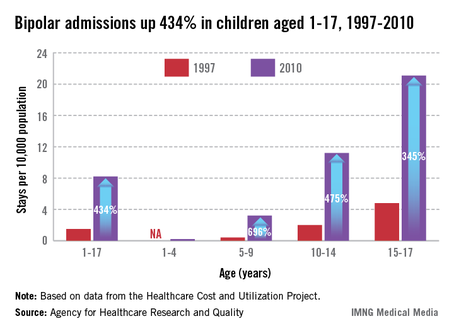
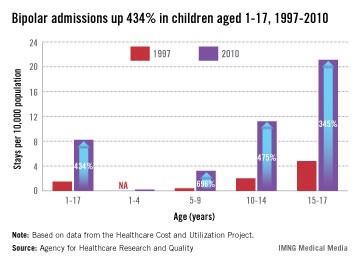
Hospital stays for bipolar disorder among children aged 1-17 years increased 434% from 1997 to 2010, the Agency for Healthcare Research and Quality reported.
In 2010, the rate of bipolar stays in children under age 18 was 8.2 per 10,000 population, compared with 1.5 per 10,000 in 1997, with the increase occurring in all ages, the AHRQ said.
The admission rate in children aged 5-9 years went from 0.4 to 3.2 per 10,000, an increase of 696%. Among children 10-14 years old, the rate was 2.0/10,000 in 1997 and 11.2/10,000 in 2010, an increase of 475%. The bipolar admission rate for those aged 15-17 years rose 345%, going from 4.8/10,000 in 1997 to 21.1/10,000 in 2010, according to the report.
In 2010, bipolar disorder accounted for 48% of hospital stays for mood disorders in children, compared with 16% in 1997, the AHRQ said.
Survey: How appearance counts in ICU
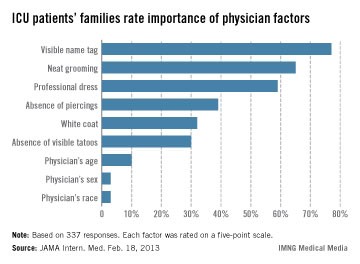
An easy-to-read name tag and neat grooming are the most important individual appearance factors for physicians working in intensive care units, according to a survey of patients’ family members in JAMA Internal Medicine.
Among the 337 respondents, 77% considered an easy-to-read name tag the most important characteristic, followed by neat grooming (65%) and professional dress (59%). Respondents rated nine different factors on a five-point scale, with 5 being very important. The least important factors are physician sex (3%) and race (3%), reported Dr. Selena Au of the University of Calgary, Alta., and her associates (JAMA Intern. Med. 2013 Feb. 18 [doi:10.1001/jamainternmed.2013.2732]).
Respondents also viewed a series of 32 photographs of 8 physician models dressed in four types of attire – traditional white coat, scrubs, suit, and casual – and were asked to select the best physician overall. Physicians wearing a white coat received 52% of the vote, compared with 24% for scrubs, 13% for a suit, and 11% for casual attire, Dr. Au and her associates wrote.
FROM JAMA INTERNAL MEDICINE
U.S. health care spending topped $1.2 trillion in 2010
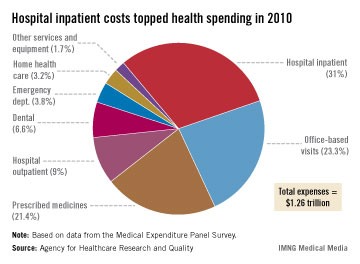
The total cost of health care in the United States was $1.26 trillion in 2010, according to a report from the Agency for Healthcare Research and Quality.
Hospital inpatient costs accounted for the largest share (31%) of the total, which applies to the civilian, noninstitutionalized population. Ambulatory care provided by office-based providers (23.3%) and hospital outpatient departments (9%) accounted for just over 32% of spending, while 21.4% was attributable to the cost of prescription medications, according to the AHRQ report.
Smaller portions of total U.S. spending went to dental services (6.6%), emergency department care (3.8%), home health care (3.2%), and other medical services and equipment (1.7%).
The data for the report came from the Medical Expenditure Panel Survey, a nationally representative longitudinal survey.
No drop in employer-based health coverage in 2012
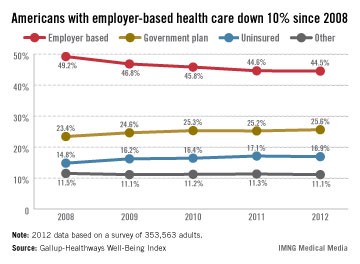
The percentage of Americans with employer-based health insurance was basically unchanged from 2011 to 2012, after dropping each of the previous 3 years, according to a survey published online Feb. 22 by Gallup.
In 2012, 44.5% of the respondents reported getting coverage from their place of employment, compared with 44.6% in 2011. That figure had previously dropped from 49.2% in 2008, Gallup said.
Survey data from the Gallup-Healthways Well-Being Index show that an increasing percentage of people are covered by government-based plans: 25.6% in 2012, compared with 23.4% in 2008. The percentage of Americans who were uninsured dropped slightly – from 17.1% in 2011 to 16.9% in 2012 – but is still higher than in 2008. Those in the "other" category may be buying insurance themselves, Gallup noted.
The Well-Being Index results come from annual telephone interviews. For 2012, the random sample consisted of 353,563 adults in all 50 states and the District of Columbia.
Use of electronic cigarettes on the rise
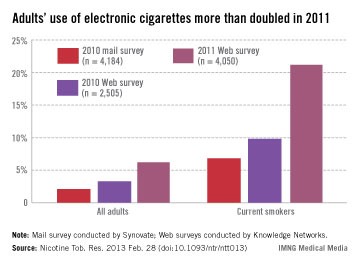
More than twice as many adult smokers used electronic cigarettes in 2011 as in 2010, according to investigators from the Centers for Disease Control and Prevention.
Approximately 21% of current smokers used electronic cigarettes at least once in 2011. The data come from Web-based surveys in 2010 and 2011 and one mail-based survey in 2010. For 2010, smokers’ use of e-cigarettes was 9.8% in the Web survey and 6.8% in the mail survey, said Brian A. King, Ph.D., and his associates at the CDC.
Among all adults, reported use of e-cigarettes was 6.2% in the 2011 survey, compared with 3.3% for the 2010 Web survey and 2.1% for the 2010 mail survey, they reported (Nicotine Tob. Res. 2013 Feb. 28 [doi:10.1093/ntr/ntt013]).
Among former smokers, e-cigarette use was 7.4% in the 2011 survey, 2.5% in the 2010 Web survey, and 0.6% in the 2010 mail survey. There was, however, "no significant difference in ever use of e-cigarettes ... by sex, age, race/ethnicity, education, income, or U.S. region" in any of the surveys, the investigators wrote.
Sample sizes were 4,050 for the 2011 Web survey, 2,505 for the 2010 Web survey, and 4,184 for the 2010 mail survey. Both Web-based surveys were conducted by Knowledge Networks; the mail-based survey was conducted by Synovate. Dr. King and his associates did not declare any financial conflicts of interest.
Cancer survival still lower for African Americans
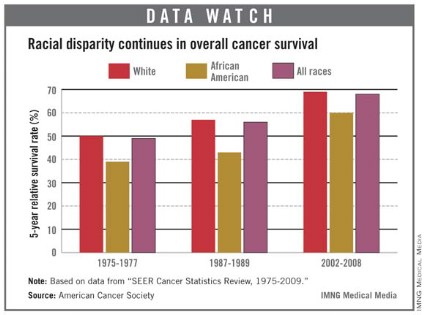
The 5-year cancer survival rate for African Americans has risen 54% since the 1970s but continues to be lower than that of whites, particularly for colon cancer, according to the American Cancer Society report.
Data from the Surveillance, Epidemiology, and End Results (SEER) database show that the 5-year relative survival rate in 2002-2008 was 60% for blacks, 69% for whites, and 68% for all races. Those numbers are all up significantly since 1975-77, when the rates for all cancers were 39% for African Americans, 50% for whites, and 49% for all races, the ACS reported.
The differences between blacks and whites varied among specific cancer sites. In 2002-2008, the 5-year survival for colon cancer was 55% for blacks and 66% for whites. For melanoma, the rate was 70% for blacks and 93% for whites. For kidney and renal pelvis cancer, however, the rates were much closer: 70% for blacks and 72% for whites. The only sites for which African Americans had higher survival rates were the brain (41%, compared with 34%) and the stomach (28%, compared with 27%), the ACS said.

Cancer incidence and mortality hit blacks hardest
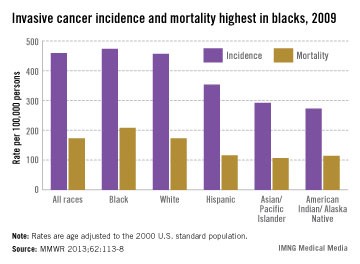
The incidence and mortality of invasive cancers were higher for blacks than for all other ethnicities in the United States in 2009, according to data from the U.S. Centers for Disease Control and Prevention.
The incidence of all cancers among blacks was 473 per 100,000 persons, compared with 459 per 100,000 for all races. The incidence was 457 per 100,000 for whites, 353 per 100,000 for Hispanics, 292 per 100,000 for Asians/Pacific Islanders, and 273 per 100,000 for American Indians/Alaska Natives (MMWR 2013;62:113-8).
The mortality rate for all invasive cancers among blacks – 208 per 100,000 persons – was again higher than the combined rate for all ethnic groups. Mortality was 172 per 100,000 persons in whites, 116 per 100,000 in Hispanics, 114 per 100,000 in American Indians/Alaska Natives, and 107 per 100,000 in Asians/Pacific Islanders, according to the CDC.
