User login
Richard Franki is the associate editor who writes and creates graphs. He started with the company in 1987, when it was known as the International Medical News Group. In his years as a journalist, Richard has worked for Cap Cities/ABC, Disney, Harcourt, Elsevier, Quadrant, Frontline, and Internet Brands. In the 1990s, he was a contributor to the ill-fated Indications column, predecessor of Livin' on the MDedge.
Women’s use of STD-related services up 27% since 2002
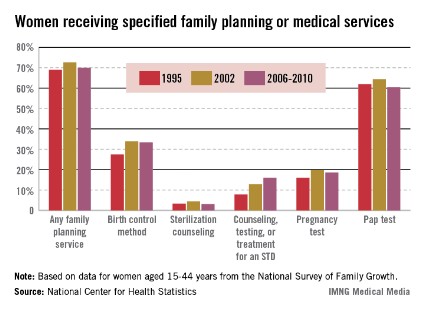
The use of most forms of family planning and related medical services has dropped slightly since 2002 in women aged 15-44 years, but STD counseling, testing, and treatment increased by 27%, the National Center for Health Statistics reported.
The percentage of women 15-44 years old who received any family planning or related medical service was up slightly during 2006-2010 (70%), compared with 1995 (69%), but that was after it had reached almost 73% in 2002, according to data from the National Survey of Family Growth.
Between 2002 and 2006-2010, use also declined for birth control method/prescription, sterilization counseling, pregnancy tests, and Pap tests.
The percentage of women receiving STD counseling, testing, and treatment was 16.0% in 2006-2010, an increase of 27% from 2002’s figure of 12.6% and more than double the 7.6% recorded in 1995. For the 2002 survey, however, the word "counseling" was added to the relevant question, "thereby broadening the scope of the question," the report noted.
Pertussis vaccination rate highest in Mississippi for 2012-2013
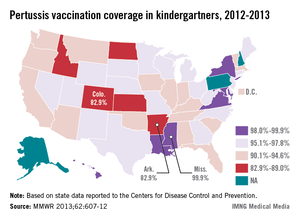
Median pertussis vaccination coverage in the United States was 95.1% among children in kindergarten for the 2012-2013 school year, the Centers for Disease Control and Prevention reported.
The state with the highest rate of coverage was Mississippi (99.9%), followed by Maryland (99.4%), Virginia (98.5%), New York (98.4%), and Louisiana (98.3%). Arkansas and Colorado had the lowest rate of pertussis vaccination, at 82.9%, with Idaho next at 88.3%, Kansas at 88.9%, and North Dakota at 89.0%, the CDC said (MMWR 2013;62:607-12).
Estimates were not provided for Alaska and New Hampshire because they report vaccination and exemption levels together. Pennsylvania does not require pertussis vaccination for kindergartners. The CDC report did not include data on homeschooled students.

Income down slightly for newly recruited psychiatrists
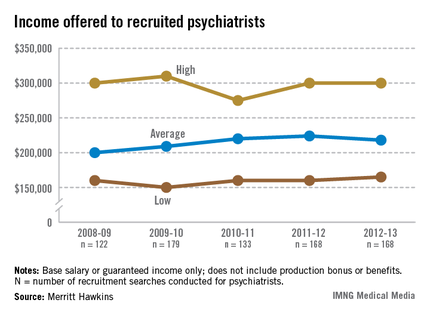
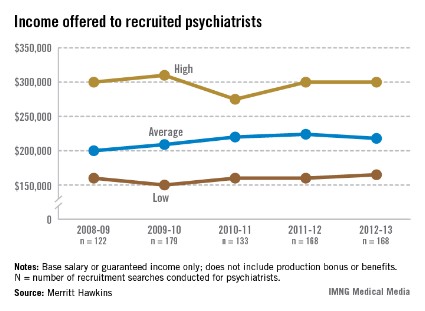
Average income was down 2.7% for psychiatrists recruited in 2012-2013, compared with the previous year, according to a report from physician job placement firm Merritt Hawkins.
For the 12-month period from April 1, 2012, to March 31, 2013, the 168 psychiatrists recruited by the company received an average base salary or guaranteed income of $218,000 from their new employers, compared with an average of $224,000 for 2011-2012. The average salary for psychiatrists had increased each of the previous 3 years, the report showed.
Despite the salary drop, psychiatry was one of the most recruited specialties in 2012-2013, finishing fourth behind family medicine, internal medicine, and hospital medicine. It has been among the top five most recruited specialties for the last 4 years, Merritt Hawkins noted, adding that "the shortage of psychiatrists continues unabated while failing to receive the attention focused on the shortage of primary care physicians."
Rate of avoidable heart disease deaths highest in blacks
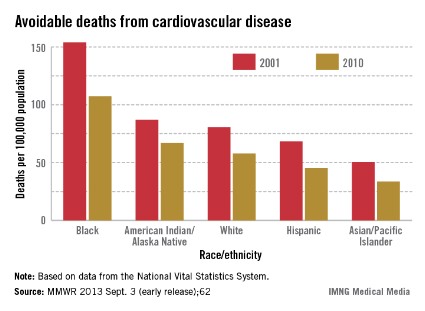
Rates of avoidable deaths from cardiovascular disease are down significantly by race/ethnicity since 2001, but African Americans are still affected disproportionately, the Centers for Disease Control and Prevention reported.
There were an estimated 200,070 avoidable deaths from heart disease, stroke, and hypertensive disease in 2010, compared with 227,961 deaths in 2001, the CDC said (MMWR 2013 Sept. 3 [early release];62).
Avoidable deaths among blacks dropped from 154 per 100,000 population in 2001 to 107 in 2010, which was almost twice as high as the rate of 57.8 per 100,000 for whites in 2010. American Indians/Alaska Natives had the second-highest rate of avoidable deaths in 2010 (66.9), followed by whites, Hispanics (45.4), and Asians/Pacific Islanders (33.6), according to the report.
Mortality data from the National Vital Statistics System were used in the analysis. A death was considered avoidable if it resulted from an underlying cause of ischemic or chronic rheumatic heart disease, cerebrovascular disease, or hypertensive disease and occurred in a person under age 75.
FROM MORBIDITY AND MORTALITY WEEKLY REPORT
Rate of avoidable heart disease deaths highest in blacks
Rates of avoidable deaths from cardiovascular disease are down significantly by race/ethnicity since 2001, but African Americans are still affected disproportionately, the Centers for Disease Control and Prevention reported.
There were an estimated 200,070 avoidable deaths from heart disease, stroke, and hypertensive disease in 2010, compared with 227,961 deaths in 2001, the CDC said (MMWR 2013 Sept. 3 [early release];62).
Avoidable deaths among blacks dropped from 154 per 100,000 population in 2001 to 107 in 2010, which was almost twice as high as the rate of 57.8 per 100,000 for whites in 2010. American Indians/Alaska Natives had the second-highest rate of avoidable deaths in 2010 (66.9), followed by whites, Hispanics (45.4), and Asians/Pacific Islanders (33.6), according to the report.
Mortality data from the National Vital Statistics System were used in the analysis. A death was considered avoidable if it resulted from an underlying cause of ischemic or chronic rheumatic heart disease, cerebrovascular disease, or hypertensive disease and occurred in a person under age 75.
FROM MORBIDITY AND MORTALITY WEEKLY REPORT

Family medicine the most recruited specialty
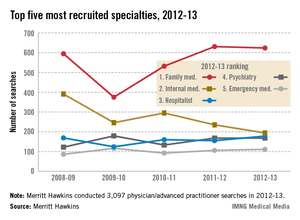
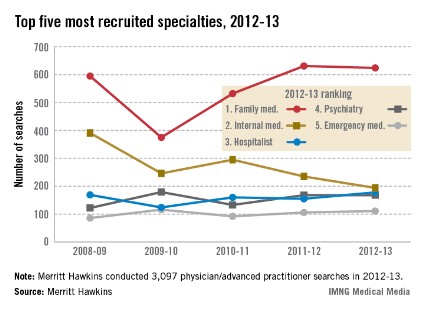
Health care employers recruited more family physicians in 2012-2013 than any other specialists, according to a report from physician job placement firm Merritt Hawkins.
From April 1, 2012, to March 31, 2013, the company conducted 624 search assignments for family physicians (including FP/OB), more than three times as many as the specialty in second place, internal medicine (194 searches). The two primary care specialties topped the list for the seventh consecutive year, the report said.
Hospitalists were the third most recruited specialists (178 searches), followed by psychiatrists (168) and emergency physicians (111). The report acknowledged a "silent shortage" of psychiatrists as they age out of the workforce, with 70% of the specialty aged 50 years or over, compared with 55% for all physicians.
Demand also has increased for nonphysician caregivers such as nurse practitioners and physician assistants, each of which finished in the top 20 most requested searches for the first time in the 20 years Merritt Hawkins has issued the recruiting report. Nurse practitioners were 10th overall and physician assistants were 12th.
Oldest adults most likely to use prescription sleep aids
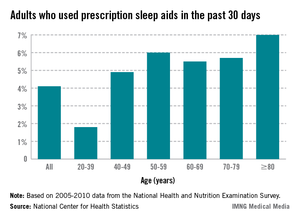
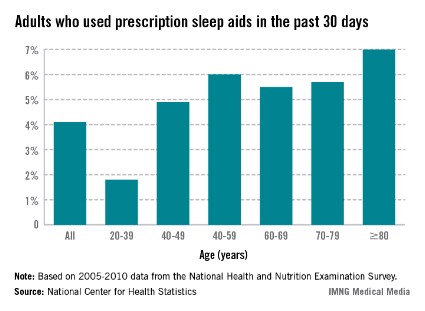
Use of sedative and hypnotic medications increased with age among U.S. adults in 2005-2010, with 7% of those aged 80 years and older reporting use in the past 30 days, the National Center for Health Statistics said in a report released Aug. 29.
Overall 30-day use among all adults aged 20 years and older was 4.1% in that time period, according to data from the National Health and Nutrition Examination Survey.
Among those aged 20-39, only 1.8% used prescription sleep aids, compared with 4.9% for those aged 40-49, 6.0% for those 50-59 years old, 5.5% for 60- to 69-year-olds, and 5.7% for those aged 70-79 years.
The sleep aids covered in the report include all hypnotic drugs and four antidepressant or sedative medications commonly prescribed for insomnia or depression: amitriptyline, doxepin, mirtazapine, and trazodone.
*Correction 9/13/13: An earlier version of this table contained an incorrect column label.
Southern states highest in hypertension
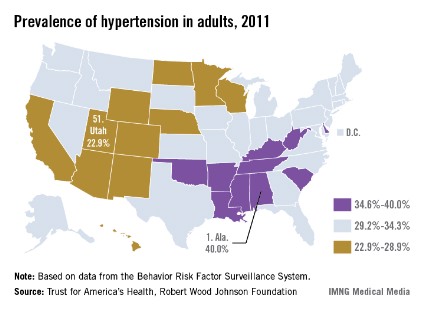
The states with the 10 highest rates of adult hypertension in 2011 were all in the South, the Trust for America’s Health and the Robert Wood Johnson Foundation reported.
In Alabama, which had the highest rate, an estimated 40.0% of the adult population had hypertension. Next up was Mississippi at 39.2%, followed by Tennessee (38.6%), Louisiana (38.3%), and Kentucky (37.9%), according to "F as in Fat: How Obesity Threatens America’s Future 2013."
The state with the lowest prevalence of adult hypertension was Utah, which had a rate of 22.9% in 2011. The rest of the lowest five were Colorado (24.9%), Minnesota (26.3%), California (27.8%), and Arizona (28.0%), the report said.
The hypertension data for the report came from the Centers for Disease Control and Prevention’s Behavior Risk Factor Surveillance System.
Adult diabetes rate highest in West Virginia
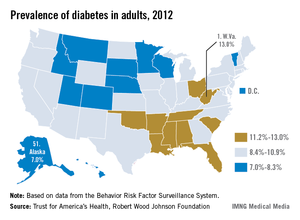
West Virginia had the highest prevalence of adult diabetes in 2012, and Alaska had the lowest rate, the Trust for America’s Health and the Robert Wood Johnson Foundation reported.
In West Virginia, 13.0% of adults had diabetes last year, compared with 7.0% for Alaska, according to "F as in Fat: How Obesity Threatens America’s Future 2013."
Nine of the 10 states with the highest diabetes rates were in the South, with Mississippi (12.5%), Alabama (12.2%), Louisiana (12.2%), and Tennessee (12.0%) in the top five. In sixth place at 11.6%, Ohio was the only state in the top ten outside the South, the report said.
After Alaska, the four states with the lowest rates were Montana (7.2%), Utah (7.2%), Vermont (7.2%), and Minnesota (7.3%).
The diabetes data for the report came from the Centers for Disease Control and Prevention’s Behavior Risk Factor Surveillance System.

U.S. circumcision rate lowest in the West
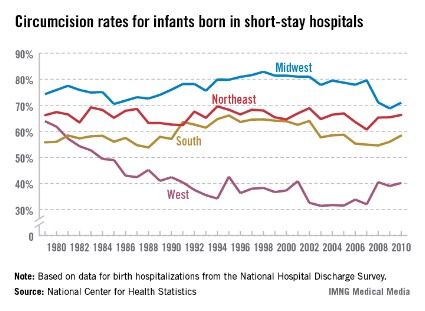
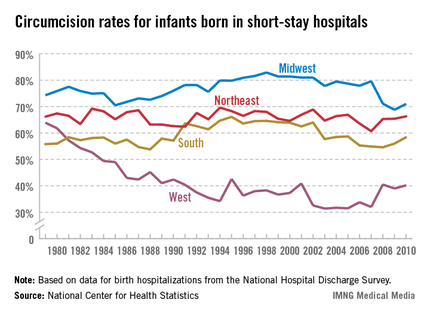
The circumcision rate for U.S. newborns was lowest in the West and highest in the Midwest in 2010, the National Center for Health Statistics reported Aug. 22.
A trend that began in the early 1980s continues to keep the West considerably below the other regions: The rate was 40.2% in 2010, compared with 58.4% in the South, 66.3% in the Northeast, and 71.0% in the Midwest, the NCHS said.
Since 1979, the circumcision rate for newborns in the West has decreased 37%. In that same period, there was almost no overall change in the Northeast, while the rate has risen slightly in the South and declined slightly in the Midwest, according to the NCHS report.
The national rate of newborn circumcision was down by 10% from 1979 (64.5%) to 2010 (58.3%). The trend over that 32-year period had rates "generally declining during the 1980s, rising in the 1990s, and declining again in the early years of the 21st century," the investigators noted. The rate increased each year from 2008 to 2010.
The report used data from the National Hospital Discharge Survey, which does not include ritual circumcisions performed outside hospitals or circumcisions performed after discharge from the birth hospitalization, they said.