User login
Richard Franki is the associate editor who writes and creates graphs. He started with the company in 1987, when it was known as the International Medical News Group. In his years as a journalist, Richard has worked for Cap Cities/ABC, Disney, Harcourt, Elsevier, Quadrant, Frontline, and Internet Brands. In the 1990s, he was a contributor to the ill-fated Indications column, predecessor of Livin' on the MDedge.
Number of U.S. malaria cases hits 40-year high
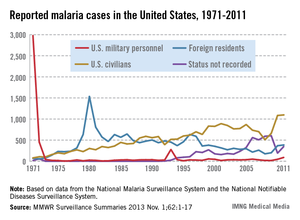
The number of malaria cases reported in the United States for 2011 was the highest since 1971, according to the Centers for Disease Control and Prevention.
Continuing a fairly steady increase since the mid-1970s, the total of 1,925 malaria cases reported in 2011 was up 14% from 2010 and 48% since 2008, the CDC said.
There were 3,180 cases in 1971, although at that time most cases occurred in military personnel. In 2011, there were 91 cases reported among the military, compared with 1,098 in U.S. civilians, 386 in foreign residents, and 350 in individuals whose status was not recorded, the CDC reported (MMWR Surveillance Summaries 2013 Nov. 1;62:1-17).
Most of the U.S. malaria cases – 1,920 – were imported, mainly from sub-Saharan Africa. The CDC noted that travel to Africa as a whole increased only 1% in 2011, but travel to sub-Saharan Africa increased by 6.9% "as a result of the Arab Spring and political transitions in North Africa."
FROM MMWR

Funding for epilepsy research lags behind Alzheimer’s, autism
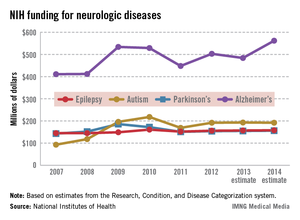
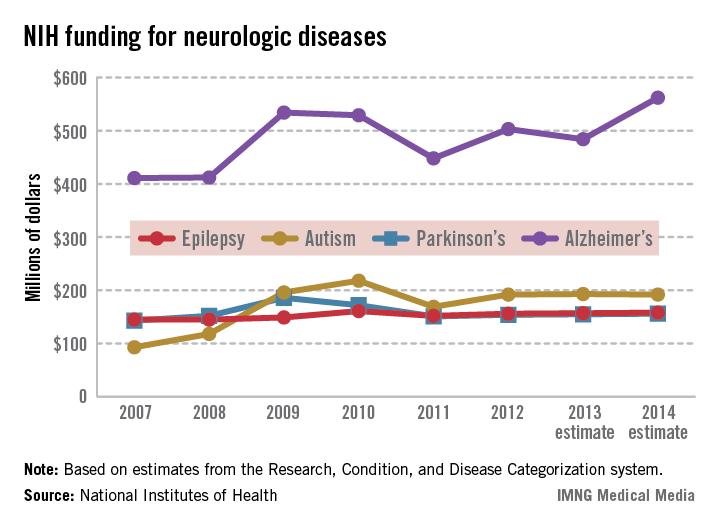
Funding of epilepsy research from the National Institutes of Health has increased by 9% since 2007, compared with increases of 37% for Alzheimer’s research and 106% for autism, according to data from the NIH’s Research, Condition, and Disease Categorization system.
NIH funding for epilepsy research was $145 million in 2007 and is expected to be about $158 million in 2014. Funding for research on Alzheimer’s disease went from $411 million in 2007 to an estimated $562 million in 2014, and autism funding increased from $93 million to $192 million. In comparison, the NIH spent about $143 million on Parkinson’s disease research in 2007 and will spend an estimated $156 million in 2014.
The situation is similar on the private-sector side of the equation. Private funding for epilepsy research was $10 million in 2011, compared with $16 million for Alzheimer’s disease, $63 million for autism, and $59 million for Parkinson’s disease, according to a report from Citizens United for Research in Epilepsy.
Now open: 146 epilepsy clinical trials
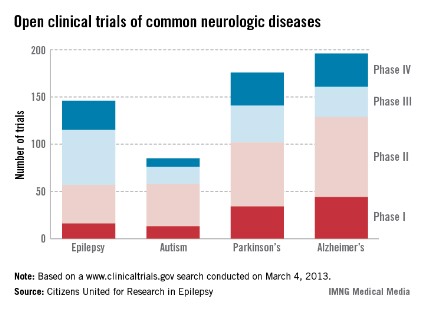
Almost 40% of the 146 open epilepsy clinical trials were at phase III as of March 4, 2013, Citizens United for Research in Epilepsy reported.
About 28% of epilepsy trials were at phase II, just over 21% were at phase IV, and almost 11% were at phase I, according to CURE’s search of clinicaltrials.gov.
Compared with the 146 epilepsy trials on that date, there were 85 autism trials, 176 Parkinson’s disease trials, and 196 Alzheimer’s disease trials, the report noted.
The number of research-related publications for epilepsy rose from 5,313 in 2008 to 6,049 in 2012 – an increase of 14%. In comparison, publications increased by 78% for autism, 36% for Parkinson’s, and 37% for Alzheimer’s in that time period, CURE said.
75% of increase in MI spending came after 30 days
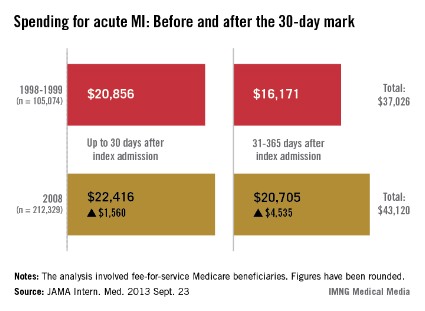
Spending on acute myocardial infarction rose by 16% per patient from 1998 to 2008, with most of that increase coming on days 31-365 after the event, according to an analysis of Medicare beneficiaries in JAMA Internal Medicine.
Total spending went from $37,026 per patient in 1998-1999 to $43,120 in 2008, an increase of $6,094 (16%). Almost 75% ($4,535) of that increase occurred 31-365 days after the index MI, with just a quarter ($1,560) coming in the first 30 days, reported Donald S. Likosky, Ph.D., of the University of Michigan, Ann Arbor, and his associates.
"Although the first 30 days after admission are the focus of many bundled payment initiatives, care after the initial admission is still very much ‘fee for service,’ with greater intensity of care per patient rewarded with increased Medicare reimbursements," the investigators wrote, suggesting that a system "akin to accountable care organizations" may be needed beyond the 30-day mark (JAMA Intern. Med. 2013 Sept. 23 [doi:10.1001/jamainternmed.2013.10789]).
The cross-sectional analysis of fee-for-service Medicare beneficiaries included 105,074 acute MI patients for 1998-1999 and 212,329 patients for 2008. The study was funded in part by a grant from the National Institute on Aging.
FROM JAMA INTERNAL MEDICINE
How often do patient data end up in the wrong chart?
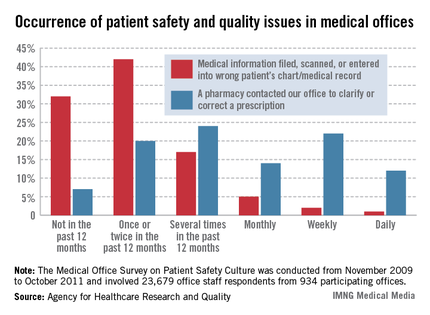
In a survey of office staff personnel, 8% said that medical information is filed, scanned, or entered into the wrong patient chart or record on at least a monthly basis, the Agency for Healthcare Research and Quality reported.
When 23,679 physicians and staffers were asked how often, in the past 12 months, data ended up in the wrong chart/record, 1% said it happened on a daily basis, 2% said it was a weekly occurrence, and 5% said it happened monthly. About 17% of respondents said that it had happened several times in the past 12 months, 42% said it had occurred once or twice in the past year, and 32% said that it had not happened at all, according to results from the Medical Office Survey on Patient Safety Culture.
Another question in the survey asked how often a pharmacy contacted the office to clarify or correct a prescription. This occurred daily for 12% of respondents, while 22% said it happened about once a week and 14% said it was a monthly occurrence. Another 24% of respondents said that there had been a pharmacy clarification/correction several times in the past year, 20% said it had happened once or twice, and 7% reported that there was no such contact, the AHRQ said.
The patient safety culture survey was conducted from November 2009 to October 2011. The respondents represented 934 medical offices, of which 62% had fully implemented an electronic medical/health records system and 73% were owned by a hospital or health system.

Information technology costs rose 28% in 5 years
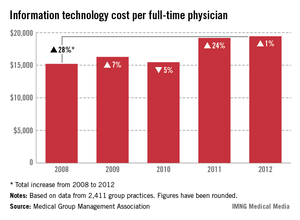
Information technology cost medical offices $19,439 per full-time physician in 2012, an increase of 28% since 2008, the Medical Group Management Association reported.
The median IT cost per physician went up a modest 1% from 2011, when it was $19,178. The largest yearly increase since 2008 occurred from 2010 to 2011, when it jumped 24%. Before that, the median cost had fallen from $16,276 in 2009 to $15,452 in 2010 – a decrease of 5%, according to the MGMA’s "Cost Survey: 2013 Report Based on 2012 Data."
Medical practices also reported increases in median staffing costs, as total business operations staff per 10,000 patients increased almost 9% – from 6.56 in 2011 to 7.13 in 2012, the MGMA said in its report, which was based on data from 2,411 group practices.

Income up almost 3% for newly recruited hospitalists
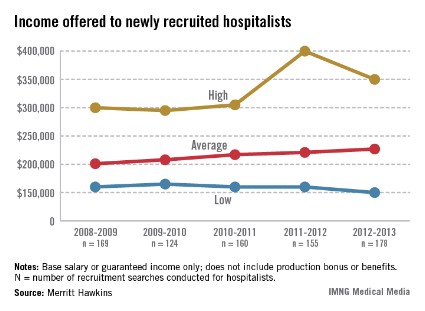
Average income was up 2.7% for hospitalists recruited in 2012-2013, compared with the previous year, according to a report from physician job placement firm Merritt Hawkins.
For the 12-month period from April 1, 2012, to March 31, 2013, the 178 hospitalists recruited by the company received an average base salary or guaranteed income of $227,000 from their new employers, compared with an average of $221,000 for 2011-2012. The average salary for hospitalists has increased each of the 4 years, the report showed.
Hospital medicine ranked third overall among all specialties in the number of physicians recruited in 2012-2013, finishing behind only family medicine and internal medicine, Merritt Hawkins said.
NSAIDs, methotrexate used most for rheumatoid arthritis
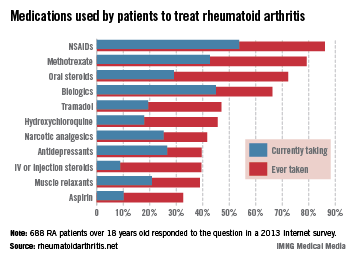
NSAIDs and methotrexate are the medications most often used by patients to treat rheumatoid arthritis, according to a survey conducted by rheumatoidarthritis.net.
Among those who answered the question on drug therapy, 86% had taken NSAIDs at some time and almost 54% were currently taking them, while 79% reported lifetime use of methotrexate and almost 43% were currently taking it. Oral steroids were third in lifetime use at 72%, but biologics were actually second in current use at 45%, the survey showed.
When looking at use of specific biologics, etanercept (Enbrel) led in lifetime use at 30% while adalimumab (Humira) was second at 25%. The top two spots were reversed for current use, with etanercept at 26% and adalimumab at 25%, rheumatoidarthritis.net reported. (The number of respondents varied for each question since not all patients were currently treating their RA with the options offered.) Infliximab (Remicade) was third in lifetime use (15%) and abatacept (Orencia) was third in current use (13%).
The survey also examined cost issues. Among respondents, more than 44% reported spending $1,000-$5,000 a year on RA treatment, 41% spent less than $1,000, 12% spent $5,000-$10,000, and 3% spent more than $10,000 a year. Almost 44% of RA patients said that they had avoided treatment at some time because of cost, and 32% reported using a coupon or free trial offer to help pay for treatment, according to the survey.
A total of 706 RA patients over age 18 completed the online "RA in America 2013" survey, which was conducted from June to August of 2013. The parent company of rheumatoidarthritis.net, Health Union LLC, reports that it "does not manufacture, sell nor market any product to diagnose, prevent or treat RA or any other disease."

U.S. physician population grew fastest in South Atlantic region
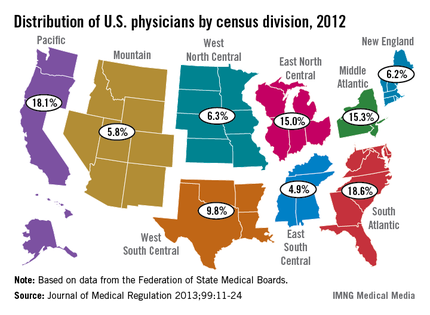
The U.S. South Atlantic states’ growth rate of 10.4% gave that region the fastest-growing population of physicians in the United States between 2010 and 2012, according to data from the Federation of State Medical Boards.
The South Atlantic also had the largest physician population of any census division in 2012 – 163,319 (18.6%) of the 878,194 doctors with an active license, said Aaron Young, Ph.D., of the FSMB in Euless, Tex., and his associates (J. Med. Regul. 2013;99:11-24).
Of the nine geographic divisions defined by the U.S. Census Bureau, five saw their physician population increase, while four experienced decreases from 2010 to 2012. After the South Atlantic, the West South Central region had the second-largest increase, at 9.3%, with the Pacific next at 9.0%. The East North Central (1.9%) and Mountain (0.1%) regions had much smaller increases, the authors reported.
Of the four regions with declines, the West North Central division had the largest decrease, at 5.9%, with New England second, at 5.7%. The Middle Atlantic was down by 2.3%, and the East South Central had a 1.5% decline, Dr. Young and his associates said.
FROM THE JOURNAL OF MEDICAL REGULATION

Sleep aid use reported by 16% of those with sleep disorders
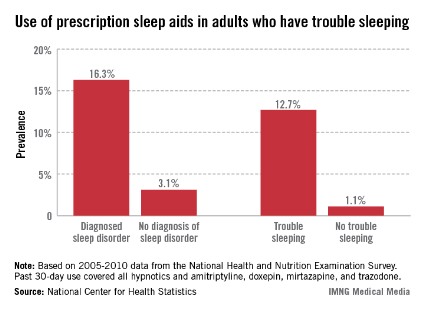
Use of prescription sleep aids was more than five times higher in those who reported a physician’s diagnosis of a sleep disorder, compared with those who did not have such a diagnosis, the National Center for Health Statistics reported.
In 2005-2010, sleep-aid use in the past 30 days was reported by 16.3% of adults who had a diagnosed sleep disorder, compared with 3.1% of those who did not have a sleep disorder, according to data from the National Health and Nutrition Examination Survey.
Past 30-day use of sleep aids was 12.7% among those who had told a physician that they had trouble sleeping and 1.1% for those who did not report any trouble sleeping, according to the report.
The sleep aids covered in the report included all hypnotic drugs and four antidepressant or sedative medications commonly prescribed for insomnia or depression: amitriptyline, doxepin, mirtazapine, and trazodone.