User login
Reporting from: 48th annual scientific meeting of the Society of Gynecologic Surgeons
Wednesday, March 30. Day 3 of SGS.
The final day of #SGS2022 began with the last round of oral and video presentations on topics including: the efficacy and safety of restrictive blood transfusion protocols in gynecologic surgical patients, restricted opioid use following midurethral sling procedures, and the efficacy of trigger point injections for myofascial pelvic pain. Next, the prestigious Distinguished Surgeon Award was presented to Dr. Jeffrey Cornella, professor of Obstetrics and Gynecology at Mayo Clinic College of Medicine, for his contributions to the field of gynecologic surgery.
This was followed by the passing of the presidential gavel from current SGS president Dr. Carl Zimmerman to incoming president Dr. Cheryl Iglesia, Director of Female Pelvic Medicine and Reconstructive Surgery at MedStar Washington Hospital Center, Washington DC, and Director of the National Center for Advanced Pelvic Surgery (NCAPS) at Medstar Health. Dr. Iglesia has been internationally and nationally recognized for her work in advancing the field of pelvic surgery and urogynecology through extensive research, clinical excellence, and support of medical education.
Needless to say, #SGS2022 was a huge success! While many of us are sad to leave San Antonio today, we are returning to our respective programs feeling motivated and rejuvenated. There is nothing more inspiring than spending time with such a highly committed group of physicians who strive to improve patient care through their excellent contributions to research and medical education. I am grateful for the new mentors, colleagues, and friends I have met at this meeting.
Thank you to the Society of Gynecologic Surgeons and OBG Management for giving me the opportunity to reflect on my experience at #SGS2022, as well as the companies that support the Fellows Scholar program.
I can’t wait to attend the 49th Annual Scientific Meeting in Tuscon, Arizona, in 2023!
Tuesday, March 29, 2022. Day 2 of SGS.
The second day of #SGS2022 began with several academic roundtables on a variety of topics including hysteroscopy, uterine-preserving prolapse surgeries, how to select patients for vaginal hysterectomy, and the role of minimally invasive surgery in transabdominal cerclage. The general session continued with more outstanding poster and video presentations that were followed by the annual presidential address. SGS president Dr. Carl Zimmerman spoke about the changing surgical landscape and SGS’s commitment to improving surgical education: “The women of America and the world deserve better.” He went on to announce the creation of a presidential task force on surgical training, whose members will include: Dr. Ted Anderson, Dr. Emily Weber LeBrun, and Dr. Mike Moen.
This year’s TeLinde Lecture was given by the executive director of the American College of Surgeons, Dr. Dr. Patricia Turner. Her talk was entitled, “Surgeons: More to Unite Us Than Divide Us.” Dr. Turner began by reminding us of the shared history between general surgery and gynecologic surgery. In fact, the American College of Surgeons was founded by gynecologist Dr. Franklin H. Martin. She went on to thoughtfully discuss the need to rethink surgical training and the way we assess surgical trainees. She highlighted the importance of collaboration between all surgical specialties to improve surgical education, improve outcomes, and advocate for patients. “In order to heal all, we have to have ALL surgeons at the table.”
Today’s general session was concluded with a panel discussion on “Operating Room Safety and Efficiency” in which Dr. Kenneth Catchpole, Dr. Teodor Grantcharov, and Dr. Jason Wright shared some interesting ideas on how we can improve patient care in the operating room. The afternoon continued with a number of social activities, providing an opportunity to enjoy the beautiful landscape of San Antonio, Texas, including: a tour of Eisenhower park, kayaking on the Guadelupe River, and the SGS golf tournament.
The fun continued into the evening at the annual “SGS’ Got Talent” in which participants could be spotted in cowboy hats, bandanas, and boots. The night was filled with food, drinks, laughter, and line dancing! #SGS2022
Monday, March 28, 2022. Day 1 of SGS.
“How do you become brave? How do you become an advocate? How do you make a change?” These are just some of the questions asked during our thought-provoking early morning session entitled, “Healthcare Inequity Awareness—A Conversation to Empower Providers and Enhance the Patient Experience” at this year’s annual scientific meeting of the Society of Gynecologic Surgeons #SGS2022. The panelists, which included Dr. Olivia Cardenas-Trowers, Dr. Maria Florian-Rodriguez, and Dr. Tristi Muir, emphasized the importance of acknowledging our own bias as physicians, as well as the role structural racism plays in the health care access and outcomes of our patients. We were reminded that “Diversity, Equity, Inclusion (aka DEI) is a journey. It is progress over time, not over night.”
Following the early morning panel, the 48th annual scientific meeting officially began with a brief welcome and recognition of new SGS members by current president Dr. Carl Zimmerman and scientific program committee chair Dr. Oz Harmanli. The rest of the morning session was filled with outstanding oral and video presentations on topics ranging from the role of oophorectomy in patients with breast cancer, creating simulation models to enhance medical education, and tips for navigating the altered retroperitoneum.
Next, the Mark D. Walters endowed lecture was given by Dr. Marta A. Crispens, entitled “Restructuring Gynecologic Surgical Education: It’s a Matter of Equity.” In her exceptionally powerful address, Dr. Crispens began by discussing the historical context in which the fields of obstetrics and gynecology were combined and comparing it to a shift in current practice toward a national decrease in number of hysterectomies and an increase in the complexity of surgical cases. She highlighted the well-studied fact that low-volume surgeons have higher complication rates and that many new ObGyn residency graduates perform only 3 to 4 hysterectomies annually during the first few years of practice. Finally, she asserted that, by separating the practices of obstetrics and gynecology, we can improve surgical education and the quality of surgical care for our patients. The audience’s enthusiasm was undeniable, resulting in resounding applause and a standing ovation.
The afternoon was filled with unique opportunities for fellows, including: the Fellow’s Pelvic Research Network (FPRN) meeting, an incredibly informative panel on how to navigate the first year out of fellowship with Dr. Mireille Truong, Dr. Christine Foley, and Dr. Jon Pennycuff, and finally, the Mentorship Mingle.
The first day was concluded with the President’s Award Ceremony in which Dr. John DeLancey was presented with the illustrious President’s Award, followed by the President’s Reception with food, drinks, and lively conversation. Looking forward to day 2 of #SGS2022. @gynsurgery
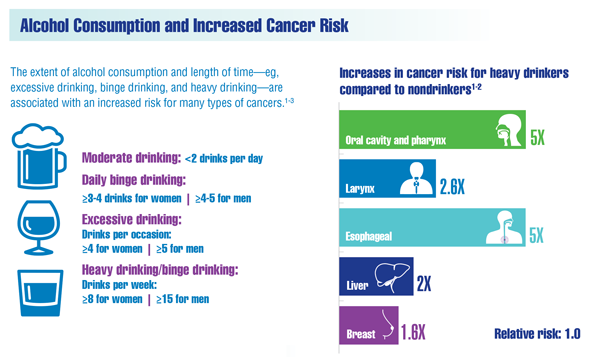
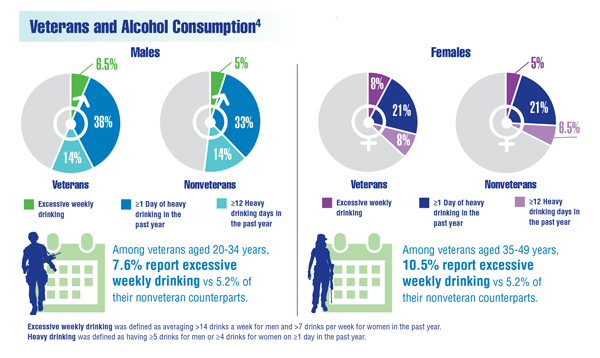
Cancer Data Trends 2022: Alcohol and Cancer

National Cancer Institute. Alcohol and cancer risk. Updated July 14, 2021. Accessed December 9, 2021. https://www.cancer.gov/about-cancer/causes-prevention/risk/alcohol/alcohol-fact-sheet
Centers for Disease Control and Prevention, National Center for Chronic Disease Prevention and Health Promotion. Excessive alcohol use. Updated November 23, 2021. Accessed December 29, 2021. https://www.cdc.gov/chronicdisease/resources/publications/factsheets/alcohol.htm
LoConte NK, Brewster AM, Kaur JS, et al. Alcohol and cancer: a statement of the American Society of Clinical Oncology. J Clin Oncol. 2018;36(1):83-93. doi:10.1200/JCO.2017.76.1155
Centers for Disease Control and Prevention, National Center for Health Statistics. National Health Interview Survey; veterans health statistics tables 8b and 8c. Updated June 19, 2020. Accessed December 9, 2021. https://www.cdc.gov/nchs/nhis/veterans_health_statistics/tables.htm
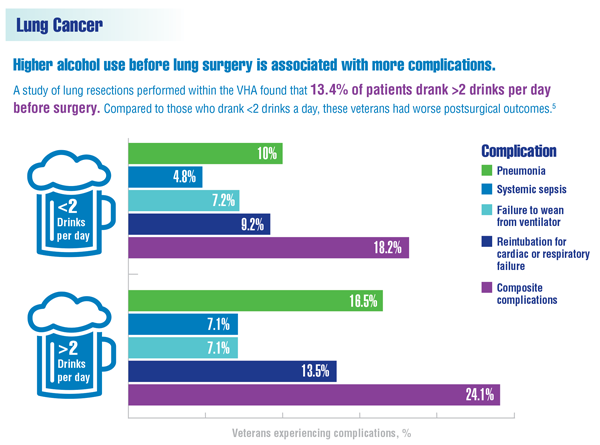
Graf SA, Zeliadt SB, Rise PJ, et al. Unhealthy alcohol use is associated with postoperative complications in veterans undergoing lung resection. J Thorac Dis. 2018;10(3):1648-1656.
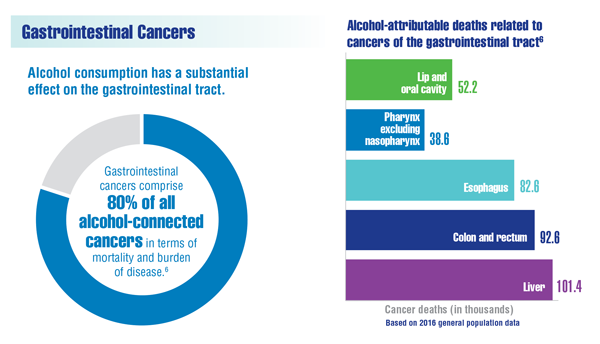
Rehm J, Shield K. Alcohol use and cancers of the gastrointestinal tract. Epidemiology and preventive implications. Front Oncol. 2020;10:403. doi:10.3389/fonc.2020.00403
National Cancer Institute. Alcohol and cancer risk. Updated July 14, 2021. Accessed December 9, 2021. https://www.cancer.gov/about-cancer/causes-prevention/risk/alcohol/alcohol-fact-sheet
Centers for Disease Control and Prevention, National Center for Chronic Disease Prevention and Health Promotion. Excessive alcohol use. Updated November 23, 2021. Accessed December 29, 2021. https://www.cdc.gov/chronicdisease/resources/publications/factsheets/alcohol.htm
LoConte NK, Brewster AM, Kaur JS, et al. Alcohol and cancer: a statement of the American Society of Clinical Oncology. J Clin Oncol. 2018;36(1):83-93. doi:10.1200/JCO.2017.76.1155
Centers for Disease Control and Prevention, National Center for Health Statistics. National Health Interview Survey; veterans health statistics tables 8b and 8c. Updated June 19, 2020. Accessed December 9, 2021. https://www.cdc.gov/nchs/nhis/veterans_health_statistics/tables.htm
Graf SA, Zeliadt SB, Rise PJ, et al. Unhealthy alcohol use is associated with postoperative complications in veterans undergoing lung resection. J Thorac Dis. 2018;10(3):1648-1656.
Rehm J, Shield K. Alcohol use and cancers of the gastrointestinal tract. Epidemiology and preventive implications. Front Oncol. 2020;10:403. doi:10.3389/fonc.2020.00403
Cancer Data Trends 2022: Hematologic Cancers
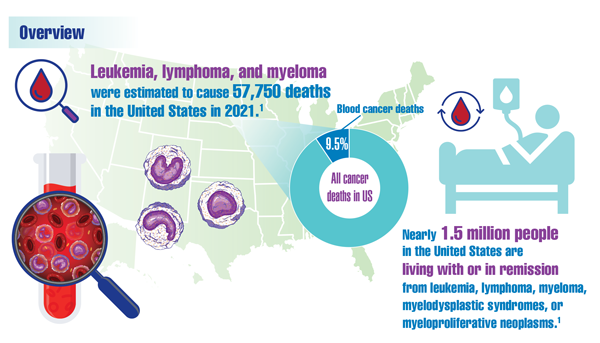
Leukemia & Lymphoma Society. Facts and statistics overview: general blood cancers. Accessed December 13, 2021. https://www.lls.org/facts-and-statistics/facts-and-statistics-overview#General%20Blood%20Cancers
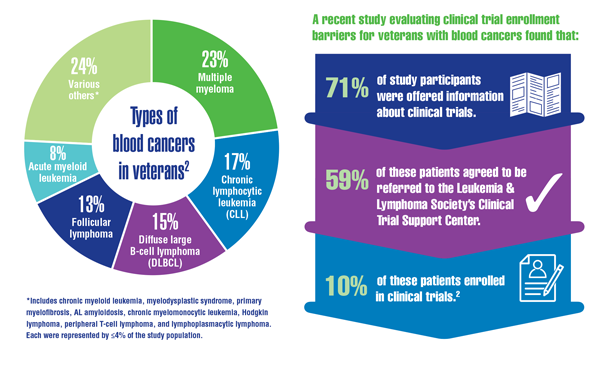
Friedman DR, Rodgers TD, Szumita L, et al. Identifying and overcoming barriers in clinical trial enrollment for veterans with blood cancers. American Society of Hematology annual meeting; December 11-14, 2021. Abstract #1920. https://ash.confex.com/ash/2021/webprogram/Paper146736.html
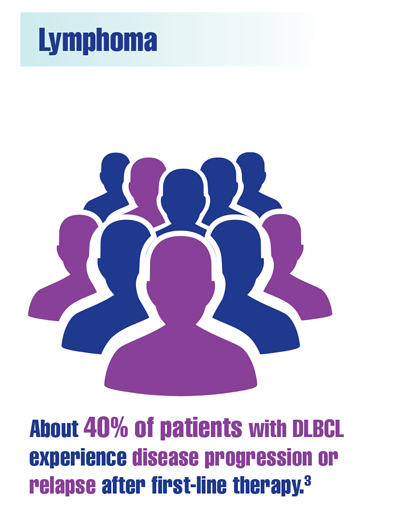
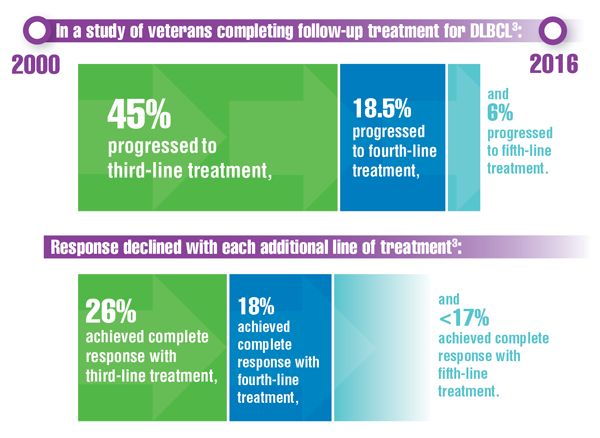
Chien HC, Morreall D, Patil V, et al. Real-world practice patterns and outcomes in veterans with relapsed/refractory diffuse large B-cell lymphoma. Future Oncol. 2021;17(4):411-422. doi:10.2217/fon-2020-0522
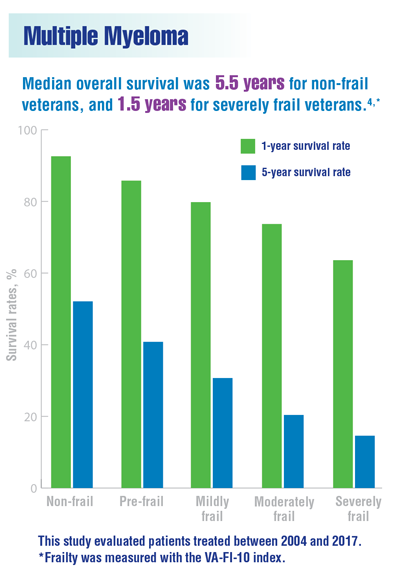
DuMontier C, Fillmore NR, Yildirim C, et al. Contemporary analysis of electronic frailty measurement in older adults with multiple myeloma treated in the national US Veterans Affairs Healthcare System. Cancers. 2021;13(12):3053. doi:10.3390/cancers13123053
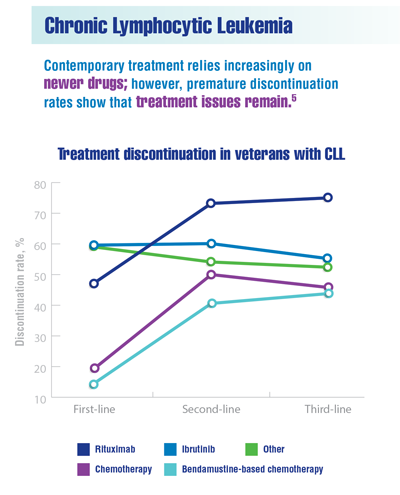
Yang K, Liu S, Boxiong Tang B, et al. Real-world treatment patterns, adherence and healthcare resource utilization for chronic lymphocytic leukemia/small lymphocytic leukemia among veterans in the United States. American Society of Hematology annual meeting; December 11-14, 2021. Abstract #4079. https://ash.confex.com/ash/2021/webprogram/Paper148716.html
Leukemia & Lymphoma Society. Facts and statistics overview: general blood cancers. Accessed December 13, 2021. https://www.lls.org/facts-and-statistics/facts-and-statistics-overview#General%20Blood%20Cancers
Friedman DR, Rodgers TD, Szumita L, et al. Identifying and overcoming barriers in clinical trial enrollment for veterans with blood cancers. American Society of Hematology annual meeting; December 11-14, 2021. Abstract #1920. https://ash.confex.com/ash/2021/webprogram/Paper146736.html
Chien HC, Morreall D, Patil V, et al. Real-world practice patterns and outcomes in veterans with relapsed/refractory diffuse large B-cell lymphoma. Future Oncol. 2021;17(4):411-422. doi:10.2217/fon-2020-0522
DuMontier C, Fillmore NR, Yildirim C, et al. Contemporary analysis of electronic frailty measurement in older adults with multiple myeloma treated in the national US Veterans Affairs Healthcare System. Cancers. 2021;13(12):3053. doi:10.3390/cancers13123053
Yang K, Liu S, Boxiong Tang B, et al. Real-world treatment patterns, adherence and healthcare resource utilization for chronic lymphocytic leukemia/small lymphocytic leukemia among veterans in the United States. American Society of Hematology annual meeting; December 11-14, 2021. Abstract #4079. https://ash.confex.com/ash/2021/webprogram/Paper148716.html
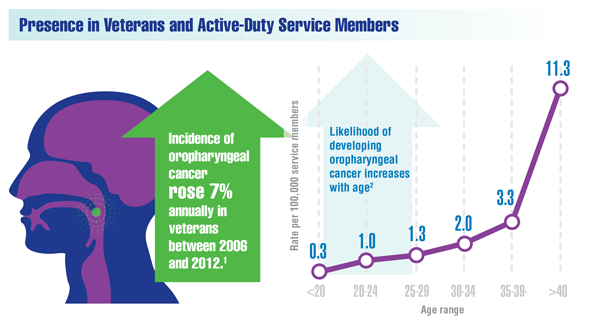
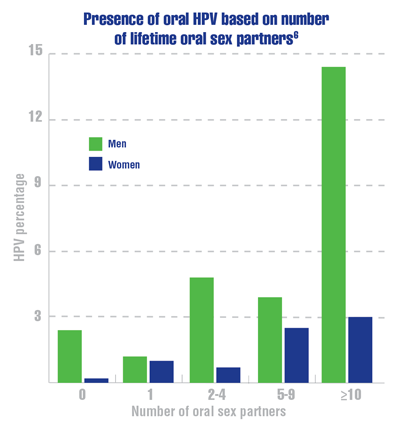
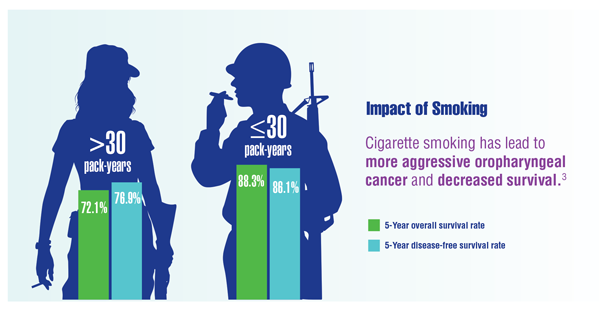
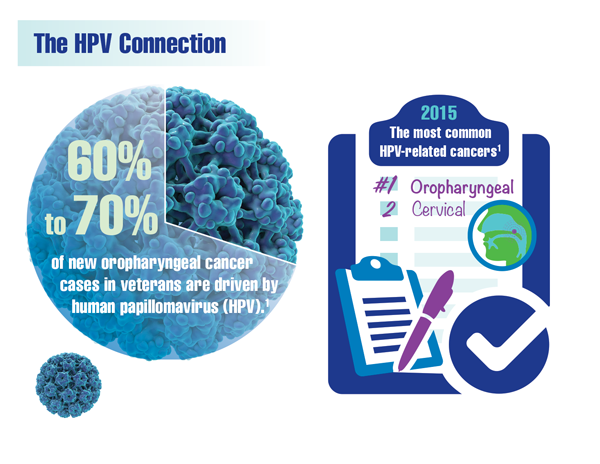
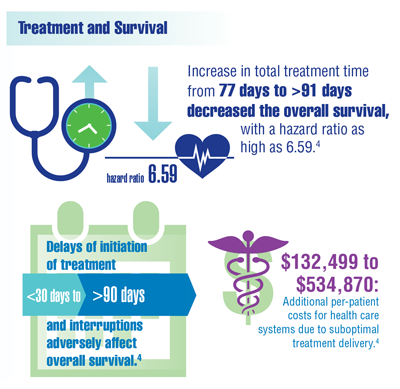
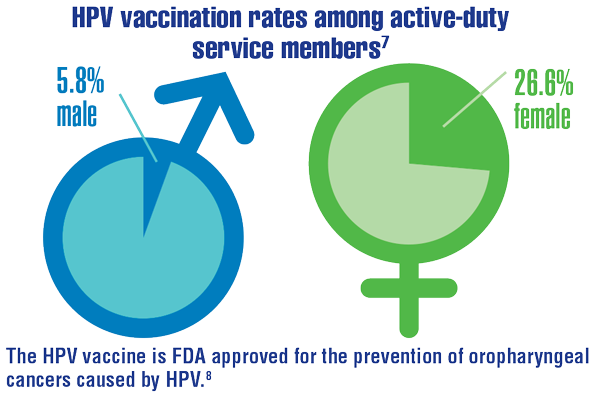
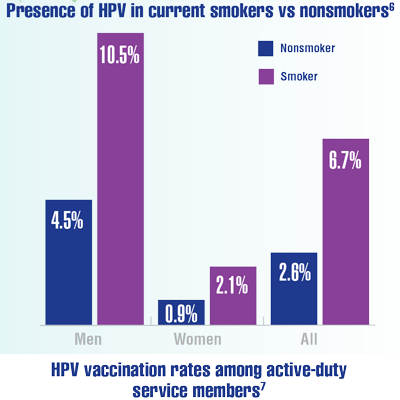
Cancer Data Trends 2022: Oropharyngeal Cancer
Zevallos JP, Kramer JR, Sandulache VC et al. National trends in oropharyngeal cancer incidence and survival within the Veterans Affairs Health Care System. Head Neck. 2021;43(1):108-115. doi:10.1002/hed.26465
Goodwin CE. Oral cavity and pharynx cancers, active component, U.S. Armed Forces, 2007-2019. MSMR. 2021;28(7):11-14. https://health.mil/News/Articles/2021/07/01/Oral-Cavity-MSMR
Elhalawani H, Mohamed ASR, Elgohari B, et al. Tobacco exposure as a major modifier of oncologic outcomes in human papillomavirus (HPV) associated oropharyngeal squamous cell carcinoma. BMC Cancer. 2020;20(1):912. doi:10.1186/s12885-020-07427-7
Jurica JM, Rubio F, Hernandez DJ, Sandulache VC. Institutional financial toxicity of failure to adhere to treatment guidelines for head and neck squamous cell carcinoma. Head Neck. 2021;43(3):816-824. doi:10.1002/hed.26539
Centers for Disease Control and Prevention. HPV infection. Updated July 23, 2021. Accessed December 9, 2021. https://www.cdc.gov/hpv/parents/about-hpv.html
D’Souza G, McNeel TS, Fakhry C. Understanding personal risk of oropharyngeal cancer: risk-groups for oncogenic oral HPV infection and oropharyngeal cancer. Ann Oncol. 2017;28(12):3065-3069. doi:10.1093/annonc/mdx535phary
Clark LL, Stahlman S, Taubman SB. Human papillomavirus vaccine initiation, coverage, and completion rates among U.S. active component service members, 2007-2017. MSMR. 2018;25(9):9-14. https://pubmed.ncbi.nlm.nih.gov/30272988/
US Food and Drug Administration. Gardasil 9. Updated August 21, 2020. Accessed December 9, 2021. https://www.fda.gov/vaccines-blood-biologics/vaccines/gardasil-9
Ear growth

A shave biopsy of the lesion was performed and it confirmed the diagnosis of chondrodermatitis nodularis helicis (CNH).
CNH is an inflammatory process that most commonly occurs on the helix of the ear but can also occur on the antihelix and, rarely, on other areas of the ear. It generally manifests as a firm nodule with surrounding erythema that may be painful only when pressure is applied. Patients may describe bleeding, ulceration, and exudate. They will usually report discomfort from sleeping on the affected side.
The pathogenesis of CNH is poorly understood but is thought to be related to vasculitis and inflammation from prolonged pressure to the affected ear during sleep or from devices that are worn in or around the ear (eg, hearing aids, headphones). Other factors such as actinic damage or ear trauma have also been described. Histopathologic studies have identified arteriolar narrowing with ischemic changes and necrosis of cartilage causing localized inflammation.1
The differential diagnosis for this lesion includes nonmelanoma skin cancer, as well as tophaceous gout and seborrheic keratosis.
There are multiple conservative treatment options. One option is to relieve pressure by sleeping on the unaffected side or using commercially available pillows with a cutout or window where the affected ear can rest. Pharmacologic treatments include topical nitroglycerin1 and intralesional collagen or corticosteroid injections. If previous treatments are unsuccessful, consider surgical excision of the affected tissue and curettage of the underlying abnormal cartilage. Recurrence is possible with both conservative and surgical treatment.
This patient was counseled on the benign nature of her biopsy findings and treatment options were discussed. She elected to proceed with pressure-relieving measures when sleeping and planned to follow up if there was no improvement.
Image courtesy of Marion Cook, MD, First Choice Community Healthcare, Albuquerque, New Mexico. Text courtesy of Spenser Squire, MD, and Daniel Stulberg, MD, FAAFP, Department of Family and Community Medicine, University of New Mexico School of Medicine, Albuquerque.
1. Nielsen LJ, Olsen CH, Lock-Anderson J. Therapeutic options of chondrodermatitis nodularis helicis. Plast Surg Int. 2016;2016:4340168. doi: 10.1155/2016/4340168
A shave biopsy of the lesion was performed and it confirmed the diagnosis of chondrodermatitis nodularis helicis (CNH).
CNH is an inflammatory process that most commonly occurs on the helix of the ear but can also occur on the antihelix and, rarely, on other areas of the ear. It generally manifests as a firm nodule with surrounding erythema that may be painful only when pressure is applied. Patients may describe bleeding, ulceration, and exudate. They will usually report discomfort from sleeping on the affected side.
The pathogenesis of CNH is poorly understood but is thought to be related to vasculitis and inflammation from prolonged pressure to the affected ear during sleep or from devices that are worn in or around the ear (eg, hearing aids, headphones). Other factors such as actinic damage or ear trauma have also been described. Histopathologic studies have identified arteriolar narrowing with ischemic changes and necrosis of cartilage causing localized inflammation.1
The differential diagnosis for this lesion includes nonmelanoma skin cancer, as well as tophaceous gout and seborrheic keratosis.
There are multiple conservative treatment options. One option is to relieve pressure by sleeping on the unaffected side or using commercially available pillows with a cutout or window where the affected ear can rest. Pharmacologic treatments include topical nitroglycerin1 and intralesional collagen or corticosteroid injections. If previous treatments are unsuccessful, consider surgical excision of the affected tissue and curettage of the underlying abnormal cartilage. Recurrence is possible with both conservative and surgical treatment.
This patient was counseled on the benign nature of her biopsy findings and treatment options were discussed. She elected to proceed with pressure-relieving measures when sleeping and planned to follow up if there was no improvement.
Image courtesy of Marion Cook, MD, First Choice Community Healthcare, Albuquerque, New Mexico. Text courtesy of Spenser Squire, MD, and Daniel Stulberg, MD, FAAFP, Department of Family and Community Medicine, University of New Mexico School of Medicine, Albuquerque.
1. Nielsen LJ, Olsen CH, Lock-Anderson J. Therapeutic options of chondrodermatitis nodularis helicis. Plast Surg Int. 2016;2016:4340168. doi: 10.1155/2016/4340168
1. Nielsen LJ, Olsen CH, Lock-Anderson J. Therapeutic options of chondrodermatitis nodularis helicis. Plast Surg Int. 2016;2016:4340168. doi: 10.1155/2016/4340168

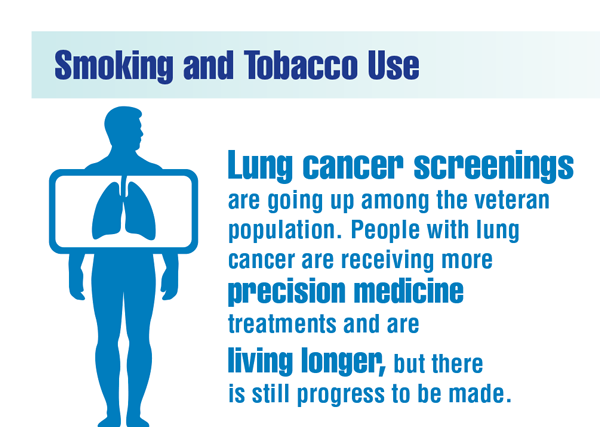
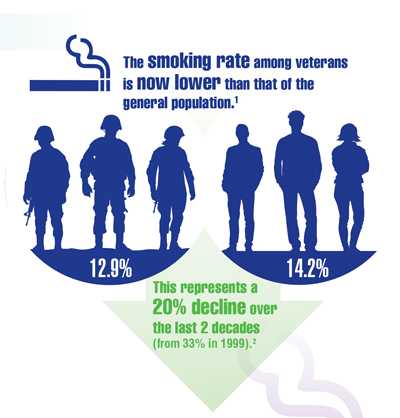
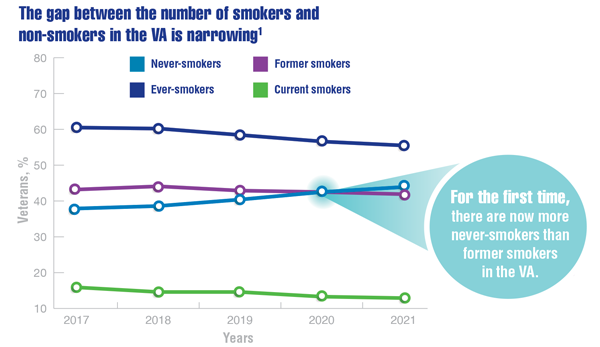
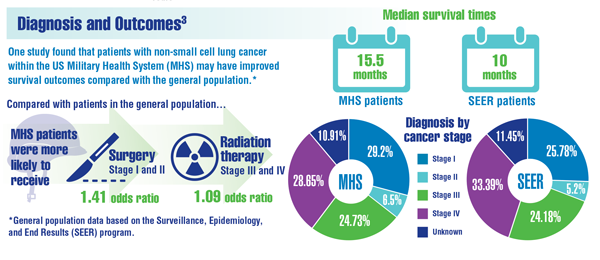
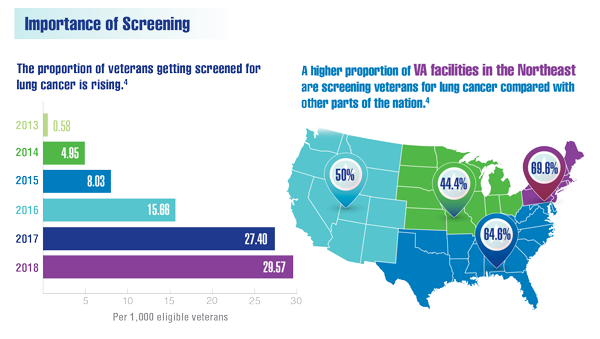
Cancer Data Trends 2022: Lung Cancer
Wang ZJ, Dhanireddy P, Prince C, Larsen M, Schimpf M, Pearman G. 2021 Survey of veteran enrollees’ health and use of health care. Published September 24, 2021. Accessed January 1, 2022. https://www.va.gov/VHASTRATEGY/SOE2020/2020_Enrollee_Data_Findings_Report-March_2021-FINAL-508_Compliant.pdf
US Department of Veterans Affairs. Smoking rates steadily trend down among veterans receiving VA care. Published November 18, 2021. Accessed January 28, 2022. https://www.va.gov/opa/pressrel/pressrelease.cfm?id=5742
Lin J, Kamamia C, Brown D, et al. Survival among lung cancer patients in the U.S. Military Health System: a comparison with the SEER population. Cancer Epidemiol Biomarkers Prev. 2018;27(6):673-679. doi:10.1158/1055-9965.EPI-17-0822
Lewis JA, Samuels LR, Denton J, et al. National lung cancer screening utilization trends in the Veterans Health Administration. JNCI Cancer Spectr. 2020;4(5):pkaa053. doi:10.1093/jncics/pkaa053
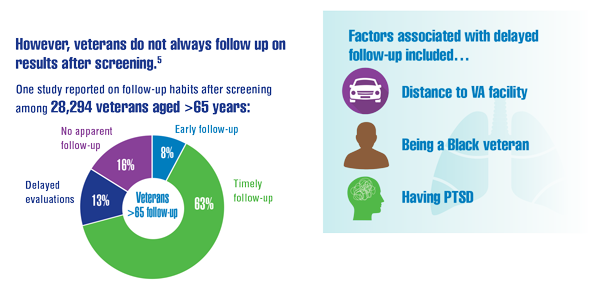
Núñez ER, Caverly TJ, Zhang S, et al. Adherence to follow-up testing recommendations in US veterans screened for lung cancer, 2015-2019. JAMA Netw Open. 2021;4(7):e2116233. doi:10.1001/jamanetworkopen.2021.16233
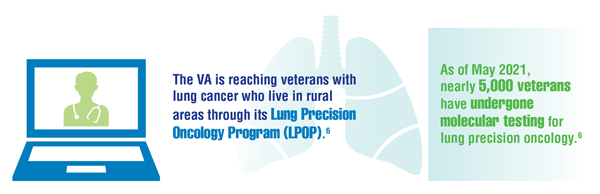
US Department of Veterans Affairs. VA Lung Precision Oncology Program (LPOP). Accessed January 27, 2022. https://www.research.va.gov/programs/lpop/
Wang ZJ, Dhanireddy P, Prince C, Larsen M, Schimpf M, Pearman G. 2021 Survey of veteran enrollees’ health and use of health care. Published September 24, 2021. Accessed January 1, 2022. https://www.va.gov/VHASTRATEGY/SOE2020/2020_Enrollee_Data_Findings_Report-March_2021-FINAL-508_Compliant.pdf
US Department of Veterans Affairs. Smoking rates steadily trend down among veterans receiving VA care. Published November 18, 2021. Accessed January 28, 2022. https://www.va.gov/opa/pressrel/pressrelease.cfm?id=5742
Lin J, Kamamia C, Brown D, et al. Survival among lung cancer patients in the U.S. Military Health System: a comparison with the SEER population. Cancer Epidemiol Biomarkers Prev. 2018;27(6):673-679. doi:10.1158/1055-9965.EPI-17-0822
Lewis JA, Samuels LR, Denton J, et al. National lung cancer screening utilization trends in the Veterans Health Administration. JNCI Cancer Spectr. 2020;4(5):pkaa053. doi:10.1093/jncics/pkaa053
Núñez ER, Caverly TJ, Zhang S, et al. Adherence to follow-up testing recommendations in US veterans screened for lung cancer, 2015-2019. JAMA Netw Open. 2021;4(7):e2116233. doi:10.1001/jamanetworkopen.2021.16233
US Department of Veterans Affairs. VA Lung Precision Oncology Program (LPOP). Accessed January 27, 2022. https://www.research.va.gov/programs/lpop/
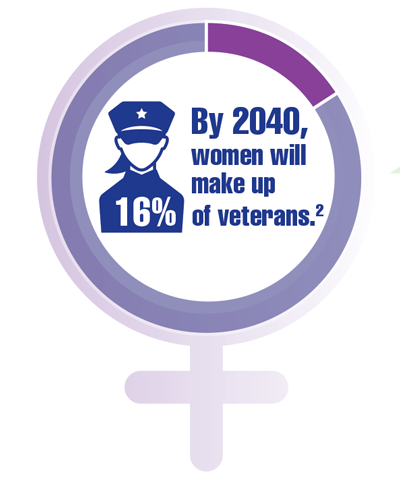
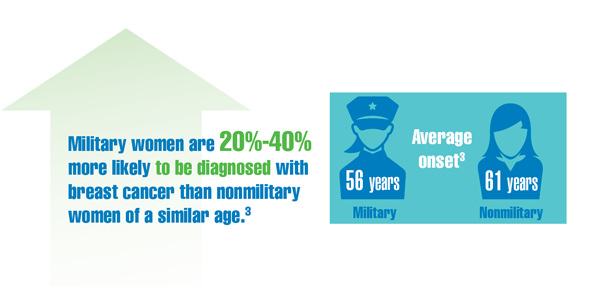
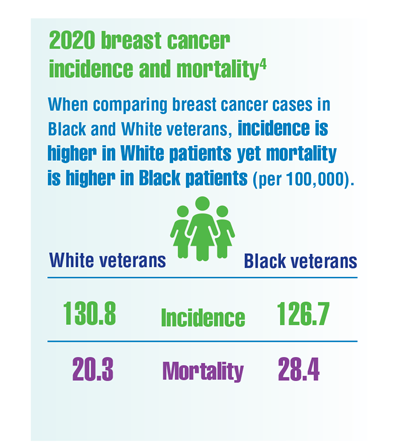
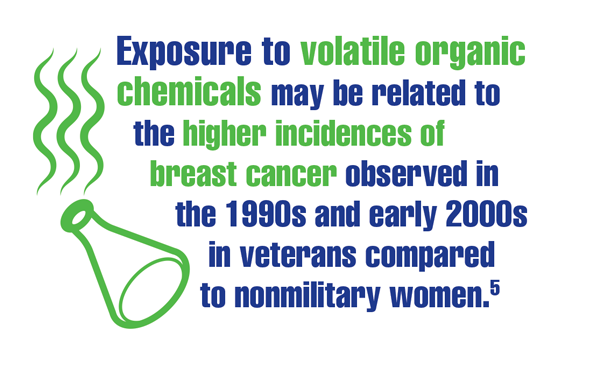
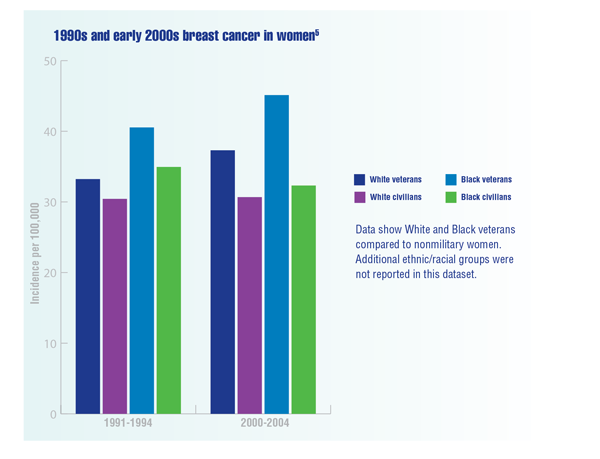
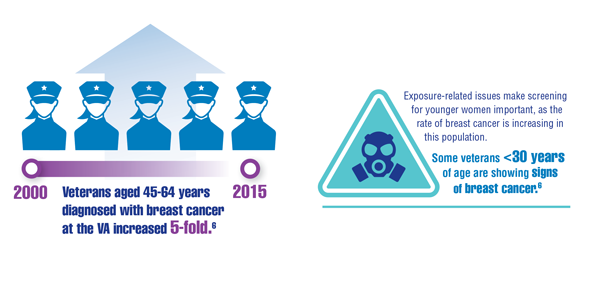
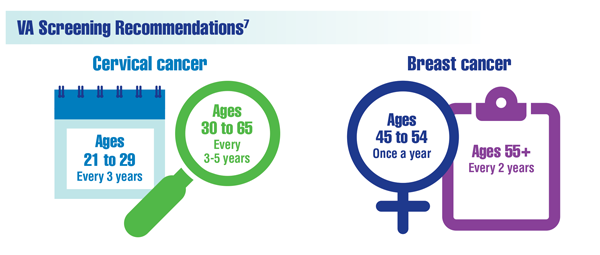
Cancer Data Trends 2022: Cancer in Women
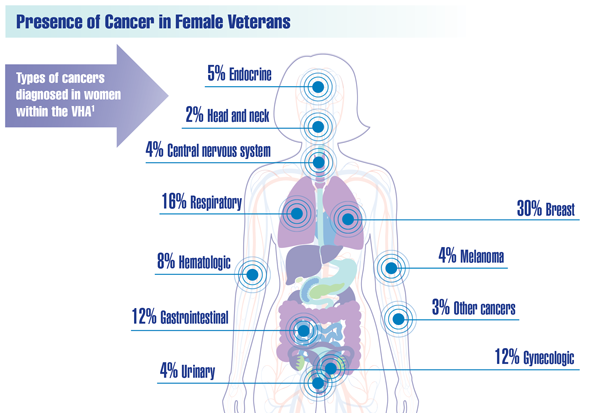
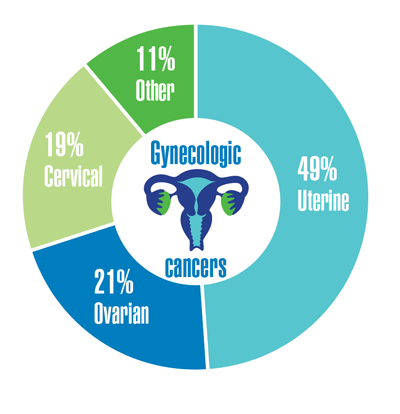
Zullig LL, Goldstein KM, Sims KJ, et al. Cancer among women treated in the Veterans Affairs Healthcare System. J Womens Health (Larchmt). 2019;28(2):268-275. doi:10.1089/jwh.2018.6936
Kondo K, Low A, Everson T, et al. Prevalence of and interventions to reduce health disparities in vulnerable veteran populations: a map of the evidence. VA Evidence-based Synthesis Program (ESP) project #05-225. Published May 2017. Accessed December 22, 2021. https://www.hsrd.research.va.gov/publications/esp/DisparitiesInterventions-REPORT.pdf
Aggarwal A, Liu ML, Krasnow SH. Breast cancer in male veteran population: an analysis from VA cancer registry. J Community Support Oncol. 2014;12(8):293-297. doi:10.12788/jcso.0066
Department of Defense Breast Cancer Research Program. The breast cancer landscape. Published October 2020. Accessed December 23, 2021. https://cdmrp.army.mil/bcrp/pdfs/Breast%20Cancer%20Landscape2020.pdf
Zhu K, Devesa SS, Wu H, et al. Cancer incidence in the US military population: comparison with rates from the SEER program. Cancer Epidemiol Biomarkers Prev. 2009;18(6):1740-1745. doi:10.1158/1055-9965.EPI-09-0041
Kennedy K. “The enemy is lurking in our bodies”— Women veterans say toxic exposure caused breast cancer. The War Horse. Published October 14, 2021. Accessed December 29, 2021. https://thewarhorse.org/military-women-face-higher-breast-cancer-rates-from-exposure
US Department of Veteran Affairs, National Center for Health Promotion and Disease Prevention. Get recommended screening tests and immunizations for women. Updated November 24, 2021. Accessed December 29, 2021. https://www.prevention.va.gov/Healthy_Living/Get_Recommended_Screening_Tests_and_Immunizations_for_Women.asp
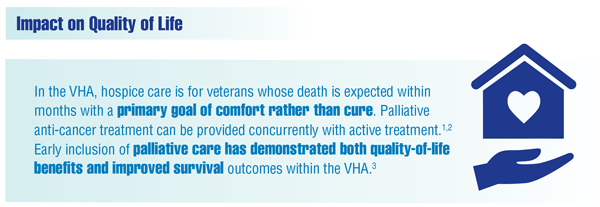
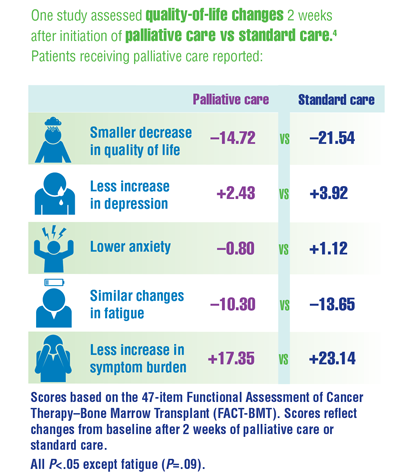
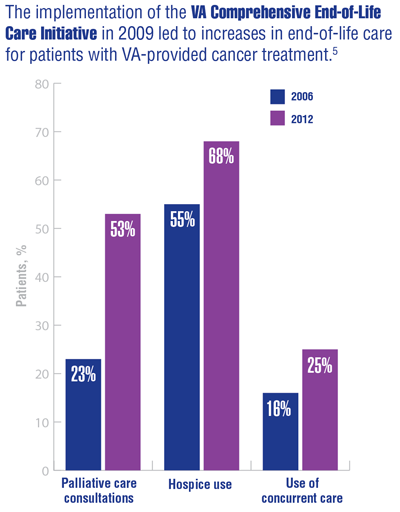
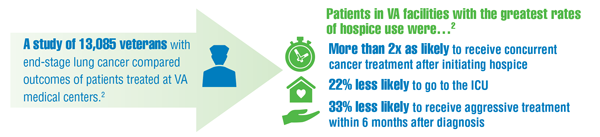
Cancer Data Trends 2022: Palliative and Hospice Care
Community hospice care: referral and purchase procedures. VHA Handbook, 1140.5 Transmittal Sheet. Washington, DC: Department of Veterans Affairs; March 1, 2005. Accessed January 13, 2022. https://www.va.gov/vhapublications/publications.cfm?pub=2
Mor V, Wagner TH, Levy C, et al. Association of expanded VA hospice care with aggressive care and cost for veterans with advanced lung cancer. JAMA Oncol. 2019;5(6):810-816. doi:10.1001/jamaoncol.2019.0081
Tan I, Ramchandran K. The role of palliative care in the management of patients with lung cancer. Lung Cancer Manag. 2020;9(4):LMT39. doi:10.2217/lmt-2020-0016
El-Jawahri A, LeBlanc T, VanDusen H, et al. Effect of inpatient palliative care on quality of life 2 weeks after hematopoietic stem cell transplantation: a randomized clinical trial. JAMA. 2016;316(20):2094-2103. doi:10.1001/jama.2016.16786
Miller SC, Intrator O, Scott W, et al. Increasing veterans’ hospice use: the Veterans Health Administration’s focus on improving end-of-life care. Health Aff (Millwood). 2017;36(7):1274. doi:10.1377/hlthaff.2017.0173
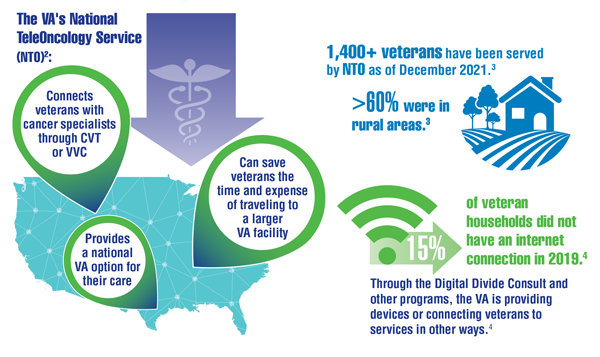
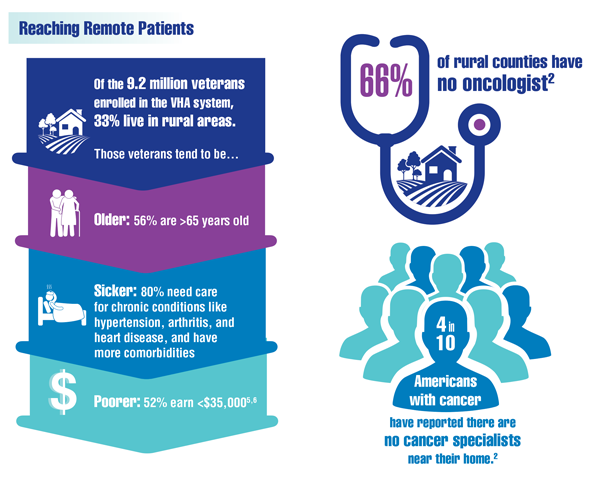
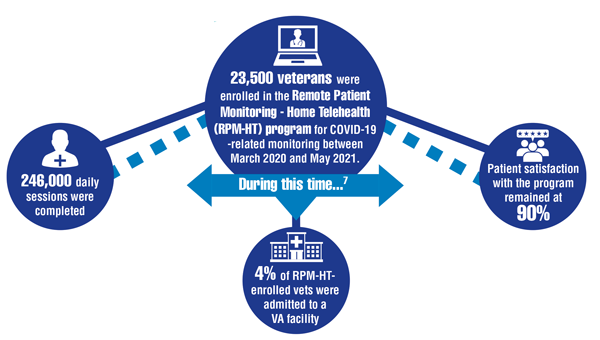
Cancer Data Trends 2022: Telehealth in Oncology
- Elliott VL. Department of Veteran Affairs: a primer on telehealth. Report R45834. Washington, DC: Congressional Research Service (CRS). Published July 26, 2019. Accessed December 14, 2021. https://crsreports.congress.gov/product/pdf/R%2FR45834
- Franchio C. Veteran’s blood cancer treated through teleoncology. VAntage Point. Published September 13, 2021. Accessed December 14, 2021. https://blogs.va.gov/VAntage/94344/veterans-blood-cancer-treated-through-teleoncology/
- Sara Ahmed, MD, Director of the VA National Precision Oncology Program (email, December 15, 2021).
- US Department of Veterans Affairs. Bridging the digital divide. Accessed December 15, 2021. https://telehealth.va.gov/digital-divide
- Jiang CY, El-Kouri NT, Elliot D, et al. Telehealth for cancer care in veterans: opportunities and challenges revealed by COVID. JCO Oncol Pract. 2021;17(1):22-29. doi:10.1200/OP.20.00520
- Klobucar TF. Increasing rural veterans’ access to care through research. Forum. Published Summer 2017. Accessed January 27, 2022. https://www.ruralhealth.va.gov/docs/VA_Forum_Summer_FINAL.pdf
- Buck C, Kobb RF, Sandreth R, et al. Maximizing VA remote patient monitoring during the COVID-19 response. Telehealth and Medicine Today. 2021;6(3):281. doi:10.30953/tmt.v6.281

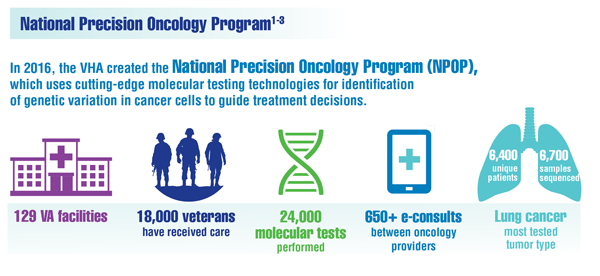
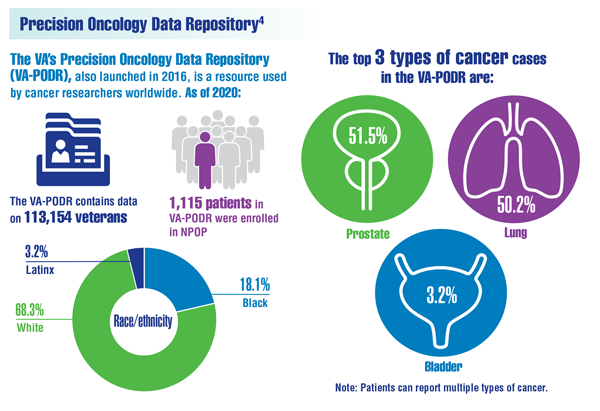
Cancer Data Trends 2022: Precision Oncology
- Poonnen PJ, Duffy JE, Hintze B, et al. Genomic analysis of metastatic solid tumors in veterans: findings from the VHA National Precision Oncology Program. JCO Precis Oncol. 2019;3:PO.19.00075. doi:10.1200/PO.19.00075
- Sara Ahmed, MD, Director of the VA National Precision Oncology Program (email, December 15, 2021).
- US Department of Veterans Affairs. National Precision Oncology Program (NPOP). Accessed December 27, 2022. https://www.cancer.va.gov/CANCER/NPOP.asp
- Elbers DC, Fillmore NR, Sung FC, et al. The Veterans Affairs Precision Oncology Data Repository, a clinical, genomic, and imaging research database. Patterns (NY). 2020;1(6):100083. doi:10.1016/j.patter.2020.100083