User login
Adenomyosis: Why we need to reassess our understanding of this condition

CASE Painful, heavy menstruation and recurrent pregnancy loss
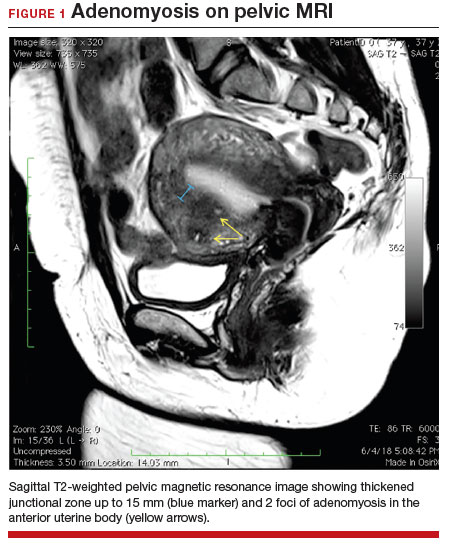
A 37-year-old woman (G3P0030) with a history of recurrent pregnancy loss presents for evaluation. She had 3 losses—most recently a miscarriage at 22 weeks with a cerclage in place. She did not undergo any surgical procedures for these losses. Hormonal and thrombophilia workup is negative and semen analysis is normal. She reports a history of painful, heavy periods for many years, as well as dyspareunia and occasional post-coital bleeding. Past medical history was otherwise unremarkable. Pelvic magnetic resonance imaging (MRI) revealed focal thickening of the junctional zone up to 15 mm with 2 foci of T2 hyperintensities suggesting adenomyosis (FIGURE 1).
How do you counsel this patient regarding the MRI findings and their impact on her fertility?
Adenomyosis is a condition in which endometrial glands and stroma are abnormally present in the uterine myometrium, resulting in smooth muscle hypertrophy and abnormal uterine contractility. Traditional teaching describes a woman in her 40s with heavy and painful menses, a “boggy uterus” on examination, who has completed childbearing and desires definitive treatment. Histologic diagnosis of adenomyosis is made from the uterine specimen at the time of hysterectomy, invariably confounding our understanding of the epidemiology of adenomyosis.
More recently, however, we are beginning to learn that this narrative is misguided. Imaging changes of adenomyosis can be seen in women who desire future fertility and in adolescents with severe dysmenorrhea, suggesting an earlier age of incidence.1 In a recent systematic review, prevalence estimates ranged from 15% to 67%, owing to varying diagnostic methods and patient inclusion criteria.2 It is increasingly being recognized as a primary contributor to infertility, with one study estimating a 30% prevalence of infertility in women with adenomyosis.3 Moreover, treatment with gonadotropin-releasing hormone agonists and/or surgical excision may improve fertility outcomes.4
As we learn more about this prevalent and life-altering condition, we owe it to our patients to consider this diagnosis when counseling on dysmenorrhea, heavy menstrual bleeding, or infertility.
Anatomy of the myometrium
The myometrium is composed of the inner and outer myometrium: the inner myometrium (IM) and endometrium are of Müllerian origin, and the outer myometrium (OM) is of mesenchymal origin. The IM thickens in response to steroid hormones during the menstrual cycle with metaplasia of endometrial stromal cells into myocytes and back again, whereas the OM is not responsive to hormones.5 Emerging literature suggests the OM is further divided into a middle and outer section based on different histologic morphologies, though the clinical implications of this are not understood.6 The term “junctional zone” (JZ) refers to the imaging appearance of what is thought to be the IM. Interestingly it cannot be identified on traditional hematoxylin and eosin staining. When the JZ is thickened or demonstrates irregular borders, it is used as a diagnostic marker for adenomyosis and is postulated to play an important role in adenomyosis pathophysiology, particularly heavy menstrual bleeding and infertility.7
Continue to: Subtypes of adenomyosis...
Subtypes of adenomyosis
While various disease classifications have been suggested for adenomyosis, to date there is no international consensus. Adenomyosis is typically described in 3 forms: diffuse, focal, or adenomyoma.8 As implied, the term focal adenomyosis refers to discrete lesions surrounded by normal myometrium, whereas abnormal glandular changes are pervasive throughout the myometrium in diffuse disease. Adenomyomas are a subgroup of focal adenomyosis that are thought to be surrounded by leiomyomatous smooth muscle and may be well demarcated on imaging.9
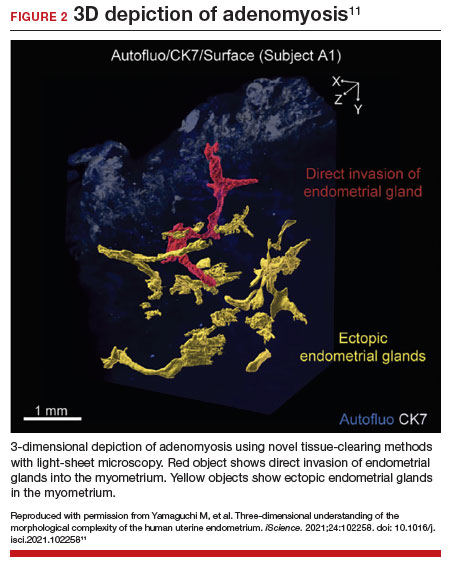
Recent research uses novel histologic imaging techniques to explore adenomyotic growth patterns in 3-dimensional (3D) reconstructions. Combining tissue-clearing methods with light-sheet fluorescence microscopy enables highly detailed 3D representations of the protein and nucleic acid structure of organs.10 For example, Yamaguchi and colleagues used this technology to explore the 3D morphological features of adenomyotic tissue and observed direct invasion of the endometrial glands into the myometrium and an “ant colony ̶ like network” of ectopic endometrial glands in the myometrium (FIGURE 2).11 These abnormal glandular networks have been visualized beyond the IM, which may not be captured on ultrasonography or MRI. While this work is still in its infancy, it has the potential to provide important insight into disease pathogenesis and to inform future therapy.
Pathogenesis
Proposed mechanisms for the development of adenomyosis include endometrial invasion, tissue injury and repair (TIAR) mechanisms, and the stem cell theory.12 According to the endometrial invasion theory, glandular epithelial cells from the basalis layer invaginate through an altered IM, slipping through weak muscle fibers and attracted by certain growth factors. In the TIAR mechanism theory, micro- or macro-trauma to the IM (whether from pregnancy, surgery, or infection) results in chronic proliferation and inflammation leading to the development of adenomyosis. Finally, the stem cell theory proposes that adenomyosis might develop from de novo ectopic endometrial tissue.
While the exact pathogenesis of adenomyosis is largely unknown, it has been associated with predictable molecular changes in the endometrium and surrounding myometrium.12 Myometrial hypercontractility is seen in patients with adenomyosis and dysmenorrhea, whereas neovascularization, high microvessel density, and abnormal uterine contractility are seen in those with abnormal uterine bleeding.13 In patients with infertility, increased inflammation, abnormal endometrial receptivity, and alterations in the myometrial architecture have been suggested to impair contractility and sperm transport.12,14
Differential growth factor expression and abnormal estrogen and progesterone signaling pathways have been observed in the IM in patients with adenomyosis, along with dysregulation of immune factors and increased inflammatory oxidative stress.12 This in turn results in myometrial hypertrophy and fibrosis, impairing normal uterine contractility patterns. This abnormal contractility may alter sperm transport and embryo implantation, and animal models that target pathways leading to fibrosis may improve endometrial receptivity.14,15 Further research is needed to elucidate specific molecular pathways and their complex interplay in this disease.
Continue to: Diagnosis...
Diagnosis
The gold standard for diagnosis of adenomyosis is histopathology from hysterectomy specimens, but specific definitions vary. Published criteria include endometrial glands within the myometrial layer greater than 0.5 to 1 low power field from the basal layer of the endometrium, endometrial glands extending deeper than 25% of the myometrial thickness, or endometrial glands a certain distance (ranging from 1-3 mm) from the basalis layer of the endometrium.16 Various methods of non-hysterectomy tissue sampling have been proposed for diagnosis, including needle, hysteroscopic, or laparoscopic sampling, but the sensitivity of these methods is poor.17 Limiting the diagnosis of adenomyosis to specimen pathology relies on invasive methods and clearly we cannot confirm the diagnosis by hysterectomy in patients with a desire for future fertility. It is for this reason that the prevalence of the disease is widely unknown.
The alternative to pathologic diagnosis is to identify radiologic changes that are associated with adenomyosis via either transvaginal ultrasound (TVUS) or MRI. Features suggestive of adenomyosis on MRI overlap with TVUS features, including uterine enlargement, anteroposterior myometrial asymmetry, T1- or T2-intense myometrial cysts or foci, and a thickened JZ.18 A JZ thicker than 12 mm has been thought to be predictive of adenomyosis, whereas a thickness of less than 8 mm is predictive of its absence, although the JZ may vary in thickness with the menstrual cycle.19,20 A 2021 systematic review and meta-analysis comparing MRI diagnosis with histopathologic findings reported a pooled sensitivity and specificity of 60% and 96%, respectively.21 The reported range for sensitivity and specificity is wide: 70% to 93% for sensitivity and 67% to 93% for specificity.22-24
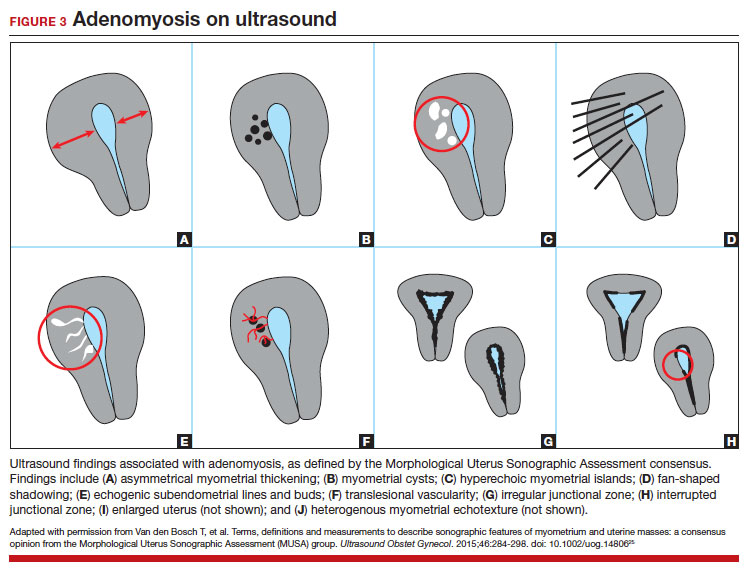
Key TVUS features associated with adenomyosis were defined in 2015 in a consensus statement released by the Morphological Uterus Sonographic Assessment (MUSA) group.25 These include a globally enlarged uterus, anteroposterior myometrial asymmetry, myometrial cysts, fan-shaped shadowing, mixed myometrial echogenicity, translesional vascularity, echogenic subendometrial lines and buds, and a thickened, irregular or discontinuous JZ (FIGURES 3 and 4).25 The accuracy of ultrasonographic diagnosis of adenomyosis using these features has been investigated in multiple systematic reviews and meta-analyses, most recently by Liu and colleagues who found a pooled sensitivity of TVUS of 81% and pooled specificity of 87%.23 The range for ultrasonographic sensitivity and specificity is wide, however, ranging from 33% to 84% for sensitivity and 64% to 100% for specificity.22 Consensus is lacking as to which TVUS features are most predictive of adenomyosis, but in general, the combination of multiple MUSA criteria (particularly myometrial cysts and irregular JZ on 3D imaging) appears to be more accurate than any one feature alone.23 The presence of fibroids may decrease the sensitivity of TVUS, and one study suggested elastography may increase the accuracy of TVUS.24,26 Moreover, given that most radiologists receive limited training on the MUSA criteria, it behooves gynecologists to become familiar with these sonographic features to be able to identify adenomyosis in our patients.

Adenomyosis also may be suspected based on hysteroscopic findings, although a normal hysteroscopy cannot rule out the disease and data are lacking to support these markers as diagnostic. Visual findings can include a “strawberry” pattern, mucosal elevation, cystic hemorrhagic lesions, localized vascularity, or endometrial defects.27 Hysteroscopy may be effective in the treatment of localized lesions, although that discussion is beyond the scope of this review.
Clinical presentation
While many women who are later diagnosed with adenomyosis are asymptomatic, the disease can present with heavy menstrual bleeding and dysmenorrhea, which occur in 50% and 30% of patients, respectively.28 Other symptoms include dyspareunia and infertility. Symptoms were previously reported to develop between the ages of 40 and 50 years; however, this is biased by diagnosis at the time of hysterectomy and the fact that younger patients are less likely to undergo definitive surgery. When using imaging criteria for diagnosis, adenomyosis might be more responsible for dysmenorrhea and chronic pelvic pain in younger patients than previously appreciated.1,29 In a recent study reviewing TVUS in 270 adolescents for any reason, adenomyosis was present in 5% of cases and this increased up to 44% in the presence of endometriosis.30
Adenomyosis often co-exists and shares similar clinical presentations with other gynecologic pathologies such as endometriosis and fibroids, making diagnosis on symptomatology alone challenging. Concurrent adenomyosis has been found in up to 73% and 57% of patients with suspected or diagnosed endometriosis and fibroids, respectively.31,32 Accumulating evidence suggests that pelvic pain previously attributed to endometriosis may in fact be a result of adenomyosis; for example, persistent pelvic pain after optimal resection of endometriosis may be confounded by the presence of adenomyosis.29 In one study of 155 patients with complete resection of deep infiltrating endometriosis, persistent pelvic pain was significantly associated with the presence of adenomyosis on imaging.33
Adenomyosis is increasingly being recognized at the time of infertility evaluation with an estimated prevalence of 30% in women with infertility.3 Among women with infertility, adenomyosis has been associated with a lower clinical pregnancy rate, higher miscarriage rate, and lower live birth rate, as well as obstetric complications such as abnormal placentation.34-36 A study of 37 baboons found the histologic diagnosis of adenomyosis alone at necropsy was associated with a 20-fold increased risk of lifelong infertility (odds ratio [OR], 20.1; 95% CI, 2.1-921), whereas presence of endometriosis was associated with a nonsignificant 3-fold risk of lifelong infertility (OR, 3.6; 95% CI, 0.9-15.8).37
In women with endometriosis and infertility, co-existing adenomyosis portends worse fertility outcomes. In a retrospective study of 244 women who underwent endometriosis surgery, more than five features of adenomyosis on imaging was associated with higher rates of infertility, in vitro fertilization treatments, and a higher number of in vitro fertilization cycles.31 Moreover, in women who underwent surgery for deep infiltrating endometriosis, the presence of adenomyosis on imaging was associated with a 68% reduction in likelihood of pregnancy after surgery.38
Conclusion
As we begin to learn about adenomyosis, our misconceptions become more evident. The notion that it largely affects women at the end of their reproductive lives is biased by using histopathology at hysterectomy as the gold standard for diagnosis. Lack of definitive histologic or imaging criteria and biopsy techniques add to the diagnostic challenge. This in turn leads to inaccurate estimates of incidence and prevalence, as we assume patients’ symptoms must be attributable to what we can see at the time of surgery (for example, Stage I or II endometriosis), rather than what we cannot see. We now know that adenomyosis is present in women of all ages, including adolescents, and can significantly contribute to reduced fertility and quality of life. We owe it to our patients to consider this condition in the differential diagnosis of dysmenorrhea, heavy menstrual bleeding, dyspareunia, and infertility.
CASE Resolved
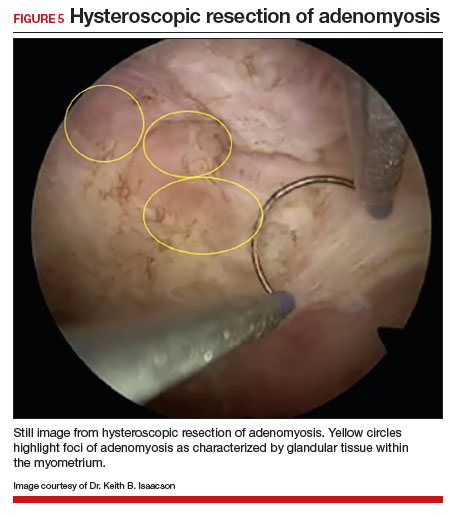
The patient underwent targeted hysteroscopic resection of adenomyosis (FIGURE 5) and conceived spontaneously the following year. ●
- Exacoustos C, Lazzeri L, Martire FG, et al. Ultrasound findings of adenomyosis in adolescents: type and grade of the disease. J Minim Invasive Gynecol. 2021;29:291.e1-299.e1. doi: 10.1016/j.jmig.2021.08.023
- Loring M, Chen TY, Isaacson KB. A systematic review of adenomyosis: it is time to reassess what we thought we knew about the disease. J Minim Invasive Gynecol. 2021;28:644655. doi: 10.1016/j.jmig.2020.10.012
- Bourdon M, Santulli P, Oliveira J, et al. Focal adenomyosis is associated with primary infertility. Fertil Steril. 2020;114:1271-1277. doi: 10.1016/j.fertnstert.2020.06.018
- Lan J, Wu Y, Wu Z, et al. Ultra-long GnRH agonist protocol during IVF/ICSI improves pregnancy outcomes in women with adenomyosis: a retrospective cohort study. Front Endocrinol (Lausanne). 2021;12:609771. doi: 10.3389 /fendo.2021.609771
- Gnecco JS, Brown AT, Kan EL, et al. Physiomimetic models of adenomyosis. Semin Reprod Med. 2020;38:179-196. doi: 10.1055/s-0040-1719084
- Harmsen MJ, Trommelen LM, de Leeuw RA, et al. Uterine junctional zone and adenomyosis: comparison of MRI, transvaginal ultrasound and histology. Ultrasound Obstet Gynecol. 2023;62:42-60. doi: 10.1002/uog.26117
- Xie T, Xu X, Yang Y, et al. The role of abnormal uterine junction zone in the occurrence and development of adenomyosis. Reprod Sci. 2022;29:2719-2730. doi: 10.1007/s43032-021 -00684-2
- Lazzeri L, Morosetti G, Centini G, et al. A sonographic classification of adenomyosis: interobserver reproducibility in the evaluation of type and degree of the myometrial involvement. Fertil Steril. 2018;110:1154-1161.e3. doi: 10.1016 /j.fertnstert.2018.06.031
- Tahlan A, Nanda A, Mohan H. Uterine adenomyoma: a clinicopathologic review of 26 cases and a review of the literature. Int J Gynecol Pathol. 2006;25:361-365. doi: 10.1097/01.pgp.0000209570.08716.b3
- Chung K, Wallace J, Kim S-Y, et al. Structural and molecular interrogation of intact biological systems. Nature. 2013;497:332-337. doi: 10.1038/nature12107
- Yamaguchi M, Yoshihara K, Suda K, et al. Three-dimensional understanding of the morphological complexity of the human uterine endometrium. iScience. 2021;24:102258. doi: 10.1016/j.isci.2021.102258
- Vannuccini S, Tosti C, Carmona F, et al. Pathogenesis of adenomyosis: an update on molecular mechanisms. Reprod Biomed Online. 2017;35:592-601. doi: 10.1016 /j.rbmo.2017.06.016
- Zhai J, Vannuccini S, Petraglia F, et al. Adenomyosis: mechanisms and pathogenesis. Semin Reprod Med. 2020;38:129-143. doi: 10.1055/s-0040-1716687
- Munro MG. Uterine polyps, adenomyosis, leiomyomas, and endometrial receptivity. Fertil Steril. 2019;111:629-640. doi: 10.1016/j.fertnstert.2019.02.008
- Kay N, Huang C-Y, Shiu L-Y, et al. TGF-β1 neutralization improves pregnancy outcomes by restoring endometrial receptivity in mice with adenomyosis. Reprod Sci. 2021;28:877-887. doi: 10.1007/s43032-020-00308-1
- Habiba M, Benagiano G. Classifying adenomyosis: progress and challenges. Int J Environ Res Public Health. 2021;18:12386. doi: 10.3390/ijerph182312386
- Movilla P, Morris S, Isaacson K. A systematic review of tissue sampling techniques for the diagnosis of adenomyosis. J Minim Invasive Gynecol. 2020;27:344-351. doi: 10.1016 /j.jmig.2019.09.001
- Agostinho L, Cruz R, Osório F, et al. MRI for adenomyosis: a pictorial review. Insights Imaging. 2017;8:549-556. doi: 10.1007/s13244-017-0576-z
- Bazot M, Cortez A, Darai E, et al. Ultrasonography compared with magnetic resonance imaging for the diagnosis of adenomyosis: correlation with histopathology. Hum Reprod. 2001;16:2427-2433. doi: 10.1093/humrep/16.11.2427
- Reinhold C, Tafazoli F, Mehio A, et al. Uterine adenomyosis: endovaginal US and MR imaging features with histopathologic correlation. Radiographics. 1999;19:S147-S160. doi: 10.1148 /radiographics.19.suppl_1.g99oc13s147
- Rees CO, Nederend J, Mischi M, et al. Objective measures of adenomyosis on MRI and their diagnostic accuracy—a systematic review & meta-analysis. Acta Obstet Gynecol Scand. 2021;100:1377-1391.
- Chapron C, Vannuccini S, Santulli P, et al. Diagnosing adenomyosis: an integrated clinical and imaging approach. Hum Reprod Update. 2020;26:392-411. doi: 10.1093 /humupd/dmz049
- Liu L, Li W, Leonardi M, et al. Diagnostic accuracy of transvaginal ultrasound and magnetic resonance imaging for adenomyosis: systematic review and meta-analysis and review of sonographic diagnostic criteria. J Ultrasound Med. 2021;40:2289-2306. doi: 10.1002/jum.15635
- Bazot M, Daraï E. Role of transvaginal sonography and magnetic resonance imaging in the diagnosis of uterine adenomyosis. Fertil Steril. 2018;109:389-397. doi: 10.1016 /j.fertnstert.2018.01.024
- Van den Bosch T, Dueholm M, Leone FPG, et al. Terms, definitions and measurements to describe sonographic features of myometrium and uterine masses: a consensus opinion from the Morphological Uterus Sonographic Assessment (MUSA) group. Ultrasound Obstet Gynecol. 2015;46:284-298. doi: 10.1002/uog.14806
- Săsăran V, Turdean S, Gliga M, et al. Value of strainratio elastography in the diagnosis and differentiation of uterine fibroids and adenomyosis. J Pers Med. 2021;11:824. doi: 10.3390/jpm11080824
- Di Spiezio Sardo A, Calagna G, Santangelo F, et al. The role of hysteroscopy in the diagnosis and treatment of adenomyosis. Biomed Res Int. 2017;2017:2518396. doi: 10.1155/2017/2518396
- Azzi R. Adenomyosis: current perspectives. Obstet Gynecol Clin North Am. 1989;16:221-235.
- Parker JD, Leondires M, Sinaii N, et al. Persistence of dysmenorrhea and nonmenstrual pain after optimal endometriosis surgery may indicate adenomyosis. Fertil Steril. 2006;86:711-715. doi: 10.1016/j.fertnstert.2006.01.030
- Martire FG, Lazzeri L, Conway F, et al. Adolescence and endometriosis: symptoms, ultrasound signs and early diagnosis. Fertil Steril. 2020;114:1049-1057. doi: 10.1016 /j.fertnstert.2020.06.012
- Decter D, Arbib N, Markovitz H, et al. Sonographic signs of adenomyosis in women with endometriosis are associated with infertility. J Clin Med. 2021;10:2355. doi: 10.3390 /jcm10112355
- Brucker SY, Huebner M, Wallwiener M, et al. Clinical characteristics indicating adenomyosis coexisting with leiomyomas: a retrospective, questionnaire-based study. Fertil Steril. 2014;101:237-241.e1. doi: 10.1016 /j.fertnstert.2013.09.038
- Perelló MF, Martínez-Zamora MÁ, Torres X, et al. Endometriotic pain is associated with adenomyosis but not with the compartments affected by deep infiltrating endometriosis. Gynecol Obstet Invest. 2017;82:240-246. doi: 10.1159/000447633
- Younes G, Tulandi T. Effects of adenomyosis on in vitro fertilization treatment outcomes: a metaanalysis. Fertil Steril. 2017;108:483-490.e3. doi: 10.1016 /j.fertnstert.2017.06.025
- Nirgianakis K, Kalaitzopoulos DR, Schwartz ASK, et al. Fertility, pregnancy and neonatal outcomes of patients with adenomyosis: a systematic review and meta-analysis. Reprod BioMed Online. 2021;42:185-206. doi: 10.1016 /j.rbmo.2020.09.023
- Ono Y, Ota H, Takimoto K, et al. Perinatal outcomes associated with the positional relationship between the placenta and the adenomyosis lesion. J Gynecol Obstet Hum Reprod. 2021;50:102114. doi: 10.1016/j.jogoh.2021.102114
- Barrier BF, Malinowski MJ, Dick EJ Jr, et al. Adenomyosis in the baboon is associated with primary infertility. Fertil Steril. 2004;82(suppl 3):1091-1094. doi: 10.1016 /j.fertnstert.2003.11.065
- Vercellini P, Consonni D, Barbara G, et al. Adenomyosis and reproductive performance after surgery for rectovaginal and colorectal endometriosis: a systematic review and meta-analysis. Reprod Biomed Online. 2014;28:704-713. doi: 10.1016/j.rbmo.2014.02.006

Dr. Haber is Fellow, Minimally Invasive Gynecologic Surgery, Women’s Health Center, Newton-Wellesley Hospital, Newton, Massachusetts.

Dr. Fitzgerald is Resident, Department of Obstetrics and Gynecology, Brigham and Women’s Hospital, Boston, Massachusetts.

Dr. Isaacson is Associate Professor and Director of Minimally Invasive Gynecologic Surgery, Women’s Health Center, Newton-Wellesley Hospital.
The authors report no financial relationships relevant to this article.
Dr. Haber is Fellow, Minimally Invasive Gynecologic Surgery, Women’s Health Center, Newton-Wellesley Hospital, Newton, Massachusetts.
Dr. Fitzgerald is Resident, Department of Obstetrics and Gynecology, Brigham and Women’s Hospital, Boston, Massachusetts.
Dr. Isaacson is Associate Professor and Director of Minimally Invasive Gynecologic Surgery, Women’s Health Center, Newton-Wellesley Hospital.
The authors report no financial relationships relevant to this article.
CASE Painful, heavy menstruation and recurrent pregnancy loss
A 37-year-old woman (G3P0030) with a history of recurrent pregnancy loss presents for evaluation. She had 3 losses—most recently a miscarriage at 22 weeks with a cerclage in place. She did not undergo any surgical procedures for these losses. Hormonal and thrombophilia workup is negative and semen analysis is normal. She reports a history of painful, heavy periods for many years, as well as dyspareunia and occasional post-coital bleeding. Past medical history was otherwise unremarkable. Pelvic magnetic resonance imaging (MRI) revealed focal thickening of the junctional zone up to 15 mm with 2 foci of T2 hyperintensities suggesting adenomyosis (FIGURE 1).
How do you counsel this patient regarding the MRI findings and their impact on her fertility?
Adenomyosis is a condition in which endometrial glands and stroma are abnormally present in the uterine myometrium, resulting in smooth muscle hypertrophy and abnormal uterine contractility. Traditional teaching describes a woman in her 40s with heavy and painful menses, a “boggy uterus” on examination, who has completed childbearing and desires definitive treatment. Histologic diagnosis of adenomyosis is made from the uterine specimen at the time of hysterectomy, invariably confounding our understanding of the epidemiology of adenomyosis.
More recently, however, we are beginning to learn that this narrative is misguided. Imaging changes of adenomyosis can be seen in women who desire future fertility and in adolescents with severe dysmenorrhea, suggesting an earlier age of incidence.1 In a recent systematic review, prevalence estimates ranged from 15% to 67%, owing to varying diagnostic methods and patient inclusion criteria.2 It is increasingly being recognized as a primary contributor to infertility, with one study estimating a 30% prevalence of infertility in women with adenomyosis.3 Moreover, treatment with gonadotropin-releasing hormone agonists and/or surgical excision may improve fertility outcomes.4
As we learn more about this prevalent and life-altering condition, we owe it to our patients to consider this diagnosis when counseling on dysmenorrhea, heavy menstrual bleeding, or infertility.
Anatomy of the myometrium
The myometrium is composed of the inner and outer myometrium: the inner myometrium (IM) and endometrium are of Müllerian origin, and the outer myometrium (OM) is of mesenchymal origin. The IM thickens in response to steroid hormones during the menstrual cycle with metaplasia of endometrial stromal cells into myocytes and back again, whereas the OM is not responsive to hormones.5 Emerging literature suggests the OM is further divided into a middle and outer section based on different histologic morphologies, though the clinical implications of this are not understood.6 The term “junctional zone” (JZ) refers to the imaging appearance of what is thought to be the IM. Interestingly it cannot be identified on traditional hematoxylin and eosin staining. When the JZ is thickened or demonstrates irregular borders, it is used as a diagnostic marker for adenomyosis and is postulated to play an important role in adenomyosis pathophysiology, particularly heavy menstrual bleeding and infertility.7
Continue to: Subtypes of adenomyosis...
Subtypes of adenomyosis
While various disease classifications have been suggested for adenomyosis, to date there is no international consensus. Adenomyosis is typically described in 3 forms: diffuse, focal, or adenomyoma.8 As implied, the term focal adenomyosis refers to discrete lesions surrounded by normal myometrium, whereas abnormal glandular changes are pervasive throughout the myometrium in diffuse disease. Adenomyomas are a subgroup of focal adenomyosis that are thought to be surrounded by leiomyomatous smooth muscle and may be well demarcated on imaging.9
Recent research uses novel histologic imaging techniques to explore adenomyotic growth patterns in 3-dimensional (3D) reconstructions. Combining tissue-clearing methods with light-sheet fluorescence microscopy enables highly detailed 3D representations of the protein and nucleic acid structure of organs.10 For example, Yamaguchi and colleagues used this technology to explore the 3D morphological features of adenomyotic tissue and observed direct invasion of the endometrial glands into the myometrium and an “ant colony ̶ like network” of ectopic endometrial glands in the myometrium (FIGURE 2).11 These abnormal glandular networks have been visualized beyond the IM, which may not be captured on ultrasonography or MRI. While this work is still in its infancy, it has the potential to provide important insight into disease pathogenesis and to inform future therapy.
Pathogenesis
Proposed mechanisms for the development of adenomyosis include endometrial invasion, tissue injury and repair (TIAR) mechanisms, and the stem cell theory.12 According to the endometrial invasion theory, glandular epithelial cells from the basalis layer invaginate through an altered IM, slipping through weak muscle fibers and attracted by certain growth factors. In the TIAR mechanism theory, micro- or macro-trauma to the IM (whether from pregnancy, surgery, or infection) results in chronic proliferation and inflammation leading to the development of adenomyosis. Finally, the stem cell theory proposes that adenomyosis might develop from de novo ectopic endometrial tissue.
While the exact pathogenesis of adenomyosis is largely unknown, it has been associated with predictable molecular changes in the endometrium and surrounding myometrium.12 Myometrial hypercontractility is seen in patients with adenomyosis and dysmenorrhea, whereas neovascularization, high microvessel density, and abnormal uterine contractility are seen in those with abnormal uterine bleeding.13 In patients with infertility, increased inflammation, abnormal endometrial receptivity, and alterations in the myometrial architecture have been suggested to impair contractility and sperm transport.12,14
Differential growth factor expression and abnormal estrogen and progesterone signaling pathways have been observed in the IM in patients with adenomyosis, along with dysregulation of immune factors and increased inflammatory oxidative stress.12 This in turn results in myometrial hypertrophy and fibrosis, impairing normal uterine contractility patterns. This abnormal contractility may alter sperm transport and embryo implantation, and animal models that target pathways leading to fibrosis may improve endometrial receptivity.14,15 Further research is needed to elucidate specific molecular pathways and their complex interplay in this disease.
Continue to: Diagnosis...
Diagnosis
The gold standard for diagnosis of adenomyosis is histopathology from hysterectomy specimens, but specific definitions vary. Published criteria include endometrial glands within the myometrial layer greater than 0.5 to 1 low power field from the basal layer of the endometrium, endometrial glands extending deeper than 25% of the myometrial thickness, or endometrial glands a certain distance (ranging from 1-3 mm) from the basalis layer of the endometrium.16 Various methods of non-hysterectomy tissue sampling have been proposed for diagnosis, including needle, hysteroscopic, or laparoscopic sampling, but the sensitivity of these methods is poor.17 Limiting the diagnosis of adenomyosis to specimen pathology relies on invasive methods and clearly we cannot confirm the diagnosis by hysterectomy in patients with a desire for future fertility. It is for this reason that the prevalence of the disease is widely unknown.
The alternative to pathologic diagnosis is to identify radiologic changes that are associated with adenomyosis via either transvaginal ultrasound (TVUS) or MRI. Features suggestive of adenomyosis on MRI overlap with TVUS features, including uterine enlargement, anteroposterior myometrial asymmetry, T1- or T2-intense myometrial cysts or foci, and a thickened JZ.18 A JZ thicker than 12 mm has been thought to be predictive of adenomyosis, whereas a thickness of less than 8 mm is predictive of its absence, although the JZ may vary in thickness with the menstrual cycle.19,20 A 2021 systematic review and meta-analysis comparing MRI diagnosis with histopathologic findings reported a pooled sensitivity and specificity of 60% and 96%, respectively.21 The reported range for sensitivity and specificity is wide: 70% to 93% for sensitivity and 67% to 93% for specificity.22-24
Key TVUS features associated with adenomyosis were defined in 2015 in a consensus statement released by the Morphological Uterus Sonographic Assessment (MUSA) group.25 These include a globally enlarged uterus, anteroposterior myometrial asymmetry, myometrial cysts, fan-shaped shadowing, mixed myometrial echogenicity, translesional vascularity, echogenic subendometrial lines and buds, and a thickened, irregular or discontinuous JZ (FIGURES 3 and 4).25 The accuracy of ultrasonographic diagnosis of adenomyosis using these features has been investigated in multiple systematic reviews and meta-analyses, most recently by Liu and colleagues who found a pooled sensitivity of TVUS of 81% and pooled specificity of 87%.23 The range for ultrasonographic sensitivity and specificity is wide, however, ranging from 33% to 84% for sensitivity and 64% to 100% for specificity.22 Consensus is lacking as to which TVUS features are most predictive of adenomyosis, but in general, the combination of multiple MUSA criteria (particularly myometrial cysts and irregular JZ on 3D imaging) appears to be more accurate than any one feature alone.23 The presence of fibroids may decrease the sensitivity of TVUS, and one study suggested elastography may increase the accuracy of TVUS.24,26 Moreover, given that most radiologists receive limited training on the MUSA criteria, it behooves gynecologists to become familiar with these sonographic features to be able to identify adenomyosis in our patients.
Adenomyosis also may be suspected based on hysteroscopic findings, although a normal hysteroscopy cannot rule out the disease and data are lacking to support these markers as diagnostic. Visual findings can include a “strawberry” pattern, mucosal elevation, cystic hemorrhagic lesions, localized vascularity, or endometrial defects.27 Hysteroscopy may be effective in the treatment of localized lesions, although that discussion is beyond the scope of this review.
Clinical presentation
While many women who are later diagnosed with adenomyosis are asymptomatic, the disease can present with heavy menstrual bleeding and dysmenorrhea, which occur in 50% and 30% of patients, respectively.28 Other symptoms include dyspareunia and infertility. Symptoms were previously reported to develop between the ages of 40 and 50 years; however, this is biased by diagnosis at the time of hysterectomy and the fact that younger patients are less likely to undergo definitive surgery. When using imaging criteria for diagnosis, adenomyosis might be more responsible for dysmenorrhea and chronic pelvic pain in younger patients than previously appreciated.1,29 In a recent study reviewing TVUS in 270 adolescents for any reason, adenomyosis was present in 5% of cases and this increased up to 44% in the presence of endometriosis.30
Adenomyosis often co-exists and shares similar clinical presentations with other gynecologic pathologies such as endometriosis and fibroids, making diagnosis on symptomatology alone challenging. Concurrent adenomyosis has been found in up to 73% and 57% of patients with suspected or diagnosed endometriosis and fibroids, respectively.31,32 Accumulating evidence suggests that pelvic pain previously attributed to endometriosis may in fact be a result of adenomyosis; for example, persistent pelvic pain after optimal resection of endometriosis may be confounded by the presence of adenomyosis.29 In one study of 155 patients with complete resection of deep infiltrating endometriosis, persistent pelvic pain was significantly associated with the presence of adenomyosis on imaging.33
Adenomyosis is increasingly being recognized at the time of infertility evaluation with an estimated prevalence of 30% in women with infertility.3 Among women with infertility, adenomyosis has been associated with a lower clinical pregnancy rate, higher miscarriage rate, and lower live birth rate, as well as obstetric complications such as abnormal placentation.34-36 A study of 37 baboons found the histologic diagnosis of adenomyosis alone at necropsy was associated with a 20-fold increased risk of lifelong infertility (odds ratio [OR], 20.1; 95% CI, 2.1-921), whereas presence of endometriosis was associated with a nonsignificant 3-fold risk of lifelong infertility (OR, 3.6; 95% CI, 0.9-15.8).37
In women with endometriosis and infertility, co-existing adenomyosis portends worse fertility outcomes. In a retrospective study of 244 women who underwent endometriosis surgery, more than five features of adenomyosis on imaging was associated with higher rates of infertility, in vitro fertilization treatments, and a higher number of in vitro fertilization cycles.31 Moreover, in women who underwent surgery for deep infiltrating endometriosis, the presence of adenomyosis on imaging was associated with a 68% reduction in likelihood of pregnancy after surgery.38
Conclusion
As we begin to learn about adenomyosis, our misconceptions become more evident. The notion that it largely affects women at the end of their reproductive lives is biased by using histopathology at hysterectomy as the gold standard for diagnosis. Lack of definitive histologic or imaging criteria and biopsy techniques add to the diagnostic challenge. This in turn leads to inaccurate estimates of incidence and prevalence, as we assume patients’ symptoms must be attributable to what we can see at the time of surgery (for example, Stage I or II endometriosis), rather than what we cannot see. We now know that adenomyosis is present in women of all ages, including adolescents, and can significantly contribute to reduced fertility and quality of life. We owe it to our patients to consider this condition in the differential diagnosis of dysmenorrhea, heavy menstrual bleeding, dyspareunia, and infertility.
CASE Resolved
The patient underwent targeted hysteroscopic resection of adenomyosis (FIGURE 5) and conceived spontaneously the following year. ●
- Exacoustos C, Lazzeri L, Martire FG, et al. Ultrasound findings of adenomyosis in adolescents: type and grade of the disease. J Minim Invasive Gynecol. 2021;29:291.e1-299.e1. doi: 10.1016/j.jmig.2021.08.023
- Loring M, Chen TY, Isaacson KB. A systematic review of adenomyosis: it is time to reassess what we thought we knew about the disease. J Minim Invasive Gynecol. 2021;28:644655. doi: 10.1016/j.jmig.2020.10.012
- Bourdon M, Santulli P, Oliveira J, et al. Focal adenomyosis is associated with primary infertility. Fertil Steril. 2020;114:1271-1277. doi: 10.1016/j.fertnstert.2020.06.018
- Lan J, Wu Y, Wu Z, et al. Ultra-long GnRH agonist protocol during IVF/ICSI improves pregnancy outcomes in women with adenomyosis: a retrospective cohort study. Front Endocrinol (Lausanne). 2021;12:609771. doi: 10.3389 /fendo.2021.609771
- Gnecco JS, Brown AT, Kan EL, et al. Physiomimetic models of adenomyosis. Semin Reprod Med. 2020;38:179-196. doi: 10.1055/s-0040-1719084
- Harmsen MJ, Trommelen LM, de Leeuw RA, et al. Uterine junctional zone and adenomyosis: comparison of MRI, transvaginal ultrasound and histology. Ultrasound Obstet Gynecol. 2023;62:42-60. doi: 10.1002/uog.26117
- Xie T, Xu X, Yang Y, et al. The role of abnormal uterine junction zone in the occurrence and development of adenomyosis. Reprod Sci. 2022;29:2719-2730. doi: 10.1007/s43032-021 -00684-2
- Lazzeri L, Morosetti G, Centini G, et al. A sonographic classification of adenomyosis: interobserver reproducibility in the evaluation of type and degree of the myometrial involvement. Fertil Steril. 2018;110:1154-1161.e3. doi: 10.1016 /j.fertnstert.2018.06.031
- Tahlan A, Nanda A, Mohan H. Uterine adenomyoma: a clinicopathologic review of 26 cases and a review of the literature. Int J Gynecol Pathol. 2006;25:361-365. doi: 10.1097/01.pgp.0000209570.08716.b3
- Chung K, Wallace J, Kim S-Y, et al. Structural and molecular interrogation of intact biological systems. Nature. 2013;497:332-337. doi: 10.1038/nature12107
- Yamaguchi M, Yoshihara K, Suda K, et al. Three-dimensional understanding of the morphological complexity of the human uterine endometrium. iScience. 2021;24:102258. doi: 10.1016/j.isci.2021.102258
- Vannuccini S, Tosti C, Carmona F, et al. Pathogenesis of adenomyosis: an update on molecular mechanisms. Reprod Biomed Online. 2017;35:592-601. doi: 10.1016 /j.rbmo.2017.06.016
- Zhai J, Vannuccini S, Petraglia F, et al. Adenomyosis: mechanisms and pathogenesis. Semin Reprod Med. 2020;38:129-143. doi: 10.1055/s-0040-1716687
- Munro MG. Uterine polyps, adenomyosis, leiomyomas, and endometrial receptivity. Fertil Steril. 2019;111:629-640. doi: 10.1016/j.fertnstert.2019.02.008
- Kay N, Huang C-Y, Shiu L-Y, et al. TGF-β1 neutralization improves pregnancy outcomes by restoring endometrial receptivity in mice with adenomyosis. Reprod Sci. 2021;28:877-887. doi: 10.1007/s43032-020-00308-1
- Habiba M, Benagiano G. Classifying adenomyosis: progress and challenges. Int J Environ Res Public Health. 2021;18:12386. doi: 10.3390/ijerph182312386
- Movilla P, Morris S, Isaacson K. A systematic review of tissue sampling techniques for the diagnosis of adenomyosis. J Minim Invasive Gynecol. 2020;27:344-351. doi: 10.1016 /j.jmig.2019.09.001
- Agostinho L, Cruz R, Osório F, et al. MRI for adenomyosis: a pictorial review. Insights Imaging. 2017;8:549-556. doi: 10.1007/s13244-017-0576-z
- Bazot M, Cortez A, Darai E, et al. Ultrasonography compared with magnetic resonance imaging for the diagnosis of adenomyosis: correlation with histopathology. Hum Reprod. 2001;16:2427-2433. doi: 10.1093/humrep/16.11.2427
- Reinhold C, Tafazoli F, Mehio A, et al. Uterine adenomyosis: endovaginal US and MR imaging features with histopathologic correlation. Radiographics. 1999;19:S147-S160. doi: 10.1148 /radiographics.19.suppl_1.g99oc13s147
- Rees CO, Nederend J, Mischi M, et al. Objective measures of adenomyosis on MRI and their diagnostic accuracy—a systematic review & meta-analysis. Acta Obstet Gynecol Scand. 2021;100:1377-1391.
- Chapron C, Vannuccini S, Santulli P, et al. Diagnosing adenomyosis: an integrated clinical and imaging approach. Hum Reprod Update. 2020;26:392-411. doi: 10.1093 /humupd/dmz049
- Liu L, Li W, Leonardi M, et al. Diagnostic accuracy of transvaginal ultrasound and magnetic resonance imaging for adenomyosis: systematic review and meta-analysis and review of sonographic diagnostic criteria. J Ultrasound Med. 2021;40:2289-2306. doi: 10.1002/jum.15635
- Bazot M, Daraï E. Role of transvaginal sonography and magnetic resonance imaging in the diagnosis of uterine adenomyosis. Fertil Steril. 2018;109:389-397. doi: 10.1016 /j.fertnstert.2018.01.024
- Van den Bosch T, Dueholm M, Leone FPG, et al. Terms, definitions and measurements to describe sonographic features of myometrium and uterine masses: a consensus opinion from the Morphological Uterus Sonographic Assessment (MUSA) group. Ultrasound Obstet Gynecol. 2015;46:284-298. doi: 10.1002/uog.14806
- Săsăran V, Turdean S, Gliga M, et al. Value of strainratio elastography in the diagnosis and differentiation of uterine fibroids and adenomyosis. J Pers Med. 2021;11:824. doi: 10.3390/jpm11080824
- Di Spiezio Sardo A, Calagna G, Santangelo F, et al. The role of hysteroscopy in the diagnosis and treatment of adenomyosis. Biomed Res Int. 2017;2017:2518396. doi: 10.1155/2017/2518396
- Azzi R. Adenomyosis: current perspectives. Obstet Gynecol Clin North Am. 1989;16:221-235.
- Parker JD, Leondires M, Sinaii N, et al. Persistence of dysmenorrhea and nonmenstrual pain after optimal endometriosis surgery may indicate adenomyosis. Fertil Steril. 2006;86:711-715. doi: 10.1016/j.fertnstert.2006.01.030
- Martire FG, Lazzeri L, Conway F, et al. Adolescence and endometriosis: symptoms, ultrasound signs and early diagnosis. Fertil Steril. 2020;114:1049-1057. doi: 10.1016 /j.fertnstert.2020.06.012
- Decter D, Arbib N, Markovitz H, et al. Sonographic signs of adenomyosis in women with endometriosis are associated with infertility. J Clin Med. 2021;10:2355. doi: 10.3390 /jcm10112355
- Brucker SY, Huebner M, Wallwiener M, et al. Clinical characteristics indicating adenomyosis coexisting with leiomyomas: a retrospective, questionnaire-based study. Fertil Steril. 2014;101:237-241.e1. doi: 10.1016 /j.fertnstert.2013.09.038
- Perelló MF, Martínez-Zamora MÁ, Torres X, et al. Endometriotic pain is associated with adenomyosis but not with the compartments affected by deep infiltrating endometriosis. Gynecol Obstet Invest. 2017;82:240-246. doi: 10.1159/000447633
- Younes G, Tulandi T. Effects of adenomyosis on in vitro fertilization treatment outcomes: a metaanalysis. Fertil Steril. 2017;108:483-490.e3. doi: 10.1016 /j.fertnstert.2017.06.025
- Nirgianakis K, Kalaitzopoulos DR, Schwartz ASK, et al. Fertility, pregnancy and neonatal outcomes of patients with adenomyosis: a systematic review and meta-analysis. Reprod BioMed Online. 2021;42:185-206. doi: 10.1016 /j.rbmo.2020.09.023
- Ono Y, Ota H, Takimoto K, et al. Perinatal outcomes associated with the positional relationship between the placenta and the adenomyosis lesion. J Gynecol Obstet Hum Reprod. 2021;50:102114. doi: 10.1016/j.jogoh.2021.102114
- Barrier BF, Malinowski MJ, Dick EJ Jr, et al. Adenomyosis in the baboon is associated with primary infertility. Fertil Steril. 2004;82(suppl 3):1091-1094. doi: 10.1016 /j.fertnstert.2003.11.065
- Vercellini P, Consonni D, Barbara G, et al. Adenomyosis and reproductive performance after surgery for rectovaginal and colorectal endometriosis: a systematic review and meta-analysis. Reprod Biomed Online. 2014;28:704-713. doi: 10.1016/j.rbmo.2014.02.006

Shiny Indurated Plaques on the Legs
The Diagnosis: Pretibial Myxedema
Histopathology showed superficial and deep mucin deposition with proliferation of fibroblasts and thin wiry collagen bundles that were consistent with a diagnosis of pretibial myxedema. The patient was treated with clobetasol ointment 0.05% twice daily for 3 months, followed by a trial of pentoxifylline 400 mg 3 times daily for 3 months. After this treatment failed, she was started on rituximab infusions of 1 g biweekly for 1 month, followed by 500 mg at 6 months, with marked improvement after the first 2 doses of 1 g.
Pretibial myxedema is an uncommon cutaneous manifestation of autoimmune thyroid disease, occurring in 1% to 5% of patients with Graves disease. It usually occurs in older adult women on the pretibial regions and less commonly on the upper extremities, face, and areas of prior trauma.1-3 Although typically asymptomatic, it can be painful and ulcerate.3 The clinical presentation consists of bilateral nonpitting edema with overlying indurated skin as well as flesh-colored, yellow-brown, violaceous, or peau d’orange papules and plaques.2,3 Lesions develop over months and often have been associated with hyperhidrosis and hypertrichosis.2 Many variants have been identified including nodular, plaquelike, diffuse swelling (ie, nonpitting edema), tumor, mixture, polypoid, and elephantiasis; severe cases with acral involvement are termed thyroid acropachy.1-3 Pathogenesis likely involves the activation of thyrotropin receptors on fibroblasts by the circulating thyrotropin autoantibodies found in Graves disease. Activated fibroblasts upregulate glycosaminoglycan production, which osmotically drives the accumulation of dermal and subdermal fluid.1,3
This diagnosis should be considered in any patient with pretibial edema or edema in areas of trauma. Graves disease most commonly is diagnosed 1 to 2 years prior to the development of pretibial myxedema; other extrathyroidal manifestations, most commonly ophthalmopathies, almost always are found in patients with pretibial myxedema. If a diagnosis of Graves disease has not been established, thyroid studies, including thyrotropin receptor antibody serum levels, should be obtained. Histopathology showing increased mucin in the dermis and increased fibroblasts can aid in diagnosis.2,3
The differential diagnosis includes inflammatory dermatoses, such as stasis dermatitis and lipodermatosclerosis. Stasis dermatitis is characterized by lichenified yellowbrown plaques that present on the lower extremities; lipodermatosclerosis then can develop and present as atrophic sclerotic plaques with a champagne bottle–like appearance. Necrobiosis lipoidica demonstrates atrophic, shiny, yellow plaques with telangiectases and ulcerations. Hypertrophic lichen planus presents with hyperkeratotic hyperpigmented plaques on the shins.1,2 Other diseases of cutaneous mucin deposition, namely scleromyxedema, demonstrate similar physical findings but more commonly are located on the trunk, face, and dorsal hands rather than the lower extremities.1-3
Treatment of pretibial myxedema is difficult; normalization of thyroid function, weight reduction, and compression stockings can help reduce edema. Medical therapies aim to decrease glycosaminoglycan production by fibroblasts. First-line treatment includes topical steroids under occlusion, and second-line therapies include intralesional steroids, systemic corticosteroids, pentoxifylline, and octreotide.2,3 Therapies for refractory disease include plasmapheresis, surgical excision, radiotherapy, and intravenous immunoglobulin; more recent studies also endorse the use of isotretinoin, intralesional hyaluronidase, and rituximab.2,4 Success also has been observed with the insulin growth factor 1 receptor inhibitor teprotumumab in active thyroid eye disease, in which insulin growth factor 1 receptor is overexpressed by fibroblasts. Given the similar pathogenesis of thyroid ophthalmopathy with other extrathyroidal manifestations, teprotumumab is a promising option for refractory cases of pretibial myxedema and has led to disease resolution in several patients.4
- Fatourechi V, Pajouhi M, Fransway AF. Dermopathy of Graves disease (pretibial myxedema). review of 150 cases. Medicine (Baltimore). 1994;73:1-7. doi:10.1097/00005792-199401000-00001
- Ai J, Leonhardt JM, Heymann WR. Autoimmune thyroid diseases: etiology, pathogenesis, and dermatologic manifestations. J Am Acad Dermatol. 2003;48:641-662. doi:10.1067/mjd.2003.257
- Schwartz KM, Fatourechi V, Ahmed DDF, et al. Dermopathy of Graves’ disease (pretibial myxedema): long-term outcome. J Clin Endocrinol Metab. 2002;87:438-446. doi:10.1210/jcem.87.2.8220
- Varma A, Rheeman C, Levitt J. Resolution of pretibial myxedema with teprotumumab in a patient with Graves disease. JAAD Case Reports. 2020;6:1281-1282. doi:10.1016/j.jdcr.2020.09.003
The Diagnosis: Pretibial Myxedema
Histopathology showed superficial and deep mucin deposition with proliferation of fibroblasts and thin wiry collagen bundles that were consistent with a diagnosis of pretibial myxedema. The patient was treated with clobetasol ointment 0.05% twice daily for 3 months, followed by a trial of pentoxifylline 400 mg 3 times daily for 3 months. After this treatment failed, she was started on rituximab infusions of 1 g biweekly for 1 month, followed by 500 mg at 6 months, with marked improvement after the first 2 doses of 1 g.
Pretibial myxedema is an uncommon cutaneous manifestation of autoimmune thyroid disease, occurring in 1% to 5% of patients with Graves disease. It usually occurs in older adult women on the pretibial regions and less commonly on the upper extremities, face, and areas of prior trauma.1-3 Although typically asymptomatic, it can be painful and ulcerate.3 The clinical presentation consists of bilateral nonpitting edema with overlying indurated skin as well as flesh-colored, yellow-brown, violaceous, or peau d’orange papules and plaques.2,3 Lesions develop over months and often have been associated with hyperhidrosis and hypertrichosis.2 Many variants have been identified including nodular, plaquelike, diffuse swelling (ie, nonpitting edema), tumor, mixture, polypoid, and elephantiasis; severe cases with acral involvement are termed thyroid acropachy.1-3 Pathogenesis likely involves the activation of thyrotropin receptors on fibroblasts by the circulating thyrotropin autoantibodies found in Graves disease. Activated fibroblasts upregulate glycosaminoglycan production, which osmotically drives the accumulation of dermal and subdermal fluid.1,3
This diagnosis should be considered in any patient with pretibial edema or edema in areas of trauma. Graves disease most commonly is diagnosed 1 to 2 years prior to the development of pretibial myxedema; other extrathyroidal manifestations, most commonly ophthalmopathies, almost always are found in patients with pretibial myxedema. If a diagnosis of Graves disease has not been established, thyroid studies, including thyrotropin receptor antibody serum levels, should be obtained. Histopathology showing increased mucin in the dermis and increased fibroblasts can aid in diagnosis.2,3
The differential diagnosis includes inflammatory dermatoses, such as stasis dermatitis and lipodermatosclerosis. Stasis dermatitis is characterized by lichenified yellowbrown plaques that present on the lower extremities; lipodermatosclerosis then can develop and present as atrophic sclerotic plaques with a champagne bottle–like appearance. Necrobiosis lipoidica demonstrates atrophic, shiny, yellow plaques with telangiectases and ulcerations. Hypertrophic lichen planus presents with hyperkeratotic hyperpigmented plaques on the shins.1,2 Other diseases of cutaneous mucin deposition, namely scleromyxedema, demonstrate similar physical findings but more commonly are located on the trunk, face, and dorsal hands rather than the lower extremities.1-3
Treatment of pretibial myxedema is difficult; normalization of thyroid function, weight reduction, and compression stockings can help reduce edema. Medical therapies aim to decrease glycosaminoglycan production by fibroblasts. First-line treatment includes topical steroids under occlusion, and second-line therapies include intralesional steroids, systemic corticosteroids, pentoxifylline, and octreotide.2,3 Therapies for refractory disease include plasmapheresis, surgical excision, radiotherapy, and intravenous immunoglobulin; more recent studies also endorse the use of isotretinoin, intralesional hyaluronidase, and rituximab.2,4 Success also has been observed with the insulin growth factor 1 receptor inhibitor teprotumumab in active thyroid eye disease, in which insulin growth factor 1 receptor is overexpressed by fibroblasts. Given the similar pathogenesis of thyroid ophthalmopathy with other extrathyroidal manifestations, teprotumumab is a promising option for refractory cases of pretibial myxedema and has led to disease resolution in several patients.4
- Fatourechi V, Pajouhi M, Fransway AF. Dermopathy of Graves disease (pretibial myxedema). review of 150 cases. Medicine (Baltimore). 1994;73:1-7. doi:10.1097/00005792-199401000-00001
- Ai J, Leonhardt JM, Heymann WR. Autoimmune thyroid diseases: etiology, pathogenesis, and dermatologic manifestations. J Am Acad Dermatol. 2003;48:641-662. doi:10.1067/mjd.2003.257
- Schwartz KM, Fatourechi V, Ahmed DDF, et al. Dermopathy of Graves’ disease (pretibial myxedema): long-term outcome. J Clin Endocrinol Metab. 2002;87:438-446. doi:10.1210/jcem.87.2.8220
- Varma A, Rheeman C, Levitt J. Resolution of pretibial myxedema with teprotumumab in a patient with Graves disease. JAAD Case Reports. 2020;6:1281-1282. doi:10.1016/j.jdcr.2020.09.003
A 70-year-old woman presented with pain and swelling in both legs of many years’ duration. She had no history of skin disease. Physical examination revealed shiny indurated plaques on the legs, ankles, and toes with limited range of motion in the ankles (top). Marked thickening of the hands and index fingers also was noted (bottom). A punch biopsy of the distal pretibial region was performed.


MCL: Pathophysiology and Epidemiology
Open Clinical Trials for Patients With Lymphoma, Leukemia, and Esophageal Cancer
Providing access to clinical trials for veteran and active-duty military patients can be a challenge, but many trials are now recruiting patients from those populations. Some trials explicitly recruit patients seeking care at the US Department of Veterans Affairs (VA), US Department of Defense (DoD) Military Health System, and Indian Health Service. The VA Office of Research and Development alone supported > 7260 research projects in 2022, and many more are sponsored by Walter Reed National Medical Center and other major defense and VA facilities. The clinical trials listed below are all open as of July 20, 2023; have at least 1 VA or DoD location recruiting patients; and are focused on treatments for lymphoma, leukemia, and esophageal cancer. For additional information and full inclusion/exclusion criteria, please consult clinicaltrials.gov.
Lymphoma
Study of a Triple Combination Therapy, DTRM-555, in Patients With R/R CLL or R/R Non-Hodgkin’s Lymphomas
Targeted drug therapies have greatly improved outcomes for patients with relapsed or refractory (R/R) chronic lymphocytic leukemia (CLL) and non-Hodgkin’s lymphoma. However, single drug therapies have limitations, therefore, the current study is evaluating a novel oral combination of targeted drugs as a way of overcoming these limitations. This study will determine the efficacy of the triple combination therapy, DTRM-555, in patients with R/R CLL or R/R non-Hodgkin’s lymphoma.
ID: NCT04305444
Sponsor: Zhejiang DTRM Biopharma
Locations: 8 locations, including Memphis VA Medical Center
Randomized Phase IIB Trial of Oral Azacytidine Plus Romidepsin Versus Investigator’s Choice in PTCL (PTCL)
Peripheral T-cell lymphoma (PTCL) is a rare and heterogeneous group of non-Hodgkin lymphoma (NHL) originating from mature (or post-thymic or ‘peripheral’) T-lymphocytes and NK cells. They are considered very aggressive and are often resistant to conventional chemotherapy.
This study employs a stratified randomization with equal allocation within strata of patients to receive oral 5-azacytidine (AZA) plus romidepsin (ROMI) versus prespecified investigator choice (ROMI, belinostat, pralatrexate or gemcitabine), for the treatment of relapsed or refractory (R/R) PTCL. The dose and schedule of AZA/ROMI has been determined from a phase I clinical trial of the combination. The primary objective of this study is to estimate the progression-free survival (PFS) among patients receiving the combination compared to single agent of choice.
ID: NCT04747236
Sponsor: Collaborator: University of Virginia; Celgene
Locations: 4 locations, including VA Long Beach Health Care System
Connect® Lymphoma Disease Registry: A US-Based Prospective Observational Cohort Study
This Disease Registry is designed to capture the patient characteristics, practice patterns, and therapeutic strategies evaluated in community and academic centers when treating relapsed/refractory (R/R) diffuse large B-cell lymphoma (DLBCL), and R/R follicular lymphoma (FL). The data collected in this Registry will facilitate the evaluation of the current treatment landscape for non-Hodgkin lymphoma (NHL), including the clinical effectiveness, safety. No investigational product or drug will be administered as part of this study. Enrolled patients will receive treatment and evaluations for their disease according to the standard of care and routine clinical practice at each study site. All treatments that patients receive for their disease will be recorded, including any previous lymphoma treatments. Clinical outcomes will be documented as part of an objective clinical assessment. In addition, patient-reported health-related quality of life (HRQoL) outcomes data will be collected from patients using various validated instruments. Social support data will also be collected.
ID: NCT04982471
Sponsor: Celgene
Locations: 60 locations, including VA Central California Health Care System, Harry S. Truman Memorial Veterans’ Hospital, and Brooke Army Medical Center
Obinutuzumab With or Without Umbralisib,Lenalidomide, or Combination Chemotherapy in Treating Patients With Relapsed or Refractory Grade I-IIIa Follicular Lymphoma
This phase II trial studies how well obinutuzumab with or without umbralisib, lenalidomide, or combination chemotherapy work in treating patients with grade I-IIIa follicular lymphoma that has come back (relapsed) or does not respond to treatment (refractory). Immunotherapy with obinutuzumab, may induce changes in the body’s immune system and may interfere with the ability of tumor cells to grow and spread. Umbralisib may stop the growth of cancer cells by blocking some of the enzymes needed for cell growth. Biological therapies, such as lenalidomide, use substances made from living organisms that may stimulate or suppress the immune system in different ways and stop cancer cells from growing. Chemotherapy drugs, such as cyclophosphamide, doxorubicin, vincristine, prednisone, and bendamustine, work in different ways to stop the growth of cancer cells, either by killing the cells, by stopping them from dividing, or by stopping them from spreading. It is not yet known whether giving obinutuzumab with or without umbralisib, lenalidomide, or combination chemotherapy will work better in treating patients with grade I-IIIa follicular lymphoma.
ID: NCT03269669
Sponsor: National Cancer Institute (NCI)
Locations: 427 locations, including VA Palo Alto Health Care System
Brentuximab Vedotin and Nivolumab With or Without Ipilimumab in Treating Patients With Relapsed or Refractory Hodgkin Lymphoma
This phase I/II trial studies the side effects and best dose of ipilimumab and nivolumab when given together with brentuximab vedotin, and how well they work in treating patients with Hodgkin lymphoma that has returned after a period of improvement (recurrent) or has not responded to previous treatment (refractory). Immunotherapy with monoclonal antibodies, such as ipilimumab and nivolumab, may help the body’s immune system attack the cancer and may interfere with the ability of cancer cells to grow and spread. Brentuximab vedotin is a monoclonal antibody, brentuximab, linked to a toxic agent called vedotin. Brentuximab attaches to CD30-positive cancer cells in a targeted way and delivers vedotin to kill them. It is not known whether giving brentuximab vedotin and nivolumab with or without ipilimumab may kill more cancer cells.
ID: NCT01896999
Sponsor: National Cancer Institute (NCI)
Locations: 486 locations, including Walter Reed National Military Medical Center
Leukemia
Testing Early Treatment for Patients With High-Risk Chronic Lymphocytic Leukemia (CLL) or Small Lymphocytic Leukemia (SLL), EVOLVE CLL/SLL Study
This phase III trial compares early treatment with venetoclax and obinutuzumab versus delayed treatment with venetoclax and obinutuzumab in patients with newly diagnosed high-risk chronic lymphocytic leukemia or small lymphocytic lymphoma. Venetoclax is in a class of medications called B-cell lymphoma-2 (BCL-2) inhibitors. It may stop the growth of cancer cells by blocking BCL-2, a protein needed for cancer cell survival. Immunotherapy with monoclonal antibodies, such as obinutuzumab, may help the body’s immune system attack the cancer, and may interfere with the ability of tumor cells to grow and spread. Starting treatment with the venetoclax and obinutuzumab early (before patients have symptoms) may have better outcomes for patients with chronic lymphocytic leukemia or small lymphocytic lymphoma compared to starting treatment with the venetoclax and obinutuzumab after patients show symptoms.
ID: NCT04269902
Sponsor: National Cancer Institute (NCI)
Locations: 545 locations, Tibor Rubin VA Medical Center, Minneapolis VA Medical Center, and Durham VA Medical Center
Testing the Use of Steroids and TyrosineKinase Inhibitors With Blinatumomab or Chemotherapy for Newly Diagnosed BCR-ABL-Positive Acute Lymphoblastic Leukemia in Adults
This phase III trial compares the effect of usual treatment of chemotherapy and steroids and a tyrosine kinase inhibitor (TKI) to the same treatment plus blinatumomab. Blinatumomab is a Bi-specific T-cell Engager (‘BiTE’) that may interfere with the ability of cancer cells to grow and spread. The information gained from this study may help researchers determine if combination therapy with steroids, TKIs, and blinatumomab work better than the standard of care.
ID: NCT04530565
Sponsor: National Cancer Institute (NCI)
Locations: 180 locations, including Walter Reed National Military Medical Center
Asciminib Monotherapy, With Dose Escalation, for 2nd and 1st Line Chronic Myelogenous Leukemia (ASC2ESCALATE)
This will be a multicenter Phase II open-label study of asciminib in CML-CP patients who have been previously treated with one prior ATP-binding site TKI with discontinuation due to treatment failure, warning or intolerance. (2L patient cohort). In addition, newly diagnosed CML-CP patients who may have received up to 4 weeks of prior TKI are included in a separate 1L patient cohort.
ID: NCT05384587
Sponsor: Novartis
Locations: 26 locations, including VA Puget Sound Health Care System
Connect® Myeloid Disease Registry
This Disease Registry will collect data on patient characteristics, treatment patterns and clinical outcomes. The objective is to describe how patients with myeloid diseases are treated; and to build a knowledge base regarding the effectiveness and safety of first-line and subsequent treatment regimens in both community and academic settings. Enrolled patients will receive treatment and evaluations for their disease according to the standard of care and routine clinical practice at each study site. All treatments that patients receive for their disease will be recorded, including initial treatment and any subsequent therapy. Data on treatment outcomes, including response rates as measured by the treating physician, evidence of progression, survival, and patient-reported outcomes will be collected quarterly on the electronic CRF.
ID: NCT01688011
Sponsor: Celgene
Locations: 240 locations, including VA Central California Health Care System, John D. Dingell VA Medical Center, Manchester VA Medical Center, Dallas VA Medical Center, White River Junction VA Medical Center, and VA Caribbean Healthcare System
Esophageal Cancer
Non-endoscopic Esophageal Sampling to Detect Barrett’s Esophagus and Esophageal Cancer in Veterans
This study seeks to incorporate non-endoscopic detection method (Esocheck/Esoguard) in primary care practice and test whether this screening modality increases the positive predictive value of upper endoscopy and increases the detection of Barrett’s esophagus and esophageal cancer.
Currently, BE is diagnosed only when patients undergo endoscopy with esophagogastroduodenoscopy (EGD). However, due to the high cost of EGD and the lack of a randomized controlled trials supporting its efficacy, endoscopy to screen for BE is not routinely recommended. Current guidelines do recommend sedated EGD in patients with multiple BE risk factors, refractory GERD, or alarm symptoms. This strategy fails to detect BE in patients whose symptoms are well controlled with either over the counter medications or physician prescribed therapies. It also fails to detect BE in asymptomatic subjects who comprise 40% of those that develop EAC. Thus, < 10% of EACs are diagnosed as early stage lesions caught by surveillance of patients with previously detected BE. Ablative nonsurgical therapies that have been developed for preventing cancer in patients with BE with high-grade dysplasia over the past decade will have little impact and the 5-year survival for EACs will remain a dismal 18% unless more effective programs for identifying BE and early EAC are developed.
Esocheck/Esoguard is a FDA approved device designed to sample the distal esophagus and analyze the collected material for presence of two methylated DNA markers. The Specific Aims of this study are:
To determine sensitivity, specificity, positive and negative predictive value of Esocheck/Esoguard performed in routine practice for detecting BE in an at risk Veteran population
To compare the yield of detected BE using EGD alone vs. stepwise molecular diagnostics(Esocheck/Esoguard) and endoscopic screening strategy (EGD) in at risk Veteran population.
ID: NCT05210049
Sponsor: Cleveland VA Medical Research and Education Foundation
Location: Louis Stokes Cleveland VA Medical Center
Progression of Gastroesophageal Reflux Disease and Barrett’s Esophagus and the Creation of a Barrett’s Registry
The purpose of this study is to determine or evaluate the risk factors such as smoking, family history etc. that cause esophageal cancer and to determine the genetic changes that lead to esophageal cancer. The investigators hypothesis is that systematic collection of data on the natural history of GERD and BE patients and risk factors for development of BE in patients with chronic GERD and progression of BE to dysplasia and adenocarcinoma will provide useful information to develop a decision model for risk stratification and risk reduction strategies in these patients.
ID: NCT00574327
Sponsor: Midwest Biomedical Research Foundation
Location: Kansas City VA Medical Center
The Use of Magnets, Magnetic Fields, and Copper Devices in a Veteran Population
Complementary and alternative medicine (CAM) is a therapeutic approach to health care used in association with or in place of standard medical therapeutic approaches. When describing CAM, the terms complementary and alternative are often used interchangeably, but the terms refer to different concepts. A nonmainstream approach used together with conventional medicine is considered complementary, whereas an approach used in place of conventional medicine is considered alternative. Most people who use nonmainstream approaches also use conventional health care.1
Integrative medicine represents therapeutic interventions that bring conventional and complementary approaches together in a coordinated way. Integrative health also emphasizes multimodal interventions, which are ≥ 2 interventions such as conventional (eg, medication, physical rehabilitation, psychotherapy) and complementary health approaches (eg, acupuncture, yoga, and probiotics) in various combinations, with an emphasis on treating the whole person rather than 1 organ system. Integrative health aims for well-coordinated care among different practitioners and institutions.1
Functional medicine requires an individualized assessment and therapeutic plan for each patient, including optimizing the function of each organ system. It uses research to understand a patient’s unique needs and formulates a plan that often uses diet, exercise, and stress reduction methods. Functional medicine may use combinations of naturopathic, osteopathic, and chiropractic medicine, among other therapies. Functional medicine has been called a systems biology model, and patients and practitioners work together to achieve the highest expression of health by addressing the underlying causes of disease.2,3
According to a 2012 national survey, more than 30% of adults and about 12% of children use health care approaches that are not part of conventional medical care or that may have unconventional origins. A National Center for Health Statistics study found that the most common complementary medical interventions from 2002 to 2012 included natural products, deep breathing, yoga and other movement programs, and chiropractic, among others. Magnets, magnetic fields, and copper devices (MMFC), which are the focus of this study, were not among the top listed interventions.4 Recent data showed that individuals in the United States are high users of CAM, including many patients who have neoplastic disease.5,6
MMFCs are a part of CAM and are reported to be a billion-dollar industry worldwide, although it is not well studied.7,8 In our study, magnet refers to the use of a magnet in contact with the body, magnetic field refers to exposure to a magnetic field administered without direct contact with the body, and copper devices refer to devices that are in contact with the body, such as bracelets, necklaces, wraps, and joint braces. These devices are often constructed using copper mesh, or weaved copper wires. Advertising has helped to increase interest in the use of these devices for musculoskeletal pain and restricted joint movement therapies. However, it is less clear whether MMFCs are being used to provide therapy for other medical conditions, such as neoplastic disease.
It is unclear how widespread MMFC use is or how it is accessed. A 2016 study of veterans and CAM use did not specifically address MMFCs.9 A Japanese study of the use of CAM provided or prescribed by a physician found that just 12 of 1575 respondents (0.7%) described using magnetic therapy.10 A Korean internet study that assessed the use of CAM found that of 1668 respondents who received CAM therapy by practice or advice of a physician, 1.2% used magnet therapy.11,12 An online study of CAM use in patients with multiple sclerosis found that 9 of 1286 respondents (0.7%) had used magnetic field therapy in the previous 3 months.13
In this study, we aimed to assess MMFC use and perspectives in a veteran population at the Carl T. Hayden Veterans Affairs Medical Center (CTHVAMC) in Phoenix, Arizona.
METHODS
We created a brief questionnaire regarding MMFC use and perspectives and distributed it to veteran patients at the infusion center at the CTHVAMC. The study was approved by the CTHVAMC department of research, and the institutional review board determined that informed consent was not required. The questionnaire did not collect any specific personal identifying data but included the participant’s sex, age, and diagnosis. Although there are standardized questionnaires concerning the use of CAM, we designed a new survey for MMFCs. The participants in the study were consecutive patients referred to the CTHVAMC infusion center for IV or other nonoral therapies. Referrals came from endocrinology, gastroenterology, hematology/oncology, neurology, rheumatology, and other specialties (eg, allergy/immunology).
The questionnaire was 1 page (front and back) and was completed anonymously without involvement by the study investigators or infusion center staff. Dated and consecutively numbered questionnaires were given to patients receiving therapy regardless of their diagnosis. Ages were categorized into groups: 18 to 30 years; 31 to 50 years; 51 to 65 years; and ≥ 66 years. Diagnoses were categorized by specialty: endocrinology, gastroenterology, hematology/oncology, neurology, rheumatology, and other. We noted in a previous similar study that the exact diagnosis was often left blank, but the specialty was more often completed.9 Since some patients required multiple visits to the infusion center, respondents were asked whether they had previously answered the questionnaire; there were no duplications.
The population we studied was under stress while receiving therapy for underlying illnesses. To improve the response rate and accuracy of the responses, we limited the number of survey questions. Since many of the respondents in the infusion center for therapy received medications that could alter their ability to respond, all questionnaires were administered prior to therapeutic intervention. In addition to the background data, respondents were asked: Do you apply magnets to your body, use magnetic field therapy, or copper devices? If you use any of these therapies, is it for pain, your diagnosis, or other? Would you consider participating in a clinical trial using magnets applied to the body or magnetic therapy?
RESULTS
We collected 210 surveys. Four surveys were missing data and were excluded. The majority of respondents (n = 133, 64%) were in the hematology/oncology diagnostic group and 121 (59%) were aged ≥ 66 years (Table 1).
Respondents were asked whether they were using MMFC therapies. The results from all age groups showed an 18% overall use and in the diagnosis groups an overall use of 23%. Eighteen respondents (35%) aged 51 to 65 years reported using MMFC, followed by 6 respondents (21%) aged 31 to 50 years. Patients with an endocrinology diagnosis had the highest rate of MMFC use (6 of 11 patients; 55%) but more patients (33 of 133 [25%]) with a hematology/oncology diagnosis used MMFCs.
Copper was the most widely used MMFC therapy among individuals who used a single MMFC therapy. Twenty respondents reported copper use, 6 used magnets, and no respondents used magnetic field therapy (Table 2).
Although we were interested in understanding veterans’ use of these therapies, we were also interested in whether the respondent group would see MMFC as a potential therapy. The highest level of interest in participation in magnet clinical trials was reported by patients aged 31 to 50 years (64%) age group, followed by those aged 51 to 65 (62%). All of the respondents in hematology/oncology, rheumatology, neurology, endocrinology, and gastroenterology groups indicated that they would consider participating in clinical studies using magnets.
DISCUSSION
We surveyed a population of veterans at the CTHVAMC infusion center who were receiving antineoplastic chemotherapy, biologic therapy, immunomodulatory therapy, transfusion, and other therapies to evaluate their use of MMFC. We chose this group to sample because of how accessible this group was and the belief that there would be an adequate survey response. We hypothesized that by asking about a specific group of CAM therapies and not, as in many surveys, multiple CAM therapies, there would be an improved response rate. We expected that very few respondents would indicate MMFC use because in a similar study conducted in 2003 to 2004 at CTHVAMC, none of the 380 survey respondents (all with a hematology/oncology diagnosis) indicated magnet or magnetic field use (JR Salvatore, unpublished data). Although copper devices were available at that time, they were not included in that study. The current survey added copper devices and showed a greater use of MMFC, including copper devices. We identified veterans who used either 1 MMFC or multiple therapies. In both groups, copper devices were the most common. This may be due to the ubiquity and availability of copper devices. These devices are highly visible and promoted by professional athletes and other well-known personalities.
Our findings showed 2 unexpected results. First, there was greater than expected use of magnets and copper devices. Second, an even less expected result that there was considerable interest in participating in clinical research that used magnets or magnetic fields.
Respondents indicated a high interest in participating in clinical trials using magnets or magnetic fields regardless of their history of MMFC use. We did not ask about a trial using copper devices because there is less scientific/medical research to justify studying those devices as opposed to data that support the use of magnets or magnetic fields. The data presented in this study suggest interest in participating in clinical trials using magnets or magnetic field therapy. One clinical trial combined static magnets as an adjuvant to antineoplastic chemotherapy.14 We believe this is the first publication to specifically quantify both MMFC use in a veteran (or any) population, and to identify the desire to participate in clinical studies that would utilize magnets or magnetic fields, whether or not they currently use magnets or magnetic fields. Based on current knowledge, it is not clear whether use of MMFC by patients represents a risk or a benefit to the population studied, and seeking that information is part of the continuation of our work. We also believe that the data in this study will help practitioners to consider asking patients specifically whether they are using these therapies, and if so why and with what result. We are extending our work to a more generalized patient population.
The use of copper devices relates to beliefs (dating to the mid-1800s) that there was a relationship between copper deficiency and rheumatologic disorders. Copper devices are used as therapies because of the belief that small amounts of copper are absorbed through the skin, decreasing inflammation, particularly around joint spaces.15 Recent data suggest a mechanism for copper-induced cell death.16 Although this recent research suggests a mechanism for how copper might induce cell death, it is unclear how this would be applied to establishing a mechanism for the health effects of wearing copper devices. Since copper devices are thought to decrease inflammation, they may have a theoretical function by decreasing the number of inflammatory cells in an affected space.
CAM magnetics are typically of lower strength. The field generated by magnets is measured and reported in Tesla. Magnetic resonance imaging typically generates from 1.5 to 3 Tesla. A refrigerator magnet is about 1 milliTesla.17 In a study conducted at the CTHVAMC, the strength of the magnets used was measured at distances from the magnet. For example, at 2 cm from the magnet, the measured strength was 18 milliTesla.14 Many MMFC devices approved by the US Food and Drug Administration are pulsed electromagnetic fields (PEMF) devices for healing of nonunion fractures (approved in 1979); cervical and lumbar fusion therapies (approved in 2004); and therapy for anxiety and depression (approved in 2006).18
Limitations
Patients with endocrinology diagnoses were the most likely to use MMFCs but were a very small percentage of the infusion center population, which could skew the data. The surveyed individuals may not have been representative of the overall patient population. Similarly, the patient population at CTHVAMC, which is primarily male and aged ≥ 66 years, may not be representative of other veteran and nonveteran patient populations.
Conclusions
MMFC devices are being used regularly by patients as a form of CAM therapy, but few studies researching the use of CAM therapy have generated data that are as specific as this study is about the use of these MMFC devices. Although there is considerable general public awareness of MMFC therapies and devices, we believe that there is a need to quantify the use of these devices. We further believe that our study is one of the first to look specifically at the use of MMFCs in a veteran population. We have found a considerable use of MMFCs in the veteran population studied, and we also showed that whether or not veterans are using these devices, they are willing to be part of research that uses the devices. Further studies would look at a more general veteran population, look more in depth at the way and for what purpose these devices are being used, and consider the development of clinical research studies that use MMFCs.
1. National Institute of Health. National Center for Complementary and Integrative Health. Updated April 2021. Accessed June 26, 2023. https://www.nccih.nih.gov/health/complementary-alternative-or-integrative-health-whats-in-a-name
2. Hanaway P. Form follows function: a functional medicine overview. Perm J. 2016;20(4):16-109. doi:10.7812/TPP/16-109
3. Bland JS. Functional medicine past, present, and future. Integr Med (Encinitas). 2022;21(2):22-26.
4. Clarke TC, Black LI, Stussman BJ, Barnes PM, Nahin RL. Trends in the use of complementary health approaches among adults: United States, 2002-2012. Natl Health Stat Report. 2015;(79):1-16.
5. Horneber M, Bueschel G, Dennert G, Less D, Ritter E, Zwahlen M. How many cancer patients use complementary and alternative medicine: a systematic review and metaanalysis. Integr Cancer Ther. 2012;11(3):187-203. doi:10.1177/1534735411423920
6. Buckner CA, Lafrenie RM, Dénommée JA, Caswell JM, Want DA. Complementary and alternative medicine use in patients before and after a cancer diagnosis. Curr Oncol. 2018;25(4):e275-e281. doi:10.3747/co.25.3884
7. Weintraub MI. Magnetic bio-stimulation in painful diabetic peripheral neuropathy: a novel intervention–a randomized, double-placebo crossover study. Am J Pain Manage. 1999; 9(1):8-17.
8. Colbert AP, Wahbeh H, Harling N, et al. Static magnetic field therapy: a critical review of treatment parameters. Evid Based Complement Alternat Med. 2009;6(2):133-139. doi:10.1093/ecam/nem131
9. Held RF, Santos S, Marki M, Helmer D. Veteran perceptions, interest, and use of complementary and alternative medicine. Fed Pract. 2016;33(9):41-47.
10. Motoo Y, Yukawa K, Arai I, Hisamura K, Tsutani K. Use of complementary and alternative medicine in Japan: a cross-sectional internet survey using the Japanese version of the International Complementary and Alternative Medicine Questionnaire. JMAJ. 2019;2(1):35-46. doi:10.31662/jmaj.2018-0044
11. Quandt SA, Verhoef MJ, Arcury TA, et al. Development of an international questionnaire to measure use of complementary and alternative medicine (I-CAM-Q). J Altern Complement Med. 2009;15(4):331-339. doi:10.1089/acm.2008.0521
12. Lee JA, Sasaki Y, Arai I, et al. An assessment of the use of complementary and alternative medicine by Korean people using an adapted version of the standardized international questionnaire (I-CAM-QK): a cross-sectional study of an internet survey. BMC Complement Altern Med. 2018;18(1):238. Published 2018 Aug 13. doi:10.1186/s12906-018-2294-6
13. Campbell E, Coulter E, Mattison P, McFadyen A, Miller L, Paul L. Access, delivery and perceived efficacy of physiotherapy and use of complementary and alternative therapies by people with progressive multiple sclerosis in the United Kingdom: An online survey. Mult Scler Relat Disord. 2017;12:64-69. doi:10.1016/j.msard.2017.01.002
14. Salvatore JR, Harrington J, Kummet T. Phase I clinical study of a static magnetic field combined with anti-neoplastic chemotherapy in the treatment of human malignancy: initial safety and toxicity data. Bioelectromagnetics. 2003;24(7):524-527. doi:10.1002/bem.10149
15. Richmond SJ, Gunadasa S, Bland M, Macpherson H. Copper bracelets and magnetic wrist straps for rheumatoid arthritis--analgesic and anti-inflammatory effects: a randomised double-blind placebo controlled crossover trial. PLoS One. 2013;8(9):e71529. Published 2013 Sep 16. doi:10.1371/journal.pone.0071529
16. Tsvetkov P, Coy S, Petrova B, et al. Copper induces cell death by targeting lipoylated TCA cycle proteins. Science. 2022;375(6586):1254-1261. doi:10.1126/science.abf0529
17. Simon NJ. Biological Effects of Static Magnetic Fields: A Review. International Cryogenic Materials Commission; 1992:179.
18. Waldorff EI, Zhang N, Ryaby JT. Pulsed electromagnetic field applications: a corporate perspective. J Orthop Translat. 2017;9:60-68. Published 2017 Mar 31. doi:10.1016/j.jot.2017.02.006
Complementary and alternative medicine (CAM) is a therapeutic approach to health care used in association with or in place of standard medical therapeutic approaches. When describing CAM, the terms complementary and alternative are often used interchangeably, but the terms refer to different concepts. A nonmainstream approach used together with conventional medicine is considered complementary, whereas an approach used in place of conventional medicine is considered alternative. Most people who use nonmainstream approaches also use conventional health care.1
Integrative medicine represents therapeutic interventions that bring conventional and complementary approaches together in a coordinated way. Integrative health also emphasizes multimodal interventions, which are ≥ 2 interventions such as conventional (eg, medication, physical rehabilitation, psychotherapy) and complementary health approaches (eg, acupuncture, yoga, and probiotics) in various combinations, with an emphasis on treating the whole person rather than 1 organ system. Integrative health aims for well-coordinated care among different practitioners and institutions.1
Functional medicine requires an individualized assessment and therapeutic plan for each patient, including optimizing the function of each organ system. It uses research to understand a patient’s unique needs and formulates a plan that often uses diet, exercise, and stress reduction methods. Functional medicine may use combinations of naturopathic, osteopathic, and chiropractic medicine, among other therapies. Functional medicine has been called a systems biology model, and patients and practitioners work together to achieve the highest expression of health by addressing the underlying causes of disease.2,3
According to a 2012 national survey, more than 30% of adults and about 12% of children use health care approaches that are not part of conventional medical care or that may have unconventional origins. A National Center for Health Statistics study found that the most common complementary medical interventions from 2002 to 2012 included natural products, deep breathing, yoga and other movement programs, and chiropractic, among others. Magnets, magnetic fields, and copper devices (MMFC), which are the focus of this study, were not among the top listed interventions.4 Recent data showed that individuals in the United States are high users of CAM, including many patients who have neoplastic disease.5,6
MMFCs are a part of CAM and are reported to be a billion-dollar industry worldwide, although it is not well studied.7,8 In our study, magnet refers to the use of a magnet in contact with the body, magnetic field refers to exposure to a magnetic field administered without direct contact with the body, and copper devices refer to devices that are in contact with the body, such as bracelets, necklaces, wraps, and joint braces. These devices are often constructed using copper mesh, or weaved copper wires. Advertising has helped to increase interest in the use of these devices for musculoskeletal pain and restricted joint movement therapies. However, it is less clear whether MMFCs are being used to provide therapy for other medical conditions, such as neoplastic disease.
It is unclear how widespread MMFC use is or how it is accessed. A 2016 study of veterans and CAM use did not specifically address MMFCs.9 A Japanese study of the use of CAM provided or prescribed by a physician found that just 12 of 1575 respondents (0.7%) described using magnetic therapy.10 A Korean internet study that assessed the use of CAM found that of 1668 respondents who received CAM therapy by practice or advice of a physician, 1.2% used magnet therapy.11,12 An online study of CAM use in patients with multiple sclerosis found that 9 of 1286 respondents (0.7%) had used magnetic field therapy in the previous 3 months.13
In this study, we aimed to assess MMFC use and perspectives in a veteran population at the Carl T. Hayden Veterans Affairs Medical Center (CTHVAMC) in Phoenix, Arizona.
METHODS
We created a brief questionnaire regarding MMFC use and perspectives and distributed it to veteran patients at the infusion center at the CTHVAMC. The study was approved by the CTHVAMC department of research, and the institutional review board determined that informed consent was not required. The questionnaire did not collect any specific personal identifying data but included the participant’s sex, age, and diagnosis. Although there are standardized questionnaires concerning the use of CAM, we designed a new survey for MMFCs. The participants in the study were consecutive patients referred to the CTHVAMC infusion center for IV or other nonoral therapies. Referrals came from endocrinology, gastroenterology, hematology/oncology, neurology, rheumatology, and other specialties (eg, allergy/immunology).
The questionnaire was 1 page (front and back) and was completed anonymously without involvement by the study investigators or infusion center staff. Dated and consecutively numbered questionnaires were given to patients receiving therapy regardless of their diagnosis. Ages were categorized into groups: 18 to 30 years; 31 to 50 years; 51 to 65 years; and ≥ 66 years. Diagnoses were categorized by specialty: endocrinology, gastroenterology, hematology/oncology, neurology, rheumatology, and other. We noted in a previous similar study that the exact diagnosis was often left blank, but the specialty was more often completed.9 Since some patients required multiple visits to the infusion center, respondents were asked whether they had previously answered the questionnaire; there were no duplications.
The population we studied was under stress while receiving therapy for underlying illnesses. To improve the response rate and accuracy of the responses, we limited the number of survey questions. Since many of the respondents in the infusion center for therapy received medications that could alter their ability to respond, all questionnaires were administered prior to therapeutic intervention. In addition to the background data, respondents were asked: Do you apply magnets to your body, use magnetic field therapy, or copper devices? If you use any of these therapies, is it for pain, your diagnosis, or other? Would you consider participating in a clinical trial using magnets applied to the body or magnetic therapy?
RESULTS
We collected 210 surveys. Four surveys were missing data and were excluded. The majority of respondents (n = 133, 64%) were in the hematology/oncology diagnostic group and 121 (59%) were aged ≥ 66 years (Table 1).
Respondents were asked whether they were using MMFC therapies. The results from all age groups showed an 18% overall use and in the diagnosis groups an overall use of 23%. Eighteen respondents (35%) aged 51 to 65 years reported using MMFC, followed by 6 respondents (21%) aged 31 to 50 years. Patients with an endocrinology diagnosis had the highest rate of MMFC use (6 of 11 patients; 55%) but more patients (33 of 133 [25%]) with a hematology/oncology diagnosis used MMFCs.
Copper was the most widely used MMFC therapy among individuals who used a single MMFC therapy. Twenty respondents reported copper use, 6 used magnets, and no respondents used magnetic field therapy (Table 2).
Although we were interested in understanding veterans’ use of these therapies, we were also interested in whether the respondent group would see MMFC as a potential therapy. The highest level of interest in participation in magnet clinical trials was reported by patients aged 31 to 50 years (64%) age group, followed by those aged 51 to 65 (62%). All of the respondents in hematology/oncology, rheumatology, neurology, endocrinology, and gastroenterology groups indicated that they would consider participating in clinical studies using magnets.
DISCUSSION
We surveyed a population of veterans at the CTHVAMC infusion center who were receiving antineoplastic chemotherapy, biologic therapy, immunomodulatory therapy, transfusion, and other therapies to evaluate their use of MMFC. We chose this group to sample because of how accessible this group was and the belief that there would be an adequate survey response. We hypothesized that by asking about a specific group of CAM therapies and not, as in many surveys, multiple CAM therapies, there would be an improved response rate. We expected that very few respondents would indicate MMFC use because in a similar study conducted in 2003 to 2004 at CTHVAMC, none of the 380 survey respondents (all with a hematology/oncology diagnosis) indicated magnet or magnetic field use (JR Salvatore, unpublished data). Although copper devices were available at that time, they were not included in that study. The current survey added copper devices and showed a greater use of MMFC, including copper devices. We identified veterans who used either 1 MMFC or multiple therapies. In both groups, copper devices were the most common. This may be due to the ubiquity and availability of copper devices. These devices are highly visible and promoted by professional athletes and other well-known personalities.
Our findings showed 2 unexpected results. First, there was greater than expected use of magnets and copper devices. Second, an even less expected result that there was considerable interest in participating in clinical research that used magnets or magnetic fields.
Respondents indicated a high interest in participating in clinical trials using magnets or magnetic fields regardless of their history of MMFC use. We did not ask about a trial using copper devices because there is less scientific/medical research to justify studying those devices as opposed to data that support the use of magnets or magnetic fields. The data presented in this study suggest interest in participating in clinical trials using magnets or magnetic field therapy. One clinical trial combined static magnets as an adjuvant to antineoplastic chemotherapy.14 We believe this is the first publication to specifically quantify both MMFC use in a veteran (or any) population, and to identify the desire to participate in clinical studies that would utilize magnets or magnetic fields, whether or not they currently use magnets or magnetic fields. Based on current knowledge, it is not clear whether use of MMFC by patients represents a risk or a benefit to the population studied, and seeking that information is part of the continuation of our work. We also believe that the data in this study will help practitioners to consider asking patients specifically whether they are using these therapies, and if so why and with what result. We are extending our work to a more generalized patient population.
The use of copper devices relates to beliefs (dating to the mid-1800s) that there was a relationship between copper deficiency and rheumatologic disorders. Copper devices are used as therapies because of the belief that small amounts of copper are absorbed through the skin, decreasing inflammation, particularly around joint spaces.15 Recent data suggest a mechanism for copper-induced cell death.16 Although this recent research suggests a mechanism for how copper might induce cell death, it is unclear how this would be applied to establishing a mechanism for the health effects of wearing copper devices. Since copper devices are thought to decrease inflammation, they may have a theoretical function by decreasing the number of inflammatory cells in an affected space.
CAM magnetics are typically of lower strength. The field generated by magnets is measured and reported in Tesla. Magnetic resonance imaging typically generates from 1.5 to 3 Tesla. A refrigerator magnet is about 1 milliTesla.17 In a study conducted at the CTHVAMC, the strength of the magnets used was measured at distances from the magnet. For example, at 2 cm from the magnet, the measured strength was 18 milliTesla.14 Many MMFC devices approved by the US Food and Drug Administration are pulsed electromagnetic fields (PEMF) devices for healing of nonunion fractures (approved in 1979); cervical and lumbar fusion therapies (approved in 2004); and therapy for anxiety and depression (approved in 2006).18
Limitations
Patients with endocrinology diagnoses were the most likely to use MMFCs but were a very small percentage of the infusion center population, which could skew the data. The surveyed individuals may not have been representative of the overall patient population. Similarly, the patient population at CTHVAMC, which is primarily male and aged ≥ 66 years, may not be representative of other veteran and nonveteran patient populations.
Conclusions
MMFC devices are being used regularly by patients as a form of CAM therapy, but few studies researching the use of CAM therapy have generated data that are as specific as this study is about the use of these MMFC devices. Although there is considerable general public awareness of MMFC therapies and devices, we believe that there is a need to quantify the use of these devices. We further believe that our study is one of the first to look specifically at the use of MMFCs in a veteran population. We have found a considerable use of MMFCs in the veteran population studied, and we also showed that whether or not veterans are using these devices, they are willing to be part of research that uses the devices. Further studies would look at a more general veteran population, look more in depth at the way and for what purpose these devices are being used, and consider the development of clinical research studies that use MMFCs.
1. National Institute of Health. National Center for Complementary and Integrative Health. Updated April 2021. Accessed June 26, 2023. https://www.nccih.nih.gov/health/complementary-alternative-or-integrative-health-whats-in-a-name
2. Hanaway P. Form follows function: a functional medicine overview. Perm J. 2016;20(4):16-109. doi:10.7812/TPP/16-109
3. Bland JS. Functional medicine past, present, and future. Integr Med (Encinitas). 2022;21(2):22-26.
4. Clarke TC, Black LI, Stussman BJ, Barnes PM, Nahin RL. Trends in the use of complementary health approaches among adults: United States, 2002-2012. Natl Health Stat Report. 2015;(79):1-16.
5. Horneber M, Bueschel G, Dennert G, Less D, Ritter E, Zwahlen M. How many cancer patients use complementary and alternative medicine: a systematic review and metaanalysis. Integr Cancer Ther. 2012;11(3):187-203. doi:10.1177/1534735411423920
6. Buckner CA, Lafrenie RM, Dénommée JA, Caswell JM, Want DA. Complementary and alternative medicine use in patients before and after a cancer diagnosis. Curr Oncol. 2018;25(4):e275-e281. doi:10.3747/co.25.3884
7. Weintraub MI. Magnetic bio-stimulation in painful diabetic peripheral neuropathy: a novel intervention–a randomized, double-placebo crossover study. Am J Pain Manage. 1999; 9(1):8-17.
8. Colbert AP, Wahbeh H, Harling N, et al. Static magnetic field therapy: a critical review of treatment parameters. Evid Based Complement Alternat Med. 2009;6(2):133-139. doi:10.1093/ecam/nem131
9. Held RF, Santos S, Marki M, Helmer D. Veteran perceptions, interest, and use of complementary and alternative medicine. Fed Pract. 2016;33(9):41-47.
10. Motoo Y, Yukawa K, Arai I, Hisamura K, Tsutani K. Use of complementary and alternative medicine in Japan: a cross-sectional internet survey using the Japanese version of the International Complementary and Alternative Medicine Questionnaire. JMAJ. 2019;2(1):35-46. doi:10.31662/jmaj.2018-0044
11. Quandt SA, Verhoef MJ, Arcury TA, et al. Development of an international questionnaire to measure use of complementary and alternative medicine (I-CAM-Q). J Altern Complement Med. 2009;15(4):331-339. doi:10.1089/acm.2008.0521
12. Lee JA, Sasaki Y, Arai I, et al. An assessment of the use of complementary and alternative medicine by Korean people using an adapted version of the standardized international questionnaire (I-CAM-QK): a cross-sectional study of an internet survey. BMC Complement Altern Med. 2018;18(1):238. Published 2018 Aug 13. doi:10.1186/s12906-018-2294-6
13. Campbell E, Coulter E, Mattison P, McFadyen A, Miller L, Paul L. Access, delivery and perceived efficacy of physiotherapy and use of complementary and alternative therapies by people with progressive multiple sclerosis in the United Kingdom: An online survey. Mult Scler Relat Disord. 2017;12:64-69. doi:10.1016/j.msard.2017.01.002
14. Salvatore JR, Harrington J, Kummet T. Phase I clinical study of a static magnetic field combined with anti-neoplastic chemotherapy in the treatment of human malignancy: initial safety and toxicity data. Bioelectromagnetics. 2003;24(7):524-527. doi:10.1002/bem.10149
15. Richmond SJ, Gunadasa S, Bland M, Macpherson H. Copper bracelets and magnetic wrist straps for rheumatoid arthritis--analgesic and anti-inflammatory effects: a randomised double-blind placebo controlled crossover trial. PLoS One. 2013;8(9):e71529. Published 2013 Sep 16. doi:10.1371/journal.pone.0071529
16. Tsvetkov P, Coy S, Petrova B, et al. Copper induces cell death by targeting lipoylated TCA cycle proteins. Science. 2022;375(6586):1254-1261. doi:10.1126/science.abf0529
17. Simon NJ. Biological Effects of Static Magnetic Fields: A Review. International Cryogenic Materials Commission; 1992:179.
18. Waldorff EI, Zhang N, Ryaby JT. Pulsed electromagnetic field applications: a corporate perspective. J Orthop Translat. 2017;9:60-68. Published 2017 Mar 31. doi:10.1016/j.jot.2017.02.006
What We Have Learned About Combining a Ketogenic Diet and Chemoimmunotherapy: A Case Report and Review of Literature
Originally developed for the treatment of refractory epilepsy, the ketogenic diet is distinguished by its high-fat, moderate-protein, and low-carbohydrate food program. Preclinical models provide emerging evidence that a ketogenic diet can have therapeutic potential for a broad range of cancers. The Warburg effect is a condition where cancer cells increase the uptake and fermentation of glucose to produce lactate for their metabolism, which is called aerobic glycolysis. Lactate is the key driver of cancer angiogenesis and proliferation.1,2
The ketogenic diet promotes a metabolic shift from glycolysis to mitochondrial metabolism in normal cells while cancer cells have dysfunction in their mitochondria due to damage in cellular respiration. The ketogenic diet creates a metabolic state whereby blood glucose levels are reduced, and blood ketone bodies (D-β-hydroxybutyrate and acetoacetate) are elevated. In normal cells, the ketogenic diet causes a decrease in glucose intake for glycolysis, which makes them unable to produce enough substrate to enter the tricarboxylic acid (TCA) cycle for adenosine triphosphate (ATP) production. Fatty acid oxidation plays a key role in ketone body synthesis as a “super fuel” that enter the TCA cycle as an alternative pathway to generate ATP. On the other hand, cancer cells are unable to use ketone bodies to produce ATP for energy and metabolism due to mitochondrial defects. Lack of energy subsequently leads to the inhibition of proliferation and survival of cancer cells.3,4 
We previously published a safety and feasibility study of the Modified Atkins Diet in metastatic cancer patients after failure of chemotherapy at the US Department of Veterans Affairs (VA) Pittsburgh Healthcare System.1 None of the patients were on chemotherapy at the time of enrollment. The Modified Atkins Diet consists of 60% fat, 30% protein, and 10% carbohydrates and is more tolerable than the ketogenic diet due to higher amounts of protein. Six of 11 patients (54%) had stable disease and partial response on positron emission tomography/computed tomography (PET/CT). Our study showed that patients who lost at least 10% of their body weight had improvement in quality of life (QOL) and cancer response.1 Here we present a case of a veteran with extensive metastatic colon cancer on concurrent ketogenic diet and chemotherapy subsequently followed by concurrent ketogenic diet and immunotherapy at Veterans Affairs Central California Health Care Systems (VACCHCS) in Fresno.
CASE PRESENTATION
A 69-year-old veteran had iron deficiency anemia (hemoglobin, 6.5 g/dL) about 5 years previously. He underwent a colonoscopy that revealed a near circumferential ulcerated mass measuring 7 cm in the transverse colon. Biopsy results showed mucinous adenocarcinoma of the colon with a foci of signet ring cells (Figure 2).
The patient received adjuvant treatment with FOLFOX (fluorouracil, leucovorin calcium, and oxaliplatin), but within several months he developed pancreatic and worsening omental metastasis seen on PET/CT. He was then started on FOLFIRI (fluorouracil, leucovorin calcium, and irinotecan hydrochloride) plus bevacizumab 16 months after his initial diagnosis. He underwent a pancreatic mastectomy that confirmed adenocarcinoma 9 months later. Afterward, he briefly resumed FOLFIRI and bevacizumab. Next-generation sequencing testing with Foundation One CDx revealed a wild-type (WT) KRAS with a high degree of tumor mutation burden of 37 muts/Mb, BRAF V600E mutation, and high microsatellite instability (MSI-H).
Due to disease progression, the patient’s treatment was changed to encorafenib and cetuximab for 4 months before progressing again with new liver mass and mediastinal lymphadenopathy. He then received pembrolizumab for 4 months until PET/CT showed progression and his carcinoembryonic antigen (CEA) increased from 95 to 1031 ng/mL by January 2021 (Figure 4).
The patient was started on trifluridine/tipiracil, and bevacizumab while concurrently initiating the ketogenic diet in January 2021. Laboratory tests drawn after 1 week of strict dietary ketogenic diet adherence showed low-level ketosis with a glucose ketone index (GKI) of 8.2 (Table 1).
A follow-up PET/CT showed disease progression along with a CEA of 94 ng/mL after 10 months of chemotherapy plus the ketogenic diet (Table 2). 
The patient continued to experience excellent QOL based on the QOL Eastern Cooperative Oncology Group (ECOG) core quality of life questionnaire (QLC-C30) forms, which he completed every 3 months. Twenty-two months after starting the ketogenic diet, the patient’s CEA increased to 293 ng/mL although PET/CT continues to show stable disease (Figures 4, 5, and 6).
DISCUSSION
The purpose of this case report is to describe whether a patient receiving active cancer treatment was able to tolerate the ketogenic diet in conjunction with chemotherapy or immunotherapy. Most literature published on the subject evaluated the tolerability and response of the ketogenic diet after the failure of standard therapy. Our patient was diagnosed with stage III mucinous colon adenocarcinoma. He received adjuvant chemotherapy but quickly developed metastatic disease to the pancreas and omentum. We started him on encorafenib and cetuximab based on the BEACON study that showed improvement in response rate and survival when compared with standard chemotherapy for patients with BRAF V600E mutation.5 Unfortunately, his cancer quickly progressed within 4 months and again did not respond to pembrolizumab despite MSI-H, which lasted for another 4 months.
We suggested the ketogenic diet and the patient agreed. He started the diet along with trifluridine/tipiracil, and bevacizumab in January 2021. The patient’s metastatic cancer stabilized for 9 months until his disease progressed again. He was started on doublet immune checkpoint inhibitors ipilimumab and nivolumab based on his MSI-H and high tumor mutation burden with the continuation of the ketogenic diet until now. The CheckMate 142 study revealed that the combination of ipilimumab and nivolumab in patients with MSI-H previously treated for metastatic colon cancer showed some benefit.6
Our patient had the loss of nuclear expression of MLH1 and PMS2 (zero tumor stained) but no evidence of the loss expression of MSH2 and MSH6 genes (99% tumor stained). About 8% to 12% of patients with metastatic colon cancer have BRAF V600E mutations that are usually mucinous type, poorly differentiated, and located in the right side of the colon, which portends to a poor prognosis. Tumor DNA mismatch repair damage results in genetic hypermutability and leads to MSI that is sensitive to treatment with checkpoint inhibitors, as in our patient. Only about 3% of MSI-H tumors are due to germline mutations such as Lynch syndrome (hereditary nonpolyposis colorectal cancer). The presence of both MLH1 hypermethylation and BRAF mutation, as in our patient, is a strong indication of somatic rather than germline mutation.7
GKI, which represents the ratio of glucose to ketone, was developed to evaluate the efficacy of the ketogenic diet. This index measures the degree of metabolic stress on tumor cells through the decrease of glucose levels and increase of ketone bodies. A GKI of ≤ 1.0 has been suggested as the ideal therapeutic goal for cancer management.8 As levels of blood glucose decline, the blood levels of ketone bodies should rise. These 2 lines should eventually intersect at a certain point beyond which one enters the therapeutic zone or therapeutic ketosis zone. This is when tumor growth is expected to slow or cease.9 The patient’s ketone (β-hydroxybutyrate) level was initially high (0.71 mmol/L) with a GKI of 8.2. (low ketotic level), which meant he tolerated a rather strict diet for the first several months. This was also reflected in his 18 lb weight loss (almost 10% of body weight) and cancer stabilization, as in our previous publication.1 Unfortunately, the patient was unable to maintain high ketone and lower GKI levels due to fatigue from depleted carbohydrate intake. He added some carbohydrate snacks in between meals, which improved the fatigue. His ketone level has been < 0.5 mmol/L ever since, albeit his disease continues to be stable. The patient continues his daily work and reports a better QOL, based on the ECOG QLC-C30 form that he completed every 3 months.10 Currently, the patient is still receiving ipilimumab and nivolumab while maintaining the ketogenic diet with stable metastatic disease on PET/CT.
Ketogenic Diet and Cellular Mechanism of Action
PI3K/Akt (phosphatidylinositol-3-kinase) signaling is one of the most important intracellular pathways for tumor cells. It leads to the inhibition of apoptosis and the promotion of cell proliferation, metabolism, and angiogenesis. Deregulation of the PI3K pathway either via amplification of PI3K by tyrosine kinase growth factor receptors or inactivation of the tumor suppressor phosphatase and tensin homolog (PTEN), which is the negative regulator of the PI3K pathway, contributes to the development of cancer cells.11
A study by Goncalves and colleagues revealed an interesting relationship between the PI3K pathway and the benefit of the ketogenic diet to slow tumor growth. PI3K inhibitors inhibit glucose uptake into skeletal muscle and adipose tissue that activate hepatic glycogenolysis. This event results in hyperglycemia due to the pancreas releasing very high levels of insulin into the blood (hyperinsulinemia) that subsequently reactivate PI3K signaling and cause resistance to PI3K inhibitors. The ketogenic diet reportedly minimized the hyperglycemia and hyperinsulinemia induced by the PI3K inhibitor and enhanced the efficacy of PI3K inhibitors in tumor models. Studies combining PI3K inhibitors and ketogenic diet are underway. Hence, combining the ketogenic diet with chemotherapy or other novel treatment should be the focus of ketogenic diet trials.12,13
Ketogenic Diet and Oncology Studies
The impact of the ketogenic diet on the growth of murine pancreatic tumors was evaluated by Yang and colleagues. The ketogenic diet decreased glucose concentration that enters the TCA cycle and increased fatty acid oxidation that produces β-hydroxybutyrate. This event promotes the generation of ATP, although with only modest elevations of NADH with less impact on tumor growth. The combination of ketogenic diet and standard chemotherapy substantially raised tumor NADH and suppressed the growth of murine tumor cells, they noted.14 Furukawa and colleagues compared 10 patients with metastatic colon cancer receiving chemotherapy plus the modified medium-chain triglyceride ketogenic diet for 1 year with 14 patients receiving chemotherapy only. The ketogenic diet group exhibited a response rate of 60% with 5 patients achieving a complete response and a disease control rate of 70%, while the chemotherapy-alone group showed a response rate of only 21% with no complete response and a disease control rate of 64%.15
The ketogenic diet also reportedly stimulates cytokine and CD4+ and CD8+ T-cell production that stimulates T-cell killing activity. The ketogenic diet may overcome several immune escape mechanisms by downregulating the expression of cytotoxic T-lymphocyte-associated protein 4 (CTLA-4) and programmed cell death protein 1 (PD-1) on tumor-infiltrating lymphocytes.16 Our patient tolerated the combination of the ketogenic diet with ipilimumab (CTLA-4 inhibitor) and nivolumab (PD-1 inhibitor) without significant toxicities and stabilization of his disease.
Future Directions
We originally presented the abstract and poster of this case report at the Association of VA Hematology/Oncology annual meeting in San Diego, California, in September 2022.17 Based on our previous experience, we are now using a modified Atkins diet, which is a less strict diet consisting of 60% fat, 30% protein, and 10% carbohydrates combined with chemotherapy and/or immunotherapy. The composition of fat to carbohydrate plus protein in the traditional ketogenic diet is usually 4:1 or 3:1, while in modified Atkins diet the ratio is 1:1 or 2:1. The benefit of the modified Atkins diet is that patients can consume more protein than a strict ketogenic diet and they can be more liberal in carbohydrate allowances. We are about to open a study protocol of combining a modified Atkin diet and chemotherapy and/or immunotherapy as a first-line treatment for veterans with all types of advanced or metastatic solid tumors at VACCHCS. The study protocol was approved by the VA Office of Research and Development and has been submitted to the VACCHCS Institutional Review Board for review. Once approved, we will start patient recruitment. 
CONCLUSIONS
Cancer cells have defects in their mitochondria that prevent them from generating energy for metabolism in the absence of glucose. They also depend on the PI3K signaling pathway to survive. The ketogenic diet has the advantage of affecting cancer cell growth by exploiting these mitochondrial defects and blocking hyperglycemia. There is growing evidence that the ketogenic diet is feasible, tolerable, and reportedly inhibits cancer growth. Our case report and previous publications suggest that the ketogenic diet can be added to chemotherapy and/or immunotherapy as an adjunct to standard-of-care cancer treatment while maintaining good QOL. We are planning to open a clinical trial using the modified Atkins diet in conjunction with active cancer treatments as first-line therapy for metastatic solid tumors at the VACCHCS. We are also working closely with researchers from several veteran hospitals to do a diet collaborative study. We believe the ketogenic diet is an important part of cancer treatment and has a promising future. More research should be dedicated to this very interesting field.
Acknowledgments
We previously presented this case report in an abstract and poster at the September 2022 AVAHO meeting in San Diego, California.
1. Tan-Shalaby JL, Carrick J, Edinger K, et al. Modified Atkins diet in advanced malignancies-final results of a safety and feasibility trial within the Veterans Affairs Pittsburgh Healthcare System. Nutr Metab (Lond). 2016;13:52. Published 2016 Aug 12. doi:10.1186/s12986-016-0113-y
2. Talib WH, Mahmod AI, Kamal A, et al. Ketogenic diet in cancer prevention and therapy: molecular targets and therapeutic opportunities. Curr Issues Mol Biol. 2021;43(2):558-589. Published 2021 Jul 3. doi:10.3390/cimb43020042
3. Tan-Shalaby J. Ketogenic diets and cancer: emerging evidence. Fed Pract. 2017;34(suppl 1):37S-42S.
4. Cortez NE, Mackenzie GG. Ketogenic diets in pancreatic cancer and associated cachexia: cellular mechanisms and clinical perspectives. Nutrients. 2021;13(9):3202. Published 2021 Sep 15. doi:10.3390/nu13093202
5. Tabernero J, Grothey A, Van Cutsem E, et al. Encorafenib plus cetuximab as a new standard of care for previously treated BRAF V600E-mutant metastatic colorectal cancer: updated survival results and subgroup analyses from the BEACON study. J Clin Oncol. 2021;39(4):273-284. doi:10.1200/JCO.20.02088
6. André T, Lonardi S, Wong KYM, et al. Nivolumab plus low-dose ipilimumab in previously treated patients with microsatellite instability-high/mismatch repair-deficient metastatic colorectal cancer: 4-year follow-up from CheckMate 142. Ann Oncol. 2022;33(10):1052-1060. doi:10.1016/j.annonc.2022.06.008
7. Grassi E, Corbelli J, Papiani G, Barbera MA, Gazzaneo F, Tamberi S. Current therapeutic strategies in BRAF-mutant metastatic colorectal cancer. Front Oncol. 2021;11:601722. Published 2021 Jun 23. doi:10.3389/fonc.2021.601722
8. Seyfried TN, Mukherjee P, Iyikesici MS, et al. Consideration of ketogenic metabolic therapy as a complementary or alternative approach for managing breast cancer. Front Nutr. 2020;7:21. Published 2020 Mar 11. doi:10.3389/fnut.2020.00021
9. Meidenbauer JJ, Mukherjee P, Seyfried TN. The glucose ketone index calculator: a simple tool to monitor therapeutic efficacy for metabolic management of brain cancer. Nutr Metab (Lond). 2015;12:12. Published 2015 Mar 11. doi:10.1186/s12986-015-0009-2
10. Fayers P, Bottomley A; EORTC Quality of Life Group; Quality of Life Unit. Quality of life research within the EORTC-the EORTC QLQ-C30. European Organisation for Research and Treatment of Cancer. Eur J Cancer. 2002;38(suppl 4):S125-S133. doi:10.1016/s0959-8049(01)00448-8
11. Yang J, Nie J, Ma X, Wei Y, Peng Y, Wei X. Targeting PI3K in cancer: mechanisms and advances in clinical trials. Mol Cancer. 2019;18(1):26. Published 2019 Feb 19. doi:10.1186/s12943-019-0954-x
12. Goncalves MD, Hopkins BD, Cantley LC. Phosphatidylinositol 3-kinase, growth disorders, and cancer. N Engl J Med. 2018;379(21):2052-2062. doi:10.1056/NEJMra1704560
13. Weber DD, Aminzadeh-Gohari S, Tulipan J, Catalano L, Feichtinger RG, Kofler B. Ketogenic diet in the treatment of cancer-where do we stand?. Mol Metab. 2020;33:102-121. doi:10.1016/j.molmet.2019.06.026
14. Yang L, TeSlaa T, Ng S, et al. Ketogenic diet and chemotherapy combine to disrupt pancreatic cancer metabolism and growth. Med. 2022;3(2):119-136. doi:10.1016/j.medj.2021.12.008
15. Furukawa K, Shigematus K, Iwase Y, et al. Clinical effects of one year of chemotherapy with a modified medium-chain triglyceride ketogenic diet on the recurrence of stage IV colon cancer. J Clin Oncol. 2018;36(suppl 15):e15709. doi:10.1200/JCO.2018.36.15_suppl.e15709
16. Zhang X, Li H, Lv X, et al. Impact of diets on response to immune checkpoint inhibitors (ICIs) therapy against tumors. Life (Basel). 2022;12(3):409. Published 2022 Mar 11. doi:10.3390/life12030409
17. Liman, A, Hwang A, Means J, Newson J. Ketogenic diet and cancer: a case report and feasibility study at VA Central California Healthcare System. Fed Pract. 2022;39(suppl 4):S18.
Originally developed for the treatment of refractory epilepsy, the ketogenic diet is distinguished by its high-fat, moderate-protein, and low-carbohydrate food program. Preclinical models provide emerging evidence that a ketogenic diet can have therapeutic potential for a broad range of cancers. The Warburg effect is a condition where cancer cells increase the uptake and fermentation of glucose to produce lactate for their metabolism, which is called aerobic glycolysis. Lactate is the key driver of cancer angiogenesis and proliferation.1,2
The ketogenic diet promotes a metabolic shift from glycolysis to mitochondrial metabolism in normal cells while cancer cells have dysfunction in their mitochondria due to damage in cellular respiration. The ketogenic diet creates a metabolic state whereby blood glucose levels are reduced, and blood ketone bodies (D-β-hydroxybutyrate and acetoacetate) are elevated. In normal cells, the ketogenic diet causes a decrease in glucose intake for glycolysis, which makes them unable to produce enough substrate to enter the tricarboxylic acid (TCA) cycle for adenosine triphosphate (ATP) production. Fatty acid oxidation plays a key role in ketone body synthesis as a “super fuel” that enter the TCA cycle as an alternative pathway to generate ATP. On the other hand, cancer cells are unable to use ketone bodies to produce ATP for energy and metabolism due to mitochondrial defects. Lack of energy subsequently leads to the inhibition of proliferation and survival of cancer cells.3,4
We previously published a safety and feasibility study of the Modified Atkins Diet in metastatic cancer patients after failure of chemotherapy at the US Department of Veterans Affairs (VA) Pittsburgh Healthcare System.1 None of the patients were on chemotherapy at the time of enrollment. The Modified Atkins Diet consists of 60% fat, 30% protein, and 10% carbohydrates and is more tolerable than the ketogenic diet due to higher amounts of protein. Six of 11 patients (54%) had stable disease and partial response on positron emission tomography/computed tomography (PET/CT). Our study showed that patients who lost at least 10% of their body weight had improvement in quality of life (QOL) and cancer response.1 Here we present a case of a veteran with extensive metastatic colon cancer on concurrent ketogenic diet and chemotherapy subsequently followed by concurrent ketogenic diet and immunotherapy at Veterans Affairs Central California Health Care Systems (VACCHCS) in Fresno.
CASE PRESENTATION
A 69-year-old veteran had iron deficiency anemia (hemoglobin, 6.5 g/dL) about 5 years previously. He underwent a colonoscopy that revealed a near circumferential ulcerated mass measuring 7 cm in the transverse colon. Biopsy results showed mucinous adenocarcinoma of the colon with a foci of signet ring cells (Figure 2).
The patient received adjuvant treatment with FOLFOX (fluorouracil, leucovorin calcium, and oxaliplatin), but within several months he developed pancreatic and worsening omental metastasis seen on PET/CT. He was then started on FOLFIRI (fluorouracil, leucovorin calcium, and irinotecan hydrochloride) plus bevacizumab 16 months after his initial diagnosis. He underwent a pancreatic mastectomy that confirmed adenocarcinoma 9 months later. Afterward, he briefly resumed FOLFIRI and bevacizumab. Next-generation sequencing testing with Foundation One CDx revealed a wild-type (WT) KRAS with a high degree of tumor mutation burden of 37 muts/Mb, BRAF V600E mutation, and high microsatellite instability (MSI-H).
Due to disease progression, the patient’s treatment was changed to encorafenib and cetuximab for 4 months before progressing again with new liver mass and mediastinal lymphadenopathy. He then received pembrolizumab for 4 months until PET/CT showed progression and his carcinoembryonic antigen (CEA) increased from 95 to 1031 ng/mL by January 2021 (Figure 4).
The patient was started on trifluridine/tipiracil, and bevacizumab while concurrently initiating the ketogenic diet in January 2021. Laboratory tests drawn after 1 week of strict dietary ketogenic diet adherence showed low-level ketosis with a glucose ketone index (GKI) of 8.2 (Table 1).
A follow-up PET/CT showed disease progression along with a CEA of 94 ng/mL after 10 months of chemotherapy plus the ketogenic diet (Table 2).
The patient continued to experience excellent QOL based on the QOL Eastern Cooperative Oncology Group (ECOG) core quality of life questionnaire (QLC-C30) forms, which he completed every 3 months. Twenty-two months after starting the ketogenic diet, the patient’s CEA increased to 293 ng/mL although PET/CT continues to show stable disease (Figures 4, 5, and 6).
DISCUSSION
The purpose of this case report is to describe whether a patient receiving active cancer treatment was able to tolerate the ketogenic diet in conjunction with chemotherapy or immunotherapy. Most literature published on the subject evaluated the tolerability and response of the ketogenic diet after the failure of standard therapy. Our patient was diagnosed with stage III mucinous colon adenocarcinoma. He received adjuvant chemotherapy but quickly developed metastatic disease to the pancreas and omentum. We started him on encorafenib and cetuximab based on the BEACON study that showed improvement in response rate and survival when compared with standard chemotherapy for patients with BRAF V600E mutation.5 Unfortunately, his cancer quickly progressed within 4 months and again did not respond to pembrolizumab despite MSI-H, which lasted for another 4 months.
We suggested the ketogenic diet and the patient agreed. He started the diet along with trifluridine/tipiracil, and bevacizumab in January 2021. The patient’s metastatic cancer stabilized for 9 months until his disease progressed again. He was started on doublet immune checkpoint inhibitors ipilimumab and nivolumab based on his MSI-H and high tumor mutation burden with the continuation of the ketogenic diet until now. The CheckMate 142 study revealed that the combination of ipilimumab and nivolumab in patients with MSI-H previously treated for metastatic colon cancer showed some benefit.6
Our patient had the loss of nuclear expression of MLH1 and PMS2 (zero tumor stained) but no evidence of the loss expression of MSH2 and MSH6 genes (99% tumor stained). About 8% to 12% of patients with metastatic colon cancer have BRAF V600E mutations that are usually mucinous type, poorly differentiated, and located in the right side of the colon, which portends to a poor prognosis. Tumor DNA mismatch repair damage results in genetic hypermutability and leads to MSI that is sensitive to treatment with checkpoint inhibitors, as in our patient. Only about 3% of MSI-H tumors are due to germline mutations such as Lynch syndrome (hereditary nonpolyposis colorectal cancer). The presence of both MLH1 hypermethylation and BRAF mutation, as in our patient, is a strong indication of somatic rather than germline mutation.7
GKI, which represents the ratio of glucose to ketone, was developed to evaluate the efficacy of the ketogenic diet. This index measures the degree of metabolic stress on tumor cells through the decrease of glucose levels and increase of ketone bodies. A GKI of ≤ 1.0 has been suggested as the ideal therapeutic goal for cancer management.8 As levels of blood glucose decline, the blood levels of ketone bodies should rise. These 2 lines should eventually intersect at a certain point beyond which one enters the therapeutic zone or therapeutic ketosis zone. This is when tumor growth is expected to slow or cease.9 The patient’s ketone (β-hydroxybutyrate) level was initially high (0.71 mmol/L) with a GKI of 8.2. (low ketotic level), which meant he tolerated a rather strict diet for the first several months. This was also reflected in his 18 lb weight loss (almost 10% of body weight) and cancer stabilization, as in our previous publication.1 Unfortunately, the patient was unable to maintain high ketone and lower GKI levels due to fatigue from depleted carbohydrate intake. He added some carbohydrate snacks in between meals, which improved the fatigue. His ketone level has been < 0.5 mmol/L ever since, albeit his disease continues to be stable. The patient continues his daily work and reports a better QOL, based on the ECOG QLC-C30 form that he completed every 3 months.10 Currently, the patient is still receiving ipilimumab and nivolumab while maintaining the ketogenic diet with stable metastatic disease on PET/CT.
Ketogenic Diet and Cellular Mechanism of Action
PI3K/Akt (phosphatidylinositol-3-kinase) signaling is one of the most important intracellular pathways for tumor cells. It leads to the inhibition of apoptosis and the promotion of cell proliferation, metabolism, and angiogenesis. Deregulation of the PI3K pathway either via amplification of PI3K by tyrosine kinase growth factor receptors or inactivation of the tumor suppressor phosphatase and tensin homolog (PTEN), which is the negative regulator of the PI3K pathway, contributes to the development of cancer cells.11
A study by Goncalves and colleagues revealed an interesting relationship between the PI3K pathway and the benefit of the ketogenic diet to slow tumor growth. PI3K inhibitors inhibit glucose uptake into skeletal muscle and adipose tissue that activate hepatic glycogenolysis. This event results in hyperglycemia due to the pancreas releasing very high levels of insulin into the blood (hyperinsulinemia) that subsequently reactivate PI3K signaling and cause resistance to PI3K inhibitors. The ketogenic diet reportedly minimized the hyperglycemia and hyperinsulinemia induced by the PI3K inhibitor and enhanced the efficacy of PI3K inhibitors in tumor models. Studies combining PI3K inhibitors and ketogenic diet are underway. Hence, combining the ketogenic diet with chemotherapy or other novel treatment should be the focus of ketogenic diet trials.12,13
Ketogenic Diet and Oncology Studies
The impact of the ketogenic diet on the growth of murine pancreatic tumors was evaluated by Yang and colleagues. The ketogenic diet decreased glucose concentration that enters the TCA cycle and increased fatty acid oxidation that produces β-hydroxybutyrate. This event promotes the generation of ATP, although with only modest elevations of NADH with less impact on tumor growth. The combination of ketogenic diet and standard chemotherapy substantially raised tumor NADH and suppressed the growth of murine tumor cells, they noted.14 Furukawa and colleagues compared 10 patients with metastatic colon cancer receiving chemotherapy plus the modified medium-chain triglyceride ketogenic diet for 1 year with 14 patients receiving chemotherapy only. The ketogenic diet group exhibited a response rate of 60% with 5 patients achieving a complete response and a disease control rate of 70%, while the chemotherapy-alone group showed a response rate of only 21% with no complete response and a disease control rate of 64%.15
The ketogenic diet also reportedly stimulates cytokine and CD4+ and CD8+ T-cell production that stimulates T-cell killing activity. The ketogenic diet may overcome several immune escape mechanisms by downregulating the expression of cytotoxic T-lymphocyte-associated protein 4 (CTLA-4) and programmed cell death protein 1 (PD-1) on tumor-infiltrating lymphocytes.16 Our patient tolerated the combination of the ketogenic diet with ipilimumab (CTLA-4 inhibitor) and nivolumab (PD-1 inhibitor) without significant toxicities and stabilization of his disease.
Future Directions
We originally presented the abstract and poster of this case report at the Association of VA Hematology/Oncology annual meeting in San Diego, California, in September 2022.17 Based on our previous experience, we are now using a modified Atkins diet, which is a less strict diet consisting of 60% fat, 30% protein, and 10% carbohydrates combined with chemotherapy and/or immunotherapy. The composition of fat to carbohydrate plus protein in the traditional ketogenic diet is usually 4:1 or 3:1, while in modified Atkins diet the ratio is 1:1 or 2:1. The benefit of the modified Atkins diet is that patients can consume more protein than a strict ketogenic diet and they can be more liberal in carbohydrate allowances. We are about to open a study protocol of combining a modified Atkin diet and chemotherapy and/or immunotherapy as a first-line treatment for veterans with all types of advanced or metastatic solid tumors at VACCHCS. The study protocol was approved by the VA Office of Research and Development and has been submitted to the VACCHCS Institutional Review Board for review. Once approved, we will start patient recruitment.
CONCLUSIONS
Cancer cells have defects in their mitochondria that prevent them from generating energy for metabolism in the absence of glucose. They also depend on the PI3K signaling pathway to survive. The ketogenic diet has the advantage of affecting cancer cell growth by exploiting these mitochondrial defects and blocking hyperglycemia. There is growing evidence that the ketogenic diet is feasible, tolerable, and reportedly inhibits cancer growth. Our case report and previous publications suggest that the ketogenic diet can be added to chemotherapy and/or immunotherapy as an adjunct to standard-of-care cancer treatment while maintaining good QOL. We are planning to open a clinical trial using the modified Atkins diet in conjunction with active cancer treatments as first-line therapy for metastatic solid tumors at the VACCHCS. We are also working closely with researchers from several veteran hospitals to do a diet collaborative study. We believe the ketogenic diet is an important part of cancer treatment and has a promising future. More research should be dedicated to this very interesting field.
Acknowledgments
We previously presented this case report in an abstract and poster at the September 2022 AVAHO meeting in San Diego, California.
1. Tan-Shalaby JL, Carrick J, Edinger K, et al. Modified Atkins diet in advanced malignancies-final results of a safety and feasibility trial within the Veterans Affairs Pittsburgh Healthcare System. Nutr Metab (Lond). 2016;13:52. Published 2016 Aug 12. doi:10.1186/s12986-016-0113-y
2. Talib WH, Mahmod AI, Kamal A, et al. Ketogenic diet in cancer prevention and therapy: molecular targets and therapeutic opportunities. Curr Issues Mol Biol. 2021;43(2):558-589. Published 2021 Jul 3. doi:10.3390/cimb43020042
3. Tan-Shalaby J. Ketogenic diets and cancer: emerging evidence. Fed Pract. 2017;34(suppl 1):37S-42S.
4. Cortez NE, Mackenzie GG. Ketogenic diets in pancreatic cancer and associated cachexia: cellular mechanisms and clinical perspectives. Nutrients. 2021;13(9):3202. Published 2021 Sep 15. doi:10.3390/nu13093202
5. Tabernero J, Grothey A, Van Cutsem E, et al. Encorafenib plus cetuximab as a new standard of care for previously treated BRAF V600E-mutant metastatic colorectal cancer: updated survival results and subgroup analyses from the BEACON study. J Clin Oncol. 2021;39(4):273-284. doi:10.1200/JCO.20.02088
6. André T, Lonardi S, Wong KYM, et al. Nivolumab plus low-dose ipilimumab in previously treated patients with microsatellite instability-high/mismatch repair-deficient metastatic colorectal cancer: 4-year follow-up from CheckMate 142. Ann Oncol. 2022;33(10):1052-1060. doi:10.1016/j.annonc.2022.06.008
7. Grassi E, Corbelli J, Papiani G, Barbera MA, Gazzaneo F, Tamberi S. Current therapeutic strategies in BRAF-mutant metastatic colorectal cancer. Front Oncol. 2021;11:601722. Published 2021 Jun 23. doi:10.3389/fonc.2021.601722
8. Seyfried TN, Mukherjee P, Iyikesici MS, et al. Consideration of ketogenic metabolic therapy as a complementary or alternative approach for managing breast cancer. Front Nutr. 2020;7:21. Published 2020 Mar 11. doi:10.3389/fnut.2020.00021
9. Meidenbauer JJ, Mukherjee P, Seyfried TN. The glucose ketone index calculator: a simple tool to monitor therapeutic efficacy for metabolic management of brain cancer. Nutr Metab (Lond). 2015;12:12. Published 2015 Mar 11. doi:10.1186/s12986-015-0009-2
10. Fayers P, Bottomley A; EORTC Quality of Life Group; Quality of Life Unit. Quality of life research within the EORTC-the EORTC QLQ-C30. European Organisation for Research and Treatment of Cancer. Eur J Cancer. 2002;38(suppl 4):S125-S133. doi:10.1016/s0959-8049(01)00448-8
11. Yang J, Nie J, Ma X, Wei Y, Peng Y, Wei X. Targeting PI3K in cancer: mechanisms and advances in clinical trials. Mol Cancer. 2019;18(1):26. Published 2019 Feb 19. doi:10.1186/s12943-019-0954-x
12. Goncalves MD, Hopkins BD, Cantley LC. Phosphatidylinositol 3-kinase, growth disorders, and cancer. N Engl J Med. 2018;379(21):2052-2062. doi:10.1056/NEJMra1704560
13. Weber DD, Aminzadeh-Gohari S, Tulipan J, Catalano L, Feichtinger RG, Kofler B. Ketogenic diet in the treatment of cancer-where do we stand?. Mol Metab. 2020;33:102-121. doi:10.1016/j.molmet.2019.06.026
14. Yang L, TeSlaa T, Ng S, et al. Ketogenic diet and chemotherapy combine to disrupt pancreatic cancer metabolism and growth. Med. 2022;3(2):119-136. doi:10.1016/j.medj.2021.12.008
15. Furukawa K, Shigematus K, Iwase Y, et al. Clinical effects of one year of chemotherapy with a modified medium-chain triglyceride ketogenic diet on the recurrence of stage IV colon cancer. J Clin Oncol. 2018;36(suppl 15):e15709. doi:10.1200/JCO.2018.36.15_suppl.e15709
16. Zhang X, Li H, Lv X, et al. Impact of diets on response to immune checkpoint inhibitors (ICIs) therapy against tumors. Life (Basel). 2022;12(3):409. Published 2022 Mar 11. doi:10.3390/life12030409
17. Liman, A, Hwang A, Means J, Newson J. Ketogenic diet and cancer: a case report and feasibility study at VA Central California Healthcare System. Fed Pract. 2022;39(suppl 4):S18.
Implementing a Telehealth Shared Counseling and Decision-Making Visit for Lung Cancer Screening in a Veterans Affairs Medical Center
Lung cancer is the second most frequently diagnosed cancer among US veterans and the leading cause of cancer death.1 Clinical trials have shown that annual screening of high-risk persons with low-dose computed tomography (LDCT) can reduce the risk of dying of lung cancer.2 In 2011, the National Lung Screening Trial (NLST) reported that over a 3-year period, annual LDCT screening reduced the risk of dying of lung cancer by 20% compared with chest radiograph screening.3 Lung cancer screening (LCS), however, was associated with harms, including false-positive results, complications from invasive diagnostic procedures, incidental findings, overdiagnosis, and radiation exposure.
The US Preventive Services Task Force (USPSTF) began recommending annual screening of high-risk persons after publication of the NLST results.4 The Veterans Health Administration (VHA) recommended implementing LCS in 2017.5 Guidelines, however, have consistently highlighted the complexity of the decision and the importance of engaging patients in thorough discussions about the potential benefits and harms of screening (shared decision making [SDM]). The Centers for Medicare and Medicaid Services (CMS) has issued coverage determinations mandating that eligible patients undergo a counseling visit that uses a decision aid to support SDM for LCS and addresses tobacco use.6,7 However, primary care practitioners (PCPs) face many challenges in delivering SDM, including a lack of awareness of clinical trial results and screening guidelines, competing clinical demands, being untrained in SDM, and not having educational resources.8 Patients in rural locations face travel burdens in attending counseling visits.9
We conducted a pilot study to address concerns with delivering SDM for LCS to veterans. We implemented a centralized screening model in which veterans were referred by clinicians to a trained decision coach who conducted telephone visits to discuss the initial LCS decision, addressed tobacco cessation, and placed LDCT orders. We evaluated the outcomes of this telemedicine visit by using decision quality metrics and tracking LCS uptake, referrals for tobacco cessation, and clinical outcomes. The University of Iowa Institutional Review Board considered this study to be a quality improvement project and waived informed consent and HIPAA (Health Insurance Portability and Accountability Act) authorization requirements.
Implementation
We implemented the LCS program at the Iowa City Veterans Affairs Health Care System (ICVAHCS), which has both resident and staff clinicians, and 2 community-based outpatient clinics (Coralville, Cedar Rapids) with staff clinicians. The pilot study, conducted from November 2020 through July 2022, was led by a multidisciplinary team that included a nurse, primary care physician, pulmonologist, and radiologist. The team conducted online presentations to educate PCPs about the epidemiology of lung cancer, results of screening trials, LCS guidelines, the rationale for a centralized model of SDM, and the ICVAHCS screening protocols.
Screening Referrals
When the study began in 2020, we used the 2015 USPSTF criteria for annual LCS: individuals aged 55 to 80 years with a 30 pack-year smoking history and current tobacco user or who had quit within 15 years.4 We lowered the starting age to 50 years and the pack-year requirement to 20 after the USPSTF issued updated guidelines in 2021.10 Clinicians were notified about potentially eligible patients through the US Department of Veterans Affairs (VA) Computerized Personal Record System (CPRS) reminders or by the nurse program coordinator (NPC) who reviewed health records of patients with upcoming appointments. If the clinician determined that screening was appropriate, they ordered an LCS consult. The NPC called the veteran to confirm eligibility, mailed a decision aid, and scheduled a telephone visit to conduct SDM. We used the VA decision aid developed for the LCS demonstration project conducted at 8 academic VA medical centers between 2013 and 2017.11
Shared Decision-Making Telephone Visit
The NPC adapted a telephone script developed for a Cancer Prevention and Research Institute of Texas–funded project conducted by 2 coauthors (RJV and LML).12 The NPC asked about receipt/review of the decision aid, described the screening process, and addressed benefits and potential harms of screening. The NPC also offered smoking cessation interventions for veterans who were currently smoking, including referrals to the VA patient aligned care team clinical pharmacist for management of tobacco cessation or to the national VA Quit Line. The encounter ended by assessing the veteran’s understanding of screening issues and eliciting the veteran’s preferences for LDCT and willingness to adhere with the LCS program.
LDCT Imaging
The NPC placed LDCT orders for veterans interested in screening and alerted the referring clinician to sign the order. Veterans who agreed to be screened were placed in an LCS dashboard developed by the Veterans Integrated Services Network (VISN) 23 LCS program that was used as a patient management tool. The dashboard allowed the NPC to track patients, ensuring that veterans were being scheduled for and completing initial and follow-up testing. Radiologists used the Lung-RADS (Lung Imaging Reporting and Data System) to categorize LDCT results (1, normal; 2, benign nodule; 3, probably benign nodule; 4, suspicious nodule).13 Veterans with Lung-RADS 1 or 2 results were scheduled for an annual LDCT (if they remained eligible). Veterans with Lung-RADS 3 results were scheduled for a 6-month follow-up CT. The screening program sent electronic consults to pulmonary for veterans with Lung-RADS 4 to determine whether they should undergo additional imaging or be evaluated in the pulmonary clinic.
Evaluating Shared Decision Making
We audio taped and transcribed randomly selected SDM encounters to assess fidelity with the 2016 CMS required discussion elements for counseling about lung cancer, including the benefit of reducing lung cancer mortality; the potential for harms from false alarms, incidental findings, overdiagnosis, and radiation exposure; the need for annual screening; the importance of smoking cessation; and the possibility of undergoing follow-up testing and diagnostic procedures. An investigator coded the transcripts to assess for the presence of each required element and scored the encounter from 0 to 7.
We also surveyed veterans completing SDM, using a convenience sampling strategy to evaluate knowledge, the quality of the SDM process, and decisional conflict. Initially, we sent mailed surveys to subjects to be completed 1 week after the SDM visit. To increase the response rate, we subsequently called patients to complete the surveys by telephone 1 week after the SDM visit.
We used the validated LCS-12 knowledge measure to assess awareness of lung cancer risks, screening eligibility, and the benefits and harms of screening.14 We evaluated the quality of the SDM visit by using the 3-item CollaboRATE scale (Table 1).15 
The NPC also took field notes during interviews to help identify additional SDM issues. After each call, the NPC noted her impressions of the veteran’s engagement with SDM and understanding of the screening issues.
Clinical Outcomes
We used the screening dashboard and CPRS to track clinical outcomes, including screening uptake, referrals for tobacco cessation, appropriate (screening or diagnostic) follow-up testing, and cancer diagnoses. We used descriptive statistics to characterize demographic data and survey responses.
Initial Findings
We conducted 105 SDM telephone visits from November 2020 through July 2022 (Table 2). 
We surveyed 47 of the veterans completing SDM visits (45%) and received 37 completed surveys (79%). All respondents were male, mean age 61.9 years, 89% White, 38% married/partnered, 70% rural, 65% currently smoking, with a mean 44.8 pack-years smoking history. On average, veterans answered 6.3 (53%) of knowledge questions correctly (Table 3).
Only 1 respondent (3%) correctly answered the multiple-choice question about indications for stopping screening. Two (5%) correctly answered the question on the magnitude of benefit, most overestimated or did not know. Similarly, 23 (62%) overestimated or did not know the predictive value of an abnormal scan. About two-thirds of veterans underestimated or did not know the attributable risk of lung cancer from tobacco, and about four-fifths did not know the mortality rank of lung cancer. Among the 37 respondents, 31 (84%) indicated not having any decisional conflict as defined by a score of 4 on the SURE scale. 
Implementing SDM
The NPC’s field notes indicated that many veterans did not perceive any need to discuss the screening decision and believed that their PCP had referred them just for screening. However, they reported having cursory discussions with their PCP, being told that only their history of heavy tobacco use meant they should be screened. For veterans who had not read the decision aid, the NPC attempted to summarize benefits and harms. However, the discussions were often inadequate because the veterans were not interested in receiving information, particularly numerical data, or indicated that they had limited time for the call.
Seventy-two (69%) of the veterans who met with the NPC were currently smoking. Tobacco cessation counseling was offered to 66; 29 were referred to the VA Quit Line, 10 were referred to the tobacco cessation pharmacist, and the NPC contacted the PCPs for 9 patients who wanted prescriptions for nicotine replacement therapy.
After the SDM visit, 91 veterans (87%) agreed to screening. By the end of the study period, 73 veterans (80%) completed testing. Most veterans had Lung-RADS 1 or 2 results, 11 (1%) had a Lung-RADS 3, and 7 (10%) had a Lung-RADS 4. All 9 veterans with Lung-RADS 3 results and at least 6 months of follow-up underwent repeat imaging within 4 to 13 months (median, 7). All veterans with a Lung-RADS 4 result were referred to pulmonary. One patient was diagnosed with an early-stage non–small cell lung cancer.
We identified several problems with LDCT coding. Radiologists did not consistently use Lung-RADS when interpreting screening LDCTs; some used the Fleischner lung nodule criteria.18 We also found discordant readings for abnormal LDCTs, where the assigned Lung-RADS score was not consistent with the nodule description in the radiology report.
Discussion
Efforts to implement LCS with a telemedicine SDM intervention were mixed. An NPC-led SDM phone call was successfully incorporated into the clinical workflow. Most veterans identified as being eligible for screening participated in the counseling visit and underwent screening. However, they were often reluctant to engage in SDM, feeling that their clinician had already recommended screening and that there was no need for further discussion. Unfortunately, many veterans had not received or reviewed the decision aid and were not interested in receiving information about benefits and harms. Because we relied on telephone calls, we could not share visual information in real time.
Overall, the surveys indicated that most veterans were very satisfied with the quality of the discussion and reported feeling no decisional conflict. However, based on the NPC’s field notes and audio recordings, we believe that the responses may have reflected earlier discussions with the PCP that reportedly emphasized only the veteran’s eligibility for screening. The fidelity assessments indicated that the NPC consistently addressed the harms and benefits of screening.
Nonetheless, the performance on knowledge measures was uneven. Veterans were generally aware of harms, including false alarms, overdiagnosis, radiation exposure, and incidental findings. They did not, however, appreciate when screening should stop. They also underestimated the risks of developing lung cancer and the portion of that risk attributable to tobacco use, and overestimated the benefits of screening. These results suggest that the veterans, at least those who completed the surveys, may not be making well-informed decisions.
Our findings echo those of other VA investigators in finding knowledge deficits among screened veterans, including being unaware that LDCT was for LCS, believing that screening could prevent cancer, receiving little information about screening harms, and feeling that negative tests meant they were among the “lucky ones” who would avoid harm from continued smoking.19,20
The VA is currently implementing centralized screening models with the Lung Precision Oncology Program and the VA partnership to increase access to lung screening (VA-PALS).5 The centralized model, which readily supports the tracking, monitoring, and reporting needs of a screening program, also has advantages in delivering SDM because counselors have been trained in SDM, are more familiar with LCS evidence and processes, can better incorporate decision tools, and do not face the same time constraints as clinicians.21 However, studies have shown that most patients have already decided to be screened when they show up for the SDM visit.22 In contrast, about one-third of patients in primary care settings who receive decision support chose not to be screened.23,24 We found that 13% of our patients decided against screening after a telephone discussion, suggesting that a virtually conducted SDM visit can meaningfully support decision making. Telemedicine also may reduce health inequities in centralized models arising from patients having limited access to screening centers.
Our results suggest that PCPs referring patients to a centralized program, even for virtual visits, should frame the decision to initiate LCS as SDM, where an informed patient is being supported in making a decision consistent with their values and preferences. Furthermore, engaging patients in SDM should not be construed as endorsing screening. When centralized support is less available, individual clinics may need to provide SDM, perhaps using a nonclinician decision coach if clinicians lack the time to lead the discussions. Decision coaches have been effectively used to increase patients’ knowledge about the benefits and harms of screening.12 Regardless of the program model, PCPs will also be responsible for determining whether patients are healthy enough to undergo invasive diagnostic testing and treatment and ensuring that tobacco use is addressed.
SDM delivered in any setting will be enhanced by ensuring that patients are provided with decision aids before a counseling visit. This will help them better understand the benefits and harms of screening and the need to elicit values. The discussion can then focus on areas of concern or questions raised by reviewing the decision aid. The clinician and patient could also use a decision aid during either a face-to-face or video clinical encounter to facilitate SDM. A Cochrane review has shown that using decision aids for people facing screening decisions increases knowledge, reduces decisional conflict, and effectively elicits values and preferences.25 Providing high-quality decision support is a patient-centered approach that respects a patient’s autonomy and may promote health equity and improve adherence.
We recognized the importance of having a multidisciplinary team, involving primary care, radiology, pulmonary, and nursing, with a shared understanding of the screening processes. These are essential features for a high-quality screening program where eligible veterans are readily identified and receive prompt and appropriate follow-up. Radiologists need to use Lung-RADS categories consistently and appropriately when reading LDCTs. This may require ongoing educational efforts, particularly given the new CMS guidelines accepting nonsubspecialist chest readers.7 Additionally, fellows and board-eligible residents may interpret images in academic settings and at VA facilities. The program needs to work closely with the pulmonary service to ensure that Lung-RADS 4 patients are promptly assessed. Radiologists and pulmonologists should calibrate the application of Lung-RADS categories to pulmonary nodules through jointly participating in meetings to review selected cases.
Challenges and Limitations
We faced some notable implementation challenges. The COVID-19 pandemic was extremely disruptive to LCS as it was to all health care. In addition, screening workflow processes were hampered by a lack of clinical reminders, which ideally would trigger for clinicians based on the tobacco history. The absence of this reminder meant that numerous patients were found to be ineligible for screening. We have a long-standing lung nodule clinic, and clinicians were confused about whether to order a surveillance imaging for an incidental nodule or a screening LDCT.
The radiology service was able to update order sets in CPRS to help guide clinicians in distinguishing indications and prerequisites for enrolling in LCS. This helped reduce the number of inappropriate orders and crossover orders between the VISN nodule tracking program and the LCS program.
Our results were preliminary and based on a small sample. We did not survey all veterans who underwent SDM, though the response rate was 79% and patient characteristics were similar to the larger cohort. Our results were potentially subject to selection bias, which could inflate the positive responses about decision quality and decisional conflict. However, the knowledge deficits are likely to be valid and suggest a need to better inform eligible veterans about the benefits and harms of screening. We did not have sufficient follow-up time to determine whether veterans were adherent to annual screenings. We showed that almost all those with abnormal imaging results completed diagnostic evaluations and/or were evaluated by pulmonary. As the program matures, we will be able to track outcomes related to cancer diagnoses and treatment.
Conclusions
A centralized LCS program was able to deliver SDM and enroll veterans in a screening program. While veterans were confident in their decision to screen and felt that they participated in decision making, knowledge testing indicated important deficits. Furthermore, we observed that many veterans did not meaningfully engage in SDM. Clinicians will need to frame the decision as patient centered at the time of referral, highlight the role of the NPC and importance of SDM, and be able to provide adequate decision support. The SDM visits can be enhanced by ensuring that veterans are able to review decision aids. Telemedicine is an acceptable and effective approach for supporting screening discussions, particularly for rural veterans.26
Acknowledgments
The authors thank the following individuals for their contributions to the study: John Paul Hornbeck, program support specialist; Kelly Miell, PhD; Bradley Mecham, PhD; Christopher C. Richards, MA; Bailey Noble, NP; Rebecca Barnhart, program analyst.
1. Zullig LL, Jackson GL, Dorn RA, et al. Cancer incidence among patients of the U.S. Veterans Affairs Health Care System. Mil Med. 2012;177(6):693-701. doi:10.7205/milmed-d-11-00434
2. Hoffman RM, Atallah RP, Struble RD, Badgett RG. Lung cancer screening with low-dose CT: a meta-analysis. J Gen Intern Med. 2020;35(10):3015-3025. doi:10.1007/s11606-020-05951-7
3. National Lung Screening Trial Research Team, Aberle DR, Adams AM, et al. Reduced lung-cancer mortality with low-dose computed tomographic screening. N Engl J Med. 2011;365(5):395-409. doi:10.1056/NEJMoa1102873
4. Moyer VA, US Preventive Services Task Force. Screening for lung cancer: U.S. Preventive Services Task Force recommendation statement. Ann Intern Med. 2014;160(5):330-338. doi:10.7326/M13-2771
5. Maurice NM, Tanner NT. Lung cancer screening at the VA: past, present and future. Semin Oncol. 2022;S0093-7754(22)00041-0. doi:10.1053/j.seminoncol.2022.06.001
6. Centers for Medicare & Medicaid Services. Screening for lung cancer with low dose computed tomography (LDCT) (CAG-00439N). Published 2015. Accessed July 10, 2023. http://www.cms.gov/medicare-coverage-database/details/nca-decision-memo.aspx?NCAId=274
7. Centers for Medicare & Medicaid Services. Screening for lung cancer with low dose computed tomography (LDCT) (CAG-00439R). Published 2022. Accessed July 10, 2023. https://www.cms.gov/medicare-coverage-database/view/ncacal-decision-memo.aspx?proposed=N&ncaid=304
8. National Academies of Sciences, Engineering, and Medicine; Health and Medicine Division; Board on Health Care Services; National Cancer Policy Forum. Implementation of Lung Cancer Screening: Proceedings of a Workshop. The National Academies Press; November 17, 2016. doi:10.172216/23680
9. Bernstein E, Bade BC, Akgün KM, Rose MG, Cain HC. Barriers and facilitators to lung cancer screening and follow-up. Semin Oncol. 2022;S0093-7754(22)00058-6. doi:10.1053/j.seminoncol.2022.07.004
10. US Preventive Services Task Force, Krist AH, Davidson KW, et al. Screening for lung cancer: US Preventive Services Task Force recommendation statement. JAMA. 2021;325(10):962-970. doi:10.1001/jama.2021.1117
11. Kinsinger LS, Atkins D, Provenzale D, Anderson C, Petzel R. Implementation of a new screening recommendation in health care: the Veterans Health Administration’s approach to lung cancer screening. Ann Intern Med. 2014;161(8):597-598. doi:10.7326/M14-1070
12. Lowenstein LM, Godoy MCB, Erasmus JJ, et al. Implementing decision coaching for lung cancer screening in the low-dose computed tomography setting. JCO Oncol Pract. 2020;16(8):e703-e725. doi:10.1200/JOP.19.00453
13. American College of Radiology Committee on Lung-RADS. Lung-RADS assessment categories 2022. Published November 2022. Accessed July 3, 2023. https://www.acr.org/-/media/ACR/Files/RADS/Lung-RADS/Lung-RADS-2022.pdf
14. Lowenstein LM, Richards VF, Leal VB, et al. A brief measure of smokers’ knowledge of lung cancer screening with low-dose computed tomography. Prev Med Rep. 2016;4:351-356. doi:10.1016/j.pmedr.2016.07.008
15. Elwyn G, Barr PJ, Grande SW, Thompson R, Walsh T, Ozanne EM. Developing CollaboRATE: a fast and frugal patient-reported measure of shared decision making in clinical encounters. Patient Educ Couns. 2013;93(1):102-107. doi:10.1016/j.pec.2013.05.009
16. Barr PJ, Thompson R, Walsh T, Grande SW, Ozanne EM, Elwyn G. The psychometric properties of CollaboRATE: a fast and frugal patient-reported measure of the shared decision-making process. J Med Internet Res. 2014;16(1):e2. doi:10.2196/jmir.3085
17. Légaré F, Kearing S, Clay K, et al. Are you SURE?: Assessing patient decisional conflict with a 4-item screening test. Can Fam Physician. 2010;56(8):e308-e314.
18. MacMahon H, Naidich DP, Goo JM, et al. Guidelines for management of incidental pulmonary nodules detected on CT images: from the Fleischner Society 2017. Radiology. 2017;284(1):228-243. doi:10.1148/radiol.2017161659
19. Wiener RS, Koppelman E, Bolton R, et al. Patient and clinician perspectives on shared decision-making in early adopting lung cancer screening programs: a qualitative study. J Gen Intern Med. 2018;33(7):1035-1042. doi:10.1007/s11606-018-4350-9
20. Zeliadt SB, Heffner JL, Sayre G, et al. Attitudes and perceptions about smoking cessation in the context of lung cancer screening. JAMA Intern Med. 2015;175(9):1530-1537. doi:10.1001/jamainternmed.2015.3558
21. Mazzone PJ, White CS, Kazerooni EA, Smith RA, Thomson CC. Proposed quality metrics for lung cancer screening programs: a National Lung Cancer Roundtable Project. Chest. 2021;160(1):368-378. doi:10.1016/j.chest.2021.01.063
22. Mazzone PJ, Tenenbaum A, Seeley M, et al. Impact of a lung cancer screening counseling and shared decision-making visit. Chest. 2017;151(3):572-578. doi:10.1016/j.chest.2016.10.027
23. Reuland DS, Cubillos L, Brenner AT, Harris RP, Minish B, Pignone MP. A pre-post study testing a lung cancer screening decision aid in primary care. BMC Med Inform Decis Mak. 2018;18(1):5. doi:10.1186/s12911-018-0582-1
24. Dharod A, Bellinger C, Foley K, Case LD, Miller D. The reach and feasibility of an interactive lung cancer screening decision aid delivered by patient portal. Appl Clin Inform. 2019;10(1):19-27. doi:10.1055/s-0038-1676807
25. Stacey D, Légaré F, Lewis K, et al. Decision aids for people facing health treatment or screening decisions. Cochrane Database Syst Rev. 2017;4:CD001431. doi:10.1002/14651858.CD001431.pub5
26. Tanner NT, Banas E, Yeager D, Dai L, Hughes Halbert C, Silvestri GA. In-person and telephonic shared decision-making visits for people considering lung cancer screening: an assessment of decision quality. Chest. 2019;155(1):236-238. doi:10.1016/j.chest.2018.07.046
Lung cancer is the second most frequently diagnosed cancer among US veterans and the leading cause of cancer death.1 Clinical trials have shown that annual screening of high-risk persons with low-dose computed tomography (LDCT) can reduce the risk of dying of lung cancer.2 In 2011, the National Lung Screening Trial (NLST) reported that over a 3-year period, annual LDCT screening reduced the risk of dying of lung cancer by 20% compared with chest radiograph screening.3 Lung cancer screening (LCS), however, was associated with harms, including false-positive results, complications from invasive diagnostic procedures, incidental findings, overdiagnosis, and radiation exposure.
The US Preventive Services Task Force (USPSTF) began recommending annual screening of high-risk persons after publication of the NLST results.4 The Veterans Health Administration (VHA) recommended implementing LCS in 2017.5 Guidelines, however, have consistently highlighted the complexity of the decision and the importance of engaging patients in thorough discussions about the potential benefits and harms of screening (shared decision making [SDM]). The Centers for Medicare and Medicaid Services (CMS) has issued coverage determinations mandating that eligible patients undergo a counseling visit that uses a decision aid to support SDM for LCS and addresses tobacco use.6,7 However, primary care practitioners (PCPs) face many challenges in delivering SDM, including a lack of awareness of clinical trial results and screening guidelines, competing clinical demands, being untrained in SDM, and not having educational resources.8 Patients in rural locations face travel burdens in attending counseling visits.9
We conducted a pilot study to address concerns with delivering SDM for LCS to veterans. We implemented a centralized screening model in which veterans were referred by clinicians to a trained decision coach who conducted telephone visits to discuss the initial LCS decision, addressed tobacco cessation, and placed LDCT orders. We evaluated the outcomes of this telemedicine visit by using decision quality metrics and tracking LCS uptake, referrals for tobacco cessation, and clinical outcomes. The University of Iowa Institutional Review Board considered this study to be a quality improvement project and waived informed consent and HIPAA (Health Insurance Portability and Accountability Act) authorization requirements.
Implementation
We implemented the LCS program at the Iowa City Veterans Affairs Health Care System (ICVAHCS), which has both resident and staff clinicians, and 2 community-based outpatient clinics (Coralville, Cedar Rapids) with staff clinicians. The pilot study, conducted from November 2020 through July 2022, was led by a multidisciplinary team that included a nurse, primary care physician, pulmonologist, and radiologist. The team conducted online presentations to educate PCPs about the epidemiology of lung cancer, results of screening trials, LCS guidelines, the rationale for a centralized model of SDM, and the ICVAHCS screening protocols.
Screening Referrals
When the study began in 2020, we used the 2015 USPSTF criteria for annual LCS: individuals aged 55 to 80 years with a 30 pack-year smoking history and current tobacco user or who had quit within 15 years.4 We lowered the starting age to 50 years and the pack-year requirement to 20 after the USPSTF issued updated guidelines in 2021.10 Clinicians were notified about potentially eligible patients through the US Department of Veterans Affairs (VA) Computerized Personal Record System (CPRS) reminders or by the nurse program coordinator (NPC) who reviewed health records of patients with upcoming appointments. If the clinician determined that screening was appropriate, they ordered an LCS consult. The NPC called the veteran to confirm eligibility, mailed a decision aid, and scheduled a telephone visit to conduct SDM. We used the VA decision aid developed for the LCS demonstration project conducted at 8 academic VA medical centers between 2013 and 2017.11
Shared Decision-Making Telephone Visit
The NPC adapted a telephone script developed for a Cancer Prevention and Research Institute of Texas–funded project conducted by 2 coauthors (RJV and LML).12 The NPC asked about receipt/review of the decision aid, described the screening process, and addressed benefits and potential harms of screening. The NPC also offered smoking cessation interventions for veterans who were currently smoking, including referrals to the VA patient aligned care team clinical pharmacist for management of tobacco cessation or to the national VA Quit Line. The encounter ended by assessing the veteran’s understanding of screening issues and eliciting the veteran’s preferences for LDCT and willingness to adhere with the LCS program.
LDCT Imaging
The NPC placed LDCT orders for veterans interested in screening and alerted the referring clinician to sign the order. Veterans who agreed to be screened were placed in an LCS dashboard developed by the Veterans Integrated Services Network (VISN) 23 LCS program that was used as a patient management tool. The dashboard allowed the NPC to track patients, ensuring that veterans were being scheduled for and completing initial and follow-up testing. Radiologists used the Lung-RADS (Lung Imaging Reporting and Data System) to categorize LDCT results (1, normal; 2, benign nodule; 3, probably benign nodule; 4, suspicious nodule).13 Veterans with Lung-RADS 1 or 2 results were scheduled for an annual LDCT (if they remained eligible). Veterans with Lung-RADS 3 results were scheduled for a 6-month follow-up CT. The screening program sent electronic consults to pulmonary for veterans with Lung-RADS 4 to determine whether they should undergo additional imaging or be evaluated in the pulmonary clinic.
Evaluating Shared Decision Making
We audio taped and transcribed randomly selected SDM encounters to assess fidelity with the 2016 CMS required discussion elements for counseling about lung cancer, including the benefit of reducing lung cancer mortality; the potential for harms from false alarms, incidental findings, overdiagnosis, and radiation exposure; the need for annual screening; the importance of smoking cessation; and the possibility of undergoing follow-up testing and diagnostic procedures. An investigator coded the transcripts to assess for the presence of each required element and scored the encounter from 0 to 7.
We also surveyed veterans completing SDM, using a convenience sampling strategy to evaluate knowledge, the quality of the SDM process, and decisional conflict. Initially, we sent mailed surveys to subjects to be completed 1 week after the SDM visit. To increase the response rate, we subsequently called patients to complete the surveys by telephone 1 week after the SDM visit.
We used the validated LCS-12 knowledge measure to assess awareness of lung cancer risks, screening eligibility, and the benefits and harms of screening.14 We evaluated the quality of the SDM visit by using the 3-item CollaboRATE scale (Table 1).15
The NPC also took field notes during interviews to help identify additional SDM issues. After each call, the NPC noted her impressions of the veteran’s engagement with SDM and understanding of the screening issues.
Clinical Outcomes
We used the screening dashboard and CPRS to track clinical outcomes, including screening uptake, referrals for tobacco cessation, appropriate (screening or diagnostic) follow-up testing, and cancer diagnoses. We used descriptive statistics to characterize demographic data and survey responses.
Initial Findings
We conducted 105 SDM telephone visits from November 2020 through July 2022 (Table 2).
We surveyed 47 of the veterans completing SDM visits (45%) and received 37 completed surveys (79%). All respondents were male, mean age 61.9 years, 89% White, 38% married/partnered, 70% rural, 65% currently smoking, with a mean 44.8 pack-years smoking history. On average, veterans answered 6.3 (53%) of knowledge questions correctly (Table 3).
Only 1 respondent (3%) correctly answered the multiple-choice question about indications for stopping screening. Two (5%) correctly answered the question on the magnitude of benefit, most overestimated or did not know. Similarly, 23 (62%) overestimated or did not know the predictive value of an abnormal scan. About two-thirds of veterans underestimated or did not know the attributable risk of lung cancer from tobacco, and about four-fifths did not know the mortality rank of lung cancer. Among the 37 respondents, 31 (84%) indicated not having any decisional conflict as defined by a score of 4 on the SURE scale.
Implementing SDM
The NPC’s field notes indicated that many veterans did not perceive any need to discuss the screening decision and believed that their PCP had referred them just for screening. However, they reported having cursory discussions with their PCP, being told that only their history of heavy tobacco use meant they should be screened. For veterans who had not read the decision aid, the NPC attempted to summarize benefits and harms. However, the discussions were often inadequate because the veterans were not interested in receiving information, particularly numerical data, or indicated that they had limited time for the call.
Seventy-two (69%) of the veterans who met with the NPC were currently smoking. Tobacco cessation counseling was offered to 66; 29 were referred to the VA Quit Line, 10 were referred to the tobacco cessation pharmacist, and the NPC contacted the PCPs for 9 patients who wanted prescriptions for nicotine replacement therapy.
After the SDM visit, 91 veterans (87%) agreed to screening. By the end of the study period, 73 veterans (80%) completed testing. Most veterans had Lung-RADS 1 or 2 results, 11 (1%) had a Lung-RADS 3, and 7 (10%) had a Lung-RADS 4. All 9 veterans with Lung-RADS 3 results and at least 6 months of follow-up underwent repeat imaging within 4 to 13 months (median, 7). All veterans with a Lung-RADS 4 result were referred to pulmonary. One patient was diagnosed with an early-stage non–small cell lung cancer.
We identified several problems with LDCT coding. Radiologists did not consistently use Lung-RADS when interpreting screening LDCTs; some used the Fleischner lung nodule criteria.18 We also found discordant readings for abnormal LDCTs, where the assigned Lung-RADS score was not consistent with the nodule description in the radiology report.
Discussion
Efforts to implement LCS with a telemedicine SDM intervention were mixed. An NPC-led SDM phone call was successfully incorporated into the clinical workflow. Most veterans identified as being eligible for screening participated in the counseling visit and underwent screening. However, they were often reluctant to engage in SDM, feeling that their clinician had already recommended screening and that there was no need for further discussion. Unfortunately, many veterans had not received or reviewed the decision aid and were not interested in receiving information about benefits and harms. Because we relied on telephone calls, we could not share visual information in real time.
Overall, the surveys indicated that most veterans were very satisfied with the quality of the discussion and reported feeling no decisional conflict. However, based on the NPC’s field notes and audio recordings, we believe that the responses may have reflected earlier discussions with the PCP that reportedly emphasized only the veteran’s eligibility for screening. The fidelity assessments indicated that the NPC consistently addressed the harms and benefits of screening.
Nonetheless, the performance on knowledge measures was uneven. Veterans were generally aware of harms, including false alarms, overdiagnosis, radiation exposure, and incidental findings. They did not, however, appreciate when screening should stop. They also underestimated the risks of developing lung cancer and the portion of that risk attributable to tobacco use, and overestimated the benefits of screening. These results suggest that the veterans, at least those who completed the surveys, may not be making well-informed decisions.
Our findings echo those of other VA investigators in finding knowledge deficits among screened veterans, including being unaware that LDCT was for LCS, believing that screening could prevent cancer, receiving little information about screening harms, and feeling that negative tests meant they were among the “lucky ones” who would avoid harm from continued smoking.19,20
The VA is currently implementing centralized screening models with the Lung Precision Oncology Program and the VA partnership to increase access to lung screening (VA-PALS).5 The centralized model, which readily supports the tracking, monitoring, and reporting needs of a screening program, also has advantages in delivering SDM because counselors have been trained in SDM, are more familiar with LCS evidence and processes, can better incorporate decision tools, and do not face the same time constraints as clinicians.21 However, studies have shown that most patients have already decided to be screened when they show up for the SDM visit.22 In contrast, about one-third of patients in primary care settings who receive decision support chose not to be screened.23,24 We found that 13% of our patients decided against screening after a telephone discussion, suggesting that a virtually conducted SDM visit can meaningfully support decision making. Telemedicine also may reduce health inequities in centralized models arising from patients having limited access to screening centers.
Our results suggest that PCPs referring patients to a centralized program, even for virtual visits, should frame the decision to initiate LCS as SDM, where an informed patient is being supported in making a decision consistent with their values and preferences. Furthermore, engaging patients in SDM should not be construed as endorsing screening. When centralized support is less available, individual clinics may need to provide SDM, perhaps using a nonclinician decision coach if clinicians lack the time to lead the discussions. Decision coaches have been effectively used to increase patients’ knowledge about the benefits and harms of screening.12 Regardless of the program model, PCPs will also be responsible for determining whether patients are healthy enough to undergo invasive diagnostic testing and treatment and ensuring that tobacco use is addressed.
SDM delivered in any setting will be enhanced by ensuring that patients are provided with decision aids before a counseling visit. This will help them better understand the benefits and harms of screening and the need to elicit values. The discussion can then focus on areas of concern or questions raised by reviewing the decision aid. The clinician and patient could also use a decision aid during either a face-to-face or video clinical encounter to facilitate SDM. A Cochrane review has shown that using decision aids for people facing screening decisions increases knowledge, reduces decisional conflict, and effectively elicits values and preferences.25 Providing high-quality decision support is a patient-centered approach that respects a patient’s autonomy and may promote health equity and improve adherence.
We recognized the importance of having a multidisciplinary team, involving primary care, radiology, pulmonary, and nursing, with a shared understanding of the screening processes. These are essential features for a high-quality screening program where eligible veterans are readily identified and receive prompt and appropriate follow-up. Radiologists need to use Lung-RADS categories consistently and appropriately when reading LDCTs. This may require ongoing educational efforts, particularly given the new CMS guidelines accepting nonsubspecialist chest readers.7 Additionally, fellows and board-eligible residents may interpret images in academic settings and at VA facilities. The program needs to work closely with the pulmonary service to ensure that Lung-RADS 4 patients are promptly assessed. Radiologists and pulmonologists should calibrate the application of Lung-RADS categories to pulmonary nodules through jointly participating in meetings to review selected cases.
Challenges and Limitations
We faced some notable implementation challenges. The COVID-19 pandemic was extremely disruptive to LCS as it was to all health care. In addition, screening workflow processes were hampered by a lack of clinical reminders, which ideally would trigger for clinicians based on the tobacco history. The absence of this reminder meant that numerous patients were found to be ineligible for screening. We have a long-standing lung nodule clinic, and clinicians were confused about whether to order a surveillance imaging for an incidental nodule or a screening LDCT.
The radiology service was able to update order sets in CPRS to help guide clinicians in distinguishing indications and prerequisites for enrolling in LCS. This helped reduce the number of inappropriate orders and crossover orders between the VISN nodule tracking program and the LCS program.
Our results were preliminary and based on a small sample. We did not survey all veterans who underwent SDM, though the response rate was 79% and patient characteristics were similar to the larger cohort. Our results were potentially subject to selection bias, which could inflate the positive responses about decision quality and decisional conflict. However, the knowledge deficits are likely to be valid and suggest a need to better inform eligible veterans about the benefits and harms of screening. We did not have sufficient follow-up time to determine whether veterans were adherent to annual screenings. We showed that almost all those with abnormal imaging results completed diagnostic evaluations and/or were evaluated by pulmonary. As the program matures, we will be able to track outcomes related to cancer diagnoses and treatment.
Conclusions
A centralized LCS program was able to deliver SDM and enroll veterans in a screening program. While veterans were confident in their decision to screen and felt that they participated in decision making, knowledge testing indicated important deficits. Furthermore, we observed that many veterans did not meaningfully engage in SDM. Clinicians will need to frame the decision as patient centered at the time of referral, highlight the role of the NPC and importance of SDM, and be able to provide adequate decision support. The SDM visits can be enhanced by ensuring that veterans are able to review decision aids. Telemedicine is an acceptable and effective approach for supporting screening discussions, particularly for rural veterans.26
Acknowledgments
The authors thank the following individuals for their contributions to the study: John Paul Hornbeck, program support specialist; Kelly Miell, PhD; Bradley Mecham, PhD; Christopher C. Richards, MA; Bailey Noble, NP; Rebecca Barnhart, program analyst.
1. Zullig LL, Jackson GL, Dorn RA, et al. Cancer incidence among patients of the U.S. Veterans Affairs Health Care System. Mil Med. 2012;177(6):693-701. doi:10.7205/milmed-d-11-00434
2. Hoffman RM, Atallah RP, Struble RD, Badgett RG. Lung cancer screening with low-dose CT: a meta-analysis. J Gen Intern Med. 2020;35(10):3015-3025. doi:10.1007/s11606-020-05951-7
3. National Lung Screening Trial Research Team, Aberle DR, Adams AM, et al. Reduced lung-cancer mortality with low-dose computed tomographic screening. N Engl J Med. 2011;365(5):395-409. doi:10.1056/NEJMoa1102873
4. Moyer VA, US Preventive Services Task Force. Screening for lung cancer: U.S. Preventive Services Task Force recommendation statement. Ann Intern Med. 2014;160(5):330-338. doi:10.7326/M13-2771
5. Maurice NM, Tanner NT. Lung cancer screening at the VA: past, present and future. Semin Oncol. 2022;S0093-7754(22)00041-0. doi:10.1053/j.seminoncol.2022.06.001
6. Centers for Medicare & Medicaid Services. Screening for lung cancer with low dose computed tomography (LDCT) (CAG-00439N). Published 2015. Accessed July 10, 2023. http://www.cms.gov/medicare-coverage-database/details/nca-decision-memo.aspx?NCAId=274
7. Centers for Medicare & Medicaid Services. Screening for lung cancer with low dose computed tomography (LDCT) (CAG-00439R). Published 2022. Accessed July 10, 2023. https://www.cms.gov/medicare-coverage-database/view/ncacal-decision-memo.aspx?proposed=N&ncaid=304
8. National Academies of Sciences, Engineering, and Medicine; Health and Medicine Division; Board on Health Care Services; National Cancer Policy Forum. Implementation of Lung Cancer Screening: Proceedings of a Workshop. The National Academies Press; November 17, 2016. doi:10.172216/23680
9. Bernstein E, Bade BC, Akgün KM, Rose MG, Cain HC. Barriers and facilitators to lung cancer screening and follow-up. Semin Oncol. 2022;S0093-7754(22)00058-6. doi:10.1053/j.seminoncol.2022.07.004
10. US Preventive Services Task Force, Krist AH, Davidson KW, et al. Screening for lung cancer: US Preventive Services Task Force recommendation statement. JAMA. 2021;325(10):962-970. doi:10.1001/jama.2021.1117
11. Kinsinger LS, Atkins D, Provenzale D, Anderson C, Petzel R. Implementation of a new screening recommendation in health care: the Veterans Health Administration’s approach to lung cancer screening. Ann Intern Med. 2014;161(8):597-598. doi:10.7326/M14-1070
12. Lowenstein LM, Godoy MCB, Erasmus JJ, et al. Implementing decision coaching for lung cancer screening in the low-dose computed tomography setting. JCO Oncol Pract. 2020;16(8):e703-e725. doi:10.1200/JOP.19.00453
13. American College of Radiology Committee on Lung-RADS. Lung-RADS assessment categories 2022. Published November 2022. Accessed July 3, 2023. https://www.acr.org/-/media/ACR/Files/RADS/Lung-RADS/Lung-RADS-2022.pdf
14. Lowenstein LM, Richards VF, Leal VB, et al. A brief measure of smokers’ knowledge of lung cancer screening with low-dose computed tomography. Prev Med Rep. 2016;4:351-356. doi:10.1016/j.pmedr.2016.07.008
15. Elwyn G, Barr PJ, Grande SW, Thompson R, Walsh T, Ozanne EM. Developing CollaboRATE: a fast and frugal patient-reported measure of shared decision making in clinical encounters. Patient Educ Couns. 2013;93(1):102-107. doi:10.1016/j.pec.2013.05.009
16. Barr PJ, Thompson R, Walsh T, Grande SW, Ozanne EM, Elwyn G. The psychometric properties of CollaboRATE: a fast and frugal patient-reported measure of the shared decision-making process. J Med Internet Res. 2014;16(1):e2. doi:10.2196/jmir.3085
17. Légaré F, Kearing S, Clay K, et al. Are you SURE?: Assessing patient decisional conflict with a 4-item screening test. Can Fam Physician. 2010;56(8):e308-e314.
18. MacMahon H, Naidich DP, Goo JM, et al. Guidelines for management of incidental pulmonary nodules detected on CT images: from the Fleischner Society 2017. Radiology. 2017;284(1):228-243. doi:10.1148/radiol.2017161659
19. Wiener RS, Koppelman E, Bolton R, et al. Patient and clinician perspectives on shared decision-making in early adopting lung cancer screening programs: a qualitative study. J Gen Intern Med. 2018;33(7):1035-1042. doi:10.1007/s11606-018-4350-9
20. Zeliadt SB, Heffner JL, Sayre G, et al. Attitudes and perceptions about smoking cessation in the context of lung cancer screening. JAMA Intern Med. 2015;175(9):1530-1537. doi:10.1001/jamainternmed.2015.3558
21. Mazzone PJ, White CS, Kazerooni EA, Smith RA, Thomson CC. Proposed quality metrics for lung cancer screening programs: a National Lung Cancer Roundtable Project. Chest. 2021;160(1):368-378. doi:10.1016/j.chest.2021.01.063
22. Mazzone PJ, Tenenbaum A, Seeley M, et al. Impact of a lung cancer screening counseling and shared decision-making visit. Chest. 2017;151(3):572-578. doi:10.1016/j.chest.2016.10.027
23. Reuland DS, Cubillos L, Brenner AT, Harris RP, Minish B, Pignone MP. A pre-post study testing a lung cancer screening decision aid in primary care. BMC Med Inform Decis Mak. 2018;18(1):5. doi:10.1186/s12911-018-0582-1
24. Dharod A, Bellinger C, Foley K, Case LD, Miller D. The reach and feasibility of an interactive lung cancer screening decision aid delivered by patient portal. Appl Clin Inform. 2019;10(1):19-27. doi:10.1055/s-0038-1676807
25. Stacey D, Légaré F, Lewis K, et al. Decision aids for people facing health treatment or screening decisions. Cochrane Database Syst Rev. 2017;4:CD001431. doi:10.1002/14651858.CD001431.pub5
26. Tanner NT, Banas E, Yeager D, Dai L, Hughes Halbert C, Silvestri GA. In-person and telephonic shared decision-making visits for people considering lung cancer screening: an assessment of decision quality. Chest. 2019;155(1):236-238. doi:10.1016/j.chest.2018.07.046
Naltrexone: a Novel Approach to Pruritus in Polycythemia Vera
P ruritus is a characteristic and often debilitating clinical manifestation reported by about 50% of patients with polycythemia vera (PV). The exact pathophysiology of PV-associated pruritus is poorly understood. The itch sensation may arise from a central phenomenon without skin itch receptor involvement, as is seen in opioid-induced pruritus, or peripherally via unmyelinated C fibers. Various interventions have been used with mixed results for symptom management in this patient population.1
Selective serotonin reuptake inhibitors (SSRIs), such as paroxetine and fluoxetine, have historically demonstrated some efficacy in treating PV-associated pruritus.2 Alongside SSRIs, phlebotomy, antihistamines, phototherapy, interferon a, and myelosuppressive medications also comprise the various current treatment options. In addition to lacking efficacy, antihistamines can cause somnolence, constipation, and xerostomia.3,4 Phlebotomy and cytoreductive therapy are often effective in controlling erythrocytosis but fail to alleviate the disabling pruritus.1,5,6 More recently, suboptimal symptom alleviation has prompted the discovery of agents that target the mammalian target of rapamycin (mTOR) and Janus kinase 2 (Jak2) pathways.1
Naltrexone is an opioid antagonist shown to suppress pruritus in various dermatologic pathologies involving histamine-independent pathways.3,7,8 A systematic search strategy identified 34 studies on PV-associated pruritus, its pathophysiology and interventions, and naltrexone as a therapeutic agent. Only 1 study in the literature has described the use of naltrexone for uremic and cholestatic pruritus.9 We describe the successful use of naltrexone monotherapy for the treatment of pruritus in a patient with PV.
Case Presentation
A 40-year-old man with Jak2-positive PV treated with ruxolitinib presented to the outpatient Michael E. DeBakey Veterans Affairs Medical Center Supportive Care Clinic in Houston, Texas, for severe refractory pruritus. Wheals manifested in pruritic regions of the patient’s skin without gross excoriations or erythema. Pruritus reportedly began diffusely across the posterior torso. Through the rapid progression of an episode lasting 30 to 45 minutes, the lesions and pruritus would spread to the anterior torso, extend to the upper extremities bilaterally, and finally descend to the lower extremities bilaterally. A persistent sensation of heat or warmth on the patient’s skin was present, and periodically, this would culminate in a burning sensation comparable to “lying flat on one’s back directly on a hornet’s nest…[followed by] a million stings” that was inconsistent with erythromelalgia given the absence of erythema. The intensity of the pruritic episodes was subjectively also described as “enough to make [him] want to jump off the roof of a building…[causing] moments of deep, deep frustration…[and] the worst of all the symptoms one may encounter because of [PV].”
Pruritus was exacerbated by sweating, heat, contact with any liquids on the skin, and sunburns, which doubled the intensity. The patient reported minimal, temporary relief with cannabidiol and cold fabric or air on his skin. His current regimen and nonpharmacologic efforts provided no relief and included oatmeal baths, cornstarch after showers, and patting instead of rubbing the skin with topical products. Trials with nonprescription diphenhydramine, loratadine, and calamine and zinc were not successful. He had not pursued phototherapy due to time limitations and travel constraints. He had a history of phlebotomies and hydroxyurea use, which he preferred to avoid and discontinued 1 year before presentation.
Despite improving hematocrit (< 45% goal) and platelet counts with ruxolitinib, the patient reported worsening pruritus that significantly impaired quality of life. His sleep and social and physical activities were hindered, preventing him from working. The patient’s active medications also included low-dose aspirin, sertraline, hydroxyzine, triamcinolone acetonide, and pregabalin for sciatica. Given persistent symptoms despite multimodal therapy and lifestyle modifications, the patient was started on naltrexone 25 mg daily, which provided immediate relief of symptoms. He continues to have adequate symptom control 2 years after naltrexone initiation.
Literature Review
A systematic search strategy was developed with the assistance of a medical librarian in Medline Ovid, using both Medical Subject Heading (MeSH) terms and synonymous keywords. The strategy was then translated to Embase, Web of Science, and Cochrane to extract publications investigating PV, pruritus, and/or naltrexone therapy. All searches were conducted on July 18, 2022, and the results of the literature review were as follows: 2 results from Medline Ovid; 34 results from Embase (2 were duplicates of Medline Ovid results); 3 results from Web of Science (all of which were duplicates of Medline Ovid or Embase results); and 0 results from Cochrane (Figure).
Discussion
Although pruritus is a common and often excruciating manifestation of PV, its pathophysiology remains unclear. Some patients with decreasing or newly normal hematocrit and hemoglobin levels have paradoxically experienced an intensification of their pruritus, which introduces erythropoietin signaling pathways as a potential mechanism of the symptom.8 However, iron replacement therapy for patients with exacerbated pruritus after phlebotomies has not demonstrated consistent relief of pruritus.8 Normalization of platelet levels also has not been historically associated with improvement of pruritus.8,9 It has been hypothesized that cells harboring Jak2 mutations at any stage of the hematopoietic pathway mature and accumulate to cause pruritus in PV.9 This theory has been foundational in the development of drugs with activity against cells expressing Jak2 mutations and interventions targeting histamine-releasing mast cells.9-11
The effective use of naltrexone in our patient suggests that histamine may not be the most effective or sole therapeutic target against pruritus in PV. Naltrexone targets opioid receptors in all layers of the epidermis, affecting cell adhesion and keratinocyte production, and exhibits anti-inflammatory effects through interactions with nonopioid receptors, including Toll-like receptor 4.12 The efficacy of oral naltrexone has been documented in patients with pruritus associated with immune checkpoint inhibitors, psoriasis, eczema, lichen simplex chronicus, prurigo nodularis, cholestasis, uremia, and multiple rheumatologic diseases.3,4,7-9,12-14 Opioid pathways also may be involved in peripheral and/or central processing of pruritus associated with PV.
Importantly, patients who are potential candidates for naltrexone therapy should be notified and advised of the risk of drug interactions with opioids, which could lead to symptoms of opioid withdrawal. Other common adverse effects of naltrexone include hepatotoxicity (especially in patients with a history of significant alcohol consumption), abdominal pain, nausea, arthralgias, myalgias, insomnia, headaches, fatigue, and anxiety.12 Therefore, it is integral to screen patients for opioid dependence and determine their baseline liver function. Patients should be monitored following naltrexone initiation to determine whether the drug is an appropriate and effective intervention against PV-associated pruritus.
CONCLUSIONS
This case study demonstrates that naltrexone may be a safe, effective, nonsedating, and cost-efficient oral alternative for refractory PV-associated pruritus. Future directions involve consideration of case series or randomized clinical trials investigating the efficacy of naltrexone in treating PV-associated pruritus. Further research is also warranted to better understand the pathophysiology of this symptom of PV to enhance and potentially expand medical management for patients.
Acknowledgments
The authors thank Amy Sisson (The Texas Medical Center Library) for her guidance and support in the literature review methodology.
1. Saini KS, Patnaik MM, Tefferi A. Polycythemia vera-associated pruritus and its management. Eur J Clin Invest. 2010;40(9):828-834. doi:10.1111/j.1365-2362.2010.02334.x
2. Tefferi A, Fonseca R. Selective serotonin reuptake inhibitors are effective in the treatment of polycythemia vera-associated pruritus. Blood. 2002;99(7):2627. doi:10.1182/blood.v99.7.2627
3. Lee J, Shin JU, Noh S, Park CO, Lee KH. Clinical efficacy and safety of naltrexone combination therapy in older patients with severe pruritus. Ann Dermatol. 2016;28(2):159-163. doi:10.5021/ad.2016.28.2.159
4. Phan NQ, Bernhard JD, Luger TA, Stander S. Antipruritic treatment with systemic mu-opioid receptor antagonists: a review. J Am Acad Dermatol. 2010;63(4):680-688. doi:10.1016/j.jaad.2009.08.052
5. Metze D, Reimann S, Beissert S, Luger T. Efficacy and safety of naltrexone, an oral opiate receptor antagonist, in the treatment of pruritus in internal and dermatological diseases. J Am Acad Dermatol. 1999;41(4):533-539.
6. Malekzad F, Arbabi M, Mohtasham N, et al. Efficacy of oral naltrexone on pruritus in atopic eczema: a double-blind, placebo-controlled study. J Eur Acad Dermatol Venereol. 2009;23(8):948-950. doi:10.1111/j.1468-3083.2009.03129.x
7. Terg R, Coronel E, Sorda J, Munoz AE, Findor J. Efficacy and safety of oral naltrexone treatment for pruritus of cholestasis, a crossover, double blind, placebo-controlled study. J Hepatol. 2002;37(6):717-722. doi:10.1016/s0168-8278(02)00318-5
8. Lelonek E, Matusiak L, Wrobel T, Szepietowski JC. Aquagenic pruritus in polycythemia vera: clinical characteristics. Acta Derm Venereol. 2018;98(5):496-500. doi:10.2340/00015555-2906
9. Siegel FP, Tauscher J, Petrides PE. Aquagenic pruritus in polycythemia vera: characteristics and influence on quality of life in 441 patients. Am J Hematol. 2013;88(8):665-669. doi:10.1002/ajh.23474
10. Al-Mashdali AF, Kashgary WR, Yassin MA. Ruxolitinib (a JAK2 inhibitor) as an emerging therapy for refractory pruritis in a patient with low-risk polycythemia vera: a case report. Medicine (Baltimore). 2021;100(44):e27722. doi:10.1097/MD.0000000000027722
11. Benevolo G, Vassallo F, Urbino I, Giai V. Polycythemia vera (PV): update on emerging treatment options. Ther Clin Risk Manag. 2021;17:209-221. doi:10.2147/TCRM.S213020
12. Lee B, Elston DM. The uses of naltrexone in dermatologic conditions. J Am Acad Dermatol. 2019;80(6):1746-1752. doi:10.1016/j.jaad.2018.12.031
13. de Carvalho JF, Skare T. Low-dose naltrexone in rheumatological diseases. Mediterr J Rheumatol. 2023;34(1):1-6. doi:10.31138/mjr.34.1.1
14. Singh R, Patel P, Thakker M, Sharma P, Barnes M, Montana S. Naloxone and maintenance naltrexone as novel and effective therapies for immunotherapy-induced pruritus: a case report and brief literature review. J Oncol Pract. 2019;15(6):347-348. doi:10.1200/JOP.18.00797
P ruritus is a characteristic and often debilitating clinical manifestation reported by about 50% of patients with polycythemia vera (PV). The exact pathophysiology of PV-associated pruritus is poorly understood. The itch sensation may arise from a central phenomenon without skin itch receptor involvement, as is seen in opioid-induced pruritus, or peripherally via unmyelinated C fibers. Various interventions have been used with mixed results for symptom management in this patient population.1
Selective serotonin reuptake inhibitors (SSRIs), such as paroxetine and fluoxetine, have historically demonstrated some efficacy in treating PV-associated pruritus.2 Alongside SSRIs, phlebotomy, antihistamines, phototherapy, interferon a, and myelosuppressive medications also comprise the various current treatment options. In addition to lacking efficacy, antihistamines can cause somnolence, constipation, and xerostomia.3,4 Phlebotomy and cytoreductive therapy are often effective in controlling erythrocytosis but fail to alleviate the disabling pruritus.1,5,6 More recently, suboptimal symptom alleviation has prompted the discovery of agents that target the mammalian target of rapamycin (mTOR) and Janus kinase 2 (Jak2) pathways.1
Naltrexone is an opioid antagonist shown to suppress pruritus in various dermatologic pathologies involving histamine-independent pathways.3,7,8 A systematic search strategy identified 34 studies on PV-associated pruritus, its pathophysiology and interventions, and naltrexone as a therapeutic agent. Only 1 study in the literature has described the use of naltrexone for uremic and cholestatic pruritus.9 We describe the successful use of naltrexone monotherapy for the treatment of pruritus in a patient with PV.
Case Presentation
A 40-year-old man with Jak2-positive PV treated with ruxolitinib presented to the outpatient Michael E. DeBakey Veterans Affairs Medical Center Supportive Care Clinic in Houston, Texas, for severe refractory pruritus. Wheals manifested in pruritic regions of the patient’s skin without gross excoriations or erythema. Pruritus reportedly began diffusely across the posterior torso. Through the rapid progression of an episode lasting 30 to 45 minutes, the lesions and pruritus would spread to the anterior torso, extend to the upper extremities bilaterally, and finally descend to the lower extremities bilaterally. A persistent sensation of heat or warmth on the patient’s skin was present, and periodically, this would culminate in a burning sensation comparable to “lying flat on one’s back directly on a hornet’s nest…[followed by] a million stings” that was inconsistent with erythromelalgia given the absence of erythema. The intensity of the pruritic episodes was subjectively also described as “enough to make [him] want to jump off the roof of a building…[causing] moments of deep, deep frustration…[and] the worst of all the symptoms one may encounter because of [PV].”
Pruritus was exacerbated by sweating, heat, contact with any liquids on the skin, and sunburns, which doubled the intensity. The patient reported minimal, temporary relief with cannabidiol and cold fabric or air on his skin. His current regimen and nonpharmacologic efforts provided no relief and included oatmeal baths, cornstarch after showers, and patting instead of rubbing the skin with topical products. Trials with nonprescription diphenhydramine, loratadine, and calamine and zinc were not successful. He had not pursued phototherapy due to time limitations and travel constraints. He had a history of phlebotomies and hydroxyurea use, which he preferred to avoid and discontinued 1 year before presentation.
Despite improving hematocrit (< 45% goal) and platelet counts with ruxolitinib, the patient reported worsening pruritus that significantly impaired quality of life. His sleep and social and physical activities were hindered, preventing him from working. The patient’s active medications also included low-dose aspirin, sertraline, hydroxyzine, triamcinolone acetonide, and pregabalin for sciatica. Given persistent symptoms despite multimodal therapy and lifestyle modifications, the patient was started on naltrexone 25 mg daily, which provided immediate relief of symptoms. He continues to have adequate symptom control 2 years after naltrexone initiation.
Literature Review
A systematic search strategy was developed with the assistance of a medical librarian in Medline Ovid, using both Medical Subject Heading (MeSH) terms and synonymous keywords. The strategy was then translated to Embase, Web of Science, and Cochrane to extract publications investigating PV, pruritus, and/or naltrexone therapy. All searches were conducted on July 18, 2022, and the results of the literature review were as follows: 2 results from Medline Ovid; 34 results from Embase (2 were duplicates of Medline Ovid results); 3 results from Web of Science (all of which were duplicates of Medline Ovid or Embase results); and 0 results from Cochrane (Figure).
Discussion
Although pruritus is a common and often excruciating manifestation of PV, its pathophysiology remains unclear. Some patients with decreasing or newly normal hematocrit and hemoglobin levels have paradoxically experienced an intensification of their pruritus, which introduces erythropoietin signaling pathways as a potential mechanism of the symptom.8 However, iron replacement therapy for patients with exacerbated pruritus after phlebotomies has not demonstrated consistent relief of pruritus.8 Normalization of platelet levels also has not been historically associated with improvement of pruritus.8,9 It has been hypothesized that cells harboring Jak2 mutations at any stage of the hematopoietic pathway mature and accumulate to cause pruritus in PV.9 This theory has been foundational in the development of drugs with activity against cells expressing Jak2 mutations and interventions targeting histamine-releasing mast cells.9-11
The effective use of naltrexone in our patient suggests that histamine may not be the most effective or sole therapeutic target against pruritus in PV. Naltrexone targets opioid receptors in all layers of the epidermis, affecting cell adhesion and keratinocyte production, and exhibits anti-inflammatory effects through interactions with nonopioid receptors, including Toll-like receptor 4.12 The efficacy of oral naltrexone has been documented in patients with pruritus associated with immune checkpoint inhibitors, psoriasis, eczema, lichen simplex chronicus, prurigo nodularis, cholestasis, uremia, and multiple rheumatologic diseases.3,4,7-9,12-14 Opioid pathways also may be involved in peripheral and/or central processing of pruritus associated with PV.
Importantly, patients who are potential candidates for naltrexone therapy should be notified and advised of the risk of drug interactions with opioids, which could lead to symptoms of opioid withdrawal. Other common adverse effects of naltrexone include hepatotoxicity (especially in patients with a history of significant alcohol consumption), abdominal pain, nausea, arthralgias, myalgias, insomnia, headaches, fatigue, and anxiety.12 Therefore, it is integral to screen patients for opioid dependence and determine their baseline liver function. Patients should be monitored following naltrexone initiation to determine whether the drug is an appropriate and effective intervention against PV-associated pruritus.
CONCLUSIONS
This case study demonstrates that naltrexone may be a safe, effective, nonsedating, and cost-efficient oral alternative for refractory PV-associated pruritus. Future directions involve consideration of case series or randomized clinical trials investigating the efficacy of naltrexone in treating PV-associated pruritus. Further research is also warranted to better understand the pathophysiology of this symptom of PV to enhance and potentially expand medical management for patients.
Acknowledgments
The authors thank Amy Sisson (The Texas Medical Center Library) for her guidance and support in the literature review methodology.
1. Saini KS, Patnaik MM, Tefferi A. Polycythemia vera-associated pruritus and its management. Eur J Clin Invest. 2010;40(9):828-834. doi:10.1111/j.1365-2362.2010.02334.x
2. Tefferi A, Fonseca R. Selective serotonin reuptake inhibitors are effective in the treatment of polycythemia vera-associated pruritus. Blood. 2002;99(7):2627. doi:10.1182/blood.v99.7.2627
3. Lee J, Shin JU, Noh S, Park CO, Lee KH. Clinical efficacy and safety of naltrexone combination therapy in older patients with severe pruritus. Ann Dermatol. 2016;28(2):159-163. doi:10.5021/ad.2016.28.2.159
4. Phan NQ, Bernhard JD, Luger TA, Stander S. Antipruritic treatment with systemic mu-opioid receptor antagonists: a review. J Am Acad Dermatol. 2010;63(4):680-688. doi:10.1016/j.jaad.2009.08.052
5. Metze D, Reimann S, Beissert S, Luger T. Efficacy and safety of naltrexone, an oral opiate receptor antagonist, in the treatment of pruritus in internal and dermatological diseases. J Am Acad Dermatol. 1999;41(4):533-539.
6. Malekzad F, Arbabi M, Mohtasham N, et al. Efficacy of oral naltrexone on pruritus in atopic eczema: a double-blind, placebo-controlled study. J Eur Acad Dermatol Venereol. 2009;23(8):948-950. doi:10.1111/j.1468-3083.2009.03129.x
7. Terg R, Coronel E, Sorda J, Munoz AE, Findor J. Efficacy and safety of oral naltrexone treatment for pruritus of cholestasis, a crossover, double blind, placebo-controlled study. J Hepatol. 2002;37(6):717-722. doi:10.1016/s0168-8278(02)00318-5
8. Lelonek E, Matusiak L, Wrobel T, Szepietowski JC. Aquagenic pruritus in polycythemia vera: clinical characteristics. Acta Derm Venereol. 2018;98(5):496-500. doi:10.2340/00015555-2906
9. Siegel FP, Tauscher J, Petrides PE. Aquagenic pruritus in polycythemia vera: characteristics and influence on quality of life in 441 patients. Am J Hematol. 2013;88(8):665-669. doi:10.1002/ajh.23474
10. Al-Mashdali AF, Kashgary WR, Yassin MA. Ruxolitinib (a JAK2 inhibitor) as an emerging therapy for refractory pruritis in a patient with low-risk polycythemia vera: a case report. Medicine (Baltimore). 2021;100(44):e27722. doi:10.1097/MD.0000000000027722
11. Benevolo G, Vassallo F, Urbino I, Giai V. Polycythemia vera (PV): update on emerging treatment options. Ther Clin Risk Manag. 2021;17:209-221. doi:10.2147/TCRM.S213020
12. Lee B, Elston DM. The uses of naltrexone in dermatologic conditions. J Am Acad Dermatol. 2019;80(6):1746-1752. doi:10.1016/j.jaad.2018.12.031
13. de Carvalho JF, Skare T. Low-dose naltrexone in rheumatological diseases. Mediterr J Rheumatol. 2023;34(1):1-6. doi:10.31138/mjr.34.1.1
14. Singh R, Patel P, Thakker M, Sharma P, Barnes M, Montana S. Naloxone and maintenance naltrexone as novel and effective therapies for immunotherapy-induced pruritus: a case report and brief literature review. J Oncol Pract. 2019;15(6):347-348. doi:10.1200/JOP.18.00797
A Case Series of Rare Immune-Mediated Adverse Reactions at the New Mexico Veterans Affairs Medical Center
Immune checkpoint inhibitors (ICIs), often broadly referred to as immunotherapy, are being prescribed at increasing rates due to their effectiveness in treating a growing number of advanced solid tumors and hematologic malignancies.1 It has been well established that T-cell signaling mechanisms designed to combat foreign pathogens have been involved in the mitigation of tumor proliferation.2 This protective process can be supported or restricted by infection, medication, or mutations.
ICIs support T-cell–mediated destruction of tumor cells by inhibiting the mechanisms designed to limit autoimmunity, specifically the programmed cell death protein 1/programmed cell death ligand 1 (PD-1/PD-L1) and cytotoxic T-lymphocyte–associated antigen 4 (CTLA-4) pathways. The results have been impressive, leading to an expansive number of US Food and Drug Administration (FDA) approvals across a diverse set of malignancies. Consequently, the Nobel Prize in Physiology or Medicine was awarded for such work in 2018.3
BACKGROUND
While altering these pathways has been shown to hinder tumor growth, the lesser restrictions on the immune system can drive unwanted autoimmune inflammation to host tissue. These toxicities are collectively known as immune-mediated adverse reactions (IMARs). Clinically and histologically, IMARs frequently manifest similarly to other autoimmune conditions and may affect any organ, including skin, liver, lungs, heart, intestine (small and large), kidneys, eyes, endocrine glands, and neurologic tissue.4,5 According to recent studies, as many as 20% to 30% of patients receiving a single ICI will experience at least 1 clinically significant IMAR, and about 13% are classified as severe; however, < 10% of patients will have their ICIs discontinued due to these reactions.6
Though infrequent, a thorough understanding of the severity of IMARs to ICIs is critical for the diagnosis and management of these organ-threatening and potentially life-threatening toxicities. With the growing use of these agents and more FDA approvals for dual checkpoint blockage (concurrent use of CTLA-4 and PD-1/PD-L1 inhibitors), the absolute number of IMARs is expected to rise, thereby leading to more exposure of such events to both oncology and nononcology clinicians. Prior literature has clearly described the treatments and outcomes for many common severe toxicities; however, information regarding presentations and outcomes for rare IMARs is lacking.7
A few fascinating cases of rare toxicities have been observed at the New Mexico Veterans Affairs Medical Center (NMVAMC) in Albuquerque despite its relatively small size compared with other US Department of Veterans Affairs medical centers. As such, herein, the diagnostic evaluation, treatments, and outcomes of rare IMARs are reported for each case, and the related literature is reviewed.
Patient Selection
Patients who were required to discontinue or postpone treatment with any ICI blocking the CTLA-4 (ipilimumab), PD-1 (pembrolizumab, nivolumab, cemiplimab), or PD-L1 (atezolizumab, avelumab, durvalumab) pathways between 2015 to 2021 due to toxicity at the NMVAMC were eligible for inclusion. The electronic health record was reviewed for each eligible case, and the patient demographics, disease characteristics, toxicities, and outcomes were documented for each patient. For the 57 patients who received ICIs within the chosen period, 11 required a treatment break or discontinuation. Of these, 3 cases were selected for reporting due to the rare IMARs observed. This study was approved by the NMVAMC Institutional Review Board.
Case 1: Myocarditis
An 84-year-old man receiving a chemoimmunotherapy regimen consisting of carboplatin, pemetrexed, and pembrolizumab for recurrent, stage IV lung adenocarcinoma developed grade 4 cardiomyopathy, as defined by the Common Terminology Criteria for Adverse Events (CTCAE) v5.0, during his treatment.8 He was treated for 2 cycles before he began experiencing an increase in liver enzymes. 
The patient’s presentation was concerning for myocarditis, and he was quickly admitted to NMVAMC. Cardiac catheterization did not reveal any signs of coronary occlusive disease. Prednisone 1 mg/kg was administered immediately; however, given continued chest pain and volume overload, he was quickly transitioned to solumedrol 1000 mg IV daily. After the initiation of his treatment, the patient’s transaminitis began to resolve, and troponin levels began to decrease; however, his symptoms continued to worsen, and his troponin rose again. By the fourth day of hospitalization, the patient was treated with infliximab, a tumor necrosis factor-α inhibitor shown to reverse ICI-induced autoimmune inflammation, with only mild improvement of his symptoms. The patient’s condition continued to deteriorate, his troponin levels remained elevated, and his family decided to withhold additional treatment. The patient died shortly thereafter.
Discussion
Cardiotoxicity resulting from ICI therapy is far less common than the other potential severe toxicities associated with ICIs. Nevertheless, many cases of ICI-induced cardiac inflammation have been reported, and it has been widely established that patients treated with ICIs are generally at higher risk for acute coronary syndrome.9-11 Acute cardiotoxicity secondary to autoimmune destruction of cardiac tissue includes myocarditis, pericarditis, and vasculitis, which may manifest with symptoms of heart failure and/or arrhythmia. Grading of ICI-induced cardiomyopathy has been defined by both CTCAE and the American Society of Clinical Oncology (ASCO), with grade 4 representing moderate to severe clinical decompensation requiring IV medications in the setting of life-threatening conditions.
Review articles have described the treatment options for severe cases.7,12 As detailed in prior reports, once ICI-induced cardiomyopathy is suspected, urgent admission and immediate evaluation to rule out acute coronary syndrome should be undertaken. Given the potential for deterioration despite the occasional insidious onset, aggressive cardiac monitoring, and close follow-up to measure response to interventions should be undertaken.
Case 2: Uveitis
A 70-year-old man who received pembrolizumab as a bladder-sparing approach for his superficial bladder cancer refractory to intravesical treatments developed uveitis. Approximately 3 months following the initiation of treatment, the patient reported bilateral itchy eyes, erythema, and tearing. He had a known history of allergic conjunctivitis that predated the ICI therapy, and consequently, it was unclear whether his symptoms were reflective of a more concerning issue. The patient’s symptoms continued to wax and wane for a few months, prompting a referral to ophthalmology colleagues at NMVAMC.
Ophthalmology evaluation identified uveitic glaucoma in the setting of his underlying chronic glaucoma. Pembrolizumab was discontinued, and the patient was counseled on choosing either cystectomy or locoregional therapies if further tumors arose. However, within a few weeks of administering topical steroid drops, his symptoms markedly improved, and he wished to be restarted on pembrolizumab. His uveitis remained in remission, and he has been treated with pembrolizumab for more than 1 year since this episode. He has had no clear findings of superficial bladder cancer recurrence while receiving ICI therapy.
Discussion
Uveitis is a known complication of pembrolizumab, and it has been shown to occur in 1% of patients with this treatment.13,14 It should be noted that most of the studies of this IMAR occurred in patients with metastatic melanoma; therefore the rate of this condition in other patients is less understood. Overall, ocular IMARs secondary to anti-PD-1 and anti-PD-L1 therapies are rare.
The most common IMAR is surface ocular disease, consisting of dry eye disease (DED), conjunctivitis, uveitis, and keratitis. Of these, the most common ocular surface disease is DED, which occurred in 1% to 4% of patients treated with ICI therapy; most of these reactions are mild and self-limiting.15 Atezolizumab has the highest association with ocular inflammation and ipilimumab has the highest association with uveitis, with reported odds ratios of 18.89 and 10.54, respectively.16 Treatment of ICI-induced uveitis generally includes topical steroids and treatment discontinuation or break.17 Oral or IV steroids, infliximab, and procedural involvement may be considered in refractory cases or those initially presenting with marked vision loss. Close communication with ophthalmology colleagues to monitor visual acuity and ocular pressure multiple times weekly during the acute phase is required for treatment titration.
Case 3: Organizing Pneumonia
A man aged 63 years was diagnosed with malignant mesothelioma after incidentally noting a pleural effusion and thickening on routine low-dose computed tomography surveillance of pulmonary nodules. A biopsy was performed and was consistent with mesothelioma, and the patient was started on nivolumab (PD-1 inhibitor) and ipilimumab (CTLA-4 inhibitor). The patient was initiated on dual ICIs, and after 6 months of therapy, he had a promising complete response. However, after 9 months of therapy, he developed a new left upper lobe (LUL) pleural-based lesion (Figure 2A).
A biopsy was performed, and the histopathologic appearance was consistent with organizing pneumonia (OP) (Figure 3). 
Discussion
ICIs can uncommonly drive pneumonitis, with the frequency adjusted based on the number of ICIs prescribed and the primary cancer involved. Across all cancers, up to 5% of patients treated with single-agent ICI therapy may experience pneumonitis, though often the findings may simply be radiographic without symptoms. Moreover, up to 10% of patients undergoing treatment for pulmonary cancer or those with dual ICI treatment regimens experience radiographic and/or clinical pneumonitis.18 The clinical manifestations include a broad spectrum of respiratory symptoms. Given the convoluting concerns of cancer progression and infection, a biopsy is often obtained. Histopathologic findings of pneumonitis may include diffuse alveolar damage and/or interstitial lung disease, with OP being a rare variant of ILD.
Among pulmonologists, OP is felt to have polymorphous imaging findings, and biopsy is required to confirm histology; however, histopathology cannot define etiology, and consequently, OP is somewhat of an umbrella diagnosis. The condition can be cryptogenic (idiopathic) or secondary to a multitude of conditions (infection, drug toxicity, or systemic disease). It is classically described as polypoid aggregations of fibroblasts that obstruct the alveolar spaces.19 This histopathologic pattern was demonstrated in our patient’s lung biopsy. Given a prior case description of ICIs, mesothelioma, OP development, and the unremarkable infectious workup, we felt that the patient’s OP was driven by his dual ICI therapy, thereby leading to the ultimate discontinuation of his ICIs and initiation of steroids.20 Thankfully, the patient had already obtained a complete response to his ICIs, and hopefully, he can attain a durable remission with the addition of maintenance chemotherapy.
CONCLUSIONS
ICIs have revolutionized the treatment of a myriad of solid tumors and hematologic malignancies, and their use internationally is expected to increase. With the alteration in immunology pathways, clinicians in all fields will need to be familiarized with IMARs secondary to these agents, including rare subtypes. In addition, the variability in presentations relative to the patients’ treatment course was significant (between 2-9 months), and this highlights that these IMARs can occur at any time point and clinicians should be ever vigilant to spot symptoms in their patients.
It was unexpected for the 3 aforementioned rare toxicities to arise at NMVAMC among only 57 treated patients, and we speculate that these findings may have been observed for 1 of 3 reasons. First, caring for 3 patients with this collection of rare toxicities may have been due to chance. Second, though there is sparse literature studying the topic, the regional environment, including sunlight exposure and air quality, may play a role in the development of one or all of these rare toxicities. Third, rates of these toxicities may be underreported in the literature or attributed to other conditions rather than due to ICIs at other sites, and the uncommon nature of these IMARs may be overstated. Investigations evaluating rates of toxicities, including those traditionally uncommonly seen, based on regional location should be conducted before any further conclusions are drawn.
1. Bagchi S, Yuan R, Engleman EG. Immune checkpoint inhibitors for the treatment of cancer: clinical impact and mechanisms of response and resistance. Published online 2020. doi:10.1146/annurev-pathol-042020
2. Chen DS, Mellman I. Oncology meets immunology: The cancer-immunity cycle. Immunity. 2013;39(1):1-10. doi:10.1016/j.immuni.2013.07.012
3. Smyth MJ, Teng MWL. 2018 Nobel Prize in physiology or medicine. Clin Transl Immunology. 2018;7(10). doi:10.1002/cti2.1041
4. Baxi S, Yang A, Gennarelli RL, et al. Immune-related adverse events for anti-PD-1 and anti-PD-L1 drugs: Systematic review and meta-analysis. BMJ (Online). 2018;360. doi:10.1136/bmj.k793
5. Ellithi M, Elnair R, Chang GV, Abdallah MA. Toxicities of immune checkpoint inhibitors: itis-ending adverse reactions and more. Cureus. Published online February 10, 2020. doi:10.7759/cureus.6935
6. Berti A, Bortolotti R, Dipasquale M, et al. Meta-analysis of immune-related adverse events in phase 3 clinical trials assessing immune checkpoint inhibitors for lung cancer. Crit Rev Oncol Hematol. 2021;162. doi:10.1016/j.critrevonc.2021.103351
7. Davies M, Duffield EA. Safety of checkpoint inhibitors for cancer treatment: strategies for patient monitoring and management of immune-mediated adverse events. Immunotargets Ther. 2017;Volume 6:51-71. doi:10.2147/itt.s141577
8. US Department of Health and Human Services. Common Terminology Criteria for Adverse Events V5.0. Accessed July 17, 2023. https://www.ncbi.nlm.nih.gov/pmc/articles/PMC5584920/
9. Johnson DB, Balko JM, Compton ML, et al. Fulminant myocarditis with combination immune checkpoint blockade. N Engl J Med. 2016;375(18):1749-1755. doi:10.1056/nejmoa1609214
10. Mahmood SS, Fradley MG, Cohen J V., et al. Myocarditis in patients treated with immune checkpoint inhibitors. J Am Coll Cardiol. 2018;71(16):1755-1764. doi:10.1016/j.jacc.2018.02.037
11. Wang DY, Salem JE, Cohen JV, et al. Fatal toxic effects associated with immune checkpoint inhibitors: a systematic review and meta-analysis. JAMA Oncol. 2018;4(12):1721-1728. doi:10.1001/jamaoncol.2018.3923
12. Brahmer JR, Lacchetti C, Schneider BJ, et al; National Comprehensive Cancer Network. Management of immune-related adverse events in patients treated with immune checkpoint inhibitor therapy: American Society of Clinical Oncology Clinical Practice Guideline. J Clin Onc. 2018;36(17):1714-1768. doi:10.1200/JCO
13. Ribas A, Hamid O, Daud A, et al. Association of pembrolizumab with tumor response and survival among patients with advanced melanoma. JAMA. 2016;315:1600-1609. doi:10.1001/jama.2016.4059
14. Dalvin LA, Shields CL, Orloff M, Sato T, Shields JA. Checkpoint inhibitor immune therapy: systemic indications and ophthalmic side effects. Retina. 2018;38(6):1063-1078. doi:10.1097/IAE.0000000000002181
15. Park RB, Jain S, Han H, Park J. Ocular surface disease associated with immune checkpoint inhibitor therapy. Ocular Surface. 2021;20:115-129. doi:10.1016/j.jtos.2021.02.004
16. Fang T, Maberley DA, Etminan M. Ocular adverse events with immune checkpoint inhibitors. J Curr Ophthalmol. 2019;31(3):319-322. doi:10.1016/j.joco.2019.05.002
17. Whist E, Symes RJ, Chang JH, et al. Uveitis caused by treatment for malignant melanoma: a case series. Retin Cases Brief Rep. 2021;15(6):718-723. doi:10.1097/ICB.0000000000000876
18. Naidoo J, Wang X, Woo KM, et al. Pneumonitis in patients treated with anti-programmed death-1/programmed death ligand 1 therapy. J Clin Onc. 2017;35(7):709-717. doi:10.1200/JCO.2016.68.2005
19. Yoshikawa A, Bychkov A, Sathirareuangchai S. Other nonneoplastic conditions, acute lung injury, organizing pneumonia. Accessed July 17, 2023. https://www.pathologyoutlines.com/topic/lungnontumorboop.html
20. Kuint R, Lotem M, Neuman T, et al. Organizing pneumonia following treatment with pembrolizumab for metastatic malignant melanoma–a case report. Respir Med Case Rep. 2017;20:95-97. doi:10.1016/j.rmcr.2017.01.003
Kenneth M. Zabel, MDa,b; Lauren Tagliaferro-Epler, MDc; Coty Ho, MDb; Marissa Tafoya, MDb,d; Michael Reyes, MDb,d; Vishal Vashistha, MDe
Correspondence: Vishal Vashistha ([email protected])
aUniversity of New Mexico Hospital, Albuquerque
bRaymond G. Murphy New Mexico Veterans Affairs Medical Center, Albuquerque
cStanford Medical Center, Palo Alto, California
dUniversity of New Mexico Cancer Center, Albuquerque
eIowa City Veterans Affairs Healthcare System, Iowa

Author disclosures
The authors report no actual or potential conflicts of interest or outside sources of funding with regard to this article.
Disclaimer
The opinions expressed herein are those of the authors and do not necessarily reflect those of Federal Practitioner, Frontline Medical Communications Inc., the U.S. Government, or any of its agencies. This article may discuss unlabeled or investigational use of certain drugs. Please review the complete prescribing information for specific drugs or drug combinations--including indications, contraindications, warnings, and adverse effects--before administering pharmacologic therapy to patients.
Ethics and consent
No informed consent was obtained from the patients; patient identifiers were removed to protect the patient’s identity.
Kenneth M. Zabel, MDa,b; Lauren Tagliaferro-Epler, MDc; Coty Ho, MDb; Marissa Tafoya, MDb,d; Michael Reyes, MDb,d; Vishal Vashistha, MDe
Correspondence: Vishal Vashistha ([email protected])
aUniversity of New Mexico Hospital, Albuquerque
bRaymond G. Murphy New Mexico Veterans Affairs Medical Center, Albuquerque
cStanford Medical Center, Palo Alto, California
dUniversity of New Mexico Cancer Center, Albuquerque
eIowa City Veterans Affairs Healthcare System, Iowa
Author disclosures
The authors report no actual or potential conflicts of interest or outside sources of funding with regard to this article.
Disclaimer
The opinions expressed herein are those of the authors and do not necessarily reflect those of Federal Practitioner, Frontline Medical Communications Inc., the U.S. Government, or any of its agencies. This article may discuss unlabeled or investigational use of certain drugs. Please review the complete prescribing information for specific drugs or drug combinations--including indications, contraindications, warnings, and adverse effects--before administering pharmacologic therapy to patients.
Ethics and consent
No informed consent was obtained from the patients; patient identifiers were removed to protect the patient’s identity.
Immune checkpoint inhibitors (ICIs), often broadly referred to as immunotherapy, are being prescribed at increasing rates due to their effectiveness in treating a growing number of advanced solid tumors and hematologic malignancies.1 It has been well established that T-cell signaling mechanisms designed to combat foreign pathogens have been involved in the mitigation of tumor proliferation.2 This protective process can be supported or restricted by infection, medication, or mutations.
ICIs support T-cell–mediated destruction of tumor cells by inhibiting the mechanisms designed to limit autoimmunity, specifically the programmed cell death protein 1/programmed cell death ligand 1 (PD-1/PD-L1) and cytotoxic T-lymphocyte–associated antigen 4 (CTLA-4) pathways. The results have been impressive, leading to an expansive number of US Food and Drug Administration (FDA) approvals across a diverse set of malignancies. Consequently, the Nobel Prize in Physiology or Medicine was awarded for such work in 2018.3
BACKGROUND
While altering these pathways has been shown to hinder tumor growth, the lesser restrictions on the immune system can drive unwanted autoimmune inflammation to host tissue. These toxicities are collectively known as immune-mediated adverse reactions (IMARs). Clinically and histologically, IMARs frequently manifest similarly to other autoimmune conditions and may affect any organ, including skin, liver, lungs, heart, intestine (small and large), kidneys, eyes, endocrine glands, and neurologic tissue.4,5 According to recent studies, as many as 20% to 30% of patients receiving a single ICI will experience at least 1 clinically significant IMAR, and about 13% are classified as severe; however, < 10% of patients will have their ICIs discontinued due to these reactions.6
Though infrequent, a thorough understanding of the severity of IMARs to ICIs is critical for the diagnosis and management of these organ-threatening and potentially life-threatening toxicities. With the growing use of these agents and more FDA approvals for dual checkpoint blockage (concurrent use of CTLA-4 and PD-1/PD-L1 inhibitors), the absolute number of IMARs is expected to rise, thereby leading to more exposure of such events to both oncology and nononcology clinicians. Prior literature has clearly described the treatments and outcomes for many common severe toxicities; however, information regarding presentations and outcomes for rare IMARs is lacking.7
A few fascinating cases of rare toxicities have been observed at the New Mexico Veterans Affairs Medical Center (NMVAMC) in Albuquerque despite its relatively small size compared with other US Department of Veterans Affairs medical centers. As such, herein, the diagnostic evaluation, treatments, and outcomes of rare IMARs are reported for each case, and the related literature is reviewed.
Patient Selection
Patients who were required to discontinue or postpone treatment with any ICI blocking the CTLA-4 (ipilimumab), PD-1 (pembrolizumab, nivolumab, cemiplimab), or PD-L1 (atezolizumab, avelumab, durvalumab) pathways between 2015 to 2021 due to toxicity at the NMVAMC were eligible for inclusion. The electronic health record was reviewed for each eligible case, and the patient demographics, disease characteristics, toxicities, and outcomes were documented for each patient. For the 57 patients who received ICIs within the chosen period, 11 required a treatment break or discontinuation. Of these, 3 cases were selected for reporting due to the rare IMARs observed. This study was approved by the NMVAMC Institutional Review Board.
Case 1: Myocarditis
An 84-year-old man receiving a chemoimmunotherapy regimen consisting of carboplatin, pemetrexed, and pembrolizumab for recurrent, stage IV lung adenocarcinoma developed grade 4 cardiomyopathy, as defined by the Common Terminology Criteria for Adverse Events (CTCAE) v5.0, during his treatment.8 He was treated for 2 cycles before he began experiencing an increase in liver enzymes.
The patient’s presentation was concerning for myocarditis, and he was quickly admitted to NMVAMC. Cardiac catheterization did not reveal any signs of coronary occlusive disease. Prednisone 1 mg/kg was administered immediately; however, given continued chest pain and volume overload, he was quickly transitioned to solumedrol 1000 mg IV daily. After the initiation of his treatment, the patient’s transaminitis began to resolve, and troponin levels began to decrease; however, his symptoms continued to worsen, and his troponin rose again. By the fourth day of hospitalization, the patient was treated with infliximab, a tumor necrosis factor-α inhibitor shown to reverse ICI-induced autoimmune inflammation, with only mild improvement of his symptoms. The patient’s condition continued to deteriorate, his troponin levels remained elevated, and his family decided to withhold additional treatment. The patient died shortly thereafter.
Discussion
Cardiotoxicity resulting from ICI therapy is far less common than the other potential severe toxicities associated with ICIs. Nevertheless, many cases of ICI-induced cardiac inflammation have been reported, and it has been widely established that patients treated with ICIs are generally at higher risk for acute coronary syndrome.9-11 Acute cardiotoxicity secondary to autoimmune destruction of cardiac tissue includes myocarditis, pericarditis, and vasculitis, which may manifest with symptoms of heart failure and/or arrhythmia. Grading of ICI-induced cardiomyopathy has been defined by both CTCAE and the American Society of Clinical Oncology (ASCO), with grade 4 representing moderate to severe clinical decompensation requiring IV medications in the setting of life-threatening conditions.
Review articles have described the treatment options for severe cases.7,12 As detailed in prior reports, once ICI-induced cardiomyopathy is suspected, urgent admission and immediate evaluation to rule out acute coronary syndrome should be undertaken. Given the potential for deterioration despite the occasional insidious onset, aggressive cardiac monitoring, and close follow-up to measure response to interventions should be undertaken.
Case 2: Uveitis
A 70-year-old man who received pembrolizumab as a bladder-sparing approach for his superficial bladder cancer refractory to intravesical treatments developed uveitis. Approximately 3 months following the initiation of treatment, the patient reported bilateral itchy eyes, erythema, and tearing. He had a known history of allergic conjunctivitis that predated the ICI therapy, and consequently, it was unclear whether his symptoms were reflective of a more concerning issue. The patient’s symptoms continued to wax and wane for a few months, prompting a referral to ophthalmology colleagues at NMVAMC.
Ophthalmology evaluation identified uveitic glaucoma in the setting of his underlying chronic glaucoma. Pembrolizumab was discontinued, and the patient was counseled on choosing either cystectomy or locoregional therapies if further tumors arose. However, within a few weeks of administering topical steroid drops, his symptoms markedly improved, and he wished to be restarted on pembrolizumab. His uveitis remained in remission, and he has been treated with pembrolizumab for more than 1 year since this episode. He has had no clear findings of superficial bladder cancer recurrence while receiving ICI therapy.
Discussion
Uveitis is a known complication of pembrolizumab, and it has been shown to occur in 1% of patients with this treatment.13,14 It should be noted that most of the studies of this IMAR occurred in patients with metastatic melanoma; therefore the rate of this condition in other patients is less understood. Overall, ocular IMARs secondary to anti-PD-1 and anti-PD-L1 therapies are rare.
The most common IMAR is surface ocular disease, consisting of dry eye disease (DED), conjunctivitis, uveitis, and keratitis. Of these, the most common ocular surface disease is DED, which occurred in 1% to 4% of patients treated with ICI therapy; most of these reactions are mild and self-limiting.15 Atezolizumab has the highest association with ocular inflammation and ipilimumab has the highest association with uveitis, with reported odds ratios of 18.89 and 10.54, respectively.16 Treatment of ICI-induced uveitis generally includes topical steroids and treatment discontinuation or break.17 Oral or IV steroids, infliximab, and procedural involvement may be considered in refractory cases or those initially presenting with marked vision loss. Close communication with ophthalmology colleagues to monitor visual acuity and ocular pressure multiple times weekly during the acute phase is required for treatment titration.
Case 3: Organizing Pneumonia
A man aged 63 years was diagnosed with malignant mesothelioma after incidentally noting a pleural effusion and thickening on routine low-dose computed tomography surveillance of pulmonary nodules. A biopsy was performed and was consistent with mesothelioma, and the patient was started on nivolumab (PD-1 inhibitor) and ipilimumab (CTLA-4 inhibitor). The patient was initiated on dual ICIs, and after 6 months of therapy, he had a promising complete response. However, after 9 months of therapy, he developed a new left upper lobe (LUL) pleural-based lesion (Figure 2A).
A biopsy was performed, and the histopathologic appearance was consistent with organizing pneumonia (OP) (Figure 3).
Discussion
ICIs can uncommonly drive pneumonitis, with the frequency adjusted based on the number of ICIs prescribed and the primary cancer involved. Across all cancers, up to 5% of patients treated with single-agent ICI therapy may experience pneumonitis, though often the findings may simply be radiographic without symptoms. Moreover, up to 10% of patients undergoing treatment for pulmonary cancer or those with dual ICI treatment regimens experience radiographic and/or clinical pneumonitis.18 The clinical manifestations include a broad spectrum of respiratory symptoms. Given the convoluting concerns of cancer progression and infection, a biopsy is often obtained. Histopathologic findings of pneumonitis may include diffuse alveolar damage and/or interstitial lung disease, with OP being a rare variant of ILD.
Among pulmonologists, OP is felt to have polymorphous imaging findings, and biopsy is required to confirm histology; however, histopathology cannot define etiology, and consequently, OP is somewhat of an umbrella diagnosis. The condition can be cryptogenic (idiopathic) or secondary to a multitude of conditions (infection, drug toxicity, or systemic disease). It is classically described as polypoid aggregations of fibroblasts that obstruct the alveolar spaces.19 This histopathologic pattern was demonstrated in our patient’s lung biopsy. Given a prior case description of ICIs, mesothelioma, OP development, and the unremarkable infectious workup, we felt that the patient’s OP was driven by his dual ICI therapy, thereby leading to the ultimate discontinuation of his ICIs and initiation of steroids.20 Thankfully, the patient had already obtained a complete response to his ICIs, and hopefully, he can attain a durable remission with the addition of maintenance chemotherapy.
CONCLUSIONS
ICIs have revolutionized the treatment of a myriad of solid tumors and hematologic malignancies, and their use internationally is expected to increase. With the alteration in immunology pathways, clinicians in all fields will need to be familiarized with IMARs secondary to these agents, including rare subtypes. In addition, the variability in presentations relative to the patients’ treatment course was significant (between 2-9 months), and this highlights that these IMARs can occur at any time point and clinicians should be ever vigilant to spot symptoms in their patients.
It was unexpected for the 3 aforementioned rare toxicities to arise at NMVAMC among only 57 treated patients, and we speculate that these findings may have been observed for 1 of 3 reasons. First, caring for 3 patients with this collection of rare toxicities may have been due to chance. Second, though there is sparse literature studying the topic, the regional environment, including sunlight exposure and air quality, may play a role in the development of one or all of these rare toxicities. Third, rates of these toxicities may be underreported in the literature or attributed to other conditions rather than due to ICIs at other sites, and the uncommon nature of these IMARs may be overstated. Investigations evaluating rates of toxicities, including those traditionally uncommonly seen, based on regional location should be conducted before any further conclusions are drawn.
1. Bagchi S, Yuan R, Engleman EG. Immune checkpoint inhibitors for the treatment of cancer: clinical impact and mechanisms of response and resistance. Published online 2020. doi:10.1146/annurev-pathol-042020
2. Chen DS, Mellman I. Oncology meets immunology: The cancer-immunity cycle. Immunity. 2013;39(1):1-10. doi:10.1016/j.immuni.2013.07.012
3. Smyth MJ, Teng MWL. 2018 Nobel Prize in physiology or medicine. Clin Transl Immunology. 2018;7(10). doi:10.1002/cti2.1041
4. Baxi S, Yang A, Gennarelli RL, et al. Immune-related adverse events for anti-PD-1 and anti-PD-L1 drugs: Systematic review and meta-analysis. BMJ (Online). 2018;360. doi:10.1136/bmj.k793
5. Ellithi M, Elnair R, Chang GV, Abdallah MA. Toxicities of immune checkpoint inhibitors: itis-ending adverse reactions and more. Cureus. Published online February 10, 2020. doi:10.7759/cureus.6935
6. Berti A, Bortolotti R, Dipasquale M, et al. Meta-analysis of immune-related adverse events in phase 3 clinical trials assessing immune checkpoint inhibitors for lung cancer. Crit Rev Oncol Hematol. 2021;162. doi:10.1016/j.critrevonc.2021.103351
7. Davies M, Duffield EA. Safety of checkpoint inhibitors for cancer treatment: strategies for patient monitoring and management of immune-mediated adverse events. Immunotargets Ther. 2017;Volume 6:51-71. doi:10.2147/itt.s141577
8. US Department of Health and Human Services. Common Terminology Criteria for Adverse Events V5.0. Accessed July 17, 2023. https://www.ncbi.nlm.nih.gov/pmc/articles/PMC5584920/
9. Johnson DB, Balko JM, Compton ML, et al. Fulminant myocarditis with combination immune checkpoint blockade. N Engl J Med. 2016;375(18):1749-1755. doi:10.1056/nejmoa1609214
10. Mahmood SS, Fradley MG, Cohen J V., et al. Myocarditis in patients treated with immune checkpoint inhibitors. J Am Coll Cardiol. 2018;71(16):1755-1764. doi:10.1016/j.jacc.2018.02.037
11. Wang DY, Salem JE, Cohen JV, et al. Fatal toxic effects associated with immune checkpoint inhibitors: a systematic review and meta-analysis. JAMA Oncol. 2018;4(12):1721-1728. doi:10.1001/jamaoncol.2018.3923
12. Brahmer JR, Lacchetti C, Schneider BJ, et al; National Comprehensive Cancer Network. Management of immune-related adverse events in patients treated with immune checkpoint inhibitor therapy: American Society of Clinical Oncology Clinical Practice Guideline. J Clin Onc. 2018;36(17):1714-1768. doi:10.1200/JCO
13. Ribas A, Hamid O, Daud A, et al. Association of pembrolizumab with tumor response and survival among patients with advanced melanoma. JAMA. 2016;315:1600-1609. doi:10.1001/jama.2016.4059
14. Dalvin LA, Shields CL, Orloff M, Sato T, Shields JA. Checkpoint inhibitor immune therapy: systemic indications and ophthalmic side effects. Retina. 2018;38(6):1063-1078. doi:10.1097/IAE.0000000000002181
15. Park RB, Jain S, Han H, Park J. Ocular surface disease associated with immune checkpoint inhibitor therapy. Ocular Surface. 2021;20:115-129. doi:10.1016/j.jtos.2021.02.004
16. Fang T, Maberley DA, Etminan M. Ocular adverse events with immune checkpoint inhibitors. J Curr Ophthalmol. 2019;31(3):319-322. doi:10.1016/j.joco.2019.05.002
17. Whist E, Symes RJ, Chang JH, et al. Uveitis caused by treatment for malignant melanoma: a case series. Retin Cases Brief Rep. 2021;15(6):718-723. doi:10.1097/ICB.0000000000000876
18. Naidoo J, Wang X, Woo KM, et al. Pneumonitis in patients treated with anti-programmed death-1/programmed death ligand 1 therapy. J Clin Onc. 2017;35(7):709-717. doi:10.1200/JCO.2016.68.2005
19. Yoshikawa A, Bychkov A, Sathirareuangchai S. Other nonneoplastic conditions, acute lung injury, organizing pneumonia. Accessed July 17, 2023. https://www.pathologyoutlines.com/topic/lungnontumorboop.html
20. Kuint R, Lotem M, Neuman T, et al. Organizing pneumonia following treatment with pembrolizumab for metastatic malignant melanoma–a case report. Respir Med Case Rep. 2017;20:95-97. doi:10.1016/j.rmcr.2017.01.003
Race and Age-Related PSA Testing Disparities in Spinal Cord Injured Men: Analysis of National Veterans Health Administration Data
Prostate cancer will be diagnosed in 12.5% of men during their lifetime. It is the most commonly diagnosed solid organ cancer in men.1 However, prostate cancer screening for prostate-specific antigen (PSA) remains controversial due to concerns about overdiagnosis, as the overall risk of dying of prostate cancer is only 2.4%.1
To address the risk and benefits of PSA testing, in 2012 the US Preventive Services Task Force (USPSTF) recommended against routine PSA testing.2 Updated 2018 recommendations continued this recommendation in men aged > 70 years but acknowledged a small potential benefit in men aged 55 to 69 years and suggested individualized shared decision making between patient and clinician.3 In addition, American Urological Association (AUA) guidelines for the early detection of prostate cancer recommend against PSA screening in men aged < 40 years or those aged > 70 years, shared decision making for individuals aged 55 to 70 years or in high-risk men aged 40 to 55 years (ie, family history of prostate cancer or African American race).4 PSA screening is not recommended for men with a life expectancy shorter than 10 to 15 years aged > 70 years.4
The Veterans Health Administration (VHA) is the largest integrated health care system in the US.5 In addition, the US Department of Veterans Affairs (VA) Spinal Cord Injury and Disorders System of Care operates 25 centers throughout the US.6 Life expectancy following spinal cord injury (SCI) increased significantly through the 1980s but has since plateaued, with life expectancy being impacted by age at injury, completeness of injury, and neurologic level.7,8 As part of a program of uniform care, all persons with SCI followed at the Spinal Cord Injury and Disorders System of Care centers are offered comprehensive annual evaluations, including screening laboratory tests, such as PSA level.9
Patients with SCI present a unique challenge when interpreting PSA levels, given potentially confounding factors, including neurogenic bladder management, high rates of bacteriuria, urinary tract infections (UTIs), testosterone deficiency, and pelvic innervation that differs from the noninjured population.10,11 Unfortunately, the literature on prostate cancer prevalence and average PSA levels in patients with SCI is limited by the small scope of studies and inconsistent data.10-16 Therefore, the purpose of the current investigation was to quantify and analyze the rates of annual PSA testing for all men with SCI in the VHA.
Methods
Approval was granted by the Richmond VA Medical Center (VAMC) Institutional Review Board in Virginia, and by the VA Informatics and Computing Infrastructure (VINCI) data access request tracker system for extraction of data from the VA Corporate Data Warehouse. Microsoft Structured Query Language was used for data programming and query design. Statistical analysis was conducted using Stata version 15.1 with assistance from professional biostatisticians.
Only male veterans with a nervous system disorder affecting the spinal cord or with myelopathy were included, based on International Classification of Diseases (ICD) version 9 and 10 codes, corresponding to traumatic and nontraumatic myelopathy. Veterans diagnosed with myelopathy based on ICD codes corresponding to progressive or degenerative myelopathies, such as multiple sclerosis or amyotrophic lateral sclerosis, were excluded.
For each veteran, extracted data included the unique identification number, date of birth, ICD code, date ICD code first appeared, race, gender, death status (yes/no), date of death (when applicable), date of each PSA test, PSA test values, and the VAMC where each test was performed. Only tests for total PSA were included. The date that the ICD code first appeared served as an approximation for the date of SCI. The time frame for the study included all PSA tests in the VINCI database for 2000 through 2017. However, only post-SCI PSA tests were included in the analysis. Duplicate tests (same date/time) were eliminated.
Race is considered a risk factor for prostate cancer only for African American patients, likely due to racial health disparities.17 Given this, we chose to categorize race as either African American or other, with a third category for missing/inconsistent reporting. Age at time of the PSA test was categorized into 4 groups (≤ 39, 40-54, 55-69, and ≥ 70 years) based on AUA guidelines.4 The annual PSA testing rate was calculated for each veteran with SCI as the number of PSA tests per year. A mean annual PSA test rate was then calculated as the weighted (by exposure time) mean value for all annual PSA testing rates from 2000 through 2017 for each age group and race. Annual exposure was calculated for each veteran and defined as the number of days a veteran was eligible to have a PSA test. This started with the date of SCI diagnosis and ended with either the date of death or the date of last PSA. If a veteran moved from one age group to another in 1 year, the first part of this year’s exposure was included in the calculation of the annual PSA testing rate for the younger group and the second part was included for the calculation of the older group. For deceased veterans, the death date was excluded from the exposure period, and their exposure period ended on the day before death.
Statistical Analysis
To compare PSA testing rates between African American race and other races, Poisson regression was used with exposure treated as an offset (exposures were summed across years for each veteran). An indicator (dummy) variable for African American race vs other races was coded, and statistical significance was set at P < .05. To check sensitivity for the Poisson assumption that the mean was equal to the variance, negative binomial regression was used. To assess for geographic PSA testing rate variability, the data were further analyzed based on the locations where PSA tests were performed. This subanalysis was limited to veterans who had all PSA tests in a single station. For each station, the average PSA testing rate was calculated for each veteran, and the mean for all annual PSA testing rates was used to determine station-specific PSA testing rates.
Results
A total of 45,274 veterans were initially identified of which 367 females were excluded (Figure 1).

The PSA testing rate rose for veterans in the age groups ≤ 39, 40 to 54, and 55 to 69 years (Figure 2A). 
Of the cohort of 37,243 veterans, 28,396 (76.2%) had their post-SCI tests done at a single facility, 6770 (18.1%) at 2 locations, and 2077 (5.5%) at > 2 locations. Single-station group data were included in a subanalysis to determine the mean (SD) PSA testing rates, which for the 123 locations was 0.98 (0.36) tests per veteran per year (range, 0.2-3.0 tests per veteran per year).
To assess the impact of the 2012 USPSTF recommendations on PSA testing rates in veterans with SCI, mean PSA testing rates were calculated for 5 years before the recommendations (2007-2011) and compared with the average PSA testing rate for 5 years following the updated recommendations (2013-2017). The USPSTF updated its recommendation again in 2018 and acknowledged the potential benefit for PSA screening in certain patient populations.2,3 Surprisingly, and despite recommendations, the results show a significant increase in PSA testing rates in all age groups for all races (P < .001) (Figure 4).
Discussion
The goal of this study was to establish testing rates and analyze PSA testing trends across races and age groups in veterans with SCI. This is the largest cohort of patients with SCI analyzed in the literature. The key findings of this study were that despite clear AUA guidelines recommending against PSA testing in patients aged ≤ 39 years and ≥ 70 years, there are high rates of testing in veterans with SCI in these age groups (0.46 tests per year in those aged ≤ 39 years and 0.91 tests per year in those aged ≥ 70 years). In terms of race, as expected based on increased risk,
Prostate Cancer Incidence
Although the exact mechanism behind alterations in prostate function in the SCI population have yet to be fully elucidated, research suggests that the prostate behaves differently after SCI. Animal models of prostate gland denervation show decreased prostate volume and suggest that SCI may lead to a reduction in prostatic secretory function associated with autonomic dysfunction. Shim and colleagues hypothesized that impaired autonomic prostate innervation alters the prostatic volume and PSA in patients with SCI.10
Additional studies looking at actual PSA levels in men with SCI reveal conflicting data.10-15,20 Toricelli and colleagues retrospectively studied 140 men with SCI, of whom 34 had PSA levels available and found that mean PSA was not significantly different for patients with SCI compared with controls, but patients using clean intermittent catheterization had 2-fold higher PSA levels.21 In contrast, Konety and colleagues found that mean PSA was not significantly different from uninjured controls in their cohort of 79 patients with SCI, though they did find a correlation between indwelling catheter use and a higher PSA.22
Studies have shown an overall decreased risk of prostate cancer in patients with SCI, though the mechanism remains unclear. A large cohort study from Taiwan showed a lower risk of prostate cancer for 54,401 patients with SCI with an adjusted hazard ratio of 0.73.23 Patel and colleagues found the overall rate of prostate cancer in the population of veterans with SCI was lower than the general uninjured VA population, though this study was limited by scope with only 350 patients with SCI.24 A more recent systematic review and meta-analysis of 9 studies evaluating the prevalence of prostate cancer in men with SCI found a reduction of up to 65% in the risk of prostate cancer in men with SCI, and PSA was found to be a poor screening tool for prostate cancer due to large study heterogeneity.16
PSA Screening
This study identified widespread overscreening using the PSA test in veterans with SCI, which is likely attributable to many factors. Per VHA Directive 1176, all eligible veterans are offered yearly interdisciplinary comprehensive evaluations, including laboratory testing, and as such veterans with SCI have high rates of annual visit attendance due to the complexity of their care.9 PSA testing is included in the standard battery of laboratory tests ordered for all patients with SCI during their annual examinations. Additionally, many SCI specialists use the PSA level in patients with SCI for identifying cystitis or prostatitis in patients with colonization who may not experience typical symptoms. Everaert and colleagues demonstrated the clinical utility for localizing UTIs to the upper or lower tract, with elevated PSA indicating prostatitis. They found that serum PSA has a sensitivity of 68% and a specificity of 100% in the differential diagnosis of prostatitis and pyelonephritis.25 As such, the high PSA screening rates may be reflective of diagnostic use for infection rather than for cancer screening.
Likely as a response to the USPSTF recommendations, there has been a national slow decline in overall PSA screening rates since 2012.26-28 A study from Vetterlein and colleagues examining changes in the PSA screening trends related to USPSTF recommendations found an 8.5% decline in overall PSA screening from 2012 to 2014.29 However, the increase in PSA testing across all ages and races in the VA population with SCI over the same period is not entirely understood and suggests the need for further research and education in this area.
Limitations
This study is limited by the use of data identified by ICD codes rather than by review of individual health records. This required the use of decision algorithms for data points, such as the date of SCI. In addition, analysis was not able to capture shared decision making that may have contributed to PSA screening outside the recommended age ranges based on additional risk factors, such as family history of lethal malignancy. Furthermore, a detailed attempt to define specific age-adjusted PSA levels was beyond the scope of this study but will be addressed in later publications. In addition, we did not exclude individuals with a diagnosis of prostate adenocarcinoma, prostatitis, or recurrent UTIs because the onset, duration, and severity of disease could not be definitively ascertained. Finally, veterans with SCI are unique and may not be reflective of individuals with SCI who do not receive care within the VA. However, despite these limitations, this is, to our knowledge, the largest and most comprehensive study evaluating PSA testing rates in individuals with SCI.
Conclusions
Currently, PSA screening is recommended following shared decision making for patients at average risk aged 55 to 70 years. Patients with SCI experience many conditions that may affect PSA values, but data regarding normal PSA ranges and rates of prostate cancer in this population remain sparse. The study demonstrated high rates of overtesting in veterans with SCI, higher than expected testing rates in African American veterans, a paradoxical increase in PSA testing rates after the 2012 publication of the USPSTF PSA guidelines, and wide variability in testing rates depending on VA location.
African American men were tested at higher rates across all age groups, including in patients aged > 70 years. To balance the benefits of detecting clinically significant prostate cancer vs the risks of invasive testing in high-risk populations with SCI, more work is needed to determine the clinical impact of screening practices. Future work is currently ongoing to define age-based PSA values in patients with SCI.
Acknowledgments
This research was supported in part through funding from the Center for Rehabilitation Science and Engineering, Virginia Commonwealth University Health System.
1. American Cancer Society. Key statistics for prostate cancer. Updated January 12, 2023. Accessed June 2, 2023. https://www.cancer.org/cancer/prostate-cancer/about/key-statistics.html
2. Moyer VA; U.S. Preventive Services Task Force. Screening for prostate cancer: U.S. Preventive Services Task Force recommendation statement. Ann Intern Med. 2012;157(2):120-134. doi:10.7326/0003-4819-157-2-201207170-00459
3. US Preventive Services Task Force, Grossman DC, Curry SJ, et al. Screening for Prostate Cancer: US Preventive Services Task Force Recommendation Statement. JAMA. 2018;319(18):1901-1913. doi:10.1001/jama.2018.3710
4. Carter HB, Albertsen PC, Barry MJ, et al. Early detection of prostate cancer: AUA Guideline. J Urol. 2013;190(2):419-426. doi:10.1016/j.juro.2013.04.119
5. US Department of Veterans Affairs, Veterans Health Administration. Updated August 15, 2022. Accessed June 2, 2023. https://www.va.gov/health/aboutVHA.asp
6. US Department of Veterans Affairs. Spinal cord injuries and disorders system of care. Updated January 31, 2022. Accessed June 2, 2023. https://www.sci.va.gov/VAs_SCID_System_of_Care.asp
7. DeVivo MJ, Chen Y, Wen H. Cause of death trends among persons with spinal cord injury in the United States: 1960-2017. Arch Phys Med Rehabil. 2022;103(4):634-641. doi:10.1016/j.apmr.2021.09.019
8. Cao Y, DiPiro N, Krause JS. Health factors and spinal cord injury: a prospective study of risk of cause-specific mortality. Spinal Cord. 2019;57(7):594-602. doi:10.1038/s41393-019-0264-6
9. US Department of Veterans Affairs, Veterans Health Administration. VHA Directive 1176(2): Spinal Cord Injuries and Disorders System of Care. Published September 30, 2019. Accessed June 2, 2023. https://www.va.gov/vhapublications/ViewPublication.asp?pub_ID=8523
10. Shim HB, Jung TY, Lee JK, Ku JH. Prostate activity and prostate cancer in spinal cord injury. Prostate Cancer Prostatic Dis. 2006;9(2):115-120. doi:10.1038/sj.pcan.4500865
11. Lynne CM, Aballa TC, Wang TJ, Rittenhouse HG, Ferrell SM, Brackett NL. Serum and semen prostate specific antigen concentrations are different in young spinal cord injured men compared to normal controls. J Urol. 1999;162(1):89-91. doi:10.1097/00005392-199907000-00022
12. Bartoletti R, Gavazzi A, Cai T, et al. Prostate growth and prevalence of prostate diseases in early onset spinal cord injuries. Eur Urol. 2009;56(1):142-148. doi:10.1016/j.eururo.2008.01.088
13. Pannek J, Berges RR, Cubick G, Meindl R, Senge T. Prostate size and PSA serum levels in male patients with spinal cord injury. Urology. 2003;62(5):845-848. doi:10.1016/s0090-4295(03)00654-x
14. Pramudji CK, Mutchnik SE, DeConcini D, Boone TB. Prostate cancer screening with prostate specific antigen in spinal cord injured men. J Urol. 2002;167(3):1303-1305.
15. Alexandrino AP, Rodrigues MA, Matsuo T. Evaluation of serum and seminal levels of prostate specific antigen in men with spinal cord injury. J Urol. 2004;171(6 Pt 1):2230-2232. doi:10.1097/01.ju.0000125241.77517.10
16. Barbonetti A, D’Andrea S, Martorella A, Felzani G, Francavilla S, Francavilla F. Risk of prostate cancer in men with spinal cord injury: a systematic review and meta-analysis. Asian J Androl. 2018;20(6):555-560. doi:10.4103/aja.aja_31_18
17. Vince RA Jr, Jiang R, Bank M, et al. Evaluation of social determinants of health and prostate cancer outcomes among black and white patients: a systematic review and meta-analysis. JAMA Netw Open. 2023;6(1):e2250416. Published 2023 Jan 3. doi:10.1001/jamanetworkopen.2022.50416
18. Smith ZL, Eggener SE, Murphy AB. African-American prostate cancer disparities. Curr Urol Rep. 2017;18(10):81. Published 2017 Aug 14. doi:10.1007/s11934-017-0724-5
19. Jeong SH, Werneburg GT, Abouassaly R, Wood H. Acquired and congenital spinal cord injury is associated with lower likelihood of prostate specific antigen screening. Urology. 2022;164:178-183. doi:10.1016/j.urology.2022.01.044
20. Benaim EA, Montoya JD, Saboorian MH, Litwiller S, Roehrborn CG. Characterization of prostate size, PSA and endocrine profiles in patients with spinal cord injuries. Prostate Cancer Prostatic Dis. 1998;1(5):250-255. doi:10.1038/sj.pcan.4500246
21. Torricelli FC, Lucon M, Vicentini F, Gomes CM, Srougi M, Bruschini H. PSA levels in men with spinal cord injury and under intermittent catheterization. Neurourol Urodyn. 2011;30(8):1522-1524. doi:10.1002/nau.21119
22. Konety BR, Nguyen TT, Brenes G, et al. Evaluation of the effect of spinal cord injury on serum PSA levels. Urology. 2000;56(1):82-86. doi:10.1016/s0090-4295(00)00548-3
23. Lee WY, Sun LM, Lin CL, et al. Risk of prostate and bladder cancers in patients with spinal cord injury: a population-based cohort study. Urol Oncol. 2014;32(1):51.e1-51.e517. doi:10.1016/j.urolonc.2013.07.019
24. Patel N, Ngo K, Hastings J, Ketchum N, Sepahpanah F. Prevalence of prostate cancer in patients with chronic spinal cord injury. PM R. 2011;3(7):633-636. doi:10.1016/j.pmrj.2011.04.024
25. Everaert K, Oostra C, Delanghe J, Vande Walle J, Van Laere M, Oosterlinck W. Diagnosis and localization of a complicated urinary tract infection in neurogenic bladder disease by tubular proteinuria and serum prostate specific antigen. Spinal Cord. 1998;36(1):33-38. doi:10.1038/sj.sc.3100520
26. Drazer MW, Huo D, Eggener SE. National prostate cancer screening rates after the 2012 US Preventive Services Task Force recommendation discouraging prostate-specific antigen-based screening. J Clin Oncol. 2015;33(22):2416-2423. doi:10.1200/JCO.2015.61.6532
27. Sammon JD, Abdollah F, Choueiri TK, et al. Prostate-specific antigen screening after 2012 US Preventive Services Task Force recommendations. JAMA. 2015;314(19):2077-2079. doi:10.1001/jama.2015.7273
28. Jemal A, Fedewa SA, Ma J, et al. Prostate cancer incidence and PSA testing patterns in relation to USPSTF screening recommendations. JAMA. 2015;314(19):2054-2061. doi:10.1001/jama.2015.14905
29. Vetterlein MW, Dalela D, Sammon JD, et al. State-by-state variation in prostate-specific antigen screening trends following the 2011 United States Preventive Services Task Force panel update. Urology. 2018;112:56-65. doi:10.1016/j.urology.2017.08.055
Prostate cancer will be diagnosed in 12.5% of men during their lifetime. It is the most commonly diagnosed solid organ cancer in men.1 However, prostate cancer screening for prostate-specific antigen (PSA) remains controversial due to concerns about overdiagnosis, as the overall risk of dying of prostate cancer is only 2.4%.1
To address the risk and benefits of PSA testing, in 2012 the US Preventive Services Task Force (USPSTF) recommended against routine PSA testing.2 Updated 2018 recommendations continued this recommendation in men aged > 70 years but acknowledged a small potential benefit in men aged 55 to 69 years and suggested individualized shared decision making between patient and clinician.3 In addition, American Urological Association (AUA) guidelines for the early detection of prostate cancer recommend against PSA screening in men aged < 40 years or those aged > 70 years, shared decision making for individuals aged 55 to 70 years or in high-risk men aged 40 to 55 years (ie, family history of prostate cancer or African American race).4 PSA screening is not recommended for men with a life expectancy shorter than 10 to 15 years aged > 70 years.4
The Veterans Health Administration (VHA) is the largest integrated health care system in the US.5 In addition, the US Department of Veterans Affairs (VA) Spinal Cord Injury and Disorders System of Care operates 25 centers throughout the US.6 Life expectancy following spinal cord injury (SCI) increased significantly through the 1980s but has since plateaued, with life expectancy being impacted by age at injury, completeness of injury, and neurologic level.7,8 As part of a program of uniform care, all persons with SCI followed at the Spinal Cord Injury and Disorders System of Care centers are offered comprehensive annual evaluations, including screening laboratory tests, such as PSA level.9
Patients with SCI present a unique challenge when interpreting PSA levels, given potentially confounding factors, including neurogenic bladder management, high rates of bacteriuria, urinary tract infections (UTIs), testosterone deficiency, and pelvic innervation that differs from the noninjured population.10,11 Unfortunately, the literature on prostate cancer prevalence and average PSA levels in patients with SCI is limited by the small scope of studies and inconsistent data.10-16 Therefore, the purpose of the current investigation was to quantify and analyze the rates of annual PSA testing for all men with SCI in the VHA.
Methods
Approval was granted by the Richmond VA Medical Center (VAMC) Institutional Review Board in Virginia, and by the VA Informatics and Computing Infrastructure (VINCI) data access request tracker system for extraction of data from the VA Corporate Data Warehouse. Microsoft Structured Query Language was used for data programming and query design. Statistical analysis was conducted using Stata version 15.1 with assistance from professional biostatisticians.
Only male veterans with a nervous system disorder affecting the spinal cord or with myelopathy were included, based on International Classification of Diseases (ICD) version 9 and 10 codes, corresponding to traumatic and nontraumatic myelopathy. Veterans diagnosed with myelopathy based on ICD codes corresponding to progressive or degenerative myelopathies, such as multiple sclerosis or amyotrophic lateral sclerosis, were excluded.
For each veteran, extracted data included the unique identification number, date of birth, ICD code, date ICD code first appeared, race, gender, death status (yes/no), date of death (when applicable), date of each PSA test, PSA test values, and the VAMC where each test was performed. Only tests for total PSA were included. The date that the ICD code first appeared served as an approximation for the date of SCI. The time frame for the study included all PSA tests in the VINCI database for 2000 through 2017. However, only post-SCI PSA tests were included in the analysis. Duplicate tests (same date/time) were eliminated.
Race is considered a risk factor for prostate cancer only for African American patients, likely due to racial health disparities.17 Given this, we chose to categorize race as either African American or other, with a third category for missing/inconsistent reporting. Age at time of the PSA test was categorized into 4 groups (≤ 39, 40-54, 55-69, and ≥ 70 years) based on AUA guidelines.4 The annual PSA testing rate was calculated for each veteran with SCI as the number of PSA tests per year. A mean annual PSA test rate was then calculated as the weighted (by exposure time) mean value for all annual PSA testing rates from 2000 through 2017 for each age group and race. Annual exposure was calculated for each veteran and defined as the number of days a veteran was eligible to have a PSA test. This started with the date of SCI diagnosis and ended with either the date of death or the date of last PSA. If a veteran moved from one age group to another in 1 year, the first part of this year’s exposure was included in the calculation of the annual PSA testing rate for the younger group and the second part was included for the calculation of the older group. For deceased veterans, the death date was excluded from the exposure period, and their exposure period ended on the day before death.
Statistical Analysis
To compare PSA testing rates between African American race and other races, Poisson regression was used with exposure treated as an offset (exposures were summed across years for each veteran). An indicator (dummy) variable for African American race vs other races was coded, and statistical significance was set at P < .05. To check sensitivity for the Poisson assumption that the mean was equal to the variance, negative binomial regression was used. To assess for geographic PSA testing rate variability, the data were further analyzed based on the locations where PSA tests were performed. This subanalysis was limited to veterans who had all PSA tests in a single station. For each station, the average PSA testing rate was calculated for each veteran, and the mean for all annual PSA testing rates was used to determine station-specific PSA testing rates.
Results
A total of 45,274 veterans were initially identified of which 367 females were excluded (Figure 1).
The PSA testing rate rose for veterans in the age groups ≤ 39, 40 to 54, and 55 to 69 years (Figure 2A).
Of the cohort of 37,243 veterans, 28,396 (76.2%) had their post-SCI tests done at a single facility, 6770 (18.1%) at 2 locations, and 2077 (5.5%) at > 2 locations. Single-station group data were included in a subanalysis to determine the mean (SD) PSA testing rates, which for the 123 locations was 0.98 (0.36) tests per veteran per year (range, 0.2-3.0 tests per veteran per year).
To assess the impact of the 2012 USPSTF recommendations on PSA testing rates in veterans with SCI, mean PSA testing rates were calculated for 5 years before the recommendations (2007-2011) and compared with the average PSA testing rate for 5 years following the updated recommendations (2013-2017). The USPSTF updated its recommendation again in 2018 and acknowledged the potential benefit for PSA screening in certain patient populations.2,3 Surprisingly, and despite recommendations, the results show a significant increase in PSA testing rates in all age groups for all races (P < .001) (Figure 4).
Discussion
The goal of this study was to establish testing rates and analyze PSA testing trends across races and age groups in veterans with SCI. This is the largest cohort of patients with SCI analyzed in the literature. The key findings of this study were that despite clear AUA guidelines recommending against PSA testing in patients aged ≤ 39 years and ≥ 70 years, there are high rates of testing in veterans with SCI in these age groups (0.46 tests per year in those aged ≤ 39 years and 0.91 tests per year in those aged ≥ 70 years). In terms of race, as expected based on increased risk,
Prostate Cancer Incidence
Although the exact mechanism behind alterations in prostate function in the SCI population have yet to be fully elucidated, research suggests that the prostate behaves differently after SCI. Animal models of prostate gland denervation show decreased prostate volume and suggest that SCI may lead to a reduction in prostatic secretory function associated with autonomic dysfunction. Shim and colleagues hypothesized that impaired autonomic prostate innervation alters the prostatic volume and PSA in patients with SCI.10
Additional studies looking at actual PSA levels in men with SCI reveal conflicting data.10-15,20 Toricelli and colleagues retrospectively studied 140 men with SCI, of whom 34 had PSA levels available and found that mean PSA was not significantly different for patients with SCI compared with controls, but patients using clean intermittent catheterization had 2-fold higher PSA levels.21 In contrast, Konety and colleagues found that mean PSA was not significantly different from uninjured controls in their cohort of 79 patients with SCI, though they did find a correlation between indwelling catheter use and a higher PSA.22
Studies have shown an overall decreased risk of prostate cancer in patients with SCI, though the mechanism remains unclear. A large cohort study from Taiwan showed a lower risk of prostate cancer for 54,401 patients with SCI with an adjusted hazard ratio of 0.73.23 Patel and colleagues found the overall rate of prostate cancer in the population of veterans with SCI was lower than the general uninjured VA population, though this study was limited by scope with only 350 patients with SCI.24 A more recent systematic review and meta-analysis of 9 studies evaluating the prevalence of prostate cancer in men with SCI found a reduction of up to 65% in the risk of prostate cancer in men with SCI, and PSA was found to be a poor screening tool for prostate cancer due to large study heterogeneity.16
PSA Screening
This study identified widespread overscreening using the PSA test in veterans with SCI, which is likely attributable to many factors. Per VHA Directive 1176, all eligible veterans are offered yearly interdisciplinary comprehensive evaluations, including laboratory testing, and as such veterans with SCI have high rates of annual visit attendance due to the complexity of their care.9 PSA testing is included in the standard battery of laboratory tests ordered for all patients with SCI during their annual examinations. Additionally, many SCI specialists use the PSA level in patients with SCI for identifying cystitis or prostatitis in patients with colonization who may not experience typical symptoms. Everaert and colleagues demonstrated the clinical utility for localizing UTIs to the upper or lower tract, with elevated PSA indicating prostatitis. They found that serum PSA has a sensitivity of 68% and a specificity of 100% in the differential diagnosis of prostatitis and pyelonephritis.25 As such, the high PSA screening rates may be reflective of diagnostic use for infection rather than for cancer screening.
Likely as a response to the USPSTF recommendations, there has been a national slow decline in overall PSA screening rates since 2012.26-28 A study from Vetterlein and colleagues examining changes in the PSA screening trends related to USPSTF recommendations found an 8.5% decline in overall PSA screening from 2012 to 2014.29 However, the increase in PSA testing across all ages and races in the VA population with SCI over the same period is not entirely understood and suggests the need for further research and education in this area.
Limitations
This study is limited by the use of data identified by ICD codes rather than by review of individual health records. This required the use of decision algorithms for data points, such as the date of SCI. In addition, analysis was not able to capture shared decision making that may have contributed to PSA screening outside the recommended age ranges based on additional risk factors, such as family history of lethal malignancy. Furthermore, a detailed attempt to define specific age-adjusted PSA levels was beyond the scope of this study but will be addressed in later publications. In addition, we did not exclude individuals with a diagnosis of prostate adenocarcinoma, prostatitis, or recurrent UTIs because the onset, duration, and severity of disease could not be definitively ascertained. Finally, veterans with SCI are unique and may not be reflective of individuals with SCI who do not receive care within the VA. However, despite these limitations, this is, to our knowledge, the largest and most comprehensive study evaluating PSA testing rates in individuals with SCI.
Conclusions
Currently, PSA screening is recommended following shared decision making for patients at average risk aged 55 to 70 years. Patients with SCI experience many conditions that may affect PSA values, but data regarding normal PSA ranges and rates of prostate cancer in this population remain sparse. The study demonstrated high rates of overtesting in veterans with SCI, higher than expected testing rates in African American veterans, a paradoxical increase in PSA testing rates after the 2012 publication of the USPSTF PSA guidelines, and wide variability in testing rates depending on VA location.
African American men were tested at higher rates across all age groups, including in patients aged > 70 years. To balance the benefits of detecting clinically significant prostate cancer vs the risks of invasive testing in high-risk populations with SCI, more work is needed to determine the clinical impact of screening practices. Future work is currently ongoing to define age-based PSA values in patients with SCI.
Acknowledgments
This research was supported in part through funding from the Center for Rehabilitation Science and Engineering, Virginia Commonwealth University Health System.
1. American Cancer Society. Key statistics for prostate cancer. Updated January 12, 2023. Accessed June 2, 2023. https://www.cancer.org/cancer/prostate-cancer/about/key-statistics.html
2. Moyer VA; U.S. Preventive Services Task Force. Screening for prostate cancer: U.S. Preventive Services Task Force recommendation statement. Ann Intern Med. 2012;157(2):120-134. doi:10.7326/0003-4819-157-2-201207170-00459
3. US Preventive Services Task Force, Grossman DC, Curry SJ, et al. Screening for Prostate Cancer: US Preventive Services Task Force Recommendation Statement. JAMA. 2018;319(18):1901-1913. doi:10.1001/jama.2018.3710
4. Carter HB, Albertsen PC, Barry MJ, et al. Early detection of prostate cancer: AUA Guideline. J Urol. 2013;190(2):419-426. doi:10.1016/j.juro.2013.04.119
5. US Department of Veterans Affairs, Veterans Health Administration. Updated August 15, 2022. Accessed June 2, 2023. https://www.va.gov/health/aboutVHA.asp
6. US Department of Veterans Affairs. Spinal cord injuries and disorders system of care. Updated January 31, 2022. Accessed June 2, 2023. https://www.sci.va.gov/VAs_SCID_System_of_Care.asp
7. DeVivo MJ, Chen Y, Wen H. Cause of death trends among persons with spinal cord injury in the United States: 1960-2017. Arch Phys Med Rehabil. 2022;103(4):634-641. doi:10.1016/j.apmr.2021.09.019
8. Cao Y, DiPiro N, Krause JS. Health factors and spinal cord injury: a prospective study of risk of cause-specific mortality. Spinal Cord. 2019;57(7):594-602. doi:10.1038/s41393-019-0264-6
9. US Department of Veterans Affairs, Veterans Health Administration. VHA Directive 1176(2): Spinal Cord Injuries and Disorders System of Care. Published September 30, 2019. Accessed June 2, 2023. https://www.va.gov/vhapublications/ViewPublication.asp?pub_ID=8523
10. Shim HB, Jung TY, Lee JK, Ku JH. Prostate activity and prostate cancer in spinal cord injury. Prostate Cancer Prostatic Dis. 2006;9(2):115-120. doi:10.1038/sj.pcan.4500865
11. Lynne CM, Aballa TC, Wang TJ, Rittenhouse HG, Ferrell SM, Brackett NL. Serum and semen prostate specific antigen concentrations are different in young spinal cord injured men compared to normal controls. J Urol. 1999;162(1):89-91. doi:10.1097/00005392-199907000-00022
12. Bartoletti R, Gavazzi A, Cai T, et al. Prostate growth and prevalence of prostate diseases in early onset spinal cord injuries. Eur Urol. 2009;56(1):142-148. doi:10.1016/j.eururo.2008.01.088
13. Pannek J, Berges RR, Cubick G, Meindl R, Senge T. Prostate size and PSA serum levels in male patients with spinal cord injury. Urology. 2003;62(5):845-848. doi:10.1016/s0090-4295(03)00654-x
14. Pramudji CK, Mutchnik SE, DeConcini D, Boone TB. Prostate cancer screening with prostate specific antigen in spinal cord injured men. J Urol. 2002;167(3):1303-1305.
15. Alexandrino AP, Rodrigues MA, Matsuo T. Evaluation of serum and seminal levels of prostate specific antigen in men with spinal cord injury. J Urol. 2004;171(6 Pt 1):2230-2232. doi:10.1097/01.ju.0000125241.77517.10
16. Barbonetti A, D’Andrea S, Martorella A, Felzani G, Francavilla S, Francavilla F. Risk of prostate cancer in men with spinal cord injury: a systematic review and meta-analysis. Asian J Androl. 2018;20(6):555-560. doi:10.4103/aja.aja_31_18
17. Vince RA Jr, Jiang R, Bank M, et al. Evaluation of social determinants of health and prostate cancer outcomes among black and white patients: a systematic review and meta-analysis. JAMA Netw Open. 2023;6(1):e2250416. Published 2023 Jan 3. doi:10.1001/jamanetworkopen.2022.50416
18. Smith ZL, Eggener SE, Murphy AB. African-American prostate cancer disparities. Curr Urol Rep. 2017;18(10):81. Published 2017 Aug 14. doi:10.1007/s11934-017-0724-5
19. Jeong SH, Werneburg GT, Abouassaly R, Wood H. Acquired and congenital spinal cord injury is associated with lower likelihood of prostate specific antigen screening. Urology. 2022;164:178-183. doi:10.1016/j.urology.2022.01.044
20. Benaim EA, Montoya JD, Saboorian MH, Litwiller S, Roehrborn CG. Characterization of prostate size, PSA and endocrine profiles in patients with spinal cord injuries. Prostate Cancer Prostatic Dis. 1998;1(5):250-255. doi:10.1038/sj.pcan.4500246
21. Torricelli FC, Lucon M, Vicentini F, Gomes CM, Srougi M, Bruschini H. PSA levels in men with spinal cord injury and under intermittent catheterization. Neurourol Urodyn. 2011;30(8):1522-1524. doi:10.1002/nau.21119
22. Konety BR, Nguyen TT, Brenes G, et al. Evaluation of the effect of spinal cord injury on serum PSA levels. Urology. 2000;56(1):82-86. doi:10.1016/s0090-4295(00)00548-3
23. Lee WY, Sun LM, Lin CL, et al. Risk of prostate and bladder cancers in patients with spinal cord injury: a population-based cohort study. Urol Oncol. 2014;32(1):51.e1-51.e517. doi:10.1016/j.urolonc.2013.07.019
24. Patel N, Ngo K, Hastings J, Ketchum N, Sepahpanah F. Prevalence of prostate cancer in patients with chronic spinal cord injury. PM R. 2011;3(7):633-636. doi:10.1016/j.pmrj.2011.04.024
25. Everaert K, Oostra C, Delanghe J, Vande Walle J, Van Laere M, Oosterlinck W. Diagnosis and localization of a complicated urinary tract infection in neurogenic bladder disease by tubular proteinuria and serum prostate specific antigen. Spinal Cord. 1998;36(1):33-38. doi:10.1038/sj.sc.3100520
26. Drazer MW, Huo D, Eggener SE. National prostate cancer screening rates after the 2012 US Preventive Services Task Force recommendation discouraging prostate-specific antigen-based screening. J Clin Oncol. 2015;33(22):2416-2423. doi:10.1200/JCO.2015.61.6532
27. Sammon JD, Abdollah F, Choueiri TK, et al. Prostate-specific antigen screening after 2012 US Preventive Services Task Force recommendations. JAMA. 2015;314(19):2077-2079. doi:10.1001/jama.2015.7273
28. Jemal A, Fedewa SA, Ma J, et al. Prostate cancer incidence and PSA testing patterns in relation to USPSTF screening recommendations. JAMA. 2015;314(19):2054-2061. doi:10.1001/jama.2015.14905
29. Vetterlein MW, Dalela D, Sammon JD, et al. State-by-state variation in prostate-specific antigen screening trends following the 2011 United States Preventive Services Task Force panel update. Urology. 2018;112:56-65. doi:10.1016/j.urology.2017.08.055