User login
Aggregate response benefit in skin clearance and itch reduction favor upadacitinib over dupilumab in AD
Key clinical point: The overall improvement in skin clearance and itch reduction suggested a preference for 30 mg upadacitinib over dupilumab and that for 15 mg or 30 mg upadacitinib over placebo in patients with moderate-to-severe atopic dermatitis (AD).
Major finding: At week 24, the aggregate response benefit for skin clearance and itch, respectively, was 32.5% and 25.8% higher with 30 mg upadacitinib vs dupilumab. The benefit favored upadacitinib over dupilumab as early as week 4. Moreover, 15 and 30 mg upadacitinib showed similar benefits over placebo.
Study details: This post hoc analysis of the data from phase 3 studies (Heads Up, Measure Up 1, and Measure Up 2) included 2356 patients with moderate-to-severe AD who received upadacitinib, dupilumab, or placebo.
Disclosures: This study was sponsored by AbbVie. Five authors declared being employees of or owning stock or stock options in AbbVie. Several authors declared being consultants, speakers, or advisors of or having other ties with various sources, including AbbVie.
Source: Silverberg JI et al. Aggregate response benefit in skin clearance and itch reduction with upadacitinib or dupilumab in patients with moderate-to-severe atopic dermatitis. Dermatitis. 2023 (Dec 18). doi: 10.1089/derm.2023.0153
Rademikibart shows promise in moderate-to-severe atopic dermatitis
Key clinical point: Rademikibart administered at 2-week (Q2W) and 4-week (Q4W) intervals was well-tolerated and effective in improving the overall symptoms in adults with moderate-to-severe atopic dermatitis (AD).
Major finding: At week 16, the least squares mean percent reductions in the Eczema Area Severity Index scores with 300 mg Q2W (−63.0%; P = .0007), 150 mg Q2W (−57.6%; P = .0067), and 300 mg Q4W (−63.5%; P = .0004) rademikibart were significantly higher than that with placebo (−39.7%). Treatment-emergent adverse event rates were similar with rademikibart (48.2%) and placebo (53.6%).
Study details: This phase 2 trial included 226 anti-interleukin (IL)-4Ra/IL-13 treatment-naive adults with moderate-to-severe AD who were randomly assigned (1:1:1:1) to receive rademikibart (300 mg Q2W, 150 mg Q2W, or 300 mg Q4W) or placebo for 16 weeks following a 600 mg loading dose of rademikibart or placebo, respectively, on day 1.
Disclosures: This study was funded by Connect Biopharma. Ten authors declared being employees or shareholders of Connect Biopharma. The other authors declared being consultants of or having other ties with various sources, including Connect Biopharma.
Source: Silverberg JI et al. Efficacy and safety of rademikibart (CBP-201), a next-generation monoclonal antibody targeting IL-4Rα, in adults with moderate-to-severe atopic dermatitis: A phase 2 randomized trial (CBP-201-WW001). J Allergy Clin Immunol. 2023 (Dec 27). doi: 10.1016/j.jaci.2023.11.924
Interim analysis confirms the safety and efficacy of dupilumab in atopic dermatitis
Key clinical point: Dupilumab led to a rapid improvement in disease control that was sustained through 2 years and showed an acceptable safety profile in adult and adolescent patients with moderate-to-severe atopic dermatitis (AD).
Major finding: Dupilumab led to an improvement in the mean Eczema Area and Severity Index score at 3 months (5.5) and 24 months (2.6) compared with baseline (16.1), with a mean absolute change from baseline to 24 months being −14.0. No new safety signals were observed.
Study details: Findings are from a 2-year interim analysis of real-world data from the PROSE registry study including 764 patients with moderate-to-severe AD (age ≥ 12 years) who initiated dupilumab.
Disclosures: The PROSE registry is sponsored by Sanofi and Regeneron Pharmaceuticals Inc. Three authors declared being employees of or holding stock or stock options in Sanofi or Regeneron. The other authors declared serving as consultants, investigators, or advisory board members for or receiving speaker or investigator fees from Sanofi, Regeneron, and others.
Source: Simpson EL et al. Real-world effectiveness of dupilumab in adult and adolescent patients with atopic dermatitis: 2-year Interim data from the PROSE registry. Dermatol Ther (Heidelb). 2024 (Jan 4). doi: 10.1007/s13555-023-01061-4
Atopic dermatitis not linked with increased venous thromboembolism risk
Key clinical point: Atopic dermatitis (AD) is associated with a lower risk for venous thromboembolism (VTE) than several rheumatologic and gastrointestinal immune-mediated inflammatory diseases (IMID).
Major finding: Patients with AD vs AD-matched control individuals did not have a higher risk for VTE (adjusted hazard ratio [aHR] 0.96; 95% CI 0.90-1.02). Compared with patients having AD, those with Crohn’s disease (aHR 1.71; 95% CI 1.47-1.99), rheumatoid arthritis (aHR 1.57; 95% CI 1.43-1.72), ulcerative colitis (aHR 1.84; 95% CI 1.63-2.09), and ankylosing spondylitis (aHR 1.45; 95% CI 1.03-2.03) had higher risks for VTE.
Study details: This retrospective observational cohort study analyzed 2,061,222 adult patients with IMID, including 1,098,633 patients with AD who were matched with 1,098,633 control individuals without IMID.
Disclosures: This study was funded by AbbVie Inc. JF Merola declared being a consultant or investigator for AbbVie and others. The other authors declared being current or former employees of or owning stocks or stock options in AbbVie.
Source: Merola JF et al. Venous thromboembolism risk is lower in patients with atopic dermatitis than other immune-mediated inflammatory diseases: A retrospective, observational, comparative cohort study using US claims data. J Am Acad Dermatol. 2023 (Dec 23). doi: 10.1016/j.jaad.2023.12.027
Chest pain and shortness of breath
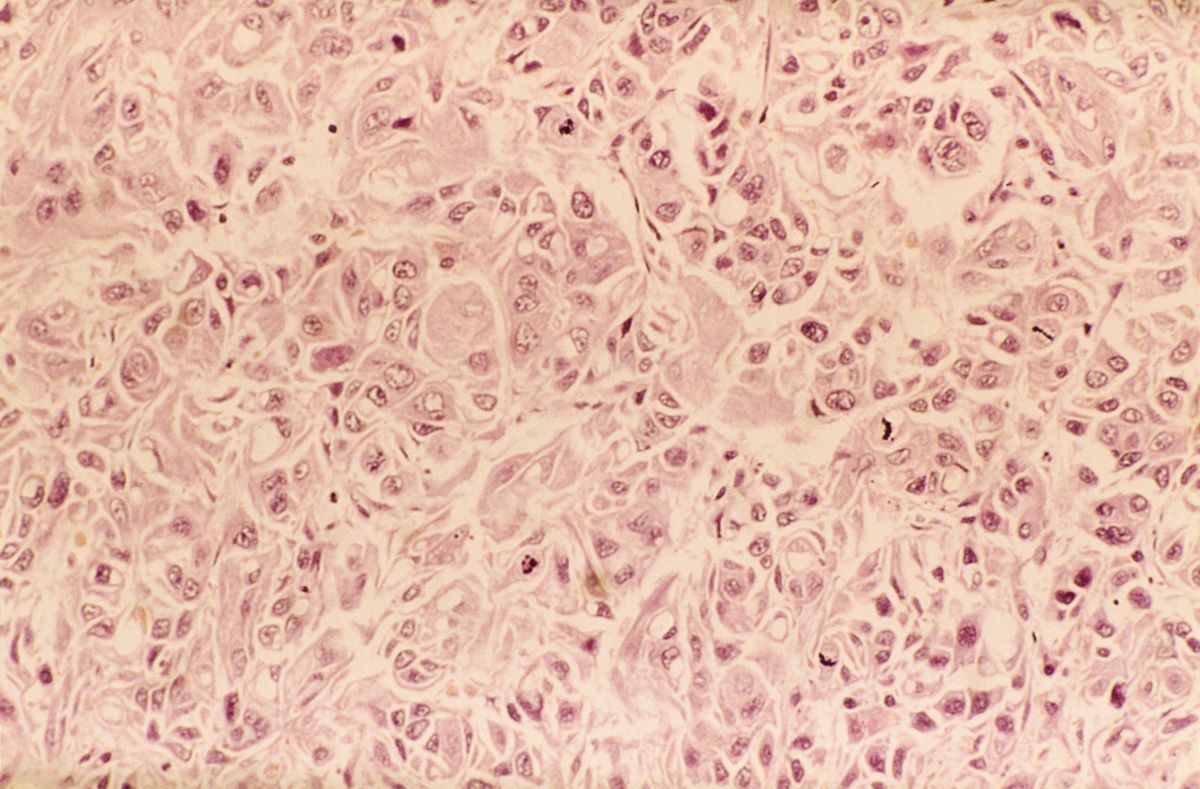
In a lifelong smoker, a tumor in the periphery of the lung and histology showing glandular cells with some neuroendocrine differentiation is most likely large cell carcinoma, a type of non–small cell lung cancer (NSCLC). Although small cell lung cancer is also associated with smoking, histology typically demonstrates highly cellular aspirates with small blue cells with very scant or null cytoplasm, loosely arranged or in a syncytial pattern. Bronchial adenoma is unlikely, given the patient's unintentional weight loss and fatigue over the past few months. Mesothelioma is most associated with asbestos exposure and is found in the lung pleura, which typically presents with pleural effusion.
Lung cancer is the top cause of cancer deaths in the US, second only to prostate cancer in men and breast cancer in women; approximately 85% of all lung cancers are classified as NSCLC. Histologically, NSCLC is further categorized into adenocarcinoma, squamous cell carcinoma, and large cell carcinoma (LCC). When a patient presents with intrathoracic symptoms (including cough, chest pain, wheezing, or dyspnea) and a pulmonary nodule on chest radiography, NSCLC is typically suspected as a possible diagnosis. Smoking is the most common cause of this lung cancer (78% in men, 90% in women).
Several methods confirm the diagnosis of NSCLC, including bronchoscopy, sputum cytology, mediastinoscopy, thoracentesis, thoracoscopy, and transthoracic needle biopsy. Which method is chosen depends on the primary lesion location and accessibility. Histologic evaluation helps differentiate between the various subtypes of NSCLC. LCC is a subset of NSCLC that is a diagnosis of exclusion. Histologically, LCC is poorly differentiated, and 90% of cases will show squamous, glandular, or neuroendocrine differentiation.
When first diagnosed with NSCLC, 20% of patients have cancer confined to a specific area, 25% of patients have cancer that has spread to nearby areas, and 55% of patients have cancer that has spread to distant body parts. The specific symptoms experienced by patients will vary depending on the location of the cancer. The prognosis for NSCLC depends on the staging of the tumor, nodes, and metastases, the patient's performance status, and any existing health conditions. In the US, the 5-year relative survival rate is 61.2% for localized disease, 33.5% for regional disease, and 7.0% for disease with distant metastases.
Treatment of NSCLC also varies according to the patient's functional status, tumor stage, molecular characteristics, and comorbidities. Generally, patients with stage I, II, or III NSCLC are treated with the intent to cure, which can include surgery, chemotherapy, radiation therapy, or a combined approach. Lobectomy or resection is generally accepted as an approach for surgical intervention on early-stage NSCLC; however, for stages higher than IB (including stage II/III), patients are recommended to undergo adjuvant chemotherapy. Patients with stage IV disease (or recurrence after initial management) are typically treated with systemic therapy or should be considered for palliative treatment to improve quality of life and overall survival.
Karl J. D'Silva, MD, Clinical Assistant Professor, Department of Medicine, Tufts University School of Medicine, Boston; Medical Director, Department of Oncology and Hematology, Lahey Hospital and Medical Center, Peabody, Massachusetts.
Karl J. D'Silva, MD, has disclosed no relevant financial relationships.
Image Quizzes are fictional or fictionalized clinical scenarios intended to provide evidence-based educational takeaways.
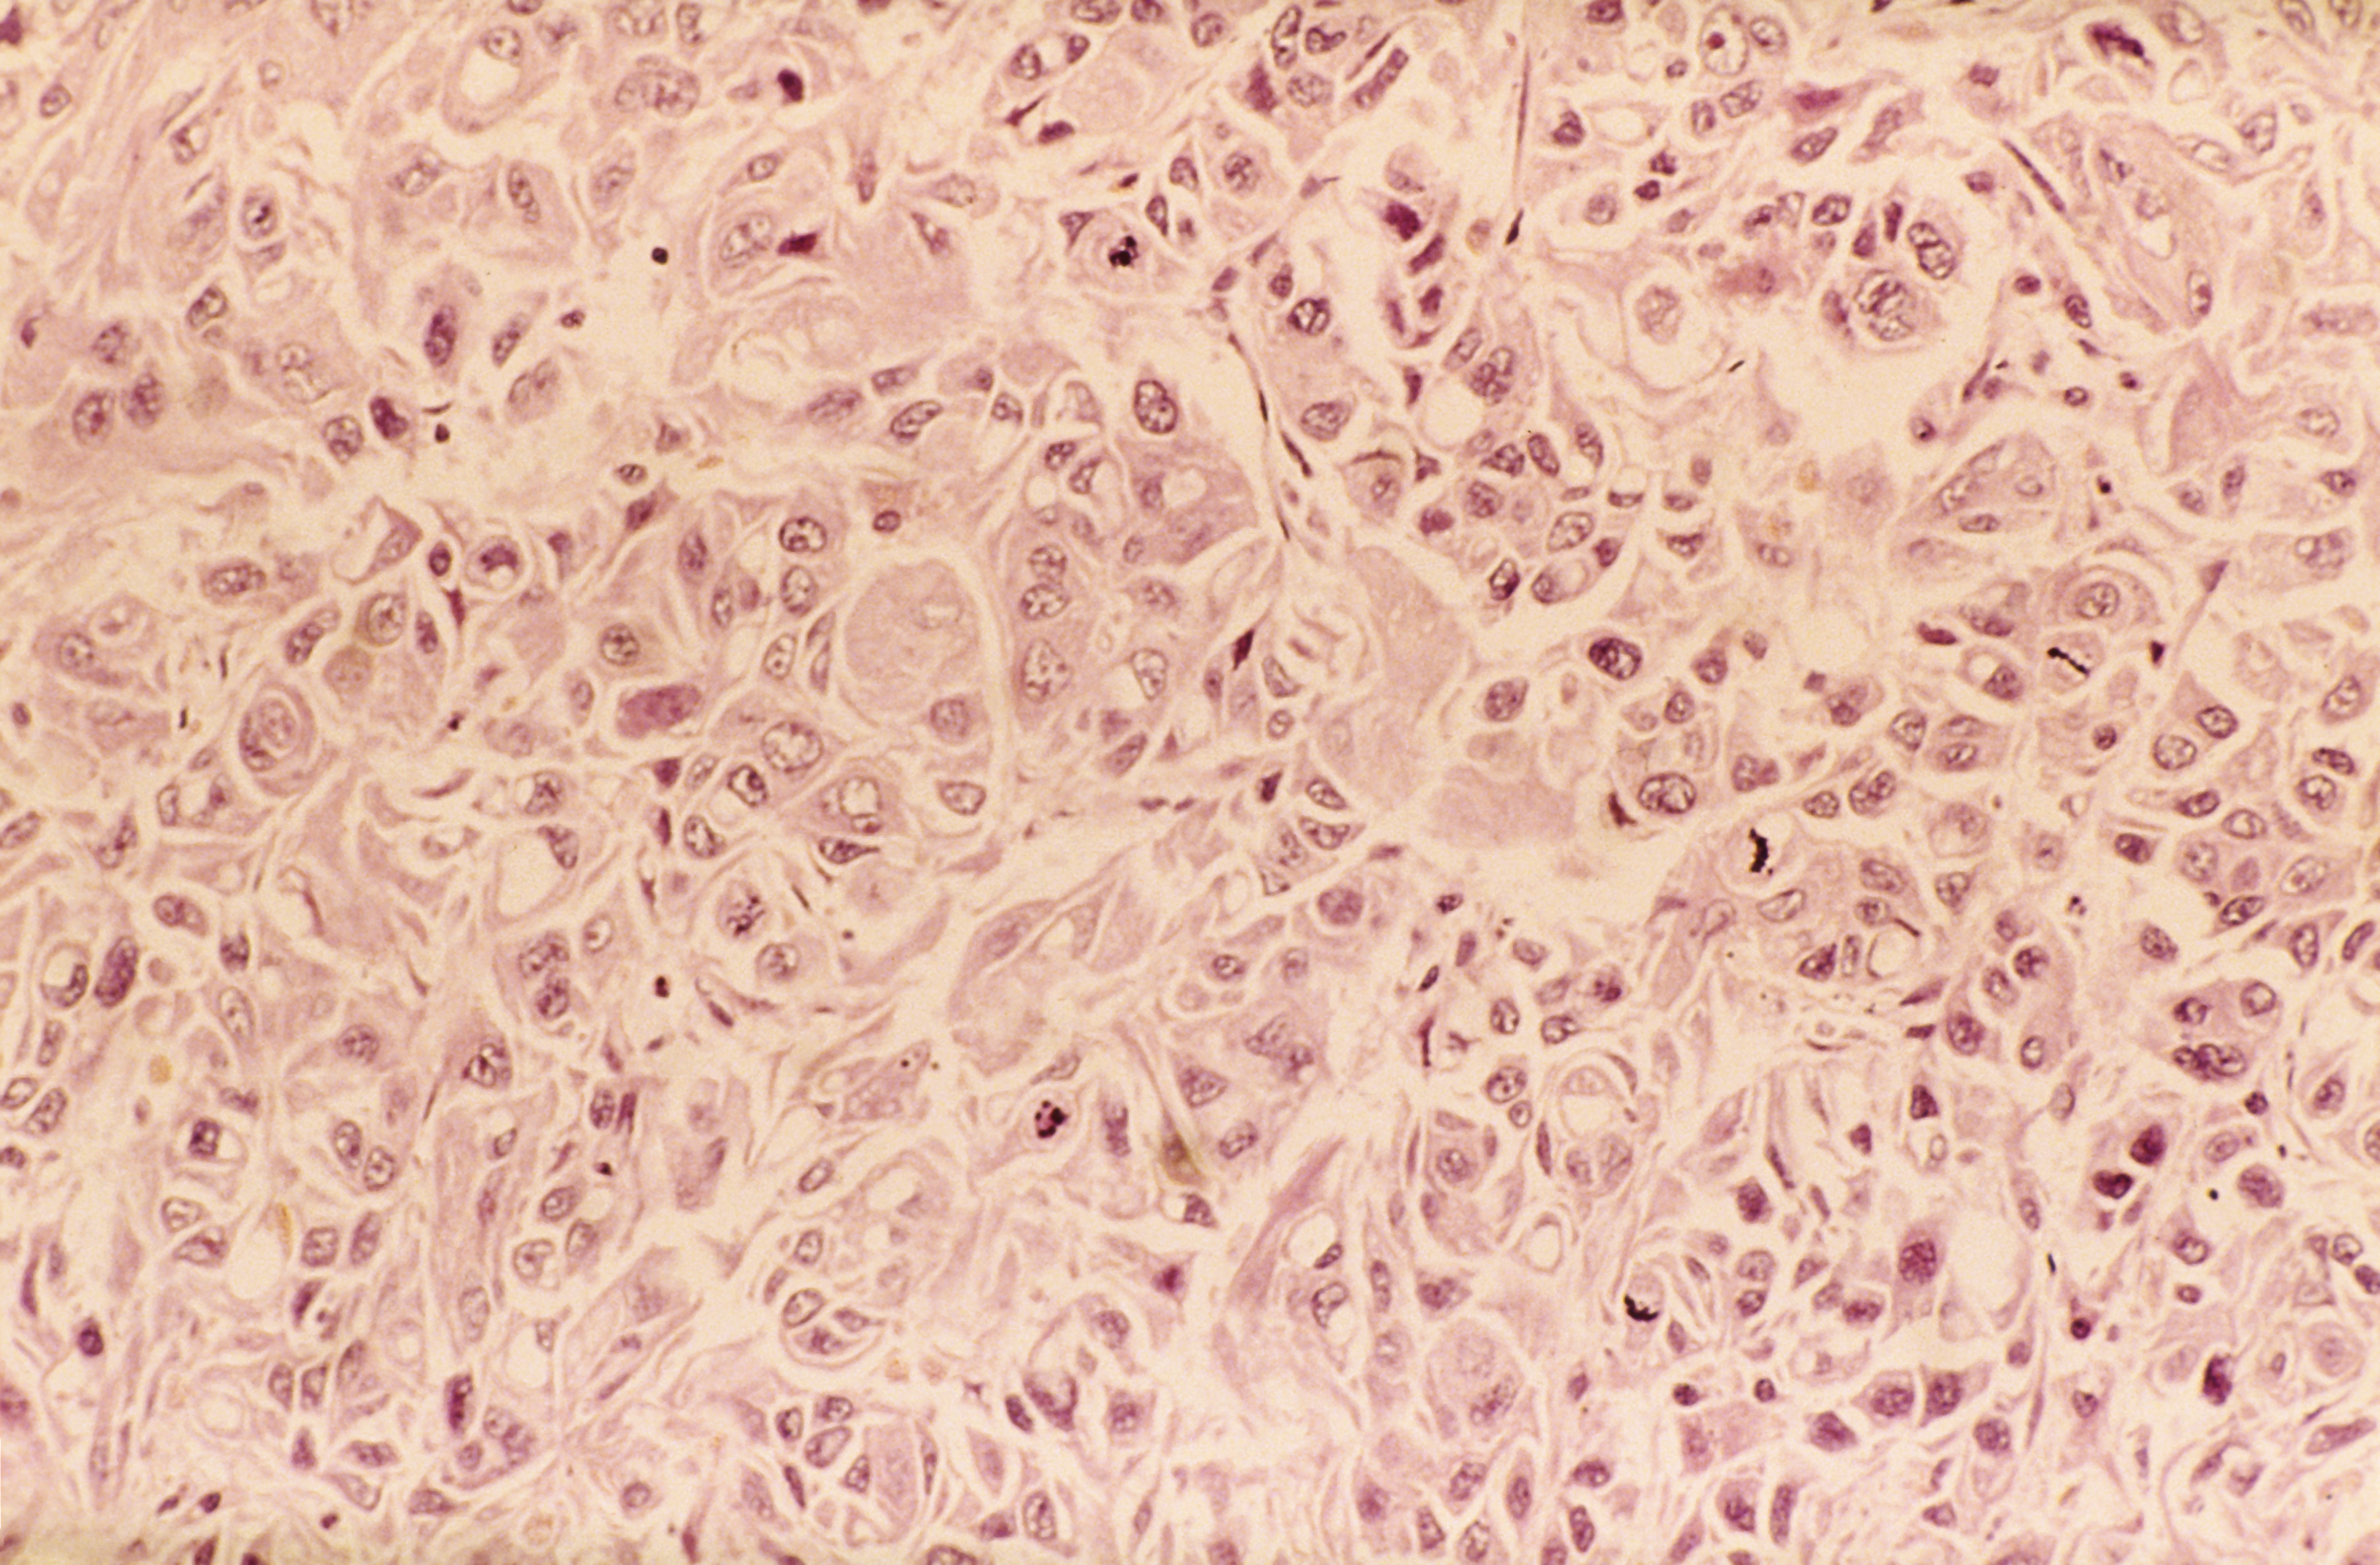
A 62-year-old man presents to his primary care physician with a persistent cough, dyspnea, unintentional weight loss, and fatigue over the past few months. He has a history of smoking for 30 years but quit 5 years ago. He also reports occasional chest pain and shortness of breath during physical activities. Physical examination reveals crackles in the middle lobe of the right lung. The patient occasionally coughs up blood. Chest radiography shows a large mass in the right lung, and a subsequent CT scan confirms a large peripheral mass of solid attenuation with an irregular margin. The patient undergoes thoracoscopy to obtain a biopsy sample from the tumor for further analysis. The biopsy reveals glandular cells with some neuroendocrine differentiation.
Preventing ASCVD Events: Using Coronary Artery Calcification Scores to Personalize Risk and Guide Statin Therapy
Lung cancer is the most common cause of cancer mortality, and cigarette smoking is the most significant risk factor. Several randomized clinical trials have shown that lung cancer screening (LCS) with nonelectrocardiogram (ECG)-gated low-dose computed tomography (LDCT) reduces both lung cancer and all-cause mortality.1,2 Hence, the US Preventive Screening Task Force (USPSTF) recommends annual screening with LDCT in adults aged 50 to 80 years who have a 20-pack-year smoking history and currently smoke or have quit within the past 15 years.3
Smoking is also an independent risk factor for atherosclerotic cardiovascular disease (ASCVD), and LCS clinical trials acknowledge that mortality from ASCVD events exceeds that of lung cancer.4,5 In an analysis of asymptomatic individuals from the Framingham Heart Offspring study who were eligible for LCS, the ASCVD event rate during a median (IQR) follow-up of 11.4 (9.7-12.0) years was 12.6%.6 However, despite the high rate of ASCVD events in this population, primary prevention strategies are consistently underused. In a study of 5495 individuals who underwent LCS with LDCT, only 40% of those eligible for statins had one prescribed, underscoring the missed opportunity for preventing ASCVD events during LCS.7 Yet the interactions for shared decision making and the availability of coronary artery calcification (CAC) scores from the LDCT provide an ideal window for intervening and preventing ASCVD events during LCS.
CAC is a hallmark of atherosclerotic plaque development and is proportional to plaque burden and ASCVD risk.8 Because of the relationship between CAC, subclinical atherosclerosis, and ASCVD risk, there is an opportunity to use CAC detected by LDCT to predict ASCVD risk and guide recommendations for statin treatment in individuals enrolled in LCS. Traditionally, CAC has been visualized by ECG-gated noncontrast CT scans with imaging protocols specifically designed to visualize the coronary arteries, minimize motion artifacts, and reduce signal noise. These scans are specifically done for primary prevention risk assessment and report an Agatston score, a summed measure based on calcified plaque area and maximal density.9 Results are reported as an overall CAC score and an age-, sex-, and race-adjusted percentile of CAC. Currently, a CAC score ≥ 100 or above the 75th percentile for age, sex, and race is considered abnormal.
High-quality evidence supports CAC scores as a strong predictor of ASCVD risk independent of age, sex, race, and other traditional risk factors.10-12 In asymptomatic individuals, a CAC score of 0 is a strong, negative risk factor associated with very low annualized mortality rates and cardiovascular (CV) events, so intermediate-risk individuals can be reclassified to a lower risk group avoiding or delaying statin therapy.13 As a result, current primary prevention guidelines allow for CAC scoring in asymptomatic, intermediate-risk adults where the clinical benefits of statin therapy are uncertain, knowing the CAC score will aid in the clinical decision to delay or initiate statin therapy.
Unlike traditional ECG-gated CAC scoring, LDCT imaging protocols are non–ECG-gated and performed at variable energy and slice thickness to optimize the detection of lung nodules. Early studies suggested that CAC detected by LDCT could be used in lieu of traditional CAC scoring to personalize risk.14,15 Recently, multiple studies have validated the accuracy and reproducibility of LDCT to detect and quantify CAC. In both the NELSON and the National Lung Screening Trial (NLST) LCS trials, higher visual and quantitative measures of CAC were independently and incrementally associated with ASCVD risk.16,17 A subsequent review and meta-analysis of 6 LCS trials confirmed CAC detected by LDCT to be an independent predictor of ASCVD events regardless of the method used to measure CAC.18

There is now consensus that either an Agatston score or a visual estimate of CAC be reported on all noncontrast, noncardiac chest CT scans irrespective of the indication or technique, including LDCT scans for LCS using a uniform reporting system known as the Coronary Artery Calcium Data and Reporting System (CAC-DRS).19 The CAC-DRS simplifies reporting and adds modifiers indicating if the reported score is visual (V) or Agatston (A) and number of vessels involved. For example, CAC-DRS A0 or CAC-DRS V0 would indicate an Agatston score of 0 or a visual score of 0. CAC-DRS A1/N2 would indicate a total Agatston score of 1-99 in 2 coronary arteries. The currently agreed-on CAC-DRS risk groups are listed in the Table, along with their corresponding visual score or Agatston score and anticipated 10-year event rate, irrespective of other risk factors.20
As LCS efforts increase, primary care practitioners will receive LDCT reports that now incorporate an estimation of CAC (visual or quantitative). Thus, it will be increasingly important to know how to interpret and use these scores to guide clinical decisions regarding the initiation of statin therapy, referral for additional testing, and when to seek specialty cardiology care. For instance, does the absence of CAC (CAC = 0) on LDCT predict a low enough risk for statin therapy to be delayed or withdrawn? Does increasing CAC scores on follow-up LDCT in individuals on statin therapy represent treatment failure? When should CAC scores trigger additional testing, such as a stress test or referral to cardiology specialty care?
Primary Prevention in LCS
The initial approach to primary prevention in LCS is no different from that recommended by the 2018 multisociety guidelines on the management of blood cholesterol, the 2019 American College of Cardiology/American Heart Association (ACC/AHA) guideline on primary prevention, or the 2022 USPTSF recommendations on statin use for primary prevention of CV disease in adults.21-23 For a baseline low-density lipoprotein cholesterol (LDL-C) ≥ 190 mg/dL, high-intensity statin therapy is recommended without further risk stratification. Individuals with diabetes also are at higher-than-average risk, and moderate-intensity statin therapy is recommended.
For individuals not in either group, a validated ASCVD risk assessment tool is recommended to estimate baseline risk. The most validated tool for estimating risk in the US population is the 2013 ACC/AHA Pooled Cohort Equation (PCE) which provides an estimate of the 10-year risk for fatal and myocardial infarction and fatal and nonfatal stroke.24 The PCE risk calculator uses age, presence of diabetes, sex, smoking history, total cholesterol, high-density lipoprotein cholesterol, systolic blood pressure, and treatment for hypertension to place individuals into 1 of 4 risk groups: low (< 5%), borderline (5% to < 7.5%), intermediate (≥ 7.5% to < 20%), and high (≥ 20%). Clinicians should be aware that the PCE only considers current smoking history and not prior smoking history or cumulative pack-year history. This differs from eligibility for LCS where recent smoking plays a larger role. All these risk factors are important to consider when evaluating risk and discussing risk-reducing strategies like statin therapy.
The 2018 multisociety guidelines and the 2019 primary prevention guidelines set the threshold for considering initiation of statin therapy at intermediate risk ≥ 7.5%.21,22 The 2020 US Department of Veterans Affairs/Department of Defense guidelines set the threshold for considering statin therapy at an estimated 10-year event rate of 12%, whereas the 2022 UPSTF recommendations set the threshold at 10% with additional risk factors as the threshold for statin therapy.23,25 The reasons for these differences are beyond the scope of this review, but all these guidelines use the PCE to estimate baseline risk as the starting point for clinical decision making.
The PCE was originally derived and validated in population studies dating to the 1960s when the importance of diet, exercise, and smoking cessation in reducing ASCVD events was not well appreciated. The application of the PCE in more contemporary populations shows that it overestimates risk, especially in older individuals and women.26,27 Overestimation of risk has the potential to result in the initiation of statin therapy in individuals in whom the actual clinical benefit would otherwise be small.

To address this issue, current guidelines allow the use of CAC scoring to refine risk in individuals who are classified as intermediate risk and who otherwise desire to avoid lifelong statin therapy. Using current recommendations, we make suggestions on how to use CAC scores from LDCT to aid in clinical decision making for individuals in LCS (Figure).
No Coronary Artery Calcification
Between 25% and 30% of LDCT done for LCS will show no CAC.14,16 In general population studies, a CAC score of 0 is a strong negative predictor when there are no other risk factors.13,28 In contrast, the negative predictive ability of a CAC score of 0 in individuals with a smoking history who are eligible for LCS is unproven. In multivariate modeling, a CAC score of 0 did not reduce the significant hazard of all-cause mortality in patients with diabetes or smokers.29 In an analysis of 44,042 individuals without known heart disease referred for CAC scoring, the frequency of a CAC score of 0 was only modestly lower in smokers (38%) compared with nonsmokers (42%), yet the all-cause mortality rate was significantly higher.30 In addition, Multi-Ethnic Study of Atherosclerosis (MESA) participants who were current smokers or eligible for LCS and had a CAC score of 0 had an observed 11-year ASCVD event rate of 13.4% and 20.8%, respectively, leading to the conclusion that a CAC score of 0 may not be predictive of minimal risk in smokers and those eligible for LCS.31 Additionally, in LCS-eligible individuals, the PCE underestimated event rates and incorporation of CAC scores did not significantly improve risk estimation. Finally, data from the NLST screening trial showed that the absence of CAC on LDCT was not associated with better survival or lower CV mortality compared with individuals with low CAC scores.32
The question of whether individuals undergoing LCS with LDCT who have no detectable CAC can avoid statin therapy is an unresolved issue; no contemporary studies have looked specifically at the relationship between estimated risk, a CAC score of 0, and ASCVD outcomes in individuals participating in LCS. For these reasons, we recommend moderate-intensity statin therapy when the estimated risk is intermediate because it is unclear that either an Agatston score of 0 reclassifies intermediate-risk LCS-eligible individuals to a lower risk group.
For the few borderline risk (estimated risk, 5% to < 7.5%) LCS-eligible individuals, a CAC score of 0 might confer low short-term risk but the long-term benefit of statin therapy on reducing subsequent risk, the presence of other risk factors, and the willingness to stop smoking should all be considered. For these individuals who elect to avoid statin therapy, annual re-estimation of risk at the time of repeat LDCT is recommended. In these circumstances, referral for traditional Agatston scoring is not likely to change decision making because the sensitivity of the 2 techniques is very similar.
Agatston Score of 1-99 or CAC-DRS or Visual Score of 1
In general population studies, these scores correspond to borderline risk and an estimated 10-year event rate of just under 7.5%.20 In both the NELSON and NLST LCS trials, even low amounts of CAC regardless of the scoring method were associated with higher observed ASCVD mortality when adjusted for other baseline risk factors.32 Thus, in patients undergoing LCS with intermediate and borderline risk, a CAC score between 1 and 99 or a visual estimate of 1 indicates the presence of subclinical atherosclerosis, and moderate-intensity statin therapy is reasonable.
Agatston Score of 100-299 or CAC-DRS or Visual Score of 2
Across all ages, races, and sexes, CAC scores between 100 to 299 are associated with an event rate of about 15% over 10 years.20 In the NELSON LCS trial, the adjusted hazard ratio for ASCVD events with a nontraditional Agatston score of 101 to 400 was 6.58.33 Thus, in patients undergoing LCS with a CAC score of 100 to 299, regardless of the baseline risk estimate, the projected absolute event rate at 10 years would be about 20%. Moderate-intensity statin therapy is recommended to reduce the baseline LDL-C by 30% to 49%.
Agatston Score of > 300 or CAC-DRS or Visual Score of 3
Agatston CAC scores > 300 are consistent with a 10-year incidence of ASCVD events of > 15% regardless of age, sex, or race and ethnicity.20 In the Calcium Consortium, a CAC > 400 was correlated with an event rate of 13.6 events/1000 person-years.12 In a Walter Reed Military Medical Center study, a CAC score > 400 projected a cumulative incidence of ASCVD events of nearly 20% at 10 years.34 In smokers eligible for LCS, a CAC score > 300 projected a 10-year ASCVD event rate of 25%.29 In these patients, moderate-intensity statin therapy is recommended, although high-intensity statin therapy can be considered if there are other risk factors.
Agatston Score ≥ 1000
The 2018 consensus statement on CAC reporting categorizes all CAC scores > 300 into a single risk group because the recommended treatment options do not differ.19 However, recent data suggest this might not be the case since individuals with very high CAC scores experience high rates of events that might justify more aggressive intervention. In an analysis of individuals who participated in the CAC Consortium with a CAC score ≥ 1000, the all-cause mortality rate was 18.8 per 1000 person-years with a CV mortality rate of 8 per 1000 person-years.35 Individuals with very high levels of CAC > 1000 also have a greater number of diseased coronary arteries, higher involvement of the left main coronary artery, and significantly higher event rates compared with those with a CAC of 400 to 999.36 In an analysis of individuals from the NLST trial, nontraditionally measured Agatston score > 1000 was associated with a hazard ratio for coronary artery disease (CAD) mortality of 3.66 in men and 5.81 in women.17 These observed and projected levels of risk are like that seen in secondary prevention trials, and some experts have recommended the use of high-intensity statin therapy to reduce LDL-C to < 70 mg/dL.37
Primary Prevention in Individuals aged 76 to 80 years
LCS can continue through age 80 years, while the PCE and primary prevention guidelines are truncated at age 75 years. Because age is a major contributor to risk, many of these individuals will already be in the intermediate- to high-risk group. However, the net clinical benefit of statin therapy for primary prevention in this age group is not well established, and the few primary prevention trials in this group have not demonstrated net clinical benefit.38 As a result, current guidelines do not provide specific treatment recommendations for individuals aged > 75 years but recognize the value of shared decision making considering associated comorbidities, age-related risks of statin therapy, and the desires of the individual to avoid ASCVD-related events even if the net clinical benefit is low.
Older individuals with elevated CAC scores should be informed about the risk of ASCVD events and the potential but unproven benefit of moderate-intensity statin therapy. Older individuals with a CAC score of 0 likely have low short-term risk of ASCVD events and withholding statin therapy is not unreasonable.
CAC Scores on Annual LDCT Scans
Because LCS requires annual LDCT scans, primary care practitioners and patients need to understand the significance of changing CAC scores over time. For individuals not on statin therapy, increasing calcification is a marker of progression of subclinical atherosclerosis. Patients undergoing LCS not on statin who have progressive increases in their CAC should consider initiating statin therapy. Individuals who opted not to initiate statin therapy who subsequently develop CAC should be re-engaged in a discussion about the significance of the finding and the clinically proven benefits of statin therapy in individuals with subclinical atherosclerosis. These considerations do not apply to individuals already on statin therapy. Statins convert lipid-rich plaques to lipid-depleted plaques, resulting in increasing calcification. As a result, CAC scores do not decrease and may increase with statin therapy.39 Individuals participating in annual LCS should be informed of this possibility. Also, in these individuals, referral to specialty care as a treatment failure is not supported by the literature.
Furthermore, serial CAC scoring to titrate the intensity of statin therapy is not currently recommended. The goal with moderate-intensity statin therapy is a 30% to 49% reduction from baseline LDL-C. If this milestone is not achieved, the statin dose can be escalated. For high-intensity statin therapy, the goal is a > 50% reduction. If this milestone is not achieved, then additional lipid-lowering agents, such as ezetimibe, can be added.
Further ASCVD Testing
LCS with LDCT is associated with improved health outcomes, and LDCT is the preferred imaging modality. The ability of LDCT to detect and quantify CAC is sufficient for clinical decision making. Therefore, obtaining a traditional CAC score increases radiation exposure without additional clinical benefits.
Furthermore, although referral for additional testing in those with nonzero CAC scores is common, current evidence does not support this practice in asymptomatic individuals. Indeed, the risks of LCS include overdiagnosis, excessive testing, and overtreatment secondary to the discovery of other findings, such as benign pulmonary nodules and CAC. With respect to CAD, randomized controlled trials do not support a strategy of coronary angiography and intervention in asymptomatic individuals, even with moderate-to-severe ischemia on functional testing.40 As a result, routine stress tests to diagnose CAD or to confirm the results of CAC scores in asymptomatic individuals are not recommended. The only potential exception would be in select cases where the CAC score is > 1000 and when calcium is predominately located in the left main coronary artery.
Conclusions
LCS provides smokers at risk for lung cancer with the best probability to survive that diagnosis, and coincidentally LCS may also provide the best opportunity to prevent ASCVD events and mortality. Before initiating LCS, clinicians should initiate a shared decision making conversation about the benefits and risks of LDCT scans. In addition to relevant education about smoking, during shared decision making, the initial ASCVD risk estimate should be done using the PCE and when appropriate the benefits of statin therapy discussed. Individuals also should be informed of the potential for identifying CAC and counseled on its significance and how it might influence the decision to recommend statin therapy.
In patients undergoing LCS with an estimated risk of ≥ 7.5% to < 20%, moderate-intensity statin therapy is indicated. In this setting, a CAC score > 0 indicates subclinical atherosclerosis and should be used to help direct patients toward initiating statin therapy. Unfortunately, in patients undergoing LCS a CAC score of 0 might not provide protection against ASCVD, and until there is more information to the contrary, these individuals should at least participate in shared decision making about the long-term benefits of statin therapy in reducing ASCVD risk. Because LDCT scanning is done annually, there are opportunities to review the importance of prevention and to adjust therapy as needed to achieve the greatest reduction in ASCVD. Reported elevated CAC scores on LDCT provide an opportunity to re-engage the patient in the discussion about the benefits of statin therapy if they are not already on a statin, or consideration for high-intensity statin if the CAC score is > 1000 or reduction in baseline LDL-C is < 30% on the current statin dose.
1. de Koning HJ, van der Aalst CM, Oudkerk M. Lung-cancer screening and the NELSON Trial. Reply. N Engl J Med. 2020;382(22):2165-2166. doi:10.1056/NEJMc2004224
2. Aberle T, Adams DR, Berg AM, et al. National Lung Screening Trial Research Team. Reduced lung-cancer mortality with low-dose computed tomographic screening. N Engl J Med. 2011;365(5):396-409. doi:10.1056/NEJMoa1102873
3. Krist AH, Davidson KW, Mangione CM, et al. US Preventive Services Task Force. Screening for lung cancer: US Preventive Services Task Force recommendation statement. JAMA. 2021;25(10):962-970. doi:10.1001/jama.2021.1117
4. Jha P, Ramasundarahettige C, Landsman V. 21st-century hazards of smoking and benefits of cessation in the United States. N Engl J Med. 2013;368(4):341-350. doi:10.1056/NEJMsa1211128
5. Khan SS, Ning H, Sinha A, et al. Cigarette smoking and competing risks for fatal and nonfatal cardiovascular disease subtypes across the life course. J Am Heart Assoc. 2021;10(23):e021751. doi:10.1161/JAHA.121.021751
6. Lu MT, Onuma OK, Massaro JM, et al. Lung cancer screening eligibility in the community: cardiovascular risk factors, coronary artery calcification, and cardiovascular events. Circulation. 2016;134(12):897-899. doi:10.1161/CIRCULATIONAHA.116.023957
7. Tailor TD, Chiles C, Yeboah J, et al. Cardiovascular risk in the lung cancer screening population: a multicenter study evaluating the association between coronary artery calcification and preventive statin prescription. J Am Coll Radiol. 2021;18(9):1258-1266. doi:10.1016/j.jacr.2021.01.015
8. Mori H, Torii S, Kutyna M, et al. Coronary artery calcification and its progression: what does it really mean? JACC Cardiovasc Imaging. 2018;11(1):127-142. doi:10.1016/j.jcmg.2017.10.012
10. Nasir K, Bittencourt MS, Blaha MJ, et al. Implications of coronary artery calcium testing among statin candidates according to American College of Cardiology/American Heart Association cholesterol management guidelines: MESA (Multi-Ethnic Study of Atherosclerosis). J Am Coll Cardiol. 2015;66(15): 1657-1668. doi:10.1016/j.jacc.2015.07.066
11. Detrano R, Guerci AD, Carr JJ, et al. Coronary calcium as a predictor of coronary events in four racial or ethnic groups. N Engl J Med. 2008;358(13):1336-1345. doi:10.1056/NEJMoa072100
12. Grandhi GR, Mirbolouk M, Dardari ZA. Interplay of coronary artery calcium and risk factors for predicting CVD/CHD Mortality: the CAC Consortium. JACC Cardiovasc Imaging. 2020;13(5):1175-1186. doi:10.1016/j.jcmg.2019.08.024
13. Blaha M, Budoff MJ, Shaw J. Absence of coronary artery calcification and all-cause mortality. JACC Cardiovasc Imaging. 2009;2(6):692-700. doi:10.1016/j.jcmg.2009.03.009
14. Shemesh J, Henschke CI, Farooqi A, et al. Frequency of coronary artery calcification on low-dose computed tomography screening for lung cancer. Clin Imaging. 2006;30(3):181-185. doi:10.1016/j.clinimag.2005.11.002
15. Shemesh J, Henschke C, Shaham D, et al. Ordinal scoring of coronary artery calcifications on low-dose CT scans of the chest is predictive of death from cardiovascular disease. Radiology. 2010;257:541-548. doi:10.1148/radiol.10100383
16. Jacobs PC, Gondrie MJ, van der Graaf Y, et al. Coronary artery calcium can predict all-cause mortality and cardiovascular events on low-dose CT screening for lung cancer. AJR Am J Roentgenol. 2012;198(3):505-511. doi:10.2214/AJR.10.5577
17. Lessmann N, de Jong PA, Celeng C, et al. Sex differences in coronary artery and thoracic aorta calcification and their association with cardiovascular mortality in heavy smokers. JACC Cardiovasc Imaging. 2019;12(9):1808-1817. doi:10.1016/j.jcmg.2018.10.026
18. Gendarme S, Goussault H, Assie JB, et al. Impact on all-cause and cardiovascular mortality rates of coronary artery calcifications detected during organized, low-dose, computed-tomography screening for lung cancer: systematic literature review and meta-analysis. Cancers (Basel). 2021;13(7):1553. doi:10.3390/cancers13071553
19. Hecht HS, Blaha MJ, Kazerooni EA, et al. CAC-DRS: coronary artery calcium data and reporting system. An expert consensus document of the Society of Cardiovascular Computed Tomography (SCCT). J Cardiovasc Comput Tomogr. 2018;12(3):185-191. doi:10.1016/j.jcct.2018.03.008
20. Budoff MJ, Young R, Burke G, et al. Ten-year association of coronary artery calcium with atherosclerotic cardiovascular disease (ASCVD) events: the multi-ethnic study of atherosclerosis (MESA). Eur Heart J. 2018;39(25):2401-2408. doi:10.1093/eurheartj/ehy217
21. Grundy SM, Stone NJ, Bailey AL, et al. 2018 AHA/ACC/AACVPR/AAPA/ABC/ACPM/ADA/AGS/APhA/ASPC/NLA/PCNA guideline on the management of blood cholesterol: executive summary: a report of the American College of Cardiology/American Heart Association Task Force on Clinical Practice Guidelines. Circulation. 2019;139(25):e1046-e1081. doi:10.1161/CIR.0000000000000624
22. Arnett DK, Blumenthal RS, Albert MA, et al. 2019 ACC/AHA guideline on the primary prevention of cardiovascular disease: a report of the American College of Cardiology/American Heart Association Task Force on Clinical Practice Guidelines. Circulation. 2019;140(11):e596-e646. doi:10.1161/CIR.0000000000000678
23. Mangione CM, Barry MJ, Nicholson WK, et al. US Preventive Services Task Force. Statin use for the primary prevention of cardiovascular disease in adults: US Preventive Services Task Force recommendation statement. JAMA. 2022;328(8):746-753. doi:10.1001/jama.2022.13044
24. Stone NJ, Robinson JG, Lichtenstein AH, et al. American College of Cardiology/American Heart Association Task Force on Practice. 2013 ACC/AHA guideline on the treatment of blood cholesterol to reduce atherosclerotic cardiovascular risk in adults: a report of the American College of Cardiology/American Heart Association Task Force on Practice Guidelines. J Am Coll Cardiol. 2014;63(25 pt B):2889-2934. doi:10.1016/j.jacc.2013.11.002
 25. US Department of Veterans Affairs, Department of Defense. VA/DoD clinical practice guideline. Updated August 25, 2021. Accessed November 3, 2023. https://www.healthquality.va.gov/guidelines/cd/lipids
26. DeFilippis AP, Young, R, Carrubba CJ, et al. An analysis of calibration and discrimination among multiple cardiovascular risk scores in a modern multiethnic cohort. Ann Intern Med. 2015;162(4):266-275. doi:10.7326/M14-1281
27. Rana JS, Tabada GH, Solomon, MD, et al. Accuracy of the atherosclerotic cardiovascular risk equation in a large contemporary, multiethnic population. J Am Coll Cardiol. 2016;67(18):2118-2130. doi:10.1016/j.jacc.2016.02.055
28. Sarwar A, Shaw LJ, Shapiro MD, et al. Diagnostic and prognostic value of absence of coronary artery calcification. JACC Cardiovasc Imaging. 2009;2(6):675-688. doi:10.1016/j.jcmg.2008.12.031
29. McEvoy JW, Blaha MJ, Rivera JJ, et al. Mortality rates in smokers and nonsmokers in the presence or absence of coronary artery calcification. JACC Cardiovasc Imaging. 2012;5(10):1037-1045. doi:10.1016/j.jcmg.2012.02.017
30. Leigh A, McEvoy JW, Garg P, et al. Coronary artery calcium scores and atherosclerotic cardiovascular disease risk stratification in smokers. JACC Cardiovasc Imaging. 2019;12(5):852-861. doi:10.1016/j.jcmg.2017.12.017
31. Garg PK, Jorgensen NW, McClelland RL, et al. Use of coronary artery calcium testing to improve coronary heart disease risk assessment in lung cancer screening population: The Multi-Ethnic Study of Atherosclerosis (MESA). J Cardiovasc Comput Tomagr. 2018;12(6):439-400.
32. Chiles C, Duan F, Gladish GW, et al. Association of coronary artery calcification and mortality in the national lung screening trial: a comparison of three scoring methods. Radiology. 2015;276(1):82-90. doi:10.1148/radiol.15142062
33. Takx RA, Isgum I, Willemink MJ, et al. Quantification of coronary artery calcium in nongated CT to predict cardiovascular events in male lung cancer screening participants: results of the NELSON study. J Cardiovasc Comput Tomogr. 2015;9(1):50-57. doi:10.1016/j.jcct.2014.11.006
34. Mitchell JD, Paisley R, Moon P, et al. Coronary artery calcium and long-term risk of death, myocardial infarction, and stroke: The Walter Reed Cohort Study. JACC Cardiovasc Imaging. 2018;11(12):1799-1806. doi:10.1016/j.jcmg.2017.09.003
35. Peng AW, Mirbolouk M, Orimoloye OA, et al. Long-term all-cause and cause-specific mortality in asymptomatic patients with CAC >/=1,000: results from the CAC Consortium. JACC Cardiovasc Imaging. 2019;13(1, pt 1):83-93. doi:10.1016/j.jcmg.2019.02.005
36. Peng AW, Dardari ZA. Blumenthal RS, et al. Very high coronary artery calcium (>/=1000) and association with cardiovascular disease events, non-cardiovascular disease outcomes, and mortality: results from MESA. Circulation. 2021;143(16):1571-1583. doi:10.1161/CIRCULATIONAHA.120.050545
37. Orringer CE, Blaha MJ, Blankstein R, et al. The National Lipid Association scientific statement on coronary artery calcium scoring to guide preventive strategies for ASCVD risk reduction. J Clin Lipidol. 2021;15(1):33-60. doi:10.1016/j.jacl.2020.12.005
38. Sheperd J, Blauw GJ, Murphy MB, et al. PROSPER study group. PROspective Study of Pravastatin in the Elderly at Risk. Pravastatin in elderly individuals at risk of vascular disease. (PROSPER): a randomized controlled trial. Lancet. 2002;360:1623-1630. doi:10.1016/s0140-6736(02)11600-x
39. Puri R, Nicholls SJ, Shao M, et al. Impact of statins on serial coronary calcification during atheroma progression and regression. J Am Coll Cardiol. 2015;65(13):1273-1282. doi:10.1016/j.jacc.2015.01.036
40. Maron D.J, Hochman J S, Reynolds HR, et al. ISCHEMIA Research Group. Initial invasive or conservative strategy for stable coronary disease. N Engl J Med. 2020;382(15):1395-1407. doi:10.1056/NEJMoa1915922
Lung cancer is the most common cause of cancer mortality, and cigarette smoking is the most significant risk factor. Several randomized clinical trials have shown that lung cancer screening (LCS) with nonelectrocardiogram (ECG)-gated low-dose computed tomography (LDCT) reduces both lung cancer and all-cause mortality.1,2 Hence, the US Preventive Screening Task Force (USPSTF) recommends annual screening with LDCT in adults aged 50 to 80 years who have a 20-pack-year smoking history and currently smoke or have quit within the past 15 years.3
Smoking is also an independent risk factor for atherosclerotic cardiovascular disease (ASCVD), and LCS clinical trials acknowledge that mortality from ASCVD events exceeds that of lung cancer.4,5 In an analysis of asymptomatic individuals from the Framingham Heart Offspring study who were eligible for LCS, the ASCVD event rate during a median (IQR) follow-up of 11.4 (9.7-12.0) years was 12.6%.6 However, despite the high rate of ASCVD events in this population, primary prevention strategies are consistently underused. In a study of 5495 individuals who underwent LCS with LDCT, only 40% of those eligible for statins had one prescribed, underscoring the missed opportunity for preventing ASCVD events during LCS.7 Yet the interactions for shared decision making and the availability of coronary artery calcification (CAC) scores from the LDCT provide an ideal window for intervening and preventing ASCVD events during LCS.
CAC is a hallmark of atherosclerotic plaque development and is proportional to plaque burden and ASCVD risk.8 Because of the relationship between CAC, subclinical atherosclerosis, and ASCVD risk, there is an opportunity to use CAC detected by LDCT to predict ASCVD risk and guide recommendations for statin treatment in individuals enrolled in LCS. Traditionally, CAC has been visualized by ECG-gated noncontrast CT scans with imaging protocols specifically designed to visualize the coronary arteries, minimize motion artifacts, and reduce signal noise. These scans are specifically done for primary prevention risk assessment and report an Agatston score, a summed measure based on calcified plaque area and maximal density.9 Results are reported as an overall CAC score and an age-, sex-, and race-adjusted percentile of CAC. Currently, a CAC score ≥ 100 or above the 75th percentile for age, sex, and race is considered abnormal.
High-quality evidence supports CAC scores as a strong predictor of ASCVD risk independent of age, sex, race, and other traditional risk factors.10-12 In asymptomatic individuals, a CAC score of 0 is a strong, negative risk factor associated with very low annualized mortality rates and cardiovascular (CV) events, so intermediate-risk individuals can be reclassified to a lower risk group avoiding or delaying statin therapy.13 As a result, current primary prevention guidelines allow for CAC scoring in asymptomatic, intermediate-risk adults where the clinical benefits of statin therapy are uncertain, knowing the CAC score will aid in the clinical decision to delay or initiate statin therapy.
Unlike traditional ECG-gated CAC scoring, LDCT imaging protocols are non–ECG-gated and performed at variable energy and slice thickness to optimize the detection of lung nodules. Early studies suggested that CAC detected by LDCT could be used in lieu of traditional CAC scoring to personalize risk.14,15 Recently, multiple studies have validated the accuracy and reproducibility of LDCT to detect and quantify CAC. In both the NELSON and the National Lung Screening Trial (NLST) LCS trials, higher visual and quantitative measures of CAC were independently and incrementally associated with ASCVD risk.16,17 A subsequent review and meta-analysis of 6 LCS trials confirmed CAC detected by LDCT to be an independent predictor of ASCVD events regardless of the method used to measure CAC.18
There is now consensus that either an Agatston score or a visual estimate of CAC be reported on all noncontrast, noncardiac chest CT scans irrespective of the indication or technique, including LDCT scans for LCS using a uniform reporting system known as the Coronary Artery Calcium Data and Reporting System (CAC-DRS).19 The CAC-DRS simplifies reporting and adds modifiers indicating if the reported score is visual (V) or Agatston (A) and number of vessels involved. For example, CAC-DRS A0 or CAC-DRS V0 would indicate an Agatston score of 0 or a visual score of 0. CAC-DRS A1/N2 would indicate a total Agatston score of 1-99 in 2 coronary arteries. The currently agreed-on CAC-DRS risk groups are listed in the Table, along with their corresponding visual score or Agatston score and anticipated 10-year event rate, irrespective of other risk factors.20
As LCS efforts increase, primary care practitioners will receive LDCT reports that now incorporate an estimation of CAC (visual or quantitative). Thus, it will be increasingly important to know how to interpret and use these scores to guide clinical decisions regarding the initiation of statin therapy, referral for additional testing, and when to seek specialty cardiology care. For instance, does the absence of CAC (CAC = 0) on LDCT predict a low enough risk for statin therapy to be delayed or withdrawn? Does increasing CAC scores on follow-up LDCT in individuals on statin therapy represent treatment failure? When should CAC scores trigger additional testing, such as a stress test or referral to cardiology specialty care?
Primary Prevention in LCS
The initial approach to primary prevention in LCS is no different from that recommended by the 2018 multisociety guidelines on the management of blood cholesterol, the 2019 American College of Cardiology/American Heart Association (ACC/AHA) guideline on primary prevention, or the 2022 USPTSF recommendations on statin use for primary prevention of CV disease in adults.21-23 For a baseline low-density lipoprotein cholesterol (LDL-C) ≥ 190 mg/dL, high-intensity statin therapy is recommended without further risk stratification. Individuals with diabetes also are at higher-than-average risk, and moderate-intensity statin therapy is recommended.
For individuals not in either group, a validated ASCVD risk assessment tool is recommended to estimate baseline risk. The most validated tool for estimating risk in the US population is the 2013 ACC/AHA Pooled Cohort Equation (PCE) which provides an estimate of the 10-year risk for fatal and myocardial infarction and fatal and nonfatal stroke.24 The PCE risk calculator uses age, presence of diabetes, sex, smoking history, total cholesterol, high-density lipoprotein cholesterol, systolic blood pressure, and treatment for hypertension to place individuals into 1 of 4 risk groups: low (< 5%), borderline (5% to < 7.5%), intermediate (≥ 7.5% to < 20%), and high (≥ 20%). Clinicians should be aware that the PCE only considers current smoking history and not prior smoking history or cumulative pack-year history. This differs from eligibility for LCS where recent smoking plays a larger role. All these risk factors are important to consider when evaluating risk and discussing risk-reducing strategies like statin therapy.
The 2018 multisociety guidelines and the 2019 primary prevention guidelines set the threshold for considering initiation of statin therapy at intermediate risk ≥ 7.5%.21,22 The 2020 US Department of Veterans Affairs/Department of Defense guidelines set the threshold for considering statin therapy at an estimated 10-year event rate of 12%, whereas the 2022 UPSTF recommendations set the threshold at 10% with additional risk factors as the threshold for statin therapy.23,25 The reasons for these differences are beyond the scope of this review, but all these guidelines use the PCE to estimate baseline risk as the starting point for clinical decision making.
The PCE was originally derived and validated in population studies dating to the 1960s when the importance of diet, exercise, and smoking cessation in reducing ASCVD events was not well appreciated. The application of the PCE in more contemporary populations shows that it overestimates risk, especially in older individuals and women.26,27 Overestimation of risk has the potential to result in the initiation of statin therapy in individuals in whom the actual clinical benefit would otherwise be small.
To address this issue, current guidelines allow the use of CAC scoring to refine risk in individuals who are classified as intermediate risk and who otherwise desire to avoid lifelong statin therapy. Using current recommendations, we make suggestions on how to use CAC scores from LDCT to aid in clinical decision making for individuals in LCS (Figure).
No Coronary Artery Calcification
Between 25% and 30% of LDCT done for LCS will show no CAC.14,16 In general population studies, a CAC score of 0 is a strong negative predictor when there are no other risk factors.13,28 In contrast, the negative predictive ability of a CAC score of 0 in individuals with a smoking history who are eligible for LCS is unproven. In multivariate modeling, a CAC score of 0 did not reduce the significant hazard of all-cause mortality in patients with diabetes or smokers.29 In an analysis of 44,042 individuals without known heart disease referred for CAC scoring, the frequency of a CAC score of 0 was only modestly lower in smokers (38%) compared with nonsmokers (42%), yet the all-cause mortality rate was significantly higher.30 In addition, Multi-Ethnic Study of Atherosclerosis (MESA) participants who were current smokers or eligible for LCS and had a CAC score of 0 had an observed 11-year ASCVD event rate of 13.4% and 20.8%, respectively, leading to the conclusion that a CAC score of 0 may not be predictive of minimal risk in smokers and those eligible for LCS.31 Additionally, in LCS-eligible individuals, the PCE underestimated event rates and incorporation of CAC scores did not significantly improve risk estimation. Finally, data from the NLST screening trial showed that the absence of CAC on LDCT was not associated with better survival or lower CV mortality compared with individuals with low CAC scores.32
The question of whether individuals undergoing LCS with LDCT who have no detectable CAC can avoid statin therapy is an unresolved issue; no contemporary studies have looked specifically at the relationship between estimated risk, a CAC score of 0, and ASCVD outcomes in individuals participating in LCS. For these reasons, we recommend moderate-intensity statin therapy when the estimated risk is intermediate because it is unclear that either an Agatston score of 0 reclassifies intermediate-risk LCS-eligible individuals to a lower risk group.
For the few borderline risk (estimated risk, 5% to < 7.5%) LCS-eligible individuals, a CAC score of 0 might confer low short-term risk but the long-term benefit of statin therapy on reducing subsequent risk, the presence of other risk factors, and the willingness to stop smoking should all be considered. For these individuals who elect to avoid statin therapy, annual re-estimation of risk at the time of repeat LDCT is recommended. In these circumstances, referral for traditional Agatston scoring is not likely to change decision making because the sensitivity of the 2 techniques is very similar.
Agatston Score of 1-99 or CAC-DRS or Visual Score of 1
In general population studies, these scores correspond to borderline risk and an estimated 10-year event rate of just under 7.5%.20 In both the NELSON and NLST LCS trials, even low amounts of CAC regardless of the scoring method were associated with higher observed ASCVD mortality when adjusted for other baseline risk factors.32 Thus, in patients undergoing LCS with intermediate and borderline risk, a CAC score between 1 and 99 or a visual estimate of 1 indicates the presence of subclinical atherosclerosis, and moderate-intensity statin therapy is reasonable.
Agatston Score of 100-299 or CAC-DRS or Visual Score of 2
Across all ages, races, and sexes, CAC scores between 100 to 299 are associated with an event rate of about 15% over 10 years.20 In the NELSON LCS trial, the adjusted hazard ratio for ASCVD events with a nontraditional Agatston score of 101 to 400 was 6.58.33 Thus, in patients undergoing LCS with a CAC score of 100 to 299, regardless of the baseline risk estimate, the projected absolute event rate at 10 years would be about 20%. Moderate-intensity statin therapy is recommended to reduce the baseline LDL-C by 30% to 49%.
Agatston Score of > 300 or CAC-DRS or Visual Score of 3
Agatston CAC scores > 300 are consistent with a 10-year incidence of ASCVD events of > 15% regardless of age, sex, or race and ethnicity.20 In the Calcium Consortium, a CAC > 400 was correlated with an event rate of 13.6 events/1000 person-years.12 In a Walter Reed Military Medical Center study, a CAC score > 400 projected a cumulative incidence of ASCVD events of nearly 20% at 10 years.34 In smokers eligible for LCS, a CAC score > 300 projected a 10-year ASCVD event rate of 25%.29 In these patients, moderate-intensity statin therapy is recommended, although high-intensity statin therapy can be considered if there are other risk factors.
Agatston Score ≥ 1000
The 2018 consensus statement on CAC reporting categorizes all CAC scores > 300 into a single risk group because the recommended treatment options do not differ.19 However, recent data suggest this might not be the case since individuals with very high CAC scores experience high rates of events that might justify more aggressive intervention. In an analysis of individuals who participated in the CAC Consortium with a CAC score ≥ 1000, the all-cause mortality rate was 18.8 per 1000 person-years with a CV mortality rate of 8 per 1000 person-years.35 Individuals with very high levels of CAC > 1000 also have a greater number of diseased coronary arteries, higher involvement of the left main coronary artery, and significantly higher event rates compared with those with a CAC of 400 to 999.36 In an analysis of individuals from the NLST trial, nontraditionally measured Agatston score > 1000 was associated with a hazard ratio for coronary artery disease (CAD) mortality of 3.66 in men and 5.81 in women.17 These observed and projected levels of risk are like that seen in secondary prevention trials, and some experts have recommended the use of high-intensity statin therapy to reduce LDL-C to < 70 mg/dL.37
Primary Prevention in Individuals aged 76 to 80 years
LCS can continue through age 80 years, while the PCE and primary prevention guidelines are truncated at age 75 years. Because age is a major contributor to risk, many of these individuals will already be in the intermediate- to high-risk group. However, the net clinical benefit of statin therapy for primary prevention in this age group is not well established, and the few primary prevention trials in this group have not demonstrated net clinical benefit.38 As a result, current guidelines do not provide specific treatment recommendations for individuals aged > 75 years but recognize the value of shared decision making considering associated comorbidities, age-related risks of statin therapy, and the desires of the individual to avoid ASCVD-related events even if the net clinical benefit is low.
Older individuals with elevated CAC scores should be informed about the risk of ASCVD events and the potential but unproven benefit of moderate-intensity statin therapy. Older individuals with a CAC score of 0 likely have low short-term risk of ASCVD events and withholding statin therapy is not unreasonable.
CAC Scores on Annual LDCT Scans
Because LCS requires annual LDCT scans, primary care practitioners and patients need to understand the significance of changing CAC scores over time. For individuals not on statin therapy, increasing calcification is a marker of progression of subclinical atherosclerosis. Patients undergoing LCS not on statin who have progressive increases in their CAC should consider initiating statin therapy. Individuals who opted not to initiate statin therapy who subsequently develop CAC should be re-engaged in a discussion about the significance of the finding and the clinically proven benefits of statin therapy in individuals with subclinical atherosclerosis. These considerations do not apply to individuals already on statin therapy. Statins convert lipid-rich plaques to lipid-depleted plaques, resulting in increasing calcification. As a result, CAC scores do not decrease and may increase with statin therapy.39 Individuals participating in annual LCS should be informed of this possibility. Also, in these individuals, referral to specialty care as a treatment failure is not supported by the literature.
Furthermore, serial CAC scoring to titrate the intensity of statin therapy is not currently recommended. The goal with moderate-intensity statin therapy is a 30% to 49% reduction from baseline LDL-C. If this milestone is not achieved, the statin dose can be escalated. For high-intensity statin therapy, the goal is a > 50% reduction. If this milestone is not achieved, then additional lipid-lowering agents, such as ezetimibe, can be added.
Further ASCVD Testing
LCS with LDCT is associated with improved health outcomes, and LDCT is the preferred imaging modality. The ability of LDCT to detect and quantify CAC is sufficient for clinical decision making. Therefore, obtaining a traditional CAC score increases radiation exposure without additional clinical benefits.
Furthermore, although referral for additional testing in those with nonzero CAC scores is common, current evidence does not support this practice in asymptomatic individuals. Indeed, the risks of LCS include overdiagnosis, excessive testing, and overtreatment secondary to the discovery of other findings, such as benign pulmonary nodules and CAC. With respect to CAD, randomized controlled trials do not support a strategy of coronary angiography and intervention in asymptomatic individuals, even with moderate-to-severe ischemia on functional testing.40 As a result, routine stress tests to diagnose CAD or to confirm the results of CAC scores in asymptomatic individuals are not recommended. The only potential exception would be in select cases where the CAC score is > 1000 and when calcium is predominately located in the left main coronary artery.
Conclusions
LCS provides smokers at risk for lung cancer with the best probability to survive that diagnosis, and coincidentally LCS may also provide the best opportunity to prevent ASCVD events and mortality. Before initiating LCS, clinicians should initiate a shared decision making conversation about the benefits and risks of LDCT scans. In addition to relevant education about smoking, during shared decision making, the initial ASCVD risk estimate should be done using the PCE and when appropriate the benefits of statin therapy discussed. Individuals also should be informed of the potential for identifying CAC and counseled on its significance and how it might influence the decision to recommend statin therapy.
In patients undergoing LCS with an estimated risk of ≥ 7.5% to < 20%, moderate-intensity statin therapy is indicated. In this setting, a CAC score > 0 indicates subclinical atherosclerosis and should be used to help direct patients toward initiating statin therapy. Unfortunately, in patients undergoing LCS a CAC score of 0 might not provide protection against ASCVD, and until there is more information to the contrary, these individuals should at least participate in shared decision making about the long-term benefits of statin therapy in reducing ASCVD risk. Because LDCT scanning is done annually, there are opportunities to review the importance of prevention and to adjust therapy as needed to achieve the greatest reduction in ASCVD. Reported elevated CAC scores on LDCT provide an opportunity to re-engage the patient in the discussion about the benefits of statin therapy if they are not already on a statin, or consideration for high-intensity statin if the CAC score is > 1000 or reduction in baseline LDL-C is < 30% on the current statin dose.
1. de Koning HJ, van der Aalst CM, Oudkerk M. Lung-cancer screening and the NELSON Trial. Reply. N Engl J Med. 2020;382(22):2165-2166. doi:10.1056/NEJMc2004224
2. Aberle T, Adams DR, Berg AM, et al. National Lung Screening Trial Research Team. Reduced lung-cancer mortality with low-dose computed tomographic screening. N Engl J Med. 2011;365(5):396-409. doi:10.1056/NEJMoa1102873
3. Krist AH, Davidson KW, Mangione CM, et al. US Preventive Services Task Force. Screening for lung cancer: US Preventive Services Task Force recommendation statement. JAMA. 2021;25(10):962-970. doi:10.1001/jama.2021.1117
4. Jha P, Ramasundarahettige C, Landsman V. 21st-century hazards of smoking and benefits of cessation in the United States. N Engl J Med. 2013;368(4):341-350. doi:10.1056/NEJMsa1211128
5. Khan SS, Ning H, Sinha A, et al. Cigarette smoking and competing risks for fatal and nonfatal cardiovascular disease subtypes across the life course. J Am Heart Assoc. 2021;10(23):e021751. doi:10.1161/JAHA.121.021751
6. Lu MT, Onuma OK, Massaro JM, et al. Lung cancer screening eligibility in the community: cardiovascular risk factors, coronary artery calcification, and cardiovascular events. Circulation. 2016;134(12):897-899. doi:10.1161/CIRCULATIONAHA.116.023957
7. Tailor TD, Chiles C, Yeboah J, et al. Cardiovascular risk in the lung cancer screening population: a multicenter study evaluating the association between coronary artery calcification and preventive statin prescription. J Am Coll Radiol. 2021;18(9):1258-1266. doi:10.1016/j.jacr.2021.01.015
8. Mori H, Torii S, Kutyna M, et al. Coronary artery calcification and its progression: what does it really mean? JACC Cardiovasc Imaging. 2018;11(1):127-142. doi:10.1016/j.jcmg.2017.10.012
10. Nasir K, Bittencourt MS, Blaha MJ, et al. Implications of coronary artery calcium testing among statin candidates according to American College of Cardiology/American Heart Association cholesterol management guidelines: MESA (Multi-Ethnic Study of Atherosclerosis). J Am Coll Cardiol. 2015;66(15): 1657-1668. doi:10.1016/j.jacc.2015.07.066
11. Detrano R, Guerci AD, Carr JJ, et al. Coronary calcium as a predictor of coronary events in four racial or ethnic groups. N Engl J Med. 2008;358(13):1336-1345. doi:10.1056/NEJMoa072100
12. Grandhi GR, Mirbolouk M, Dardari ZA. Interplay of coronary artery calcium and risk factors for predicting CVD/CHD Mortality: the CAC Consortium. JACC Cardiovasc Imaging. 2020;13(5):1175-1186. doi:10.1016/j.jcmg.2019.08.024
13. Blaha M, Budoff MJ, Shaw J. Absence of coronary artery calcification and all-cause mortality. JACC Cardiovasc Imaging. 2009;2(6):692-700. doi:10.1016/j.jcmg.2009.03.009
14. Shemesh J, Henschke CI, Farooqi A, et al. Frequency of coronary artery calcification on low-dose computed tomography screening for lung cancer. Clin Imaging. 2006;30(3):181-185. doi:10.1016/j.clinimag.2005.11.002
15. Shemesh J, Henschke C, Shaham D, et al. Ordinal scoring of coronary artery calcifications on low-dose CT scans of the chest is predictive of death from cardiovascular disease. Radiology. 2010;257:541-548. doi:10.1148/radiol.10100383
16. Jacobs PC, Gondrie MJ, van der Graaf Y, et al. Coronary artery calcium can predict all-cause mortality and cardiovascular events on low-dose CT screening for lung cancer. AJR Am J Roentgenol. 2012;198(3):505-511. doi:10.2214/AJR.10.5577
17. Lessmann N, de Jong PA, Celeng C, et al. Sex differences in coronary artery and thoracic aorta calcification and their association with cardiovascular mortality in heavy smokers. JACC Cardiovasc Imaging. 2019;12(9):1808-1817. doi:10.1016/j.jcmg.2018.10.026
18. Gendarme S, Goussault H, Assie JB, et al. Impact on all-cause and cardiovascular mortality rates of coronary artery calcifications detected during organized, low-dose, computed-tomography screening for lung cancer: systematic literature review and meta-analysis. Cancers (Basel). 2021;13(7):1553. doi:10.3390/cancers13071553
19. Hecht HS, Blaha MJ, Kazerooni EA, et al. CAC-DRS: coronary artery calcium data and reporting system. An expert consensus document of the Society of Cardiovascular Computed Tomography (SCCT). J Cardiovasc Comput Tomogr. 2018;12(3):185-191. doi:10.1016/j.jcct.2018.03.008
20. Budoff MJ, Young R, Burke G, et al. Ten-year association of coronary artery calcium with atherosclerotic cardiovascular disease (ASCVD) events: the multi-ethnic study of atherosclerosis (MESA). Eur Heart J. 2018;39(25):2401-2408. doi:10.1093/eurheartj/ehy217
21. Grundy SM, Stone NJ, Bailey AL, et al. 2018 AHA/ACC/AACVPR/AAPA/ABC/ACPM/ADA/AGS/APhA/ASPC/NLA/PCNA guideline on the management of blood cholesterol: executive summary: a report of the American College of Cardiology/American Heart Association Task Force on Clinical Practice Guidelines. Circulation. 2019;139(25):e1046-e1081. doi:10.1161/CIR.0000000000000624
22. Arnett DK, Blumenthal RS, Albert MA, et al. 2019 ACC/AHA guideline on the primary prevention of cardiovascular disease: a report of the American College of Cardiology/American Heart Association Task Force on Clinical Practice Guidelines. Circulation. 2019;140(11):e596-e646. doi:10.1161/CIR.0000000000000678
23. Mangione CM, Barry MJ, Nicholson WK, et al. US Preventive Services Task Force. Statin use for the primary prevention of cardiovascular disease in adults: US Preventive Services Task Force recommendation statement. JAMA. 2022;328(8):746-753. doi:10.1001/jama.2022.13044
24. Stone NJ, Robinson JG, Lichtenstein AH, et al. American College of Cardiology/American Heart Association Task Force on Practice. 2013 ACC/AHA guideline on the treatment of blood cholesterol to reduce atherosclerotic cardiovascular risk in adults: a report of the American College of Cardiology/American Heart Association Task Force on Practice Guidelines. J Am Coll Cardiol. 2014;63(25 pt B):2889-2934. doi:10.1016/j.jacc.2013.11.002
25. US Department of Veterans Affairs, Department of Defense. VA/DoD clinical practice guideline. Updated August 25, 2021. Accessed November 3, 2023. https://www.healthquality.va.gov/guidelines/cd/lipids
26. DeFilippis AP, Young, R, Carrubba CJ, et al. An analysis of calibration and discrimination among multiple cardiovascular risk scores in a modern multiethnic cohort. Ann Intern Med. 2015;162(4):266-275. doi:10.7326/M14-1281
27. Rana JS, Tabada GH, Solomon, MD, et al. Accuracy of the atherosclerotic cardiovascular risk equation in a large contemporary, multiethnic population. J Am Coll Cardiol. 2016;67(18):2118-2130. doi:10.1016/j.jacc.2016.02.055
28. Sarwar A, Shaw LJ, Shapiro MD, et al. Diagnostic and prognostic value of absence of coronary artery calcification. JACC Cardiovasc Imaging. 2009;2(6):675-688. doi:10.1016/j.jcmg.2008.12.031
29. McEvoy JW, Blaha MJ, Rivera JJ, et al. Mortality rates in smokers and nonsmokers in the presence or absence of coronary artery calcification. JACC Cardiovasc Imaging. 2012;5(10):1037-1045. doi:10.1016/j.jcmg.2012.02.017
30. Leigh A, McEvoy JW, Garg P, et al. Coronary artery calcium scores and atherosclerotic cardiovascular disease risk stratification in smokers. JACC Cardiovasc Imaging. 2019;12(5):852-861. doi:10.1016/j.jcmg.2017.12.017
31. Garg PK, Jorgensen NW, McClelland RL, et al. Use of coronary artery calcium testing to improve coronary heart disease risk assessment in lung cancer screening population: The Multi-Ethnic Study of Atherosclerosis (MESA). J Cardiovasc Comput Tomagr. 2018;12(6):439-400.
32. Chiles C, Duan F, Gladish GW, et al. Association of coronary artery calcification and mortality in the national lung screening trial: a comparison of three scoring methods. Radiology. 2015;276(1):82-90. doi:10.1148/radiol.15142062
33. Takx RA, Isgum I, Willemink MJ, et al. Quantification of coronary artery calcium in nongated CT to predict cardiovascular events in male lung cancer screening participants: results of the NELSON study. J Cardiovasc Comput Tomogr. 2015;9(1):50-57. doi:10.1016/j.jcct.2014.11.006
34. Mitchell JD, Paisley R, Moon P, et al. Coronary artery calcium and long-term risk of death, myocardial infarction, and stroke: The Walter Reed Cohort Study. JACC Cardiovasc Imaging. 2018;11(12):1799-1806. doi:10.1016/j.jcmg.2017.09.003
35. Peng AW, Mirbolouk M, Orimoloye OA, et al. Long-term all-cause and cause-specific mortality in asymptomatic patients with CAC >/=1,000: results from the CAC Consortium. JACC Cardiovasc Imaging. 2019;13(1, pt 1):83-93. doi:10.1016/j.jcmg.2019.02.005
36. Peng AW, Dardari ZA. Blumenthal RS, et al. Very high coronary artery calcium (>/=1000) and association with cardiovascular disease events, non-cardiovascular disease outcomes, and mortality: results from MESA. Circulation. 2021;143(16):1571-1583. doi:10.1161/CIRCULATIONAHA.120.050545
37. Orringer CE, Blaha MJ, Blankstein R, et al. The National Lipid Association scientific statement on coronary artery calcium scoring to guide preventive strategies for ASCVD risk reduction. J Clin Lipidol. 2021;15(1):33-60. doi:10.1016/j.jacl.2020.12.005
38. Sheperd J, Blauw GJ, Murphy MB, et al. PROSPER study group. PROspective Study of Pravastatin in the Elderly at Risk. Pravastatin in elderly individuals at risk of vascular disease. (PROSPER): a randomized controlled trial. Lancet. 2002;360:1623-1630. doi:10.1016/s0140-6736(02)11600-x
39. Puri R, Nicholls SJ, Shao M, et al. Impact of statins on serial coronary calcification during atheroma progression and regression. J Am Coll Cardiol. 2015;65(13):1273-1282. doi:10.1016/j.jacc.2015.01.036
40. Maron D.J, Hochman J S, Reynolds HR, et al. ISCHEMIA Research Group. Initial invasive or conservative strategy for stable coronary disease. N Engl J Med. 2020;382(15):1395-1407. doi:10.1056/NEJMoa1915922
Appetite loss and unusual agitation
Given the patient's results on the genetic panel and MRI, as well as the noted cognitive decline and increased aggression, this patient is suspected of having limbic-predominant age-related TDP-43 encephalopathy (LATE) secondary to AD and is referred to the neurologist on her multidisciplinary care team for further consultation and testing.
AD is one of the most common forms of dementia. More than 6 million people in the United States have clinical AD or mild cognitive impairment because of AD. LATE is a new classification of dementia, identified in 2019, that mimics AD but is a unique disease entity driven by the misfolding of the protein TDP-43, which regulates gene expression in the brain. Misfolded TDP-43 protein is common among older adults aged ≥ 85 years, and about a quarter of this population has enough misfolded TDP-43 protein to affect their memory and cognition.
Diagnosing AD currently relies on a clinical approach. A complete physical examination, with a detailed neurologic examination and a mental status examination, is used to evaluate disease stage. Initial mental status testing evaluates attention and concentration, recent and remote memory, language, praxis, executive function, and visuospatial function. Because LATE is a newly discovered form of dementia, there are no set guidelines on diagnosing LATE and no robust biomarker for TDP-43. What is known about LATE has been gleaned mostly from retrospective clinicopathologic studies.
The LATE consensus working group reports that the clinical course of disease, as studied by autopsy-proven LATE neuropathologic change (LATE-NC), is described as an "amnestic cognitive syndrome that can evolve to incorporate multiple cognitive domains and ultimately to impair activities of daily living." Researchers are currently analyzing different clinical assessments and neuroimaging with MRI to characterize LATE. A group of international researchers recently published a set of clinical criteria for limbic-predominant amnestic neurodegenerative syndrome (LANS), which is associated with LATE-NC. Their criteria include "core, standard and advanced features that are measurable in vivo, including older age at evaluation, mild clinical syndrome, disproportionate hippocampal atrophy, impaired semantic memory, limbic hypometabolism, absence of neocortical degenerative patterns and low likelihood of neocortical tau, with degrees of certainty (highest, high, moderate, low)." Other neuroimaging studies of autopsy-confirmed LATE-NC have shown that atrophy is mostly focused in the medial temporal lobe with marked reduced hippocampal volume.
The group reports that LATE and AD probably share pathophysiologic mechanisms. One of the universally accepted hallmarks of AD is the formation of beta-amyloid plaques, which are dense, mostly insoluble deposits of beta-amyloid protein that develop around neurons in the hippocampus and other regions in the cerebral cortex used for decision-making. These plaques disrupt brain function and lead to brain atrophy. The LATE group also reports that this same pathology has been noted with LATE: "Many subjects with LATE-NC have comorbid brain pathologies, often including amyloid-beta plaques and tauopathy." That said, genetic studies have helped identify five genes with risk alleles for LATE (GRN, TMEM106B, ABCC9, KCNMB2, and APOE), suggesting disease-specific underlying mechanisms compared to AD.
Patient and caregiver education and guidance is vital with a dementia diagnosis. If LATE and/or AD are suspected, physicians should encourage the involvement of family and friends who agree to become more involved in the patient's care as the disease progresses. These individuals need to understand the patient's wishes around care, especially for the future when the patient is no longer able to make decisions. The patient may also consider establishing medical advance directives and durable power of attorney for medical and financial decision-making. Caregivers supporting the patient are encouraged to help balance the physical needs of the patient while maintaining respect for them as a competent adult to the extent allowed by the progression of their disease.
Because LATE is a new classification of dementia, there are no known effective treatments. One ongoing study is testing the use of autologous bone marrow–derived stem cells to help improve cognitive impairment among patients with LATE, AD, and other dementias. Current AD treatments are focused on symptomatic therapies that modulate neurotransmitters — either acetylcholine or glutamate. The standard medical treatment includes cholinesterase inhibitors and a partial N-methyl-D-aspartate antagonist. Two amyloid-directed antibodies (aducanumab, lecanemab) are currently available in the United States for individuals with AD exhibiting mild cognitive impairment or mild dementia. A third agent currently in clinical trials (donanemab) has shown significantly slowed clinical progression after 1.5 years among clinical trial participants with early symptomatic AD and amyloid and tau pathology.
Shaheen E. Lakhan, MD, PhD, MS, MEd, Chief of Pain Management, Carilion Clinic and Virginia Tech Carilion School of Medicine, Roanoke, Virginia.
Disclosure: Shaheen E. Lakhan, MD, PhD, MS, MEd, has disclosed no relevant financial relationships.
Image Quizzes are fictional or fictionalized clinical scenarios intended to provide evidence-based educational takeaways.

An 85-year-old woman presents to her geriatrician with her daughter, who is her primary caregiver. Seven years ago, the patient was diagnosed with mild Alzheimer's disease (AD). Her symptoms at diagnosis were irritability, forgetfulness, and panic attacks. Cognitive, behavioral, and functional assessments showed levels of decline; neurologic examination revealed mild hyposmia. The patient has been living with her daughter ever since her AD diagnosis.
At today's visit, the daughter reports that her mother has been experiencing loss of appetite and wide mood fluctuations with moments of unusual agitation. In addition, she tells the geriatrician that her mother has had trouble maintaining her balance and seems to have lost her sense of time. The patient has difficulty remembering what month and day it is, and how long it's been since her brother came to visit — which has been every Sunday like clockwork since the patient moved in with her daughter. The daughter also notes that her mother loses track of the story line when she is watching movie and TV shows lately.
The physician orders a brain MRI and genetic panel. MRI reveals atrophy in the frontal cortex as well as the medial temporal lobe, with hippocampal sclerosis. The genetic panel shows APOE and TMEM106 mutations.
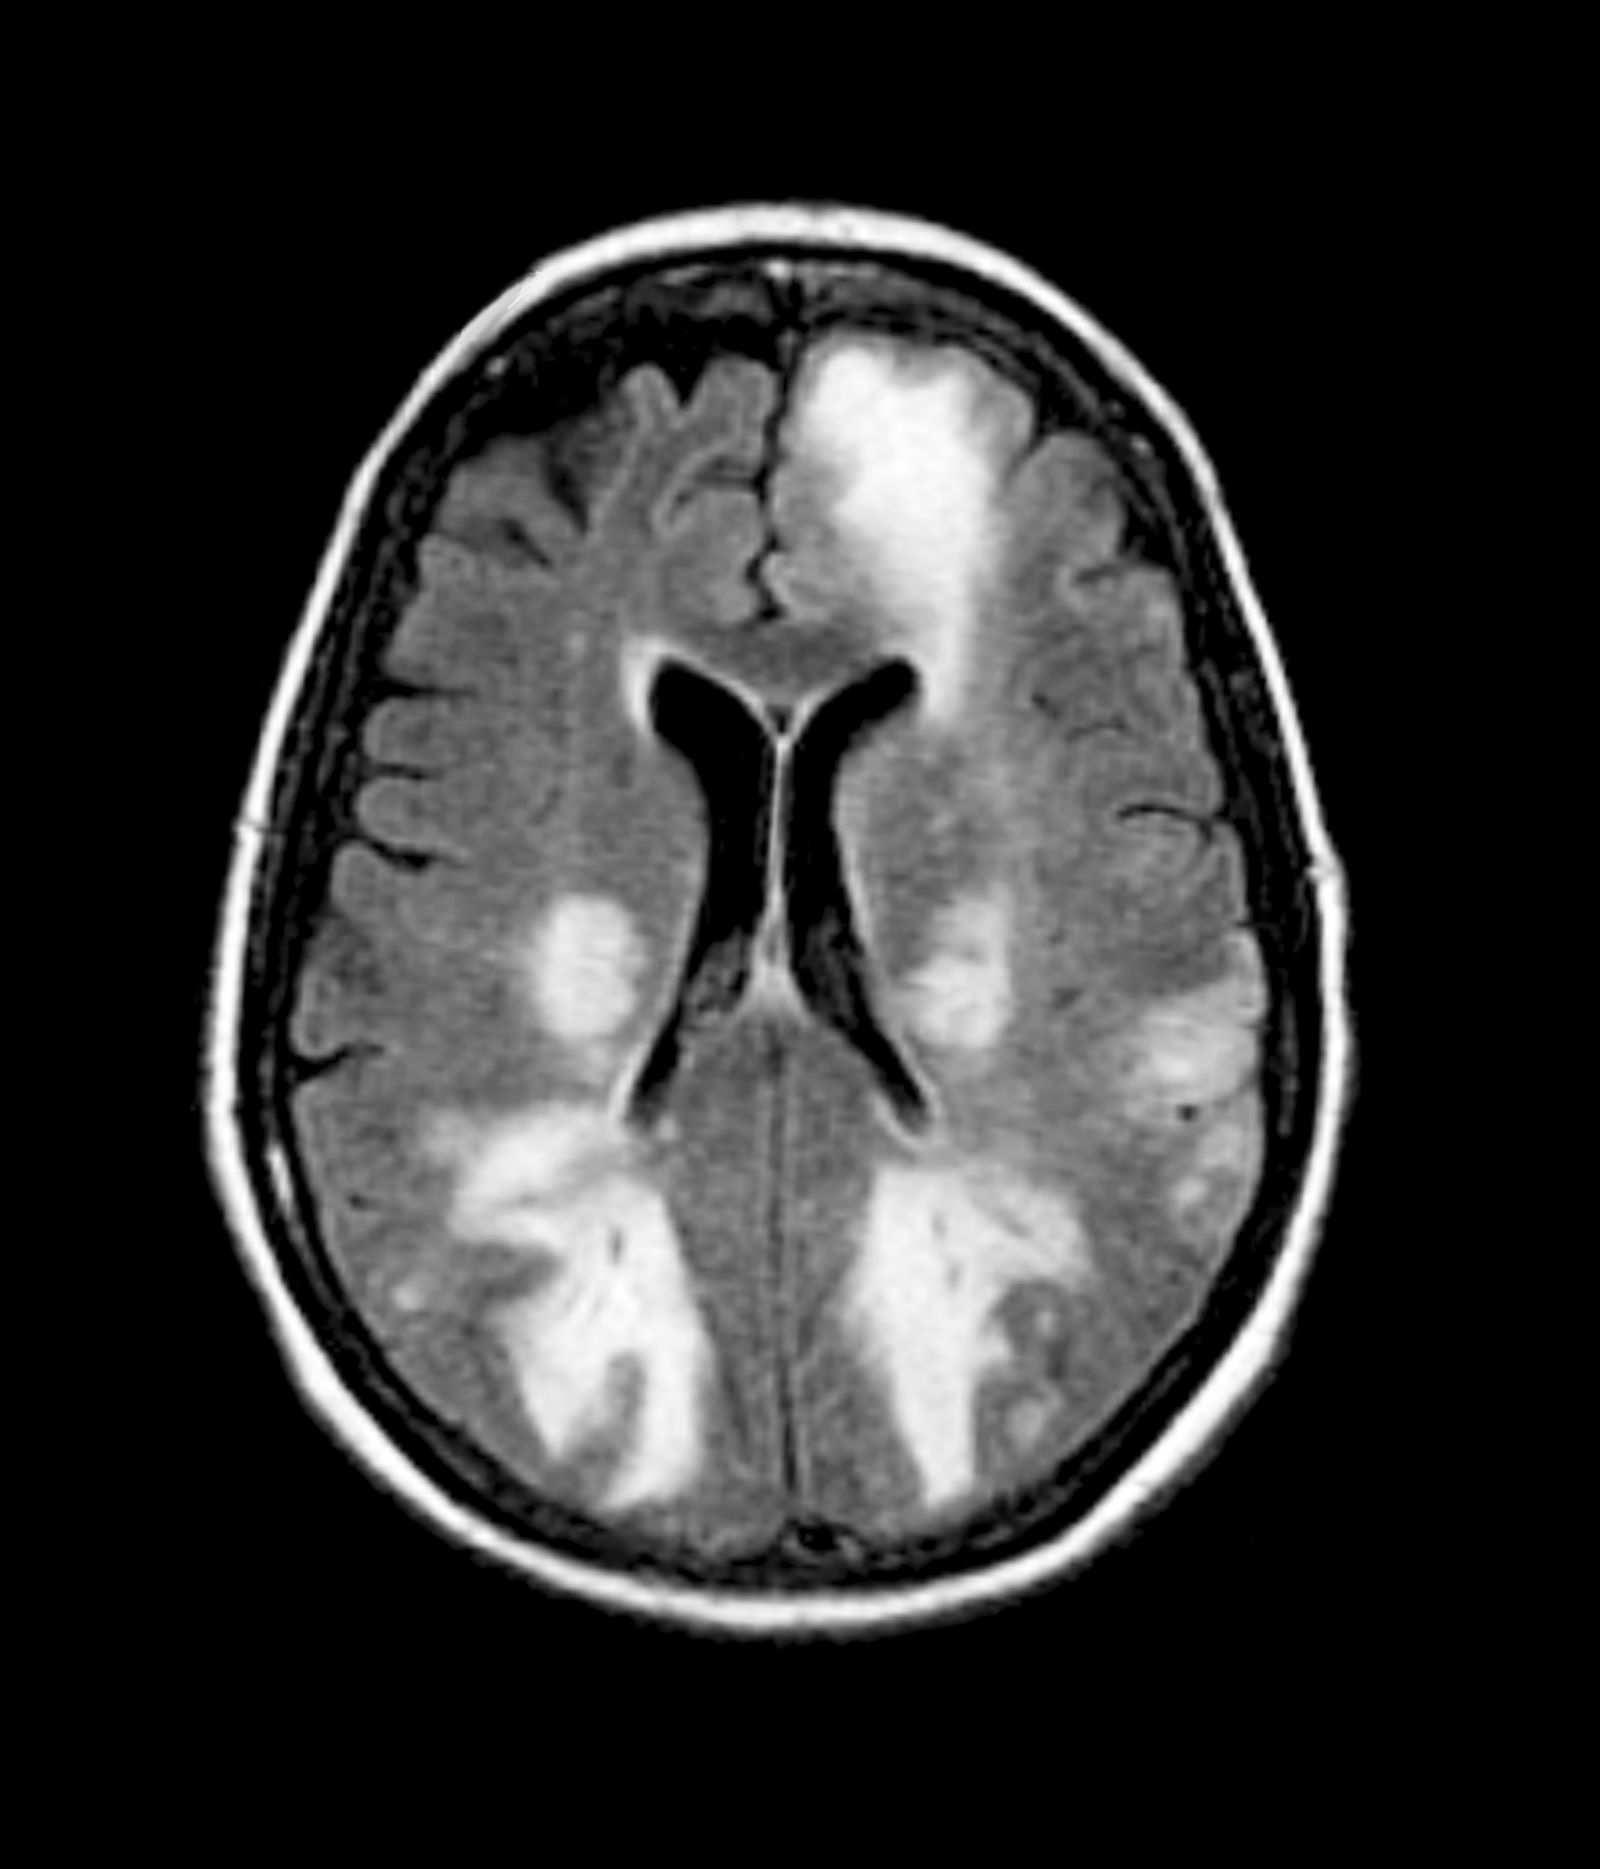
Homonymous blurred vision
Migraine is one of the most common neurologic diseases, affecting about 14% of the population. Migraines may also be associated with auras or visual or sensory symptoms that precede the headache. However, approximately 4% of people with migraine experience their usual migraines and sometimes also experience episodes of an aura that is not followed by a headache. Silent migraines, also known as acephalgic migraines or "migraine auras without headache," typically cause symptoms that accompany the phases of a migraine, but without the classic headache pain. It is most common among young adults in their 20s and 30s and older adults between 40 and 60 years of age, especially in those who had auras accompanied by migraine headaches when younger.
According to the International Headache Society, a migraine aura develops gradually over 5 to 10 minutes and lasts for less than 1 hour. Although the symptoms of a silent migraine may vary from person to person, visual symptoms occur in more than 90% of migraine auras. Visual symptoms may also be accompanied by other neurologic symptoms such as dizziness, numbness or tingling, and aphasia. The most common visual symptoms are positive symptoms, such as flash scotoma, visual distortion, colored spots, and flash hallucinations. Visual symptoms may easily be confused with symptoms of a transient ischemic attack (TIA). However, migraine auras generally last 15 to 30 minutes. They are often described as dynamic, bright, multicolored forms in geometric patterns. In contrast, the visual symptoms of a TIA last on average 3 to 10 minutes and are described as a static, dark dimming of vision.
The diagnosis of migraine aura without headache should be made after all other possible causes have been excluded, particularly TIAs and focal seizures because of the diagnostic, therapeutic, and prognostic implications. Testing may include a neurologic and eye examination, MRI, CT angiography, and laboratory testing for clotting disorders.
Migraine aura without headache is a benign condition and generally does not require treatment. When symptoms of silent migraines are severe enough, low-dose aspirin and calcium-channel blockers may be considered as treatment options. However, triptans, which are often used in patients with migraine headaches, should not be used to treat silent migraines because they do not act fast enough to affect an aura. In addition, triptans should be used with caution in older patients, who may have vascular disease, hypertension, and other cardiovascular risk factors.
Jasmin Harpe, MD, MPH, Headache Fellow, Department of Neurology, Harvard University, John R. Graham Headache Center, Mass General Brigham, Boston, MA
Jasmin Harpe, MD, MPH, has disclosed no relevant financial relationships.
Image Quizzes are fictional or fictionalized clinical scenarios intended to provide evidence-based educational takeaways.

A 56-year-old woman with no significant past medical history presents for a neurologic evaluation owing to three episodes of homonymous blurred vision for the past year. She describes the episodes as presenting as irregular shapes in both eyes. The shapes are located at the top left and right side of the visual fields and have a purple, light blue and brown color. During the episodes, the symptoms develop gradually over 5 to 10 minutes and resolve within 45 minutes. She has not noticed any precipitating factors. Her symptoms are not associated with muscle weakness, dizziness, or changes in speech. The patient denies ever having headaches in the past, but her mother and sister both see a neurologist for migraines. She denies the use of alcohol or drugs but has smoked 10 cigarettes daily for the past 30 years.
Test results from neurologic and eye examinations are normal. Routine laboratory tests are within reference normal limits. A carotid Doppler ultrasound indicates no carotid plaques. Brain MRI and CT angiography display normal results.

Botanical Briefs: Neem Oil (Azadirachta indica)
Commonly known as neem or nimba, Azadirachta indica traditionally has been used as an oil or poultice to lighten skin pigment and reduce joint inflammation. Neem is a drought-resistant evergreen tree with thin serrated leaves, white fragrant flowers, and olivelike fruit (Figure 1). This plant is indigenous to India but also is readily found within tropical and semitropical environments throughout the Middle East, Southeast Asia, North Africa, and Australia.
.")
Traditional Uses
For more than 4000 years, neem leaves, bark, fruit, and seeds have been used in food, insecticide, and herbal medicine cross-culturally in Indian Ayurvedic medicine and across Southeast Asia, particularly in Cambodia, Laos, Thailand, Myanmar, and Vietnam.1-3 Because of its many essential nutrients—oleic acid, palmitic acid, stearic acid, linoleic acid, behenic acid, arachidic acid, and palmitoleic acid—and readily available nature, some ethnic groups include neem in their diet.4 Neem commonly is used as a seasoning in soups and rice, eaten as a cooked vegetable, infused into teas and tonics, and pickled with other spices.5
All parts of the neem tree—both externally and internally—have been utilized in traditional medicine for the treatment of various diseases and ailments. The flowers have been used to treat eye diseases and dyspepsia, the fruit has been employed as an anthelmintic, the seeds and leaves have been used for malaria treatment and insecticide, the stem bark has been used for the treatment of diarrhea, and the root bark has been used for skin diseases and inflammation.6 Neem oil is a yellow-brown bitter substance that often is utilized to treat skin diseases such as psoriasis, eczema, fungal infections, and abscesses.
Case Report—A 77-year-old man presented with a diffuse rash across the lower back. He reported that he had been using topical neem oil to alleviate lower back pain and arthritis for the last 6 months with noted relief and improvement of back pain. After roughly 3 to 4 months of using neem oil, he noted a rash on the lower back, bilateral flanks, and buttocks (Figure 2). The rash was asymptomatic, and he denied any pruritus, scaling, pain, or burning. The patient was referred to dermatology and received a diagnosis of chemical leukoderma secondary to contact with A indica. The patient was advised to stop using the topical neem oil, and the rash was simply monitored, as it was asymptomatic.

Bioactivity
Research has elucidated multiple bioactivity mechanisms of neem, including melanogenesis-inhibitory activity, toxicity against pests, antimalarial activity, and antioxidant activity.1,7-9 Literature on the diverse phytochemical components of A indica indicate high levels of limonoids, flavonoids, and triterpenoids that are responsible for much of its antioxidant, anti-inflammatory, and insecticide properties.1,10
Melanogenesis-Inhibitory Activity—To date, neem has been added to a number of cosmetic products used in Ayurvedic medicine. One study of isolated compounds in A indica showed superior inhibitory activities against melanogenesis with minimal toxicity to cells (86.5%–105.1% cell viability). Western blot analysis of samples extracted and isolated from neem root and bark showed melanogenesis-inhibitory activities in B16 melanoma cells through the inhibition of microphthalmia-associated transcription factor expression and decreased expression of tyrosinase, as well as tyrosinase-related proteins 1 and 2, which are largely responsible for melanin synthesis.11 In another study, A indica flowers and their extracted constituents—6-deacetylnimbin and kaempferide—suggest melanogenesis-inhibitory activities in B16 melanoma cells with little to no toxicity to the cells (81.0%–111.7% cell viability).1 In an evaluationof A indica seed extracts, some of the isolated limonoids and diterpenoids exhibited a marked melanogenesis-inhibitory effect (74%–91% reduction of melanin content) with no toxicity to the cell.5 All of these studies indicate that active compounds in neem root, bark, flowers, and seeds may be potential skin-lightening agents.
Toxicity Against Pests—Neem seeds have phytochemicals that convey some insecticidal properties. The seeds often are ground into a powder, combined with water, and sprayed onto crops to act as an insecticide. As a natural method of nonpesticidal management, A indica acts as an antifeedant, insect repellent, and egg-laying deterrent that protects crops from damage. Studies of A indica have noted effective nonpesticidal management against arthropod pests such as armyworm, termites, and the oriental fruit fly.7,12,13
Antimalarial Activity—One study indicated that nimbolide, a limonoid from the neem plant, demonstrated antimalarial activity against Plasmodium falciparum. In separate cultures of asexual parasites and mature gametocytes, parasite numbers were less than 50% of the number in control cultures (8.0% vs 8.5% parasitemia, respectively).14 Thus, the lower parasite numbers indicated by this study highlight the antimalarial utility of nimbolide and neem oil.
Antioxidant and Anti-inflammatory Activity—Neem bark has been reported to have considerable antioxidant activity due to its high phenolic content.1,15 One study showed that azadirachtin and nimbolide in neem exhibited concentration-dependent antiradical scavenging activity and antioxidant properties.16
The anti-inflammatory potential for neem may occur via the inhibition of the nuclear factor-κB signaling pathway, which is linked to cancer, inflammation, and apoptosis.17 It also has been observed that nimbidin within neem extracts—such as leaves, bark, and seed extract—suppresses the function of macrophages and neutrophils relevant to inflammation.16 Another study indicated neem’s anti-inflammatory activity due to the regulation of proinflammatory enzymes such as cyclooxygenase and lipoxygenase.18
Safety, Toxicity, and Risks
Ingestion—Although neem is safe to use in the general population, neem oil poisoning has been reported, particularly in young children. Ingesting large quantities of neem has resulted in vomiting, hepatic toxicity, metabolic acidosis, late neurologic sequelae, and encephalopathy in young children.19 The diagnosis of neem oil poisoning is based on patient history, clinical examination, and imaging findings. Poisoning can manifest as drowsiness, tachypnea, and generalized seizures.20
Topical Application—Topical use of neem appears to be safe if the substance is diluted with other ingredients. However, direct application to the skin is not advised, as it may cause leukoderma and could induce allergic contact dermatitis and other allergic reactions.4
Final Thoughts
The use of neem extract for disease prevention and treatment has been prevalent around the world since ancient times. Neem has been documented to possess melanogenesis-inhibitory activity, toxicity against pests, antimalarial activity, and antioxidant activity by means of tyrosinase inhibition, phytochemical production, limonoid expression, and nuclear factor-κB regulation, respectively. However, topical use of neem may trigger a cutaneous response, highlighting the importance of considering a diagnosis of neem oil–induced chemical leukoderma when patients present with a hypopigmented rash and relevant history.
- Kitdamrongtham W, Ishii K, Ebina K, et al. Limonoids and flavonoids from the flowers of Azadirachta indica var. siamensis, and their melanogenesis-inhibitory and cytotoxic activities. Chem Biodivers. 2014;11:73-84. doi:10.1002/cbdv.201300266
- Singh A, Srivastava PS, Lakshmikumaran M. Comparison of AFLP and SAMPL markers for assessment of intra-population genetic variation in Azadirachta indica A. Juss. Plant Sci. 2002;162:17-25. doi:10.1016/S0168-9452(01)00503-9
- Pandey G, Verma K, Singh M. Evaluation of phytochemical, antibacterial and free radical scavenging properties of Azadirachta Indica (neem) leaves. Int J Pharm Pharmaceut Sci. 2014;6:444-447.
- Romita P, Calogiuri G, Bellino M, et al. Allergic contact dermatitis caused by neem oil: an underrated allergen. Contact Dermatitis. 2019;81:133-134. doi:10.1111/cod. 13256
- Akihisa T, Noto T, Takahashi A, et al. Melanogenesis inhibitory, anti-inflammatory, and chemopreventive effects of limonoids from the seeds of Azadirachta indica A. Juss. (neem). J Oleo Sci. 2009;58:581-594.
- Subapriya R, Nagini S. Medicinal properties of neem leaves: a review. Curr Med Chem Anticancer Agents. 2005;5:149-156. doi:10.2174/1568011053174828
- Areekul S, Sinchaisri P, Tigvatananon S. Effect of Thai plant extracts on the Oriental fruit fly. I: toxicity test. Agriculture and Natural Resources. 1987;21:395-407.
- Rochanakij S, Thebtaranonth Y, Yenjai C, et al. Nimbolide, a constituent of Azadirachta indica, inhibits Plasmodium falciparum in culture. Southeast Asian J Trop Med Public Health. 1985;16:66-72.
- Sithisarn P, Supabphol R, Gritsanapan W. Antioxidant activity of Siamese neem tree (VP1209). J Ethnopharmacol. 2005;99:109-112. doi:10.1016/j.jep.2005.02.008
- Yin F, Lei XX, Cheng L, et al. Isolation and structure identification of the compounds from the seeds and leaves of Azadirachta indica A. Juss. J China Pharmaceut University. 2005;36:10-12.
- Su S, Cheng J, Zhang C, et al. Melanogenesis-inhibitory activities of limonoids and tricyclic diterpenoids from Azadirachta indica. Bioorganic Chemistry. 2020;100:103941. doi:j.bioorg.2020.103941
- Tulashie SK, Adjei F, Abraham J, et al. Potential of neem extracts as natural insecticide against fall armyworm (Spodoptera frugiperda (JE Smith)(Lepidoptera: Noctuidae). Case Stud Chem Environ Eng. 2021;4:100130. doi:10.1016/j.cscee.2021.100130
- Yashroy RC, Gupta PK. Neem-seed oil inhibits growth of termite surface-tunnels. Indian J Toxicol. 2000;7:49-50.
- Udeinya JI, Shu EN, Quakyi I, et al. An antimalarial neem leaf extract has both schizonticidal and gametocytocidal activities. Am J Therapeutics. 2008;15:108-110. doi:10.1097/MJT.0b013e31804c6d1d
- Bindurani R, Kumar K. Evaluation of antioxidant activity of hydro distilled extracts of leaf, heart wood and flower of Azadirachta indica. Int J Pharm Sci Rev Res. 2013;20:222.
- Alzohairy MA. Therapeutics role of Azadirachta indica (Neem) and their active constituents in diseases prevention and treatment [published online March 1, 2016]. Evid Based Complement Alternat Med. doi:10.1155/2016/7382506
- Schumacher M, Cerella C, Reuter S, et al. Anti-inflammatory, pro-apoptotic, and anti-proliferative effects of a methanolic neem (Azadirachta indica) leaf extract are mediated via modulation of the nuclear factor-κB pathway. Genes Nutr. 2011;6:149-160. doi:10.1007/s12263-010-0194-6
- Kaur G, Sarwar Alam M, Athar M. Nimbidin suppresses functions of macrophages and neutrophils: relevance to its anti-inflammatory mechanisms. Phytotherapy Res. 2004;18:419-424. doi:10.1002/ptr.1474
- Dhongade RK, Kavade SG, Damle RS. Neem oil poisoning. Indian Pediatr. 2008;45:56-57.
- Bhaskar MV, Pramod SJ, Jeevika MU, et al. MR imaging findings of neem oil poisoning. Am J Neuroradiol. 2010;31:E60-E61. doi:10.3174/ajnr.A2146
Commonly known as neem or nimba, Azadirachta indica traditionally has been used as an oil or poultice to lighten skin pigment and reduce joint inflammation. Neem is a drought-resistant evergreen tree with thin serrated leaves, white fragrant flowers, and olivelike fruit (Figure 1). This plant is indigenous to India but also is readily found within tropical and semitropical environments throughout the Middle East, Southeast Asia, North Africa, and Australia.
Traditional Uses
For more than 4000 years, neem leaves, bark, fruit, and seeds have been used in food, insecticide, and herbal medicine cross-culturally in Indian Ayurvedic medicine and across Southeast Asia, particularly in Cambodia, Laos, Thailand, Myanmar, and Vietnam.1-3 Because of its many essential nutrients—oleic acid, palmitic acid, stearic acid, linoleic acid, behenic acid, arachidic acid, and palmitoleic acid—and readily available nature, some ethnic groups include neem in their diet.4 Neem commonly is used as a seasoning in soups and rice, eaten as a cooked vegetable, infused into teas and tonics, and pickled with other spices.5
All parts of the neem tree—both externally and internally—have been utilized in traditional medicine for the treatment of various diseases and ailments. The flowers have been used to treat eye diseases and dyspepsia, the fruit has been employed as an anthelmintic, the seeds and leaves have been used for malaria treatment and insecticide, the stem bark has been used for the treatment of diarrhea, and the root bark has been used for skin diseases and inflammation.6 Neem oil is a yellow-brown bitter substance that often is utilized to treat skin diseases such as psoriasis, eczema, fungal infections, and abscesses.
Case Report—A 77-year-old man presented with a diffuse rash across the lower back. He reported that he had been using topical neem oil to alleviate lower back pain and arthritis for the last 6 months with noted relief and improvement of back pain. After roughly 3 to 4 months of using neem oil, he noted a rash on the lower back, bilateral flanks, and buttocks (Figure 2). The rash was asymptomatic, and he denied any pruritus, scaling, pain, or burning. The patient was referred to dermatology and received a diagnosis of chemical leukoderma secondary to contact with A indica. The patient was advised to stop using the topical neem oil, and the rash was simply monitored, as it was asymptomatic.
Bioactivity
Research has elucidated multiple bioactivity mechanisms of neem, including melanogenesis-inhibitory activity, toxicity against pests, antimalarial activity, and antioxidant activity.1,7-9 Literature on the diverse phytochemical components of A indica indicate high levels of limonoids, flavonoids, and triterpenoids that are responsible for much of its antioxidant, anti-inflammatory, and insecticide properties.1,10
Melanogenesis-Inhibitory Activity—To date, neem has been added to a number of cosmetic products used in Ayurvedic medicine. One study of isolated compounds in A indica showed superior inhibitory activities against melanogenesis with minimal toxicity to cells (86.5%–105.1% cell viability). Western blot analysis of samples extracted and isolated from neem root and bark showed melanogenesis-inhibitory activities in B16 melanoma cells through the inhibition of microphthalmia-associated transcription factor expression and decreased expression of tyrosinase, as well as tyrosinase-related proteins 1 and 2, which are largely responsible for melanin synthesis.11 In another study, A indica flowers and their extracted constituents—6-deacetylnimbin and kaempferide—suggest melanogenesis-inhibitory activities in B16 melanoma cells with little to no toxicity to the cells (81.0%–111.7% cell viability).1 In an evaluationof A indica seed extracts, some of the isolated limonoids and diterpenoids exhibited a marked melanogenesis-inhibitory effect (74%–91% reduction of melanin content) with no toxicity to the cell.5 All of these studies indicate that active compounds in neem root, bark, flowers, and seeds may be potential skin-lightening agents.
Toxicity Against Pests—Neem seeds have phytochemicals that convey some insecticidal properties. The seeds often are ground into a powder, combined with water, and sprayed onto crops to act as an insecticide. As a natural method of nonpesticidal management, A indica acts as an antifeedant, insect repellent, and egg-laying deterrent that protects crops from damage. Studies of A indica have noted effective nonpesticidal management against arthropod pests such as armyworm, termites, and the oriental fruit fly.7,12,13
Antimalarial Activity—One study indicated that nimbolide, a limonoid from the neem plant, demonstrated antimalarial activity against Plasmodium falciparum. In separate cultures of asexual parasites and mature gametocytes, parasite numbers were less than 50% of the number in control cultures (8.0% vs 8.5% parasitemia, respectively).14 Thus, the lower parasite numbers indicated by this study highlight the antimalarial utility of nimbolide and neem oil.
Antioxidant and Anti-inflammatory Activity—Neem bark has been reported to have considerable antioxidant activity due to its high phenolic content.1,15 One study showed that azadirachtin and nimbolide in neem exhibited concentration-dependent antiradical scavenging activity and antioxidant properties.16
The anti-inflammatory potential for neem may occur via the inhibition of the nuclear factor-κB signaling pathway, which is linked to cancer, inflammation, and apoptosis.17 It also has been observed that nimbidin within neem extracts—such as leaves, bark, and seed extract—suppresses the function of macrophages and neutrophils relevant to inflammation.16 Another study indicated neem’s anti-inflammatory activity due to the regulation of proinflammatory enzymes such as cyclooxygenase and lipoxygenase.18
Safety, Toxicity, and Risks
Ingestion—Although neem is safe to use in the general population, neem oil poisoning has been reported, particularly in young children. Ingesting large quantities of neem has resulted in vomiting, hepatic toxicity, metabolic acidosis, late neurologic sequelae, and encephalopathy in young children.19 The diagnosis of neem oil poisoning is based on patient history, clinical examination, and imaging findings. Poisoning can manifest as drowsiness, tachypnea, and generalized seizures.20
Topical Application—Topical use of neem appears to be safe if the substance is diluted with other ingredients. However, direct application to the skin is not advised, as it may cause leukoderma and could induce allergic contact dermatitis and other allergic reactions.4
Final Thoughts
The use of neem extract for disease prevention and treatment has been prevalent around the world since ancient times. Neem has been documented to possess melanogenesis-inhibitory activity, toxicity against pests, antimalarial activity, and antioxidant activity by means of tyrosinase inhibition, phytochemical production, limonoid expression, and nuclear factor-κB regulation, respectively. However, topical use of neem may trigger a cutaneous response, highlighting the importance of considering a diagnosis of neem oil–induced chemical leukoderma when patients present with a hypopigmented rash and relevant history.
- Kitdamrongtham W, Ishii K, Ebina K, et al. Limonoids and flavonoids from the flowers of Azadirachta indica var. siamensis, and their melanogenesis-inhibitory and cytotoxic activities. Chem Biodivers. 2014;11:73-84. doi:10.1002/cbdv.201300266
- Singh A, Srivastava PS, Lakshmikumaran M. Comparison of AFLP and SAMPL markers for assessment of intra-population genetic variation in Azadirachta indica A. Juss. Plant Sci. 2002;162:17-25. doi:10.1016/S0168-9452(01)00503-9
- Pandey G, Verma K, Singh M. Evaluation of phytochemical, antibacterial and free radical scavenging properties of Azadirachta Indica (neem) leaves. Int J Pharm Pharmaceut Sci. 2014;6:444-447.
- Romita P, Calogiuri G, Bellino M, et al. Allergic contact dermatitis caused by neem oil: an underrated allergen. Contact Dermatitis. 2019;81:133-134. doi:10.1111/cod. 13256
- Akihisa T, Noto T, Takahashi A, et al. Melanogenesis inhibitory, anti-inflammatory, and chemopreventive effects of limonoids from the seeds of Azadirachta indica A. Juss. (neem). J Oleo Sci. 2009;58:581-594.
- Subapriya R, Nagini S. Medicinal properties of neem leaves: a review. Curr Med Chem Anticancer Agents. 2005;5:149-156. doi:10.2174/1568011053174828
- Areekul S, Sinchaisri P, Tigvatananon S. Effect of Thai plant extracts on the Oriental fruit fly. I: toxicity test. Agriculture and Natural Resources. 1987;21:395-407.
- Rochanakij S, Thebtaranonth Y, Yenjai C, et al. Nimbolide, a constituent of Azadirachta indica, inhibits Plasmodium falciparum in culture. Southeast Asian J Trop Med Public Health. 1985;16:66-72.
- Sithisarn P, Supabphol R, Gritsanapan W. Antioxidant activity of Siamese neem tree (VP1209). J Ethnopharmacol. 2005;99:109-112. doi:10.1016/j.jep.2005.02.008
- Yin F, Lei XX, Cheng L, et al. Isolation and structure identification of the compounds from the seeds and leaves of Azadirachta indica A. Juss. J China Pharmaceut University. 2005;36:10-12.
- Su S, Cheng J, Zhang C, et al. Melanogenesis-inhibitory activities of limonoids and tricyclic diterpenoids from Azadirachta indica. Bioorganic Chemistry. 2020;100:103941. doi:j.bioorg.2020.103941
- Tulashie SK, Adjei F, Abraham J, et al. Potential of neem extracts as natural insecticide against fall armyworm (Spodoptera frugiperda (JE Smith)(Lepidoptera: Noctuidae). Case Stud Chem Environ Eng. 2021;4:100130. doi:10.1016/j.cscee.2021.100130
- Yashroy RC, Gupta PK. Neem-seed oil inhibits growth of termite surface-tunnels. Indian J Toxicol. 2000;7:49-50.
- Udeinya JI, Shu EN, Quakyi I, et al. An antimalarial neem leaf extract has both schizonticidal and gametocytocidal activities. Am J Therapeutics. 2008;15:108-110. doi:10.1097/MJT.0b013e31804c6d1d
- Bindurani R, Kumar K. Evaluation of antioxidant activity of hydro distilled extracts of leaf, heart wood and flower of Azadirachta indica. Int J Pharm Sci Rev Res. 2013;20:222.
- Alzohairy MA. Therapeutics role of Azadirachta indica (Neem) and their active constituents in diseases prevention and treatment [published online March 1, 2016]. Evid Based Complement Alternat Med. doi:10.1155/2016/7382506
- Schumacher M, Cerella C, Reuter S, et al. Anti-inflammatory, pro-apoptotic, and anti-proliferative effects of a methanolic neem (Azadirachta indica) leaf extract are mediated via modulation of the nuclear factor-κB pathway. Genes Nutr. 2011;6:149-160. doi:10.1007/s12263-010-0194-6
- Kaur G, Sarwar Alam M, Athar M. Nimbidin suppresses functions of macrophages and neutrophils: relevance to its anti-inflammatory mechanisms. Phytotherapy Res. 2004;18:419-424. doi:10.1002/ptr.1474
- Dhongade RK, Kavade SG, Damle RS. Neem oil poisoning. Indian Pediatr. 2008;45:56-57.
- Bhaskar MV, Pramod SJ, Jeevika MU, et al. MR imaging findings of neem oil poisoning. Am J Neuroradiol. 2010;31:E60-E61. doi:10.3174/ajnr.A2146
Practice Points
- Neem is a traditional herb with various bioactivities, such as melanogenesis-inhibitory activity, toxicity against pests, antimalarial activity, and antioxidant activity.
- Neem should be used with caution as a remedy because of its skin-lightening properties, which are attributed to melanogenesis-inhibitory activity via tyrosinase inhibition.
- Chemical leukoderma should be included in the differential diagnosis when a patient presents with a hypopigmented rash after topical use of neem products.
")