User login
Relationships Between Residence Characteristics and Nursing Home Compare Database Quality Measures
From the University of Nebraska, Lincoln (Mr. Puckett and Dr. Ryherd), University of Nebraska Medical Center, Omaha (Dr. Manley), and the University of Nebraska, Omaha (Dr. Ryan).
ABSTRACT
Objective: This study evaluated relationships between physical characteristics of nursing home residences and quality-of-care measures.
Design: This was a cross-sectional ecologic study. The dependent variables were 5 Centers for Medicare & Medicaid Services (CMS) Nursing Home Compare database long-stay quality measures (QMs) during 2019: percentage of residents who displayed depressive symptoms, percentage of residents who were physically restrained, percentage of residents who experienced 1 or more falls resulting in injury, percentage of residents who received antipsychotic medication, and percentage of residents who received anti-anxiety medication. The independent variables were 4 residence characteristics: ownership type, size, occupancy, and region within the United States. We explored how different types of each residence characteristic compare for each QM.
Setting, participants, and measurements: Quality measure values from 15,420 CMS-supported nursing homes across the United States averaged over the 4 quarters of 2019 reporting were used. Welch’s analysis of variance was performed to examine whether the mean QM values for groups within each residential characteristic were statistically different.
Results: Publicly owned and low-occupancy residences had the highest mean QM values, indicating the poorest performance. Nonprofit and high-occupancy residences generally had the lowest (ie, best) mean QM values. There were significant differences in mean QM values among nursing home sizes and regions.
Conclusion: This study suggests that residence characteristics are related to 5 nursing home QMs. Results suggest that physical characteristics may be related to overall quality of life in nursing homes.
Keywords: quality of care, quality measures, residence characteristics, Alzheimer’s disease and related dementias.
More than 55 million people worldwide are living with Alzheimer’s disease and related dementias (ADRD).1 With the aging of the Baby Boomer population, this number is expected to rise to more than 78 million worldwide by 2030.1 Given the growing number of cognitively impaired older adults, there is an increased need for residences designed for the specialized care of this population. Although there are dozens of living options for the elderly, and although most specialized establishments have the resources to meet the immediate needs of their residents, many facilities lack universal design features that support a high quality of life for someone with ADRD or mild cognitive impairment. Previous research has shown relationships between behavioral and psychological symptoms of dementia (BPSD) and environmental characteristics such as acoustics, lighting, and indoor air temperature.2,3 Physical behaviors of BPSD, including aggression and wandering, and psychological symptoms, such as depression, anxiety, and delusions, put residents at risk of injury.4 Additionally, BPSD is correlated with caregiver burden and stress.5-8 Patients with dementia may also experience a lower stress threshold, changes in perception of space, and decreased short-term memory, creating environmental difficulties for those with ADRD9 that lead them to exhibit BPSD due to poor environmental design. Thus, there is a need to learn more about design features that minimize BPSD and promote a high quality of life for those with ADRD.10
Although research has shown relationships between physical environmental characteristics and BPSD, in this work we study relationships between possible BPSD indicators and 4 residence-level characteristics: ownership type, size, occupancy, and region in the United States (determined by location of the Centers for Medicare & Medicaid Services [CMS] regional offices). We analyzed data from the CMS Nursing Home Compare database for the year 2019.11 This database publishes quarterly data and star ratings for quality-of-care measures (QMs), staffing levels, and health inspections for every nursing home supported by CMS. Previous research has investigated the accuracy of QM reporting for resident falls, the impact of residential characteristics on administration of antipsychotic medication, the influence of profit status on resident outcomes and quality of care, and the effect of nursing home size on quality of life.12-16 Additionally, research suggests that residential characteristics such as size and location could be associated with infection control in nursing homes.17
Certain QMs, such as psychotropic drug administration, resident falls, and physical restraint, provide indicators of agitation, disorientation, or aggression, which are often signals of BPSD episodes. We hypothesized that residence types are associated with different QM scores, which could indicate different occurrences of BPSD. We selected 5 QMs for long-stay residents that could potentially be used as indicators of BPSD. Short-stay resident data were not included in this work to control for BPSD that could be a result of sheer unfamiliarity with the environment and confusion from being in a new home.
Methods
Design and Data Collection
This was a cross-sectional ecologic study aimed at exploring relationships between aggregate residential characteristics and QMs. Data were retrieved from the 2019 annual archives found in the CMS provider data catalog on nursing homes, including rehabilitation services.11 The dataset provides general residence information, such as ownership, number of beds, number of residents, and location, as well as residence quality metrics, such as QMs, staffing data, and inspection data. Residence characteristics and 4-quarter averages of QMs were retrieved and used as cross-sectional data. The data used are from 15,420 residences across the United States. Nursing homes located in Guam, the US Pacific Territories, Puerto Rico, and the US Virgin Islands, while supported by CMS and included in the dataset, were excluded from the study due to a severe absence of QM data.
Dependent Variables
We investigated 5 QMs that were averaged across the 4 quarters of 2019. The QMs used as dependent variables were percentage of residents who displayed depressive symptoms (depression), percentage of residents who were physically restrained (restraint), percentage of residents who experienced 1 or more falls resulting in a major injury (falls), percentage of residents who received antipsychotic medication (antipsychotic medication), and percentage of residents who received anti-anxiety or hypnotic medication (anti-anxiety medication).
A total of 2471 QM values were unreported across the 5 QM analyzed: 501 residences did not report depression data; 479 did not report restraint data; 477 did not report falls data; 508 did not report antipsychotic medication data; and 506 did not report anti-anxiety medication data. A residence with a missing QM value was excluded from that respective analysis.
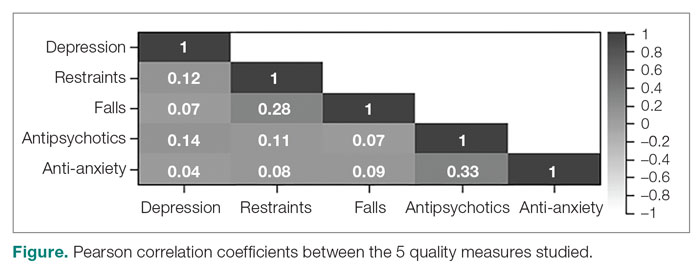
To assess the relationships among the different QMs, a Pearson correlation coefficient r was computed for each unique pair of QMs (Figure). All QMs studied were found to be very weakly or weakly correlated with one another using the Evans classification for very weak and weak correlations (r < 0.20 and 0.20 < r < 0.39, respectively).18
Independent Variables
A total of 15,420 residences were included in the study. Seventy-nine residences did not report occupancy data, however, so those residences were excluded from the occupancy analyses. We categorized the ownership of each nursing home as for-profit, nonprofit, or public. We categorized nursing home size, based on quartiles of the size distribution, as large (> 127 beds), medium (64 to 126 beds), and small (< 64 beds). This method for categorizing the residential characteristics was similar to that used in previous work.19 Similarly, we categorized nursing home occupancy as high (> 92% occupancy), medium (73% to 91% occupancy), and low (< 73% occupancy) based on quartiles of the occupancy distribution. For the regional analysis, we grouped states together based on the CMS regional offices: Atlanta, Georgia; Boston, Massachusetts; Chicago, Illinois; Dallas, Texas; Denver, Colorado; Kansas City, Missouri; New York, New York; Philadelphia, Pennsylvania; San Francisco, California; and Seattle, Washington.20
Analyses
We used Levene’s test to determine whether variances among the residential groups were equal for each QM, using an a priori α = 0.05. For all 20 tests conducted (4 residential characteristics for all 5 QMs), the resulting F-statistics were significant, indicating that the assumption of homogeneity of variance was not met.
We therefore used Welch’s analysis of variance (ANOVA) to evaluate whether the groups within each residential characteristic were the same on their QM means. For example, we tested whether for-profit, nonprofit, and public residences had significantly different mean depression rates. For statistically significant differences, a Games-Howell post-hoc test was conducted to test the difference between all unique pairwise comparisons. An a priori α = 0.05 was used for both Welch’s ANOVA and post-hoc testing. All analyses were conducted in RStudio Version 1.2.5033 (Posit Software, PBC).
Results
Mean Differences
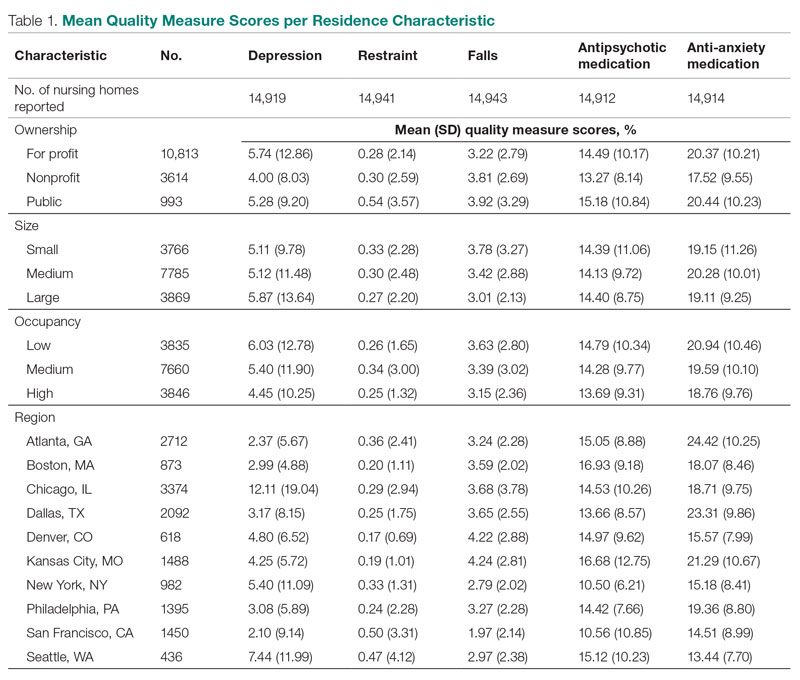
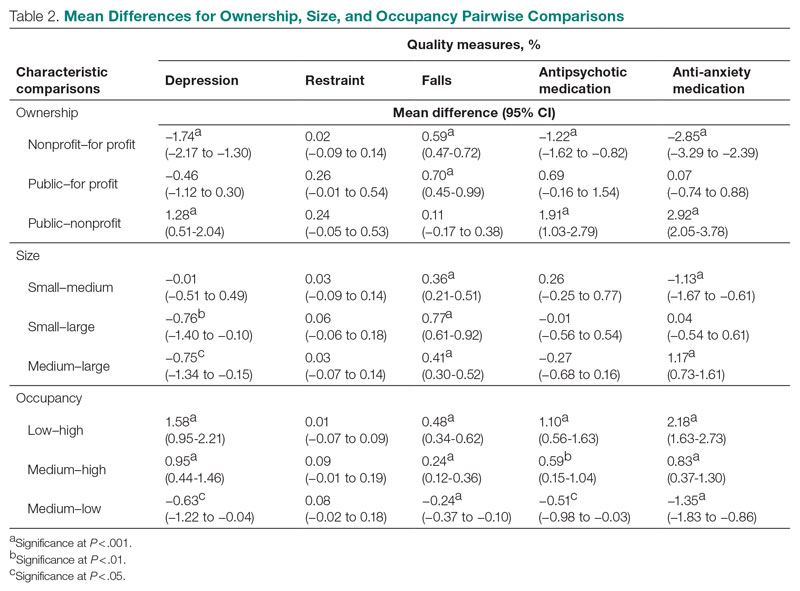
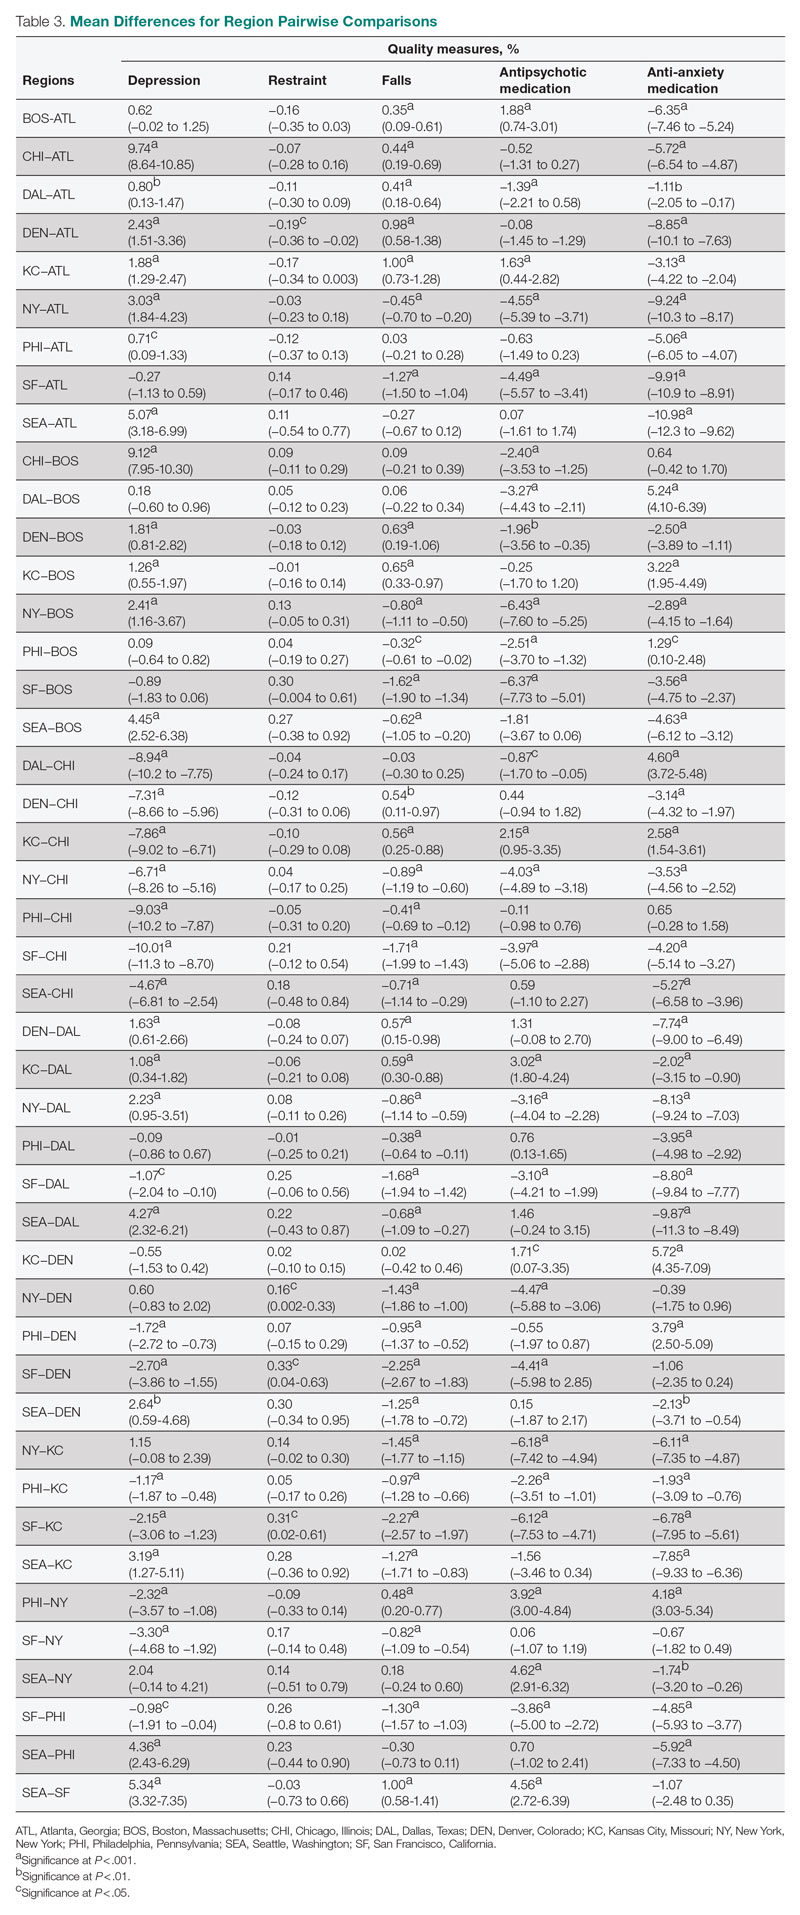
Mean QM scores for the 5 QMs investigated, grouped by residential characteristic for the 2019 year of reporting, are shown in Table 1. It should be noted that the number of residences that reported occupancy data (n = 15,341) does not equal the total number of residences included in the study (N = 15,420) because 79 residences did not report occupancy data. For all QMs reported in Table 1, lower scores are better. Table 2 and Table 3 show results from pairwise comparisons of mean differences for the different residential characteristic and QM groupings. Mean differences and 95% CI are presented along with an indication of statistical significance (when applicable).
Ownership
Nonprofit residences had significantly lower (ie, better) mean scores than for-profit and public residences for 3 QMs: resident depression, antipsychotic medication use, and anti-anxiety medication use. For-profit and public residences did not significantly differ in their mean values for these QMs. For-profit residences had a significantly lower mean score for resident falls than both nonprofit and public residences, but no significant difference existed between scores for nonprofit and public residence falls. There were no statistically significant differences between mean restraint scores among the ownership types.
Size
Large (ie, high-capacity) residences had a significantly higher mean depression score than both medium and small residences, but there was not a significant difference between medium and small residences. Large residences had the significantly lowest mean score for resident falls, and medium residences scored significantly lower than small residences. Medium residences had a significantly higher mean score for anti-anxiety medication use than both small and large residences, but there was no significant difference between small and large residences. There were no statistically significant differences between mean scores for restraint and antipsychotic medication use among the nursing home sizes.
Occupancy
The mean scores for 4 out of the 5 QMs exhibited similar relationships with occupancy rates: resident depression, falls, and antipsychotic and anti-anxiety medication use. Low-occupancy residences consistently scored significantly higher than both medium- and high-occupancy residences, and medium-occupancy residences consistently scored significantly higher than high-occupancy residences. On average, high-occupancy (≥ 92%) residences reported better QM scores than low-occupancy (< 73%) and medium-occupancy (73% to 91%) residences for all the QMs studied except physical restraint, which yielded no significant results. These findings indicate a possible inverse relationship between building occupancy rate and these 4 QMs.
Region
Pairwise comparisons of mean QM scores by region are shown in Table 3. The Chicago region had a significantly higher mean depression score than all other regions, while the San Francisco region’s score was significantly lower than all other regions, except Atlanta and Boston. The Kansas City region had a significantly higher mean score for resident falls than all other regions, with the exception of Denver, and the San Francisco region scored significantly lower than all other regions in falls. The Boston region had a significantly higher mean score for administering antipsychotic medication than all other regions, except for Kansas City and Seattle, and the New York and San Francisco regions both had significantly lower scores than all other regions except for each other. The Atlanta region reported a significantly higher mean score for administering antianxiety medication than all other regions, and the Seattle region’s score for anti-anxiety medication use was significantly lower than all other regions except for San Francisco.
Discussion
This study presented mean percentages for 5 QMs reported in the Nursing Home Compare database for the year 2019: depression, restraint, falls, antipsychotic medication use, and anti-anxiety medication use. We investigated these scores by 4 residential characteristics: ownership type, size, occupancy, and region. In general, publicly owned and low-occupancy residences had the highest scores, and thus the poorest performances, for the 5 chosen QMs during 2019. Nonprofit and high-occupancy residences generally had the lowest (ie, better) scores, and this result agrees with previous findings on long-stay nursing home residents.21 One possible explanation for better performance by high-occupancy buildings could be that increased social interaction is beneficial to nursing home residents as compared with low-occupancy buildings, where less social interaction is probable. It is difficult to draw conclusions regarding nursing home size and region; however, there are significant differences among sizes for 3 out of the 5 QMs and significant differences among regions for all 5 QMs. The analyses suggest that residence-level characteristics are related to QM scores. Although reported QMs are not a direct representation of resident quality of life, this work agrees with previous research that residential characteristics have some impact on the lives of nursing home residents.13-17 Improvements in QM reporting and changes in quality improvement goals since the formation of Nursing Home Compare exist, suggesting that nursing homes’ awareness of their reporting duties may impact quality of care or reporting tendencies.21,22 Future research should consider investigating the impacts of the COVID-19 pandemic on quality-reporting trends and QM scores.
Other physical characteristics of nursing homes, such as noise, lighting levels, and air quality, may also have an impact on QMs and possibly nursing home residents themselves. This type of data exploration could be included in future research. Additionally, future research could include a similar analysis over a longer period, rather than the 1-year period examined here, to investigate which types of residences consistently have high or low scores or how different types of residences have evolved over the years, particularly considering the impact of the COVID-19 pandemic. Information such as staffing levels, building renovations, and inspection data could be accounted for in future studies. Different QMs could also be investigated to better understand the influence of residential characteristics on quality of care.
Conclusion
This study suggests that residence-level characteristics are related to 5 reported nursing home QMs. Overall, nonprofit and high-occupancy residences had the lowest QM scores, indicating the highest performance. Although the results do not necessarily suggest that residence-level characteristics impact individual nursing home residents’ quality of life, they suggest that physical characteristics affect overall quality of life in nursing homes. Future research is needed to determine the specific physical characteristics of these residences that affect QM scores.
Corresponding author: Brian J. Puckett, [email protected].
Disclosures: None reported.
1. Gauthier S, Rosa-Neto P, Morais JA, et al. World Alzheimer report 2021: journey through the diagnosis of dementia. Alzheimer’s Disease International; 2021.
2. Garre-Olmo J, López-Pousa S, Turon-Estrada A, et al. Environmental determinants of quality of life in nursing home residents with severe dementia. J Am Geriatr Soc. 2012;60(7):1230-1236. doi:10.1111/j.1532-5415.2012.04040.x
3. Zeisel J, Silverstein N, Hyde J, et al. Environmental correlates to behavioral health outcomes in Alzheimer’s special care units. Gerontologist. 2003;43(5):697-711. doi:10.1093/geront/43.5.697
4. Brawley E. Environmental design for Alzheimer’s disease: a quality of life issue. Aging Ment Health. 2001;5(1):S79-S83. doi:10.1080/13607860120044846
5. Joosse L. Do sound levels and space contribute to agitation in nursing home residents with dementia? Research Gerontol Nurs. 2012;5(3):174-184. doi:10.3928/19404921-20120605-02
6. Dowling G, Graf C, Hubbard E, et al. Light treatment for neuropsychiatric behaviors in Alzheimer’s disease. Western J Nurs Res. 2007;29(8):961-975. doi:10.1177/0193945907303083
7. Tartarini F, Cooper P, Fleming R, et al. Indoor air temperature and agitation of nursing home residents with dementia. Am J Alzheimers Dis Other Demen. 2017;32(5):272-281. doi:10.1177/1533317517704898
8. Miyamoto Y, Tachimori H, Ito H. Formal caregiver burden in dementia: impact of behavioral and psychological symptoms of dementia and activities of daily living. Geriatr Nurs. 2010;31(4):246-253. doi:10.1016/j.gerinurse.2010.01.002
9. Dementia care and the built environment: position paper 3. Alzheimer’s Australia; 2004.
10. Cloak N, Al Khalili Y. Behavioral and psychological symptoms in dementia. Updated July 21, 2022. In: StatPearls [Internet]. StatPearls Publishing; 2022.
11. Centers for Medicare & Medicaid Services. Nursing homes including rehab services data archive. 2019 annual files. Accessed January 30, 2023. https://data.cms.gov/provider-data/archived-data/nursing-homes
12. Sanghavi P, Pan S, Caudry D. Assessment of nursing home reporting of major injury falls for quality measurement on Nursing Home Compare. Health Serv Res. 2020;55(2):201-210. doi:10.1111/1475-6773.13247
13. Hughes C, Lapane K, Mor V. Influence of facility characteristics on use of antipsychotic medications in nursing homes. Med Care. 2000;38(12):1164-1173. doi:10.1097/00005650-200012000-00003
14. Aaronson W, Zinn J, Rosko M. Do for-profit and not-for-profit nursing homes behave differently? Gerontologist. 1994;34(6):775-786. doi:10.1093/geront/34.6.775
15. O’Neill C, Harrington C, Kitchener M, et al. Quality of care in nursing homes: an analysis of relationships among profit, quality, and ownership. Med Care. 2003;41(12):1318-1330. doi:10.1097/01.MLR.0000100586.33970.58
16. Allen PD, Klein WC, Gruman C. Correlates of complaints made to the Connecticut Long-Term Care Ombudsman program: the role of organizational and structural factors. Res Aging. 2003;25(6):631-654. doi:10.1177/0164027503256691
17. Abrams H, Loomer L, Gandhi A, et al. Characteristics of U.S. nursing homes with COVID-19 cases. J Am Geriatr Soc. 2020;68(8):1653-1656. doi:10.1111/jgs.16661
18. Evans JD. Straightforward Statistics for the Behavioral Sciences. Thomson Brooks/Cole Publishing Co; 1996.
19. Zinn J, Spector W, Hsieh L, et al. Do trends in the reporting of quality measures on the Nursing Home Compare web site differ by nursing home characteristics? Gerontologist. 2005;45(6):720-730.
20. Centers for Medicare & Medicaid Services. CMS Regional Offices. Accessed January 30, 2023. https://www.cms.gov/Medicare/Coding/ICD10/CMS-Regional-Offices
21. Mukamel DB, Weimer DL, Spector WD, et al. Publication of quality report cards and trends in reported quality measures in nursing homes. Health Serv Res. 2008;43(4):1244-1262. doi:10.1093/geront/45.6.720
22. Harris Y, Clauser SB. Achieving improvement through nursing home quality measurement. Health Care Financ Rev. 2002;23(4):5-18.
From the University of Nebraska, Lincoln (Mr. Puckett and Dr. Ryherd), University of Nebraska Medical Center, Omaha (Dr. Manley), and the University of Nebraska, Omaha (Dr. Ryan).
ABSTRACT
Objective: This study evaluated relationships between physical characteristics of nursing home residences and quality-of-care measures.
Design: This was a cross-sectional ecologic study. The dependent variables were 5 Centers for Medicare & Medicaid Services (CMS) Nursing Home Compare database long-stay quality measures (QMs) during 2019: percentage of residents who displayed depressive symptoms, percentage of residents who were physically restrained, percentage of residents who experienced 1 or more falls resulting in injury, percentage of residents who received antipsychotic medication, and percentage of residents who received anti-anxiety medication. The independent variables were 4 residence characteristics: ownership type, size, occupancy, and region within the United States. We explored how different types of each residence characteristic compare for each QM.
Setting, participants, and measurements: Quality measure values from 15,420 CMS-supported nursing homes across the United States averaged over the 4 quarters of 2019 reporting were used. Welch’s analysis of variance was performed to examine whether the mean QM values for groups within each residential characteristic were statistically different.
Results: Publicly owned and low-occupancy residences had the highest mean QM values, indicating the poorest performance. Nonprofit and high-occupancy residences generally had the lowest (ie, best) mean QM values. There were significant differences in mean QM values among nursing home sizes and regions.
Conclusion: This study suggests that residence characteristics are related to 5 nursing home QMs. Results suggest that physical characteristics may be related to overall quality of life in nursing homes.
Keywords: quality of care, quality measures, residence characteristics, Alzheimer’s disease and related dementias.
More than 55 million people worldwide are living with Alzheimer’s disease and related dementias (ADRD).1 With the aging of the Baby Boomer population, this number is expected to rise to more than 78 million worldwide by 2030.1 Given the growing number of cognitively impaired older adults, there is an increased need for residences designed for the specialized care of this population. Although there are dozens of living options for the elderly, and although most specialized establishments have the resources to meet the immediate needs of their residents, many facilities lack universal design features that support a high quality of life for someone with ADRD or mild cognitive impairment. Previous research has shown relationships between behavioral and psychological symptoms of dementia (BPSD) and environmental characteristics such as acoustics, lighting, and indoor air temperature.2,3 Physical behaviors of BPSD, including aggression and wandering, and psychological symptoms, such as depression, anxiety, and delusions, put residents at risk of injury.4 Additionally, BPSD is correlated with caregiver burden and stress.5-8 Patients with dementia may also experience a lower stress threshold, changes in perception of space, and decreased short-term memory, creating environmental difficulties for those with ADRD9 that lead them to exhibit BPSD due to poor environmental design. Thus, there is a need to learn more about design features that minimize BPSD and promote a high quality of life for those with ADRD.10
Although research has shown relationships between physical environmental characteristics and BPSD, in this work we study relationships between possible BPSD indicators and 4 residence-level characteristics: ownership type, size, occupancy, and region in the United States (determined by location of the Centers for Medicare & Medicaid Services [CMS] regional offices). We analyzed data from the CMS Nursing Home Compare database for the year 2019.11 This database publishes quarterly data and star ratings for quality-of-care measures (QMs), staffing levels, and health inspections for every nursing home supported by CMS. Previous research has investigated the accuracy of QM reporting for resident falls, the impact of residential characteristics on administration of antipsychotic medication, the influence of profit status on resident outcomes and quality of care, and the effect of nursing home size on quality of life.12-16 Additionally, research suggests that residential characteristics such as size and location could be associated with infection control in nursing homes.17
Certain QMs, such as psychotropic drug administration, resident falls, and physical restraint, provide indicators of agitation, disorientation, or aggression, which are often signals of BPSD episodes. We hypothesized that residence types are associated with different QM scores, which could indicate different occurrences of BPSD. We selected 5 QMs for long-stay residents that could potentially be used as indicators of BPSD. Short-stay resident data were not included in this work to control for BPSD that could be a result of sheer unfamiliarity with the environment and confusion from being in a new home.
Methods
Design and Data Collection
This was a cross-sectional ecologic study aimed at exploring relationships between aggregate residential characteristics and QMs. Data were retrieved from the 2019 annual archives found in the CMS provider data catalog on nursing homes, including rehabilitation services.11 The dataset provides general residence information, such as ownership, number of beds, number of residents, and location, as well as residence quality metrics, such as QMs, staffing data, and inspection data. Residence characteristics and 4-quarter averages of QMs were retrieved and used as cross-sectional data. The data used are from 15,420 residences across the United States. Nursing homes located in Guam, the US Pacific Territories, Puerto Rico, and the US Virgin Islands, while supported by CMS and included in the dataset, were excluded from the study due to a severe absence of QM data.
Dependent Variables
We investigated 5 QMs that were averaged across the 4 quarters of 2019. The QMs used as dependent variables were percentage of residents who displayed depressive symptoms (depression), percentage of residents who were physically restrained (restraint), percentage of residents who experienced 1 or more falls resulting in a major injury (falls), percentage of residents who received antipsychotic medication (antipsychotic medication), and percentage of residents who received anti-anxiety or hypnotic medication (anti-anxiety medication).
A total of 2471 QM values were unreported across the 5 QM analyzed: 501 residences did not report depression data; 479 did not report restraint data; 477 did not report falls data; 508 did not report antipsychotic medication data; and 506 did not report anti-anxiety medication data. A residence with a missing QM value was excluded from that respective analysis.
To assess the relationships among the different QMs, a Pearson correlation coefficient r was computed for each unique pair of QMs (Figure). All QMs studied were found to be very weakly or weakly correlated with one another using the Evans classification for very weak and weak correlations (r < 0.20 and 0.20 < r < 0.39, respectively).18
Independent Variables
A total of 15,420 residences were included in the study. Seventy-nine residences did not report occupancy data, however, so those residences were excluded from the occupancy analyses. We categorized the ownership of each nursing home as for-profit, nonprofit, or public. We categorized nursing home size, based on quartiles of the size distribution, as large (> 127 beds), medium (64 to 126 beds), and small (< 64 beds). This method for categorizing the residential characteristics was similar to that used in previous work.19 Similarly, we categorized nursing home occupancy as high (> 92% occupancy), medium (73% to 91% occupancy), and low (< 73% occupancy) based on quartiles of the occupancy distribution. For the regional analysis, we grouped states together based on the CMS regional offices: Atlanta, Georgia; Boston, Massachusetts; Chicago, Illinois; Dallas, Texas; Denver, Colorado; Kansas City, Missouri; New York, New York; Philadelphia, Pennsylvania; San Francisco, California; and Seattle, Washington.20
Analyses
We used Levene’s test to determine whether variances among the residential groups were equal for each QM, using an a priori α = 0.05. For all 20 tests conducted (4 residential characteristics for all 5 QMs), the resulting F-statistics were significant, indicating that the assumption of homogeneity of variance was not met.
We therefore used Welch’s analysis of variance (ANOVA) to evaluate whether the groups within each residential characteristic were the same on their QM means. For example, we tested whether for-profit, nonprofit, and public residences had significantly different mean depression rates. For statistically significant differences, a Games-Howell post-hoc test was conducted to test the difference between all unique pairwise comparisons. An a priori α = 0.05 was used for both Welch’s ANOVA and post-hoc testing. All analyses were conducted in RStudio Version 1.2.5033 (Posit Software, PBC).
Results
Mean Differences
Mean QM scores for the 5 QMs investigated, grouped by residential characteristic for the 2019 year of reporting, are shown in Table 1. It should be noted that the number of residences that reported occupancy data (n = 15,341) does not equal the total number of residences included in the study (N = 15,420) because 79 residences did not report occupancy data. For all QMs reported in Table 1, lower scores are better. Table 2 and Table 3 show results from pairwise comparisons of mean differences for the different residential characteristic and QM groupings. Mean differences and 95% CI are presented along with an indication of statistical significance (when applicable).
Ownership
Nonprofit residences had significantly lower (ie, better) mean scores than for-profit and public residences for 3 QMs: resident depression, antipsychotic medication use, and anti-anxiety medication use. For-profit and public residences did not significantly differ in their mean values for these QMs. For-profit residences had a significantly lower mean score for resident falls than both nonprofit and public residences, but no significant difference existed between scores for nonprofit and public residence falls. There were no statistically significant differences between mean restraint scores among the ownership types.
Size
Large (ie, high-capacity) residences had a significantly higher mean depression score than both medium and small residences, but there was not a significant difference between medium and small residences. Large residences had the significantly lowest mean score for resident falls, and medium residences scored significantly lower than small residences. Medium residences had a significantly higher mean score for anti-anxiety medication use than both small and large residences, but there was no significant difference between small and large residences. There were no statistically significant differences between mean scores for restraint and antipsychotic medication use among the nursing home sizes.
Occupancy
The mean scores for 4 out of the 5 QMs exhibited similar relationships with occupancy rates: resident depression, falls, and antipsychotic and anti-anxiety medication use. Low-occupancy residences consistently scored significantly higher than both medium- and high-occupancy residences, and medium-occupancy residences consistently scored significantly higher than high-occupancy residences. On average, high-occupancy (≥ 92%) residences reported better QM scores than low-occupancy (< 73%) and medium-occupancy (73% to 91%) residences for all the QMs studied except physical restraint, which yielded no significant results. These findings indicate a possible inverse relationship between building occupancy rate and these 4 QMs.
Region
Pairwise comparisons of mean QM scores by region are shown in Table 3. The Chicago region had a significantly higher mean depression score than all other regions, while the San Francisco region’s score was significantly lower than all other regions, except Atlanta and Boston. The Kansas City region had a significantly higher mean score for resident falls than all other regions, with the exception of Denver, and the San Francisco region scored significantly lower than all other regions in falls. The Boston region had a significantly higher mean score for administering antipsychotic medication than all other regions, except for Kansas City and Seattle, and the New York and San Francisco regions both had significantly lower scores than all other regions except for each other. The Atlanta region reported a significantly higher mean score for administering antianxiety medication than all other regions, and the Seattle region’s score for anti-anxiety medication use was significantly lower than all other regions except for San Francisco.
Discussion
This study presented mean percentages for 5 QMs reported in the Nursing Home Compare database for the year 2019: depression, restraint, falls, antipsychotic medication use, and anti-anxiety medication use. We investigated these scores by 4 residential characteristics: ownership type, size, occupancy, and region. In general, publicly owned and low-occupancy residences had the highest scores, and thus the poorest performances, for the 5 chosen QMs during 2019. Nonprofit and high-occupancy residences generally had the lowest (ie, better) scores, and this result agrees with previous findings on long-stay nursing home residents.21 One possible explanation for better performance by high-occupancy buildings could be that increased social interaction is beneficial to nursing home residents as compared with low-occupancy buildings, where less social interaction is probable. It is difficult to draw conclusions regarding nursing home size and region; however, there are significant differences among sizes for 3 out of the 5 QMs and significant differences among regions for all 5 QMs. The analyses suggest that residence-level characteristics are related to QM scores. Although reported QMs are not a direct representation of resident quality of life, this work agrees with previous research that residential characteristics have some impact on the lives of nursing home residents.13-17 Improvements in QM reporting and changes in quality improvement goals since the formation of Nursing Home Compare exist, suggesting that nursing homes’ awareness of their reporting duties may impact quality of care or reporting tendencies.21,22 Future research should consider investigating the impacts of the COVID-19 pandemic on quality-reporting trends and QM scores.
Other physical characteristics of nursing homes, such as noise, lighting levels, and air quality, may also have an impact on QMs and possibly nursing home residents themselves. This type of data exploration could be included in future research. Additionally, future research could include a similar analysis over a longer period, rather than the 1-year period examined here, to investigate which types of residences consistently have high or low scores or how different types of residences have evolved over the years, particularly considering the impact of the COVID-19 pandemic. Information such as staffing levels, building renovations, and inspection data could be accounted for in future studies. Different QMs could also be investigated to better understand the influence of residential characteristics on quality of care.
Conclusion
This study suggests that residence-level characteristics are related to 5 reported nursing home QMs. Overall, nonprofit and high-occupancy residences had the lowest QM scores, indicating the highest performance. Although the results do not necessarily suggest that residence-level characteristics impact individual nursing home residents’ quality of life, they suggest that physical characteristics affect overall quality of life in nursing homes. Future research is needed to determine the specific physical characteristics of these residences that affect QM scores.
Corresponding author: Brian J. Puckett, [email protected].
Disclosures: None reported.
From the University of Nebraska, Lincoln (Mr. Puckett and Dr. Ryherd), University of Nebraska Medical Center, Omaha (Dr. Manley), and the University of Nebraska, Omaha (Dr. Ryan).
ABSTRACT
Objective: This study evaluated relationships between physical characteristics of nursing home residences and quality-of-care measures.
Design: This was a cross-sectional ecologic study. The dependent variables were 5 Centers for Medicare & Medicaid Services (CMS) Nursing Home Compare database long-stay quality measures (QMs) during 2019: percentage of residents who displayed depressive symptoms, percentage of residents who were physically restrained, percentage of residents who experienced 1 or more falls resulting in injury, percentage of residents who received antipsychotic medication, and percentage of residents who received anti-anxiety medication. The independent variables were 4 residence characteristics: ownership type, size, occupancy, and region within the United States. We explored how different types of each residence characteristic compare for each QM.
Setting, participants, and measurements: Quality measure values from 15,420 CMS-supported nursing homes across the United States averaged over the 4 quarters of 2019 reporting were used. Welch’s analysis of variance was performed to examine whether the mean QM values for groups within each residential characteristic were statistically different.
Results: Publicly owned and low-occupancy residences had the highest mean QM values, indicating the poorest performance. Nonprofit and high-occupancy residences generally had the lowest (ie, best) mean QM values. There were significant differences in mean QM values among nursing home sizes and regions.
Conclusion: This study suggests that residence characteristics are related to 5 nursing home QMs. Results suggest that physical characteristics may be related to overall quality of life in nursing homes.
Keywords: quality of care, quality measures, residence characteristics, Alzheimer’s disease and related dementias.
More than 55 million people worldwide are living with Alzheimer’s disease and related dementias (ADRD).1 With the aging of the Baby Boomer population, this number is expected to rise to more than 78 million worldwide by 2030.1 Given the growing number of cognitively impaired older adults, there is an increased need for residences designed for the specialized care of this population. Although there are dozens of living options for the elderly, and although most specialized establishments have the resources to meet the immediate needs of their residents, many facilities lack universal design features that support a high quality of life for someone with ADRD or mild cognitive impairment. Previous research has shown relationships between behavioral and psychological symptoms of dementia (BPSD) and environmental characteristics such as acoustics, lighting, and indoor air temperature.2,3 Physical behaviors of BPSD, including aggression and wandering, and psychological symptoms, such as depression, anxiety, and delusions, put residents at risk of injury.4 Additionally, BPSD is correlated with caregiver burden and stress.5-8 Patients with dementia may also experience a lower stress threshold, changes in perception of space, and decreased short-term memory, creating environmental difficulties for those with ADRD9 that lead them to exhibit BPSD due to poor environmental design. Thus, there is a need to learn more about design features that minimize BPSD and promote a high quality of life for those with ADRD.10
Although research has shown relationships between physical environmental characteristics and BPSD, in this work we study relationships between possible BPSD indicators and 4 residence-level characteristics: ownership type, size, occupancy, and region in the United States (determined by location of the Centers for Medicare & Medicaid Services [CMS] regional offices). We analyzed data from the CMS Nursing Home Compare database for the year 2019.11 This database publishes quarterly data and star ratings for quality-of-care measures (QMs), staffing levels, and health inspections for every nursing home supported by CMS. Previous research has investigated the accuracy of QM reporting for resident falls, the impact of residential characteristics on administration of antipsychotic medication, the influence of profit status on resident outcomes and quality of care, and the effect of nursing home size on quality of life.12-16 Additionally, research suggests that residential characteristics such as size and location could be associated with infection control in nursing homes.17
Certain QMs, such as psychotropic drug administration, resident falls, and physical restraint, provide indicators of agitation, disorientation, or aggression, which are often signals of BPSD episodes. We hypothesized that residence types are associated with different QM scores, which could indicate different occurrences of BPSD. We selected 5 QMs for long-stay residents that could potentially be used as indicators of BPSD. Short-stay resident data were not included in this work to control for BPSD that could be a result of sheer unfamiliarity with the environment and confusion from being in a new home.
Methods
Design and Data Collection
This was a cross-sectional ecologic study aimed at exploring relationships between aggregate residential characteristics and QMs. Data were retrieved from the 2019 annual archives found in the CMS provider data catalog on nursing homes, including rehabilitation services.11 The dataset provides general residence information, such as ownership, number of beds, number of residents, and location, as well as residence quality metrics, such as QMs, staffing data, and inspection data. Residence characteristics and 4-quarter averages of QMs were retrieved and used as cross-sectional data. The data used are from 15,420 residences across the United States. Nursing homes located in Guam, the US Pacific Territories, Puerto Rico, and the US Virgin Islands, while supported by CMS and included in the dataset, were excluded from the study due to a severe absence of QM data.
Dependent Variables
We investigated 5 QMs that were averaged across the 4 quarters of 2019. The QMs used as dependent variables were percentage of residents who displayed depressive symptoms (depression), percentage of residents who were physically restrained (restraint), percentage of residents who experienced 1 or more falls resulting in a major injury (falls), percentage of residents who received antipsychotic medication (antipsychotic medication), and percentage of residents who received anti-anxiety or hypnotic medication (anti-anxiety medication).
A total of 2471 QM values were unreported across the 5 QM analyzed: 501 residences did not report depression data; 479 did not report restraint data; 477 did not report falls data; 508 did not report antipsychotic medication data; and 506 did not report anti-anxiety medication data. A residence with a missing QM value was excluded from that respective analysis.
To assess the relationships among the different QMs, a Pearson correlation coefficient r was computed for each unique pair of QMs (Figure). All QMs studied were found to be very weakly or weakly correlated with one another using the Evans classification for very weak and weak correlations (r < 0.20 and 0.20 < r < 0.39, respectively).18
Independent Variables
A total of 15,420 residences were included in the study. Seventy-nine residences did not report occupancy data, however, so those residences were excluded from the occupancy analyses. We categorized the ownership of each nursing home as for-profit, nonprofit, or public. We categorized nursing home size, based on quartiles of the size distribution, as large (> 127 beds), medium (64 to 126 beds), and small (< 64 beds). This method for categorizing the residential characteristics was similar to that used in previous work.19 Similarly, we categorized nursing home occupancy as high (> 92% occupancy), medium (73% to 91% occupancy), and low (< 73% occupancy) based on quartiles of the occupancy distribution. For the regional analysis, we grouped states together based on the CMS regional offices: Atlanta, Georgia; Boston, Massachusetts; Chicago, Illinois; Dallas, Texas; Denver, Colorado; Kansas City, Missouri; New York, New York; Philadelphia, Pennsylvania; San Francisco, California; and Seattle, Washington.20
Analyses
We used Levene’s test to determine whether variances among the residential groups were equal for each QM, using an a priori α = 0.05. For all 20 tests conducted (4 residential characteristics for all 5 QMs), the resulting F-statistics were significant, indicating that the assumption of homogeneity of variance was not met.
We therefore used Welch’s analysis of variance (ANOVA) to evaluate whether the groups within each residential characteristic were the same on their QM means. For example, we tested whether for-profit, nonprofit, and public residences had significantly different mean depression rates. For statistically significant differences, a Games-Howell post-hoc test was conducted to test the difference between all unique pairwise comparisons. An a priori α = 0.05 was used for both Welch’s ANOVA and post-hoc testing. All analyses were conducted in RStudio Version 1.2.5033 (Posit Software, PBC).
Results
Mean Differences
Mean QM scores for the 5 QMs investigated, grouped by residential characteristic for the 2019 year of reporting, are shown in Table 1. It should be noted that the number of residences that reported occupancy data (n = 15,341) does not equal the total number of residences included in the study (N = 15,420) because 79 residences did not report occupancy data. For all QMs reported in Table 1, lower scores are better. Table 2 and Table 3 show results from pairwise comparisons of mean differences for the different residential characteristic and QM groupings. Mean differences and 95% CI are presented along with an indication of statistical significance (when applicable).
Ownership
Nonprofit residences had significantly lower (ie, better) mean scores than for-profit and public residences for 3 QMs: resident depression, antipsychotic medication use, and anti-anxiety medication use. For-profit and public residences did not significantly differ in their mean values for these QMs. For-profit residences had a significantly lower mean score for resident falls than both nonprofit and public residences, but no significant difference existed between scores for nonprofit and public residence falls. There were no statistically significant differences between mean restraint scores among the ownership types.
Size
Large (ie, high-capacity) residences had a significantly higher mean depression score than both medium and small residences, but there was not a significant difference between medium and small residences. Large residences had the significantly lowest mean score for resident falls, and medium residences scored significantly lower than small residences. Medium residences had a significantly higher mean score for anti-anxiety medication use than both small and large residences, but there was no significant difference between small and large residences. There were no statistically significant differences between mean scores for restraint and antipsychotic medication use among the nursing home sizes.
Occupancy
The mean scores for 4 out of the 5 QMs exhibited similar relationships with occupancy rates: resident depression, falls, and antipsychotic and anti-anxiety medication use. Low-occupancy residences consistently scored significantly higher than both medium- and high-occupancy residences, and medium-occupancy residences consistently scored significantly higher than high-occupancy residences. On average, high-occupancy (≥ 92%) residences reported better QM scores than low-occupancy (< 73%) and medium-occupancy (73% to 91%) residences for all the QMs studied except physical restraint, which yielded no significant results. These findings indicate a possible inverse relationship between building occupancy rate and these 4 QMs.
Region
Pairwise comparisons of mean QM scores by region are shown in Table 3. The Chicago region had a significantly higher mean depression score than all other regions, while the San Francisco region’s score was significantly lower than all other regions, except Atlanta and Boston. The Kansas City region had a significantly higher mean score for resident falls than all other regions, with the exception of Denver, and the San Francisco region scored significantly lower than all other regions in falls. The Boston region had a significantly higher mean score for administering antipsychotic medication than all other regions, except for Kansas City and Seattle, and the New York and San Francisco regions both had significantly lower scores than all other regions except for each other. The Atlanta region reported a significantly higher mean score for administering antianxiety medication than all other regions, and the Seattle region’s score for anti-anxiety medication use was significantly lower than all other regions except for San Francisco.
Discussion
This study presented mean percentages for 5 QMs reported in the Nursing Home Compare database for the year 2019: depression, restraint, falls, antipsychotic medication use, and anti-anxiety medication use. We investigated these scores by 4 residential characteristics: ownership type, size, occupancy, and region. In general, publicly owned and low-occupancy residences had the highest scores, and thus the poorest performances, for the 5 chosen QMs during 2019. Nonprofit and high-occupancy residences generally had the lowest (ie, better) scores, and this result agrees with previous findings on long-stay nursing home residents.21 One possible explanation for better performance by high-occupancy buildings could be that increased social interaction is beneficial to nursing home residents as compared with low-occupancy buildings, where less social interaction is probable. It is difficult to draw conclusions regarding nursing home size and region; however, there are significant differences among sizes for 3 out of the 5 QMs and significant differences among regions for all 5 QMs. The analyses suggest that residence-level characteristics are related to QM scores. Although reported QMs are not a direct representation of resident quality of life, this work agrees with previous research that residential characteristics have some impact on the lives of nursing home residents.13-17 Improvements in QM reporting and changes in quality improvement goals since the formation of Nursing Home Compare exist, suggesting that nursing homes’ awareness of their reporting duties may impact quality of care or reporting tendencies.21,22 Future research should consider investigating the impacts of the COVID-19 pandemic on quality-reporting trends and QM scores.
Other physical characteristics of nursing homes, such as noise, lighting levels, and air quality, may also have an impact on QMs and possibly nursing home residents themselves. This type of data exploration could be included in future research. Additionally, future research could include a similar analysis over a longer period, rather than the 1-year period examined here, to investigate which types of residences consistently have high or low scores or how different types of residences have evolved over the years, particularly considering the impact of the COVID-19 pandemic. Information such as staffing levels, building renovations, and inspection data could be accounted for in future studies. Different QMs could also be investigated to better understand the influence of residential characteristics on quality of care.
Conclusion
This study suggests that residence-level characteristics are related to 5 reported nursing home QMs. Overall, nonprofit and high-occupancy residences had the lowest QM scores, indicating the highest performance. Although the results do not necessarily suggest that residence-level characteristics impact individual nursing home residents’ quality of life, they suggest that physical characteristics affect overall quality of life in nursing homes. Future research is needed to determine the specific physical characteristics of these residences that affect QM scores.
Corresponding author: Brian J. Puckett, [email protected].
Disclosures: None reported.
1. Gauthier S, Rosa-Neto P, Morais JA, et al. World Alzheimer report 2021: journey through the diagnosis of dementia. Alzheimer’s Disease International; 2021.
2. Garre-Olmo J, López-Pousa S, Turon-Estrada A, et al. Environmental determinants of quality of life in nursing home residents with severe dementia. J Am Geriatr Soc. 2012;60(7):1230-1236. doi:10.1111/j.1532-5415.2012.04040.x
3. Zeisel J, Silverstein N, Hyde J, et al. Environmental correlates to behavioral health outcomes in Alzheimer’s special care units. Gerontologist. 2003;43(5):697-711. doi:10.1093/geront/43.5.697
4. Brawley E. Environmental design for Alzheimer’s disease: a quality of life issue. Aging Ment Health. 2001;5(1):S79-S83. doi:10.1080/13607860120044846
5. Joosse L. Do sound levels and space contribute to agitation in nursing home residents with dementia? Research Gerontol Nurs. 2012;5(3):174-184. doi:10.3928/19404921-20120605-02
6. Dowling G, Graf C, Hubbard E, et al. Light treatment for neuropsychiatric behaviors in Alzheimer’s disease. Western J Nurs Res. 2007;29(8):961-975. doi:10.1177/0193945907303083
7. Tartarini F, Cooper P, Fleming R, et al. Indoor air temperature and agitation of nursing home residents with dementia. Am J Alzheimers Dis Other Demen. 2017;32(5):272-281. doi:10.1177/1533317517704898
8. Miyamoto Y, Tachimori H, Ito H. Formal caregiver burden in dementia: impact of behavioral and psychological symptoms of dementia and activities of daily living. Geriatr Nurs. 2010;31(4):246-253. doi:10.1016/j.gerinurse.2010.01.002
9. Dementia care and the built environment: position paper 3. Alzheimer’s Australia; 2004.
10. Cloak N, Al Khalili Y. Behavioral and psychological symptoms in dementia. Updated July 21, 2022. In: StatPearls [Internet]. StatPearls Publishing; 2022.
11. Centers for Medicare & Medicaid Services. Nursing homes including rehab services data archive. 2019 annual files. Accessed January 30, 2023. https://data.cms.gov/provider-data/archived-data/nursing-homes
12. Sanghavi P, Pan S, Caudry D. Assessment of nursing home reporting of major injury falls for quality measurement on Nursing Home Compare. Health Serv Res. 2020;55(2):201-210. doi:10.1111/1475-6773.13247
13. Hughes C, Lapane K, Mor V. Influence of facility characteristics on use of antipsychotic medications in nursing homes. Med Care. 2000;38(12):1164-1173. doi:10.1097/00005650-200012000-00003
14. Aaronson W, Zinn J, Rosko M. Do for-profit and not-for-profit nursing homes behave differently? Gerontologist. 1994;34(6):775-786. doi:10.1093/geront/34.6.775
15. O’Neill C, Harrington C, Kitchener M, et al. Quality of care in nursing homes: an analysis of relationships among profit, quality, and ownership. Med Care. 2003;41(12):1318-1330. doi:10.1097/01.MLR.0000100586.33970.58
16. Allen PD, Klein WC, Gruman C. Correlates of complaints made to the Connecticut Long-Term Care Ombudsman program: the role of organizational and structural factors. Res Aging. 2003;25(6):631-654. doi:10.1177/0164027503256691
17. Abrams H, Loomer L, Gandhi A, et al. Characteristics of U.S. nursing homes with COVID-19 cases. J Am Geriatr Soc. 2020;68(8):1653-1656. doi:10.1111/jgs.16661
18. Evans JD. Straightforward Statistics for the Behavioral Sciences. Thomson Brooks/Cole Publishing Co; 1996.
19. Zinn J, Spector W, Hsieh L, et al. Do trends in the reporting of quality measures on the Nursing Home Compare web site differ by nursing home characteristics? Gerontologist. 2005;45(6):720-730.
20. Centers for Medicare & Medicaid Services. CMS Regional Offices. Accessed January 30, 2023. https://www.cms.gov/Medicare/Coding/ICD10/CMS-Regional-Offices
21. Mukamel DB, Weimer DL, Spector WD, et al. Publication of quality report cards and trends in reported quality measures in nursing homes. Health Serv Res. 2008;43(4):1244-1262. doi:10.1093/geront/45.6.720
22. Harris Y, Clauser SB. Achieving improvement through nursing home quality measurement. Health Care Financ Rev. 2002;23(4):5-18.
1. Gauthier S, Rosa-Neto P, Morais JA, et al. World Alzheimer report 2021: journey through the diagnosis of dementia. Alzheimer’s Disease International; 2021.
2. Garre-Olmo J, López-Pousa S, Turon-Estrada A, et al. Environmental determinants of quality of life in nursing home residents with severe dementia. J Am Geriatr Soc. 2012;60(7):1230-1236. doi:10.1111/j.1532-5415.2012.04040.x
3. Zeisel J, Silverstein N, Hyde J, et al. Environmental correlates to behavioral health outcomes in Alzheimer’s special care units. Gerontologist. 2003;43(5):697-711. doi:10.1093/geront/43.5.697
4. Brawley E. Environmental design for Alzheimer’s disease: a quality of life issue. Aging Ment Health. 2001;5(1):S79-S83. doi:10.1080/13607860120044846
5. Joosse L. Do sound levels and space contribute to agitation in nursing home residents with dementia? Research Gerontol Nurs. 2012;5(3):174-184. doi:10.3928/19404921-20120605-02
6. Dowling G, Graf C, Hubbard E, et al. Light treatment for neuropsychiatric behaviors in Alzheimer’s disease. Western J Nurs Res. 2007;29(8):961-975. doi:10.1177/0193945907303083
7. Tartarini F, Cooper P, Fleming R, et al. Indoor air temperature and agitation of nursing home residents with dementia. Am J Alzheimers Dis Other Demen. 2017;32(5):272-281. doi:10.1177/1533317517704898
8. Miyamoto Y, Tachimori H, Ito H. Formal caregiver burden in dementia: impact of behavioral and psychological symptoms of dementia and activities of daily living. Geriatr Nurs. 2010;31(4):246-253. doi:10.1016/j.gerinurse.2010.01.002
9. Dementia care and the built environment: position paper 3. Alzheimer’s Australia; 2004.
10. Cloak N, Al Khalili Y. Behavioral and psychological symptoms in dementia. Updated July 21, 2022. In: StatPearls [Internet]. StatPearls Publishing; 2022.
11. Centers for Medicare & Medicaid Services. Nursing homes including rehab services data archive. 2019 annual files. Accessed January 30, 2023. https://data.cms.gov/provider-data/archived-data/nursing-homes
12. Sanghavi P, Pan S, Caudry D. Assessment of nursing home reporting of major injury falls for quality measurement on Nursing Home Compare. Health Serv Res. 2020;55(2):201-210. doi:10.1111/1475-6773.13247
13. Hughes C, Lapane K, Mor V. Influence of facility characteristics on use of antipsychotic medications in nursing homes. Med Care. 2000;38(12):1164-1173. doi:10.1097/00005650-200012000-00003
14. Aaronson W, Zinn J, Rosko M. Do for-profit and not-for-profit nursing homes behave differently? Gerontologist. 1994;34(6):775-786. doi:10.1093/geront/34.6.775
15. O’Neill C, Harrington C, Kitchener M, et al. Quality of care in nursing homes: an analysis of relationships among profit, quality, and ownership. Med Care. 2003;41(12):1318-1330. doi:10.1097/01.MLR.0000100586.33970.58
16. Allen PD, Klein WC, Gruman C. Correlates of complaints made to the Connecticut Long-Term Care Ombudsman program: the role of organizational and structural factors. Res Aging. 2003;25(6):631-654. doi:10.1177/0164027503256691
17. Abrams H, Loomer L, Gandhi A, et al. Characteristics of U.S. nursing homes with COVID-19 cases. J Am Geriatr Soc. 2020;68(8):1653-1656. doi:10.1111/jgs.16661
18. Evans JD. Straightforward Statistics for the Behavioral Sciences. Thomson Brooks/Cole Publishing Co; 1996.
19. Zinn J, Spector W, Hsieh L, et al. Do trends in the reporting of quality measures on the Nursing Home Compare web site differ by nursing home characteristics? Gerontologist. 2005;45(6):720-730.
20. Centers for Medicare & Medicaid Services. CMS Regional Offices. Accessed January 30, 2023. https://www.cms.gov/Medicare/Coding/ICD10/CMS-Regional-Offices
21. Mukamel DB, Weimer DL, Spector WD, et al. Publication of quality report cards and trends in reported quality measures in nursing homes. Health Serv Res. 2008;43(4):1244-1262. doi:10.1093/geront/45.6.720
22. Harris Y, Clauser SB. Achieving improvement through nursing home quality measurement. Health Care Financ Rev. 2002;23(4):5-18.
Tooth loss and diabetes together hasten mental decline
most specifically in those 65-74 years of age, new findings suggest.
The data come from a 12-year follow-up of older adults in a nationally representative U.S. survey.
“From a clinical perspective, our study demonstrates the importance of improving access to dental health care and integrating primary dental and medical care. Health care professionals and family caregivers should pay close attention to the cognitive status of diabetic older adults with poor oral health status,” lead author Bei Wu, PhD, of New York University, said in an interview. Dr. Wu is the Dean’s Professor in Global Health and codirector of the NYU Aging Incubator.
Moreover, said Dr. Wu: “For individuals with both poor oral health and diabetes, regular dental visits should be encouraged in addition to adherence to the diabetes self-care protocol.”
Diabetes has long been recognized as a risk factor for cognitive decline, but the findings have been inconsistent for different age groups. Tooth loss has also been linked to cognitive decline and dementia, as well as diabetes.
The mechanisms aren’t entirely clear, but “co-occurring diabetes and poor oral health may increase the risk for dementia, possibly via the potentially interrelated pathways of chronic inflammation and cardiovascular risk factors,” Dr. Wu said.
The new study, published in the Journal of Dental Research, is the first to examine the relationships between all three conditions by age group.
Diabetes, edentulism, and cognitive decline
The data came from a total of 9,948 participants in the Health and Retirement Study (HRS) from 2006 to 2018. At baseline, 5,440 participants were aged 65-74 years, 3,300 were aged 75-84, and 1,208 were aged 85 years or older.
They were assessed every 2 years using the 35-point Telephone Survey for Cognitive Status, which included tests of immediate and delayed word recall, repeated subtracting by 7, counting backward from 20, naming objects, and naming the president and vice president of the U.S. As might be expected, the youngest group scored the highest, averaging 23 points, while the oldest group scored lowest, at 18.5 points.
Participants were also asked if they had ever been told by a doctor that they have diabetes. Another question was: “Have you lost all of your upper and lower natural permanent teeth?”
The condition of having no teeth is known as edentulism.
The percentages of participants who reported having both diabetes and edentulism were 6.0%, 6.7%, and 5.0% for those aged 65-74 years, 75-84 years, and 85 years or older, respectively. The proportions with neither of those conditions were 63.5%, 60.4%, and 58.3% in those three age groups, respectively (P < .001).
Compared with their counterparts with neither diabetes nor edentulism at baseline, older adults with both conditions aged 65-74 years (P < .001) and aged 75-84 years had worse cognitive function (P < .001).
In terms of the rate of cognitive decline, compared with those with neither condition from the same age cohort, older adults aged 65-74 years with both conditions declined at a higher rate (P < .001).
Having diabetes alone led to accelerated cognitive decline in older adults aged 65-74 years (P < .001). Having edentulism alone led to accelerated decline in older adults aged 65-74 years (P < .001) and older adults aged 75-84 years (P < 0.01).
“Our study finds the co-occurrence of diabetes and edentulism led to a worse cognitive function and a faster cognitive decline in older adults aged 65-74 years,” say Wu and colleagues.
Study limitations: Better data needed
The study has several limitations, most of them due to the data source. For example, while the HRS collects detailed information on cognitive status, edentulism is its only measure of oral health. There were no data on whether individuals had replacements such as dentures or implants that would affect their ability to eat, which could influence other health factors.
“I have made repeated appeals for federal funding to collect more oral health-related information in large national surveys,” Dr. Wu told this news organization.
Similarly, assessments of diabetes status such as hemoglobin A1c were only available for small subsets and not sufficient to demonstrate statistical significance, she explained.
Dr. Wu suggested that both oral health and cognitive screening might be included in the “Welcome to Medicare” preventive visit. In addition, “Oral hygiene practice should also be highlighted to improve cognitive health. Developing dental care interventions and programs are needed for reducing the societal cost of dementia.”
The study was partially supported by the National Institutes of Health. The authors have reported no relevant financial relationships.
A version of this article first appeared on Medscape.com.
most specifically in those 65-74 years of age, new findings suggest.
The data come from a 12-year follow-up of older adults in a nationally representative U.S. survey.
“From a clinical perspective, our study demonstrates the importance of improving access to dental health care and integrating primary dental and medical care. Health care professionals and family caregivers should pay close attention to the cognitive status of diabetic older adults with poor oral health status,” lead author Bei Wu, PhD, of New York University, said in an interview. Dr. Wu is the Dean’s Professor in Global Health and codirector of the NYU Aging Incubator.
Moreover, said Dr. Wu: “For individuals with both poor oral health and diabetes, regular dental visits should be encouraged in addition to adherence to the diabetes self-care protocol.”
Diabetes has long been recognized as a risk factor for cognitive decline, but the findings have been inconsistent for different age groups. Tooth loss has also been linked to cognitive decline and dementia, as well as diabetes.
The mechanisms aren’t entirely clear, but “co-occurring diabetes and poor oral health may increase the risk for dementia, possibly via the potentially interrelated pathways of chronic inflammation and cardiovascular risk factors,” Dr. Wu said.
The new study, published in the Journal of Dental Research, is the first to examine the relationships between all three conditions by age group.
Diabetes, edentulism, and cognitive decline
The data came from a total of 9,948 participants in the Health and Retirement Study (HRS) from 2006 to 2018. At baseline, 5,440 participants were aged 65-74 years, 3,300 were aged 75-84, and 1,208 were aged 85 years or older.
They were assessed every 2 years using the 35-point Telephone Survey for Cognitive Status, which included tests of immediate and delayed word recall, repeated subtracting by 7, counting backward from 20, naming objects, and naming the president and vice president of the U.S. As might be expected, the youngest group scored the highest, averaging 23 points, while the oldest group scored lowest, at 18.5 points.
Participants were also asked if they had ever been told by a doctor that they have diabetes. Another question was: “Have you lost all of your upper and lower natural permanent teeth?”
The condition of having no teeth is known as edentulism.
The percentages of participants who reported having both diabetes and edentulism were 6.0%, 6.7%, and 5.0% for those aged 65-74 years, 75-84 years, and 85 years or older, respectively. The proportions with neither of those conditions were 63.5%, 60.4%, and 58.3% in those three age groups, respectively (P < .001).
Compared with their counterparts with neither diabetes nor edentulism at baseline, older adults with both conditions aged 65-74 years (P < .001) and aged 75-84 years had worse cognitive function (P < .001).
In terms of the rate of cognitive decline, compared with those with neither condition from the same age cohort, older adults aged 65-74 years with both conditions declined at a higher rate (P < .001).
Having diabetes alone led to accelerated cognitive decline in older adults aged 65-74 years (P < .001). Having edentulism alone led to accelerated decline in older adults aged 65-74 years (P < .001) and older adults aged 75-84 years (P < 0.01).
“Our study finds the co-occurrence of diabetes and edentulism led to a worse cognitive function and a faster cognitive decline in older adults aged 65-74 years,” say Wu and colleagues.
Study limitations: Better data needed
The study has several limitations, most of them due to the data source. For example, while the HRS collects detailed information on cognitive status, edentulism is its only measure of oral health. There were no data on whether individuals had replacements such as dentures or implants that would affect their ability to eat, which could influence other health factors.
“I have made repeated appeals for federal funding to collect more oral health-related information in large national surveys,” Dr. Wu told this news organization.
Similarly, assessments of diabetes status such as hemoglobin A1c were only available for small subsets and not sufficient to demonstrate statistical significance, she explained.
Dr. Wu suggested that both oral health and cognitive screening might be included in the “Welcome to Medicare” preventive visit. In addition, “Oral hygiene practice should also be highlighted to improve cognitive health. Developing dental care interventions and programs are needed for reducing the societal cost of dementia.”
The study was partially supported by the National Institutes of Health. The authors have reported no relevant financial relationships.
A version of this article first appeared on Medscape.com.
most specifically in those 65-74 years of age, new findings suggest.
The data come from a 12-year follow-up of older adults in a nationally representative U.S. survey.
“From a clinical perspective, our study demonstrates the importance of improving access to dental health care and integrating primary dental and medical care. Health care professionals and family caregivers should pay close attention to the cognitive status of diabetic older adults with poor oral health status,” lead author Bei Wu, PhD, of New York University, said in an interview. Dr. Wu is the Dean’s Professor in Global Health and codirector of the NYU Aging Incubator.
Moreover, said Dr. Wu: “For individuals with both poor oral health and diabetes, regular dental visits should be encouraged in addition to adherence to the diabetes self-care protocol.”
Diabetes has long been recognized as a risk factor for cognitive decline, but the findings have been inconsistent for different age groups. Tooth loss has also been linked to cognitive decline and dementia, as well as diabetes.
The mechanisms aren’t entirely clear, but “co-occurring diabetes and poor oral health may increase the risk for dementia, possibly via the potentially interrelated pathways of chronic inflammation and cardiovascular risk factors,” Dr. Wu said.
The new study, published in the Journal of Dental Research, is the first to examine the relationships between all three conditions by age group.
Diabetes, edentulism, and cognitive decline
The data came from a total of 9,948 participants in the Health and Retirement Study (HRS) from 2006 to 2018. At baseline, 5,440 participants were aged 65-74 years, 3,300 were aged 75-84, and 1,208 were aged 85 years or older.
They were assessed every 2 years using the 35-point Telephone Survey for Cognitive Status, which included tests of immediate and delayed word recall, repeated subtracting by 7, counting backward from 20, naming objects, and naming the president and vice president of the U.S. As might be expected, the youngest group scored the highest, averaging 23 points, while the oldest group scored lowest, at 18.5 points.
Participants were also asked if they had ever been told by a doctor that they have diabetes. Another question was: “Have you lost all of your upper and lower natural permanent teeth?”
The condition of having no teeth is known as edentulism.
The percentages of participants who reported having both diabetes and edentulism were 6.0%, 6.7%, and 5.0% for those aged 65-74 years, 75-84 years, and 85 years or older, respectively. The proportions with neither of those conditions were 63.5%, 60.4%, and 58.3% in those three age groups, respectively (P < .001).
Compared with their counterparts with neither diabetes nor edentulism at baseline, older adults with both conditions aged 65-74 years (P < .001) and aged 75-84 years had worse cognitive function (P < .001).
In terms of the rate of cognitive decline, compared with those with neither condition from the same age cohort, older adults aged 65-74 years with both conditions declined at a higher rate (P < .001).
Having diabetes alone led to accelerated cognitive decline in older adults aged 65-74 years (P < .001). Having edentulism alone led to accelerated decline in older adults aged 65-74 years (P < .001) and older adults aged 75-84 years (P < 0.01).
“Our study finds the co-occurrence of diabetes and edentulism led to a worse cognitive function and a faster cognitive decline in older adults aged 65-74 years,” say Wu and colleagues.
Study limitations: Better data needed
The study has several limitations, most of them due to the data source. For example, while the HRS collects detailed information on cognitive status, edentulism is its only measure of oral health. There were no data on whether individuals had replacements such as dentures or implants that would affect their ability to eat, which could influence other health factors.
“I have made repeated appeals for federal funding to collect more oral health-related information in large national surveys,” Dr. Wu told this news organization.
Similarly, assessments of diabetes status such as hemoglobin A1c were only available for small subsets and not sufficient to demonstrate statistical significance, she explained.
Dr. Wu suggested that both oral health and cognitive screening might be included in the “Welcome to Medicare” preventive visit. In addition, “Oral hygiene practice should also be highlighted to improve cognitive health. Developing dental care interventions and programs are needed for reducing the societal cost of dementia.”
The study was partially supported by the National Institutes of Health. The authors have reported no relevant financial relationships.
A version of this article first appeared on Medscape.com.
FROM THE JOURNAL OF DENTAL RESEARCH
Watch for buprenorphine ‘spiking’ in urine drug tests
Urine drug testing can be valuable for monitoring patients undergoing treatment with buprenorphine for opioid use disorder (OUD). However, some patients alter their test results by adding buprenorphine directly to their urine sample to imply adherence, a new study shows.
“I anticipate a much-needed increase” in the number of people gaining access to buprenorphine therapy, given elimination of the X waiver, first author Jarratt D. Pytell, MD, with University of Colorado at Denver, Aurora, said in a statement.
“New prescribers of buprenorphine will need to learn how to conduct the increasingly complex initiation of treatment and then gauge whether it is successful or not,” added Dr. Pytell, a general internist and addiction medicine specialist.
“Spiking suggests that treatment is not working – especially in patients continuing illicit drug use. Detecting spiking allows clinicians to adjust or intensify the treatment plan,” Dr. Pytell said in an interview.
The study was published online in JAMA Psychiatry.
A sign of elevated patient risk
In a cross-sectional study using Millennium Health’s proprietary urine drug test (UDT) database, researchers analyzed 507,735 urine specimens from 58,476 OUD patients collected between January 2017 and April 2022.
A total of 9546 (1.9%) specimens from 4,550 patients (7.6%) were suggestive of spiking.
UDT specimens suggestive of spiking had two times the odds of being positive for other opioids (fentanyl or heroin), compared with opioid negative samples.
UDT specimens obtained from primary care clinics, from patients aged 35-44 years, and from patients living in the South Atlantic region of the United States were also more likely to be suggestive of buprenorphine spiking.
“Our study demonstrated that a buprenorphine to norbuprenorphine ratio of less than 0.02 indicates the possibility of spiking,” Dr. Pytell said in an interview.
“Nevertheless, it is important to note that this cutoff is not a definitive standard and further controlled studies are necessary to determine its predictive value for spiking. But recognizing possible spiking is very important since it demonstrates a point of elevated risk for the patient and the treatment approach should be reconsidered,” Dr. Pytell said.
“At Millennium Health, we have been tracking the enormity of the drug use crisis. This study suggests that spiking is an important patient safety issue, and it is not uncommon,” study coauthor Eric Dawson, PharmD, vice president of clinical affairs, Millennium Health, said in a statement.
“Detection of spiking requires definitive drug testing. Immunoassay-based, point-of-care tests cannot detect spiking because they are generally incapable of quantitative analysis and differentiating buprenorphine from norbuprenorphine,” Dr. Dawson said.
Best practices?
“We need to develop best practices specific for this situation where a patient has added buprenorphine to the urine drug test specimen,” said Dr. Pytell.
“As with all unexpected findings, it is crucial for clinicians to approach this finding in a nonjudgmental manner and work with the patient to understand what might have motivated them to alter their urine specimen,” he added.
Dr. Pytell said a common reaction for clinicians might be to discontinue treatment. However, this is actually a time to try and engage with the patient.
“Clinicians should work collaboratively with patients to identify potential reasons for spiking and determine what changes may need to be made to better support the patient’s recovery,” Dr. Pytell said.
“This could include more frequent monitoring or referral to a higher level of care. In addition, clinicians should be aware that patients who engage in spiking may be experiencing other challenges that impact their ability to adhere to treatment, such as inadequate housing, mental health issues, or financial strain. Addressing these underlying issues may help patients overcome barriers to treatment adherence and reduce the likelihood of future spiking,” Dr. Pytell said.
This study was supported by Millennium Health. The authors have no relevant disclosures.
A version of this article first appeared on Medscape.com.
Urine drug testing can be valuable for monitoring patients undergoing treatment with buprenorphine for opioid use disorder (OUD). However, some patients alter their test results by adding buprenorphine directly to their urine sample to imply adherence, a new study shows.
“I anticipate a much-needed increase” in the number of people gaining access to buprenorphine therapy, given elimination of the X waiver, first author Jarratt D. Pytell, MD, with University of Colorado at Denver, Aurora, said in a statement.
“New prescribers of buprenorphine will need to learn how to conduct the increasingly complex initiation of treatment and then gauge whether it is successful or not,” added Dr. Pytell, a general internist and addiction medicine specialist.
“Spiking suggests that treatment is not working – especially in patients continuing illicit drug use. Detecting spiking allows clinicians to adjust or intensify the treatment plan,” Dr. Pytell said in an interview.
The study was published online in JAMA Psychiatry.
A sign of elevated patient risk
In a cross-sectional study using Millennium Health’s proprietary urine drug test (UDT) database, researchers analyzed 507,735 urine specimens from 58,476 OUD patients collected between January 2017 and April 2022.
A total of 9546 (1.9%) specimens from 4,550 patients (7.6%) were suggestive of spiking.
UDT specimens suggestive of spiking had two times the odds of being positive for other opioids (fentanyl or heroin), compared with opioid negative samples.
UDT specimens obtained from primary care clinics, from patients aged 35-44 years, and from patients living in the South Atlantic region of the United States were also more likely to be suggestive of buprenorphine spiking.
“Our study demonstrated that a buprenorphine to norbuprenorphine ratio of less than 0.02 indicates the possibility of spiking,” Dr. Pytell said in an interview.
“Nevertheless, it is important to note that this cutoff is not a definitive standard and further controlled studies are necessary to determine its predictive value for spiking. But recognizing possible spiking is very important since it demonstrates a point of elevated risk for the patient and the treatment approach should be reconsidered,” Dr. Pytell said.
“At Millennium Health, we have been tracking the enormity of the drug use crisis. This study suggests that spiking is an important patient safety issue, and it is not uncommon,” study coauthor Eric Dawson, PharmD, vice president of clinical affairs, Millennium Health, said in a statement.
“Detection of spiking requires definitive drug testing. Immunoassay-based, point-of-care tests cannot detect spiking because they are generally incapable of quantitative analysis and differentiating buprenorphine from norbuprenorphine,” Dr. Dawson said.
Best practices?
“We need to develop best practices specific for this situation where a patient has added buprenorphine to the urine drug test specimen,” said Dr. Pytell.
“As with all unexpected findings, it is crucial for clinicians to approach this finding in a nonjudgmental manner and work with the patient to understand what might have motivated them to alter their urine specimen,” he added.
Dr. Pytell said a common reaction for clinicians might be to discontinue treatment. However, this is actually a time to try and engage with the patient.
“Clinicians should work collaboratively with patients to identify potential reasons for spiking and determine what changes may need to be made to better support the patient’s recovery,” Dr. Pytell said.
“This could include more frequent monitoring or referral to a higher level of care. In addition, clinicians should be aware that patients who engage in spiking may be experiencing other challenges that impact their ability to adhere to treatment, such as inadequate housing, mental health issues, or financial strain. Addressing these underlying issues may help patients overcome barriers to treatment adherence and reduce the likelihood of future spiking,” Dr. Pytell said.
This study was supported by Millennium Health. The authors have no relevant disclosures.
A version of this article first appeared on Medscape.com.
Urine drug testing can be valuable for monitoring patients undergoing treatment with buprenorphine for opioid use disorder (OUD). However, some patients alter their test results by adding buprenorphine directly to their urine sample to imply adherence, a new study shows.
“I anticipate a much-needed increase” in the number of people gaining access to buprenorphine therapy, given elimination of the X waiver, first author Jarratt D. Pytell, MD, with University of Colorado at Denver, Aurora, said in a statement.
“New prescribers of buprenorphine will need to learn how to conduct the increasingly complex initiation of treatment and then gauge whether it is successful or not,” added Dr. Pytell, a general internist and addiction medicine specialist.
“Spiking suggests that treatment is not working – especially in patients continuing illicit drug use. Detecting spiking allows clinicians to adjust or intensify the treatment plan,” Dr. Pytell said in an interview.
The study was published online in JAMA Psychiatry.
A sign of elevated patient risk
In a cross-sectional study using Millennium Health’s proprietary urine drug test (UDT) database, researchers analyzed 507,735 urine specimens from 58,476 OUD patients collected between January 2017 and April 2022.
A total of 9546 (1.9%) specimens from 4,550 patients (7.6%) were suggestive of spiking.
UDT specimens suggestive of spiking had two times the odds of being positive for other opioids (fentanyl or heroin), compared with opioid negative samples.
UDT specimens obtained from primary care clinics, from patients aged 35-44 years, and from patients living in the South Atlantic region of the United States were also more likely to be suggestive of buprenorphine spiking.
“Our study demonstrated that a buprenorphine to norbuprenorphine ratio of less than 0.02 indicates the possibility of spiking,” Dr. Pytell said in an interview.
“Nevertheless, it is important to note that this cutoff is not a definitive standard and further controlled studies are necessary to determine its predictive value for spiking. But recognizing possible spiking is very important since it demonstrates a point of elevated risk for the patient and the treatment approach should be reconsidered,” Dr. Pytell said.
“At Millennium Health, we have been tracking the enormity of the drug use crisis. This study suggests that spiking is an important patient safety issue, and it is not uncommon,” study coauthor Eric Dawson, PharmD, vice president of clinical affairs, Millennium Health, said in a statement.
“Detection of spiking requires definitive drug testing. Immunoassay-based, point-of-care tests cannot detect spiking because they are generally incapable of quantitative analysis and differentiating buprenorphine from norbuprenorphine,” Dr. Dawson said.
Best practices?
“We need to develop best practices specific for this situation where a patient has added buprenorphine to the urine drug test specimen,” said Dr. Pytell.
“As with all unexpected findings, it is crucial for clinicians to approach this finding in a nonjudgmental manner and work with the patient to understand what might have motivated them to alter their urine specimen,” he added.
Dr. Pytell said a common reaction for clinicians might be to discontinue treatment. However, this is actually a time to try and engage with the patient.
“Clinicians should work collaboratively with patients to identify potential reasons for spiking and determine what changes may need to be made to better support the patient’s recovery,” Dr. Pytell said.
“This could include more frequent monitoring or referral to a higher level of care. In addition, clinicians should be aware that patients who engage in spiking may be experiencing other challenges that impact their ability to adhere to treatment, such as inadequate housing, mental health issues, or financial strain. Addressing these underlying issues may help patients overcome barriers to treatment adherence and reduce the likelihood of future spiking,” Dr. Pytell said.
This study was supported by Millennium Health. The authors have no relevant disclosures.
A version of this article first appeared on Medscape.com.
FROM JAMA PSYCHIATRY
Substance abuse disorders may share a common genetic signature
suggest new findings that researchers say could eventually lead to universal therapies to treat multiple and comorbid addictions.
“Genetics play a key role in determining health throughout our lives, but they are not destiny. Our hope with genomic studies is to further illuminate factors that may protect or predispose a person to substance use disorders – knowledge that can be used to expand preventative services and empower individuals to make informed decisions about drug use,” Nora Volkow, MD, director of the National Institute on Drug Abuse, said in news release.
“A better understanding of genetics also brings us one step closer to developing personalized interventions that are tailored to an individual’s unique biology, environment, and lived experience in order to provide the most benefits,” Dr. Volkow added.
The research was published online in Nature Mental Health.
Global research
Led by a team at the Washington University in St. Louis, the study included more than 150 collaborating investigators from around the world.
The risk of developing SUDs is influenced by a complex interplay between genetics and environmental factors. In a genomewide association study, the investigators looked for variations in the genome that were closely associated with SUDs in more than 1 million people of European ancestry and 92,630 people of African ancestry.
Among the European ancestry sample, they discovered 19 single-nucleotide polymorphisms that were significantly associated with general addiction risk and 47 genetic variants linked to specific SUDs – 9 for alcohol, 32 for tobacco, 5 for cannabis, and 1 for opioids.
The strongest gene signals consistent across the various SUDs mapped to areas in the genome involved in dopamine-signaling regulation, which reinforces the role of the dopamine system in addiction.
The genomic pattern also predicted higher risk of mental and physical illness, including psychiatric disorders, suicidal behavior, respiratory disease, heart disease, and chronic pain conditions. In children aged 9 or 10 years, presumably without any SUD, these genes correlated with parental substance use and externalizing behavior.
“Substance use disorders and mental disorders often co-occur, and we know that the most effective treatments help people address both issues at the same time. The shared genetic mechanisms between substance use and mental disorders revealed in this study underscore the importance of thinking about these disorders in tandem,” Joshua A. Gordon, MD, PhD, director of the National Institute of Mental Health, said in a news release.
Repurpose existing drugs for SUDs?
Separately, the genomic analysis of individuals of African ancestry showed only one genetic variation associated with general addiction risk and one substance-specific variation for risk of alcohol use disorder. The smaller sample size may be one reason for the more limited findings in this population.
“There is a tremendous need for treatments that target addiction generally, given patterns of the use of multiple substances, lifetime substance use, and severity seen in the clinic,” lead researcher Alexander Hatoum, PhD, at Washington University in St. Louis, said in a news release.
“Our study opens the door to identifying medications that may be leveraged to treat addiction broadly, which may be especially useful for treating more severe forms, including addiction to multiple substances,” Dr. Hatoum added.
As part of the study, the researchers compiled a list of approved and investigational pharmaceutical drugs that could potentially be repurposed to treat SUDs.
The list includes more than 100 drugs to investigate in future clinical trials, including those that can influence regulation of dopamine signaling.
This research was supported by NIDA, the National Institute on Alcohol Abuse and Alcoholism, NIMH, the Eunice Kennedy Shriver National Institute of Child Health and Human Development, and the National Institute on Aging.
A version of this article first appeared on Medscape.com.
suggest new findings that researchers say could eventually lead to universal therapies to treat multiple and comorbid addictions.
“Genetics play a key role in determining health throughout our lives, but they are not destiny. Our hope with genomic studies is to further illuminate factors that may protect or predispose a person to substance use disorders – knowledge that can be used to expand preventative services and empower individuals to make informed decisions about drug use,” Nora Volkow, MD, director of the National Institute on Drug Abuse, said in news release.
“A better understanding of genetics also brings us one step closer to developing personalized interventions that are tailored to an individual’s unique biology, environment, and lived experience in order to provide the most benefits,” Dr. Volkow added.
The research was published online in Nature Mental Health.
Global research
Led by a team at the Washington University in St. Louis, the study included more than 150 collaborating investigators from around the world.
The risk of developing SUDs is influenced by a complex interplay between genetics and environmental factors. In a genomewide association study, the investigators looked for variations in the genome that were closely associated with SUDs in more than 1 million people of European ancestry and 92,630 people of African ancestry.
Among the European ancestry sample, they discovered 19 single-nucleotide polymorphisms that were significantly associated with general addiction risk and 47 genetic variants linked to specific SUDs – 9 for alcohol, 32 for tobacco, 5 for cannabis, and 1 for opioids.
The strongest gene signals consistent across the various SUDs mapped to areas in the genome involved in dopamine-signaling regulation, which reinforces the role of the dopamine system in addiction.
The genomic pattern also predicted higher risk of mental and physical illness, including psychiatric disorders, suicidal behavior, respiratory disease, heart disease, and chronic pain conditions. In children aged 9 or 10 years, presumably without any SUD, these genes correlated with parental substance use and externalizing behavior.
“Substance use disorders and mental disorders often co-occur, and we know that the most effective treatments help people address both issues at the same time. The shared genetic mechanisms between substance use and mental disorders revealed in this study underscore the importance of thinking about these disorders in tandem,” Joshua A. Gordon, MD, PhD, director of the National Institute of Mental Health, said in a news release.
Repurpose existing drugs for SUDs?
Separately, the genomic analysis of individuals of African ancestry showed only one genetic variation associated with general addiction risk and one substance-specific variation for risk of alcohol use disorder. The smaller sample size may be one reason for the more limited findings in this population.
“There is a tremendous need for treatments that target addiction generally, given patterns of the use of multiple substances, lifetime substance use, and severity seen in the clinic,” lead researcher Alexander Hatoum, PhD, at Washington University in St. Louis, said in a news release.
“Our study opens the door to identifying medications that may be leveraged to treat addiction broadly, which may be especially useful for treating more severe forms, including addiction to multiple substances,” Dr. Hatoum added.
As part of the study, the researchers compiled a list of approved and investigational pharmaceutical drugs that could potentially be repurposed to treat SUDs.
The list includes more than 100 drugs to investigate in future clinical trials, including those that can influence regulation of dopamine signaling.
This research was supported by NIDA, the National Institute on Alcohol Abuse and Alcoholism, NIMH, the Eunice Kennedy Shriver National Institute of Child Health and Human Development, and the National Institute on Aging.
A version of this article first appeared on Medscape.com.
suggest new findings that researchers say could eventually lead to universal therapies to treat multiple and comorbid addictions.
“Genetics play a key role in determining health throughout our lives, but they are not destiny. Our hope with genomic studies is to further illuminate factors that may protect or predispose a person to substance use disorders – knowledge that can be used to expand preventative services and empower individuals to make informed decisions about drug use,” Nora Volkow, MD, director of the National Institute on Drug Abuse, said in news release.
“A better understanding of genetics also brings us one step closer to developing personalized interventions that are tailored to an individual’s unique biology, environment, and lived experience in order to provide the most benefits,” Dr. Volkow added.
The research was published online in Nature Mental Health.
Global research
Led by a team at the Washington University in St. Louis, the study included more than 150 collaborating investigators from around the world.
The risk of developing SUDs is influenced by a complex interplay between genetics and environmental factors. In a genomewide association study, the investigators looked for variations in the genome that were closely associated with SUDs in more than 1 million people of European ancestry and 92,630 people of African ancestry.
Among the European ancestry sample, they discovered 19 single-nucleotide polymorphisms that were significantly associated with general addiction risk and 47 genetic variants linked to specific SUDs – 9 for alcohol, 32 for tobacco, 5 for cannabis, and 1 for opioids.
The strongest gene signals consistent across the various SUDs mapped to areas in the genome involved in dopamine-signaling regulation, which reinforces the role of the dopamine system in addiction.
The genomic pattern also predicted higher risk of mental and physical illness, including psychiatric disorders, suicidal behavior, respiratory disease, heart disease, and chronic pain conditions. In children aged 9 or 10 years, presumably without any SUD, these genes correlated with parental substance use and externalizing behavior.
“Substance use disorders and mental disorders often co-occur, and we know that the most effective treatments help people address both issues at the same time. The shared genetic mechanisms between substance use and mental disorders revealed in this study underscore the importance of thinking about these disorders in tandem,” Joshua A. Gordon, MD, PhD, director of the National Institute of Mental Health, said in a news release.
Repurpose existing drugs for SUDs?
Separately, the genomic analysis of individuals of African ancestry showed only one genetic variation associated with general addiction risk and one substance-specific variation for risk of alcohol use disorder. The smaller sample size may be one reason for the more limited findings in this population.
“There is a tremendous need for treatments that target addiction generally, given patterns of the use of multiple substances, lifetime substance use, and severity seen in the clinic,” lead researcher Alexander Hatoum, PhD, at Washington University in St. Louis, said in a news release.
“Our study opens the door to identifying medications that may be leveraged to treat addiction broadly, which may be especially useful for treating more severe forms, including addiction to multiple substances,” Dr. Hatoum added.
As part of the study, the researchers compiled a list of approved and investigational pharmaceutical drugs that could potentially be repurposed to treat SUDs.
The list includes more than 100 drugs to investigate in future clinical trials, including those that can influence regulation of dopamine signaling.
This research was supported by NIDA, the National Institute on Alcohol Abuse and Alcoholism, NIMH, the Eunice Kennedy Shriver National Institute of Child Health and Human Development, and the National Institute on Aging.
A version of this article first appeared on Medscape.com.
FROM NATURE MENTAL HEALTH
Restless legs a new modifiable risk factor for dementia?
suggesting the disorder may be a risk factor for dementia or a very early noncognitive sign of dementia, researchers say.
In a large population-based cohort study, adults with RLS were significantly more likely to develop dementia over more than a decade than were their peers without RLS.
If confirmed in future studies, “regular check-ups for cognitive decline in older patients with RLS may facilitate earlier detection and intervention for those with dementia risk,” wrote investigators led by Eosu Kim, MD, PhD, with Yonsei University, Seoul, Republic of Korea.
The study was published online in Alzheimer’s Research and Therapy.
Sleep disorders and dementia
RLS is associated with poor sleep, depression/anxiety, poor diet, microvasculopathy, and hypoxia – all of which are known risk factors for dementia. However, the relationship between RLS and incident dementia has been unclear.
The researchers compared risk for all-cause dementia, Alzheimer’s disease (AD), and vascular dementia (VaD) among 2,501 adults with newly diagnosed RLS and 9,977 matched control persons participating in the Korean National Health Insurance Service–Elderly Cohort, a nationwide population-based cohort of adults aged 60 and older.
The mean age of the cohort was 73 years; most of the participants were women (65%). Among all 12,478 participants, 874 (7%) developed all-cause dementia during follow-up – 475 (54%) developed AD, and 194 (22%) developed VaD.
The incidence of all-cause dementia was significantly higher among the RLS group than among the control group (10.4% vs. 6.2%). Incidence rates of AD and VaD (5.6% and 2.6%, respectively) were also higher in the RLS group than in the control group (3.4% and 1.3%, respectively).
In Cox regression analysis, RLS was significantly associated with an increased risk of all-cause dementia (adjusted hazard ratio [aHR], 1.46; 95% confidence interval [CI], 1.24-1.72), AD (aHR 1.38; 95% CI, 1.11-1.72) and VaD (aHR, 1.81; 95% CI, 1.30-2.53).
The researchers noted that RLS may precede deterioration of cognitive function, leading to dementia, and they suggest that RLS could be regarded as a “newly identified” risk factor or prodromal sign of dementia.
Modifiable risk factor
Reached for comment, Thanh Dang-Vu, MD, PhD, professor and research chair in sleep, neuroimaging, and cognitive health at Concordia University in Montreal, said there is now “increasing literature that shows sleep as a modifiable risk factor for cognitive decline.
“Previous evidence indicates that both sleep apnea and insomnia disorder increase the risk for cognitive decline and possibly dementia. Here the study adds to this body of evidence linking sleep disorders to dementia, suggesting that RLS should also be considered as a sleep-related risk factor,” Dr. Dang-Vu told this news organization.
“More evidence is needed, though, as here, all diagnoses were based on national health insurance diagnostic codes, and it is likely there were missed diagnoses for RLS but also for other sleep disorders, as there was no systematic screening for them,” Dr. Dang-Vu cautioned.
Support for the study was provided by the Ministry of Health and Welfare, the Korean government, and Yonsei University. Dr. Kim and Dr. Dang-Vu reported no relevant financial relationships.
A version of this article first appeared on Medscape.com.
suggesting the disorder may be a risk factor for dementia or a very early noncognitive sign of dementia, researchers say.
In a large population-based cohort study, adults with RLS were significantly more likely to develop dementia over more than a decade than were their peers without RLS.
If confirmed in future studies, “regular check-ups for cognitive decline in older patients with RLS may facilitate earlier detection and intervention for those with dementia risk,” wrote investigators led by Eosu Kim, MD, PhD, with Yonsei University, Seoul, Republic of Korea.
The study was published online in Alzheimer’s Research and Therapy.
Sleep disorders and dementia
RLS is associated with poor sleep, depression/anxiety, poor diet, microvasculopathy, and hypoxia – all of which are known risk factors for dementia. However, the relationship between RLS and incident dementia has been unclear.
The researchers compared risk for all-cause dementia, Alzheimer’s disease (AD), and vascular dementia (VaD) among 2,501 adults with newly diagnosed RLS and 9,977 matched control persons participating in the Korean National Health Insurance Service–Elderly Cohort, a nationwide population-based cohort of adults aged 60 and older.
The mean age of the cohort was 73 years; most of the participants were women (65%). Among all 12,478 participants, 874 (7%) developed all-cause dementia during follow-up – 475 (54%) developed AD, and 194 (22%) developed VaD.
The incidence of all-cause dementia was significantly higher among the RLS group than among the control group (10.4% vs. 6.2%). Incidence rates of AD and VaD (5.6% and 2.6%, respectively) were also higher in the RLS group than in the control group (3.4% and 1.3%, respectively).
In Cox regression analysis, RLS was significantly associated with an increased risk of all-cause dementia (adjusted hazard ratio [aHR], 1.46; 95% confidence interval [CI], 1.24-1.72), AD (aHR 1.38; 95% CI, 1.11-1.72) and VaD (aHR, 1.81; 95% CI, 1.30-2.53).
The researchers noted that RLS may precede deterioration of cognitive function, leading to dementia, and they suggest that RLS could be regarded as a “newly identified” risk factor or prodromal sign of dementia.
Modifiable risk factor
Reached for comment, Thanh Dang-Vu, MD, PhD, professor and research chair in sleep, neuroimaging, and cognitive health at Concordia University in Montreal, said there is now “increasing literature that shows sleep as a modifiable risk factor for cognitive decline.
“Previous evidence indicates that both sleep apnea and insomnia disorder increase the risk for cognitive decline and possibly dementia. Here the study adds to this body of evidence linking sleep disorders to dementia, suggesting that RLS should also be considered as a sleep-related risk factor,” Dr. Dang-Vu told this news organization.
“More evidence is needed, though, as here, all diagnoses were based on national health insurance diagnostic codes, and it is likely there were missed diagnoses for RLS but also for other sleep disorders, as there was no systematic screening for them,” Dr. Dang-Vu cautioned.
Support for the study was provided by the Ministry of Health and Welfare, the Korean government, and Yonsei University. Dr. Kim and Dr. Dang-Vu reported no relevant financial relationships.
A version of this article first appeared on Medscape.com.
suggesting the disorder may be a risk factor for dementia or a very early noncognitive sign of dementia, researchers say.
In a large population-based cohort study, adults with RLS were significantly more likely to develop dementia over more than a decade than were their peers without RLS.
If confirmed in future studies, “regular check-ups for cognitive decline in older patients with RLS may facilitate earlier detection and intervention for those with dementia risk,” wrote investigators led by Eosu Kim, MD, PhD, with Yonsei University, Seoul, Republic of Korea.
The study was published online in Alzheimer’s Research and Therapy.
Sleep disorders and dementia
RLS is associated with poor sleep, depression/anxiety, poor diet, microvasculopathy, and hypoxia – all of which are known risk factors for dementia. However, the relationship between RLS and incident dementia has been unclear.
The researchers compared risk for all-cause dementia, Alzheimer’s disease (AD), and vascular dementia (VaD) among 2,501 adults with newly diagnosed RLS and 9,977 matched control persons participating in the Korean National Health Insurance Service–Elderly Cohort, a nationwide population-based cohort of adults aged 60 and older.
The mean age of the cohort was 73 years; most of the participants were women (65%). Among all 12,478 participants, 874 (7%) developed all-cause dementia during follow-up – 475 (54%) developed AD, and 194 (22%) developed VaD.
The incidence of all-cause dementia was significantly higher among the RLS group than among the control group (10.4% vs. 6.2%). Incidence rates of AD and VaD (5.6% and 2.6%, respectively) were also higher in the RLS group than in the control group (3.4% and 1.3%, respectively).
In Cox regression analysis, RLS was significantly associated with an increased risk of all-cause dementia (adjusted hazard ratio [aHR], 1.46; 95% confidence interval [CI], 1.24-1.72), AD (aHR 1.38; 95% CI, 1.11-1.72) and VaD (aHR, 1.81; 95% CI, 1.30-2.53).
The researchers noted that RLS may precede deterioration of cognitive function, leading to dementia, and they suggest that RLS could be regarded as a “newly identified” risk factor or prodromal sign of dementia.
Modifiable risk factor
Reached for comment, Thanh Dang-Vu, MD, PhD, professor and research chair in sleep, neuroimaging, and cognitive health at Concordia University in Montreal, said there is now “increasing literature that shows sleep as a modifiable risk factor for cognitive decline.
“Previous evidence indicates that both sleep apnea and insomnia disorder increase the risk for cognitive decline and possibly dementia. Here the study adds to this body of evidence linking sleep disorders to dementia, suggesting that RLS should also be considered as a sleep-related risk factor,” Dr. Dang-Vu told this news organization.
“More evidence is needed, though, as here, all diagnoses were based on national health insurance diagnostic codes, and it is likely there were missed diagnoses for RLS but also for other sleep disorders, as there was no systematic screening for them,” Dr. Dang-Vu cautioned.
Support for the study was provided by the Ministry of Health and Welfare, the Korean government, and Yonsei University. Dr. Kim and Dr. Dang-Vu reported no relevant financial relationships.
A version of this article first appeared on Medscape.com.
FROM ALZHEIMER’S RESEARCH AND THERAPY
Depression tied to inflammation and survival in lung cancer
suggests a new study.
The findings underscore the importance of assessing and treating depression in patients with cancer, particularly given the high rate of depression among those with lung cancer versus other types of cancer, the investigators said.
The study involved 186 patients with newly diagnosed stage IV non–small cell lung cancer (NSCLC), of whom 35% had self-reported moderate to severe depressive symptoms.
Depression was reliably associated with lung-relevant systemic inflammation responses (SIRs), which included neutrophil-to-lymphocyte ratio (NLR), platelet-to-lymphocyte ratio (PLR), and Advanced Lung Cancer Inflammation Index (ALI) score.
These SIRs were prognostic for 2-year OS.
Overall mortality at 2 years was 61%. Higher NLRs and PLRs and lower ALI scores all predicted worse OS (hazard ratio, 1.91, 2.08, and 0.53, respectively).
The findings were published online in PLoS ONE (2023 Feb 24.
“These patients with high levels of depression are at much higher risk for poor outcomes,” but the key finding was that patients with the highest depression levels were driving the relationship, lead author Barbara Andersen, PhD, professor of psychology at Ohio State University, Columbus, stated in a press release.
“It was patients with high depression levels who had strikingly higher inflammation levels, and that is what really drove the correlation we saw,” she explained.
For example, 56% of patients with no depression symptoms or only mild depression symptoms had a PLR above the cutoff for dangerous levels of inflammation, compared with 42% whose PLR was below the cutoff. However, among those with high depression levels, 77% and 23% had a PLR above and below the cutoff, respectively.
“These highly depressed patients were 1.3-3 times more likely to have high inflammation levels, even after controlling for other factors related to inflammation biomarker levels, including demographics and smoking status,” Dr. Andersen noted.
“Depression levels may be as important or even more important than other factors that have been associated with how people fare with lung cancer,” she suggested.
In a previous study, the team controlled for baseline depression and found that “the trajectory of depression from diagnosis through 2 years (18 assessments) predicted NSCLC patients’ survival (HR, 1.09), above and beyond baseline depression, sociodemographics, smoking status, cell type, and receipt of targeted treatments and immunotherapies.”
“Taken together, data support psychological, behavioral, and biologic toxicities of depression capable of influencing treatment response and/or survival,” they wrote.
“The results may help explain why a substantial portion of lung cancer patients fail to respond to new immunotherapy and targeted treatments that have led to significantly longer survival for many people with the disease,” Dr. Andersen said.
The investigators concluded that “intensive study of depression among patients with NSCLC, combined with measures of cell biology, inflammation, and immunity, is needed to extend these findings and discover their mechanisms, with the long-term aim to improve patients’ quality of life, treatment responses, and longevity.”
This study was funded by the Ohio State University Comprehensive Cancer Center and Pelotonia through grants to individual authors. Dr. Andersen reported having no relevant disclosures.
A version of this article first appeared on Medscape.com.
suggests a new study.
The findings underscore the importance of assessing and treating depression in patients with cancer, particularly given the high rate of depression among those with lung cancer versus other types of cancer, the investigators said.
The study involved 186 patients with newly diagnosed stage IV non–small cell lung cancer (NSCLC), of whom 35% had self-reported moderate to severe depressive symptoms.
Depression was reliably associated with lung-relevant systemic inflammation responses (SIRs), which included neutrophil-to-lymphocyte ratio (NLR), platelet-to-lymphocyte ratio (PLR), and Advanced Lung Cancer Inflammation Index (ALI) score.
These SIRs were prognostic for 2-year OS.
Overall mortality at 2 years was 61%. Higher NLRs and PLRs and lower ALI scores all predicted worse OS (hazard ratio, 1.91, 2.08, and 0.53, respectively).
The findings were published online in PLoS ONE (2023 Feb 24.
“These patients with high levels of depression are at much higher risk for poor outcomes,” but the key finding was that patients with the highest depression levels were driving the relationship, lead author Barbara Andersen, PhD, professor of psychology at Ohio State University, Columbus, stated in a press release.
“It was patients with high depression levels who had strikingly higher inflammation levels, and that is what really drove the correlation we saw,” she explained.
For example, 56% of patients with no depression symptoms or only mild depression symptoms had a PLR above the cutoff for dangerous levels of inflammation, compared with 42% whose PLR was below the cutoff. However, among those with high depression levels, 77% and 23% had a PLR above and below the cutoff, respectively.
“These highly depressed patients were 1.3-3 times more likely to have high inflammation levels, even after controlling for other factors related to inflammation biomarker levels, including demographics and smoking status,” Dr. Andersen noted.
“Depression levels may be as important or even more important than other factors that have been associated with how people fare with lung cancer,” she suggested.
In a previous study, the team controlled for baseline depression and found that “the trajectory of depression from diagnosis through 2 years (18 assessments) predicted NSCLC patients’ survival (HR, 1.09), above and beyond baseline depression, sociodemographics, smoking status, cell type, and receipt of targeted treatments and immunotherapies.”
“Taken together, data support psychological, behavioral, and biologic toxicities of depression capable of influencing treatment response and/or survival,” they wrote.
“The results may help explain why a substantial portion of lung cancer patients fail to respond to new immunotherapy and targeted treatments that have led to significantly longer survival for many people with the disease,” Dr. Andersen said.
The investigators concluded that “intensive study of depression among patients with NSCLC, combined with measures of cell biology, inflammation, and immunity, is needed to extend these findings and discover their mechanisms, with the long-term aim to improve patients’ quality of life, treatment responses, and longevity.”
This study was funded by the Ohio State University Comprehensive Cancer Center and Pelotonia through grants to individual authors. Dr. Andersen reported having no relevant disclosures.
A version of this article first appeared on Medscape.com.
suggests a new study.
The findings underscore the importance of assessing and treating depression in patients with cancer, particularly given the high rate of depression among those with lung cancer versus other types of cancer, the investigators said.
The study involved 186 patients with newly diagnosed stage IV non–small cell lung cancer (NSCLC), of whom 35% had self-reported moderate to severe depressive symptoms.
Depression was reliably associated with lung-relevant systemic inflammation responses (SIRs), which included neutrophil-to-lymphocyte ratio (NLR), platelet-to-lymphocyte ratio (PLR), and Advanced Lung Cancer Inflammation Index (ALI) score.
These SIRs were prognostic for 2-year OS.
Overall mortality at 2 years was 61%. Higher NLRs and PLRs and lower ALI scores all predicted worse OS (hazard ratio, 1.91, 2.08, and 0.53, respectively).
The findings were published online in PLoS ONE (2023 Feb 24.
“These patients with high levels of depression are at much higher risk for poor outcomes,” but the key finding was that patients with the highest depression levels were driving the relationship, lead author Barbara Andersen, PhD, professor of psychology at Ohio State University, Columbus, stated in a press release.
“It was patients with high depression levels who had strikingly higher inflammation levels, and that is what really drove the correlation we saw,” she explained.
For example, 56% of patients with no depression symptoms or only mild depression symptoms had a PLR above the cutoff for dangerous levels of inflammation, compared with 42% whose PLR was below the cutoff. However, among those with high depression levels, 77% and 23% had a PLR above and below the cutoff, respectively.
“These highly depressed patients were 1.3-3 times more likely to have high inflammation levels, even after controlling for other factors related to inflammation biomarker levels, including demographics and smoking status,” Dr. Andersen noted.
“Depression levels may be as important or even more important than other factors that have been associated with how people fare with lung cancer,” she suggested.
In a previous study, the team controlled for baseline depression and found that “the trajectory of depression from diagnosis through 2 years (18 assessments) predicted NSCLC patients’ survival (HR, 1.09), above and beyond baseline depression, sociodemographics, smoking status, cell type, and receipt of targeted treatments and immunotherapies.”
“Taken together, data support psychological, behavioral, and biologic toxicities of depression capable of influencing treatment response and/or survival,” they wrote.
“The results may help explain why a substantial portion of lung cancer patients fail to respond to new immunotherapy and targeted treatments that have led to significantly longer survival for many people with the disease,” Dr. Andersen said.
The investigators concluded that “intensive study of depression among patients with NSCLC, combined with measures of cell biology, inflammation, and immunity, is needed to extend these findings and discover their mechanisms, with the long-term aim to improve patients’ quality of life, treatment responses, and longevity.”
This study was funded by the Ohio State University Comprehensive Cancer Center and Pelotonia through grants to individual authors. Dr. Andersen reported having no relevant disclosures.
A version of this article first appeared on Medscape.com.
FROM PLOS ONE
Bruce Willis’ frontotemporal dementia is not your grandpa’s dementia
What is remarkable about the swamp that we call FTD is that it’s a somewhat rare and unusual type of dementia. We tend to characterize dementia as the erosion of memory, but FTD is more characterized by the loss of control over emotions and other cognitive functions. What›s especially tragic for performers like Mr. Willis is the loss of the verbal fluency required for delivering one’s lines.
Frontotemporal dementia
To this casual observer, Bruce Willis was an almost invincible force, vigorous, vital, one of the “immortals.” Alas, with his FTD diagnosis, we know that even a die-hard like Mr. Willis, now only 67 years of age, may have to endure years of progressive decline. If the disease follows its typical path, that will probably include slowly disconnecting and progressively losing emotional judgment and control as well as losing a reasonable understanding of what or why any of it is happening. He may also experience a progressive deterioration of the control of bodily functions and general health.
Most people with dementia lose their neurocognitive abilities through a number of different pathways, all of which result in brain shrinkage, disconnection, evident neuropathology, neurobehavioral expressions of loss, and forms of befuddlement. Alzheimer’s disease leads the list as the most common form of dementia, but vascular dementias; dementia with Lewy bodies; “mixed” dementias; dementias associated with Parkinson’s, Huntington’s, or other diseases; dementia rising from alcoholic or other brain poisoning, HIV, Lyme disease, or a host of other brain infections; or from traumatic encephalopathy (chronic or more current) may present at any active neurology clinic. These are what you might think of as your “grandpa’s dementia” – the common types often associated with old age.
FTD is a particularly interesting variant for several reasons. First, it usually arises in relatively young individuals, with initial symptoms emerging in one’s 50s or 60s. In most cases, there is no genetic and, with rare exception, any other explanation of origin – except that old medical standby, bad luck.
Second, FTD has little initial impact on a patient’s broader memory and associated cognitive abilities. The patient will stumble to come up with that next word and ultimately slow down their speech as their brain struggles with verbal fluency; they will struggle with translating their feelings and emotions into fast and appropriate actions expressed in their mind and their physical body while their memory will appear intact.
In all other dementias, cognitive losses can be profound, whereas social and emotional control and voluble speech production are generally better sustained. Imagine the impact that these struggles in verbal fluency and in emotional calibration and response must have for an established actor. By all reports, Mr. Willis vigorously pursued the work that he loved right up until the time of his dementia diagnosis, even as his colleagues would almost certainly have seen that he was struggling. Sadly, a lack of that type of self-awareness is an expected consequence of FTD.
The salience network and von Economo neurons
Third and most intriguing to a neuroscientific nerd like me is that patients with FTD experience an initial loss of a special population of cortical neurons located within the salience network in our brains, called the von Economo neurons. That salience network is designed to quickly read and evaluate our complex thoughts and emotions and via those Economo neurons, initiate appropriate neurologic and physical responses.
We share this special von Economo machinery with great apes, whales, elephants, and a handful of other especially social mammalian species.
When we see or hear or otherwise sense something that induces fear, alarm, or a potential reward, the salience network in our brain acts as a kind of gatekeeper. First, it assesses the emergent or changing situation, then it rapidly initiates an emotional and physical response. As I sit with a patient in obvious distress in my office, my salience network turns on an empathetic alarm. My brain and body immediately adjust to initiate appropriately sympathetic reactions. The von Economo neurons – those very neurons that have substantially died off in a brain with FTD – are the linchpins in this fast-response emotion and complex body signal-informed system.
Controlled emotional response is at the heart of our humanity. It’s a sad day when we lose it.
In other neurologic clinical conditions marked by the loss of specific brain cells, different forms of “disuse atrophy” are partly the cause. We don’t know whether that’s the case for FTD. Scientists have shown that specific forms of computerized brain exercises can sharply increase activity levels in the salience network which is linked to improvements in the regulatory control of the autonomic nervous system – one of the key response-mediating targets of the network’s von Economo neurons.
Interestingly, superagers who sustain body and brain health into their 90s (and beyond) die with a full complement of von Economo neurons operating happily in a still-vigorous salience network.
This neuroscientist can foresee a day when we routinely assess the integrity of this important brain system and more reliably maintain its good health. Keeping those very special neurons alive would have probably allowed Mr. Willis to sustain himself on the soundstage and on the grander stage of life for a long time to come. Alas, like so many things in medicine, there is promise. But at this moment for this famous patient, our current medical science appears to be a day late, and a dollar short.
Dr. Merzenichis is professor emeritus at the University of California, San Francisco, and a Kavli Laureate in Neuroscience. He reported conflicts of interest with the National Institutes of Health, Stronger Brains, and Posit Science.
A version of this article first appeared on Medscape.com.
What is remarkable about the swamp that we call FTD is that it’s a somewhat rare and unusual type of dementia. We tend to characterize dementia as the erosion of memory, but FTD is more characterized by the loss of control over emotions and other cognitive functions. What›s especially tragic for performers like Mr. Willis is the loss of the verbal fluency required for delivering one’s lines.
Frontotemporal dementia
To this casual observer, Bruce Willis was an almost invincible force, vigorous, vital, one of the “immortals.” Alas, with his FTD diagnosis, we know that even a die-hard like Mr. Willis, now only 67 years of age, may have to endure years of progressive decline. If the disease follows its typical path, that will probably include slowly disconnecting and progressively losing emotional judgment and control as well as losing a reasonable understanding of what or why any of it is happening. He may also experience a progressive deterioration of the control of bodily functions and general health.
Most people with dementia lose their neurocognitive abilities through a number of different pathways, all of which result in brain shrinkage, disconnection, evident neuropathology, neurobehavioral expressions of loss, and forms of befuddlement. Alzheimer’s disease leads the list as the most common form of dementia, but vascular dementias; dementia with Lewy bodies; “mixed” dementias; dementias associated with Parkinson’s, Huntington’s, or other diseases; dementia rising from alcoholic or other brain poisoning, HIV, Lyme disease, or a host of other brain infections; or from traumatic encephalopathy (chronic or more current) may present at any active neurology clinic. These are what you might think of as your “grandpa’s dementia” – the common types often associated with old age.
FTD is a particularly interesting variant for several reasons. First, it usually arises in relatively young individuals, with initial symptoms emerging in one’s 50s or 60s. In most cases, there is no genetic and, with rare exception, any other explanation of origin – except that old medical standby, bad luck.
Second, FTD has little initial impact on a patient’s broader memory and associated cognitive abilities. The patient will stumble to come up with that next word and ultimately slow down their speech as their brain struggles with verbal fluency; they will struggle with translating their feelings and emotions into fast and appropriate actions expressed in their mind and their physical body while their memory will appear intact.
In all other dementias, cognitive losses can be profound, whereas social and emotional control and voluble speech production are generally better sustained. Imagine the impact that these struggles in verbal fluency and in emotional calibration and response must have for an established actor. By all reports, Mr. Willis vigorously pursued the work that he loved right up until the time of his dementia diagnosis, even as his colleagues would almost certainly have seen that he was struggling. Sadly, a lack of that type of self-awareness is an expected consequence of FTD.
The salience network and von Economo neurons
Third and most intriguing to a neuroscientific nerd like me is that patients with FTD experience an initial loss of a special population of cortical neurons located within the salience network in our brains, called the von Economo neurons. That salience network is designed to quickly read and evaluate our complex thoughts and emotions and via those Economo neurons, initiate appropriate neurologic and physical responses.
We share this special von Economo machinery with great apes, whales, elephants, and a handful of other especially social mammalian species.
When we see or hear or otherwise sense something that induces fear, alarm, or a potential reward, the salience network in our brain acts as a kind of gatekeeper. First, it assesses the emergent or changing situation, then it rapidly initiates an emotional and physical response. As I sit with a patient in obvious distress in my office, my salience network turns on an empathetic alarm. My brain and body immediately adjust to initiate appropriately sympathetic reactions. The von Economo neurons – those very neurons that have substantially died off in a brain with FTD – are the linchpins in this fast-response emotion and complex body signal-informed system.
Controlled emotional response is at the heart of our humanity. It’s a sad day when we lose it.
In other neurologic clinical conditions marked by the loss of specific brain cells, different forms of “disuse atrophy” are partly the cause. We don’t know whether that’s the case for FTD. Scientists have shown that specific forms of computerized brain exercises can sharply increase activity levels in the salience network which is linked to improvements in the regulatory control of the autonomic nervous system – one of the key response-mediating targets of the network’s von Economo neurons.
Interestingly, superagers who sustain body and brain health into their 90s (and beyond) die with a full complement of von Economo neurons operating happily in a still-vigorous salience network.
This neuroscientist can foresee a day when we routinely assess the integrity of this important brain system and more reliably maintain its good health. Keeping those very special neurons alive would have probably allowed Mr. Willis to sustain himself on the soundstage and on the grander stage of life for a long time to come. Alas, like so many things in medicine, there is promise. But at this moment for this famous patient, our current medical science appears to be a day late, and a dollar short.
Dr. Merzenichis is professor emeritus at the University of California, San Francisco, and a Kavli Laureate in Neuroscience. He reported conflicts of interest with the National Institutes of Health, Stronger Brains, and Posit Science.
A version of this article first appeared on Medscape.com.
What is remarkable about the swamp that we call FTD is that it’s a somewhat rare and unusual type of dementia. We tend to characterize dementia as the erosion of memory, but FTD is more characterized by the loss of control over emotions and other cognitive functions. What›s especially tragic for performers like Mr. Willis is the loss of the verbal fluency required for delivering one’s lines.
Frontotemporal dementia
To this casual observer, Bruce Willis was an almost invincible force, vigorous, vital, one of the “immortals.” Alas, with his FTD diagnosis, we know that even a die-hard like Mr. Willis, now only 67 years of age, may have to endure years of progressive decline. If the disease follows its typical path, that will probably include slowly disconnecting and progressively losing emotional judgment and control as well as losing a reasonable understanding of what or why any of it is happening. He may also experience a progressive deterioration of the control of bodily functions and general health.
Most people with dementia lose their neurocognitive abilities through a number of different pathways, all of which result in brain shrinkage, disconnection, evident neuropathology, neurobehavioral expressions of loss, and forms of befuddlement. Alzheimer’s disease leads the list as the most common form of dementia, but vascular dementias; dementia with Lewy bodies; “mixed” dementias; dementias associated with Parkinson’s, Huntington’s, or other diseases; dementia rising from alcoholic or other brain poisoning, HIV, Lyme disease, or a host of other brain infections; or from traumatic encephalopathy (chronic or more current) may present at any active neurology clinic. These are what you might think of as your “grandpa’s dementia” – the common types often associated with old age.
FTD is a particularly interesting variant for several reasons. First, it usually arises in relatively young individuals, with initial symptoms emerging in one’s 50s or 60s. In most cases, there is no genetic and, with rare exception, any other explanation of origin – except that old medical standby, bad luck.
Second, FTD has little initial impact on a patient’s broader memory and associated cognitive abilities. The patient will stumble to come up with that next word and ultimately slow down their speech as their brain struggles with verbal fluency; they will struggle with translating their feelings and emotions into fast and appropriate actions expressed in their mind and their physical body while their memory will appear intact.
In all other dementias, cognitive losses can be profound, whereas social and emotional control and voluble speech production are generally better sustained. Imagine the impact that these struggles in verbal fluency and in emotional calibration and response must have for an established actor. By all reports, Mr. Willis vigorously pursued the work that he loved right up until the time of his dementia diagnosis, even as his colleagues would almost certainly have seen that he was struggling. Sadly, a lack of that type of self-awareness is an expected consequence of FTD.
The salience network and von Economo neurons
Third and most intriguing to a neuroscientific nerd like me is that patients with FTD experience an initial loss of a special population of cortical neurons located within the salience network in our brains, called the von Economo neurons. That salience network is designed to quickly read and evaluate our complex thoughts and emotions and via those Economo neurons, initiate appropriate neurologic and physical responses.
We share this special von Economo machinery with great apes, whales, elephants, and a handful of other especially social mammalian species.
When we see or hear or otherwise sense something that induces fear, alarm, or a potential reward, the salience network in our brain acts as a kind of gatekeeper. First, it assesses the emergent or changing situation, then it rapidly initiates an emotional and physical response. As I sit with a patient in obvious distress in my office, my salience network turns on an empathetic alarm. My brain and body immediately adjust to initiate appropriately sympathetic reactions. The von Economo neurons – those very neurons that have substantially died off in a brain with FTD – are the linchpins in this fast-response emotion and complex body signal-informed system.
Controlled emotional response is at the heart of our humanity. It’s a sad day when we lose it.
In other neurologic clinical conditions marked by the loss of specific brain cells, different forms of “disuse atrophy” are partly the cause. We don’t know whether that’s the case for FTD. Scientists have shown that specific forms of computerized brain exercises can sharply increase activity levels in the salience network which is linked to improvements in the regulatory control of the autonomic nervous system – one of the key response-mediating targets of the network’s von Economo neurons.
Interestingly, superagers who sustain body and brain health into their 90s (and beyond) die with a full complement of von Economo neurons operating happily in a still-vigorous salience network.
This neuroscientist can foresee a day when we routinely assess the integrity of this important brain system and more reliably maintain its good health. Keeping those very special neurons alive would have probably allowed Mr. Willis to sustain himself on the soundstage and on the grander stage of life for a long time to come. Alas, like so many things in medicine, there is promise. But at this moment for this famous patient, our current medical science appears to be a day late, and a dollar short.
Dr. Merzenichis is professor emeritus at the University of California, San Francisco, and a Kavli Laureate in Neuroscience. He reported conflicts of interest with the National Institutes of Health, Stronger Brains, and Posit Science.
A version of this article first appeared on Medscape.com.
‘Harm avoidance’ temperament predicts depression in adults
Temperament has been defined as “an individual’s propensity to react emotionally, learn behavior and to form attachments without conscious effort by associative conditioning,” wrote Aleksi Ahola, PhD, of the University of Oulu, Finland, and colleagues. “Temperament is a potential endophenotype for depression, as it is inheritable and genetically linked with depression,” they said. The Temperament and Character Inventory (TCI) includes four temperament traits: harm avoidance (HA), novelty seeking (NS), reward dependence (RD), and persistence (P); previous studies have shown associations between higher HA and depression, but long-term data are limited, they wrote.
In a population-based study published in Comprehensive Psychiatry, the researchers followed 3,999 adults from age 31 to 54 years. The participants were part of the Northern Finland Birth Cohort 1966 Study.
The primary outcome was the onset of depression in a previously mentally healthy adult population. Temperament was assessed using the TCI, and depression was based on the Hopkins system checklist-25 (SCL-25). Individuals with previous psychiatric disorders related to depression, bipolar disorder, or psychosis were excluded. Effect size was measured using the Cohen’s d test.
Overall, 240 individuals were diagnosed with depression over the follow-up period. Women later diagnosed with depression had higher baseline TCI scores for HA, compared with those without depression. After controlling for multiple variables, higher TCI scores for HA, NS, and P were significantly associated with increased risk of any depression.
Among men, the TCI HA score was associated with significantly increased risk of any depression after adjustments, but no association appeared for other TCI scores. However, higher RD was associated with a reduced risk of psychotic depression in men (odds ratio, 0.79), although the study was not designed to assess psychotic depression, the researchers noted.
In an additional analysis of temperament cluster groups, shy and pessimistic traits were associated with depression in men (OR, 1.89), but not in women. In women, the cluster group with no specific extreme personality traits (cluster III) appeared to show an association with depression, which may be related to the association of NS and P with depression, the researchers wrote in their discussion.
The study is the first known to show differences between genders in the prediction of depression based on temperament traits, notably the link between high persistence and the onset of any depression in women, they said.
The study findings were limited by several factors including the potential for missed cases of less severe depression not reported in a national register, and by the relatively small number of men in the study, the researchers noted. In addition, the TCI’s three character traits of self-directedness, cooperativeness, and self-transcendence were not part of the current study, they said.
However, the results were strengthened by the large sample size, premorbid temperament assessment, and long follow-up period, although more research is needed in larger populations using real-world personalities to confirm the findings, they said.
“Research regarding temperament is important as it may have clinical significance as predictor of psychiatric morbidity and even suicide risk,” they said.
“Understanding those potentially at risk of depression could help in preventing the onset of the disease, and creating cluster profiles to match real-world personas could offer a clinical tool for this kind of prevention,” they concluded.
The study was supported by the University of Oulu, Oulu University Hospital, the Ministry of Health and Social Affairs, the National Institute for Health and Welfare, and the Regional Institute of Occupational Health. The researchers had no financial conflicts to disclose.
Temperament has been defined as “an individual’s propensity to react emotionally, learn behavior and to form attachments without conscious effort by associative conditioning,” wrote Aleksi Ahola, PhD, of the University of Oulu, Finland, and colleagues. “Temperament is a potential endophenotype for depression, as it is inheritable and genetically linked with depression,” they said. The Temperament and Character Inventory (TCI) includes four temperament traits: harm avoidance (HA), novelty seeking (NS), reward dependence (RD), and persistence (P); previous studies have shown associations between higher HA and depression, but long-term data are limited, they wrote.
In a population-based study published in Comprehensive Psychiatry, the researchers followed 3,999 adults from age 31 to 54 years. The participants were part of the Northern Finland Birth Cohort 1966 Study.
The primary outcome was the onset of depression in a previously mentally healthy adult population. Temperament was assessed using the TCI, and depression was based on the Hopkins system checklist-25 (SCL-25). Individuals with previous psychiatric disorders related to depression, bipolar disorder, or psychosis were excluded. Effect size was measured using the Cohen’s d test.
Overall, 240 individuals were diagnosed with depression over the follow-up period. Women later diagnosed with depression had higher baseline TCI scores for HA, compared with those without depression. After controlling for multiple variables, higher TCI scores for HA, NS, and P were significantly associated with increased risk of any depression.
Among men, the TCI HA score was associated with significantly increased risk of any depression after adjustments, but no association appeared for other TCI scores. However, higher RD was associated with a reduced risk of psychotic depression in men (odds ratio, 0.79), although the study was not designed to assess psychotic depression, the researchers noted.
In an additional analysis of temperament cluster groups, shy and pessimistic traits were associated with depression in men (OR, 1.89), but not in women. In women, the cluster group with no specific extreme personality traits (cluster III) appeared to show an association with depression, which may be related to the association of NS and P with depression, the researchers wrote in their discussion.
The study is the first known to show differences between genders in the prediction of depression based on temperament traits, notably the link between high persistence and the onset of any depression in women, they said.
The study findings were limited by several factors including the potential for missed cases of less severe depression not reported in a national register, and by the relatively small number of men in the study, the researchers noted. In addition, the TCI’s three character traits of self-directedness, cooperativeness, and self-transcendence were not part of the current study, they said.
However, the results were strengthened by the large sample size, premorbid temperament assessment, and long follow-up period, although more research is needed in larger populations using real-world personalities to confirm the findings, they said.
“Research regarding temperament is important as it may have clinical significance as predictor of psychiatric morbidity and even suicide risk,” they said.
“Understanding those potentially at risk of depression could help in preventing the onset of the disease, and creating cluster profiles to match real-world personas could offer a clinical tool for this kind of prevention,” they concluded.
The study was supported by the University of Oulu, Oulu University Hospital, the Ministry of Health and Social Affairs, the National Institute for Health and Welfare, and the Regional Institute of Occupational Health. The researchers had no financial conflicts to disclose.
Temperament has been defined as “an individual’s propensity to react emotionally, learn behavior and to form attachments without conscious effort by associative conditioning,” wrote Aleksi Ahola, PhD, of the University of Oulu, Finland, and colleagues. “Temperament is a potential endophenotype for depression, as it is inheritable and genetically linked with depression,” they said. The Temperament and Character Inventory (TCI) includes four temperament traits: harm avoidance (HA), novelty seeking (NS), reward dependence (RD), and persistence (P); previous studies have shown associations between higher HA and depression, but long-term data are limited, they wrote.
In a population-based study published in Comprehensive Psychiatry, the researchers followed 3,999 adults from age 31 to 54 years. The participants were part of the Northern Finland Birth Cohort 1966 Study.
The primary outcome was the onset of depression in a previously mentally healthy adult population. Temperament was assessed using the TCI, and depression was based on the Hopkins system checklist-25 (SCL-25). Individuals with previous psychiatric disorders related to depression, bipolar disorder, or psychosis were excluded. Effect size was measured using the Cohen’s d test.
Overall, 240 individuals were diagnosed with depression over the follow-up period. Women later diagnosed with depression had higher baseline TCI scores for HA, compared with those without depression. After controlling for multiple variables, higher TCI scores for HA, NS, and P were significantly associated with increased risk of any depression.
Among men, the TCI HA score was associated with significantly increased risk of any depression after adjustments, but no association appeared for other TCI scores. However, higher RD was associated with a reduced risk of psychotic depression in men (odds ratio, 0.79), although the study was not designed to assess psychotic depression, the researchers noted.
In an additional analysis of temperament cluster groups, shy and pessimistic traits were associated with depression in men (OR, 1.89), but not in women. In women, the cluster group with no specific extreme personality traits (cluster III) appeared to show an association with depression, which may be related to the association of NS and P with depression, the researchers wrote in their discussion.
The study is the first known to show differences between genders in the prediction of depression based on temperament traits, notably the link between high persistence and the onset of any depression in women, they said.
The study findings were limited by several factors including the potential for missed cases of less severe depression not reported in a national register, and by the relatively small number of men in the study, the researchers noted. In addition, the TCI’s three character traits of self-directedness, cooperativeness, and self-transcendence were not part of the current study, they said.
However, the results were strengthened by the large sample size, premorbid temperament assessment, and long follow-up period, although more research is needed in larger populations using real-world personalities to confirm the findings, they said.
“Research regarding temperament is important as it may have clinical significance as predictor of psychiatric morbidity and even suicide risk,” they said.
“Understanding those potentially at risk of depression could help in preventing the onset of the disease, and creating cluster profiles to match real-world personas could offer a clinical tool for this kind of prevention,” they concluded.
The study was supported by the University of Oulu, Oulu University Hospital, the Ministry of Health and Social Affairs, the National Institute for Health and Welfare, and the Regional Institute of Occupational Health. The researchers had no financial conflicts to disclose.
FROM COMPREHENSIVE PSYCHIATRY
Screen time and teenagers: Principles for parents
The Centers for Disease Control and Prevention recently released results of the most recent Youth Risk Behavior Survey, their once-a-decade survey of youth mental health and risk-taking behaviors. The headlines aren’t good: Self-reported rates of anxiety, depression, suicidal thoughts, and suicide attempts in adolescents have increased substantially from 2011 to 2021. This echoes epidemiologic data showing increasing rates of anxiety and depression over the last decade in 12- to 24-year-olds, but not in older age cohorts.

This trend started well before COVID, coinciding with the explosive growth in use of smartphones, apps, and social media platforms. Facebook launched in 2004, the iPhone in 2007, Instagram in 2010, and TikTok in 2016. A 2018 Pew Research survey of 13- to 17-year-olds found that 97% of them used at least one social media platform and 45% described themselves as online “almost constantly.” Social media does have great potential benefits for adolescents.
We all experienced how it supported relationships during COVID. It can provide supportive networks for teenagers isolated by exclusion, illness, or disability. It can support exploration of esoteric interests, expression of identity, entertainment, and relaxation. But certain children, as was true before social media, seem vulnerable to the bullying, loneliness, isolation, and disengagement that social media may exacerbate.

Several studies have shown an association between high daily screen time and adolescent anxiety and depression. These findings have not been consistently duplicated, and those that were could not establish causality. There appears to be a strong link between certain illnesses (ADHD, depression, anorexia nervosa) and excessive screen use, which can in turn worsen symptoms. But it is hard to know which came first or how they are related.
Now, a very large long-term observational study has suggested that there may be critical windows in adolescence (11-13 years in girls and 14-16 in boys and again at 19 years for both) during which time excessive screen time can put that child’s developing mental health at risk. This is nuanced and interesting progress, but you don’t have to wait another decade to offer the families in your practice some common sense guidance when they are asking how to balance their children’s needs to be independent and socially connected (and the fact that smartphones and social media are pervasive) with the risks of overuse. Equipped with these guiding principles, parents can set individualized, flexible ground rules, and adjust them as their children grow into young adults.
First: Know your child
Parents are, of course, the experts on their own child – their talents, interests, challenges, vulnerabilities, and developmental progress. Children with poor impulse control (including those with ADHD) are going to have greater difficulty turning away from highly addictive activities on their devices. Children who are anxious and shy may be prone to avoiding the stress of real-life situations, preferring virtual ones. Children with a history of depression may be vulnerable to relapse if their sleep and exercise routines are disrupted by excessive use. And children with eating disorders are especially vulnerable to the superficial social comparisons and “likes” that Instagram offers. Children with these vulnerabilities will benefit if their parents are aware of and can talk about these vulnerabilities, ideally with their child. They should be prepared to work with their teens to develop strategies that can help them learn how to manage their social media usage. These might include stopping screen use after a certain hour, leaving devices outside of bedrooms at night, and setting up apps that monitor and alert them about excessive use. They might use resources such as the AAP’s Family Media Plan (Media and Children [aap.org]), but simply taking the time to have regular, open, honest conversations about what is known and unknown about the potential risks of social media use is very protective.
Second: Use adolescent development as your guide
For those children who do not have a known vulnerability to overuse, consider the following areas that are essential to healthy development in adolescence as guideposts to help parents in setting reasonable ground rules: building independence, cultivating healthy social relationships, learning about their identity, managing their strong emotions, and developing the skills of self-care. If screen time supports these developmental areas, then it’s probably healthy. If it interferes with them, then not. And remember, parents should routinely discuss these principles with their children as well.
Independence
Key questions. Does their use of a device enable them to function more independently – that is, to arrange for rides, manage their schedules, homework, shifts, and so forth – on their own? Could it be done with a “dumb” device (text/call only)?
Social relationships
One-way viewing (Instagram, Facebook) with superficial acquaintances may promote isolation, anxiety, and depression, does not facilitate deepened relationships, and may be using up time that they could be investing in genuine social connections. But if they are using their devices to stay connected to good friends who live far away or just have different schedules, they can promote genuine, satisfying, bilateral social connections.
Key questions. Are they engaged in two-way communication with their devices? Are they staying connected to friends with whom they have a genuine, substantial relationship?
Investigating and experimenting with interests (identity)
Teenagers are supposed to be learning in deep and nuanced ways about their own interests and abilities during these years. This requires a lot of time invested in exploration and experimentation and a considerable amount of failure. Any activity that consumes a lot of their time without deepening meaningful knowledge of their interests and abilities (that is, activity that is only an escape or distraction) will interfere with their discovering their authentic identity.
Key questions. Is their use of devices facilitating this genuine exploration (setting up internships, practicing programming, or exploring interests that must be virtual)? Or is their device use just consuming precious time they could be using to genuinely explore potential interests?
Managing anxiety or distress
Exploring their identity and building social connections will involve a lot of stress, failure, disappointment, and even heartbreak. Learning to manage these uncomfortable feelings is an important part of adolescence. Distraction with a diverting entertainment can be one of several strategies for managing stress and distress. But if it becomes the only strategy, it can keep teens from getting “back in the game” and experiencing the fun, success, meaning, and joy that are also a big part of this exploration.
Key questions. Do they turn to their devices first when sad or stressed? Are they also able to use other strategies, such as talking with friends/family, exercising, or engaging in a meaningful pursuit to help them manage stress? Do they feel better after a little time spent on their device, or as if they will only feel good if they can stay on the device?
Self-care
Getting adequate, restful sleep (8-10 hours/night), finding regular time for exercise, cultivating healthy eating habits, and discovering what healthy strategies help them to unwind or relax is critical to a teenager’s healthiest development, and to healthy adult life. Some screens may help with motivating and tracking exercise, but screens in the bedroom interfere with going to bed, and with falling and staying asleep. Most teenagers are very busy and managing a lot of (normal) stress; the senseless fun or relaxation that are part of video games or surfing the Web are quick, practical, and effective ways to unwind. Don’t discourage your teenager from enjoying them. Instead, focus on also helping them to find other healthy ways to relax: hot baths, exercise, time with pets, crafts, reading, and listening to music are just a few examples. As they are building their identity, they should also be discovering how they best slow down and calm down.
Key questions. How many hours of sleep do they usually get on a school night? Is their phone (or other screen) in their bedroom during sleep? How do they relax? Do they have several strategies that do not require screens? Do they exercise regularly (3-5 times weekly)? Do they complain that they do not have enough time for exercise?
Third: Be mindful of what you model
Many of these principles can apply to our own use of smartphones, computers, and so on. Remind parents that their teenager will ultimately consider and follow their example much more than their commands. They should be prepared to talk about how they are thinking about the risks and benefits of social media use, how they are developing rules and expectations, and why they decided on them. These conversations model thoughtful and flexible decision-making.
It is critical that parents acknowledge that there are wonderful benefits to technology, including senseless fun. Then, it is easier to discuss how escaping into screen use can be hard to resist, and why it is important to practice resisting some temptations. Parents should find ways to follow the same rules they set for their teenager, or making them “family rules.” It’s important for our teenagers to learn about how to set these limits, as eventually they will be setting their own!
Dr. Swick is physician in chief at Ohana Center for Child and Adolescent Behavioral Health, Community Hospital of the Monterey (Calif.) Peninsula. Dr. Jellinek is professor emeritus of psychiatry and pediatrics, Harvard Medical School, Boston. Email them at [email protected].
The Centers for Disease Control and Prevention recently released results of the most recent Youth Risk Behavior Survey, their once-a-decade survey of youth mental health and risk-taking behaviors. The headlines aren’t good: Self-reported rates of anxiety, depression, suicidal thoughts, and suicide attempts in adolescents have increased substantially from 2011 to 2021. This echoes epidemiologic data showing increasing rates of anxiety and depression over the last decade in 12- to 24-year-olds, but not in older age cohorts.
This trend started well before COVID, coinciding with the explosive growth in use of smartphones, apps, and social media platforms. Facebook launched in 2004, the iPhone in 2007, Instagram in 2010, and TikTok in 2016. A 2018 Pew Research survey of 13- to 17-year-olds found that 97% of them used at least one social media platform and 45% described themselves as online “almost constantly.” Social media does have great potential benefits for adolescents.
We all experienced how it supported relationships during COVID. It can provide supportive networks for teenagers isolated by exclusion, illness, or disability. It can support exploration of esoteric interests, expression of identity, entertainment, and relaxation. But certain children, as was true before social media, seem vulnerable to the bullying, loneliness, isolation, and disengagement that social media may exacerbate.
Several studies have shown an association between high daily screen time and adolescent anxiety and depression. These findings have not been consistently duplicated, and those that were could not establish causality. There appears to be a strong link between certain illnesses (ADHD, depression, anorexia nervosa) and excessive screen use, which can in turn worsen symptoms. But it is hard to know which came first or how they are related.
Now, a very large long-term observational study has suggested that there may be critical windows in adolescence (11-13 years in girls and 14-16 in boys and again at 19 years for both) during which time excessive screen time can put that child’s developing mental health at risk. This is nuanced and interesting progress, but you don’t have to wait another decade to offer the families in your practice some common sense guidance when they are asking how to balance their children’s needs to be independent and socially connected (and the fact that smartphones and social media are pervasive) with the risks of overuse. Equipped with these guiding principles, parents can set individualized, flexible ground rules, and adjust them as their children grow into young adults.
First: Know your child
Parents are, of course, the experts on their own child – their talents, interests, challenges, vulnerabilities, and developmental progress. Children with poor impulse control (including those with ADHD) are going to have greater difficulty turning away from highly addictive activities on their devices. Children who are anxious and shy may be prone to avoiding the stress of real-life situations, preferring virtual ones. Children with a history of depression may be vulnerable to relapse if their sleep and exercise routines are disrupted by excessive use. And children with eating disorders are especially vulnerable to the superficial social comparisons and “likes” that Instagram offers. Children with these vulnerabilities will benefit if their parents are aware of and can talk about these vulnerabilities, ideally with their child. They should be prepared to work with their teens to develop strategies that can help them learn how to manage their social media usage. These might include stopping screen use after a certain hour, leaving devices outside of bedrooms at night, and setting up apps that monitor and alert them about excessive use. They might use resources such as the AAP’s Family Media Plan (Media and Children [aap.org]), but simply taking the time to have regular, open, honest conversations about what is known and unknown about the potential risks of social media use is very protective.
Second: Use adolescent development as your guide
For those children who do not have a known vulnerability to overuse, consider the following areas that are essential to healthy development in adolescence as guideposts to help parents in setting reasonable ground rules: building independence, cultivating healthy social relationships, learning about their identity, managing their strong emotions, and developing the skills of self-care. If screen time supports these developmental areas, then it’s probably healthy. If it interferes with them, then not. And remember, parents should routinely discuss these principles with their children as well.
Independence
Key questions. Does their use of a device enable them to function more independently – that is, to arrange for rides, manage their schedules, homework, shifts, and so forth – on their own? Could it be done with a “dumb” device (text/call only)?
Social relationships
One-way viewing (Instagram, Facebook) with superficial acquaintances may promote isolation, anxiety, and depression, does not facilitate deepened relationships, and may be using up time that they could be investing in genuine social connections. But if they are using their devices to stay connected to good friends who live far away or just have different schedules, they can promote genuine, satisfying, bilateral social connections.
Key questions. Are they engaged in two-way communication with their devices? Are they staying connected to friends with whom they have a genuine, substantial relationship?
Investigating and experimenting with interests (identity)
Teenagers are supposed to be learning in deep and nuanced ways about their own interests and abilities during these years. This requires a lot of time invested in exploration and experimentation and a considerable amount of failure. Any activity that consumes a lot of their time without deepening meaningful knowledge of their interests and abilities (that is, activity that is only an escape or distraction) will interfere with their discovering their authentic identity.
Key questions. Is their use of devices facilitating this genuine exploration (setting up internships, practicing programming, or exploring interests that must be virtual)? Or is their device use just consuming precious time they could be using to genuinely explore potential interests?
Managing anxiety or distress
Exploring their identity and building social connections will involve a lot of stress, failure, disappointment, and even heartbreak. Learning to manage these uncomfortable feelings is an important part of adolescence. Distraction with a diverting entertainment can be one of several strategies for managing stress and distress. But if it becomes the only strategy, it can keep teens from getting “back in the game” and experiencing the fun, success, meaning, and joy that are also a big part of this exploration.
Key questions. Do they turn to their devices first when sad or stressed? Are they also able to use other strategies, such as talking with friends/family, exercising, or engaging in a meaningful pursuit to help them manage stress? Do they feel better after a little time spent on their device, or as if they will only feel good if they can stay on the device?
Self-care
Getting adequate, restful sleep (8-10 hours/night), finding regular time for exercise, cultivating healthy eating habits, and discovering what healthy strategies help them to unwind or relax is critical to a teenager’s healthiest development, and to healthy adult life. Some screens may help with motivating and tracking exercise, but screens in the bedroom interfere with going to bed, and with falling and staying asleep. Most teenagers are very busy and managing a lot of (normal) stress; the senseless fun or relaxation that are part of video games or surfing the Web are quick, practical, and effective ways to unwind. Don’t discourage your teenager from enjoying them. Instead, focus on also helping them to find other healthy ways to relax: hot baths, exercise, time with pets, crafts, reading, and listening to music are just a few examples. As they are building their identity, they should also be discovering how they best slow down and calm down.
Key questions. How many hours of sleep do they usually get on a school night? Is their phone (or other screen) in their bedroom during sleep? How do they relax? Do they have several strategies that do not require screens? Do they exercise regularly (3-5 times weekly)? Do they complain that they do not have enough time for exercise?
Third: Be mindful of what you model
Many of these principles can apply to our own use of smartphones, computers, and so on. Remind parents that their teenager will ultimately consider and follow their example much more than their commands. They should be prepared to talk about how they are thinking about the risks and benefits of social media use, how they are developing rules and expectations, and why they decided on them. These conversations model thoughtful and flexible decision-making.
It is critical that parents acknowledge that there are wonderful benefits to technology, including senseless fun. Then, it is easier to discuss how escaping into screen use can be hard to resist, and why it is important to practice resisting some temptations. Parents should find ways to follow the same rules they set for their teenager, or making them “family rules.” It’s important for our teenagers to learn about how to set these limits, as eventually they will be setting their own!
Dr. Swick is physician in chief at Ohana Center for Child and Adolescent Behavioral Health, Community Hospital of the Monterey (Calif.) Peninsula. Dr. Jellinek is professor emeritus of psychiatry and pediatrics, Harvard Medical School, Boston. Email them at [email protected].
The Centers for Disease Control and Prevention recently released results of the most recent Youth Risk Behavior Survey, their once-a-decade survey of youth mental health and risk-taking behaviors. The headlines aren’t good: Self-reported rates of anxiety, depression, suicidal thoughts, and suicide attempts in adolescents have increased substantially from 2011 to 2021. This echoes epidemiologic data showing increasing rates of anxiety and depression over the last decade in 12- to 24-year-olds, but not in older age cohorts.
This trend started well before COVID, coinciding with the explosive growth in use of smartphones, apps, and social media platforms. Facebook launched in 2004, the iPhone in 2007, Instagram in 2010, and TikTok in 2016. A 2018 Pew Research survey of 13- to 17-year-olds found that 97% of them used at least one social media platform and 45% described themselves as online “almost constantly.” Social media does have great potential benefits for adolescents.
We all experienced how it supported relationships during COVID. It can provide supportive networks for teenagers isolated by exclusion, illness, or disability. It can support exploration of esoteric interests, expression of identity, entertainment, and relaxation. But certain children, as was true before social media, seem vulnerable to the bullying, loneliness, isolation, and disengagement that social media may exacerbate.
Several studies have shown an association between high daily screen time and adolescent anxiety and depression. These findings have not been consistently duplicated, and those that were could not establish causality. There appears to be a strong link between certain illnesses (ADHD, depression, anorexia nervosa) and excessive screen use, which can in turn worsen symptoms. But it is hard to know which came first or how they are related.
Now, a very large long-term observational study has suggested that there may be critical windows in adolescence (11-13 years in girls and 14-16 in boys and again at 19 years for both) during which time excessive screen time can put that child’s developing mental health at risk. This is nuanced and interesting progress, but you don’t have to wait another decade to offer the families in your practice some common sense guidance when they are asking how to balance their children’s needs to be independent and socially connected (and the fact that smartphones and social media are pervasive) with the risks of overuse. Equipped with these guiding principles, parents can set individualized, flexible ground rules, and adjust them as their children grow into young adults.
First: Know your child
Parents are, of course, the experts on their own child – their talents, interests, challenges, vulnerabilities, and developmental progress. Children with poor impulse control (including those with ADHD) are going to have greater difficulty turning away from highly addictive activities on their devices. Children who are anxious and shy may be prone to avoiding the stress of real-life situations, preferring virtual ones. Children with a history of depression may be vulnerable to relapse if their sleep and exercise routines are disrupted by excessive use. And children with eating disorders are especially vulnerable to the superficial social comparisons and “likes” that Instagram offers. Children with these vulnerabilities will benefit if their parents are aware of and can talk about these vulnerabilities, ideally with their child. They should be prepared to work with their teens to develop strategies that can help them learn how to manage their social media usage. These might include stopping screen use after a certain hour, leaving devices outside of bedrooms at night, and setting up apps that monitor and alert them about excessive use. They might use resources such as the AAP’s Family Media Plan (Media and Children [aap.org]), but simply taking the time to have regular, open, honest conversations about what is known and unknown about the potential risks of social media use is very protective.
Second: Use adolescent development as your guide
For those children who do not have a known vulnerability to overuse, consider the following areas that are essential to healthy development in adolescence as guideposts to help parents in setting reasonable ground rules: building independence, cultivating healthy social relationships, learning about their identity, managing their strong emotions, and developing the skills of self-care. If screen time supports these developmental areas, then it’s probably healthy. If it interferes with them, then not. And remember, parents should routinely discuss these principles with their children as well.
Independence
Key questions. Does their use of a device enable them to function more independently – that is, to arrange for rides, manage their schedules, homework, shifts, and so forth – on their own? Could it be done with a “dumb” device (text/call only)?
Social relationships
One-way viewing (Instagram, Facebook) with superficial acquaintances may promote isolation, anxiety, and depression, does not facilitate deepened relationships, and may be using up time that they could be investing in genuine social connections. But if they are using their devices to stay connected to good friends who live far away or just have different schedules, they can promote genuine, satisfying, bilateral social connections.
Key questions. Are they engaged in two-way communication with their devices? Are they staying connected to friends with whom they have a genuine, substantial relationship?
Investigating and experimenting with interests (identity)
Teenagers are supposed to be learning in deep and nuanced ways about their own interests and abilities during these years. This requires a lot of time invested in exploration and experimentation and a considerable amount of failure. Any activity that consumes a lot of their time without deepening meaningful knowledge of their interests and abilities (that is, activity that is only an escape or distraction) will interfere with their discovering their authentic identity.
Key questions. Is their use of devices facilitating this genuine exploration (setting up internships, practicing programming, or exploring interests that must be virtual)? Or is their device use just consuming precious time they could be using to genuinely explore potential interests?
Managing anxiety or distress
Exploring their identity and building social connections will involve a lot of stress, failure, disappointment, and even heartbreak. Learning to manage these uncomfortable feelings is an important part of adolescence. Distraction with a diverting entertainment can be one of several strategies for managing stress and distress. But if it becomes the only strategy, it can keep teens from getting “back in the game” and experiencing the fun, success, meaning, and joy that are also a big part of this exploration.
Key questions. Do they turn to their devices first when sad or stressed? Are they also able to use other strategies, such as talking with friends/family, exercising, or engaging in a meaningful pursuit to help them manage stress? Do they feel better after a little time spent on their device, or as if they will only feel good if they can stay on the device?
Self-care
Getting adequate, restful sleep (8-10 hours/night), finding regular time for exercise, cultivating healthy eating habits, and discovering what healthy strategies help them to unwind or relax is critical to a teenager’s healthiest development, and to healthy adult life. Some screens may help with motivating and tracking exercise, but screens in the bedroom interfere with going to bed, and with falling and staying asleep. Most teenagers are very busy and managing a lot of (normal) stress; the senseless fun or relaxation that are part of video games or surfing the Web are quick, practical, and effective ways to unwind. Don’t discourage your teenager from enjoying them. Instead, focus on also helping them to find other healthy ways to relax: hot baths, exercise, time with pets, crafts, reading, and listening to music are just a few examples. As they are building their identity, they should also be discovering how they best slow down and calm down.
Key questions. How many hours of sleep do they usually get on a school night? Is their phone (or other screen) in their bedroom during sleep? How do they relax? Do they have several strategies that do not require screens? Do they exercise regularly (3-5 times weekly)? Do they complain that they do not have enough time for exercise?
Third: Be mindful of what you model
Many of these principles can apply to our own use of smartphones, computers, and so on. Remind parents that their teenager will ultimately consider and follow their example much more than their commands. They should be prepared to talk about how they are thinking about the risks and benefits of social media use, how they are developing rules and expectations, and why they decided on them. These conversations model thoughtful and flexible decision-making.
It is critical that parents acknowledge that there are wonderful benefits to technology, including senseless fun. Then, it is easier to discuss how escaping into screen use can be hard to resist, and why it is important to practice resisting some temptations. Parents should find ways to follow the same rules they set for their teenager, or making them “family rules.” It’s important for our teenagers to learn about how to set these limits, as eventually they will be setting their own!
Dr. Swick is physician in chief at Ohana Center for Child and Adolescent Behavioral Health, Community Hospital of the Monterey (Calif.) Peninsula. Dr. Jellinek is professor emeritus of psychiatry and pediatrics, Harvard Medical School, Boston. Email them at [email protected].
Increased cancer in military pilots and ground crew: Pentagon
“Military aircrew and ground crew were overall more likely to be diagnosed with cancer, but less likely to die from cancer compared to the U.S. population,” the report concludes.
The study involved 156,050 aircrew and 737,891 ground crew. Participants were followed between 1992 and 2017. Both groups were predominantly male and non-Hispanic.
Data on cancer incidence and mortality for these two groups were compared with data from groups of similar age in the general population through use of the Surveillance, Epidemiology, and End Results (SEER) Database of the National Cancer Institute.
For aircrew, the study found an 87% higher rate of melanoma, a 39% higher rate of thyroid cancer, a 16% higher rate of prostate cancer, and a 24% higher rate of cancer for all sites combined.
A higher rate of melanoma and prostate cancer among aircrew has been reported previously, but the increased rate of thyroid cancer is a new finding, the authors note.
The uptick in melanoma has also been reported in studies of civilian pilots and cabin crew. It has been attributed to exposure to hazardous ultraviolet and cosmic radiation.
For ground crew members, the analysis found a 19% higher rate of cancers of the brain and nervous system, a 15% higher rate of thyroid cancer, a 9% higher rate of melanoma and of kidney and renal pelvis cancers, and a 3% higher rate of cancer for all sites combined.
There is little to compare these findings with: This is the first time that cancer risk has been evaluated in such a large population of military ground crew.
Lower rates of cancer mortality
In contrast to the increase in cancer incidence, the report found a decrease in cancer mortality.
When compared with a demographically similar U.S. population, the mortality rate among aircrew was 56% lower for all cancer sites; for ground crew, the mortality rate was 35% lower.
However, the report authors emphasize that “it is important to note that the military study population was relatively young.”
The median age at the end of follow-up for the cancer incidence analysis was 41 years for aircrew and 26 years for ground crew. The median age at the end of follow-up for the cancer mortality analysis was 48 years for aircrew and 41 years for ground crew.
“Results may have differed if additional older former Service members had been included in the study, since cancer risk and mortality rates increase with age,” the authors comment.
Other studies have found an increase in deaths from melanoma as well as an increase in the incidence of melanoma. A meta-analysis published in 2019 in the British Journal of Dermatology found that airline pilots and cabin crew have about twice the risk of melanoma and other skin cancers than the general population. Pilots are also more likely to die from melanoma.
Further study underway
The findings on military air and ground crew come from phase 1 of a study that was required by Congress in the 2021 defense bill. Because the investigators found an increase in the incidence of cancer, phase 2 of the study is now necessary.
The report authors explain that phase 2 will consist of identifying the carcinogenic toxicants or hazardous materials associated with military flight operations; identifying operating environments that could be associated with increased amounts of ionizing and nonionizing radiation; identifying specific duties, dates of service, and types of aircraft flown that could have increased the risk for cancer; identifying duty locations associated with a higher incidence of cancers; identifying potential exposures through military service that are not related to aviation; and determining the appropriate age to begin screening military aircrew and ground crew for cancers.
A version of this article first appeared on Medscape.com.
“Military aircrew and ground crew were overall more likely to be diagnosed with cancer, but less likely to die from cancer compared to the U.S. population,” the report concludes.
The study involved 156,050 aircrew and 737,891 ground crew. Participants were followed between 1992 and 2017. Both groups were predominantly male and non-Hispanic.
Data on cancer incidence and mortality for these two groups were compared with data from groups of similar age in the general population through use of the Surveillance, Epidemiology, and End Results (SEER) Database of the National Cancer Institute.
For aircrew, the study found an 87% higher rate of melanoma, a 39% higher rate of thyroid cancer, a 16% higher rate of prostate cancer, and a 24% higher rate of cancer for all sites combined.
A higher rate of melanoma and prostate cancer among aircrew has been reported previously, but the increased rate of thyroid cancer is a new finding, the authors note.
The uptick in melanoma has also been reported in studies of civilian pilots and cabin crew. It has been attributed to exposure to hazardous ultraviolet and cosmic radiation.
For ground crew members, the analysis found a 19% higher rate of cancers of the brain and nervous system, a 15% higher rate of thyroid cancer, a 9% higher rate of melanoma and of kidney and renal pelvis cancers, and a 3% higher rate of cancer for all sites combined.
There is little to compare these findings with: This is the first time that cancer risk has been evaluated in such a large population of military ground crew.
Lower rates of cancer mortality
In contrast to the increase in cancer incidence, the report found a decrease in cancer mortality.
When compared with a demographically similar U.S. population, the mortality rate among aircrew was 56% lower for all cancer sites; for ground crew, the mortality rate was 35% lower.
However, the report authors emphasize that “it is important to note that the military study population was relatively young.”
The median age at the end of follow-up for the cancer incidence analysis was 41 years for aircrew and 26 years for ground crew. The median age at the end of follow-up for the cancer mortality analysis was 48 years for aircrew and 41 years for ground crew.
“Results may have differed if additional older former Service members had been included in the study, since cancer risk and mortality rates increase with age,” the authors comment.
Other studies have found an increase in deaths from melanoma as well as an increase in the incidence of melanoma. A meta-analysis published in 2019 in the British Journal of Dermatology found that airline pilots and cabin crew have about twice the risk of melanoma and other skin cancers than the general population. Pilots are also more likely to die from melanoma.
Further study underway
The findings on military air and ground crew come from phase 1 of a study that was required by Congress in the 2021 defense bill. Because the investigators found an increase in the incidence of cancer, phase 2 of the study is now necessary.
The report authors explain that phase 2 will consist of identifying the carcinogenic toxicants or hazardous materials associated with military flight operations; identifying operating environments that could be associated with increased amounts of ionizing and nonionizing radiation; identifying specific duties, dates of service, and types of aircraft flown that could have increased the risk for cancer; identifying duty locations associated with a higher incidence of cancers; identifying potential exposures through military service that are not related to aviation; and determining the appropriate age to begin screening military aircrew and ground crew for cancers.
A version of this article first appeared on Medscape.com.
“Military aircrew and ground crew were overall more likely to be diagnosed with cancer, but less likely to die from cancer compared to the U.S. population,” the report concludes.
The study involved 156,050 aircrew and 737,891 ground crew. Participants were followed between 1992 and 2017. Both groups were predominantly male and non-Hispanic.
Data on cancer incidence and mortality for these two groups were compared with data from groups of similar age in the general population through use of the Surveillance, Epidemiology, and End Results (SEER) Database of the National Cancer Institute.
For aircrew, the study found an 87% higher rate of melanoma, a 39% higher rate of thyroid cancer, a 16% higher rate of prostate cancer, and a 24% higher rate of cancer for all sites combined.
A higher rate of melanoma and prostate cancer among aircrew has been reported previously, but the increased rate of thyroid cancer is a new finding, the authors note.
The uptick in melanoma has also been reported in studies of civilian pilots and cabin crew. It has been attributed to exposure to hazardous ultraviolet and cosmic radiation.
For ground crew members, the analysis found a 19% higher rate of cancers of the brain and nervous system, a 15% higher rate of thyroid cancer, a 9% higher rate of melanoma and of kidney and renal pelvis cancers, and a 3% higher rate of cancer for all sites combined.
There is little to compare these findings with: This is the first time that cancer risk has been evaluated in such a large population of military ground crew.
Lower rates of cancer mortality
In contrast to the increase in cancer incidence, the report found a decrease in cancer mortality.
When compared with a demographically similar U.S. population, the mortality rate among aircrew was 56% lower for all cancer sites; for ground crew, the mortality rate was 35% lower.
However, the report authors emphasize that “it is important to note that the military study population was relatively young.”
The median age at the end of follow-up for the cancer incidence analysis was 41 years for aircrew and 26 years for ground crew. The median age at the end of follow-up for the cancer mortality analysis was 48 years for aircrew and 41 years for ground crew.
“Results may have differed if additional older former Service members had been included in the study, since cancer risk and mortality rates increase with age,” the authors comment.
Other studies have found an increase in deaths from melanoma as well as an increase in the incidence of melanoma. A meta-analysis published in 2019 in the British Journal of Dermatology found that airline pilots and cabin crew have about twice the risk of melanoma and other skin cancers than the general population. Pilots are also more likely to die from melanoma.
Further study underway
The findings on military air and ground crew come from phase 1 of a study that was required by Congress in the 2021 defense bill. Because the investigators found an increase in the incidence of cancer, phase 2 of the study is now necessary.
The report authors explain that phase 2 will consist of identifying the carcinogenic toxicants or hazardous materials associated with military flight operations; identifying operating environments that could be associated with increased amounts of ionizing and nonionizing radiation; identifying specific duties, dates of service, and types of aircraft flown that could have increased the risk for cancer; identifying duty locations associated with a higher incidence of cancers; identifying potential exposures through military service that are not related to aviation; and determining the appropriate age to begin screening military aircrew and ground crew for cancers.
A version of this article first appeared on Medscape.com.