User login
Novel oral testosterone replacement therapy headed to FDA
Marius Pharmaceuticals has submitted a new drug application (NDA) to the Food and Drug Administration for Kyzatrex, an oral testosterone replacement therapy (TRT).
With this NDA, the company is seeking approval for Kyzatrex as a treatment for adult men with primary and secondary hypogonadism, also known as testosterone deficiency. Marius has requested a priority review that, if accepted, would result in an anticipated 6-month review period.
Current treatment options for hypogonadal men consist of therapies with safety concerns, such as cardiovascular and metabolic risks, that make patient adherence to treatment very low.
Kyzatrex is a novel oral formulation of testosterone undecanoate administered twice daily in a soft gelatin capsule.
“TRT remains a therapeutic challenge because there are worrisome and conflicting data related to increased cardiovascular disease risk, which has special relevance to high-risk diabetic populations,” Paul S. Jellinger, MD, professor of clinical medicine at the University of Miami, told this news organization. Furthermore, “injectable depot testosterone may be associated with peak supraphysiological levels and a substantial increase in hemoglobin. Topical testosterone offers more stable levels without a peak and trough, but in some men achieving physiologic levels may be difficult.”
The NDA is supported by results from a 6-month treatment extension of the pivotal phase 3 MRS-TU-2019 study (NCT04467697). Final results from this study have not been presented, but the company wrote in a press release that the results will be published some time in 2021.
They further reported that Kyzatrex was well tolerated by patients, with more than 96% of study participants completing 90 days of treatment in the pivotal phase 3 study. Study patients achieved average testosterone levels in the normal range.
Across the pooled phase 3 trials, the most frequent treatment-related treatment-emergent adverse event (TEAE) was hypertension, and no serious TEAEs were considered treatment related.
“We are extremely proud to have generated compelling efficacy and safety data in our phase 3 trials,” said Om Dhingra, PhD, cofounder and CEO of Marius. “We look forward to continuing to work collaboratively with the FDA on the review of our application, and if approved, Kyzatrex has the potential to become the standard of care for the treatment of primary and secondary hypogonadism globally.”
“An oral [testosterone] preparation with steady state physiologic levels would be a welcome addition to our choices for therapy assuming, of course, the absence of adverse effects,” explained Dr. Jellinger. “However, the greater challenge of testosterone therapy is the appropriate selection of those suited for testosterone replacement therapy.”
The company also plans to submit a marketing authorization application with the European Medicines Agency in the first half of 2022.
Theory of Planned Behavior Provides A Theoretical Explanation For Enhanced Behavior Change With Genetic-Based Lifestyle Interventions
Study Overview
Objective. To determine the impact of providing genetically tailored and population-based lifestyle advice for weight management on key constructs of the Theory of Planned Behavior (TPB), a widely accepted theory used to help predict human lifestyle-related behaviors.
Design. Pragmatic, cluster, randomized controlled trial.
Settings and participants. This study took place at the East Elgin Family Health Team, a primary care clinic in Aylmer, Ontario, Canada. Recruitment occurred between April 2017 and September 2018, with staggered intervention cohorts occurring from May 2017 to September 2019. Participants enrolled in a weight management program at the clinic were invited to participate in the study if they met the following inclusion criteria: body mass index (BMI) ≥25 kg/m2, >18 years of age, English-speaking, willing to undergo genetic testing, having access to a computer with internet at least 1 day per week, and not seeing another health care provider for weight loss advice outside of the study. Exclusion criteria included pregnancy and lactation. All participants provided written informed consent.
Interventions. At baseline, weight management program cohorts (average cohort size was 14 participants) were randomized (1:1) to receive either the standard population-based intervention (Group Lifestyle Balance, or GLB) or a modified GLB intervention, which included the provision of lifestyle genomics (LGx) information and advice (GLB+LGx). Both interventions aimed to assist participants with weight management and healthy lifestyle change, with particular focus on nutrition and physical activity (PA). Interventions were 12 months long, consisting of 23 group-based sessions and 3 one-on-one sessions with a registered dietitian after 3, 6, and 12 months (all sessions were face-to-face). To improve intervention adherence, participants were given reminder calls for their one-on-one appointments and for the start of their program. A sample size was calculated based on the primary outcome indicating that a total of 74 participants were needed (n = 37 per group) for this trial. By September 2019, this sample size was exceeded with 10 randomized groups (n = 140).
The 5 randomized standard GLB groups followed the established GLB program curriculum comprising population-based information and advice while focusing on following a calorie-controlled, moderate-fat (25% of calories) nutrition plan with at least 150 minutes of weekly moderate-intensity PA. Participants were also provided with a 1-page summary report of their nutrition and PA guidelines at the first group meeting outlining population-based targets, including acceptable macronutrient distribution ranges for protein, total fat, saturated fat, monounsaturated fat, polyunsaturated fat, sodium, calories, snacking, and PA.
The 5 randomized modified GLB+LGx groups followed a modified GLB program curriculum in which participants were given genetic-based information and advice, which differed from the advice given to the standard GLB group, while focusing on following a calorie-controlled nutrition plan. The nutrition and PA targets were personalized based on their individual genetic variation. For example, participants with the AA variant of FTO (rs9939609) were advised to engage in at least 30 to 60 minutes of PA daily 6 days per week, with muscle-strengthening activities at least 2 days per week, rather than receiving the standard population-based advice to aim for 150 minutes weekly of PA with at least 2 days per week of muscle-strengthening activity. Participants were also provided with a 1-page summary report of their nutrition and PA guidelines at the first group meeting, which outlined genetic-based information and advice related to protein, total fat, saturated fat, monounsaturated fat, polyunsaturated fat, sodium, calories, snacking, and PA.
Measures and analysis. Change in the TPB components (attitudes, subjective norms and perceived behavioral control) were measured via a TPB questionnaire at 5 time points: baseline (2-week run-in period), immediately after the first group session (where participants received a summary report of either population-based or genetic-based recommendations depending on group assignment), and after 3-, 6- and 12-month follow-ups. Attitudes, subjective norms, and perceived behavioral control were measured on a Likert scale from 1 through 7. Self-reported measures of actual behavioral control (including annual household income, perceptions about events arising in one’s day-to-day life that suddenly take up one’s free time, perceptions about the frequency of feeling ill or tired, and highest achieved level of education) were collected via survey questions and assessed on a Likert scale of 1 through 7. Stage of change was also measured, based on the Transtheoretical Model, using a Likert scale of 1 through 6.
Linear mixed models were used to conduct within- and between-group analyses using SPSS version 26.0, while controlling for measures of actual behavioral control. All analyses were intention-to-treat by originally assigned groups, with mean value imputation conducted for missing data. A Bonferroni correction for multiple testing was used. For all statistical analyses, the level of significance was set at P < 0.05 and trending towards significance at P = 0.05–0.06.
Main results. Participants consisted of primarily middle-age, middle-income, Caucasian females. Baseline attitudes towards the effectiveness of nutrition and PA for weight management were generally positive, and participants perceived that undergoing genetic testing would assist with weight management. Participants had overall neutral subjective norms related to friends and family consuming a healthy diet and engaging in PA, but perceived that their friends, family, and health care team (HCT) believed it was important for them to achieve their nutrition and PA recommendations. Participants overall also perceived that their HCT believed genetic testing could assist with weight management. Baseline measures of perceived behavioral control were overall neutral, with baseline stage of change between “motivation” and “action” (short-term; <3 months).
In within-group analyses, significant improvements (P < 0.05) in attitudes towards the effectiveness of nutrition and PA recommendations for weight management, subjective norms related to both friends and family consuming a healthy diet, and perceived behavioral control in changing PA/dietary intake and managing weight tended to be short-term in the GLB group and long-term for the GLB+LGx group. In all cases of between-group differences for changes in TPB components, the GLB group exhibited reductions in scores, whereas the GLB+LGx group exhibited increases or improvements. Between-group differences (short-term and long-term) in several measures of subjective norms were observed. For example, after 3 months, significant between-group differences were observed in changes in perception that friends believed LGx would help with weight management (P = 0.024). After 12 months, between-group differences trending towards significance were also observed in changes in perception that family members believed genetic testing would help with weight management (P = 0.05). Significant between-group differences and differences trending towards significance were also observed at 12 months for changes in perception that family believed it was important for the participant to achieve the PA recommendations (P = 0.049) and nutrition recommendations (P = 0.05). Between-group differences trending towards significance were also observed at 3 months in attitudes towards the effectiveness of LGx for weight management (P = 0.06). There were no significant between-group differences observed in changes in perceived behavioral control.
Conclusion. Results from this study support the hypothesis that the TPB can help provide a theoretical explanation for why genetically tailored lifestyle information and advice can lead to improvements in lifestyle behavior change.
Commentary
Because health behaviors are critical in areas such as prevention, treatment, and rehabilitation, it is important to describe and understand what drives these behaviors.1 Theories are important tools in this effort as they aim to explain and predict health behavior and are used in the design and evaluation of interventions.1 The TPB is one of the most widely accepted behavior change theories and posits that attitudes, subjective norms (or social pressures and behaviors), and perceived behavioral control are significant predictors of an individual’s intention to engage in behaviors.2 TPB has been highlighted in the literature as a validated theory for predicting nutrition and PA intentions and resulting behaviors.3,4
Motivating lifestyle behavior change in clinical practice can be challenging, but some studies have demonstrated how providing genetic information and advice (or lifestyle genomics) can help motivate changes in nutrition and PA among patients.5-7 Because this has yet to be explained using the TPB, this study is an important contribution to the literature as it aimed to determine the impact of providing genetically tailored and population-based lifestyle advice for weight management on key constructs of the TPB. Briefly, results from within-group analyses in this study demonstrated that the provision of genetically tailored lifestyle information and advice (via the GLB+LGx intervention) tended to impact antecedents of behavior change, more so over the long-term, while population-based advice (via the standard GLB intervention) tended to impact antecedents of behavior change over the short-term (eg, attitudes towards dietary fat intake, perceptions that friends and family consume a healthy diet, and perceptions about the impact of genetic-based advice for weight management). In addition, between-group differences in subjective norms observed at 12 months suggested that social pressures and norms may be influencing long-term changes in lifestyle habits.
While key strengths of this study include its pragmatic cluster randomized controlled trial design, 12-month intervention duration, and intent-to-treat analyses, there are some study limitations, which are acknowledged by the authors. Generalizability is limited to the demographic characteristics of the study population (ie, middle-aged, middle-income, Caucasian females enrolled in a lifestyle change weight management program). Thus, replication of the study is needed in more diverse study populations and with health-related outcomes beyond weight management. In addition, as the authors indicate, future research should ensure the inclusion of theory-based questionnaires in genetic-based intervention studies assessing lifestyle behavior change to elucidate theory-based mechanisms of change.
Applications for Clinical Practice
Population-based research has consistently indicated that nutrition interventions typically impact short-term dietary changes. Confronting the challenge of long-term adherence to nutrition and PA recommendations requires an understanding of factors impacting long-term motivation and behavior change. With increased attention on and research into genetically tailored lifestyle advice (or lifestyle genomics), it is important for clinical practitioners to be familiar with the evidence supporting these approaches. In addition, this research highlights the need to consider individual factors (attitudes, subjective norms, and perceived behavioral control) that may predict successful change in lifestyle habits when providing nutrition and PA recommendations, whether population-based or genetically tailored.
—Katrina F. Mateo, PhD, MPH
1. Lippke S, Ziegelmann JP. Theory-based health behavior change: Developing, testing, and applying theories for evidence-based interventions. Appl Psychol. 2008;57:698-716.
2. Ajzen I. The Theory of planned behaviour: reactions and reflections. Psychol Health. 2011;26:1113-1127.
3. McDermott MS, Oliver M, Simnadis T, et al. The Theory of Planned Behaviour and dietary patterns: A systematic review and meta-analysis. Prev Med (Baltim). 2015;81:150-156.
4. McEachan RRC, Conner M, Taylor NJ, Lawton RJ. Prospective prediction of health-related behaviours with the theory of planned behaviour: A meta-analysis. Health Psychol Rev. 2011;5:97-144.
5. Hietaranta-Luoma H-L, Tahvonen R, Iso-Touru T, et al A. An intervention study of individual, APOE genotype-based dietary and physical-activity advice: impact on health behavior. J Nutrigenet Nutrigenomics. 2014;7:161-174.
6. Nielsen DE, El-Sohemy A. Disclosure of genetic information and change in dietary intake: a randomized controlled trial. DeAngelis MM, ed. PLoS One. 2014;9(11):e112665.
7. Egglestone C, Morris A, O’Brien A. Effect of direct‐to‐consumer genetic tests on health behaviour and anxiety: a survey of consumers and potential consumers. J Genet Couns. 2013;22:565-575.
Study Overview
Objective. To determine the impact of providing genetically tailored and population-based lifestyle advice for weight management on key constructs of the Theory of Planned Behavior (TPB), a widely accepted theory used to help predict human lifestyle-related behaviors.
Design. Pragmatic, cluster, randomized controlled trial.
Settings and participants. This study took place at the East Elgin Family Health Team, a primary care clinic in Aylmer, Ontario, Canada. Recruitment occurred between April 2017 and September 2018, with staggered intervention cohorts occurring from May 2017 to September 2019. Participants enrolled in a weight management program at the clinic were invited to participate in the study if they met the following inclusion criteria: body mass index (BMI) ≥25 kg/m2, >18 years of age, English-speaking, willing to undergo genetic testing, having access to a computer with internet at least 1 day per week, and not seeing another health care provider for weight loss advice outside of the study. Exclusion criteria included pregnancy and lactation. All participants provided written informed consent.
Interventions. At baseline, weight management program cohorts (average cohort size was 14 participants) were randomized (1:1) to receive either the standard population-based intervention (Group Lifestyle Balance, or GLB) or a modified GLB intervention, which included the provision of lifestyle genomics (LGx) information and advice (GLB+LGx). Both interventions aimed to assist participants with weight management and healthy lifestyle change, with particular focus on nutrition and physical activity (PA). Interventions were 12 months long, consisting of 23 group-based sessions and 3 one-on-one sessions with a registered dietitian after 3, 6, and 12 months (all sessions were face-to-face). To improve intervention adherence, participants were given reminder calls for their one-on-one appointments and for the start of their program. A sample size was calculated based on the primary outcome indicating that a total of 74 participants were needed (n = 37 per group) for this trial. By September 2019, this sample size was exceeded with 10 randomized groups (n = 140).
The 5 randomized standard GLB groups followed the established GLB program curriculum comprising population-based information and advice while focusing on following a calorie-controlled, moderate-fat (25% of calories) nutrition plan with at least 150 minutes of weekly moderate-intensity PA. Participants were also provided with a 1-page summary report of their nutrition and PA guidelines at the first group meeting outlining population-based targets, including acceptable macronutrient distribution ranges for protein, total fat, saturated fat, monounsaturated fat, polyunsaturated fat, sodium, calories, snacking, and PA.
The 5 randomized modified GLB+LGx groups followed a modified GLB program curriculum in which participants were given genetic-based information and advice, which differed from the advice given to the standard GLB group, while focusing on following a calorie-controlled nutrition plan. The nutrition and PA targets were personalized based on their individual genetic variation. For example, participants with the AA variant of FTO (rs9939609) were advised to engage in at least 30 to 60 minutes of PA daily 6 days per week, with muscle-strengthening activities at least 2 days per week, rather than receiving the standard population-based advice to aim for 150 minutes weekly of PA with at least 2 days per week of muscle-strengthening activity. Participants were also provided with a 1-page summary report of their nutrition and PA guidelines at the first group meeting, which outlined genetic-based information and advice related to protein, total fat, saturated fat, monounsaturated fat, polyunsaturated fat, sodium, calories, snacking, and PA.
Measures and analysis. Change in the TPB components (attitudes, subjective norms and perceived behavioral control) were measured via a TPB questionnaire at 5 time points: baseline (2-week run-in period), immediately after the first group session (where participants received a summary report of either population-based or genetic-based recommendations depending on group assignment), and after 3-, 6- and 12-month follow-ups. Attitudes, subjective norms, and perceived behavioral control were measured on a Likert scale from 1 through 7. Self-reported measures of actual behavioral control (including annual household income, perceptions about events arising in one’s day-to-day life that suddenly take up one’s free time, perceptions about the frequency of feeling ill or tired, and highest achieved level of education) were collected via survey questions and assessed on a Likert scale of 1 through 7. Stage of change was also measured, based on the Transtheoretical Model, using a Likert scale of 1 through 6.
Linear mixed models were used to conduct within- and between-group analyses using SPSS version 26.0, while controlling for measures of actual behavioral control. All analyses were intention-to-treat by originally assigned groups, with mean value imputation conducted for missing data. A Bonferroni correction for multiple testing was used. For all statistical analyses, the level of significance was set at P < 0.05 and trending towards significance at P = 0.05–0.06.
Main results. Participants consisted of primarily middle-age, middle-income, Caucasian females. Baseline attitudes towards the effectiveness of nutrition and PA for weight management were generally positive, and participants perceived that undergoing genetic testing would assist with weight management. Participants had overall neutral subjective norms related to friends and family consuming a healthy diet and engaging in PA, but perceived that their friends, family, and health care team (HCT) believed it was important for them to achieve their nutrition and PA recommendations. Participants overall also perceived that their HCT believed genetic testing could assist with weight management. Baseline measures of perceived behavioral control were overall neutral, with baseline stage of change between “motivation” and “action” (short-term; <3 months).
In within-group analyses, significant improvements (P < 0.05) in attitudes towards the effectiveness of nutrition and PA recommendations for weight management, subjective norms related to both friends and family consuming a healthy diet, and perceived behavioral control in changing PA/dietary intake and managing weight tended to be short-term in the GLB group and long-term for the GLB+LGx group. In all cases of between-group differences for changes in TPB components, the GLB group exhibited reductions in scores, whereas the GLB+LGx group exhibited increases or improvements. Between-group differences (short-term and long-term) in several measures of subjective norms were observed. For example, after 3 months, significant between-group differences were observed in changes in perception that friends believed LGx would help with weight management (P = 0.024). After 12 months, between-group differences trending towards significance were also observed in changes in perception that family members believed genetic testing would help with weight management (P = 0.05). Significant between-group differences and differences trending towards significance were also observed at 12 months for changes in perception that family believed it was important for the participant to achieve the PA recommendations (P = 0.049) and nutrition recommendations (P = 0.05). Between-group differences trending towards significance were also observed at 3 months in attitudes towards the effectiveness of LGx for weight management (P = 0.06). There were no significant between-group differences observed in changes in perceived behavioral control.
Conclusion. Results from this study support the hypothesis that the TPB can help provide a theoretical explanation for why genetically tailored lifestyle information and advice can lead to improvements in lifestyle behavior change.
Commentary
Because health behaviors are critical in areas such as prevention, treatment, and rehabilitation, it is important to describe and understand what drives these behaviors.1 Theories are important tools in this effort as they aim to explain and predict health behavior and are used in the design and evaluation of interventions.1 The TPB is one of the most widely accepted behavior change theories and posits that attitudes, subjective norms (or social pressures and behaviors), and perceived behavioral control are significant predictors of an individual’s intention to engage in behaviors.2 TPB has been highlighted in the literature as a validated theory for predicting nutrition and PA intentions and resulting behaviors.3,4
Motivating lifestyle behavior change in clinical practice can be challenging, but some studies have demonstrated how providing genetic information and advice (or lifestyle genomics) can help motivate changes in nutrition and PA among patients.5-7 Because this has yet to be explained using the TPB, this study is an important contribution to the literature as it aimed to determine the impact of providing genetically tailored and population-based lifestyle advice for weight management on key constructs of the TPB. Briefly, results from within-group analyses in this study demonstrated that the provision of genetically tailored lifestyle information and advice (via the GLB+LGx intervention) tended to impact antecedents of behavior change, more so over the long-term, while population-based advice (via the standard GLB intervention) tended to impact antecedents of behavior change over the short-term (eg, attitudes towards dietary fat intake, perceptions that friends and family consume a healthy diet, and perceptions about the impact of genetic-based advice for weight management). In addition, between-group differences in subjective norms observed at 12 months suggested that social pressures and norms may be influencing long-term changes in lifestyle habits.
While key strengths of this study include its pragmatic cluster randomized controlled trial design, 12-month intervention duration, and intent-to-treat analyses, there are some study limitations, which are acknowledged by the authors. Generalizability is limited to the demographic characteristics of the study population (ie, middle-aged, middle-income, Caucasian females enrolled in a lifestyle change weight management program). Thus, replication of the study is needed in more diverse study populations and with health-related outcomes beyond weight management. In addition, as the authors indicate, future research should ensure the inclusion of theory-based questionnaires in genetic-based intervention studies assessing lifestyle behavior change to elucidate theory-based mechanisms of change.
Applications for Clinical Practice
Population-based research has consistently indicated that nutrition interventions typically impact short-term dietary changes. Confronting the challenge of long-term adherence to nutrition and PA recommendations requires an understanding of factors impacting long-term motivation and behavior change. With increased attention on and research into genetically tailored lifestyle advice (or lifestyle genomics), it is important for clinical practitioners to be familiar with the evidence supporting these approaches. In addition, this research highlights the need to consider individual factors (attitudes, subjective norms, and perceived behavioral control) that may predict successful change in lifestyle habits when providing nutrition and PA recommendations, whether population-based or genetically tailored.
—Katrina F. Mateo, PhD, MPH
1. Lippke S, Ziegelmann JP. Theory-based health behavior change: Developing, testing, and applying theories for evidence-based interventions. Appl Psychol. 2008;57:698-716.
2. Ajzen I. The Theory of planned behaviour: reactions and reflections. Psychol Health. 2011;26:1113-1127.
3. McDermott MS, Oliver M, Simnadis T, et al. The Theory of Planned Behaviour and dietary patterns: A systematic review and meta-analysis. Prev Med (Baltim). 2015;81:150-156.
4. McEachan RRC, Conner M, Taylor NJ, Lawton RJ. Prospective prediction of health-related behaviours with the theory of planned behaviour: A meta-analysis. Health Psychol Rev. 2011;5:97-144.
5. Hietaranta-Luoma H-L, Tahvonen R, Iso-Touru T, et al A. An intervention study of individual, APOE genotype-based dietary and physical-activity advice: impact on health behavior. J Nutrigenet Nutrigenomics. 2014;7:161-174.
6. Nielsen DE, El-Sohemy A. Disclosure of genetic information and change in dietary intake: a randomized controlled trial. DeAngelis MM, ed. PLoS One. 2014;9(11):e112665.
7. Egglestone C, Morris A, O’Brien A. Effect of direct‐to‐consumer genetic tests on health behaviour and anxiety: a survey of consumers and potential consumers. J Genet Couns. 2013;22:565-575.
20-year-old man • sudden-onset chest pain • worsening pain with cough and exertion • Dx?
THE CASE
A 20-year-old man presented to our clinic with a 3-day history of nonradiating chest pain located at the center of his chest. Past medical history included idiopathic neonatal giant-cell hepatitis and subsequent liver transplant at 1 month of age; he had been followed by the transplant team without rejection or infection and was in otherwise good health prior to the chest pain.
On the day of symptom onset, he was walking inside his house and fell to his knees with a chest pain described as “a punch” to the center of the chest that lasted for a few seconds. He was able to continue his daily activities without limitation despite a constant, squeezing, centrally located chest pain. The pain worsened with cough and exertion.
A few hours later, he went to an urgent care center for evaluation. There, he reported, his chest radiograph and electrocardiogram (EKG) results were normal and he was given a diagnosis of musculoskeletal chest pain. Over the next 3 days, his chest pain persisted but did not worsen. He was taking 500 mg of naproxen every 8 hours with no improvement. No other acute or chronic medications were being taken. He had no significant family history. A review of systems was otherwise negative.
On physical exam, his vital statistics included a height of 6’4”; weight, 261 lb; body mass index, 31.8; temperature, 98.7 °F; blood pressure, 134/77 mm Hg; heart rate, 92 beats/min; respiratory rate, 18 breaths/min; and oxygen saturation, 96%. Throughout the exam, he demonstrated no acute distress, appeared well, and was talkative; however, he reported having a “constant, squeezing” chest pain that did not worsen with palpation of the chest. The rest of his physical exam was unremarkable.
Although he reported that his EKG and chest radiograph were normal 3 days prior, repeat chest radiograph and EKG were ordered due to his unexplained, active chest pain and the lack of immediate access to the prior results.
THE DIAGNOSIS
The chest radiograph (FIGURE 1A) showed a “mildly ectatic ascending thoracic aorta” that had increased since a chest radiograph from 6 years prior (FIGURE 1B) and “was concerning for an aneurysm.” Computed tomography (CT) angiography (FIGURE 2) then confirmed a 7-cm aneurysm of the ascending aorta, with findings suggestive of a retrograde ascending aortic dissection.

DISCUSSION
The average age of a patient with acute aortic dissection (AAD) is 63 years; only 7% occur in people younger than 40.1 AAD is often accompanied by a predisposing risk factor such as a connective tissue disease, bicuspid aortic valve, longstanding hypertension, trauma, or larger aortic dimensions.2,3 Younger patients are more likely to have predisposing risk factors of Marfan syndrome, prior aortic surgery, or a bicuspid aortic valve.3

Continue to: A literature review did not reveal...
A literature review did not reveal any known correlation between the patient’s history of giant-cell hepatitis or antirejection therapy with thoracic aortic dissection. Furthermore, liver transplant is not known to be a specific risk factor for AAD in pediatric patients or outside the immediate postoperative period. Therefore, there were no known predisposing risk factors for AAD in our patient.
The most common clinical feature of AAD is chest pain, which occurs in 75% of patients.1 Other clinical symptoms include hypertension and diaphoresis.2,4 However, classic clinical findings are not always displayed, making the diagnosis difficult.2,4 The classical description of “tearing pain” is seen in only 51% of patients, and 5% to 15% of patients present without any pain.1
Commonly missed or misdiagnosed. The diagnosis of AAD has been missed during the initial exam in 38% of patients.4 As seen in our case, symptoms may be initially diagnosed as musculoskeletal chest pain. Based on symptoms, AAD can be incorrectly diagnosed as an acute myocardial infarction or vascular embolization.2,4
Every hour after symptom onset, the mortality rate of untreated AAD increases 1% to 2%,with no difference based on age.3,4 Different reports have shown mortality rates between 7% and 30%.4
Effective imaging is crucial to the diagnosis and treatment of AAD, given the occurrence of atypical presentation, missed diagnosis, and high mortality rate.4 A chest radiograph will show a widened mediastinum, but the preferred diagnostic tests are a CT or transthoracic echocardiogram.2,4 Once the diagnosis of AAD is confirmed, an aortic angiogram is the preferred test to determine the extent of the dissection prior to surgical treatment.2
Continue to: Classification dictates treatment
Classification dictates treatment. AAD is classified based on where the dissection of the aorta occurs. If the dissection involves the ascending aorta, it is classified as a type A AAD and should immediately be treated with emergent surgery in order to prevent complications including myocardial infarction, cardiac tamponade, and aortic rupture.2,4,5 If the dissection is limited to the descending aorta, it is classified as a type B AAD and can be medically managed by controlling pain and lowering blood pressure; if symptoms persist, surgical management may be required.2 After hospital discharge, AAD patients are followed closely with medical therapy, serial imaging, and reoperation if necessary.4
Our patient underwent emergent surgery for aortic root/ascending aortic replacement with a mechanical valve. He tolerated the procedure well. Surgical tissue pathology of the aortic segment showed a wall of elastic vessel with medial degeneration and dissection, and the tissue pathology of the aorta leaflets showed valvular tissue with myxoid degeneration.
THE TAKEAWAY
It is critical to keep AAD in the differential diagnosis of a patient presenting with acute onset of chest pain, as AAD often has an atypical presentation and can easily be misdiagnosed. Effective imaging is crucial to diagnosis, and immediate treatment is essential to patient survival.
CORRESPONDENCE
Rachel A. Reedy, PA, University of Florida, Department of General Pediatrics, 7046 SW Archer Road, Gainesville, FL 32608; [email protected]
1. Pineault J, Ouimet D, Pichette V, Vallée M. A case of aortic dissection in a young adult: a refresher of the literature of this “great masquerader.” Int J Gen Med. 2011;4:889-893.
2. Agabegi SS, Agabegi ElD, Ring AC. Diseases of the cardiovascular system. In: Jackson A, ed. Step-up to Medicine. 3rd ed. Lippincott Williams & Wilkins; 2012:54-55.
3. Januzzi JL, Isselbacher EM, Fattori R, et al. Characterizing the young patient with aortic dissection: results from the International Registry of Aortic Dissection (IRAD). J Am Coll Cardiol. 2004;43:665-669.
4. Tsai TT, Trimarchi S, Nienaber CA. Acute aortic dissection: perspectives from the International Registry of Acute Aortic Dissection (IRAD). Eur J Vasc Endovasc Surg. 2009;37:149-159.
5. Trimarchi S, Eagle KA, Nienaber CA, et al. Role of age in acute type A aortic dissection outcome: Report from the International Registry of Acute Aortic Dissection (IRAD). J Thorac Cardiovasc Surg. 2010;140:784-789.
THE CASE
A 20-year-old man presented to our clinic with a 3-day history of nonradiating chest pain located at the center of his chest. Past medical history included idiopathic neonatal giant-cell hepatitis and subsequent liver transplant at 1 month of age; he had been followed by the transplant team without rejection or infection and was in otherwise good health prior to the chest pain.
On the day of symptom onset, he was walking inside his house and fell to his knees with a chest pain described as “a punch” to the center of the chest that lasted for a few seconds. He was able to continue his daily activities without limitation despite a constant, squeezing, centrally located chest pain. The pain worsened with cough and exertion.
A few hours later, he went to an urgent care center for evaluation. There, he reported, his chest radiograph and electrocardiogram (EKG) results were normal and he was given a diagnosis of musculoskeletal chest pain. Over the next 3 days, his chest pain persisted but did not worsen. He was taking 500 mg of naproxen every 8 hours with no improvement. No other acute or chronic medications were being taken. He had no significant family history. A review of systems was otherwise negative.
On physical exam, his vital statistics included a height of 6’4”; weight, 261 lb; body mass index, 31.8; temperature, 98.7 °F; blood pressure, 134/77 mm Hg; heart rate, 92 beats/min; respiratory rate, 18 breaths/min; and oxygen saturation, 96%. Throughout the exam, he demonstrated no acute distress, appeared well, and was talkative; however, he reported having a “constant, squeezing” chest pain that did not worsen with palpation of the chest. The rest of his physical exam was unremarkable.
Although he reported that his EKG and chest radiograph were normal 3 days prior, repeat chest radiograph and EKG were ordered due to his unexplained, active chest pain and the lack of immediate access to the prior results.
THE DIAGNOSIS
The chest radiograph (FIGURE 1A) showed a “mildly ectatic ascending thoracic aorta” that had increased since a chest radiograph from 6 years prior (FIGURE 1B) and “was concerning for an aneurysm.” Computed tomography (CT) angiography (FIGURE 2) then confirmed a 7-cm aneurysm of the ascending aorta, with findings suggestive of a retrograde ascending aortic dissection.
DISCUSSION
The average age of a patient with acute aortic dissection (AAD) is 63 years; only 7% occur in people younger than 40.1 AAD is often accompanied by a predisposing risk factor such as a connective tissue disease, bicuspid aortic valve, longstanding hypertension, trauma, or larger aortic dimensions.2,3 Younger patients are more likely to have predisposing risk factors of Marfan syndrome, prior aortic surgery, or a bicuspid aortic valve.3
Continue to: A literature review did not reveal...
A literature review did not reveal any known correlation between the patient’s history of giant-cell hepatitis or antirejection therapy with thoracic aortic dissection. Furthermore, liver transplant is not known to be a specific risk factor for AAD in pediatric patients or outside the immediate postoperative period. Therefore, there were no known predisposing risk factors for AAD in our patient.
The most common clinical feature of AAD is chest pain, which occurs in 75% of patients.1 Other clinical symptoms include hypertension and diaphoresis.2,4 However, classic clinical findings are not always displayed, making the diagnosis difficult.2,4 The classical description of “tearing pain” is seen in only 51% of patients, and 5% to 15% of patients present without any pain.1
Commonly missed or misdiagnosed. The diagnosis of AAD has been missed during the initial exam in 38% of patients.4 As seen in our case, symptoms may be initially diagnosed as musculoskeletal chest pain. Based on symptoms, AAD can be incorrectly diagnosed as an acute myocardial infarction or vascular embolization.2,4
Every hour after symptom onset, the mortality rate of untreated AAD increases 1% to 2%,with no difference based on age.3,4 Different reports have shown mortality rates between 7% and 30%.4
Effective imaging is crucial to the diagnosis and treatment of AAD, given the occurrence of atypical presentation, missed diagnosis, and high mortality rate.4 A chest radiograph will show a widened mediastinum, but the preferred diagnostic tests are a CT or transthoracic echocardiogram.2,4 Once the diagnosis of AAD is confirmed, an aortic angiogram is the preferred test to determine the extent of the dissection prior to surgical treatment.2
Continue to: Classification dictates treatment
Classification dictates treatment. AAD is classified based on where the dissection of the aorta occurs. If the dissection involves the ascending aorta, it is classified as a type A AAD and should immediately be treated with emergent surgery in order to prevent complications including myocardial infarction, cardiac tamponade, and aortic rupture.2,4,5 If the dissection is limited to the descending aorta, it is classified as a type B AAD and can be medically managed by controlling pain and lowering blood pressure; if symptoms persist, surgical management may be required.2 After hospital discharge, AAD patients are followed closely with medical therapy, serial imaging, and reoperation if necessary.4
Our patient underwent emergent surgery for aortic root/ascending aortic replacement with a mechanical valve. He tolerated the procedure well. Surgical tissue pathology of the aortic segment showed a wall of elastic vessel with medial degeneration and dissection, and the tissue pathology of the aorta leaflets showed valvular tissue with myxoid degeneration.
THE TAKEAWAY
It is critical to keep AAD in the differential diagnosis of a patient presenting with acute onset of chest pain, as AAD often has an atypical presentation and can easily be misdiagnosed. Effective imaging is crucial to diagnosis, and immediate treatment is essential to patient survival.
CORRESPONDENCE
Rachel A. Reedy, PA, University of Florida, Department of General Pediatrics, 7046 SW Archer Road, Gainesville, FL 32608; [email protected]
1. Pineault J, Ouimet D, Pichette V, Vallée M. A case of aortic dissection in a young adult: a refresher of the literature of this “great masquerader.” Int J Gen Med. 2011;4:889-893.
2. Agabegi SS, Agabegi ElD, Ring AC. Diseases of the cardiovascular system. In: Jackson A, ed. Step-up to Medicine. 3rd ed. Lippincott Williams & Wilkins; 2012:54-55.
3. Januzzi JL, Isselbacher EM, Fattori R, et al. Characterizing the young patient with aortic dissection: results from the International Registry of Aortic Dissection (IRAD). J Am Coll Cardiol. 2004;43:665-669.
4. Tsai TT, Trimarchi S, Nienaber CA. Acute aortic dissection: perspectives from the International Registry of Acute Aortic Dissection (IRAD). Eur J Vasc Endovasc Surg. 2009;37:149-159.
5. Trimarchi S, Eagle KA, Nienaber CA, et al. Role of age in acute type A aortic dissection outcome: Report from the International Registry of Acute Aortic Dissection (IRAD). J Thorac Cardiovasc Surg. 2010;140:784-789.

Can viscous fiber lower glycemic markers in type 2 diabetes?
ILLUSTRATIVE CASE
A 57-year-old man who was given a diagnosis of T2D a year ago presents for an office visit. His hemoglobin A1C level at diagnosis was 8.3%. He is otherwise healthy and has been adhering well to a plan of metformin 1000 mg twice daily, regular exercise, and a low-carbohydrate diet you recommended. His most recent hemoglobin A1C is 7.3%. He is pleased with his progress, so he is discouraged when you tell him that he is not yet at goal. He asks if there are other things that he can do to further lower his hemoglobin A1C. What can you recommend for him?
According to the National Diabetes Statistics Report, 2020 from the Centers for Disease Control and Prevention, approximately 34.1 million US adults ≥ 18 years of age (13% of the adult population) have diabetes, 50% of whom have a hemoglobin A1C > 7%. The report also states that approximately 88 million US adults—more than one-third of the population—have prediabetes.2
The American Diabetes Association (ADA) estimated that diabetes-related health care costs in the United States for 2017 totaled $237 billion, an increase of 26% from 2012. More than $30 billion of this expense comes directly from diabetes medications; the remainder of these costs are related to lost wages, clinic visits, hospitalizations, and treatment for diabetic complications and comorbidities. After controlling for age and gender, medical expenditures for people with diabetes are 2.3 times higher than for those without diabetes.3
The 2019
STUDY SUMMARY
Effect on A1C exceeded the FDA threshold for new drugs
This systematic review and meta-analysis searched MEDLINE, Embase, and the Cochrane Central Register of Controlled Trials to identify randomized controlled trials that studied the effects of viscous fiber supplementation on glycemic control in patients with T2D. Eligible studies included those that: (1) had a duration ≥ 3 weeks; (2) allowed isolation of the viscous fiber effects; and (3) reported at least 1 of the following glycemic measures: hemoglobin A1C (n = 1148 patients), fasting glucose (n = 1394), fasting insulin (n = 228),
Data were pooled using the generic inverse variance method and expressed as mean difference (MD) with 95% confidence intervals (CIs). Heterogeneity was assessed and quantified (Cochran Q and I2 statistics, respectively). I2 ≥ 50% indicates substantial heterogeneity. The Grading of Recommendations Assessment, Development, and Evaluation (GRADE) approach was used to evaluate the overall strength of evidence.
Twenty-eight eligible studies were compared. The median age of included patients was 60 years. The median dose of viscous fiber was 13.1 g/d (range, 2.55-21). Viscous fiber type varied between the studies and included psyllium, guar gum, β-glucan, and konjac, and was consumed in powder, tablet, capsule, and limited food-based forms (in 1 of the included studies). The median trial duration was 8 weeks, with 11 trials lasting ≥ 12 weeks.
Continue to: The study found...
The study found moderate-grade evidence that, when added to standard of care, viscous fiber supplementation reduced hemoglobin A1C (MD = –0.58%; 95% CI, –0.88 to –0.28; P = .0002; I2 = 91%), fasting glucose (MD = –14.8 mg/dL; 95% CI, –23.8 to –5.58; P = .001; I2 = 92%), and HOMA-IR (MD = –1.89; 95% CI, –3.45 to –0.33; P = .02; I2 = 94%) compared with control. The effect on hemoglobin A1C exceeds the ≥ 0.3% threshold established by the US Food and Drug Administration for new antihyperglycemic drug development. There was no significant effect on fasting insulin or fructosamine, although the sample size for fructosamine was small. No significant evidence of a dose-dependent response effect was found. The studies had substantial heterogeneity. No evaluation of potential or real harm was noted in the analysis.
WHAT’S NEW
Potential glycemic benefit without large dietary increase
The glucose-lowering effects of increased fiber intake have often been hypothesized, but this meta-analysis is the first to focus specifically on the effect of viscous fiber supplements in patients with T2D. Prior meta-analyses, including those cited in the 2019 ADA recommendations mentioned above, included primarily whole-food dietary sources of fiber in the treatment arms and generally had more modest effects on outcomes.4,6,7
By focusing on viscous fiber supplements, this study isolated the effect of these supplements vs fiber-rich dietary changes. It illustrates a greater potential benefit with supplements than whole-food dietary sources of fiber, and at a lower dose of fiber than was seen in prior studies without requiring substantial increases in caloric intake. Viscous fiber supplementation is a potential adjunct to the usual evidence-based standards of care for glycemic control in patients with T2D.
CAVEATS
Limited study durations may raise uncertainty about long-term benefits
This meta-analysis does have its limitations. The heterogeneity among the studies analyzed makes it difficult to establish a single recommendation regarding dose, type, and brand of fiber to be used. Only 11 of the 28 studies lasted longer than 12 weeks, with a median duration of 8 weeks, making any long-term effects on hemoglobin A1C unknown. No adverse effects or reactions were described to evaluate safety and tolerability of the viscous fiber supplementation. No patient-oriented outcomes were reported.
CHALLENGES TO IMPLEMENTATION
Patients may not be eager to supplement with viscous fiber
The biggest challenge to implementation is patient compliance. Some forms of supplemental fiber are less palatable than others and may cause unpleasant gastrointestinal adverse effects, which may be an impediment for some patients. Cost may also be an issue for some patients. Diabetes medications can be expensive; however, they are often covered, at least partially, by medical insurance. Over-the-counter supplements are unlikely to be covered for most patients.
ACKNOWLEDGEMENT
The PURLs Surveillance System was supported in part by Grant Number UL1RR024999 from the National Center for Research Resources, a Clinical Translational Science Award to the University of Chicago. The content is solely the responsibility of the authors and does not necessarily represent the official views of the National Center for Research Resources or the National Institutes of Health.
1. Jovanovski E, Khayyat R, Zurbau A, et al. Should viscous fiber supplements be considered in diabetes control? Results from a systematic review and meta-analysis of randomized controlled tria ls. Diabetes Care. 2019;42:755-766. Published correction appears in Diabetes Care. 2019;42:1604.
2. CDC. National Diabetes Statistics Report, 2020. Estimates of Diabetes and Its Burden in the United States. Atlanta, GA: Centers for Disease Control and Prevention, US Dept of Health and Human Services; 2020.
3. American Diabetes Association. Economic costs of diabetes in the U.S. in 2017. Diabetes Care. 2018;41:917-928.
4. Evert AB, Dennison M, Gardner CD, et al. Nutrition therapy for adults with diabetes or prediabetes: a consensus report. Diabetes Care. 2019;42:731-754.
5. American Diabetes Association. 5. Lifestyle management: Standards of Medical Care in Diabetes—2019. Diabetes Care. 2019;42(suppl 1):S46-S60.
6. Post RE, Mainous AG III, King DE, et al. Dietary fiber for the treatment of type 2 diabetes mellitus: a meta-analysis. J Am Board Fam Med. 2012;25:16-23.
7. Jenkins DJA, Kendall CWC, Augustin LSA, et al. Effect of legumes as part of a low glycemic index diet on glycemic control and cardiovascular risk factors in type 2 diabetes mellitus: a randomized controlled trial. Arch Intern Med. 2012;172:1653-1660.
ILLUSTRATIVE CASE
A 57-year-old man who was given a diagnosis of T2D a year ago presents for an office visit. His hemoglobin A1C level at diagnosis was 8.3%. He is otherwise healthy and has been adhering well to a plan of metformin 1000 mg twice daily, regular exercise, and a low-carbohydrate diet you recommended. His most recent hemoglobin A1C is 7.3%. He is pleased with his progress, so he is discouraged when you tell him that he is not yet at goal. He asks if there are other things that he can do to further lower his hemoglobin A1C. What can you recommend for him?
According to the National Diabetes Statistics Report, 2020 from the Centers for Disease Control and Prevention, approximately 34.1 million US adults ≥ 18 years of age (13% of the adult population) have diabetes, 50% of whom have a hemoglobin A1C > 7%. The report also states that approximately 88 million US adults—more than one-third of the population—have prediabetes.2
The American Diabetes Association (ADA) estimated that diabetes-related health care costs in the United States for 2017 totaled $237 billion, an increase of 26% from 2012. More than $30 billion of this expense comes directly from diabetes medications; the remainder of these costs are related to lost wages, clinic visits, hospitalizations, and treatment for diabetic complications and comorbidities. After controlling for age and gender, medical expenditures for people with diabetes are 2.3 times higher than for those without diabetes.3
The 2019
STUDY SUMMARY
Effect on A1C exceeded the FDA threshold for new drugs
This systematic review and meta-analysis searched MEDLINE, Embase, and the Cochrane Central Register of Controlled Trials to identify randomized controlled trials that studied the effects of viscous fiber supplementation on glycemic control in patients with T2D. Eligible studies included those that: (1) had a duration ≥ 3 weeks; (2) allowed isolation of the viscous fiber effects; and (3) reported at least 1 of the following glycemic measures: hemoglobin A1C (n = 1148 patients), fasting glucose (n = 1394), fasting insulin (n = 228),
Data were pooled using the generic inverse variance method and expressed as mean difference (MD) with 95% confidence intervals (CIs). Heterogeneity was assessed and quantified (Cochran Q and I2 statistics, respectively). I2 ≥ 50% indicates substantial heterogeneity. The Grading of Recommendations Assessment, Development, and Evaluation (GRADE) approach was used to evaluate the overall strength of evidence.
Twenty-eight eligible studies were compared. The median age of included patients was 60 years. The median dose of viscous fiber was 13.1 g/d (range, 2.55-21). Viscous fiber type varied between the studies and included psyllium, guar gum, β-glucan, and konjac, and was consumed in powder, tablet, capsule, and limited food-based forms (in 1 of the included studies). The median trial duration was 8 weeks, with 11 trials lasting ≥ 12 weeks.
Continue to: The study found...
The study found moderate-grade evidence that, when added to standard of care, viscous fiber supplementation reduced hemoglobin A1C (MD = –0.58%; 95% CI, –0.88 to –0.28; P = .0002; I2 = 91%), fasting glucose (MD = –14.8 mg/dL; 95% CI, –23.8 to –5.58; P = .001; I2 = 92%), and HOMA-IR (MD = –1.89; 95% CI, –3.45 to –0.33; P = .02; I2 = 94%) compared with control. The effect on hemoglobin A1C exceeds the ≥ 0.3% threshold established by the US Food and Drug Administration for new antihyperglycemic drug development. There was no significant effect on fasting insulin or fructosamine, although the sample size for fructosamine was small. No significant evidence of a dose-dependent response effect was found. The studies had substantial heterogeneity. No evaluation of potential or real harm was noted in the analysis.
WHAT’S NEW
Potential glycemic benefit without large dietary increase
The glucose-lowering effects of increased fiber intake have often been hypothesized, but this meta-analysis is the first to focus specifically on the effect of viscous fiber supplements in patients with T2D. Prior meta-analyses, including those cited in the 2019 ADA recommendations mentioned above, included primarily whole-food dietary sources of fiber in the treatment arms and generally had more modest effects on outcomes.4,6,7
By focusing on viscous fiber supplements, this study isolated the effect of these supplements vs fiber-rich dietary changes. It illustrates a greater potential benefit with supplements than whole-food dietary sources of fiber, and at a lower dose of fiber than was seen in prior studies without requiring substantial increases in caloric intake. Viscous fiber supplementation is a potential adjunct to the usual evidence-based standards of care for glycemic control in patients with T2D.
CAVEATS
Limited study durations may raise uncertainty about long-term benefits
This meta-analysis does have its limitations. The heterogeneity among the studies analyzed makes it difficult to establish a single recommendation regarding dose, type, and brand of fiber to be used. Only 11 of the 28 studies lasted longer than 12 weeks, with a median duration of 8 weeks, making any long-term effects on hemoglobin A1C unknown. No adverse effects or reactions were described to evaluate safety and tolerability of the viscous fiber supplementation. No patient-oriented outcomes were reported.
CHALLENGES TO IMPLEMENTATION
Patients may not be eager to supplement with viscous fiber
The biggest challenge to implementation is patient compliance. Some forms of supplemental fiber are less palatable than others and may cause unpleasant gastrointestinal adverse effects, which may be an impediment for some patients. Cost may also be an issue for some patients. Diabetes medications can be expensive; however, they are often covered, at least partially, by medical insurance. Over-the-counter supplements are unlikely to be covered for most patients.
ACKNOWLEDGEMENT
The PURLs Surveillance System was supported in part by Grant Number UL1RR024999 from the National Center for Research Resources, a Clinical Translational Science Award to the University of Chicago. The content is solely the responsibility of the authors and does not necessarily represent the official views of the National Center for Research Resources or the National Institutes of Health.
1. Jovanovski E, Khayyat R, Zurbau A, et al. Should viscous fiber supplements be considered in diabetes control? Results from a systematic review and meta-analysis of randomized controlled tria ls. Diabetes Care. 2019;42:755-766. Published correction appears in Diabetes Care. 2019;42:1604.
2. CDC. National Diabetes Statistics Report, 2020. Estimates of Diabetes and Its Burden in the United States. Atlanta, GA: Centers for Disease Control and Prevention, US Dept of Health and Human Services; 2020.
3. American Diabetes Association. Economic costs of diabetes in the U.S. in 2017. Diabetes Care. 2018;41:917-928.
4. Evert AB, Dennison M, Gardner CD, et al. Nutrition therapy for adults with diabetes or prediabetes: a consensus report. Diabetes Care. 2019;42:731-754.
5. American Diabetes Association. 5. Lifestyle management: Standards of Medical Care in Diabetes—2019. Diabetes Care. 2019;42(suppl 1):S46-S60.
6. Post RE, Mainous AG III, King DE, et al. Dietary fiber for the treatment of type 2 diabetes mellitus: a meta-analysis. J Am Board Fam Med. 2012;25:16-23.
7. Jenkins DJA, Kendall CWC, Augustin LSA, et al. Effect of legumes as part of a low glycemic index diet on glycemic control and cardiovascular risk factors in type 2 diabetes mellitus: a randomized controlled trial. Arch Intern Med. 2012;172:1653-1660.
PRACTICE CHANGER
Unless contraindicated, recommend viscous fiber supplementation to your patients with type 2 diabetes (T2D), in addition to the usual evidence-based standards of care, to improve markers of glycemic control.
STRENGTH OF RECOMMENDATION
C: Based on a meta-analysis and systematic review of 28 randomized controlled trials, without discussion of patient-oriented outcomes.1
Jovanovski E, Khayyat R, Zurbau A, et al. Should viscous fiber supplements be considered in diabetes control? Results from a systematic review and meta-analysis of randomized controlled trials. Diabetes Care. 2019;42:755-766. Published correction appears in Diabetes Care. 2019;42:1604.

Atopic dermatitis: More than just a rash
Atopic dermatitis (AD), also known as eczema, is a chronic inflammatory skin condition that is well known for its relapsing, pruritic rash in children and adults. Less recognized are its associated conditions—allergic rhinitis, asthma, food allergies, attention-deficit/hyperactivity disorder (ADHD), depression, and anxiety—and its burden on patients and their families. In fact, families that have children with AD report lower overall quality of life than those with otherwise healthy children.1 Given AD’s prevalence across age groups and its effect on the family, family physicians are uniquely positioned to diagnose, care for, and counsel patients with AD and its associated maladies.
The prevalence and pathogenesis of AD
AD affects up to 20% of children and 5% of adults in the United States.2 AD typically manifests before a child reaches age 5 (often in the first 6 months of life), and it is slightly more common in females (1.3:1). A family history of atopy (eczema, asthma, allergic rhinitis) is common. In fact, children with one atopic parent have a 2- to 3-fold increased risk of atopic dermatitis; those with 2 atopic parents have a 3- to 5-fold increased risk.3
The pathophysiology of AD is complex, culminating in impaired barrier function of the skin and transepidermal water loss resulting in dry and inflamed skin. Additionally, alterations in a cell-mediated immune response leading to an immunoglobulin (Ig) E-mediated hypersensitivity is also theorized to play a role in the development of AD.
Signs and symptoms
Signs at birth. Physical signs of atopic dermatitis typically appear between birth and 6 months. In infancy, lesions generally occur on the scalp, face (FIGURES 1A and 1B), neck, and extensor surfaces of the extremities. Lesions are typically papules and vesicles, sometimes accompanied by serous exudate and crusting. Eczematous lesions typically spare the groin and diaper area, and their presence in this area should raise suspicion for an alternative diagnosis.

Beginning at age 2 years, eczematous lesions are more commonly limited to the folds of the flexor surfaces. Instead of the weeping and crusting lesions seen in infancy, eczema in older children manifests as dry, lichenified papules and plaques in areas that are typically affected in adults: the wrist, hands, ankles, and popliteal and antecubital fossa.2
Although lesions in adults are similar to those of childhood, they may manifest in a more localized area (hand or eyelid, for example). As is the case in childhood, the lesions are dry, sometimes lichenified, and found on the flexural surfaces (FIGURES 2A and 2B).2

Symptom triggers are unproven
While anecdotal reports cite various triggers for AD flares, a systematic review found little scientific evidence to substantiate identifiable triggers.4 Triggers often cited and studied are foods, dust mite exposure, airborne allergens, detergents, sunlight, fabrics, bacterial infections, and stress. While as many as one-third of people with AD who also have confirmed dust mite allergy report worsening of symptoms when exposed to dust, a Cochrane review of 7 randomized controlled trials totaling 324 adults and children with eczema found that efforts at dust mite mitigation (laundering of bed covers, increased vacuuming, spraying for mites) were not effective in reducing symptoms.5
Continue to: How quality of life diminishes with AD
How quality of life diminishes with AD
AD substantially lessens quality of life. For children, the most distressing physical symptoms include itching that inhibits sleep and provokes scratching, pain, and bleeding. Emotional distress can cause irritability, crying, and uncooperativeness with treatments. Parents also report that they frequently restrict their children from activities, such as playing in the heat or swimming, that may lead to worsening of their eczema.6
The loss of sleep associated with AD is not completely understood but is likely multifactorial. Pruritus and scratching leading to sleeplessness is the most obvious culprit, but an altered circadian rhythm, immune system response, and changes in skin physiology are also likely factors.7 Whatever the cause, sleep disturbance is reported in as many as 60% of patients with AD, and the degree of sleep disturbance is proportional to increases in disease severity and worsening of quality-of-life scores.8 Lost sleep is not limited to patients; parents of children with AD also report significant loss of sleep and subsequent decreased work productivity and quality of life.9
Children with AD are often the target of bullying.10 A 2015 survey by the National Eczema Association indicates that 1 in 5 children reported being bullied due to their AD.11
Associated conditions and comorbidities
AD increases patients’ risks for other illnesses, due either to their underlying atopy or to the effects of

Atopic march
Atopic march—the clinical succession of AD, allergic rhinitis, and asthma—is a well-established clinical progression. The presence of all 3 conditions appears to be more common in children diagnosed with AD before 2 years of age.12 Typically, allergic rhinitis manifests at around age 4, and asthma develops between ages 6 and 8. The severity of AD predicts progression. Compared with an 8% chance of asthma developing among the general population, children with mild AD have a 20% to 30% chance of developing asthma, and those with severe AD have about a 70% chance.12
Continue to: Food allergies
Food allergies
Patients with AD are at higher risk for food-induced anaphylaxis, with up to one-third of AD patients having an IgE-mediated food allergy.13 While it is theorized that the impaired skin barrier of an atopic child may allow for early sensitization and allergy development, a landmark 2015 study demonstrated that early allergen introduction (specifically, peanuts) may serve as a preventive strategy in those at high risk of food allergies.14 Current guidelines recommend that physicians be aware of the increased possibility of food allergies in those with AD, and consider evaluating a child for milk, egg, peanut, wheat, and soy allergy if the child is younger than 5 years and has eczema that does not resolve with treatment, or has eczema and a history of an allergic reaction to a specific food.15
Interestingly, despite the strong association between AD and food allergies, it is not clear that food allergies trigger atopic flares; as such, elimination diets are not universally recommended in those without a proven food allergy.
Psychiatric diagnoses
Children with AD have an increased prevalence of several psychiatric conditions, including ADHD, depression, anxiety, conduct disorder, and autism when compared with peers who do not have AD, and the probability correlates with the severity of AD
What we do know is that one of the strongest associations between AD and a psychiatric condition is with ADHD, with a recent pooled meta-analysis showing a 46% increase in risk.17 The incidence of depression among children with AD appears to correlate with the severity of AD symptoms: estimated at 5% with mild AD, 7% with moderate disease, and 14% with severe disease (compared with 3% without AD). Similar incremental increases are seen when correlating AD and anxiety.16
Nonpharmacologic care
Bathing
Bathing habits are critical to controlling AD. While bathing serves to both hydrate the skin and remove allergens, the water’s evaporation off the skin surface can lead to increased transepidermal water loss. Combining bathing and immediate application of a moisturizer improves skin hydration in patients with AD vs bathing alone.18 Thus, consensus guidelines recommend once-daily bathing (bath or shower) to remove scale and crust, followed by immediate application of a moisturizing emollient.19
Continue to: Emollients
Emollients
Application of moisturizing emollients is the mainstay of nonpharmacologic care of AD, and there is strong evidence that their regimented use reduces disease burden and the need for prescription treatment.19 Emollient creams and ointments help retain moisture and improve the skin’s barrier. While ointments may provide a better barrier, patients tend to prefer creams as they are less greasy than ointments.
Emollient therapy may also help prevent development of AD, especially in those infants thought to be at high risk with a family history of atopy. In a multinational randomized controlled trial, infants who received daily full-body application of emollient beginning at 3 weeks of life were significantly less likely than controls to develop AD by 6 months.20 While the mechanism of action is not clearly understood, it is believed that early emollient use prevents skin dehydration and maintains the skin’s barrier integrity, thus decreasing allergen epidermal penetration and subsequent inflammation.
Bleach bath
A bleach bath, prepared by adding 1/2 cup of unconcentrated bleach (5.25% sodium hypochlorite) to a standard 40-gallon bathtub, produces a chlorine mixture equivalent to an average swimming pool. Soaking in a bleach bath for 10 minutes once or twice weekly is thought to reduce inflammation and bacteria on the skin, but studies of its efficacy in improving atopic symptoms are mixed.
In a pooled analysis of 5 studies evaluating bleach baths vs standard baths, there was no significant difference in disease severity at 4 weeks.21 Thus, while bleach baths were effective in decreasing disease severity, they appeared to be no more effective than a standard water bath.21 Bleach baths may be helpful, however, in cases of moderate-to-severe disease with frequent bacterial infections.19
Pharmacologic therapy
Steroids
For symptoms refractory to nonpharmacologic skin care, topical steroids are the initial pharmacologic treatment for AD.19 Choose steroid potency based on symptom severity and disease location. Low- to medium-potency is appropriate for mild disease, and medium- to high-potency is useful for moderate-to-severe symptoms. High-potency steroids are generally avoided on the face and skin folds; however, they can be used for short periods in these areas to induce remission. They must then be quickly tapered and discontinued.
Continue to: Frequency
Frequency. Topical corticosteroids are typically applied twice daily, although recent studies indicate that once-daily application is just as efficacious.22 In addition to treatment of an acute flare, topical steroids are useful as maintenance therapy for patients with recurrent outbreaks in the same anatomical site. Guidelines suggest once- or twice-weekly application of a medium-potency steroid to prolong time between flares.19
For children, a practical guide is for caregivers to apply the amount of steroid covering 1 adult fingertip to an area of the child’s skin equal to that of 2 adult palms.23 Topical steroids are generally well tolerated and have a good safety profile. Adverse effects are proportional to the amount and duration of use and include purpura, telangiectasias, striae, and skin atrophy. The risk of skin atrophy increases with higher potency steroids, occlusion (covering affected area after steroid application), use on thin-skinned areas, and older patient age.24
Reassure patients/parents about the safety of topical steroids, as fears regarding the potential adverse effects can limit compliance. In one study of 200 patients with AD, 72.5% of respondents expressed fear of using steroids on their own skin or that of their child, and 24% admitted being noncompliant with therapy based on these concerns.25
Treating flares. Oral steroids are sometimes needed to abort or control an AD flare in older children and adults. A tapering course of prednisone over 5 to 7 days, transitioning to medium- to high-dose topical steroids, may be needed to achieve symptom control.
Topical calcineurin inhibitors
Topical calcineurin inhibitors, including tacrolimus and pimecrolimus, are generally second-line therapy to topical corticosteroids. However, as nonsteroidal agents, topical calcineurin inhibitors do not cause skin atrophy and can be a first-line option in areas where atrophy is more common (face, eyelids, neck, and skin folds).26
Continue to: A Cochrane review found...
A Cochrane review found tacrolimus 0.1% to be better than low‐potency topical corticosteroids on the face and neck areas, while results were equivocal when compared with moderate‐potency topical corticosteroids on the trunk and extremities (no difference based on physician assessment, but marginal benefit favoring tacrolimus based on participant scoring).27 When compared head-to-head, tacrolimus was more effective than pimecrolimus, although tacrolimus has a higher rate of local irritation. The most common adverse effects are stinging and burning at the application site, although these adverse effects generally improve with repeated application.
There have been long-term safety concerns with topical calcineurin inhibitors—chiefly a 2006 Food and Drug Administration (FDA) black box warning regarding a possible link between topical calcineurin inhibitors and cancer. However, while there may be a slight increased risk of lymphoma in AD patients, a recent meta-analysis did not find an association between topical calcineurin inhibitors use and lymphoma.28 Given the initial concern—and pending additional data—the FDA currently recommends reserving topical calcineurin inhibitors for second-line therapy and only for the minimum amount of time to induce improvement. It also recommends avoiding their use in patients younger than 2 years and in those with compromised immune systems.
Cisaborole
Cisaborole, a topical phosphodiesterase 4 (PDE4) inhibitor, received FDA approval in 2016 for mild-to-moderate AD. By inhibiting PDE4, the drug limits inflammation. In a multicenter randomized trial, patients applying cisaborole 2% twice a day noted reductions in pruritus, inflammation, excoriation, and lichenification.29 Adverse effects are minimal and limited to application site irritation.
Systemic treatments
While beyond the care of a family physician, symptoms refractory to conservative, nonpharmacologic measures and combinations of topical pharmaceuticals can be treated with systemic immunomodulators such as cyclosporine, azathioprine, and methotrexate. Phototherapy is also effective in patients with more widespread skin involvement. Dupilumab, an injectable monoclonal antibody that binds to interleukin-4 receptor and inhibits inflammation, is approved to treat moderate-to-severe AD in adults.30
Ineffective therapies: Oral montelukast and probiotics
While oral antihistamines are frequently prescribed and used, there are no studies evaluating the use of antihistamines (H1) as monotherapy for AD.31 Nonetheless, while not altering the disease process, the sedative effect of antihistamines may palliate the nocturnal pruritus frequently associated with AD. Although nonsedating antihistamines may still have a role for atopic patients with concurrent seasonal and environmental allergies, there is no evidence to support their use in the treatment of AD.
Continue to: Data are limited...
Data are limited on the effectiveness of leukotriene receptor antagonists for AD, and all studies meeting inclusion for a Cochrane review assessed oral montelukast. The review found no benefit with the use of montelukast 10 mg in terms of severity of disease, pruritus, or need for topical steroids.32
A systematic review investigating the benefit of probiotics for the treatment of AD found no improvement in patient-rated eczema scores for quality of life.33 Additionally, a review of 11 randomized controlled trials including 596 participants found no evidence to suggest efficacy of fish oil, zinc, selenium, vitamin D, vitamin E, pyridoxine, sea buckthorn oil, hempseed oil, or sunflower oil in the treatment of AD.34
Education can reduce AD severity
Family physicians can be a source of education and support for patients and families of patients with AD. Support programs for adults with AD—including education, relaxation techniques, and cognitive behavioral therapy—have been shown to decrease disease severity.35 Comparable improvement in disease severity has been demonstrated in children with AD when similar education is provided to them and their families.
CORRESPONDENCE
Franklin Berkey, DO, Penn State Health, 1850 East Park Avenue, Suite 207, State College, PA 16803; fberkey@ pennstatehealth.psu.edu.
1. Carroll CL, Balkrishnan R, Feldman SR, et al. The burden of atopic dermatitis: impact on the patient, family, and society. Pediatr Dermatol. 2005;22:192-199.
2. Ahn C, Huang W. Clinical presentation of atopic dermatitis. In: Fortson E, Feldman SR, Stroud LC, eds. Management of Atopic Dermatitis: Methods and Challenges. Springer International Publishing; 2017:38-46.
3. Eichenfield LF, Tom WL, Chamblin SL, et al. Guidelines of care for the management of atopic dermatitis. Part 1: diagnosis and assessment of atopic dermatitis. J Am Acad Dermatol. 2014;70:338-351.
4. Langan SM, Williams HC. What causes worsening of eczema? A systematic review. Br J Dermatol. 2006;155:504-514.
5. Nankervis H, Pynn EV, Boyle RJ, et al. House dust mite reduction and avoidance measures for treating eczema. Cochrane Database Syst Rev. 2015:CD008426.
6. Chamlin SL, Frieden IJ, Williams ML, et al. Effects of atopic dermatitis on young American children and their families. Pediatrics. 2004;114:607-611.
7. Chang Y-S, Chiang B-L. Mechanism of sleep disturbance in children with atopic dermatitis and the role of the circadian rhythm and melatonin. Int J Mol Sci. 2016;17:462.
8. Camfferman D, Kennedy JD, Gold M, et al. Eczema and sleep and its relationship to daytime functioning in children. Sleep Med Rev. 2010;14:359-369.
9. Chamlin SL, Mattson CL, Frieden IJ, et al. The price of pruritus: sleep disturbance and cosleeping in atopic dermatitis. Arch Pediatr Adolesc Med. 2005;159:745-750.
10. Drucker AM, Wang AR, Li W-Q, et al. The burden of atopic dermatitis: summary of a report for the National Eczema Association. J Invest Dermatol. 2017;137:P26-P30.
11. National Eczema Association. Tools for school: addressing school bullying for kids with eczema. Accessed January 5, 2021. https://nationaleczema.org/children-with-eczema-experience-bullying/
12. Bantz SK, Zhu Z, Zhen T. The atopic march: progression from atopic dermatitis to allergic rhinitis and asthma. J Clin Cell Immunol. 2014;5:202
13. Laird M, Sicco KL. Defining and measuring the scope of atopic dermatitis. Adv Exp Med Biol. 2017;1027:93-104.
14. Du Toit G, Roberts G, Sayre PH, et al. Randomized trial of peanut consumption in infants at risk for peanut allergy. N Engl J Med. 2015;372:803-813.
15. Boyce JA, Assa’ad A, Burks AW, et al. Guidelines for the diagnosis and management of food allergy in the United States: report of the NIAID-sponsored expert panel. J Allergy Clin Immunol. 2010;126:S1–S58.
16. Yaghmaie P, Koudelka CW, Simpson EL. Mental health comorbidity in patients with atopic dermatitis. J Allergy Clin Immunol. 2013;131:428-433.
17. Strom MA, Fishbein AB, Paller AS, et al. Association between atopic dermatitis and attention deficit hyperactivity disorder in U.S. children and adults. Br J Dermatol. 2016;175:920-929.
18. Chiang C, Eichenfield LF. Quantitative assessment of combination bathing and moisturizing regimens on skin hydration in atopic dermatitis. Pediatr Dermatol. 2009;26:273-278.
19. Eichenfield LF, Tom WL, Berger TG, et al. Guidelines of care for the management of atopic dermatitis: section 2. Management and treatment of atopic dermatitis with topical therapies. J Am Acad Dermatol. 2014;71:116-132.
20. Simpson EL, Chalmers JR, Hanifin JM, et al. Emollient enhancement of the skin barrier from birth offers effective atopic dermatitis prevention. J Allergy Clin Immunol. 2014;134:818-823.
21. Chopra R, Vakharia PP, Sacotte R, et al. Efficacy of bleach baths in reducing severity of atopic dermatitis: a systematic review and meta-analysis. Ann Allergy Asthma Immunol. 2017;119:435-440.
22. Williams HC. Established corticosteroid creams should be applied only once daily in patients with atopic eczema. BMJ. 2007;334:1272.
23. Long CC, Mills CM, Finlay AY. A practical guide to topical therapy in children. Br J Dermatol. 1998;138:293-296.
24. Callen J, Chamlin S, Eichenfield LF, et al. A systematic review of the safety of topical therapies for atopic dermatitis. Br J Dermatol. 2007;156:203-221.
25. Charman CR, Morris AD, Williams HC. Topical corticosteroid phobia in patients with atopic eczema. Br J Dermatol. 2000;142:931-936.
26. Ashcroft DM, Dimmock P, Garside R, et al. Efficacy and tolerability of topical pimecrolimus and tacrolimus in the treatment of atopic dermatitis: a meta-analysis of randomised controlled trials. BMJ. 2005;330:516.
27. Cury Martins J, Martins C, Aoki V, et al. Topical tacrolimus for atopic dermatitis. Cochrane Database Syst Rev. 2015:CD009864.
28. Legendre L, Barnetche T, Mazereeuw-Hautier J, et al. Risk of lymphoma in patients with atopic dermatitis and the role of topical treatment: a systematic review and meta-analysis. J Am Acad Dermatol. 2015;72:992-1002.
29. Paller AS, Tom WL, Lebwohl MG, et al. Efficacy and safety of crisaborole ointment, a novel, nonsteroidal phosphodiesterase 4 (PDE4) inhibitor for the topical treatment of atopic dermatitis (AD) in children and adults. J Am Acad Dermatol. 2016;75:494-503.
30. Dupilumab [package insert]. Tarrytown, NY: Regeneron Pharmaceuticals Inc; 2017.
31. van Zuuren EJ, Apfelbacher CJ, Fedorowicz Z, et al. No high level evidence to support the use of oral H1 antihistamines as monotherapy for eczema: a summary of a Cochrane systematic review. Syst Rev. 2014;3:25.
32. Ferguson L, Futamura M, Vakirlis E, et al. Leukotriene receptor antagonists for eczema. Cochrane Database Syst Rev. 2018:CD011224.
33. Makrgeorgou A, Leonardi-Bee J, Bath-Hextall FJ, et al. Probiotics for treating eczema. Cochrane Database Syst Rev. 2018:CD006135.
34. Bath-Hextall FJ, Jenkinson C, Humphreys R, et al. Dietary supplements for established atopic eczema. Cochrane Database Syst Rev. 2012:CD005205.
35. Sy W, Lamb AJ. Atopic dermatitis disease education. In: Fortson E, Feldman SR, Stroud LC, eds. Management of Atopic Dermatitis: Methods and Challenges. Springer International Publishing; 2017:179-184.
Atopic dermatitis (AD), also known as eczema, is a chronic inflammatory skin condition that is well known for its relapsing, pruritic rash in children and adults. Less recognized are its associated conditions—allergic rhinitis, asthma, food allergies, attention-deficit/hyperactivity disorder (ADHD), depression, and anxiety—and its burden on patients and their families. In fact, families that have children with AD report lower overall quality of life than those with otherwise healthy children.1 Given AD’s prevalence across age groups and its effect on the family, family physicians are uniquely positioned to diagnose, care for, and counsel patients with AD and its associated maladies.
The prevalence and pathogenesis of AD
AD affects up to 20% of children and 5% of adults in the United States.2 AD typically manifests before a child reaches age 5 (often in the first 6 months of life), and it is slightly more common in females (1.3:1). A family history of atopy (eczema, asthma, allergic rhinitis) is common. In fact, children with one atopic parent have a 2- to 3-fold increased risk of atopic dermatitis; those with 2 atopic parents have a 3- to 5-fold increased risk.3
The pathophysiology of AD is complex, culminating in impaired barrier function of the skin and transepidermal water loss resulting in dry and inflamed skin. Additionally, alterations in a cell-mediated immune response leading to an immunoglobulin (Ig) E-mediated hypersensitivity is also theorized to play a role in the development of AD.
Signs and symptoms
Signs at birth. Physical signs of atopic dermatitis typically appear between birth and 6 months. In infancy, lesions generally occur on the scalp, face (FIGURES 1A and 1B), neck, and extensor surfaces of the extremities. Lesions are typically papules and vesicles, sometimes accompanied by serous exudate and crusting. Eczematous lesions typically spare the groin and diaper area, and their presence in this area should raise suspicion for an alternative diagnosis.
Beginning at age 2 years, eczematous lesions are more commonly limited to the folds of the flexor surfaces. Instead of the weeping and crusting lesions seen in infancy, eczema in older children manifests as dry, lichenified papules and plaques in areas that are typically affected in adults: the wrist, hands, ankles, and popliteal and antecubital fossa.2
Although lesions in adults are similar to those of childhood, they may manifest in a more localized area (hand or eyelid, for example). As is the case in childhood, the lesions are dry, sometimes lichenified, and found on the flexural surfaces (FIGURES 2A and 2B).2
Symptom triggers are unproven
While anecdotal reports cite various triggers for AD flares, a systematic review found little scientific evidence to substantiate identifiable triggers.4 Triggers often cited and studied are foods, dust mite exposure, airborne allergens, detergents, sunlight, fabrics, bacterial infections, and stress. While as many as one-third of people with AD who also have confirmed dust mite allergy report worsening of symptoms when exposed to dust, a Cochrane review of 7 randomized controlled trials totaling 324 adults and children with eczema found that efforts at dust mite mitigation (laundering of bed covers, increased vacuuming, spraying for mites) were not effective in reducing symptoms.5
Continue to: How quality of life diminishes with AD
How quality of life diminishes with AD
AD substantially lessens quality of life. For children, the most distressing physical symptoms include itching that inhibits sleep and provokes scratching, pain, and bleeding. Emotional distress can cause irritability, crying, and uncooperativeness with treatments. Parents also report that they frequently restrict their children from activities, such as playing in the heat or swimming, that may lead to worsening of their eczema.6
The loss of sleep associated with AD is not completely understood but is likely multifactorial. Pruritus and scratching leading to sleeplessness is the most obvious culprit, but an altered circadian rhythm, immune system response, and changes in skin physiology are also likely factors.7 Whatever the cause, sleep disturbance is reported in as many as 60% of patients with AD, and the degree of sleep disturbance is proportional to increases in disease severity and worsening of quality-of-life scores.8 Lost sleep is not limited to patients; parents of children with AD also report significant loss of sleep and subsequent decreased work productivity and quality of life.9
Children with AD are often the target of bullying.10 A 2015 survey by the National Eczema Association indicates that 1 in 5 children reported being bullied due to their AD.11
Associated conditions and comorbidities
AD increases patients’ risks for other illnesses, due either to their underlying atopy or to the effects of
Atopic march
Atopic march—the clinical succession of AD, allergic rhinitis, and asthma—is a well-established clinical progression. The presence of all 3 conditions appears to be more common in children diagnosed with AD before 2 years of age.12 Typically, allergic rhinitis manifests at around age 4, and asthma develops between ages 6 and 8. The severity of AD predicts progression. Compared with an 8% chance of asthma developing among the general population, children with mild AD have a 20% to 30% chance of developing asthma, and those with severe AD have about a 70% chance.12
Continue to: Food allergies
Food allergies
Patients with AD are at higher risk for food-induced anaphylaxis, with up to one-third of AD patients having an IgE-mediated food allergy.13 While it is theorized that the impaired skin barrier of an atopic child may allow for early sensitization and allergy development, a landmark 2015 study demonstrated that early allergen introduction (specifically, peanuts) may serve as a preventive strategy in those at high risk of food allergies.14 Current guidelines recommend that physicians be aware of the increased possibility of food allergies in those with AD, and consider evaluating a child for milk, egg, peanut, wheat, and soy allergy if the child is younger than 5 years and has eczema that does not resolve with treatment, or has eczema and a history of an allergic reaction to a specific food.15
Interestingly, despite the strong association between AD and food allergies, it is not clear that food allergies trigger atopic flares; as such, elimination diets are not universally recommended in those without a proven food allergy.
Psychiatric diagnoses
Children with AD have an increased prevalence of several psychiatric conditions, including ADHD, depression, anxiety, conduct disorder, and autism when compared with peers who do not have AD, and the probability correlates with the severity of AD
What we do know is that one of the strongest associations between AD and a psychiatric condition is with ADHD, with a recent pooled meta-analysis showing a 46% increase in risk.17 The incidence of depression among children with AD appears to correlate with the severity of AD symptoms: estimated at 5% with mild AD, 7% with moderate disease, and 14% with severe disease (compared with 3% without AD). Similar incremental increases are seen when correlating AD and anxiety.16
Nonpharmacologic care
Bathing
Bathing habits are critical to controlling AD. While bathing serves to both hydrate the skin and remove allergens, the water’s evaporation off the skin surface can lead to increased transepidermal water loss. Combining bathing and immediate application of a moisturizer improves skin hydration in patients with AD vs bathing alone.18 Thus, consensus guidelines recommend once-daily bathing (bath or shower) to remove scale and crust, followed by immediate application of a moisturizing emollient.19
Continue to: Emollients
Emollients
Application of moisturizing emollients is the mainstay of nonpharmacologic care of AD, and there is strong evidence that their regimented use reduces disease burden and the need for prescription treatment.19 Emollient creams and ointments help retain moisture and improve the skin’s barrier. While ointments may provide a better barrier, patients tend to prefer creams as they are less greasy than ointments.
Emollient therapy may also help prevent development of AD, especially in those infants thought to be at high risk with a family history of atopy. In a multinational randomized controlled trial, infants who received daily full-body application of emollient beginning at 3 weeks of life were significantly less likely than controls to develop AD by 6 months.20 While the mechanism of action is not clearly understood, it is believed that early emollient use prevents skin dehydration and maintains the skin’s barrier integrity, thus decreasing allergen epidermal penetration and subsequent inflammation.
Bleach bath
A bleach bath, prepared by adding 1/2 cup of unconcentrated bleach (5.25% sodium hypochlorite) to a standard 40-gallon bathtub, produces a chlorine mixture equivalent to an average swimming pool. Soaking in a bleach bath for 10 minutes once or twice weekly is thought to reduce inflammation and bacteria on the skin, but studies of its efficacy in improving atopic symptoms are mixed.
In a pooled analysis of 5 studies evaluating bleach baths vs standard baths, there was no significant difference in disease severity at 4 weeks.21 Thus, while bleach baths were effective in decreasing disease severity, they appeared to be no more effective than a standard water bath.21 Bleach baths may be helpful, however, in cases of moderate-to-severe disease with frequent bacterial infections.19
Pharmacologic therapy
Steroids
For symptoms refractory to nonpharmacologic skin care, topical steroids are the initial pharmacologic treatment for AD.19 Choose steroid potency based on symptom severity and disease location. Low- to medium-potency is appropriate for mild disease, and medium- to high-potency is useful for moderate-to-severe symptoms. High-potency steroids are generally avoided on the face and skin folds; however, they can be used for short periods in these areas to induce remission. They must then be quickly tapered and discontinued.
Continue to: Frequency
Frequency. Topical corticosteroids are typically applied twice daily, although recent studies indicate that once-daily application is just as efficacious.22 In addition to treatment of an acute flare, topical steroids are useful as maintenance therapy for patients with recurrent outbreaks in the same anatomical site. Guidelines suggest once- or twice-weekly application of a medium-potency steroid to prolong time between flares.19
For children, a practical guide is for caregivers to apply the amount of steroid covering 1 adult fingertip to an area of the child’s skin equal to that of 2 adult palms.23 Topical steroids are generally well tolerated and have a good safety profile. Adverse effects are proportional to the amount and duration of use and include purpura, telangiectasias, striae, and skin atrophy. The risk of skin atrophy increases with higher potency steroids, occlusion (covering affected area after steroid application), use on thin-skinned areas, and older patient age.24
Reassure patients/parents about the safety of topical steroids, as fears regarding the potential adverse effects can limit compliance. In one study of 200 patients with AD, 72.5% of respondents expressed fear of using steroids on their own skin or that of their child, and 24% admitted being noncompliant with therapy based on these concerns.25
Treating flares. Oral steroids are sometimes needed to abort or control an AD flare in older children and adults. A tapering course of prednisone over 5 to 7 days, transitioning to medium- to high-dose topical steroids, may be needed to achieve symptom control.
Topical calcineurin inhibitors
Topical calcineurin inhibitors, including tacrolimus and pimecrolimus, are generally second-line therapy to topical corticosteroids. However, as nonsteroidal agents, topical calcineurin inhibitors do not cause skin atrophy and can be a first-line option in areas where atrophy is more common (face, eyelids, neck, and skin folds).26
Continue to: A Cochrane review found...
A Cochrane review found tacrolimus 0.1% to be better than low‐potency topical corticosteroids on the face and neck areas, while results were equivocal when compared with moderate‐potency topical corticosteroids on the trunk and extremities (no difference based on physician assessment, but marginal benefit favoring tacrolimus based on participant scoring).27 When compared head-to-head, tacrolimus was more effective than pimecrolimus, although tacrolimus has a higher rate of local irritation. The most common adverse effects are stinging and burning at the application site, although these adverse effects generally improve with repeated application.
There have been long-term safety concerns with topical calcineurin inhibitors—chiefly a 2006 Food and Drug Administration (FDA) black box warning regarding a possible link between topical calcineurin inhibitors and cancer. However, while there may be a slight increased risk of lymphoma in AD patients, a recent meta-analysis did not find an association between topical calcineurin inhibitors use and lymphoma.28 Given the initial concern—and pending additional data—the FDA currently recommends reserving topical calcineurin inhibitors for second-line therapy and only for the minimum amount of time to induce improvement. It also recommends avoiding their use in patients younger than 2 years and in those with compromised immune systems.
Cisaborole
Cisaborole, a topical phosphodiesterase 4 (PDE4) inhibitor, received FDA approval in 2016 for mild-to-moderate AD. By inhibiting PDE4, the drug limits inflammation. In a multicenter randomized trial, patients applying cisaborole 2% twice a day noted reductions in pruritus, inflammation, excoriation, and lichenification.29 Adverse effects are minimal and limited to application site irritation.
Systemic treatments
While beyond the care of a family physician, symptoms refractory to conservative, nonpharmacologic measures and combinations of topical pharmaceuticals can be treated with systemic immunomodulators such as cyclosporine, azathioprine, and methotrexate. Phototherapy is also effective in patients with more widespread skin involvement. Dupilumab, an injectable monoclonal antibody that binds to interleukin-4 receptor and inhibits inflammation, is approved to treat moderate-to-severe AD in adults.30
Ineffective therapies: Oral montelukast and probiotics
While oral antihistamines are frequently prescribed and used, there are no studies evaluating the use of antihistamines (H1) as monotherapy for AD.31 Nonetheless, while not altering the disease process, the sedative effect of antihistamines may palliate the nocturnal pruritus frequently associated with AD. Although nonsedating antihistamines may still have a role for atopic patients with concurrent seasonal and environmental allergies, there is no evidence to support their use in the treatment of AD.
Continue to: Data are limited...
Data are limited on the effectiveness of leukotriene receptor antagonists for AD, and all studies meeting inclusion for a Cochrane review assessed oral montelukast. The review found no benefit with the use of montelukast 10 mg in terms of severity of disease, pruritus, or need for topical steroids.32
A systematic review investigating the benefit of probiotics for the treatment of AD found no improvement in patient-rated eczema scores for quality of life.33 Additionally, a review of 11 randomized controlled trials including 596 participants found no evidence to suggest efficacy of fish oil, zinc, selenium, vitamin D, vitamin E, pyridoxine, sea buckthorn oil, hempseed oil, or sunflower oil in the treatment of AD.34
Education can reduce AD severity
Family physicians can be a source of education and support for patients and families of patients with AD. Support programs for adults with AD—including education, relaxation techniques, and cognitive behavioral therapy—have been shown to decrease disease severity.35 Comparable improvement in disease severity has been demonstrated in children with AD when similar education is provided to them and their families.
CORRESPONDENCE
Franklin Berkey, DO, Penn State Health, 1850 East Park Avenue, Suite 207, State College, PA 16803; fberkey@ pennstatehealth.psu.edu.
1. Carroll CL, Balkrishnan R, Feldman SR, et al. The burden of atopic dermatitis: impact on the patient, family, and society. Pediatr Dermatol. 2005;22:192-199.
2. Ahn C, Huang W. Clinical presentation of atopic dermatitis. In: Fortson E, Feldman SR, Stroud LC, eds. Management of Atopic Dermatitis: Methods and Challenges. Springer International Publishing; 2017:38-46.
3. Eichenfield LF, Tom WL, Chamblin SL, et al. Guidelines of care for the management of atopic dermatitis. Part 1: diagnosis and assessment of atopic dermatitis. J Am Acad Dermatol. 2014;70:338-351.
4. Langan SM, Williams HC. What causes worsening of eczema? A systematic review. Br J Dermatol. 2006;155:504-514.
5. Nankervis H, Pynn EV, Boyle RJ, et al. House dust mite reduction and avoidance measures for treating eczema. Cochrane Database Syst Rev. 2015:CD008426.
6. Chamlin SL, Frieden IJ, Williams ML, et al. Effects of atopic dermatitis on young American children and their families. Pediatrics. 2004;114:607-611.
7. Chang Y-S, Chiang B-L. Mechanism of sleep disturbance in children with atopic dermatitis and the role of the circadian rhythm and melatonin. Int J Mol Sci. 2016;17:462.
8. Camfferman D, Kennedy JD, Gold M, et al. Eczema and sleep and its relationship to daytime functioning in children. Sleep Med Rev. 2010;14:359-369.
9. Chamlin SL, Mattson CL, Frieden IJ, et al. The price of pruritus: sleep disturbance and cosleeping in atopic dermatitis. Arch Pediatr Adolesc Med. 2005;159:745-750.
10. Drucker AM, Wang AR, Li W-Q, et al. The burden of atopic dermatitis: summary of a report for the National Eczema Association. J Invest Dermatol. 2017;137:P26-P30.
11. National Eczema Association. Tools for school: addressing school bullying for kids with eczema. Accessed January 5, 2021. https://nationaleczema.org/children-with-eczema-experience-bullying/
12. Bantz SK, Zhu Z, Zhen T. The atopic march: progression from atopic dermatitis to allergic rhinitis and asthma. J Clin Cell Immunol. 2014;5:202
13. Laird M, Sicco KL. Defining and measuring the scope of atopic dermatitis. Adv Exp Med Biol. 2017;1027:93-104.
14. Du Toit G, Roberts G, Sayre PH, et al. Randomized trial of peanut consumption in infants at risk for peanut allergy. N Engl J Med. 2015;372:803-813.
15. Boyce JA, Assa’ad A, Burks AW, et al. Guidelines for the diagnosis and management of food allergy in the United States: report of the NIAID-sponsored expert panel. J Allergy Clin Immunol. 2010;126:S1–S58.
16. Yaghmaie P, Koudelka CW, Simpson EL. Mental health comorbidity in patients with atopic dermatitis. J Allergy Clin Immunol. 2013;131:428-433.
17. Strom MA, Fishbein AB, Paller AS, et al. Association between atopic dermatitis and attention deficit hyperactivity disorder in U.S. children and adults. Br J Dermatol. 2016;175:920-929.
18. Chiang C, Eichenfield LF. Quantitative assessment of combination bathing and moisturizing regimens on skin hydration in atopic dermatitis. Pediatr Dermatol. 2009;26:273-278.
19. Eichenfield LF, Tom WL, Berger TG, et al. Guidelines of care for the management of atopic dermatitis: section 2. Management and treatment of atopic dermatitis with topical therapies. J Am Acad Dermatol. 2014;71:116-132.
20. Simpson EL, Chalmers JR, Hanifin JM, et al. Emollient enhancement of the skin barrier from birth offers effective atopic dermatitis prevention. J Allergy Clin Immunol. 2014;134:818-823.
21. Chopra R, Vakharia PP, Sacotte R, et al. Efficacy of bleach baths in reducing severity of atopic dermatitis: a systematic review and meta-analysis. Ann Allergy Asthma Immunol. 2017;119:435-440.
22. Williams HC. Established corticosteroid creams should be applied only once daily in patients with atopic eczema. BMJ. 2007;334:1272.
23. Long CC, Mills CM, Finlay AY. A practical guide to topical therapy in children. Br J Dermatol. 1998;138:293-296.
24. Callen J, Chamlin S, Eichenfield LF, et al. A systematic review of the safety of topical therapies for atopic dermatitis. Br J Dermatol. 2007;156:203-221.
25. Charman CR, Morris AD, Williams HC. Topical corticosteroid phobia in patients with atopic eczema. Br J Dermatol. 2000;142:931-936.
26. Ashcroft DM, Dimmock P, Garside R, et al. Efficacy and tolerability of topical pimecrolimus and tacrolimus in the treatment of atopic dermatitis: a meta-analysis of randomised controlled trials. BMJ. 2005;330:516.
27. Cury Martins J, Martins C, Aoki V, et al. Topical tacrolimus for atopic dermatitis. Cochrane Database Syst Rev. 2015:CD009864.
28. Legendre L, Barnetche T, Mazereeuw-Hautier J, et al. Risk of lymphoma in patients with atopic dermatitis and the role of topical treatment: a systematic review and meta-analysis. J Am Acad Dermatol. 2015;72:992-1002.
29. Paller AS, Tom WL, Lebwohl MG, et al. Efficacy and safety of crisaborole ointment, a novel, nonsteroidal phosphodiesterase 4 (PDE4) inhibitor for the topical treatment of atopic dermatitis (AD) in children and adults. J Am Acad Dermatol. 2016;75:494-503.
30. Dupilumab [package insert]. Tarrytown, NY: Regeneron Pharmaceuticals Inc; 2017.
31. van Zuuren EJ, Apfelbacher CJ, Fedorowicz Z, et al. No high level evidence to support the use of oral H1 antihistamines as monotherapy for eczema: a summary of a Cochrane systematic review. Syst Rev. 2014;3:25.
32. Ferguson L, Futamura M, Vakirlis E, et al. Leukotriene receptor antagonists for eczema. Cochrane Database Syst Rev. 2018:CD011224.
33. Makrgeorgou A, Leonardi-Bee J, Bath-Hextall FJ, et al. Probiotics for treating eczema. Cochrane Database Syst Rev. 2018:CD006135.
34. Bath-Hextall FJ, Jenkinson C, Humphreys R, et al. Dietary supplements for established atopic eczema. Cochrane Database Syst Rev. 2012:CD005205.
35. Sy W, Lamb AJ. Atopic dermatitis disease education. In: Fortson E, Feldman SR, Stroud LC, eds. Management of Atopic Dermatitis: Methods and Challenges. Springer International Publishing; 2017:179-184.
PRACTICE RECOMMENDATIONS
› Advise patients to regularly apply moisturizers, which reduces atopic dermatitis (AD) severity and may avert the need for pharmacologic intervention. A
› Assure patients that a topical corticosteroid is safe and effective as first-line treatment for AD symptoms refractory to nonpharmacologic recommendations. A
› Consider topical calcineurin inhibitors for both acute and chronic AD in adults and children, especially in areas more prone to topical corticosteroid adverse effects. A
Strength of recommendation (SOR)
A Good-quality patient-oriented evidence
B Inconsistent or limited-quality patient-oriented evidence
C Consensus, usual practice, opinion, disease-oriented evidence, case series

Tactics to prevent or slow progression of CKD in patients with diabetes
Chronic kidney disease (CKD) is a significant comorbidity of diabetes mellitus. The Kidney Disease Outcomes Quality Initiative (KDOQI) of the National Kidney Foundation defines CKD as the presence of kidney damage or decreased kidney function for ≥ 3 months. CKD caused by diabetes is called diabetic kidney disease (DKD), which is 1 of 3 principal microvascular complications of diabetes. DKD can progress to end-stage renal disease (ESRD), requiring kidney replacement therapy, and is the leading cause of CKD and ESRD in the United States.1-3 Studies have also shown that, particularly in patients with diabetes, CKD considerably increases the risk of cardiovascular events, which often occur prior to ESRD.1,4
This article provides the latest recommendations for evaluating and managing DKD to help you prevent or slow its progression.
Defining and categorizing diabetic kidney disease
CKD is defined as persistently elevated excretion of urinary albumin (albuminuria) and decreased estimated glomerular filtration rate (eGFR), or as the presence of signs of progressive kidney damage.5,6 DKD, also known as diabetic nephropathy, is CKD attributed to long-term diabetes. A patient’s eGFR is the established basis for assignment to a stage (1, 2, 3a, 3b, 4, or 5) of CKD (TABLE 17) and, along with the category of albuminuria (A1, A2, or A3), can indicate prognosis.

Taking its toll in diabetes
As many as 40% of patients with diabetes develop DKD.8-10 Most studies of DKD have been conducted in patients with type 1 diabetes (T1D), because the time of clinical onset is typically known.
Type 1 diabetes. DKD usually occurs 10 to 15 years, or later, after the onset of diabetes.6 As many as 30% of people with T1D have albuminuria approximately 15 years after onset of diabetes; almost one-half of those develop DKD.5,11 After approximately 22.5 years without albuminuria, patients with T1D have approximately a 1% annual risk of DKD.12
Type 2 diabetes (T2D). DKD is often present at diagnosis, likely due to a delay in diagnosis and briefer clinical exposure, compared to T1D. Albuminuria has been reported in as many as 40% of patients with T2D approximately 10 years after onset of diabetes.12,13
Multiple risk factors with no standout “predictor”
Genetic susceptibility, ethnicity, glycemic control, smoking, blood pressure (BP), and the eGFR have been identified as risk factors for renal involvement in diabetes; obesity, oral contraceptives, and age can also contribute. Although each risk factor increases the risk of DKD, no single factor is adequately predictive. Moderately increased albuminuria, the earliest sign of DKD, is associated with progressive nephropathy.12
Continue to: How great is the risk?
How great is the risk? From disease onset to proteinuria and from proteinuria to ESRD, the risk of DKD in T1D and T2D is similar. With appropriate treatment, albuminuria can regress, and the risk of ESRD can be < 20% at 10 years in T1D.12 As in T1D, good glycemic control might result in regression of albuminuria in T2D.14
For unknown reasons, the degree of albuminuria can exist independent of the progression of DKD. Factors responsible for a progressive decline in eGFR in DKD without albuminuria are unknown.12,15
Patient evaluation with an eye toward comorbidities
A comprehensive initial medical evaluation for DKD includes a review of microvascular complications; visits to specialists; lifestyle and behavior patterns (eg, diet, sleep, substance use, and social support); and medication adherence, adverse drug effects, and alternative medicines. Although DKD is often a clinical diagnosis, it can be ruled in by persistent albuminuria or decreased eGFR, or both, in established diabetes or diabetic retinopathy when other causes are unlikely (see “Recommended DKD screening protocol,” below).
Screening for mental health conditions and barriers to self-management is also key.6
Comorbidities, of course, can complicate disease management in patients with diabetes.16-20 Providers and patients therefore need to be aware of potential diabetic comorbidities. For example, DKD and even moderately increased albuminuria significantly increase the risk of cardiovascular disease (CVD).12 Other possible comorbidities include (but are not limited to) nonalcoholic steatohepatitis, fracture, hearing impairment, cancer (eg, liver, pancreas, endometrium, colon, rectum, breast, and bladder), pancreatitis, hypogonadism, obstructive sleep apnea, periodontal disease, anxiety, depression, and eating disorders.6
Continue to: Recommended DKD screening protocol
Recommended DKD screening protocol
In all cases of T2D, in cases of T1D of ≥ 5 years’ duration, and in patients with diabetes and comorbid hypertension, perform annual screening for albuminuria, an elevated creatinine level, and a decline in eGFR.
To confirm the diagnosis of DKD, at least 2 of 3 urine specimens must demonstrate an elevated urinary albumin:creatinine ratio (UACR) over a 3- to 6-month period.21 Apart from renal damage, exercise within 24 hours before specimen collection, infection, fever, congestive heart failure, hyperglycemia, menstruation, and hypertension can elevate the UACR.6
Levels of the UACR are established as follows22:
- Normal UACR is defined as < 30 milligrams of albumin per gram of creatinine (expressed as “mg/g”).
- Increased urinary albumin excretion is defined as ≥ 30 mg/g.
- Moderately increased albuminuria, a predictor of potential nephropathy, is the excretion of 30 to 300 mg/g.
- Severely increased albuminuria is excretion > 300 mg/g; it is often followed by a gradual decline in eGFR that, without treatment, eventually leads to ESRD.
The rate of decline in eGFR once albuminuria is severely increased is equivalent in T1D and T2D.12 Without intervention, the time from severely increased albuminuria to ESRD in T1D and T2D averages approximately 6 or 7 years.
Clinical features
DKD is typically a clinical diagnosis seen in patients with longstanding diabetes, albuminuria, retinopathy, or a reduced eGFR in the absence of another primary cause of kidney damage. In patients with T1D and DKD, signs of retinopathy and neuropathy are almost always present at diagnosis, unless a diagnosis is made early in the course of diabetes.12 Therefore, the presence of retinopathy suggests that diabetes is the likely cause of CKD.
Continue to: The presence of microvascular disease...
The presence of microvascular disease in patients with T2D and DKD is less predictable.12 In T2D patients who do not have retinopathy, consider causes of CKD other than DKD. Features suggesting that the cause of CKD is an underlying condition other than diabetes are rapidly increasing albuminuria or decreasing eGFR; urinary sediment comprising red blood cells or white blood cells; and nephrotic syndrome.6
As the prevalence of diabetes increases, it has become more common to diagnose DKD by eGFR without albuminuria—underscoring the importance of routine monitoring of eGFR in patients with diabetes.6
Sources of expert guidance. The Chronic Kidney Disease Epidemiology Collaboration equation23 is preferred for calculating eGFR from serum creatinine: An eGFR < 60 mL/min/1.73 m2 is considered abnormal.3,12 At these rates, the prevalence of complications related to CKD rises and screening for complications becomes necessary.
A more comprehensive classification of the stages of CKD, incorporating albuminuria and progression of CKD, has been recommended by Kidney Disease: Improving Global Outcomes (KDIGO).7 Because eGFR and excretion of albumin vary, abnormal test results need to be verified over time to stage the degree of CKD.3,12 Kidney damage often manifests as albuminuria, but also as hematuria, other types of abnormal urinary sediment, radiographic abnormalities, and other abnormal presentations.
Management
Nutritional factors
Excessive protein intake has been shown to increase albuminuria, worsen renal function, and increase CVD mortality in DKD.24-26 Therefore, daily dietary protein intake of 0.8 g/kg body weight is recommended for patients who are not on dialysis.3 Patients on dialysis might require higher protein intake to preserve muscle mass caused by protein-energy wasting, which is common in dialysis patients.6
Continue to: Low sodium intake
Low sodium intake in CKD patients has been shown to decrease BP and thus slow the progression of renal disease and lower the risk of CVD. The recommended dietary sodium intake in CKD patients is 1500-3000 mg/d.3
Low potassium intake. Hyperkalemia is a serious complication of CKD. A low-potassium diet is recommended in ESRD patients who have a potassium level > 5.5 mEq/L.6
Blood pressure
Preventing and treating hypertension is critical to slowing the progression of CKD and reducing cardiovascular risk. BP should be measured at every clinic visit. Aside from lifestyle changes, medication might be needed to reach target BP.
The American Diabetes Association recommends a BP goal of ≤ 140/90 mm Hg for hypertensive patients with diabetes, although they do state that a lower BP target (≤ 130/80 mm Hg) might be more appropriate for patients with DKD.27
The American College of Cardiology recommends that hypertensive patients with CKD have a BP target of ≤ 130/80 mm Hg.28
Continue to: ACE inhibitors and ARBs
Angiotensin-converting enzyme (ACE) inhibitors and angiotensin II receptor blockers (ARBs) have renoprotective benefits. These agents are recommended as first-line medications for patients with diabetes, hypertension, and an eGFR < 60 mL/min/1.73 m2 and a UACR > 300 mg/g.29-31 Evidence also supports their use when the UACR is 30 to 299 mg/g.
Studies have shown that, in patients with DKD, ACE inhibitors and ARBs can slow the progression of renal disease.29,30,32 There is no difference between ACE inhibitors and ARBs in their effectiveness for preventing progression of DKD.6 There is no added benefit in combining an ACE inhibitor and an ARB33; notably, combination ACE inhibitor and ARB therapy can increase the risk of adverse events, such as hyperkalemia and acute kidney injury, especially in patients with DKD.33
There is no evidence for starting an ACE inhibitor or ARB to prevent CKD in patients with diabetes who are not hypertensive.5
ACE inhibitors and ARBs should be used with caution in women of childbearing age, who should use a reliable form of contraception if taking one of these drugs.
Diuretics. Thiazide-type and loop diuretics might potentiate the positive effects of ACE inhibitors and ARBs. KDOQI guidelines recommend that, in patients who require a second agent to control BP, a diuretic should be considered in combination with an ACE inhibitor or an ARB.20 A loop diuretic is preferred if the eGFR is < 30 mL/min/1.73 m2.
Continue to: Nondihydropyridine calcium-channel blockers
Nondihydropyridine calcium-channel blockers (CCBs), such as diltiazem and verapamil, have been shown to be more effective then dihydrophyridine CCBs, such as amlodipine and nifedipine, in slowing the progression of renal disease because of their antiproteinuric effects. However, the antiproteinuric effects of nondihydropyridine CCBs are not as strong as those of ACE inhibitors or ARBs, and these drugs do not appear to potentiate the effects of an ACE inhibitor or ARB when used in combination.20
Nondihydropyridine CCBs might be a reasonable alternative in patients who cannot tolerate an ACE inhibitor or an ARB.
Mineralocorticoid receptor antagonists in combination with an ACE inhibitor or ARB have been demonstrated to reduce albuminuria in short-term studies.34,35
Glycemic levels
Studies conducted in patients with T1D, and others in patients with T2D, have shown that tight glycemic control can delay the onset and slow the progression of albuminuria and a decline in the eGFR.10,36-39 The target glycated hemoglobin (A1C) should be < 7% to prevent or slow progression of DKD.40 However, patients with DKD have an increased risk of hypoglycemic events and increased mortality with more intensive glycemic control.40,41 Given those findings, some patients with DKD and significant comorbidities, ESRD, or limited life expectancy might need to have an A1C target set at 8%.6,42
Adjustments to antidiabetes medications in DKD
In patients with stages 3 to 5 DKD, several common antidiabetic medications might need to be adjusted or discontinued because they decrease creatinine clearance.
Continue to: First-generation sulfonylureas
First-generation sulfonylureas should be avoided in DKD. Glipizide and gliclazide are preferred among second-generation sulfonylureas because they do not increase the risk of hypoglycemia in DKD patients, although patients taking these medications still require close monitoring of their blood glucose level.20
Metformin. In 2016, recommendations changed for the use of metformin in patients with DKD: The eGFR, not the serum creatinine level, should guide treatment.43 Metformin can be used safely in patients with (1) an eGFR of < 60 mL/min/1.73 m2 and (2) an eGFR of 30 mL/min/1.73 m2 with close monitoring. Metformin should not be initiated if the eGFR is < 45 mL/min/1.73 m2.43
Antidiabetes medications with direct effect on the kidney
Several antidiabetes medications have a direct effect on the kidney apart from their effect on the blood glucose level.
Sodium-glucose co-transporter 2 (SGLT2) inhibitors have been shown to reduce albuminuria and slow the decrease of eGFR independent of glycemic control. In addition, SGLT2 inhibitors have also been shown to have cardiovascular benefits in patients with DKD.44,45
Glucagon-like peptide 1 (GLP-1) receptor agonists have been shown to delay and decrease the progression of DKD.46-48 Also, similar to what is seen with SGLT2 inhibitors, GLP-1 agonists have demonstrable cardiovascular benefit in patients with DKD.46,48
Continue to: Dyslipidemia and DKD
Dyslipidemia and DKD
Because the risk of CVD is increased in patients with DKD, addressing other modifiable risk factors, including dyslipidemia, is recommended in these patients. Patients with diabetes and stages 1 to 4 DKD should be treated with a high-intensity statin or a combination of a statin and ezetimibe.49,50
If a patient is taking a statin and starting dialysis, it’s important to discuss with him or her whether to continue the statin, based on perceived benefits and risks. It is not recommended that statins be initiated in patients on dialysis unless there is a specific cardiovascular indication for doing so. Risk reduction with a statin has been shown to be significantly less in dialysis patients than in patients who are not being treated with dialysis.49
Complications of CKD
Anemia is a common complication of CKD. KDIGO recommends measuring the hemoglobin concentration annually in DKD stage 3 patients without anemia; at least every 6 months in stage 4 patients; and at least every 3 months in stage 5. DKD patients with anemia should have additional laboratory testing: the absolute reticulocyte count, serum ferritin, serum transferrin saturation, vitamin B12, and folate.51
Mineral and bone disorder should be screened for in patients with DKD. TABLE 252 outlines when clinical laboratory tests should be ordered to assess for mineral bone disease.

When to refer to a nephrologist
Refer patients with stage 4 or 5 CKD (eGFR, ≤ 30 mL/min/1.73 m2) to a nephrologist for discussion of kidney replacement therapy.6 Patients with stage 3a CKD and severely increased albuminuria or with stage 3b CKD and moderately or severely increased albuminuria should also be referred to a nephrologist for intervention to delay disease progression.
Continue to: Identifying the need for early referral...
Identifying the need for early referral to a nephrologist has been shown to reduce the cost, and improve the quality, of care.53 Other indications for earlier referral include uncertainty about the etiology of renal disease, persistent or severe albuminuria, persistent hematuria, a rapid decline in eGFR, and acute kidney injury. Additionally, referral at an earlier stage of DKD might be needed to assist with complications associated with DKD, such as anemia, secondary hyperparathyroidism, mineral and bone disorder, resistant hypertension, fluid overload, and electrolyte disturbances.6
ACKNOWLEDGEMENT
The authors thank Colleen Colbert, PhD, and Iqbal Ahmad, PhD, for their review and critique of the manuscript of this article. They also thank Christopher Babiuch, MD, for his guidance in the preparation of the manuscript.
CORRESPONDENCE
Faraz Ahmad, MD, MPH, Care Point East Family Medicine, 543 Taylor Avenue, 2nd floor, Columbus, OH 43203; faraz. [email protected].
1. Radbill B, Murphy B, LeRoith D. Rationale and strategies for early detection and management of diabetic kidney disease. Mayo Clin Proc. 2008;83:1373-1381.
2. Saran R, Robinson B, Abbott KC, et al. US Renal Data System 2017 Annual Data Report: Epidemiology of kidney disease in the United States. Am J Kidney Dis. 2018;71(3 suppl 1):A7.
3. Tuttle KR, Bakris GL, Bilous RW, et al. Diabetic kidney disease: a report from an ADA Consensus Conference. Am J Kidney Dis. 2014;64:510-533.
4. Fox CS, Matsushita K, Woodward M, et al; . Associations of kidney disease measures with mortality and end-stage renal disease in individuals with and without diabetes: a meta-analysis. Lancet. 2012;380:1662-1673.
5. Orchard TJ, Dorman JS, Maser RE, et al. Prevalence of complications in IDDM by sex and duration. Pittsburgh Epidemiology of Diabetes Complications Study II. Diabetes. 1990;39:1116-1124.
6. American Diabetes Association. Standards of Medical Care in Diabetes—2018. Diabetes Care. 2018;41(suppl 1):S1-S159. Accessed January 5, 2021. https://care.diabetesjournals.org/content/41/Supplement_1
7. National Kidney Foundation. KDIGO 2012 clinical practice guideline for the evaluation and management of chronic kidney disease. Kidney Int Suppl. 2013;3:1-150. Accessed January 5, 2021. https://kdigo.org/wp-content/uploads/2017/02/KDIGO_2012_CKD_GL.pdf
8. Afkarian M, Zelnick LR, Hall YN, et al. Clinical manifestations of kidney disease among US adults with diabetes, 1988-2014. JAMA. 2016;316:602-610.
9. de Boer IH, Rue TC, Hall YN, et al. Temporal trends in the prevalence of diabetic kidney disease in the United States. JAMA. 2011;305:2532-2539.
10. de Boer IH; DCCT/EDIC Research Group. Kidney disease and related findings in the Diabetes Control and Complications Trial/Epidemiology of Diabetes Interventions and Complications study. Diabetes Care. 2014;37:24-30.
11. Stanton RC. Clinical challenges in diagnosis and management of diabetic kidney disease. Am J Kidney Dis. 2014;63(2 suppl 2):S3-S21.
12. Mottl AK, Tuttle KR. Diabetic kidney disease: Pathogenesis and epidemiology. UpToDate. Updated August 19, 2019. Accessed January 5, 2021. www.uptodate.com/contents/diabetic-kidney-disease-pathogenesis-and-epidemiology
13. Bakris GL. Moderately increased albuminuria (microalbuminuria) in type 2 diabetes mellitus. UpToDate. Updated November 3, 2020. Accessed January 5, 2021. https://www.uptodate.com/contents/moderately-increased-albuminuria-microalbuminuria-in-type-2-diabetes-mellitus
14. Bandak G, Sang Y, Gasparini A, et al. Hyperkalemia after initiating renin-angiotensin system blockade: the Stockholm Creatinine Measurements (SCREAM) Project. J Am Heart Assoc. 2017;6:e005428.
15. Saran R, Robinson B, Abbott KC, et al. US Renal Data System 2016 Annual Data Report: Epidemiology of kidney disease in the United States. Am J Kidney Dis. 2017;69(3 suppl 1):A7-A8.
16. Nilsson E, Gasparini A, Ärnlöv J, et al. Incidence and determinants of hyperkalemia and hypokalemia in a large healthcare system. Int J Cardiol. 2017;245:277-284.
17. de Boer IH, Gao X, Cleary PA, et al; Diabetes Control and Complications Trial/Epidemiology of Diabetes Interventions and Complications (DCCT/EDIC) Research Group. Albuminuria changes and cardiovascular and renal outcomes in type 1 diabetes: The DCCT/EDIC study. Clin J Am Soc Nephrol. 2016;11:1969-1977.
18. Sumida K, Molnar MZ, Potukuchi PK, et al. Changes in albuminuria and subsequent risk of incident kidney disease. Clin J Am Soc Nephrol. 2017;12:1941-1949.
19. Borch-Johnsen K, Wenzel H, Viberti GC, et al. Is screening and intervention for microalbuminuria worthwhile in patient with insulin dependent diabetes? BMJ. 1993;306:1722-1725.
20. KDOQI. KDOQI clinical practice guidelines and clinical practice recommendations for diabetes and chronic kidney disease. Am J Kidney Dis. 2007;49(2 suppl 2):S12-154.
21. Bakris GL. Moderately increased albuminuria (microalbuminuria) in type 1 diabetes mellitus. UpToDate. Updated December 3, 2019. Accessed January 5, 2021. https://www.uptodate.com/contents/moderately-increased-albuminuria-microalbuminuria-in-type-1-diabetes-mellitus
22. Delanaye P, Glassock RJ, Pottel H, et al. An age-calibrated definition of chronic kidney disease: rationale and benefits. Clin Biochem Rev. 2016;37:17-26.
23. Levey AS, Stevens LA, Schmid CH, et al; , A new equation to estimate glomerular filtration rate. Ann Intern Med. 2009;150:604-612.
24. Wrone EM, Carnethon MR, Palaniappan L, et al; . Association of dietary protein intake and microalbuminuria in healthy adults: Third National Health and Nutrition Examination Survey. Am J Kidney Dis. 2003;41:580-587.
25. Knight EL, Stampfer MJ, Hankinson SE, et al. The impact of protein intake on renal function decline in women with normal renal function or mild renal insufficiency. Ann Intern Med. 2003;138:460-467.
26. Bernstein AM, Sun Q, Hu FB, et al. Major dietary protein sources and risk of coronary heart disease in women. Circulation. 2010;122:876-883.
27. de Boer, IH, Bangalore S, Benetos A, et al. Diabetes and hypertension: a position statement by the American Diabetes Association. Diabetes Care. 2017;40:1273-1284.
28. Whelton PK, Carey RM, Aronow WS, et al. 2017 ACC/AHA/AAPA/ABC/ACPM/AGS/APhA/ASH/ASPC/NMA/PCNA guideline for the prevention, detection, evaluation, and management of high blood pressure in adults: report of the American College of Cardiology/American Heart Association Task Force on Clinical Practice Guidelines. J Am Coll Cardiol. 2018;71:e127-e248.
29. Brenner BM, Cooper ME, de Zeeuw D, et al; Effects of losartan on renal and cardiovascular outcomes in patients with type 2 diabetes and nephropathy. N Engl J Med. 2001;345:861-869.
30. Lewis EJ, Hunsicker LG, Bain RP, et al. The effect of angiotensin-converting-enzyme inhibition on diabetic nephropathy. The Collaborative Study Group. N Engl J Med. 1993;329:1456-1462.
31. Heart Outcomes Prevention Evaluation (HOPE) Study Investigators. Effects of ramipril on cardiovascular and microvascular outcomes in people with diabetes mellitus: results of the HOPE study and MICRO-HOPE substudy. Lancet. 2000;355;253-259.
32. Lewis EJ, Hunsicker LG, Clarke WR, et al; . Renoprotective effect of the angiotensin-receptor antagonist irbesartan in patients with nephropathy due to type 2 diabetes. N Engl J Med. 2001;345:851-860.
33. Fried LF, Emanuele N, Zhang JH, et al; . Combined angiotensin inhibition for the treatment of diabetic nephropathy. N Engl J Med. 2013;369:1892-1903.
34. Bakris GL, Agarwal R, Chan JC, et al; . Effect of finerenone on albuminuria in patients with diabetic nephropathy: a randomized clinical trial. JAMA. 2015;314:884-894.
35. Filippatos G, Anker SD, M, et al. Randomized controlled study of finerenone vs. eplerenone in patients with worsening chronic heart failure and diabetes mellitus and/or chronic kidney disease. Eur Heart J. 2016;37:2105-2114.
36. The ADVANCE Collaborative Group. Intensive blood glucose control and vascular outcomes in patients with type 2 diabetes.N Engl J Med. 2008;358:2560-2572.
37. Ismail-Beigi F, Craven T, Banerji MA, et al; . Effect of intensive treatment of hyperglycaemia on microvascular outcomes in type 2 diabetes: an analysis of the ACCORD randomised trial. Lancet. 2010;376:419-430.
38. Zoungas S, Chalmers J, Neal B, et al; . Follow-up of blood-pressure lowering and glucose control in type 2 diabetes. N Engl J Med. 2014;371:1392-1406.
39. Zoungas S, Arima H, Gerstein HC, et al; . Effects of intensive glucose control on microvascular outcomes in patients with type 2 diabetes: a meta-analysis of individual participant data from randomised controlled trials. Lancet Diabetes Endocrinol. 2017;5:431-437.
40. Miller ME, Bonds DE, Gerstein HC, et al; . The effects of baseline characteristics, glycaemia treatment approach, and glycated haemoglobin concentration on the risk of severe hypoglycaemia: post hoc epidemiological analysis of the ACCORD study. BMJ. 2010;340;b5444.
41. Papademetriou V, Lovato L, Doumas M, et al; . Chronic kidney disease and intensive glycemic control increase cardiovascular risk in patients with type 2 diabetes. Kidney Int. 2015;87:649-659.
42. National Kidney Foundation. KDOQI clinical practice guideline for diabetes and CKD: 2012 Update. Am J Kidney Dis. 2012;60:850-886.
43. Imam TH. Changes in metformin use in chronic kidney disease. Clin Kidney J. 2017;10:301-304.
44. Wanner C, Inzucchi SE, Lachin JM, et al; Empagliflozin and progression of kidney disease in type 2 diabetes. N Engl J Med. 2016;375:323-334.
45. Neal B, Perkovic V, Mahaffey KW, et al; . Canagliflozin and cardiovascular and renal events in type 2 diabetes. N Engl J Med. 2017;377:644-657.
46. Marso SP, Daniels GH, Brown-Frandsen K, et al; . Liraglutide and cardiovascular outcomes in type 2 diabetes. N Engl J Med. 2016;375:311-322.
47. Mann JFE, DD, Brown-Frandsen K, et al; . Liraglutide and renal outcomes in type 2 diabetes. N Engl J Med. 2017;377:839-848.
48. Marso SP, Bain SC, Consoli A, et al; . Semaglutide and cardiovascular outcomes in patients with type 2 diabetes. N Engl J Med. 2016;375:1834-1844.
49. Wanner C, Tonelli M; Kidney Disease: Improving Global Outcomes Lipid Guideline Development Work Group Members. KDIGO clinical practice guideline for lipid management in CKD: summary of recommendation statements and clinical approach to the patient. Kidney Int. 2014;85:1303-1309.
50. Grundy SM, Stone NJ, Bailey AL, et al. 2018 AHA/ACC/AACVPR/AAPA/ABC/ACPM/ADA/AGS/APhA/ASPC/NLA/PCNA guideline on the management of blood cholesterol. A Report of the American College of Cardiology/American Heart Association Task Force on Clinical Practice Guidelines. Circulation. 2019;139:e1082-e1143.
51. National Kidney Foundation KDOQI. KDIGO clinical practice guideline for anemia in chronic kidney disease. Kidney Int Suppl. 2012;2:279-335. Accessed January 5, 2021. www.sciencedirect.com/journal/kidney-international-supplements/vol/2/issue/4
52. National Kidney Foundation KDOQI. Evaluation and treatment of chronic kidney disease-mineral and bone disorder (CKD-MBD). 2010. Accessed January 5, 2021. www.kidney.org/sites/default/files/02-10-390B_LBA_KDOQI_BoneGuide.pdf
53. Smart MA, Dieberg G, Ladhani M, et al. Early referral to specialist nephrology services for preventing the progression to end-stage kidney disease. Cochrane Database Syst Rev. 2014;(6):CD007333.
Chronic kidney disease (CKD) is a significant comorbidity of diabetes mellitus. The Kidney Disease Outcomes Quality Initiative (KDOQI) of the National Kidney Foundation defines CKD as the presence of kidney damage or decreased kidney function for ≥ 3 months. CKD caused by diabetes is called diabetic kidney disease (DKD), which is 1 of 3 principal microvascular complications of diabetes. DKD can progress to end-stage renal disease (ESRD), requiring kidney replacement therapy, and is the leading cause of CKD and ESRD in the United States.1-3 Studies have also shown that, particularly in patients with diabetes, CKD considerably increases the risk of cardiovascular events, which often occur prior to ESRD.1,4
This article provides the latest recommendations for evaluating and managing DKD to help you prevent or slow its progression.
Defining and categorizing diabetic kidney disease
CKD is defined as persistently elevated excretion of urinary albumin (albuminuria) and decreased estimated glomerular filtration rate (eGFR), or as the presence of signs of progressive kidney damage.5,6 DKD, also known as diabetic nephropathy, is CKD attributed to long-term diabetes. A patient’s eGFR is the established basis for assignment to a stage (1, 2, 3a, 3b, 4, or 5) of CKD (TABLE 17) and, along with the category of albuminuria (A1, A2, or A3), can indicate prognosis.
Taking its toll in diabetes
As many as 40% of patients with diabetes develop DKD.8-10 Most studies of DKD have been conducted in patients with type 1 diabetes (T1D), because the time of clinical onset is typically known.
Type 1 diabetes. DKD usually occurs 10 to 15 years, or later, after the onset of diabetes.6 As many as 30% of people with T1D have albuminuria approximately 15 years after onset of diabetes; almost one-half of those develop DKD.5,11 After approximately 22.5 years without albuminuria, patients with T1D have approximately a 1% annual risk of DKD.12
Type 2 diabetes (T2D). DKD is often present at diagnosis, likely due to a delay in diagnosis and briefer clinical exposure, compared to T1D. Albuminuria has been reported in as many as 40% of patients with T2D approximately 10 years after onset of diabetes.12,13
Multiple risk factors with no standout “predictor”
Genetic susceptibility, ethnicity, glycemic control, smoking, blood pressure (BP), and the eGFR have been identified as risk factors for renal involvement in diabetes; obesity, oral contraceptives, and age can also contribute. Although each risk factor increases the risk of DKD, no single factor is adequately predictive. Moderately increased albuminuria, the earliest sign of DKD, is associated with progressive nephropathy.12
Continue to: How great is the risk?
How great is the risk? From disease onset to proteinuria and from proteinuria to ESRD, the risk of DKD in T1D and T2D is similar. With appropriate treatment, albuminuria can regress, and the risk of ESRD can be < 20% at 10 years in T1D.12 As in T1D, good glycemic control might result in regression of albuminuria in T2D.14
For unknown reasons, the degree of albuminuria can exist independent of the progression of DKD. Factors responsible for a progressive decline in eGFR in DKD without albuminuria are unknown.12,15
Patient evaluation with an eye toward comorbidities
A comprehensive initial medical evaluation for DKD includes a review of microvascular complications; visits to specialists; lifestyle and behavior patterns (eg, diet, sleep, substance use, and social support); and medication adherence, adverse drug effects, and alternative medicines. Although DKD is often a clinical diagnosis, it can be ruled in by persistent albuminuria or decreased eGFR, or both, in established diabetes or diabetic retinopathy when other causes are unlikely (see “Recommended DKD screening protocol,” below).
Screening for mental health conditions and barriers to self-management is also key.6
Comorbidities, of course, can complicate disease management in patients with diabetes.16-20 Providers and patients therefore need to be aware of potential diabetic comorbidities. For example, DKD and even moderately increased albuminuria significantly increase the risk of cardiovascular disease (CVD).12 Other possible comorbidities include (but are not limited to) nonalcoholic steatohepatitis, fracture, hearing impairment, cancer (eg, liver, pancreas, endometrium, colon, rectum, breast, and bladder), pancreatitis, hypogonadism, obstructive sleep apnea, periodontal disease, anxiety, depression, and eating disorders.6
Continue to: Recommended DKD screening protocol
Recommended DKD screening protocol
In all cases of T2D, in cases of T1D of ≥ 5 years’ duration, and in patients with diabetes and comorbid hypertension, perform annual screening for albuminuria, an elevated creatinine level, and a decline in eGFR.
To confirm the diagnosis of DKD, at least 2 of 3 urine specimens must demonstrate an elevated urinary albumin:creatinine ratio (UACR) over a 3- to 6-month period.21 Apart from renal damage, exercise within 24 hours before specimen collection, infection, fever, congestive heart failure, hyperglycemia, menstruation, and hypertension can elevate the UACR.6
Levels of the UACR are established as follows22:
- Normal UACR is defined as < 30 milligrams of albumin per gram of creatinine (expressed as “mg/g”).
- Increased urinary albumin excretion is defined as ≥ 30 mg/g.
- Moderately increased albuminuria, a predictor of potential nephropathy, is the excretion of 30 to 300 mg/g.
- Severely increased albuminuria is excretion > 300 mg/g; it is often followed by a gradual decline in eGFR that, without treatment, eventually leads to ESRD.
The rate of decline in eGFR once albuminuria is severely increased is equivalent in T1D and T2D.12 Without intervention, the time from severely increased albuminuria to ESRD in T1D and T2D averages approximately 6 or 7 years.
Clinical features
DKD is typically a clinical diagnosis seen in patients with longstanding diabetes, albuminuria, retinopathy, or a reduced eGFR in the absence of another primary cause of kidney damage. In patients with T1D and DKD, signs of retinopathy and neuropathy are almost always present at diagnosis, unless a diagnosis is made early in the course of diabetes.12 Therefore, the presence of retinopathy suggests that diabetes is the likely cause of CKD.
Continue to: The presence of microvascular disease...
The presence of microvascular disease in patients with T2D and DKD is less predictable.12 In T2D patients who do not have retinopathy, consider causes of CKD other than DKD. Features suggesting that the cause of CKD is an underlying condition other than diabetes are rapidly increasing albuminuria or decreasing eGFR; urinary sediment comprising red blood cells or white blood cells; and nephrotic syndrome.6
As the prevalence of diabetes increases, it has become more common to diagnose DKD by eGFR without albuminuria—underscoring the importance of routine monitoring of eGFR in patients with diabetes.6
Sources of expert guidance. The Chronic Kidney Disease Epidemiology Collaboration equation23 is preferred for calculating eGFR from serum creatinine: An eGFR < 60 mL/min/1.73 m2 is considered abnormal.3,12 At these rates, the prevalence of complications related to CKD rises and screening for complications becomes necessary.
A more comprehensive classification of the stages of CKD, incorporating albuminuria and progression of CKD, has been recommended by Kidney Disease: Improving Global Outcomes (KDIGO).7 Because eGFR and excretion of albumin vary, abnormal test results need to be verified over time to stage the degree of CKD.3,12 Kidney damage often manifests as albuminuria, but also as hematuria, other types of abnormal urinary sediment, radiographic abnormalities, and other abnormal presentations.
Management
Nutritional factors
Excessive protein intake has been shown to increase albuminuria, worsen renal function, and increase CVD mortality in DKD.24-26 Therefore, daily dietary protein intake of 0.8 g/kg body weight is recommended for patients who are not on dialysis.3 Patients on dialysis might require higher protein intake to preserve muscle mass caused by protein-energy wasting, which is common in dialysis patients.6
Continue to: Low sodium intake
Low sodium intake in CKD patients has been shown to decrease BP and thus slow the progression of renal disease and lower the risk of CVD. The recommended dietary sodium intake in CKD patients is 1500-3000 mg/d.3
Low potassium intake. Hyperkalemia is a serious complication of CKD. A low-potassium diet is recommended in ESRD patients who have a potassium level > 5.5 mEq/L.6
Blood pressure
Preventing and treating hypertension is critical to slowing the progression of CKD and reducing cardiovascular risk. BP should be measured at every clinic visit. Aside from lifestyle changes, medication might be needed to reach target BP.
The American Diabetes Association recommends a BP goal of ≤ 140/90 mm Hg for hypertensive patients with diabetes, although they do state that a lower BP target (≤ 130/80 mm Hg) might be more appropriate for patients with DKD.27
The American College of Cardiology recommends that hypertensive patients with CKD have a BP target of ≤ 130/80 mm Hg.28
Continue to: ACE inhibitors and ARBs
Angiotensin-converting enzyme (ACE) inhibitors and angiotensin II receptor blockers (ARBs) have renoprotective benefits. These agents are recommended as first-line medications for patients with diabetes, hypertension, and an eGFR < 60 mL/min/1.73 m2 and a UACR > 300 mg/g.29-31 Evidence also supports their use when the UACR is 30 to 299 mg/g.
Studies have shown that, in patients with DKD, ACE inhibitors and ARBs can slow the progression of renal disease.29,30,32 There is no difference between ACE inhibitors and ARBs in their effectiveness for preventing progression of DKD.6 There is no added benefit in combining an ACE inhibitor and an ARB33; notably, combination ACE inhibitor and ARB therapy can increase the risk of adverse events, such as hyperkalemia and acute kidney injury, especially in patients with DKD.33
There is no evidence for starting an ACE inhibitor or ARB to prevent CKD in patients with diabetes who are not hypertensive.5
ACE inhibitors and ARBs should be used with caution in women of childbearing age, who should use a reliable form of contraception if taking one of these drugs.
Diuretics. Thiazide-type and loop diuretics might potentiate the positive effects of ACE inhibitors and ARBs. KDOQI guidelines recommend that, in patients who require a second agent to control BP, a diuretic should be considered in combination with an ACE inhibitor or an ARB.20 A loop diuretic is preferred if the eGFR is < 30 mL/min/1.73 m2.
Continue to: Nondihydropyridine calcium-channel blockers
Nondihydropyridine calcium-channel blockers (CCBs), such as diltiazem and verapamil, have been shown to be more effective then dihydrophyridine CCBs, such as amlodipine and nifedipine, in slowing the progression of renal disease because of their antiproteinuric effects. However, the antiproteinuric effects of nondihydropyridine CCBs are not as strong as those of ACE inhibitors or ARBs, and these drugs do not appear to potentiate the effects of an ACE inhibitor or ARB when used in combination.20
Nondihydropyridine CCBs might be a reasonable alternative in patients who cannot tolerate an ACE inhibitor or an ARB.
Mineralocorticoid receptor antagonists in combination with an ACE inhibitor or ARB have been demonstrated to reduce albuminuria in short-term studies.34,35
Glycemic levels
Studies conducted in patients with T1D, and others in patients with T2D, have shown that tight glycemic control can delay the onset and slow the progression of albuminuria and a decline in the eGFR.10,36-39 The target glycated hemoglobin (A1C) should be < 7% to prevent or slow progression of DKD.40 However, patients with DKD have an increased risk of hypoglycemic events and increased mortality with more intensive glycemic control.40,41 Given those findings, some patients with DKD and significant comorbidities, ESRD, or limited life expectancy might need to have an A1C target set at 8%.6,42
Adjustments to antidiabetes medications in DKD
In patients with stages 3 to 5 DKD, several common antidiabetic medications might need to be adjusted or discontinued because they decrease creatinine clearance.
Continue to: First-generation sulfonylureas
First-generation sulfonylureas should be avoided in DKD. Glipizide and gliclazide are preferred among second-generation sulfonylureas because they do not increase the risk of hypoglycemia in DKD patients, although patients taking these medications still require close monitoring of their blood glucose level.20
Metformin. In 2016, recommendations changed for the use of metformin in patients with DKD: The eGFR, not the serum creatinine level, should guide treatment.43 Metformin can be used safely in patients with (1) an eGFR of < 60 mL/min/1.73 m2 and (2) an eGFR of 30 mL/min/1.73 m2 with close monitoring. Metformin should not be initiated if the eGFR is < 45 mL/min/1.73 m2.43
Antidiabetes medications with direct effect on the kidney
Several antidiabetes medications have a direct effect on the kidney apart from their effect on the blood glucose level.
Sodium-glucose co-transporter 2 (SGLT2) inhibitors have been shown to reduce albuminuria and slow the decrease of eGFR independent of glycemic control. In addition, SGLT2 inhibitors have also been shown to have cardiovascular benefits in patients with DKD.44,45
Glucagon-like peptide 1 (GLP-1) receptor agonists have been shown to delay and decrease the progression of DKD.46-48 Also, similar to what is seen with SGLT2 inhibitors, GLP-1 agonists have demonstrable cardiovascular benefit in patients with DKD.46,48
Continue to: Dyslipidemia and DKD
Dyslipidemia and DKD
Because the risk of CVD is increased in patients with DKD, addressing other modifiable risk factors, including dyslipidemia, is recommended in these patients. Patients with diabetes and stages 1 to 4 DKD should be treated with a high-intensity statin or a combination of a statin and ezetimibe.49,50
If a patient is taking a statin and starting dialysis, it’s important to discuss with him or her whether to continue the statin, based on perceived benefits and risks. It is not recommended that statins be initiated in patients on dialysis unless there is a specific cardiovascular indication for doing so. Risk reduction with a statin has been shown to be significantly less in dialysis patients than in patients who are not being treated with dialysis.49
Complications of CKD
Anemia is a common complication of CKD. KDIGO recommends measuring the hemoglobin concentration annually in DKD stage 3 patients without anemia; at least every 6 months in stage 4 patients; and at least every 3 months in stage 5. DKD patients with anemia should have additional laboratory testing: the absolute reticulocyte count, serum ferritin, serum transferrin saturation, vitamin B12, and folate.51
Mineral and bone disorder should be screened for in patients with DKD. TABLE 252 outlines when clinical laboratory tests should be ordered to assess for mineral bone disease.
When to refer to a nephrologist
Refer patients with stage 4 or 5 CKD (eGFR, ≤ 30 mL/min/1.73 m2) to a nephrologist for discussion of kidney replacement therapy.6 Patients with stage 3a CKD and severely increased albuminuria or with stage 3b CKD and moderately or severely increased albuminuria should also be referred to a nephrologist for intervention to delay disease progression.
Continue to: Identifying the need for early referral...
Identifying the need for early referral to a nephrologist has been shown to reduce the cost, and improve the quality, of care.53 Other indications for earlier referral include uncertainty about the etiology of renal disease, persistent or severe albuminuria, persistent hematuria, a rapid decline in eGFR, and acute kidney injury. Additionally, referral at an earlier stage of DKD might be needed to assist with complications associated with DKD, such as anemia, secondary hyperparathyroidism, mineral and bone disorder, resistant hypertension, fluid overload, and electrolyte disturbances.6
ACKNOWLEDGEMENT
The authors thank Colleen Colbert, PhD, and Iqbal Ahmad, PhD, for their review and critique of the manuscript of this article. They also thank Christopher Babiuch, MD, for his guidance in the preparation of the manuscript.
CORRESPONDENCE
Faraz Ahmad, MD, MPH, Care Point East Family Medicine, 543 Taylor Avenue, 2nd floor, Columbus, OH 43203; faraz. [email protected].
1. Radbill B, Murphy B, LeRoith D. Rationale and strategies for early detection and management of diabetic kidney disease. Mayo Clin Proc. 2008;83:1373-1381.
2. Saran R, Robinson B, Abbott KC, et al. US Renal Data System 2017 Annual Data Report: Epidemiology of kidney disease in the United States. Am J Kidney Dis. 2018;71(3 suppl 1):A7.
3. Tuttle KR, Bakris GL, Bilous RW, et al. Diabetic kidney disease: a report from an ADA Consensus Conference. Am J Kidney Dis. 2014;64:510-533.
4. Fox CS, Matsushita K, Woodward M, et al; . Associations of kidney disease measures with mortality and end-stage renal disease in individuals with and without diabetes: a meta-analysis. Lancet. 2012;380:1662-1673.
5. Orchard TJ, Dorman JS, Maser RE, et al. Prevalence of complications in IDDM by sex and duration. Pittsburgh Epidemiology of Diabetes Complications Study II. Diabetes. 1990;39:1116-1124.
6. American Diabetes Association. Standards of Medical Care in Diabetes—2018. Diabetes Care. 2018;41(suppl 1):S1-S159. Accessed January 5, 2021. https://care.diabetesjournals.org/content/41/Supplement_1
7. National Kidney Foundation. KDIGO 2012 clinical practice guideline for the evaluation and management of chronic kidney disease. Kidney Int Suppl. 2013;3:1-150. Accessed January 5, 2021. https://kdigo.org/wp-content/uploads/2017/02/KDIGO_2012_CKD_GL.pdf
8. Afkarian M, Zelnick LR, Hall YN, et al. Clinical manifestations of kidney disease among US adults with diabetes, 1988-2014. JAMA. 2016;316:602-610.
9. de Boer IH, Rue TC, Hall YN, et al. Temporal trends in the prevalence of diabetic kidney disease in the United States. JAMA. 2011;305:2532-2539.
10. de Boer IH; DCCT/EDIC Research Group. Kidney disease and related findings in the Diabetes Control and Complications Trial/Epidemiology of Diabetes Interventions and Complications study. Diabetes Care. 2014;37:24-30.
11. Stanton RC. Clinical challenges in diagnosis and management of diabetic kidney disease. Am J Kidney Dis. 2014;63(2 suppl 2):S3-S21.
12. Mottl AK, Tuttle KR. Diabetic kidney disease: Pathogenesis and epidemiology. UpToDate. Updated August 19, 2019. Accessed January 5, 2021. www.uptodate.com/contents/diabetic-kidney-disease-pathogenesis-and-epidemiology
13. Bakris GL. Moderately increased albuminuria (microalbuminuria) in type 2 diabetes mellitus. UpToDate. Updated November 3, 2020. Accessed January 5, 2021. https://www.uptodate.com/contents/moderately-increased-albuminuria-microalbuminuria-in-type-2-diabetes-mellitus
14. Bandak G, Sang Y, Gasparini A, et al. Hyperkalemia after initiating renin-angiotensin system blockade: the Stockholm Creatinine Measurements (SCREAM) Project. J Am Heart Assoc. 2017;6:e005428.
15. Saran R, Robinson B, Abbott KC, et al. US Renal Data System 2016 Annual Data Report: Epidemiology of kidney disease in the United States. Am J Kidney Dis. 2017;69(3 suppl 1):A7-A8.
16. Nilsson E, Gasparini A, Ärnlöv J, et al. Incidence and determinants of hyperkalemia and hypokalemia in a large healthcare system. Int J Cardiol. 2017;245:277-284.
17. de Boer IH, Gao X, Cleary PA, et al; Diabetes Control and Complications Trial/Epidemiology of Diabetes Interventions and Complications (DCCT/EDIC) Research Group. Albuminuria changes and cardiovascular and renal outcomes in type 1 diabetes: The DCCT/EDIC study. Clin J Am Soc Nephrol. 2016;11:1969-1977.
18. Sumida K, Molnar MZ, Potukuchi PK, et al. Changes in albuminuria and subsequent risk of incident kidney disease. Clin J Am Soc Nephrol. 2017;12:1941-1949.
19. Borch-Johnsen K, Wenzel H, Viberti GC, et al. Is screening and intervention for microalbuminuria worthwhile in patient with insulin dependent diabetes? BMJ. 1993;306:1722-1725.
20. KDOQI. KDOQI clinical practice guidelines and clinical practice recommendations for diabetes and chronic kidney disease. Am J Kidney Dis. 2007;49(2 suppl 2):S12-154.
21. Bakris GL. Moderately increased albuminuria (microalbuminuria) in type 1 diabetes mellitus. UpToDate. Updated December 3, 2019. Accessed January 5, 2021. https://www.uptodate.com/contents/moderately-increased-albuminuria-microalbuminuria-in-type-1-diabetes-mellitus
22. Delanaye P, Glassock RJ, Pottel H, et al. An age-calibrated definition of chronic kidney disease: rationale and benefits. Clin Biochem Rev. 2016;37:17-26.
23. Levey AS, Stevens LA, Schmid CH, et al; , A new equation to estimate glomerular filtration rate. Ann Intern Med. 2009;150:604-612.
24. Wrone EM, Carnethon MR, Palaniappan L, et al; . Association of dietary protein intake and microalbuminuria in healthy adults: Third National Health and Nutrition Examination Survey. Am J Kidney Dis. 2003;41:580-587.
25. Knight EL, Stampfer MJ, Hankinson SE, et al. The impact of protein intake on renal function decline in women with normal renal function or mild renal insufficiency. Ann Intern Med. 2003;138:460-467.
26. Bernstein AM, Sun Q, Hu FB, et al. Major dietary protein sources and risk of coronary heart disease in women. Circulation. 2010;122:876-883.
27. de Boer, IH, Bangalore S, Benetos A, et al. Diabetes and hypertension: a position statement by the American Diabetes Association. Diabetes Care. 2017;40:1273-1284.
28. Whelton PK, Carey RM, Aronow WS, et al. 2017 ACC/AHA/AAPA/ABC/ACPM/AGS/APhA/ASH/ASPC/NMA/PCNA guideline for the prevention, detection, evaluation, and management of high blood pressure in adults: report of the American College of Cardiology/American Heart Association Task Force on Clinical Practice Guidelines. J Am Coll Cardiol. 2018;71:e127-e248.
29. Brenner BM, Cooper ME, de Zeeuw D, et al; Effects of losartan on renal and cardiovascular outcomes in patients with type 2 diabetes and nephropathy. N Engl J Med. 2001;345:861-869.
30. Lewis EJ, Hunsicker LG, Bain RP, et al. The effect of angiotensin-converting-enzyme inhibition on diabetic nephropathy. The Collaborative Study Group. N Engl J Med. 1993;329:1456-1462.
31. Heart Outcomes Prevention Evaluation (HOPE) Study Investigators. Effects of ramipril on cardiovascular and microvascular outcomes in people with diabetes mellitus: results of the HOPE study and MICRO-HOPE substudy. Lancet. 2000;355;253-259.
32. Lewis EJ, Hunsicker LG, Clarke WR, et al; . Renoprotective effect of the angiotensin-receptor antagonist irbesartan in patients with nephropathy due to type 2 diabetes. N Engl J Med. 2001;345:851-860.
33. Fried LF, Emanuele N, Zhang JH, et al; . Combined angiotensin inhibition for the treatment of diabetic nephropathy. N Engl J Med. 2013;369:1892-1903.
34. Bakris GL, Agarwal R, Chan JC, et al; . Effect of finerenone on albuminuria in patients with diabetic nephropathy: a randomized clinical trial. JAMA. 2015;314:884-894.
35. Filippatos G, Anker SD, M, et al. Randomized controlled study of finerenone vs. eplerenone in patients with worsening chronic heart failure and diabetes mellitus and/or chronic kidney disease. Eur Heart J. 2016;37:2105-2114.
36. The ADVANCE Collaborative Group. Intensive blood glucose control and vascular outcomes in patients with type 2 diabetes.N Engl J Med. 2008;358:2560-2572.
37. Ismail-Beigi F, Craven T, Banerji MA, et al; . Effect of intensive treatment of hyperglycaemia on microvascular outcomes in type 2 diabetes: an analysis of the ACCORD randomised trial. Lancet. 2010;376:419-430.
38. Zoungas S, Chalmers J, Neal B, et al; . Follow-up of blood-pressure lowering and glucose control in type 2 diabetes. N Engl J Med. 2014;371:1392-1406.
39. Zoungas S, Arima H, Gerstein HC, et al; . Effects of intensive glucose control on microvascular outcomes in patients with type 2 diabetes: a meta-analysis of individual participant data from randomised controlled trials. Lancet Diabetes Endocrinol. 2017;5:431-437.
40. Miller ME, Bonds DE, Gerstein HC, et al; . The effects of baseline characteristics, glycaemia treatment approach, and glycated haemoglobin concentration on the risk of severe hypoglycaemia: post hoc epidemiological analysis of the ACCORD study. BMJ. 2010;340;b5444.
41. Papademetriou V, Lovato L, Doumas M, et al; . Chronic kidney disease and intensive glycemic control increase cardiovascular risk in patients with type 2 diabetes. Kidney Int. 2015;87:649-659.
42. National Kidney Foundation. KDOQI clinical practice guideline for diabetes and CKD: 2012 Update. Am J Kidney Dis. 2012;60:850-886.
43. Imam TH. Changes in metformin use in chronic kidney disease. Clin Kidney J. 2017;10:301-304.
44. Wanner C, Inzucchi SE, Lachin JM, et al; Empagliflozin and progression of kidney disease in type 2 diabetes. N Engl J Med. 2016;375:323-334.
45. Neal B, Perkovic V, Mahaffey KW, et al; . Canagliflozin and cardiovascular and renal events in type 2 diabetes. N Engl J Med. 2017;377:644-657.
46. Marso SP, Daniels GH, Brown-Frandsen K, et al; . Liraglutide and cardiovascular outcomes in type 2 diabetes. N Engl J Med. 2016;375:311-322.
47. Mann JFE, DD, Brown-Frandsen K, et al; . Liraglutide and renal outcomes in type 2 diabetes. N Engl J Med. 2017;377:839-848.
48. Marso SP, Bain SC, Consoli A, et al; . Semaglutide and cardiovascular outcomes in patients with type 2 diabetes. N Engl J Med. 2016;375:1834-1844.
49. Wanner C, Tonelli M; Kidney Disease: Improving Global Outcomes Lipid Guideline Development Work Group Members. KDIGO clinical practice guideline for lipid management in CKD: summary of recommendation statements and clinical approach to the patient. Kidney Int. 2014;85:1303-1309.
50. Grundy SM, Stone NJ, Bailey AL, et al. 2018 AHA/ACC/AACVPR/AAPA/ABC/ACPM/ADA/AGS/APhA/ASPC/NLA/PCNA guideline on the management of blood cholesterol. A Report of the American College of Cardiology/American Heart Association Task Force on Clinical Practice Guidelines. Circulation. 2019;139:e1082-e1143.
51. National Kidney Foundation KDOQI. KDIGO clinical practice guideline for anemia in chronic kidney disease. Kidney Int Suppl. 2012;2:279-335. Accessed January 5, 2021. www.sciencedirect.com/journal/kidney-international-supplements/vol/2/issue/4
52. National Kidney Foundation KDOQI. Evaluation and treatment of chronic kidney disease-mineral and bone disorder (CKD-MBD). 2010. Accessed January 5, 2021. www.kidney.org/sites/default/files/02-10-390B_LBA_KDOQI_BoneGuide.pdf
53. Smart MA, Dieberg G, Ladhani M, et al. Early referral to specialist nephrology services for preventing the progression to end-stage kidney disease. Cochrane Database Syst Rev. 2014;(6):CD007333.
PRACTICE RECOMMENDATIONS
› Screen patients with diabetes annually for diabetic kidney disease with measurement of urinary albumin and the estimated glomerular filtration rate. B
› Optimize blood glucose and blood pressure control in patients with diabetes to prevent or delay progression to diabetic kidney disease. A
› Treat hypertensive patients with diabetes and stages 1 to 4 chronic kidney disease with an angiotensin-converting enzyme inhibitor or angiotensin II-receptor blocker as a first-line antihypertensive, absent contraindications. A
Strength of recommendation (SOR)
A Good-quality patient-oriented evidence
B Inconsistent or limited-quality patient-oriented evidence
C Consensus, usual practice, opinion, disease-oriented evidence, case series

PCPs play a small part in low-value care spending
according to a brief report published online Jan. 18 in Annals of Internal Medicine.
However, one expert said there are better ways to curb low-value care than focusing on which specialties are guilty of the practice.
Analyzing a 20% random sample of Medicare Part B claims, Aaron Baum, PhD, with the Icahn School of Medicine at Mount Sinai, New York, and colleagues found that the services primary care physicians performed or ordered made up on average 8.3% of the low-value care their patients received (interquartile range, 3.9%-15.1%; 95th percentile, 35.6%) and their referrals made up 15.4% (IQR, 6.3%-26.4%; 95th percentile, 44.6%).
By specialty, cardiology had the worst record with 27% of all spending on low-value services ($1.8 billion) attributed to that specialty. Yet, of the 25 highest-spending specialties in the report, 12 of them were associated with 1% or less than 1% each of all low-value spending, indicating the waste was widely distributed.
Dr. Baum said in an interview that though there are some PCPs guilty of high spending on low-value services, overall, most primary care physicians’ low-value services add up to only 0.3% of Part B spending. He noted that Part B spending is about one-third of all Medicare spending.
Primary care is often thought to be at the core of care management and spending and PCPs are often seen as the gatekeepers, but this analysis suggests that efforts to make big differences in curtailing low-value spending might be more effective elsewhere.
“There’s only so much spending you can reduce by changing primary care physicians’ services that they directly perform,” Dr. Baum said.
Low-value care is costly, can be harmful
Mark Fendrick, MD, director of the University of Michigan’s Center for Value-Based Insurance Design in Ann Arbor, said in an interview that the report adds confirmation to previous research that has consistently shown low-value care is “extremely common, very costly, and provided by primary care providers and specialists alike.” He noted that it can also be harmful.
“The math is simple,” he said. “If we want to improve coverage and lower patient costs for essential services like visits, diagnostic tests, and drugs, we have to reduce spending on those services that do not make Americans any healthier.”
The study ranked 31 clinical services judged to be low value by physician societies, Medicare and clinical guidelines, and their use among beneficiaries enrolled between 2007 and 2014. Here’s how the top six low-value services compare.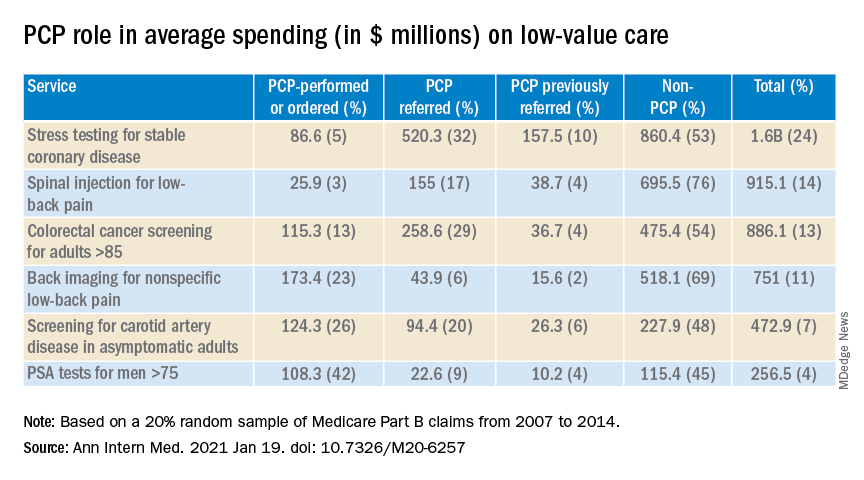
Dr. Fendrick said a weakness of the paper is the years of the data (2007-2014). Some of the criteria around low-value care have changed since then. The age that a prostate-specific antigen test becomes low-value is now 70 years, for instance, instead of 75. He added that some of the figures attributed to non-PCP providers appear out of date.
Dr. Fendrick said, “I understand that there are Medicare patients who end up at a gastroenterologist or surgeon’s office to get colorectal cancer screening, but it would be very hard for me to believe that half of stress tests and over half of colon cancer screening over [age] 85 [years] and half of PSA for people over 75 did not have some type of referring clinicians involved. I certainly don’t think that would be the case in 2020-2021.”
Dr. Baum said those years were the latest years available for the data points needed for this analysis, but he and his colleagues were working to update the data for future publication.
Dr. Fendrick said not much has changed in recent years in terms of waste on low-value care, even with campaigns such as Choosing Wisely dedicated to identifying low-value services or procedures in each specialty.
“I believe there’s not a particular group of clinicians one way or the other who are actually doing any better now than they were 7 years ago,” he said. He would rather focus less on which specialties are associated with the most low-value care and more on the underlying policies that encourage low-value care.
“If you’re going to get paid for doing a stress test and get paid nothing or significantly less if you don’t, the incentives are in the wrong direction,” he said.
Dr. Fendrick said the pandemic era provides an opportunity to eliminate low-value care because use of those services has dropped drastically as resources have been diverted to COVID-19 patients and many services have been delayed or canceled.
He said he has been pushing an approach that providers should be paid more after the pandemic “to do the things we want them to do.”
As an example, he said, instead of paying $886 million on colonoscopies for people over the age of 85, “why don’t we put a policy in place that would make it better for patients by lowering cost sharing and better for providers by paying them more to do the service on the people who need it as opposed to the people who don’t?”
The research was funded by the American Board of Family Medicine Foundation. Dr. Baum and a coauthor reported receiving personal fees from American Board of Family Medicine Foundation during the conduct of the study. Another coauthor reported receiving personal fees from Collective Health, HealthRight 360, PLOS Medicine, and the New England Journal of Medicine, outside the submitted work. Dr. Fendrick disclosed no relevant financial relationships.
A version of this article first appeared on Medscape.com.
Breaking the cycle of medication overuse headache
Medication overuse headache (MOH), a secondary headache diagnosis, is a prevalent phenomenon that complicates headache diagnosis and treatment, increases the cost of care, and reduces quality of life. Effective abortive medication is essential for the headache sufferer; when an abortive is used too frequently, however, headache frequency increases—potentially beginning a cycle in which the patient then takes more medication to abort the headache. Over time, the patient suffers from an ever-increasing number of headaches, takes even more abortive medication, and so on. In the presence of MOH, there is a reduction in pain response to preventive and abortive treatments; when medication overuse is eliminated, pain response improves.1
Although MOH is well recognized among headache specialists, the condition is often overlooked in primary care. Since headache is a top complaint in primary care, however, and prevention is a major goal in family medicine, the opportunity for you to recognize, treat, and prevent MOH is significant. In fact, a randomized controlled trial showed that brief patient education about headache care and MOH provided by a primary care physician can lead to a significant reduction in headache frequency among patients with MOH.2
This article reviews the recognition and diagnosis of MOH, based on historical features and current criteria; addresses risk factors for abortive medication overuse and how to withdraw an offending agent; and explores the value of bridging and preventive therapies to reduce the overall frequency of headache.

What defines MOH?
Typically, MOH is a chronification of a primary headache disorder. However, in patients with a history of migraine who are undergoing treatment for another chronic pain condition with an opioid or other analgesic, MOH can be induced.3 An increase in the frequency of headache raises the specter of a concomitant increase in the level of disability4; psychiatric comorbidity5; and more headache days, with time lost from school and work.
The Migraine Disability Assessment (MIDAS) questionnaire, a validated instrument that helps the provider (1) measure the impact that headache has on a patient’s life and (2) follow treatment progress, also provides information to employers and insurance companies on treatment coverage and the need for work modification. The MIDAS score is 3 times higher in patients with MOH than in patients with episodic migraine.6,7
The annual associated cost per person of MOH has been estimated at $4000, resulting in billions of dollars in associated costs8; most of these costs are related to absenteeism and disability. After detoxification for MOH, annual outpatient medication costs are reduced by approximately 24%.9
Efforts to solve a common problem create another
Headache affects nearly 50% of the general population worldwide,10 accounting for about 4% of primary care visits11 and approximately 20% of outpatient neurology consultations.12 Although inpatient stays for headache are approximately half the duration of the overall average hospital stay, headache accounts for 3% of admissions.13 According to the Global Burden of Disease study, tension-type headache, migraine, and MOH are the 3 most common headache disorders.10 Headache is the second leading cause of disability among people 15 to 49 years of age.10
Continue to: The prevalence of MOH...
The prevalence of MOH in the general population is 2%.7,14,15 A population-based study showed that the rate of progression from episodic headache (< 15 d/mo) to chronic headache (≥ 15 d/mo) in the general population is 2.5% per year16; however, progression to chronic headache is 14% per year in patients with medication overuse. One-third of the general population with chronic migraine overuses symptomatic medication; in US headache clinics, roughly one-half of patients with chronic headache overuse acute medication.6
Definitions and diagnosis
MOH is a secondary headache diagnosis in the third edition of the International Classification of Headache Disorders (ICHD-3) (TABLE 1),17 which lists diagnostic criteria for recognized headache disorders.

Terminology. MOH has also been called rebound headache, drug-induced headache, and transformed migraine, but these terms are outdated and are not formal diagnoses. Patients sometimes refer to substance-withdrawal headaches (not discussed in this article) as rebound headaches, so clarity is important when discussing headache with patients: namely, that MOH is an exacerbation of an existing headache condition caused by overuse of abortive headache medications, including analgesics, combination analgesics, triptans, barbiturates, and opioids.
MOH was recognized in the early 1950s and fully differentiated as a diagnosis in 2005 in the second edition of the ICHD. The disorder is subcategorized by offending abortive agent (TABLE 217) because the frequency of analgesic use required to develop MOH differs by agent.

Risk factors for MOH and chronification of a primary headache disorder. There are several risk factors for developing MOH, and others that contribute to increasing headache frequency in general (TABLE 35,14,18-23). Some risk factors are common to each. All are important to address because some are modifiable.

Continue to: Pathophysiology
Pathophysiology. The pathophysiology and psychology behind MOH are largely unknown. Physiologic changes in pain processing and functional imaging changes have been demonstrated in patients with MOH, both of which are reversible upon withdrawal of medication.23 Genetic factors and changes in hormone and neurotransmitter levels are found in MOH patients; this is not the case in patients who have an episodic headache pattern only.24
Presentation. Diagnostic criteria for MOH do not include clinical characteristics. Typically, the phenotype of MOH in a given patient is similar to the underlying primary headache25—although this principle can be complicated to tease out because these medications can suppress some symptoms. Diagnosis of a primary headache disorder should be documented along with the diagnosis of MOH.
Medication overuse can exist without MOH: Not every patient who frequently uses an abortive medication develops MOH.
Treatment is multifaceted—and can become complex
Mainstays of treatment of MOH are education about the disorder and detoxification from the overused agent, although specific treatments can differ depending on the agent involved, the frequency and duration of its use, and a patient’s behavioral patterns and psychiatric comorbidities. Often, a daily medication to prevent headache is considered upon, or after, withdrawal of the offending agent. The timing of introducing a preventive might impact its effectiveness. Some refractory cases require more intensive therapy, including hospitalization at a specialized tertiary center.
But before we look at detoxification from an overused agent, it’s important to review one of the best strategies of all in combatting MOH.
Continue to: First and best strategy
First and best strategy: Avoid onset of MOH
Select an appropriate abortive to reduce the risk of MOH. With regard to specific acute headache medications, some nuances other than type of headache should be considered. Nonsteroidal anti-inflammatory drugs (NSAIDs) are recommended as abortive therapy by the American Headache Society for their efficacy, favorable adverse effect profile, and low cost. NSAIDs are protective against development of MOH if a patient’s baseline headache frequency is < 10/mo; at a frequency of 10 to 14 d/mo, however, the risk of MOH increases when using an NSAID.6 A similar effect has been seen with triptans.16 Longer-acting NSAIDs, such as nabumetone and naproxen, have been proposed as less likely to cause MOH, and are even used as bridging therapy sometimes (as long as neither of these was the overused medication).26
The time it takes to develop MOH is shortest with triptans, followed by ergots, then analgesics.27
Prospective cohort studies6,16 have shown that barbiturates and opioids are more likely to induce MOH; for that reason, agents in these analgesic classes are almost universally avoided unless no other medically acceptable options exist. Using barbiturate-containing compounds or opioids > 4 d/mo exponentially increases the likelihood of MOH.
Promising preclinical data demonstrate that the gepant, or small-molecule calcitonin gene-related peptide (CGRP) receptor antagonist, class of medications used as abortive therapy does not induce medication overuse cutaneous allodynia.28
Provide education. Primary prevention of MOH involves (1) increasing patients’ awareness of how to take medications appropriately and (2) restricting intake of over-the-counter abortive medications. Often, the expert recommendation is to limit abortives to approximately 2 d/wk because more frequent use places patients at risk of further increased use and subsequent MOH.
Continue to: A randomized controlled trial in Norway...
A randomized controlled trial in Norway compared outcomes in 2 groups of patients with MOH: One group was given advice on the disorder by a physician; the other group was not provided with advice. In the “business-as-usual” group, there was no significant improvement; however, when general practitioners provided simple advice (lasting roughly 9 minutes) about reducing abortive medication use to a safe level and cautioned patients that they would be “feeling worse before feeling better,” headache days were reduced by approximately 8 per month and medication days, by 16 per month.2
A subsequent, long-term follow-up study29 of patients from the Norway trial2 who had been given advice and education showed a relapse rate (ie, into overuse of headache medication) of only 8% and sustained reduction of headache days and medication use at 16 months.
Offer support and other nondrug interventions. A recent review of 3 studies23 recommended that extra support for patients from a headache nurse, close follow-up, keeping an electronic diary that provides feedback, and undertaking a short course of psychotherapy can reduce medication overuse and prevent relapse.
If MOH develops, initiate withdrawal, introduce a preventive
Withdraw overused medication. Most current evidence suggests that withdrawal of the offending agent is the most effective factor in reducing headache days and improving quality of life. A randomized controlled trial compared the effects of (1) complete and immediate withdrawal of an abortive medication with (2) reducing its use (ie, limiting intake to 2 d/wk), on headache frequency, disability, and quality of life.30 There was a reduction of headache days in both groups; however, reduction was much greater at 2 months in the complete withdrawal group than in the restricted intake group (respectively, a 41% and a 26% reduction in headache days per month). This effect was sustained at 6 and 12 months in both groups. The study confirmed the results of earlier research2,15: Abrupt withdrawal leads to reversion to an episodic pattern at 2 to 6 months in approximately 40% to 60% of patients.
More studies are needed to determine the most appropriate treatment course for MOH; however, complete withdrawal of the causative drug is the most important intervention.
Continue to: Consider withdrawal plus preventive treatment
Consider withdrawal plus preventive treatment. Use of sodium valproate, in addition to medication overuse detoxification, led to a significant reduction in headache days and improvement in quality of life at 12 weeks but no difference after 24 weeks, compared with detoxification alone in a randomized, double-blind, placebo-controlled study.31
A study of 61 patients showed a larger reduction (by 7.2 d/mo) in headache frequency with any preventive medication in addition to medication withdrawal, compared to withdrawal alone (by 4.1 d/mo) after 3 months; however, the relative benefit was gone at 6 months.32
A study of 98 patients compared immediate and delayed initiation of preventive medication upon withdrawal of overused abortive medication.33 Response was defined as a > 50% reduction in headache frequency and was similar in both groups; results showed a 28% response with immediate initiation of a preventive; a 23% response with delayed (ie, 2 months after withdrawal) initiation; and a 48% response in both groups at 12 months.
Collectively, these studies suggest that adding a preventive medication at the time of withdrawal has the potential to reduce headache frequency more quickly than withdrawal alone. However, after 3 to 6 months, the outcome of reduced headache frequency is the same whether or not a preventive medication is used—as long as the offending agent has been withdrawn.
Do preventives work without withdrawing overused medication? Patients with MOH often show little or no improvement with addition of a preventive medication only; their response to a preventive improves after withdrawal of the overused medication. Patients without previous headache improvement after addition of a preventive, who also did not improve 2 months after withdrawal, then demonstrated an overall reduction in headache by 26% when a preventive was reintroduced after withdrawal.2
Continue to: The research evidence for preventives
The research evidence for preventives. Medications for headache prevention have not been extensively evaluated specifically for treating MOH. Here is what’s known:
- Flunarizine, amitriptyline, and beta-blockers usually are ineffective for MOH.24
- Results for topiramate are mixed: A small, double-blind, placebo-controlled chronic migraine study in Europe showed that, in a subgroup of patients with MOH, topiramate led to a small but significant reduction (3.5 d/mo) in headache frequency, compared to placebo.27 A similar study done in the United States did not show a significant difference between the active-treatment and placebo groups.34
- Findings regarding onabotulinumtoxinA are intriguing: In a posthoc analysis of onabotulinumtoxinA to treat chronic migraine, patients with MOH who did not undergo detoxification had an 8 d/mo greater reduction in headache, compared to placebo.35 However, when compared to placebo in conjunction with detoxification, onabotulinumtoxinA demonstrated no benefit.36
- Newer CGRP antagonist and CGRP receptor antagonist monoclonal antibodies are successful preventive medications that have demonstrated a reduction in acute medication use days per month and headache days per month37; these compounds have not been compared to withdrawal alone.
Reducing the severity and duration of withdrawal symptoms
Withdrawal from overused abortive headache medications can lead to worsening headache, nausea, vomiting, hypotension, tachycardia, sleep disturbances, restlessness, anxiety, and nervousness. Symptoms usually last 2 to 10 days but can persist for as long as 4 weeks; duration of withdrawal symptoms varies with the medication that is being overused. In patients who have used a triptan, for example, mean duration of withdrawal is 4.1 days; ergotamine, 6.7 days; and NSAIDs, 9.5 days.23 Tapered withdrawal is sometimes recommended with opioids and barbiturates to reduce withdrawal symptoms. It is unclear whether starting a preventive medication during withdrawal assists in reducing withdrawal symptoms.38
Bridging therapy to reduce symptoms of withdrawal is often provided despite debatable utility. Available evidence does not favor one agent or method but suggests some strategies that could be helpful:
- A prednisone taper has a potential role during the first 6 days of withdrawal by reducing rebound headache and withdrawal symptoms39; however, oral prednisolone has been shown to have no benefit.40
- Alone, IV methylprednisolone seems not to be of benefit; however, in a retrospective study of 94 patients, IV methylprednisolone plus diazepam for 5 days led to a significant reduction in headache frequency and drug consumption that was sustained after 3 months.41
- Celecoxib was compared to prednisone over a 20-day course: a celecoxib dosage of 400 mg/d for the first 5 days, tapered by 100 mg every 5 days, and an oral prednisone dosage of 75 mg/d for the first 5 days, then tapered every 5 days. Patients taking celecoxib had lower headache intensity but there was no difference in headache frequency and acute medication intake between the groups.42
Other strategies. Using antiemetics and NSAIDs to reduce withdrawal symptoms is widely practiced, but no placebo-controlled trials have been conducted to support this strategy.
Patients in withdrawal might be more likely to benefit from inpatient care if they have a severe comorbidity, such as opioid or barbiturate use; failure to respond to, tolerate, or adhere to treatment; or relapse after withdrawal.38
Continue to: Cognitive behavioral therapy...
Cognitive behavioral therapy, exercise, a headache diary, and biofeedback should be considered in every patient’s treatment strategy because a multidisciplinary approach increases adherence and leads to improvement in headache frequency and a decrease in disability and medication use.43
Predictors of Tx success
A prospective cohort study determined that the rate of MOH relapse is 31% at 6 months, 41% at 1 year, and 45% at 4 years, with the highest risk of relapse during the first year.44 Looking at the correlation between type of medication overused and relapse rate, the research indicates that
- triptans have the lowest risk of relapse,44
- simple analgesics have a higher risk of relapse than triptans,22,44 and
- opioids have the highest risk of relapse.22
Where the data don’t agree. Data on combination analgesics and on ergots are conflicting.22 In addition, data on whether the primary type of headache predicts relapse rate conflict; however, migraine might predict a better outcome than tension-type headache.22
To recap and expand: Management pearls
The major goals of headache management generally are to rule out secondary headache, reach a correct diagnosis, reduce overall headache frequency, and provide effective abortive medication. A large component of reducing headache frequency is addressing and treating medication overuse.
Seek to understand the nature of the patient’s headache disorder. Components of the history are key in identifying the underlying headache diagnosis and ruling out other, more concerning secondary headache diagnoses. The ICHD-3 is an excellent resource for treating headache disorders because the classification lists specific diagnostic criteria for all recognized headache diagnoses.
Continue to: Medication withdrawal...
Medication withdrawal—with or without preventive medication—should reduce the frequency of MOH in 2 or 3 months. If headache does not become less frequent, however, the headache diagnosis might need to be reconsidered. Minimizing the use of abortive medication is generally recommended, but reduction or withdrawal of these medications does not guarantee that patients will revert to an episodic pattern of headache.
Treating withdrawal symptoms is a reasonable approach in some patients, but evidence does not support routinely providing bridging therapy.
Apply preventives carefully. Abortive medication withdrawal should generally be completed before initiating preventive medication; however, over the short term, starting preventive therapy while withdrawing the overused medication could assist in reducing headache frequency rapidly. This strategy can put patients at risk of medication adverse effects and using the medications longer than necessary, yet might be reasonable in certain patients, given their comorbidities, risk of relapse, and physician and patient preference. A preventive medication for an individual patient should generally be chosen in line with recommendations of the American Academy of Neurology45 and on the basis of the history and comorbidities.
Provide education, which is essential to lowering barriers to success. Patients with MOH must be counseled to understand that (1) a headache treatment that is supposed to be making them feel better is, in fact, making them feel worse and (2) they will get worse before they get better. Many patients are afraid to be without medication to use as needed. It is helpful to educate them on the different types of treatments (abortive, preventive); how MOH interferes with headache prophylaxis and medication efficacy; how MOH alters brain function (ie, aforementioned physiologic changes in pain processing and functional imaging changes23); and that such change is reversible when medication is withdrawn.
ACKNOWLEDGEMENT
The author thanks Jeffrey Curtis, MD, MPH, for his support and editing assistance with the manuscript.
CORRESPONDENCE
Allison Crain, MD, 2927 N 7th Avenue, Phoenix, AZ 85013; [email protected].
1. Zeeberg P, Olesen J, Jensen R. Discontinuation of medication overuse in headache patients: recovery of therapeutic responsiveness. Cephalalgia. 2006;26:1192-1198.
2. Kristoffersen ES, Straand J, Vetvik KG, et al. Brief intervention for medication-overuse headache in primary care. The BIMOH study: a double-blind pragmatic cluster randomised parallel controlled trial. J Neurol Neurosurg Psychiatry. 2015;86:505-512.
3. Bahra A, Walsh M, Menon S, et al. Does chronic daily headache arise de novo in association with regular use of analgesics? Headache. 2003;43:179-190.
4. Blumenfeld AM, Varon SF, Wilcox TK, et al. Disability, HRQoL and resource use among chronic and episodic migraineurs: results from the International Burden of Migraine Study (IBMS) Cephalalgia. 2011;31:301-315.
5. Chu H-T, Liang C-S, Lee J-T, et al. Associations between depression/anxiety and headache frequency in migraineurs: a cross-sectional study. Headache. 2018;58:407-415.
6. Bigal ME, Lipton RB. Excessive acute migraine medication use and migraine progression. Neurology. 2008;71:1821-1828.
7. Colás R, Muñoz P, Temprano R, et al. Chronic daily headache with analgesic overuse: epidemiology and impact on quality of life. Neurology. 2004;62:1338-1342.
8. Linde M, Gustavsson A, Stovner LJ, et al. The cost of headache disorders in Europe: the Eurolight project. Eur J Neurol. 2012;19:703-711.
9. Shah AM, Bendtsen L, Zeeberg P, et al. Reduction of medication costs after detoxification for medication-overuse headache. Headache. 2013;53:665-672.
10. . Global, regional, and national burden of migraine and tension-type headache, 1990–2016: a systematic analysis for the Global Burden of Disease Study 2016. Lancet Neurol. 2018;17:954-976.
11. Kernick D, Stapley S, Goadsby PJ, et al. What happens to new-onset headache presenting to primary care? A case–cohort study using electronic primary care records. Cephalalgia. 2008;28:1188-1195.
12. Stone J, Carson A, Duncan R, et al. Who is referred to neurology clinics?—the diagnoses made in 3781 new patients. Clin Neurol Neurosurg. 2010;112:747-751.
13. Munoz-Ceron J, Marin-Careaga V, L, et al. Headache at the emergency room: etiologies, diagnostic usefulness of the ICHD 3 criteria, red and green flags. PloS One. 2019;14:e0208728.
14. Evers S, Marziniak M. Clinical features, pathophysiology, and treatment of medication-overuse headache. Lancet Neurol. 2010;9:391-401.
15. Tassorelli C, Jensen R, Allena M, et al; the . A consensus protocol for the management of medication-overuse headache: evaluation in a multicentric, multinational study. Cephalalgia. 2014;34:645-655.
16. Bigal ME, Serrano D, Buse D, et al. Acute migraine medications and evolution from episodic to chronic migraine: a longitudinal population-based study. Headache. 2008;48:1157-1168.
17. Headache Classification Committee of the International Headache Society (IHS). The International Classification of Headache Disorders, 3rd edition. Cephalalgia. 2018;38:1-211.
18. Ferrari A, Leone S, Vergoni AV, et al. Similarities and differences between chronic migraine and episodic migraine. Headache. 2007;47:65-72.
19. Hagen K, Linde M, Steiner TJ, et al. Risk factors for medication-overuse headache: an 11-year follow-up study. The Nord-Trøndelag Health Studies. Pain. 2012;153:56-61.
20. Katsarava Z, Schneewiess S, Kurth T, et al. Incidence and predictors for chronicity of headache in patients with episodic migraine. Neurology. 2004;62:788-790.
21. Lipton RB, Fanning KM, Buse DC, et al. Migraine progression in subgroups of migraine based on comorbidities: results of the CaMEO study. Neurology. 2019;93:e2224-e2236.
22. Munksgaard SB, Madsen SK, Wienecke T. Treatment of medication overuse headache—a review. Acta Neurol Scand. 2019;139:405-414.
23. Ferraro S, Grazzi L, Mandelli M, et al. Pain processing in medication overuse headache: a functional magnetic resonance imaging (fMRI) study. Pain Med. 2012;13:255-262.
24. Diener H-C, Holle D, Solbach K, et al. Medication-overuse headache: risk factors, pathophysiology and management. Nat Rev Neurol. 2016;12:575-583.
25. Limmroth V, Katsarava Z, Fritsche G, et al. Features of medication overuse headache following overuse of different acute headache drugs. Neurology. 2002;59:1011-1014.
26. Mauskop A, ed. Migraine and Headache. 2nd ed. Oxford University Press; 2013.
27. Diener H-C, Bussone G, Van Oene JC, et al; . Topiramate reduces headache days in chronic migraine: a randomized, double-blind, placebo-controlled study. Cephalalgia. 2007;27:814-823.
28. Navratilova E, Behravesh S, Oyarzo J, et al. Ubrogepant does not induce latent sensitization in a preclinical model of medication overuse headache Cephalalgia. 2020;40:892-902.
29. Kristoffersen ES, Straand J, Russell MB, et al. Lasting improvement of medication-overuse headache after brief intervention—a long-term follow-up in primary care. Eur J Neurol. 2017;24:883-891.
30. Carlsen LN, Munksgaard SB, Jensen RH, et al. Complete detoxification is the most effective treatment of medication-overuse headache: a randomized controlled open-label trial. Cephalalgia. 2018;38:225-236.
31. Sarchielli P, Messina P, Cupini LM, et al; SAMOHA Study Group. Sodium valproate in migraine without aura and medication overuse headache: a randomized controlled trial. Eur Neuropsychopharmacol. 2014;24:1289-1297.
32. Hagen K, Stovner LJ. A randomized controlled trial on medication-overuse headache: outcome after 1 and 4 years. Acta Neurol Scand Suppl. 2011;124(suppl 191):38-43.
33. Munksgaard SB, Bendtsen L, Jensen RH. Detoxification of medication-overuse headache by a multidisciplinary treatment programme is highly effective: a comparison of two consecutive treatment methods in an open-label design. Cephalalgia. 2012;32:834-844.
34. Silberstein S, Lipton R, Dodick D, et al. Topiramate treatment of chronic migraine: a randomized, placebo-controlled trial of quality of life and other efficacy measures. Headache. 2009;49:1153-1162.
35. Silberstein SD, Blumenfeld AM, Cady RK, et al. OnabotulinumtoxinA for treatment of chronic migraine: PREEMPT 24-week pooled subgroup analysis of patients who had acute headache medication overuse at baseline. J Neurol Sci. 2013;331:48-56.
36. Sandrini G, Perrotta A, Tassorelli C, et al. Botulinum toxin type-A in the prophylactic treatment of medication-overuse headache: a multicenter, double-blind, randomized, placebo-controlled, parallel group study. J Headache Pain. 2011;12:427-433.
37. Tepper SJ. CGRP and headache: a brief review. Neurol Sci. 2019;40(suppl 1):99-105.
38. Diener H-C, Dodick D, Evers S, et al. Pathophysiology, prevention and treatment of medication overuse headache. Lancet Neurol. 2019;18:891-902.
39. Krymchantowski AV, Barbosa JS. Prednisone as initial treatment of analgesic-induced daily headache. Cephalalgia. 2000;20:107-113.
40. Bøe MG, Mygland A, Salvesen R. Prednisolone does not reduce withdrawal headache: a randomized, double-blind study. Neurology. 2007;69:26-31.
41. Paolucci M, Altamura C, Brunelli N, et al. Methylprednisolone plus diazepam i.v. as bridge therapy for medication overuse headache. Neurol Sci. 2017;38:2025-2029.
42. Taghdiri F, Togha M, Razeghi Jahromi S, et al. Celecoxib vs prednisone for the treatment of withdrawal headache in patients with medication overuse headache: a randomized, double-blind clinical trial. Headache. 2015;55:128-135.
43. Ramsey RR, Ryan JL, Hershey AD, et al. Treatment adherence in patients with headache: a systematic review. Headache. 2014;54:795-816.
44. Katsarava Z, Muessig M, Dzagnidze A, et al. Medication overuse headache: rates and predictors for relapse in a 4-year prospective study. Cephalalgia. 2005;25:12-15.
45. Silberstein SD, Holland S, Freitag F, et al; . Evidence-based guideline update: pharmacologic treatment for episodic migraine prevention in adults: report of the Quality Standards Subcommittee of the American Academy of Neurology and the American Headache Society. Neurology. 2012; 78:1137-1145.
Medication overuse headache (MOH), a secondary headache diagnosis, is a prevalent phenomenon that complicates headache diagnosis and treatment, increases the cost of care, and reduces quality of life. Effective abortive medication is essential for the headache sufferer; when an abortive is used too frequently, however, headache frequency increases—potentially beginning a cycle in which the patient then takes more medication to abort the headache. Over time, the patient suffers from an ever-increasing number of headaches, takes even more abortive medication, and so on. In the presence of MOH, there is a reduction in pain response to preventive and abortive treatments; when medication overuse is eliminated, pain response improves.1
Although MOH is well recognized among headache specialists, the condition is often overlooked in primary care. Since headache is a top complaint in primary care, however, and prevention is a major goal in family medicine, the opportunity for you to recognize, treat, and prevent MOH is significant. In fact, a randomized controlled trial showed that brief patient education about headache care and MOH provided by a primary care physician can lead to a significant reduction in headache frequency among patients with MOH.2
This article reviews the recognition and diagnosis of MOH, based on historical features and current criteria; addresses risk factors for abortive medication overuse and how to withdraw an offending agent; and explores the value of bridging and preventive therapies to reduce the overall frequency of headache.
What defines MOH?
Typically, MOH is a chronification of a primary headache disorder. However, in patients with a history of migraine who are undergoing treatment for another chronic pain condition with an opioid or other analgesic, MOH can be induced.3 An increase in the frequency of headache raises the specter of a concomitant increase in the level of disability4; psychiatric comorbidity5; and more headache days, with time lost from school and work.
The Migraine Disability Assessment (MIDAS) questionnaire, a validated instrument that helps the provider (1) measure the impact that headache has on a patient’s life and (2) follow treatment progress, also provides information to employers and insurance companies on treatment coverage and the need for work modification. The MIDAS score is 3 times higher in patients with MOH than in patients with episodic migraine.6,7
The annual associated cost per person of MOH has been estimated at $4000, resulting in billions of dollars in associated costs8; most of these costs are related to absenteeism and disability. After detoxification for MOH, annual outpatient medication costs are reduced by approximately 24%.9
Efforts to solve a common problem create another
Headache affects nearly 50% of the general population worldwide,10 accounting for about 4% of primary care visits11 and approximately 20% of outpatient neurology consultations.12 Although inpatient stays for headache are approximately half the duration of the overall average hospital stay, headache accounts for 3% of admissions.13 According to the Global Burden of Disease study, tension-type headache, migraine, and MOH are the 3 most common headache disorders.10 Headache is the second leading cause of disability among people 15 to 49 years of age.10
Continue to: The prevalence of MOH...
The prevalence of MOH in the general population is 2%.7,14,15 A population-based study showed that the rate of progression from episodic headache (< 15 d/mo) to chronic headache (≥ 15 d/mo) in the general population is 2.5% per year16; however, progression to chronic headache is 14% per year in patients with medication overuse. One-third of the general population with chronic migraine overuses symptomatic medication; in US headache clinics, roughly one-half of patients with chronic headache overuse acute medication.6
Definitions and diagnosis
MOH is a secondary headache diagnosis in the third edition of the International Classification of Headache Disorders (ICHD-3) (TABLE 1),17 which lists diagnostic criteria for recognized headache disorders.
Terminology. MOH has also been called rebound headache, drug-induced headache, and transformed migraine, but these terms are outdated and are not formal diagnoses. Patients sometimes refer to substance-withdrawal headaches (not discussed in this article) as rebound headaches, so clarity is important when discussing headache with patients: namely, that MOH is an exacerbation of an existing headache condition caused by overuse of abortive headache medications, including analgesics, combination analgesics, triptans, barbiturates, and opioids.
MOH was recognized in the early 1950s and fully differentiated as a diagnosis in 2005 in the second edition of the ICHD. The disorder is subcategorized by offending abortive agent (TABLE 217) because the frequency of analgesic use required to develop MOH differs by agent.
Risk factors for MOH and chronification of a primary headache disorder. There are several risk factors for developing MOH, and others that contribute to increasing headache frequency in general (TABLE 35,14,18-23). Some risk factors are common to each. All are important to address because some are modifiable.
Continue to: Pathophysiology
Pathophysiology. The pathophysiology and psychology behind MOH are largely unknown. Physiologic changes in pain processing and functional imaging changes have been demonstrated in patients with MOH, both of which are reversible upon withdrawal of medication.23 Genetic factors and changes in hormone and neurotransmitter levels are found in MOH patients; this is not the case in patients who have an episodic headache pattern only.24
Presentation. Diagnostic criteria for MOH do not include clinical characteristics. Typically, the phenotype of MOH in a given patient is similar to the underlying primary headache25—although this principle can be complicated to tease out because these medications can suppress some symptoms. Diagnosis of a primary headache disorder should be documented along with the diagnosis of MOH.
Medication overuse can exist without MOH: Not every patient who frequently uses an abortive medication develops MOH.
Treatment is multifaceted—and can become complex
Mainstays of treatment of MOH are education about the disorder and detoxification from the overused agent, although specific treatments can differ depending on the agent involved, the frequency and duration of its use, and a patient’s behavioral patterns and psychiatric comorbidities. Often, a daily medication to prevent headache is considered upon, or after, withdrawal of the offending agent. The timing of introducing a preventive might impact its effectiveness. Some refractory cases require more intensive therapy, including hospitalization at a specialized tertiary center.
But before we look at detoxification from an overused agent, it’s important to review one of the best strategies of all in combatting MOH.
Continue to: First and best strategy
First and best strategy: Avoid onset of MOH
Select an appropriate abortive to reduce the risk of MOH. With regard to specific acute headache medications, some nuances other than type of headache should be considered. Nonsteroidal anti-inflammatory drugs (NSAIDs) are recommended as abortive therapy by the American Headache Society for their efficacy, favorable adverse effect profile, and low cost. NSAIDs are protective against development of MOH if a patient’s baseline headache frequency is < 10/mo; at a frequency of 10 to 14 d/mo, however, the risk of MOH increases when using an NSAID.6 A similar effect has been seen with triptans.16 Longer-acting NSAIDs, such as nabumetone and naproxen, have been proposed as less likely to cause MOH, and are even used as bridging therapy sometimes (as long as neither of these was the overused medication).26
The time it takes to develop MOH is shortest with triptans, followed by ergots, then analgesics.27
Prospective cohort studies6,16 have shown that barbiturates and opioids are more likely to induce MOH; for that reason, agents in these analgesic classes are almost universally avoided unless no other medically acceptable options exist. Using barbiturate-containing compounds or opioids > 4 d/mo exponentially increases the likelihood of MOH.
Promising preclinical data demonstrate that the gepant, or small-molecule calcitonin gene-related peptide (CGRP) receptor antagonist, class of medications used as abortive therapy does not induce medication overuse cutaneous allodynia.28
Provide education. Primary prevention of MOH involves (1) increasing patients’ awareness of how to take medications appropriately and (2) restricting intake of over-the-counter abortive medications. Often, the expert recommendation is to limit abortives to approximately 2 d/wk because more frequent use places patients at risk of further increased use and subsequent MOH.
Continue to: A randomized controlled trial in Norway...
A randomized controlled trial in Norway compared outcomes in 2 groups of patients with MOH: One group was given advice on the disorder by a physician; the other group was not provided with advice. In the “business-as-usual” group, there was no significant improvement; however, when general practitioners provided simple advice (lasting roughly 9 minutes) about reducing abortive medication use to a safe level and cautioned patients that they would be “feeling worse before feeling better,” headache days were reduced by approximately 8 per month and medication days, by 16 per month.2
A subsequent, long-term follow-up study29 of patients from the Norway trial2 who had been given advice and education showed a relapse rate (ie, into overuse of headache medication) of only 8% and sustained reduction of headache days and medication use at 16 months.
Offer support and other nondrug interventions. A recent review of 3 studies23 recommended that extra support for patients from a headache nurse, close follow-up, keeping an electronic diary that provides feedback, and undertaking a short course of psychotherapy can reduce medication overuse and prevent relapse.
If MOH develops, initiate withdrawal, introduce a preventive
Withdraw overused medication. Most current evidence suggests that withdrawal of the offending agent is the most effective factor in reducing headache days and improving quality of life. A randomized controlled trial compared the effects of (1) complete and immediate withdrawal of an abortive medication with (2) reducing its use (ie, limiting intake to 2 d/wk), on headache frequency, disability, and quality of life.30 There was a reduction of headache days in both groups; however, reduction was much greater at 2 months in the complete withdrawal group than in the restricted intake group (respectively, a 41% and a 26% reduction in headache days per month). This effect was sustained at 6 and 12 months in both groups. The study confirmed the results of earlier research2,15: Abrupt withdrawal leads to reversion to an episodic pattern at 2 to 6 months in approximately 40% to 60% of patients.
More studies are needed to determine the most appropriate treatment course for MOH; however, complete withdrawal of the causative drug is the most important intervention.
Continue to: Consider withdrawal plus preventive treatment
Consider withdrawal plus preventive treatment. Use of sodium valproate, in addition to medication overuse detoxification, led to a significant reduction in headache days and improvement in quality of life at 12 weeks but no difference after 24 weeks, compared with detoxification alone in a randomized, double-blind, placebo-controlled study.31
A study of 61 patients showed a larger reduction (by 7.2 d/mo) in headache frequency with any preventive medication in addition to medication withdrawal, compared to withdrawal alone (by 4.1 d/mo) after 3 months; however, the relative benefit was gone at 6 months.32
A study of 98 patients compared immediate and delayed initiation of preventive medication upon withdrawal of overused abortive medication.33 Response was defined as a > 50% reduction in headache frequency and was similar in both groups; results showed a 28% response with immediate initiation of a preventive; a 23% response with delayed (ie, 2 months after withdrawal) initiation; and a 48% response in both groups at 12 months.
Collectively, these studies suggest that adding a preventive medication at the time of withdrawal has the potential to reduce headache frequency more quickly than withdrawal alone. However, after 3 to 6 months, the outcome of reduced headache frequency is the same whether or not a preventive medication is used—as long as the offending agent has been withdrawn.
Do preventives work without withdrawing overused medication? Patients with MOH often show little or no improvement with addition of a preventive medication only; their response to a preventive improves after withdrawal of the overused medication. Patients without previous headache improvement after addition of a preventive, who also did not improve 2 months after withdrawal, then demonstrated an overall reduction in headache by 26% when a preventive was reintroduced after withdrawal.2
Continue to: The research evidence for preventives
The research evidence for preventives. Medications for headache prevention have not been extensively evaluated specifically for treating MOH. Here is what’s known:
- Flunarizine, amitriptyline, and beta-blockers usually are ineffective for MOH.24
- Results for topiramate are mixed: A small, double-blind, placebo-controlled chronic migraine study in Europe showed that, in a subgroup of patients with MOH, topiramate led to a small but significant reduction (3.5 d/mo) in headache frequency, compared to placebo.27 A similar study done in the United States did not show a significant difference between the active-treatment and placebo groups.34
- Findings regarding onabotulinumtoxinA are intriguing: In a posthoc analysis of onabotulinumtoxinA to treat chronic migraine, patients with MOH who did not undergo detoxification had an 8 d/mo greater reduction in headache, compared to placebo.35 However, when compared to placebo in conjunction with detoxification, onabotulinumtoxinA demonstrated no benefit.36
- Newer CGRP antagonist and CGRP receptor antagonist monoclonal antibodies are successful preventive medications that have demonstrated a reduction in acute medication use days per month and headache days per month37; these compounds have not been compared to withdrawal alone.
Reducing the severity and duration of withdrawal symptoms
Withdrawal from overused abortive headache medications can lead to worsening headache, nausea, vomiting, hypotension, tachycardia, sleep disturbances, restlessness, anxiety, and nervousness. Symptoms usually last 2 to 10 days but can persist for as long as 4 weeks; duration of withdrawal symptoms varies with the medication that is being overused. In patients who have used a triptan, for example, mean duration of withdrawal is 4.1 days; ergotamine, 6.7 days; and NSAIDs, 9.5 days.23 Tapered withdrawal is sometimes recommended with opioids and barbiturates to reduce withdrawal symptoms. It is unclear whether starting a preventive medication during withdrawal assists in reducing withdrawal symptoms.38
Bridging therapy to reduce symptoms of withdrawal is often provided despite debatable utility. Available evidence does not favor one agent or method but suggests some strategies that could be helpful:
- A prednisone taper has a potential role during the first 6 days of withdrawal by reducing rebound headache and withdrawal symptoms39; however, oral prednisolone has been shown to have no benefit.40
- Alone, IV methylprednisolone seems not to be of benefit; however, in a retrospective study of 94 patients, IV methylprednisolone plus diazepam for 5 days led to a significant reduction in headache frequency and drug consumption that was sustained after 3 months.41
- Celecoxib was compared to prednisone over a 20-day course: a celecoxib dosage of 400 mg/d for the first 5 days, tapered by 100 mg every 5 days, and an oral prednisone dosage of 75 mg/d for the first 5 days, then tapered every 5 days. Patients taking celecoxib had lower headache intensity but there was no difference in headache frequency and acute medication intake between the groups.42
Other strategies. Using antiemetics and NSAIDs to reduce withdrawal symptoms is widely practiced, but no placebo-controlled trials have been conducted to support this strategy.
Patients in withdrawal might be more likely to benefit from inpatient care if they have a severe comorbidity, such as opioid or barbiturate use; failure to respond to, tolerate, or adhere to treatment; or relapse after withdrawal.38
Continue to: Cognitive behavioral therapy...
Cognitive behavioral therapy, exercise, a headache diary, and biofeedback should be considered in every patient’s treatment strategy because a multidisciplinary approach increases adherence and leads to improvement in headache frequency and a decrease in disability and medication use.43
Predictors of Tx success
A prospective cohort study determined that the rate of MOH relapse is 31% at 6 months, 41% at 1 year, and 45% at 4 years, with the highest risk of relapse during the first year.44 Looking at the correlation between type of medication overused and relapse rate, the research indicates that
- triptans have the lowest risk of relapse,44
- simple analgesics have a higher risk of relapse than triptans,22,44 and
- opioids have the highest risk of relapse.22
Where the data don’t agree. Data on combination analgesics and on ergots are conflicting.22 In addition, data on whether the primary type of headache predicts relapse rate conflict; however, migraine might predict a better outcome than tension-type headache.22
To recap and expand: Management pearls
The major goals of headache management generally are to rule out secondary headache, reach a correct diagnosis, reduce overall headache frequency, and provide effective abortive medication. A large component of reducing headache frequency is addressing and treating medication overuse.
Seek to understand the nature of the patient’s headache disorder. Components of the history are key in identifying the underlying headache diagnosis and ruling out other, more concerning secondary headache diagnoses. The ICHD-3 is an excellent resource for treating headache disorders because the classification lists specific diagnostic criteria for all recognized headache diagnoses.
Continue to: Medication withdrawal...
Medication withdrawal—with or without preventive medication—should reduce the frequency of MOH in 2 or 3 months. If headache does not become less frequent, however, the headache diagnosis might need to be reconsidered. Minimizing the use of abortive medication is generally recommended, but reduction or withdrawal of these medications does not guarantee that patients will revert to an episodic pattern of headache.
Treating withdrawal symptoms is a reasonable approach in some patients, but evidence does not support routinely providing bridging therapy.
Apply preventives carefully. Abortive medication withdrawal should generally be completed before initiating preventive medication; however, over the short term, starting preventive therapy while withdrawing the overused medication could assist in reducing headache frequency rapidly. This strategy can put patients at risk of medication adverse effects and using the medications longer than necessary, yet might be reasonable in certain patients, given their comorbidities, risk of relapse, and physician and patient preference. A preventive medication for an individual patient should generally be chosen in line with recommendations of the American Academy of Neurology45 and on the basis of the history and comorbidities.
Provide education, which is essential to lowering barriers to success. Patients with MOH must be counseled to understand that (1) a headache treatment that is supposed to be making them feel better is, in fact, making them feel worse and (2) they will get worse before they get better. Many patients are afraid to be without medication to use as needed. It is helpful to educate them on the different types of treatments (abortive, preventive); how MOH interferes with headache prophylaxis and medication efficacy; how MOH alters brain function (ie, aforementioned physiologic changes in pain processing and functional imaging changes23); and that such change is reversible when medication is withdrawn.
ACKNOWLEDGEMENT
The author thanks Jeffrey Curtis, MD, MPH, for his support and editing assistance with the manuscript.
CORRESPONDENCE
Allison Crain, MD, 2927 N 7th Avenue, Phoenix, AZ 85013; [email protected].
1. Zeeberg P, Olesen J, Jensen R. Discontinuation of medication overuse in headache patients: recovery of therapeutic responsiveness. Cephalalgia. 2006;26:1192-1198.
2. Kristoffersen ES, Straand J, Vetvik KG, et al. Brief intervention for medication-overuse headache in primary care. The BIMOH study: a double-blind pragmatic cluster randomised parallel controlled trial. J Neurol Neurosurg Psychiatry. 2015;86:505-512.
3. Bahra A, Walsh M, Menon S, et al. Does chronic daily headache arise de novo in association with regular use of analgesics? Headache. 2003;43:179-190.
4. Blumenfeld AM, Varon SF, Wilcox TK, et al. Disability, HRQoL and resource use among chronic and episodic migraineurs: results from the International Burden of Migraine Study (IBMS) Cephalalgia. 2011;31:301-315.
5. Chu H-T, Liang C-S, Lee J-T, et al. Associations between depression/anxiety and headache frequency in migraineurs: a cross-sectional study. Headache. 2018;58:407-415.
6. Bigal ME, Lipton RB. Excessive acute migraine medication use and migraine progression. Neurology. 2008;71:1821-1828.
7. Colás R, Muñoz P, Temprano R, et al. Chronic daily headache with analgesic overuse: epidemiology and impact on quality of life. Neurology. 2004;62:1338-1342.
8. Linde M, Gustavsson A, Stovner LJ, et al. The cost of headache disorders in Europe: the Eurolight project. Eur J Neurol. 2012;19:703-711.
9. Shah AM, Bendtsen L, Zeeberg P, et al. Reduction of medication costs after detoxification for medication-overuse headache. Headache. 2013;53:665-672.
10. . Global, regional, and national burden of migraine and tension-type headache, 1990–2016: a systematic analysis for the Global Burden of Disease Study 2016. Lancet Neurol. 2018;17:954-976.
11. Kernick D, Stapley S, Goadsby PJ, et al. What happens to new-onset headache presenting to primary care? A case–cohort study using electronic primary care records. Cephalalgia. 2008;28:1188-1195.
12. Stone J, Carson A, Duncan R, et al. Who is referred to neurology clinics?—the diagnoses made in 3781 new patients. Clin Neurol Neurosurg. 2010;112:747-751.
13. Munoz-Ceron J, Marin-Careaga V, L, et al. Headache at the emergency room: etiologies, diagnostic usefulness of the ICHD 3 criteria, red and green flags. PloS One. 2019;14:e0208728.
14. Evers S, Marziniak M. Clinical features, pathophysiology, and treatment of medication-overuse headache. Lancet Neurol. 2010;9:391-401.
15. Tassorelli C, Jensen R, Allena M, et al; the . A consensus protocol for the management of medication-overuse headache: evaluation in a multicentric, multinational study. Cephalalgia. 2014;34:645-655.
16. Bigal ME, Serrano D, Buse D, et al. Acute migraine medications and evolution from episodic to chronic migraine: a longitudinal population-based study. Headache. 2008;48:1157-1168.
17. Headache Classification Committee of the International Headache Society (IHS). The International Classification of Headache Disorders, 3rd edition. Cephalalgia. 2018;38:1-211.
18. Ferrari A, Leone S, Vergoni AV, et al. Similarities and differences between chronic migraine and episodic migraine. Headache. 2007;47:65-72.
19. Hagen K, Linde M, Steiner TJ, et al. Risk factors for medication-overuse headache: an 11-year follow-up study. The Nord-Trøndelag Health Studies. Pain. 2012;153:56-61.
20. Katsarava Z, Schneewiess S, Kurth T, et al. Incidence and predictors for chronicity of headache in patients with episodic migraine. Neurology. 2004;62:788-790.
21. Lipton RB, Fanning KM, Buse DC, et al. Migraine progression in subgroups of migraine based on comorbidities: results of the CaMEO study. Neurology. 2019;93:e2224-e2236.
22. Munksgaard SB, Madsen SK, Wienecke T. Treatment of medication overuse headache—a review. Acta Neurol Scand. 2019;139:405-414.
23. Ferraro S, Grazzi L, Mandelli M, et al. Pain processing in medication overuse headache: a functional magnetic resonance imaging (fMRI) study. Pain Med. 2012;13:255-262.
24. Diener H-C, Holle D, Solbach K, et al. Medication-overuse headache: risk factors, pathophysiology and management. Nat Rev Neurol. 2016;12:575-583.
25. Limmroth V, Katsarava Z, Fritsche G, et al. Features of medication overuse headache following overuse of different acute headache drugs. Neurology. 2002;59:1011-1014.
26. Mauskop A, ed. Migraine and Headache. 2nd ed. Oxford University Press; 2013.
27. Diener H-C, Bussone G, Van Oene JC, et al; . Topiramate reduces headache days in chronic migraine: a randomized, double-blind, placebo-controlled study. Cephalalgia. 2007;27:814-823.
28. Navratilova E, Behravesh S, Oyarzo J, et al. Ubrogepant does not induce latent sensitization in a preclinical model of medication overuse headache Cephalalgia. 2020;40:892-902.
29. Kristoffersen ES, Straand J, Russell MB, et al. Lasting improvement of medication-overuse headache after brief intervention—a long-term follow-up in primary care. Eur J Neurol. 2017;24:883-891.
30. Carlsen LN, Munksgaard SB, Jensen RH, et al. Complete detoxification is the most effective treatment of medication-overuse headache: a randomized controlled open-label trial. Cephalalgia. 2018;38:225-236.
31. Sarchielli P, Messina P, Cupini LM, et al; SAMOHA Study Group. Sodium valproate in migraine without aura and medication overuse headache: a randomized controlled trial. Eur Neuropsychopharmacol. 2014;24:1289-1297.
32. Hagen K, Stovner LJ. A randomized controlled trial on medication-overuse headache: outcome after 1 and 4 years. Acta Neurol Scand Suppl. 2011;124(suppl 191):38-43.
33. Munksgaard SB, Bendtsen L, Jensen RH. Detoxification of medication-overuse headache by a multidisciplinary treatment programme is highly effective: a comparison of two consecutive treatment methods in an open-label design. Cephalalgia. 2012;32:834-844.
34. Silberstein S, Lipton R, Dodick D, et al. Topiramate treatment of chronic migraine: a randomized, placebo-controlled trial of quality of life and other efficacy measures. Headache. 2009;49:1153-1162.
35. Silberstein SD, Blumenfeld AM, Cady RK, et al. OnabotulinumtoxinA for treatment of chronic migraine: PREEMPT 24-week pooled subgroup analysis of patients who had acute headache medication overuse at baseline. J Neurol Sci. 2013;331:48-56.
36. Sandrini G, Perrotta A, Tassorelli C, et al. Botulinum toxin type-A in the prophylactic treatment of medication-overuse headache: a multicenter, double-blind, randomized, placebo-controlled, parallel group study. J Headache Pain. 2011;12:427-433.
37. Tepper SJ. CGRP and headache: a brief review. Neurol Sci. 2019;40(suppl 1):99-105.
38. Diener H-C, Dodick D, Evers S, et al. Pathophysiology, prevention and treatment of medication overuse headache. Lancet Neurol. 2019;18:891-902.
39. Krymchantowski AV, Barbosa JS. Prednisone as initial treatment of analgesic-induced daily headache. Cephalalgia. 2000;20:107-113.
40. Bøe MG, Mygland A, Salvesen R. Prednisolone does not reduce withdrawal headache: a randomized, double-blind study. Neurology. 2007;69:26-31.
41. Paolucci M, Altamura C, Brunelli N, et al. Methylprednisolone plus diazepam i.v. as bridge therapy for medication overuse headache. Neurol Sci. 2017;38:2025-2029.
42. Taghdiri F, Togha M, Razeghi Jahromi S, et al. Celecoxib vs prednisone for the treatment of withdrawal headache in patients with medication overuse headache: a randomized, double-blind clinical trial. Headache. 2015;55:128-135.
43. Ramsey RR, Ryan JL, Hershey AD, et al. Treatment adherence in patients with headache: a systematic review. Headache. 2014;54:795-816.
44. Katsarava Z, Muessig M, Dzagnidze A, et al. Medication overuse headache: rates and predictors for relapse in a 4-year prospective study. Cephalalgia. 2005;25:12-15.
45. Silberstein SD, Holland S, Freitag F, et al; . Evidence-based guideline update: pharmacologic treatment for episodic migraine prevention in adults: report of the Quality Standards Subcommittee of the American Academy of Neurology and the American Headache Society. Neurology. 2012; 78:1137-1145.
PRACTICE RECOMMENDATIONS
› Avoid prescribing barbiturates or opioids for a headache disorder. A
› Limit use of a headache-abortive medication to twice a week when starting a patient on the drug. C
› Consider providing bridging therapy during detoxification of the overused medication. C
› Do not provide a preventive medication without withdrawing the overused agent. A
Strength of recommendation (SOR)
A Good-quality patient-oriented evidence
B Inconsistent or limited-quality patient-oriented evidence
C Consensus, usual practice, opinion, disease-oriented evidence, case series

At-home exercises for 4 common musculoskeletal complaints
The mainstay of treatment for many musculoskeletal (MSK) complaints is physical or occupational therapy. But often an individual’s underlying biomechanical issue is one that can be easily addressed with a home exercise plan, and, in light of the COVID-19 pandemic, patients may wish to avoid in-person physical therapy. This article describes the rationale for, and methods of providing, home exercises for several MSK conditions commonly seen in the primary care setting.
General rehabilitation principles: First things first
With basic MSK complaints, focus on controlling pain and swelling before undertaking restoration of function. Tailor pharmacologic and nonpharmacologic options to the patient’s needs, using first-line modalities such as ice and compression to reduce inflammation, and prescribing scheduled doses of an anti-inflammatory medication to help with both pain and inflammation.
Once pain is sufficiently controlled, have patients begin basic rehabilitation with simple range-of-motion exercises that move the injured region through normal patterns, as tolerated. Later, the patient can progress through more specific exercises to return the injured region to full functional capacity.
Explain to patients that it takes about 7 to 10 days of consistent care to decrease inflammation, but that they should begin prescribed exercises once they are able to tolerate them. Plan a follow-up visit in 2 to 3 weeks to check on the patient’s response to prescribed care.
Which is better, ice or heat?
Ice and heat are both commonly used to treat MSK injuries and pain, although scrutiny of the use of either intervention has increased. Despite the widespread use of these modalities, there is little evidence to support their effect on patient outcomes. The historical consensus has been that ice decreases pain, inflammation, and edema,while heat can facilitate movement in rehabilitation by improving blood flow and decreasing stiffness.1-3 In our practice, we encourage use of both topical modalities as a way to start exercise therapy when pain from the acute injury limits participation. Patients often ask which modality they should use. Ice is generally applied in the acute injury phase (48-72 hours after injury), while heat has been thought to be more beneficial in the chronic stages.
Ccontinue to: When and how to apply ice
When and how to apply ice. Applying an ice pack or a bag of frozen vegetables directly to the affected area will help control pain and swelling. Ice should be applied for 15 to 20 minutes at a time, once an hour. If a patient has sensitivity to cold or if the ice pack is a gel-type, have the patient place a layer (eg, towel) between the ice and skin to avoid injury to the skin. Additional caution should be exercised in patients with peripheral vascular disease, cryoglobulinemia, Raynaud disease, or a history of frostbite at the site.4
An alternative method we sometimes recommend is ice-cup massage. The patient can fill a small paper cup with water and freeze it. The cup is then used to massage the injured area, providing a more active method of icing whereby the cold can penetrate more quickly. Ice-cup massage should be done for 5 to 10 minutes, 3 to 4 times a day.
When and how to apply heat. Heat will help relax and loosen muscles and is a preferred treatment for older injuries, chronic pain, muscle tension, and spasms.5 Because heat can increase blood flow and, likely, inflammation, it should not be used in the acute injury phase. A heating pad or a warm, wet towel can be applied for up to 20 minutes at a time to help relieve pain and tension. Heat is also beneficial before participating in rehab activities as a method of “warming up” a recently injured area.6 However, ice should still be used following activity to prevent any new inflammation.
Anti-inflammatory medications
For an acute injury, nonsteroidal anti-inflammatory drugs (NSAIDs) not only can decrease inflammation and aid in healing but can alleviate pain. We typically start with over-the-counter (OTC) NSAIDs taken on a schedule. A good suggestion is to have the patient take the scheduled NSAID with food for 7 to 10 days or until symptoms subside.
Topical analgesics
Because oral medications can occasionally cause adverse effects or be contraindicated in some patients, topical analgesics can be a good substitute due to their minimal adverse effects. Acceptable topical medications include NSAIDs, lidocaine, menthol, and arnica. Other than prescribed topical NSAIDs, these products can be applied directly to the painful area on an as-needed basis. Often, a topical patch is a nice option to recommend for use during work or school, and a topical cream or ointment can be used at bedtime.
Continue to: Graduated rehabilitation
Graduated rehabilitation
The following 4 common MSK injuries are ones that can benefit from a graduated approach to rehabilitation at home.
Lateral ankle sprain
Lateral ankle sprain, usually resulting from an inversion mechanism, is the most common type of acute ankle sprain seen in primary care and sports medicine settings.7-9 The injury causes lateral ankle pain and swelling, decreased range of motion and strength, and pain with weight-bearing activities.
Treatment and rehabilitation after this type of injury are critical to restoring normal function and increasing the likelihood of returning to pre-injury levels of activity.9,10 Goals for an acute ankle sprain include controlling swelling, regaining full range of motion, increasing muscle strength and power, and improving balance.
Phase 1: Immediately following injury, have the patient protect the injured area with rest, ice, compression, and elevation (RICE). This will help to decrease swelling and pain. Exercises to regain range of motion, such as stretching and doing ankle “ABCs,” should begin within 48 to 72 hours of the initial injury (TABLE 1).9-11
Continue to: Phase 2
Phase 2: Once the patient has achieved full range of motion and pain is controlled, begin the process of regaining strength. The 4-way ankle exercise program (with elastic tubing) is an easy at-home exercise that has been shown to improve strength in plantar flexion, dorsiflexion, eversion, and inversion (TABLE 1).9-11
Phase 3: Once your patient is able to bear full weight with little to no pain, begin a balance program (TABLE 19-11). This is the most frequently neglected component of rehabilitation and the most common reason patients return with chronic ankle pain or repeat ankle injuries. Deficits in postural stability and balance have been reported in unstable ankles following acute ankle sprains,10,12-15 and studies have shown that individuals with poor stability are at a greater risk of injury.13-16

For most lateral ankle sprains, patients can expect time to recovery to range from 2 to 8 weeks. Longer recoveries are associated with more severe injuries or those that involve the syndesmosis.
Plantar fasciitis
Plantar fasciitis (PF) of the foot can be frustrating for a patient due to its chronic nature. Most patients will present with pain in the heel that is aggravated by weight-bearing activities. A conservative management program that focuses on reducing pain and inflammation, reducing tissue stress, and restoring strength and flexibility has been shown to be effective for this type of injury.17,18

Step 1: Reduce pain and inflammation. Deep-tissue massage and cryotherapy are easy ways to help with pain and inflammation. Deep-tissue massage can be accomplished by rolling the bottom of the foot on a golf or lacrosse ball. A favorite recommendation of ours to reduce inflammation is to use the ice-cup massage, mentioned earlier, for 5 minutes. Or rolling the bottom of the foot on a frozen water bottle will accomplish both tasks at once (TABLE 217,18).
Step 2: Reduce tissue stress. Management tools commonly used to reduce tissue stress are OTC orthotics and night splints. The night splint has been shown to improve symptoms,but patients often stop using it due to discomfort.19 Many kinds of night splints are available, but we have found that the sock variety with a strap to keep the foot in dorsiflexion is best tolerated, and it should be covered by most care plans.
Continue to: Step 3
Step 3: Restore muscle strength and flexibility. Restoring flexibility of the gastrocnemius and soleus is most frequently recommended for treating PF. Strengthening exercises that involve intrinsic and extrinsic muscles of the foot and ankle are also essential.17,18 Helpful exercises include those listed in TABLE 1.9-11 Additionally, an eccentric heel stretch can help to alleviate PF symptoms (TABLE 217,18).
A reasonable timeline for follow-up on newly diagnosed PF is 4 to 6 weeks. While many patients will not have recovered in that time, the goal is to document progress in recovery. If no progress is made, consider other treatment modalities.

Patellofemoral pain syndrome
Patellofemoral pain syndrome (PFPS) is one of the most common orthopedic complaints, estimated to comprise 7.3% of all orthopedic visits.20 Commonly called “runner’s knee,” PFPS is the leading cause of anterior knee pain in active individuals. Studies suggest a gender bias, with PFPS being diagnosed more frequently in females than in males, particularly between the ages of 10 and 19.20 Often, there is vague anterior knee pain, or pain that worsens with activities such as climbing hills or stairs, or with long sitting or when fatigued.
In general, unbalanced patellar tracking within the trochlear groove likely leads to this pain. Multiple contributory factors have been described; however, evidence increasingly has shown that deficiencies in hip strength may contribute significantly to maltracking of the patella with resultant pain. Specifically, weakness in hip external rotators and abductors is associated with abnormal lower extremity mechanics.21 One randomized controlled trial by Ferber et al found that therapy protocols directed at hip and core strength showed earlier resolution of pain and greater strength when compared with knee protocols alone.22
We routinely talk to patients about how the knee is the “victim” caught between weak hips and/or flat feet. It is prudent to look for both in the office visit. This can be done with one simple maneuver: Ask your patient to do a squat followed by 3 or 4 single-leg squats on each side. This will often reveal dysfunction at the foot/ankle or weakness in the hips/core as demonstrated by pronated feet (along with valgus tracking of the knees inward) or loss of balance upon squatting.
There is general consensus that a nonsurgical approach is the mainstay of treatment for PFPS.23 Pelvic stabilization and hip strengthening are standard components along with treatment protocols of exercises tailored to one’s individual weaknesses.
Numerous types of exercises do not require specialized equipment and can be taught in the office (TABLE 324). Explain to patients that the recovery process may take several months. Monthly follow-up to document progress is essential and helps to ensure compliance with one’s home program.


Continue to : Neck pain
Neck pain
The annual prevalence of nonspecific neck pain ranges from 27% to 48%, with 70% of individuals being afflicted at some time in their lives.25 First rule out any neurologic factors that might suggest cervical disc disease or spinal stenosis. If a patient describes weakness or sensory changes along one or both upper extremities, obtain imaging and consider more formalized therapy with a physical therapist.
In patients without any red flags, investigate possible biomechanical causes. It is essential to review the patient’s work and home habits, particularly in light of COVID-19, to determine if adjustments may be needed. Factors to consider are desk and computer setups at work or home, reading or laptop use in bed, sleep habits, and frequency of cellular phone calls/texting.26 A formal ergonomic assessment of the patient’s workplace may be helpful.
A mainstay in treating mechanical neck pain is alleviating trapezial tightness or spasm. Manipulative therapies such as osteopathic manipulation, massage, and chiropractic care can provide pain relief in the acute setting as well as help with control of chronic symptoms.27 A simple self-care tool is using a tennis ball to massage the trapezial muscles. This can be accomplished by having the patient position the tennis ball along the upper trapezial muscles, holding it in place by leaning against a wall, and initiating self-massage. Another method of self-massage is to put 2 tennis balls in an athletic tube sock and tie off the end, place the sock on the floor, and lie on it in the supine position.
There is also evidence that exercise of any kind can help control neck pain.28,29 The easiest exercises one can offer a patient with neck stiffness, or even mild cervical strains, is self-directed stretching through gentle pressure applied in all 4 directions on the neck. This technique can be repeated hourly both at work and at home (TABLE 4).

Reminders that can help ensure success
You can use the approaches described here for numerous other MSK conditions in helping patients on the road to recovery.
After the acute phase, advise patients to
• apply heat to the affected area before exercising. This can help bring blood flow to the region and promote ease of movement.
• continue icing the area following rehabilitation exercises in order to control exercise-induced inflammation.
• report any changing symptoms such as worsening pain, numbness, or weakness.
These techniques are one step in the recovery process. A home program can benefit the patient either alone or in combination with more advanced techniques that are best accomplished under the watchful eye of a physical or occupational therapist.
CORRESPONDENCE
Carrie A. Jaworski, MD, FAAFP, FACSM, 2180 Pfingsten Road, Suite 3100, Glenview, IL 60026; [email protected]
1. Hubbard TJ, Aronson SL, Denegar CR. Does cryotherapy hasten return to participation? A systematic review. J Athl Train. 2004;39:88-94.
2. Ho SS, Coel MN, Kagawa R, et al. The effects of ice on blood flow and bone metabolism in knees. Am J Sports Med. 1994;22:537-540.
3. Malanga GA, Yan N, Stark J. Mechanisms and efficacy of heat and cold therapies for musculoskeletal injury. Postgrad Med. 2015;127:57-65.
4. Bleakley CM, O’Connor S, Tully MA, et al. The PRICE study (Protection Rest Ice Compression Elevation): design of a randomised controlled trial comparing standard versus cryokinetic ice applications in the management of acute ankle sprain. BMC Musculoskelet Disord. 2007;8:125.
5. Mayer JM, Ralph L, Look M, et al. Treating acute low back pain with continuous low-level heat wrap therapy and/or exercise: a randomized controlled trial. Spine J. 2005;5:395-403.
6. Cetin N, Aytar A, Atalay A, et al. Comparing hot pack, short-wave diathermy, ultrasound, and TENS on isokinetic strength, pain, and functional status of women with osteoarthritic knees: a single-blind, randomized, controlled trial. Am J Phys Med Rehabil. 2008;87:443-451.
7. Waterman BR, Owens BD, Davey S, et al. The epidemiology of ankle sprains in the United States. J Bone Joint Surg Am. 2010;92:2279-2284.
8. Fong DT, Hong Y, Chan LK, et al. A systematic review on ankle injury and ankle sprain in sports. Sports Med. 2007;37:73-94.
9. Kerkhoffs GM, Rowe BH, Assendelft WJ, et al. Immobilisation and functional treatment for acute lateral ankle ligament injuries in adults. Cochrane Database Syst Rev. 2002(3):CD003762.
10. Mattacola CG, Dwyer MK. Rehabilitation of the ankle after acute sprain or chronic instability. J Ath Train. 2002;37:413-429.
11. Hü bscher M, Zech A, Pfeifer K, et al. Neuromuscular training for sports injury prevention: a systematic review. Med Sci Sports Exerc. 2010;42:413-421.
12. Emery CA, Meeuwisse WH. The effectiveness of a neuromuscular prevention strategy to reduce injuries in youth soccer: a cluster-randomised controlled trial. Br J Sports Med. 2010;44:555-562.
13. Tiemstra JD. Update on acute ankle sprains. Am Fam Physician. 2012;85:1170-1176.
14. Beynnon BD, Murphy DF, Alosa DM. Predictive factors for lateral ankle sprains: a literature review. J Ath Train. 2002;37:376-380.
15. Schiftan GS, Ross LA, Hahne AJ. The effectiveness of proprioceptive training in preventing ankle sprains in sporting populations: a systematic review and meta-analysis. J Sci Med Sport. 2015;18:238–244.
16. Hupperets MD, Verhagen EA, van Mechelen W. Effect of unsupervised home based proprioceptive training on recurrences of ankle sprain: randomised controlled trial. BMJ. 2009;339:b2684
17. Thompson JV, Saini SS, Reb CW, et al. Diagnosis and management of plantar fasciitis. J Am Osteopath Assoc. 2014;114:900-906.
18. DiGiovanni BF, Nawoczenski DA, Malay DP, et al. Plantar fascia-specific stretching exercise improves outcomes in patients with chronic plantar fasciitis. A prospective clinical trial with two-year follow-up. J Bone Joint Surg Am. 2006;88:1775-1781.

19. Lee SY, McKeon P, Hertel J. Does the use of orthoses improve self-reported pain and function measures in patients with plantar fasciitis? A meta-analysis. Phys Ther Sport. 2009;10:12-18.
20. Glaviano NR, Key M, Hart JM, et al. Demographic and epidemiological trends in patellofemoral pain. J Sports Phys Ther. 2015;10: 281-290.
21. Louden JK. Biomechanics and pathomechanics of the patellofemoral joint. Int J Sports Phys Ther. 2016;11: 820-830.
22. Ferber R, Bolgla L, Earl-Boehm JE, et al. Strengthening of hip and core versus knee muscles for the treatment of patellofemoral pain: a multicenter randomized controlled trial. J Ath Train. 2015;50: 366-377.
23. Collins NJ, Bisset LM, Crossley KM, et al. Efficacy of nonsurgical interventions for anterior knee pain: systematic review and meta-analysis of randomized trials. Sports Med. 2013;41:31-49.
24. Bolgla LA. Hip strength and kinematics in patellofemoral syndrome. In: Brotzman SB, Manske RC eds. Clinical Orthopaedic Rehabilitation. 3rd ed. Philadelphia, PA: Elsevier Mosby; 2011:273-274.
25. Hogg-Johnson S, van der Velde G, Carroll LJ, et al. The burden and determinants of neck pain in the general population: results of the Bone and Joint Decade 2000-2010 Task Force on Neck Pain and Its Associated Disorders. Spine. 2008;33(suppl 4):S39-S51.
26. Larsson B, Søgaard K, Rosendal L. Work related neck-shoulder pain: a review on magnitude, risk factors, biochemical characteristics, clinical picture and preventive interventions. Best Pract Res Clin Rheumatol. 2007; 21:447-463.
27. Giles LG, Muller R. Chronic spinal pain: a randomized clinical trial comparing medication, acupuncture, and spinal manipulation. Spine. 2003;28:1490-1502.
28. Bronfort G, Evans R, Anderson A, et al. Spinal manipulation, medication, or home exercise with advice for acute and subacute neck pain: a randomized trial. Ann Intern Med. 2012;156:1-10.
29. Evans R, Bronfort G, Bittell S, et al. A pilot study for a randomized clinical trial assessing chiropractic care, medical care, and self-care education for acute and subacute neck pain patients. J Manipulative Physiol Ther. 2003;26:403-411.
The mainstay of treatment for many musculoskeletal (MSK) complaints is physical or occupational therapy. But often an individual’s underlying biomechanical issue is one that can be easily addressed with a home exercise plan, and, in light of the COVID-19 pandemic, patients may wish to avoid in-person physical therapy. This article describes the rationale for, and methods of providing, home exercises for several MSK conditions commonly seen in the primary care setting.
General rehabilitation principles: First things first
With basic MSK complaints, focus on controlling pain and swelling before undertaking restoration of function. Tailor pharmacologic and nonpharmacologic options to the patient’s needs, using first-line modalities such as ice and compression to reduce inflammation, and prescribing scheduled doses of an anti-inflammatory medication to help with both pain and inflammation.
Once pain is sufficiently controlled, have patients begin basic rehabilitation with simple range-of-motion exercises that move the injured region through normal patterns, as tolerated. Later, the patient can progress through more specific exercises to return the injured region to full functional capacity.
Explain to patients that it takes about 7 to 10 days of consistent care to decrease inflammation, but that they should begin prescribed exercises once they are able to tolerate them. Plan a follow-up visit in 2 to 3 weeks to check on the patient’s response to prescribed care.
Which is better, ice or heat?
Ice and heat are both commonly used to treat MSK injuries and pain, although scrutiny of the use of either intervention has increased. Despite the widespread use of these modalities, there is little evidence to support their effect on patient outcomes. The historical consensus has been that ice decreases pain, inflammation, and edema,while heat can facilitate movement in rehabilitation by improving blood flow and decreasing stiffness.1-3 In our practice, we encourage use of both topical modalities as a way to start exercise therapy when pain from the acute injury limits participation. Patients often ask which modality they should use. Ice is generally applied in the acute injury phase (48-72 hours after injury), while heat has been thought to be more beneficial in the chronic stages.
Ccontinue to: When and how to apply ice
When and how to apply ice. Applying an ice pack or a bag of frozen vegetables directly to the affected area will help control pain and swelling. Ice should be applied for 15 to 20 minutes at a time, once an hour. If a patient has sensitivity to cold or if the ice pack is a gel-type, have the patient place a layer (eg, towel) between the ice and skin to avoid injury to the skin. Additional caution should be exercised in patients with peripheral vascular disease, cryoglobulinemia, Raynaud disease, or a history of frostbite at the site.4
An alternative method we sometimes recommend is ice-cup massage. The patient can fill a small paper cup with water and freeze it. The cup is then used to massage the injured area, providing a more active method of icing whereby the cold can penetrate more quickly. Ice-cup massage should be done for 5 to 10 minutes, 3 to 4 times a day.
When and how to apply heat. Heat will help relax and loosen muscles and is a preferred treatment for older injuries, chronic pain, muscle tension, and spasms.5 Because heat can increase blood flow and, likely, inflammation, it should not be used in the acute injury phase. A heating pad or a warm, wet towel can be applied for up to 20 minutes at a time to help relieve pain and tension. Heat is also beneficial before participating in rehab activities as a method of “warming up” a recently injured area.6 However, ice should still be used following activity to prevent any new inflammation.
Anti-inflammatory medications
For an acute injury, nonsteroidal anti-inflammatory drugs (NSAIDs) not only can decrease inflammation and aid in healing but can alleviate pain. We typically start with over-the-counter (OTC) NSAIDs taken on a schedule. A good suggestion is to have the patient take the scheduled NSAID with food for 7 to 10 days or until symptoms subside.
Topical analgesics
Because oral medications can occasionally cause adverse effects or be contraindicated in some patients, topical analgesics can be a good substitute due to their minimal adverse effects. Acceptable topical medications include NSAIDs, lidocaine, menthol, and arnica. Other than prescribed topical NSAIDs, these products can be applied directly to the painful area on an as-needed basis. Often, a topical patch is a nice option to recommend for use during work or school, and a topical cream or ointment can be used at bedtime.
Continue to: Graduated rehabilitation
Graduated rehabilitation
The following 4 common MSK injuries are ones that can benefit from a graduated approach to rehabilitation at home.
Lateral ankle sprain
Lateral ankle sprain, usually resulting from an inversion mechanism, is the most common type of acute ankle sprain seen in primary care and sports medicine settings.7-9 The injury causes lateral ankle pain and swelling, decreased range of motion and strength, and pain with weight-bearing activities.
Treatment and rehabilitation after this type of injury are critical to restoring normal function and increasing the likelihood of returning to pre-injury levels of activity.9,10 Goals for an acute ankle sprain include controlling swelling, regaining full range of motion, increasing muscle strength and power, and improving balance.
Phase 1: Immediately following injury, have the patient protect the injured area with rest, ice, compression, and elevation (RICE). This will help to decrease swelling and pain. Exercises to regain range of motion, such as stretching and doing ankle “ABCs,” should begin within 48 to 72 hours of the initial injury (TABLE 1).9-11
Continue to: Phase 2
Phase 2: Once the patient has achieved full range of motion and pain is controlled, begin the process of regaining strength. The 4-way ankle exercise program (with elastic tubing) is an easy at-home exercise that has been shown to improve strength in plantar flexion, dorsiflexion, eversion, and inversion (TABLE 1).9-11
Phase 3: Once your patient is able to bear full weight with little to no pain, begin a balance program (TABLE 19-11). This is the most frequently neglected component of rehabilitation and the most common reason patients return with chronic ankle pain or repeat ankle injuries. Deficits in postural stability and balance have been reported in unstable ankles following acute ankle sprains,10,12-15 and studies have shown that individuals with poor stability are at a greater risk of injury.13-16
For most lateral ankle sprains, patients can expect time to recovery to range from 2 to 8 weeks. Longer recoveries are associated with more severe injuries or those that involve the syndesmosis.
Plantar fasciitis
Plantar fasciitis (PF) of the foot can be frustrating for a patient due to its chronic nature. Most patients will present with pain in the heel that is aggravated by weight-bearing activities. A conservative management program that focuses on reducing pain and inflammation, reducing tissue stress, and restoring strength and flexibility has been shown to be effective for this type of injury.17,18
Step 1: Reduce pain and inflammation. Deep-tissue massage and cryotherapy are easy ways to help with pain and inflammation. Deep-tissue massage can be accomplished by rolling the bottom of the foot on a golf or lacrosse ball. A favorite recommendation of ours to reduce inflammation is to use the ice-cup massage, mentioned earlier, for 5 minutes. Or rolling the bottom of the foot on a frozen water bottle will accomplish both tasks at once (TABLE 217,18).
Step 2: Reduce tissue stress. Management tools commonly used to reduce tissue stress are OTC orthotics and night splints. The night splint has been shown to improve symptoms,but patients often stop using it due to discomfort.19 Many kinds of night splints are available, but we have found that the sock variety with a strap to keep the foot in dorsiflexion is best tolerated, and it should be covered by most care plans.
Continue to: Step 3
Step 3: Restore muscle strength and flexibility. Restoring flexibility of the gastrocnemius and soleus is most frequently recommended for treating PF. Strengthening exercises that involve intrinsic and extrinsic muscles of the foot and ankle are also essential.17,18 Helpful exercises include those listed in TABLE 1.9-11 Additionally, an eccentric heel stretch can help to alleviate PF symptoms (TABLE 217,18).
A reasonable timeline for follow-up on newly diagnosed PF is 4 to 6 weeks. While many patients will not have recovered in that time, the goal is to document progress in recovery. If no progress is made, consider other treatment modalities.
Patellofemoral pain syndrome
Patellofemoral pain syndrome (PFPS) is one of the most common orthopedic complaints, estimated to comprise 7.3% of all orthopedic visits.20 Commonly called “runner’s knee,” PFPS is the leading cause of anterior knee pain in active individuals. Studies suggest a gender bias, with PFPS being diagnosed more frequently in females than in males, particularly between the ages of 10 and 19.20 Often, there is vague anterior knee pain, or pain that worsens with activities such as climbing hills or stairs, or with long sitting or when fatigued.
In general, unbalanced patellar tracking within the trochlear groove likely leads to this pain. Multiple contributory factors have been described; however, evidence increasingly has shown that deficiencies in hip strength may contribute significantly to maltracking of the patella with resultant pain. Specifically, weakness in hip external rotators and abductors is associated with abnormal lower extremity mechanics.21 One randomized controlled trial by Ferber et al found that therapy protocols directed at hip and core strength showed earlier resolution of pain and greater strength when compared with knee protocols alone.22
We routinely talk to patients about how the knee is the “victim” caught between weak hips and/or flat feet. It is prudent to look for both in the office visit. This can be done with one simple maneuver: Ask your patient to do a squat followed by 3 or 4 single-leg squats on each side. This will often reveal dysfunction at the foot/ankle or weakness in the hips/core as demonstrated by pronated feet (along with valgus tracking of the knees inward) or loss of balance upon squatting.
There is general consensus that a nonsurgical approach is the mainstay of treatment for PFPS.23 Pelvic stabilization and hip strengthening are standard components along with treatment protocols of exercises tailored to one’s individual weaknesses.
Numerous types of exercises do not require specialized equipment and can be taught in the office (TABLE 324). Explain to patients that the recovery process may take several months. Monthly follow-up to document progress is essential and helps to ensure compliance with one’s home program.
Continue to : Neck pain
Neck pain
The annual prevalence of nonspecific neck pain ranges from 27% to 48%, with 70% of individuals being afflicted at some time in their lives.25 First rule out any neurologic factors that might suggest cervical disc disease or spinal stenosis. If a patient describes weakness or sensory changes along one or both upper extremities, obtain imaging and consider more formalized therapy with a physical therapist.
In patients without any red flags, investigate possible biomechanical causes. It is essential to review the patient’s work and home habits, particularly in light of COVID-19, to determine if adjustments may be needed. Factors to consider are desk and computer setups at work or home, reading or laptop use in bed, sleep habits, and frequency of cellular phone calls/texting.26 A formal ergonomic assessment of the patient’s workplace may be helpful.
A mainstay in treating mechanical neck pain is alleviating trapezial tightness or spasm. Manipulative therapies such as osteopathic manipulation, massage, and chiropractic care can provide pain relief in the acute setting as well as help with control of chronic symptoms.27 A simple self-care tool is using a tennis ball to massage the trapezial muscles. This can be accomplished by having the patient position the tennis ball along the upper trapezial muscles, holding it in place by leaning against a wall, and initiating self-massage. Another method of self-massage is to put 2 tennis balls in an athletic tube sock and tie off the end, place the sock on the floor, and lie on it in the supine position.
There is also evidence that exercise of any kind can help control neck pain.28,29 The easiest exercises one can offer a patient with neck stiffness, or even mild cervical strains, is self-directed stretching through gentle pressure applied in all 4 directions on the neck. This technique can be repeated hourly both at work and at home (TABLE 4).
Reminders that can help ensure success
You can use the approaches described here for numerous other MSK conditions in helping patients on the road to recovery.
After the acute phase, advise patients to
• apply heat to the affected area before exercising. This can help bring blood flow to the region and promote ease of movement.
• continue icing the area following rehabilitation exercises in order to control exercise-induced inflammation.
• report any changing symptoms such as worsening pain, numbness, or weakness.
These techniques are one step in the recovery process. A home program can benefit the patient either alone or in combination with more advanced techniques that are best accomplished under the watchful eye of a physical or occupational therapist.
CORRESPONDENCE
Carrie A. Jaworski, MD, FAAFP, FACSM, 2180 Pfingsten Road, Suite 3100, Glenview, IL 60026; [email protected]
1. Hubbard TJ, Aronson SL, Denegar CR. Does cryotherapy hasten return to participation? A systematic review. J Athl Train. 2004;39:88-94.
2. Ho SS, Coel MN, Kagawa R, et al. The effects of ice on blood flow and bone metabolism in knees. Am J Sports Med. 1994;22:537-540.
3. Malanga GA, Yan N, Stark J. Mechanisms and efficacy of heat and cold therapies for musculoskeletal injury. Postgrad Med. 2015;127:57-65.
4. Bleakley CM, O’Connor S, Tully MA, et al. The PRICE study (Protection Rest Ice Compression Elevation): design of a randomised controlled trial comparing standard versus cryokinetic ice applications in the management of acute ankle sprain. BMC Musculoskelet Disord. 2007;8:125.
5. Mayer JM, Ralph L, Look M, et al. Treating acute low back pain with continuous low-level heat wrap therapy and/or exercise: a randomized controlled trial. Spine J. 2005;5:395-403.
6. Cetin N, Aytar A, Atalay A, et al. Comparing hot pack, short-wave diathermy, ultrasound, and TENS on isokinetic strength, pain, and functional status of women with osteoarthritic knees: a single-blind, randomized, controlled trial. Am J Phys Med Rehabil. 2008;87:443-451.
7. Waterman BR, Owens BD, Davey S, et al. The epidemiology of ankle sprains in the United States. J Bone Joint Surg Am. 2010;92:2279-2284.
8. Fong DT, Hong Y, Chan LK, et al. A systematic review on ankle injury and ankle sprain in sports. Sports Med. 2007;37:73-94.
9. Kerkhoffs GM, Rowe BH, Assendelft WJ, et al. Immobilisation and functional treatment for acute lateral ankle ligament injuries in adults. Cochrane Database Syst Rev. 2002(3):CD003762.
10. Mattacola CG, Dwyer MK. Rehabilitation of the ankle after acute sprain or chronic instability. J Ath Train. 2002;37:413-429.
11. Hü bscher M, Zech A, Pfeifer K, et al. Neuromuscular training for sports injury prevention: a systematic review. Med Sci Sports Exerc. 2010;42:413-421.
12. Emery CA, Meeuwisse WH. The effectiveness of a neuromuscular prevention strategy to reduce injuries in youth soccer: a cluster-randomised controlled trial. Br J Sports Med. 2010;44:555-562.
13. Tiemstra JD. Update on acute ankle sprains. Am Fam Physician. 2012;85:1170-1176.
14. Beynnon BD, Murphy DF, Alosa DM. Predictive factors for lateral ankle sprains: a literature review. J Ath Train. 2002;37:376-380.
15. Schiftan GS, Ross LA, Hahne AJ. The effectiveness of proprioceptive training in preventing ankle sprains in sporting populations: a systematic review and meta-analysis. J Sci Med Sport. 2015;18:238–244.
16. Hupperets MD, Verhagen EA, van Mechelen W. Effect of unsupervised home based proprioceptive training on recurrences of ankle sprain: randomised controlled trial. BMJ. 2009;339:b2684
17. Thompson JV, Saini SS, Reb CW, et al. Diagnosis and management of plantar fasciitis. J Am Osteopath Assoc. 2014;114:900-906.
18. DiGiovanni BF, Nawoczenski DA, Malay DP, et al. Plantar fascia-specific stretching exercise improves outcomes in patients with chronic plantar fasciitis. A prospective clinical trial with two-year follow-up. J Bone Joint Surg Am. 2006;88:1775-1781.
19. Lee SY, McKeon P, Hertel J. Does the use of orthoses improve self-reported pain and function measures in patients with plantar fasciitis? A meta-analysis. Phys Ther Sport. 2009;10:12-18.
20. Glaviano NR, Key M, Hart JM, et al. Demographic and epidemiological trends in patellofemoral pain. J Sports Phys Ther. 2015;10: 281-290.
21. Louden JK. Biomechanics and pathomechanics of the patellofemoral joint. Int J Sports Phys Ther. 2016;11: 820-830.
22. Ferber R, Bolgla L, Earl-Boehm JE, et al. Strengthening of hip and core versus knee muscles for the treatment of patellofemoral pain: a multicenter randomized controlled trial. J Ath Train. 2015;50: 366-377.
23. Collins NJ, Bisset LM, Crossley KM, et al. Efficacy of nonsurgical interventions for anterior knee pain: systematic review and meta-analysis of randomized trials. Sports Med. 2013;41:31-49.
24. Bolgla LA. Hip strength and kinematics in patellofemoral syndrome. In: Brotzman SB, Manske RC eds. Clinical Orthopaedic Rehabilitation. 3rd ed. Philadelphia, PA: Elsevier Mosby; 2011:273-274.
25. Hogg-Johnson S, van der Velde G, Carroll LJ, et al. The burden and determinants of neck pain in the general population: results of the Bone and Joint Decade 2000-2010 Task Force on Neck Pain and Its Associated Disorders. Spine. 2008;33(suppl 4):S39-S51.
26. Larsson B, Søgaard K, Rosendal L. Work related neck-shoulder pain: a review on magnitude, risk factors, biochemical characteristics, clinical picture and preventive interventions. Best Pract Res Clin Rheumatol. 2007; 21:447-463.
27. Giles LG, Muller R. Chronic spinal pain: a randomized clinical trial comparing medication, acupuncture, and spinal manipulation. Spine. 2003;28:1490-1502.
28. Bronfort G, Evans R, Anderson A, et al. Spinal manipulation, medication, or home exercise with advice for acute and subacute neck pain: a randomized trial. Ann Intern Med. 2012;156:1-10.
29. Evans R, Bronfort G, Bittell S, et al. A pilot study for a randomized clinical trial assessing chiropractic care, medical care, and self-care education for acute and subacute neck pain patients. J Manipulative Physiol Ther. 2003;26:403-411.
PRACTICE RECOMMENDATIONS
❯ Have patients apply ice to an acute injury for 15 to 20 minutes at a time to help control inflammation, and prescribe an anti-inflammatory medication, if indicated. A
❯ Reserve heat application for use following the acute phase of injury to decrease stiffness. A
❯ Instruct patients who have an acute lateral ankle sprain to begin “ankle ABCs” and other range-of-motion exercises once acute pain subsides. C
❯ Consider recommending an eccentric heel stretch to help alleviate plantar fasciitis symptoms. C
Strength of recommendation (SOR)
A Good-quality patient-oriented evidence
B Inconsistent or limited-quality patient-oriented evidence
C Consensus, usual practice, opinion, disease-oriented evidence, case series

USPSTF update on sexually transmitted infections
In August 2020, the US Preventive Services Task Force published an update of its recommendation on preventing sexually transmitted infections (STIs) with behavioral counseling interventions.1
Whom to counsel. The USPSTF continues to recommend behavioral counseling for all sexually active adolescents and for adults at increased risk for STIs. Adults at increased risk include those who have been diagnosed with an STI in the past year, those with multiple sex partners or a sex partner at high risk for an STI, those not using condoms consistently, and those belonging to populations with high prevalence rates of STIs. These populations with high prevalence rates include1
- individuals seeking care at STI clinics,
- sexual and gender minorities, and
- those who are positive for human immunodeficiency virus (HIV), use injection drugs, exchange sex for drugs or money, or have recently been in a correctional facility.
Features of effective counseling. The Task Force recommends that primary care clinicians provide behavioral counseling or refer to counseling services or suggest media-based interventions. The most effective counseling interventions are those that span more than 120 minutes over several sessions. But the Task Force also states that counseling lasting about 30 minutes in a single session can also be effective. Counseling should include information about common STIs and their modes of transmission; encouragement in the use of safer sex practices; and training in proper condom use, how to communicate with partners about safer sex practices, and problem-solving. Various approaches to this counseling can be found at https://uspreventiveservicestaskforce.org/uspstf/recommendation/sexually-transmitted-infections-behavioral-counseling.
This updated recommendation is timely because most STIs in the United States have been increasing in incidence for the past decade or longer.2 Per 100,000 population, the total number of chlamydia cases since 2000 has risen from 251.4 to 539.9 (115%);gonorrhea cases since 2009 have risen from 98.1 to 179.1 (83%).3 And since 2000, the total number of reported syphilis cases per 100,000 has risen from 2.1 to 10.8 (414%).3
Chlamydia affects primarily those ages 15 to 24 years, with highest rates occurring in females (FIGURE 1).2 Gonorrhea affects women and men fairly evenly with slightly higher rates in men; the highest rates are seen in those ages 20 to 29 (FIGURE 2).2 Syphilis predominantly affects men who have sex with men, and the highest rates are in those ages 20 to 34 (FIGURE 3).2 In contrast to these upward trends, the number of HIV cases diagnosed has been relatively steady, with a slight downward trend over the past decade.4Other STIs that can be prevented through behavioral counseling include herpes simplex, human papillomavirus (HPV), hepatitis B virus (HBV) and trichomonas vaginalis.
Continue to: How to integrate STI preventioninto the primary care encounter
How to integrate STI preventioninto the primary care encounter
A key resource for learning to recognize the signs and symptoms of STIs, to correctly diagnose them, and to treat them according to CDC guidelines can be found at www.cdc.gov/std/tg2015/default.htm.5 Equally important is to integrate the prevention of STIs into the clinical routine by using a 4-step approach: risk assessment, risk reduction (counseling and chemoprevention), screening, and vaccination.
Risk assessment. The first step in prevention is taking a sexual history to accurately assess a patient’s risk for STIs. The CDC provides a tool (www.cdc.gov/std/products/provider-pocket-guides.htm) that can assist in gathering information in a nonjudgmental fashion about 5 Ps: partners, practices, protection from STIs, past history of STIs, and prevention of pregnancy.
Risk reduction. Following STI risk assessment, recommend risk-reduction interventions, as appropriate. Notable in the new Task Force recommendation are behavioral counseling methods that work. Additionally, when needed, pre-exposure prophylaxis with effective antiretroviral agents can be offered to those at high risk of HIV.6
Screening. Task Force recommendations for STI screening are described in the TABLE.7-12 Screening for HIV, chlamydia, gonorrhea, syphilis, and HBV are also recommended for pregnant women. And, although pregnant women are not specifically mentioned in the recommendation on chlamydia screening, it is reasonable to include it in prenatal care testing for STIs.
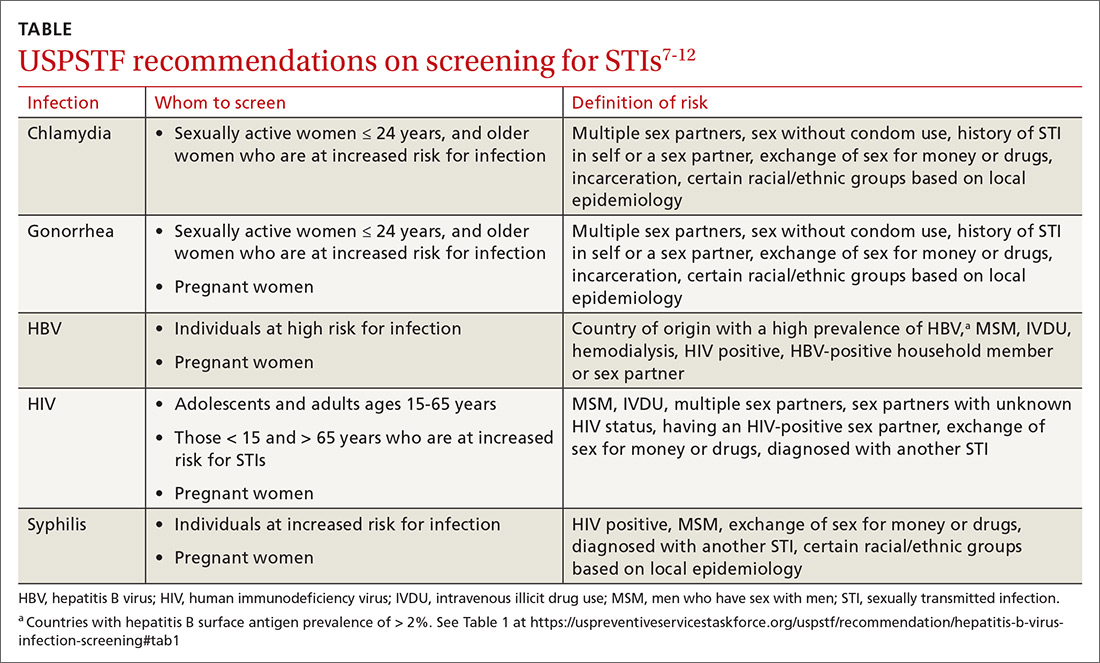
The Task Force has made an “I” statement regarding screening for gonorrhea and chlamydia in males. This does not mean that screening should be avoided, but only that there is insufficient evidence to support a firm statement regarding the harms and benefits in males. Keep in mind that this applies to asymptomatic males, and that testing and preventive treatment are warranted after documented exposure to either infection.
The Task Force recommends against screening for genital herpes, including in pregnant women, because of a lack of evidence of benefit from such screening, the high rate of false-positive tests, and the potential to cause anxiety and harm to personal relationships.
Continue to: Although hepatitis C virus...
Although hepatitis C virus (HCV) is transmitted mainly through intravenous drug use, it can also be transmitted sexually. The Task Force recommends screening for HCV in all adults ages 18 to 79 years.13
Vaccination. Two STIs can be prevented by immunizations: HPV and HBV. The current recommendations by the Advisory Committee on Immunization Practices (ACIP) are to vaccinate all infants with HBV vaccine and all unvaccinated children and adolescents through age 18.14 Unvaccinated adults who are at risk for HBV infection, including those at risk through sexual practices, should also be vaccinated.14
ACIP recommends routine HPV vaccination at age 11 or 12 years, but it can be started as early as 9 years.15 Catch-up vaccination is recommended for males and females through age 26 years.15 The vaccine is approved for use in individuals ages 27 through 45 years, but ACIP has not recommended it for routine use in this age group, and has instead recommended shared clinical decision-making to evaluate whether there is potential individual benefit from the vaccine.15
Public health implications
All STIs are reportable to local or state health departments. This is important for tracking community infection trends and, if resources are available, for contact notification and testing. In most jurisdictions, local health department resources are limited and contact tracing may be restricted to syphilis and HIV infections. When this is the case, it is especially important to instruct patients in whom STIs have been detected to notify their recent sex partners and advise them to be tested or preventively treated.
Expedited partner therapy (EPT)—providing treatment for exposed sexual contacts without a clinical encounter—is allowed in some states and is a tool that can prevent re-infection in the treated patient and suppress spread in the community. This is most useful for partners of those with gonorrhea, chlamydia, or trichomonas. The CDC has published guidance on how to implement EPT in a clinical setting if state law allows it.16
1. Henderson JT, Senger CA, Henninger M, et al. Behavioral counseling interventions to prevent sexually transmitted infections. JAMA. 2020;324:682-699.
2. CDC. Sexually transmitted disease surveillance, 2018. www.cdc.gov/std/stats18/slides.htm. Accessed November 25, 2020.
3. CDC. Sexually transmitted disease surveillance 2018. www.cdc.gov/std/stats18/tables/1.htm. Accessed November 25, 2020.
4. CDC. Estimated HIV incidence and prevalence in the United States (2010-2018). www.cdc.gov/hiv/pdf/library/slidesets/cdc-hiv-surveillance-epidemiology-2018.pdf. Accessed November 25, 2020.
5. CDC. 2015 sexually transmitted disease treatment guidelines. www.cdc.gov/std/tg2015/default.htm. Accessed November 25, 2020.
6. USPSTF. Prevention of human immunodeficiency (HIV) infection: pre-exposure prophylaxis. https://uspreventiveservicestaskforce.org/uspstf/recommendation/prevention-of-human-immunodeficiency-virus-hiv-infection-pre-exposure-prophylaxis. Accessed November 25, 2020.
7. LeFevre ML, U.S. Preventive Services Task Force. Screening for chlamydia and gonorrhea: US Preventive Services Task Force recommendation statement. Ann Intern Med. 2014;161:902-910. 8. USPSTF. Syphilis infection in nonpregnant adults and adolescents: screening. www.uspreventiveservicestaskforce.org/uspstf/recommendation/syphilis-infection-in-nonpregnant-adults-and-adolescents. Accessed November 25, 2020.
9. Curry SJ, Krist AH, Owens DK, et al. Screening for syphilis in pregnant women: US Preventive Services Task Force reaffirmation recommendation statement. JAMA. 2018;320:911-917.
10. Owens DK, Davidson KW, Krist AH, et al; US Preventive Services Task Force. Screening for HIV infection: US Preventive Services Task Force recommendation statement. JAMA. 2019;321:2326-2336.
11. USPSTF. US Preventive Services Task Force issues draft recommendation statement on screening for hepatitis B virus infection in adolescents and adults. www.uspreventiveservicestaskforce.org/uspstf/sites/default/files/file/supporting_documents/hepatitis-b-nonpregnant-adults-draft-rs-bulletin.pdf. Accessed November 25, 2020.
12. Owens DK, Davidson KW, Krist AH, et al. Screening for Hepatitis B Virus Infection in Pregnant Women: US Preventive Services Task Force reaffirmation recommendation statement. JAMA. 2019;322:349-354.
13. USPSTF. Hepatitis C virus infection in adolescents and adults: screening. www.uspreventiveservicestaskforce.org/uspstf/recommendation/hepatitis-c-screening. Accessed November 25, 2020. 14. Schillie S, Vellozzi C, Reingold A, et al. Prevention of hepatitis B virus infection in the United States: recommendations of the Advisory Committee on Immunization Practices. MMWR Recomm Rep. 2018;67;1-31.
15. Meites E, Szilagyi PG, Chesson HW, et al. Human papillomavirus vaccination for adults: updated recommendations of the Advisory Committee on Immunization Practices. MMWR Morb Mortal Wkly Rep. 2019;68:698-702.
16. CDC. Expedited partner therapy in the management of sexually transmitted diseases. www.cdc.gov/std/treatment/eptfinalreport2006.pdf. Accessed November 25, 2020.
In August 2020, the US Preventive Services Task Force published an update of its recommendation on preventing sexually transmitted infections (STIs) with behavioral counseling interventions.1
Whom to counsel. The USPSTF continues to recommend behavioral counseling for all sexually active adolescents and for adults at increased risk for STIs. Adults at increased risk include those who have been diagnosed with an STI in the past year, those with multiple sex partners or a sex partner at high risk for an STI, those not using condoms consistently, and those belonging to populations with high prevalence rates of STIs. These populations with high prevalence rates include1
- individuals seeking care at STI clinics,
- sexual and gender minorities, and
- those who are positive for human immunodeficiency virus (HIV), use injection drugs, exchange sex for drugs or money, or have recently been in a correctional facility.
Features of effective counseling. The Task Force recommends that primary care clinicians provide behavioral counseling or refer to counseling services or suggest media-based interventions. The most effective counseling interventions are those that span more than 120 minutes over several sessions. But the Task Force also states that counseling lasting about 30 minutes in a single session can also be effective. Counseling should include information about common STIs and their modes of transmission; encouragement in the use of safer sex practices; and training in proper condom use, how to communicate with partners about safer sex practices, and problem-solving. Various approaches to this counseling can be found at https://uspreventiveservicestaskforce.org/uspstf/recommendation/sexually-transmitted-infections-behavioral-counseling.
This updated recommendation is timely because most STIs in the United States have been increasing in incidence for the past decade or longer.2 Per 100,000 population, the total number of chlamydia cases since 2000 has risen from 251.4 to 539.9 (115%);gonorrhea cases since 2009 have risen from 98.1 to 179.1 (83%).3 And since 2000, the total number of reported syphilis cases per 100,000 has risen from 2.1 to 10.8 (414%).3
Chlamydia affects primarily those ages 15 to 24 years, with highest rates occurring in females (FIGURE 1).2 Gonorrhea affects women and men fairly evenly with slightly higher rates in men; the highest rates are seen in those ages 20 to 29 (FIGURE 2).2 Syphilis predominantly affects men who have sex with men, and the highest rates are in those ages 20 to 34 (FIGURE 3).2 In contrast to these upward trends, the number of HIV cases diagnosed has been relatively steady, with a slight downward trend over the past decade.4Other STIs that can be prevented through behavioral counseling include herpes simplex, human papillomavirus (HPV), hepatitis B virus (HBV) and trichomonas vaginalis.
Continue to: How to integrate STI preventioninto the primary care encounter
How to integrate STI preventioninto the primary care encounter
A key resource for learning to recognize the signs and symptoms of STIs, to correctly diagnose them, and to treat them according to CDC guidelines can be found at www.cdc.gov/std/tg2015/default.htm.5 Equally important is to integrate the prevention of STIs into the clinical routine by using a 4-step approach: risk assessment, risk reduction (counseling and chemoprevention), screening, and vaccination.
Risk assessment. The first step in prevention is taking a sexual history to accurately assess a patient’s risk for STIs. The CDC provides a tool (www.cdc.gov/std/products/provider-pocket-guides.htm) that can assist in gathering information in a nonjudgmental fashion about 5 Ps: partners, practices, protection from STIs, past history of STIs, and prevention of pregnancy.
Risk reduction. Following STI risk assessment, recommend risk-reduction interventions, as appropriate. Notable in the new Task Force recommendation are behavioral counseling methods that work. Additionally, when needed, pre-exposure prophylaxis with effective antiretroviral agents can be offered to those at high risk of HIV.6
Screening. Task Force recommendations for STI screening are described in the TABLE.7-12 Screening for HIV, chlamydia, gonorrhea, syphilis, and HBV are also recommended for pregnant women. And, although pregnant women are not specifically mentioned in the recommendation on chlamydia screening, it is reasonable to include it in prenatal care testing for STIs.
The Task Force has made an “I” statement regarding screening for gonorrhea and chlamydia in males. This does not mean that screening should be avoided, but only that there is insufficient evidence to support a firm statement regarding the harms and benefits in males. Keep in mind that this applies to asymptomatic males, and that testing and preventive treatment are warranted after documented exposure to either infection.
The Task Force recommends against screening for genital herpes, including in pregnant women, because of a lack of evidence of benefit from such screening, the high rate of false-positive tests, and the potential to cause anxiety and harm to personal relationships.
Continue to: Although hepatitis C virus...
Although hepatitis C virus (HCV) is transmitted mainly through intravenous drug use, it can also be transmitted sexually. The Task Force recommends screening for HCV in all adults ages 18 to 79 years.13
Vaccination. Two STIs can be prevented by immunizations: HPV and HBV. The current recommendations by the Advisory Committee on Immunization Practices (ACIP) are to vaccinate all infants with HBV vaccine and all unvaccinated children and adolescents through age 18.14 Unvaccinated adults who are at risk for HBV infection, including those at risk through sexual practices, should also be vaccinated.14
ACIP recommends routine HPV vaccination at age 11 or 12 years, but it can be started as early as 9 years.15 Catch-up vaccination is recommended for males and females through age 26 years.15 The vaccine is approved for use in individuals ages 27 through 45 years, but ACIP has not recommended it for routine use in this age group, and has instead recommended shared clinical decision-making to evaluate whether there is potential individual benefit from the vaccine.15
Public health implications
All STIs are reportable to local or state health departments. This is important for tracking community infection trends and, if resources are available, for contact notification and testing. In most jurisdictions, local health department resources are limited and contact tracing may be restricted to syphilis and HIV infections. When this is the case, it is especially important to instruct patients in whom STIs have been detected to notify their recent sex partners and advise them to be tested or preventively treated.
Expedited partner therapy (EPT)—providing treatment for exposed sexual contacts without a clinical encounter—is allowed in some states and is a tool that can prevent re-infection in the treated patient and suppress spread in the community. This is most useful for partners of those with gonorrhea, chlamydia, or trichomonas. The CDC has published guidance on how to implement EPT in a clinical setting if state law allows it.16
1. Henderson JT, Senger CA, Henninger M, et al. Behavioral counseling interventions to prevent sexually transmitted infections. JAMA. 2020;324:682-699.
2. CDC. Sexually transmitted disease surveillance, 2018. www.cdc.gov/std/stats18/slides.htm. Accessed November 25, 2020.
3. CDC. Sexually transmitted disease surveillance 2018. www.cdc.gov/std/stats18/tables/1.htm. Accessed November 25, 2020.
4. CDC. Estimated HIV incidence and prevalence in the United States (2010-2018). www.cdc.gov/hiv/pdf/library/slidesets/cdc-hiv-surveillance-epidemiology-2018.pdf. Accessed November 25, 2020.
5. CDC. 2015 sexually transmitted disease treatment guidelines. www.cdc.gov/std/tg2015/default.htm. Accessed November 25, 2020.
6. USPSTF. Prevention of human immunodeficiency (HIV) infection: pre-exposure prophylaxis. https://uspreventiveservicestaskforce.org/uspstf/recommendation/prevention-of-human-immunodeficiency-virus-hiv-infection-pre-exposure-prophylaxis. Accessed November 25, 2020.
7. LeFevre ML, U.S. Preventive Services Task Force. Screening for chlamydia and gonorrhea: US Preventive Services Task Force recommendation statement. Ann Intern Med. 2014;161:902-910. 8. USPSTF. Syphilis infection in nonpregnant adults and adolescents: screening. www.uspreventiveservicestaskforce.org/uspstf/recommendation/syphilis-infection-in-nonpregnant-adults-and-adolescents. Accessed November 25, 2020.
9. Curry SJ, Krist AH, Owens DK, et al. Screening for syphilis in pregnant women: US Preventive Services Task Force reaffirmation recommendation statement. JAMA. 2018;320:911-917.
10. Owens DK, Davidson KW, Krist AH, et al; US Preventive Services Task Force. Screening for HIV infection: US Preventive Services Task Force recommendation statement. JAMA. 2019;321:2326-2336.
11. USPSTF. US Preventive Services Task Force issues draft recommendation statement on screening for hepatitis B virus infection in adolescents and adults. www.uspreventiveservicestaskforce.org/uspstf/sites/default/files/file/supporting_documents/hepatitis-b-nonpregnant-adults-draft-rs-bulletin.pdf. Accessed November 25, 2020.
12. Owens DK, Davidson KW, Krist AH, et al. Screening for Hepatitis B Virus Infection in Pregnant Women: US Preventive Services Task Force reaffirmation recommendation statement. JAMA. 2019;322:349-354.
13. USPSTF. Hepatitis C virus infection in adolescents and adults: screening. www.uspreventiveservicestaskforce.org/uspstf/recommendation/hepatitis-c-screening. Accessed November 25, 2020. 14. Schillie S, Vellozzi C, Reingold A, et al. Prevention of hepatitis B virus infection in the United States: recommendations of the Advisory Committee on Immunization Practices. MMWR Recomm Rep. 2018;67;1-31.
15. Meites E, Szilagyi PG, Chesson HW, et al. Human papillomavirus vaccination for adults: updated recommendations of the Advisory Committee on Immunization Practices. MMWR Morb Mortal Wkly Rep. 2019;68:698-702.
16. CDC. Expedited partner therapy in the management of sexually transmitted diseases. www.cdc.gov/std/treatment/eptfinalreport2006.pdf. Accessed November 25, 2020.
