User login
Polio in 2022: Some concerns but vaccine still works
Who would have thought we would need to refresh our knowledge on polio virus in 2022? Fate seems cruel to add this concern on the heels of SARS-CoV-2, monkeypox, abnormal seasons for RSV, acute flaccid myelitis (AFM) linked to enteroviruses, and a summer of parechovirus causing infant meningitis. But confirmation that indeed an adult had polio with paralytic disease raises concerns among public health groups and ordinary citizens alike, particularly those who remember polio in its heyday.
History: In the summer of 1952, polio was among the most feared diseases on the planet. Families were advised to not allow children to congregate in groups or use public swimming pools; little league baseball games were being canceled and there was talk of not opening schools for the fall. Every parent’s nightmare seemed to be the nonspecific febrile summer illness that led to paralytic sequelae. TV news included videos of the iron lung wards in hospitals across the country. Medical providers felt powerless, only able to give nonspecific preventive advice. There was no specific antiviral (there still isn’t) and vaccines seemed a long way off.

Then came the news that Dr. Jonas Salk’s group had gotten an inactivated polio vaccine (IPV) approved for general use in 1955. Families were excited to have their children vaccinated. Paralytic polio cases dropped like a rock from approximately 22,000/year in 1952 to approximately 2,200 in 1956. A surge to near 6,000 cases in 1959 led to Dr. Albert Sabin’s oral polio vaccine (OPV), which supplanted IPV in 1961. OPV had the advantages of: 1) Inducing mucosal as well as serum antibodies, 2) more durable responses, and 3) immunity in unvaccinated persons exposed to vaccine virus that had been shed in stools into wastewater and rivers.
By 1964, polio had nearly disappeared. The last wild-type indigenous U.S. case was in 1979. By 1994, all the Americas were declared polio free. Because the only U.S. paralytic polio cases thereafter were foreign imports or were associated with oral vaccine strains (so-called vaccine-associated paralytic polio [VAPP]), OPV was replaced by an enhanced IPV in 2000 to prevent further VAPP.
Polio facts: Polio is asymptomatic in about 70% of infections. Among the 30% with symptoms, paralysis occurs infrequently, with the overall rate of paralytic infections being 0.5% (rate varies by virus type with type 3 having the highest rate).1 Why then was the world so afraid of polio? If every person in a U.S. birth cohort (about 3.7 million) was unvaccinated and became infected with poliovirus, more than 18,000 would get paralytic polio and almost 1,300 would die. Of note, adults have a higher chance of paralytic polio after infection than children.
Concerns in 2022: Persons vaccinated with at least three doses of either IPV or OPV have historically been protected from paralytic polio (99% protection). But are we sure that the United States remains protected against polio after 2 decades of IPV being the only vaccine? Polio could be reintroduced at any time to the United States from countries with reported cases that likely arose because of low vaccination rates related to war, famine, or political upheavals (Malawi, Mozambique, Nigeria, Pakistan, and Afghanistan).2 The proof? The recent confirmed New York case.
International efforts resulted in global eradication of two polio wild-types viruses (type 2 in 2015 and type 3 in 2019). Nevertheless, vaccine-derived, virulent polio virus (VDPV) type 2 and VDPV-3 still circulate in some areas, particularly Africa (VDPV-2) and Israel (VDPV-3). The above-mentioned U.S. case is an unvaccinated adult traveler who went to an area where VDPV-2 circulates and developed disease after returning home.3 So, it was not an indigenous reappearance in the United States and it was not a breakthrough case in a vaccinated person. But it is sobering to realize that all who are unvaccinated remain at risk for paralytic polio in 2022, particularly because vaccination rates declined nearly everywhere during the initial COVID-19 pandemic. We are still catching up, with vaccination rates under 50% in some ZIP codes.4
Are VDPVs circulating in some parts of the United States? Interestingly, wastewater surveillance programs may be the most economical and practical way to perform polio surveillance. Such a program detected polio virus in London wastewater in June 2022.5 New York has recently detected polio in wastewater during testing begun because of the recent case.6
Good news: For paralytic polio, seropositivity at any titer indicates protection, so U.S. serosurveillance data would also be informative. How durable is polio protection in the IPV era? Available data suggest that even though we have used only IPV these past 20 years, seropositivity rates among vaccinees with at least three doses of either IPV or OPV should persist for decades and likely for life. Even before polio became a concern this year, the Centers for Disease Control and Prevention, being proactive, wanted to ensure that the enhanced IPV was producing durable immunity and that persons of all ages remained seropositive to the three polio virus types over 10 years after discontinuing OPV use in 2012.
The CDC collaborated with investigators in Kansas City, Mo., to evaluate titers and seropositivity to all three types in a 2- to 85-year-old otherwise healthy cohort with demographics that mirrored the 2010 census for the Kansas City region, which in turn mirrored the national 2021 census data.7 There were approximately 100 persons in each age cohort, with 200 below age 11 years (the cohort that had received only IPV). Serology was performed at the CDC.
Overall seropositivity rates were high, but lower for type 3 (83.3%) and type 2 (90.7%) than type 1 (94.4%). Of note, most of those seronegative for one or more types were among 2- to 3-year-olds who had not completed their full IPV series, with most seronegative results being against polio types 1 and 3. Further, five, who were confirmed as having received no polio vaccine, were seronegative for all three types. Two with no available vaccine records (over 18 years old) were also seronegative for all three types.
So, regardless of the era in which one got polio vaccine, vaccine protection appears to persist indefinitely after three doses. Even 80-year-olds were still seropositive if they had three doses. We can confidently reassure our patients that the vaccine still works; the persons who need to fear polio in 2022 are those who are not vaccinated or have had fewer than three doses, particularly if they travel to areas of persistent polio. Wild type 1 virus persists in a few countries as does VDPV type 2 and VDPV type 3. Importantly, wild type 2 and wild type 3 (with the lowest seropositivity in 2012 study) have been eliminated globally so the only circulating type 2 and type 3 polio virus is VDPV in a few countries. Travel to these countries warrants review of polio vaccine records and CDC or WHO current recommendations for travelers to those countries.
Dr. Harrison is a professor, University of Missouri Kansas City School of Medicine, department of medicine, infectious diseases section, Kansas City. Email him at [email protected].
References
1. Poliomyelitis. World Health Organization fact sheet, 2022 Jul 4..
2. Franco-Paredes C et al. Lancet Infect Dis. 2022 Aug 16. doi: 10.1016/S1473-3099(22)00548-5.
3. Link-Gelles R et al. MMWR Morb Mortal Wkly Rep. 2022 Aug 19;71(33):1065-8.
4. “Polio vaccination rate for 2-year-olds is as low as 37% in parts of N.Y. county where paralysis case was found,” NBC News, Erika Edwards, 2022 Aug 16. 5. Vaccine-derived poliovirus type 2 (VDPV2) detected in environmental samples in London. Polioeradication.org. 2022 Jun 22.
6. “NYSDOH and NYCDOHMH wastewater monitoring identifies polio in New York City and urges unvaccinated New Yorkers to get vaccinated now,” nyc.gov. 2022 Aug 12.
7. Wallace GS et al. Hum Vaccin Immunother. 2017;13(4):776-83.
Who would have thought we would need to refresh our knowledge on polio virus in 2022? Fate seems cruel to add this concern on the heels of SARS-CoV-2, monkeypox, abnormal seasons for RSV, acute flaccid myelitis (AFM) linked to enteroviruses, and a summer of parechovirus causing infant meningitis. But confirmation that indeed an adult had polio with paralytic disease raises concerns among public health groups and ordinary citizens alike, particularly those who remember polio in its heyday.
History: In the summer of 1952, polio was among the most feared diseases on the planet. Families were advised to not allow children to congregate in groups or use public swimming pools; little league baseball games were being canceled and there was talk of not opening schools for the fall. Every parent’s nightmare seemed to be the nonspecific febrile summer illness that led to paralytic sequelae. TV news included videos of the iron lung wards in hospitals across the country. Medical providers felt powerless, only able to give nonspecific preventive advice. There was no specific antiviral (there still isn’t) and vaccines seemed a long way off.
Then came the news that Dr. Jonas Salk’s group had gotten an inactivated polio vaccine (IPV) approved for general use in 1955. Families were excited to have their children vaccinated. Paralytic polio cases dropped like a rock from approximately 22,000/year in 1952 to approximately 2,200 in 1956. A surge to near 6,000 cases in 1959 led to Dr. Albert Sabin’s oral polio vaccine (OPV), which supplanted IPV in 1961. OPV had the advantages of: 1) Inducing mucosal as well as serum antibodies, 2) more durable responses, and 3) immunity in unvaccinated persons exposed to vaccine virus that had been shed in stools into wastewater and rivers.
By 1964, polio had nearly disappeared. The last wild-type indigenous U.S. case was in 1979. By 1994, all the Americas were declared polio free. Because the only U.S. paralytic polio cases thereafter were foreign imports or were associated with oral vaccine strains (so-called vaccine-associated paralytic polio [VAPP]), OPV was replaced by an enhanced IPV in 2000 to prevent further VAPP.
Polio facts: Polio is asymptomatic in about 70% of infections. Among the 30% with symptoms, paralysis occurs infrequently, with the overall rate of paralytic infections being 0.5% (rate varies by virus type with type 3 having the highest rate).1 Why then was the world so afraid of polio? If every person in a U.S. birth cohort (about 3.7 million) was unvaccinated and became infected with poliovirus, more than 18,000 would get paralytic polio and almost 1,300 would die. Of note, adults have a higher chance of paralytic polio after infection than children.
Concerns in 2022: Persons vaccinated with at least three doses of either IPV or OPV have historically been protected from paralytic polio (99% protection). But are we sure that the United States remains protected against polio after 2 decades of IPV being the only vaccine? Polio could be reintroduced at any time to the United States from countries with reported cases that likely arose because of low vaccination rates related to war, famine, or political upheavals (Malawi, Mozambique, Nigeria, Pakistan, and Afghanistan).2 The proof? The recent confirmed New York case.
International efforts resulted in global eradication of two polio wild-types viruses (type 2 in 2015 and type 3 in 2019). Nevertheless, vaccine-derived, virulent polio virus (VDPV) type 2 and VDPV-3 still circulate in some areas, particularly Africa (VDPV-2) and Israel (VDPV-3). The above-mentioned U.S. case is an unvaccinated adult traveler who went to an area where VDPV-2 circulates and developed disease after returning home.3 So, it was not an indigenous reappearance in the United States and it was not a breakthrough case in a vaccinated person. But it is sobering to realize that all who are unvaccinated remain at risk for paralytic polio in 2022, particularly because vaccination rates declined nearly everywhere during the initial COVID-19 pandemic. We are still catching up, with vaccination rates under 50% in some ZIP codes.4
Are VDPVs circulating in some parts of the United States? Interestingly, wastewater surveillance programs may be the most economical and practical way to perform polio surveillance. Such a program detected polio virus in London wastewater in June 2022.5 New York has recently detected polio in wastewater during testing begun because of the recent case.6
Good news: For paralytic polio, seropositivity at any titer indicates protection, so U.S. serosurveillance data would also be informative. How durable is polio protection in the IPV era? Available data suggest that even though we have used only IPV these past 20 years, seropositivity rates among vaccinees with at least three doses of either IPV or OPV should persist for decades and likely for life. Even before polio became a concern this year, the Centers for Disease Control and Prevention, being proactive, wanted to ensure that the enhanced IPV was producing durable immunity and that persons of all ages remained seropositive to the three polio virus types over 10 years after discontinuing OPV use in 2012.
The CDC collaborated with investigators in Kansas City, Mo., to evaluate titers and seropositivity to all three types in a 2- to 85-year-old otherwise healthy cohort with demographics that mirrored the 2010 census for the Kansas City region, which in turn mirrored the national 2021 census data.7 There were approximately 100 persons in each age cohort, with 200 below age 11 years (the cohort that had received only IPV). Serology was performed at the CDC.
Overall seropositivity rates were high, but lower for type 3 (83.3%) and type 2 (90.7%) than type 1 (94.4%). Of note, most of those seronegative for one or more types were among 2- to 3-year-olds who had not completed their full IPV series, with most seronegative results being against polio types 1 and 3. Further, five, who were confirmed as having received no polio vaccine, were seronegative for all three types. Two with no available vaccine records (over 18 years old) were also seronegative for all three types.
So, regardless of the era in which one got polio vaccine, vaccine protection appears to persist indefinitely after three doses. Even 80-year-olds were still seropositive if they had three doses. We can confidently reassure our patients that the vaccine still works; the persons who need to fear polio in 2022 are those who are not vaccinated or have had fewer than three doses, particularly if they travel to areas of persistent polio. Wild type 1 virus persists in a few countries as does VDPV type 2 and VDPV type 3. Importantly, wild type 2 and wild type 3 (with the lowest seropositivity in 2012 study) have been eliminated globally so the only circulating type 2 and type 3 polio virus is VDPV in a few countries. Travel to these countries warrants review of polio vaccine records and CDC or WHO current recommendations for travelers to those countries.
Dr. Harrison is a professor, University of Missouri Kansas City School of Medicine, department of medicine, infectious diseases section, Kansas City. Email him at [email protected].
References
1. Poliomyelitis. World Health Organization fact sheet, 2022 Jul 4..
2. Franco-Paredes C et al. Lancet Infect Dis. 2022 Aug 16. doi: 10.1016/S1473-3099(22)00548-5.
3. Link-Gelles R et al. MMWR Morb Mortal Wkly Rep. 2022 Aug 19;71(33):1065-8.
4. “Polio vaccination rate for 2-year-olds is as low as 37% in parts of N.Y. county where paralysis case was found,” NBC News, Erika Edwards, 2022 Aug 16. 5. Vaccine-derived poliovirus type 2 (VDPV2) detected in environmental samples in London. Polioeradication.org. 2022 Jun 22.
6. “NYSDOH and NYCDOHMH wastewater monitoring identifies polio in New York City and urges unvaccinated New Yorkers to get vaccinated now,” nyc.gov. 2022 Aug 12.
7. Wallace GS et al. Hum Vaccin Immunother. 2017;13(4):776-83.
Pandemic has helped clinicians to gain better insight on pernio, expert says
PORTLAND, ORE. – while others are not, according to Lindy P. Fox, MD, professor of dermatology and director of the hospital consultation service at the University of California, San Francisco.
“We’re learning a lot about pernio because of COVID,” Dr. Fox, a member of the American Academy of Dermatology’s Ad Hoc Task Force on COVID-19, said at the annual meeting of the Pacific Dermatologic Association. “Patients with pernio tend to either have bright red or purple individual lesions or an erythromelalgia-like presentation, often waking up in the middle of the night saying ‘my feet hurt. I can’t put sheets over my feet.’ In my experience, the patients with an erythromelalgia-like presentation tend to be a lot harder to treat.”

Establishing terminology to describe pernio-like lesions was a challenge in the early stages of the COVID-19 pandemic, Dr. Fox added, with clinicians using terms like erythema multiforme-like, coxsackie-like, or even necrotic to describe the lesions. “I don’t think pernio is truly necrotic; I think it’s really inflammatory and purpuric,” she said.
Early in the pandemic, studies suggesting a link with these cases and COVID-19 infection include a case series of 318 patients with pernio-like skin lesions who had confirmed or suspected COVID-19. Most of these patients were generally young and healthy and most had relatively mild COVID-19; 7% were laboratory-confirmed COVID-19 positive, and 6% were close contacts of patients with confirmed COVID-19. Pernio-like lesions were the only symptoms in 55% of the patients.
In another study, researchers in France evaluated the clinical, laboratory, and pathologic characteristics of 40 patients who developed chilblain-like lesions (mostly involving the toes) during the COVID-19 pandemic and were seen as outpatients in April 2020 . All were polymerase chain reaction (PCR) negative, 30% were SARS-CoV-2 serology positive, and 60% had elevated D-dimers. Histology obtained from 19 of the patients revealed lymphocytic inflammation and vascular damage, and 8 had IgA positivity.
In a retrospective analysis of seven pediatric chilblains cases during the pandemic, researchers examined the skin biopsies to evaluate histopathological features and explored the presence of SARS-CoV-2 in the tissue. All patients were PCR negative. The authors observed cytoplasmic granular positivity for SARS-CoV-2 spike protein in endothelial cells, a feature that they said showed coronavirus-like particles, consistent with SARS-CoV-2.
Not all studies in the medical literature have demonstrated an association between pernio-like/chilblains-like lesions and COVID-19, though. An analysis of 23 patients, with skin eruptions considered associated with SARS-CoV-2 infections (including 21 cases of chilblains) during the first wave of the pandemic found that the antibody and T-cell response in patients with pandemic chilblains was the same as in negative controls.
“What’s remarkably interesting about this study is that they did autopsies of samples from patients who had died prepandemic, so there was no such thing as COVID-19,” said Dr. Fox, who was not involved with the study. “They stained for viral particles in those patients, and they were positive in a subset of patients. This makes me wonder about what the significance of that staining positivity is.”
Yet another group of investigators looked at what was happening with pernio during the waves of COVID in a study of chilblains cases in children in Spain, and found a stronger association between lockdown and cold temperature, which argues against a direct association between pernio and COVID infection.
In Dr. Fox’s experience, COVID toes can recur, especially upon exposure to cold. “What taught me this in real life is a patient who I saw remotely by video,” she recalled. “It was early on in the pandemic. I could not prove he had COVID no matter how hard I tried, but I do think he had COVID toes at that time.” When he later was confirmed to have COVID, “he got pernio in the same exact location as his original suspected COVID toes.”
According to an analysis of long COVID in the skin, based on cases reported to the American Academy of Dermatology–International League of Dermatological Societies registry from April 8 to Oct. 8, 2020, pernio-like lesions lasted a median of 12 days in patients with lab-confirmed COVID-19 and a median of 15 days in those with suspected COVID-19. But almost 7% of the 103 pernio cases were long-haulers, defined as those with dermatologic signs of COVID that lasted beyond 60 days.
“There are some patients who are resistant to treatment,” Dr. Fox said. “In addition, recurrent lesions make me think that maybe all pernio is triggered by some viral cause. This causes an immunologic phenomenon that’s responding to a viral trigger you’re trying to deal with. That may be the better way to think about COVID toes.”
Different variants of COVID also appear to be changing the characteristics of dermatologic manifestations associated with infection. Results from a large retrospective analysis of nearly 350,000 users of a COVID study App in the United Kingdom found that skin lesions were more predictive of a positive test in the Delta wave, compared with the Omicron wave, while pernio-like lesions were predictive of infection in the Delta wave but not in the Omicron wave.
“And, whether you were vaccinated or unvaccinated really did not influence whether or not you were going to have a skin rash as a presenting sign of COVID, except for the burning rash, which was less in vaccinated patients,” said Dr. Fox, who was not involved with the study.
Dr. Fox reported having no relevant disclosures.
PORTLAND, ORE. – while others are not, according to Lindy P. Fox, MD, professor of dermatology and director of the hospital consultation service at the University of California, San Francisco.
“We’re learning a lot about pernio because of COVID,” Dr. Fox, a member of the American Academy of Dermatology’s Ad Hoc Task Force on COVID-19, said at the annual meeting of the Pacific Dermatologic Association. “Patients with pernio tend to either have bright red or purple individual lesions or an erythromelalgia-like presentation, often waking up in the middle of the night saying ‘my feet hurt. I can’t put sheets over my feet.’ In my experience, the patients with an erythromelalgia-like presentation tend to be a lot harder to treat.”
Establishing terminology to describe pernio-like lesions was a challenge in the early stages of the COVID-19 pandemic, Dr. Fox added, with clinicians using terms like erythema multiforme-like, coxsackie-like, or even necrotic to describe the lesions. “I don’t think pernio is truly necrotic; I think it’s really inflammatory and purpuric,” she said.
Early in the pandemic, studies suggesting a link with these cases and COVID-19 infection include a case series of 318 patients with pernio-like skin lesions who had confirmed or suspected COVID-19. Most of these patients were generally young and healthy and most had relatively mild COVID-19; 7% were laboratory-confirmed COVID-19 positive, and 6% were close contacts of patients with confirmed COVID-19. Pernio-like lesions were the only symptoms in 55% of the patients.
In another study, researchers in France evaluated the clinical, laboratory, and pathologic characteristics of 40 patients who developed chilblain-like lesions (mostly involving the toes) during the COVID-19 pandemic and were seen as outpatients in April 2020 . All were polymerase chain reaction (PCR) negative, 30% were SARS-CoV-2 serology positive, and 60% had elevated D-dimers. Histology obtained from 19 of the patients revealed lymphocytic inflammation and vascular damage, and 8 had IgA positivity.
In a retrospective analysis of seven pediatric chilblains cases during the pandemic, researchers examined the skin biopsies to evaluate histopathological features and explored the presence of SARS-CoV-2 in the tissue. All patients were PCR negative. The authors observed cytoplasmic granular positivity for SARS-CoV-2 spike protein in endothelial cells, a feature that they said showed coronavirus-like particles, consistent with SARS-CoV-2.
Not all studies in the medical literature have demonstrated an association between pernio-like/chilblains-like lesions and COVID-19, though. An analysis of 23 patients, with skin eruptions considered associated with SARS-CoV-2 infections (including 21 cases of chilblains) during the first wave of the pandemic found that the antibody and T-cell response in patients with pandemic chilblains was the same as in negative controls.
“What’s remarkably interesting about this study is that they did autopsies of samples from patients who had died prepandemic, so there was no such thing as COVID-19,” said Dr. Fox, who was not involved with the study. “They stained for viral particles in those patients, and they were positive in a subset of patients. This makes me wonder about what the significance of that staining positivity is.”
Yet another group of investigators looked at what was happening with pernio during the waves of COVID in a study of chilblains cases in children in Spain, and found a stronger association between lockdown and cold temperature, which argues against a direct association between pernio and COVID infection.
In Dr. Fox’s experience, COVID toes can recur, especially upon exposure to cold. “What taught me this in real life is a patient who I saw remotely by video,” she recalled. “It was early on in the pandemic. I could not prove he had COVID no matter how hard I tried, but I do think he had COVID toes at that time.” When he later was confirmed to have COVID, “he got pernio in the same exact location as his original suspected COVID toes.”
According to an analysis of long COVID in the skin, based on cases reported to the American Academy of Dermatology–International League of Dermatological Societies registry from April 8 to Oct. 8, 2020, pernio-like lesions lasted a median of 12 days in patients with lab-confirmed COVID-19 and a median of 15 days in those with suspected COVID-19. But almost 7% of the 103 pernio cases were long-haulers, defined as those with dermatologic signs of COVID that lasted beyond 60 days.
“There are some patients who are resistant to treatment,” Dr. Fox said. “In addition, recurrent lesions make me think that maybe all pernio is triggered by some viral cause. This causes an immunologic phenomenon that’s responding to a viral trigger you’re trying to deal with. That may be the better way to think about COVID toes.”
Different variants of COVID also appear to be changing the characteristics of dermatologic manifestations associated with infection. Results from a large retrospective analysis of nearly 350,000 users of a COVID study App in the United Kingdom found that skin lesions were more predictive of a positive test in the Delta wave, compared with the Omicron wave, while pernio-like lesions were predictive of infection in the Delta wave but not in the Omicron wave.
“And, whether you were vaccinated or unvaccinated really did not influence whether or not you were going to have a skin rash as a presenting sign of COVID, except for the burning rash, which was less in vaccinated patients,” said Dr. Fox, who was not involved with the study.
Dr. Fox reported having no relevant disclosures.
AT PDA 2022
Improving Inpatient COVID-19 Vaccination Rates Among Adult Patients at a Tertiary Academic Medical Center
From the Department of Medicine, The George Washington University School of Medicine and Health Sciences, Washington, DC.
Abstract
Objective: Inpatient vaccination initiatives are well described in the literature. During the COVID-19 pandemic, hospitals began administering COVID-19 vaccines to hospitalized patients. Although vaccination rates increased, there remained many unvaccinated patients despite community efforts. This quality improvement project aimed to increase the COVID-19 vaccination rates of hospitalized patients on the medicine service at the George Washington University Hospital (GWUH).
Methods: From November 2021 through February 2022, we conducted a Plan-Do-Study-Act (PDSA) cycle with 3 phases. Initial steps included gathering baseline data from the electronic health record and consulting stakeholders. The first 2 phases focused on educating housestaff on the availability, ordering process, and administration of the Pfizer vaccine. The third phase consisted of developing educational pamphlets for patients to be included in their admission packets.
Results: The baseline mean COVID-19 vaccination rate (August to October 2021) of eligible patients on the medicine service was 10.7%. In the months after we implemented the PDSA cycle (November 2021 to February 2022), the mean vaccination rate increased to 15.4%.
Conclusion: This quality improvement project implemented measures to increase administration of the Pfizer vaccine to eligible patients admitted to the medicine service at GWUH. The mean vaccination rate increased from 10.7% in the 3 months prior to implementation to 15.4% during the 4 months post implementation. Other measures to consider in the future include increasing the availability of other COVID-19 vaccines at our hospital and incorporating the vaccine into the admission order set to help facilitate vaccination early in the hospital course.
Keywords: housestaff, quality improvement, PDSA, COVID-19, BNT162b2 vaccine, patient education
Throughout the COVID-19 pandemic, case rates in the United States have fluctuated considerably, corresponding to epidemic waves. In 2021, US daily cases of COVID-19 peaked at nearly 300,000 in early January and reached a nadir of 8000 cases in mid-June.1 In September 2021, new cases had increased to 200,000 per day due to the prevalence of the Delta variant.1 Particularly with the emergence of new variants of SARS-CoV-2, vaccination efforts to limit the spread of infection and severity of illness are critical. Data have shown that 2 doses of the BNT162b2 vaccine (Pfizer-BioNTech) were largely protective against severe infection for approximately 6 months.2,3 When we began this quality improvement (QI) project in September 2021, only 179 million Americans had been fully vaccinated, according to data from the Centers for Disease Control and Prevention, which is just over half of the US population.4 An electronic survey conducted in the United States with more than 5 million responses found that, of those who were hesitant about receiving the vaccine, 49% reported a fear of adverse effects and 48% reported a lack of trust in the vaccine.5
This QI project sought to target unvaccinated individuals admitted to the internal medicine inpatient service. Vaccinating hospitalized patients is especially important since they are sicker than the general population and at higher risk of having poor outcomes from COVID-19. Inpatient vaccine initiatives, such as administering influenza vaccine prior to discharge, have been successfully implemented in the past.6 One large COVID-19 vaccination program featured an admission order set to increase the rates of vaccination among hospitalized patients.7 Our QI project piloted a multidisciplinary approach involving the nursing staff, pharmacy, information technology (IT) department, and internal medicine housestaff to increase COVID-19 vaccination rates among hospitalized patients on the medical service. This project aimed to increase inpatient vaccination rates through interventions targeting both primary providers as well as the patients themselves.
Methods
Setting and Interventions
This project was conducted at the George Washington University Hospital (GWUH) in Washington, DC. The clinicians involved in the study were the internal medicine housestaff, and the patients included were adults admitted to the resident medicine ward teams. The project was exempt by the institutional review board and did not require informed consent.
The quality improvement initiative had 3 phases, each featuring a different intervention (Table 1). The first phase involved sending a weekly announcement (via email and a secure health care messaging app) to current residents rotating on the inpatient medicine service. The announcement contained information regarding COVID-19 vaccine availability at the hospital, instructions on ordering the vaccine, and the process of coordinating with pharmacy to facilitate vaccine administration. Thereafter, residents were educated on the process of giving a COVID-19 vaccine to a patient from start to finish. Due to the nature of the residency schedule, different housestaff members rotated in and out of the medicine wards during the intervention periods. The weekly email was sent to the entire internal medicine housestaff, informing all residents about the QI project, while the weekly secure messages served as reminders and were only sent to residents currently on the medicine wards.

In the second phase, we posted paper flyers throughout the hospital to remind housestaff to give the vaccine and again educate them on the process of ordering the vaccine. For the third intervention, a COVID-19 vaccine educational pamphlet was developed for distribution to inpatients at GWUH. The pamphlet included information on vaccine efficacy, safety, side effects, and eligibility. The pamphlet was incorporated in the admission packet that every patient receives upon admission to the hospital. The patients reviewed the pamphlets with nursing staff, who would answer any questions, with residents available to discuss any outstanding concerns.
Measures and Data Gathering
The primary endpoint of the study was inpatient vaccination rate, defined as the number of COVID-19 vaccines administered divided by the number of patients eligible to receive a vaccine (not fully vaccinated). During initial triage, nursing staff documented vaccination status in the electronic health record (EHR), checking a box in a data entry form if a patient had received 0, 1, or 2 doses of the COVID-19 vaccine. The GWUH IT department generated data from this form to determine the number of patients eligible to receive a COVID-19 vaccine. Data were extracted from the medication administration record in the EHR to determine the number of vaccines that were administered to patients during their hospitalization on the inpatient medical service. Each month, the IT department extracted data for the number of eligible patients and the number of vaccines administered. This yielded the monthly vaccination rates. The monthly vaccination rates in the period prior to starting the QI initiative were compared to the rates in the period after the interventions were implemented.
Of note, during the course of this project, patients became eligible for a third COVID-19 vaccine (booster). We decided to continue with the original aim of vaccinating adults who had only received 0 or 1 dose of the vaccine. Therefore, the eligibility criteria remained the same throughout the study. We obtained retrospective data to ensure that the vaccines being counted toward the vaccination rate were vaccines given to patients not yet fully vaccinated and not vaccines given as boosters.

Results
From August to October 2021, the baseline average monthly vaccination rate of patients on the medicine service who were eligible to receive a COVID-19 vaccine was 10.7%. After the first intervention, the vaccination rate increased to 19.7% in November 2021 (Table 2). The second intervention yielded vaccination rates of 11.4% and 11.8% in December 2021 and January 2022, respectively. During the final phase in February 2022, the vaccination rate was 19.0%. At the conclusion of the study, the mean vaccination rate for the intervention months was 15.4% (Figure 1). Process stability and variation are demonstrated with a statistical process control chart (Figure 2).

 chart.")
Discussion
For this housestaff-driven QI project, we implemented an inpatient COVID-19 vaccination campaign consisting of 3 phases that targeted both providers and patients. During the intervention period, we observed an increased vaccination rate compared to the period just prior to implementation of the QI project. While our interventions may certainly have boosted vaccination rates, we understand other variables could have contributed to increased rates as well. The emergence of variants in the United States, such as omicron in December 2021,8 could have precipitated a demand for vaccinations among patients. Holidays in November and December may also have increased patients’ desire to get vaccinated before travel.
We encountered a number of roadblocks that challenged our project, including difficulty identifying patients who were eligible for the vaccine, logistical vaccine administration challenges, and hesitancy among the inpatient population. Accurately identifying patients who were eligible for a vaccine in the EHR was especially challenging in the setting of rapidly changing guidelines regarding COVID-19 vaccination. In September 2021, the US Food and Drug Administration authorized the Pfizer booster for certain populations and later, in November 2021, for all adults. This meant that some fully vaccinated hospitalized patients (those with 2 doses) then qualified for an additional dose of the vaccine and received a dose during hospitalization. To determine the true vaccination rate, we obtained retrospective data that allowed us to track each vaccine administered. If a patient had already received 2 doses of the COVID-19 vaccine, the vaccine administered was counted as a booster and excluded from the calculation of the vaccination rate. Future PDSA cycles could include updating the EHR to capture the whole range of COVID-19 vaccination status (unvaccinated, partially vaccinated, fully vaccinated, fully vaccinated with 1 booster, fully vaccinated with 2 boosters).
We also encountered logistical challenges with the administration of the COVID-19 vaccine to hospitalized patients. During the intervention period, our pharmacy department required 5 COVID-19 vaccination orders before opening a vial and administering the vaccine doses in order to reduce waste. This policy may have limited our ability to vaccinate eligible inpatients because we were not always able to identify 5 patients simultaneously on the service who were eligible and consented to the vaccine.
The majority of patients who were interested in receiving COVID-19 vaccination had already been vaccinated in the outpatient setting. This fact made the inpatient internal medicine subset of patients a particularly challenging population to target, given their possible hesitancy regarding vaccination. By utilizing a multidisciplinary team and increasing communication of providers and nursing staff, we helped to increase the COVID-19 vaccination rates at our hospital from 10.7% to 15.4%.
Future Directions
Future interventions to consider include increasing the availability of other approved COVID-19 vaccines at our hospital besides the Pfizer-BioNTech vaccine. Furthermore, incorporating the vaccine into the admission order set would help initiate the vaccination process early in the hospital course. We encourage other institutions to utilize similar approaches to not only remind providers about inpatient vaccination, but also educate and encourage patients to receive the vaccine. These measures will help institutions increase inpatient COVID-19 vaccination rates in a high-risk population.
Corresponding author: Anna Rubin, MD, Department of Medicine, The George Washington University School of Medicine and Health Sciences, Washington, DC; [email protected]
Disclosures: None reported.
1. Trends in number of COVID-19 cases and deaths in the US reported to CDC, by state/territory. Centers for Disease Control and Prevention. Accessed February 25, 2022. https://covid.cdc.gov/covid-data-tracker/#trends_dailycases
2. Polack FP, Thomas SJ, Kitchin N, et al. Safety and efficacy of the BNT162B2 MRNA COVID-19 vaccine. N Engl J Med. 2020;383(27):2603-2615. doi:10.1056/nejmoa2034577
3. Hall V, Foulkes S, Insalata F, et al. Protection against SARS-COV-2 after covid-19 vaccination and previous infection. N Engl J Med. 2022;386(13):1207-1220. doi:10.1056/nejmoa2118691
4. Trends in number of COVID-19 vaccinations in the US. Centers for Disease Control and Prevention. Accessed February 25, 2022. https://covid.cdc.gov/covid-data-tracker/#vaccination-trends_vacctrends-fully-cum
5. King WC, Rubinstein M, Reinhart A, Mejia R. Time trends, factors associated with, and reasons for covid-19 vaccine hesitancy: A massive online survey of US adults from January-May 2021. PLOS ONE. 2021;16(12). doi:10.1371/journal.pone.0260731
6. Cohen ES, Ogrinc G, Taylor T, et al. Influenza vaccination rates for hospitalised patients: A multiyear quality improvement effort. BMJ Qual Saf. 2015;24(3):221-227. doi:10.1136/bmjqs-2014-003556
7. Berger RE, Diaz DC, Chacko S, et al. Implementation of an inpatient covid-19 vaccination program. NEJM Catalyst. 2021;2(10). doi:10.1056/cat.21.0235
8. CDC COVID-19 Response Team. SARS-CoV-2 B.1.1.529 (Omicron) Variant - United States, December 1-8, 2021. MMWR Morb Mortal Wkly Rep. 2021;70(50):1731-1734. doi:10.15585/mmwr.mm7050e1
From the Department of Medicine, The George Washington University School of Medicine and Health Sciences, Washington, DC.
Abstract
Objective: Inpatient vaccination initiatives are well described in the literature. During the COVID-19 pandemic, hospitals began administering COVID-19 vaccines to hospitalized patients. Although vaccination rates increased, there remained many unvaccinated patients despite community efforts. This quality improvement project aimed to increase the COVID-19 vaccination rates of hospitalized patients on the medicine service at the George Washington University Hospital (GWUH).
Methods: From November 2021 through February 2022, we conducted a Plan-Do-Study-Act (PDSA) cycle with 3 phases. Initial steps included gathering baseline data from the electronic health record and consulting stakeholders. The first 2 phases focused on educating housestaff on the availability, ordering process, and administration of the Pfizer vaccine. The third phase consisted of developing educational pamphlets for patients to be included in their admission packets.
Results: The baseline mean COVID-19 vaccination rate (August to October 2021) of eligible patients on the medicine service was 10.7%. In the months after we implemented the PDSA cycle (November 2021 to February 2022), the mean vaccination rate increased to 15.4%.
Conclusion: This quality improvement project implemented measures to increase administration of the Pfizer vaccine to eligible patients admitted to the medicine service at GWUH. The mean vaccination rate increased from 10.7% in the 3 months prior to implementation to 15.4% during the 4 months post implementation. Other measures to consider in the future include increasing the availability of other COVID-19 vaccines at our hospital and incorporating the vaccine into the admission order set to help facilitate vaccination early in the hospital course.
Keywords: housestaff, quality improvement, PDSA, COVID-19, BNT162b2 vaccine, patient education
Throughout the COVID-19 pandemic, case rates in the United States have fluctuated considerably, corresponding to epidemic waves. In 2021, US daily cases of COVID-19 peaked at nearly 300,000 in early January and reached a nadir of 8000 cases in mid-June.1 In September 2021, new cases had increased to 200,000 per day due to the prevalence of the Delta variant.1 Particularly with the emergence of new variants of SARS-CoV-2, vaccination efforts to limit the spread of infection and severity of illness are critical. Data have shown that 2 doses of the BNT162b2 vaccine (Pfizer-BioNTech) were largely protective against severe infection for approximately 6 months.2,3 When we began this quality improvement (QI) project in September 2021, only 179 million Americans had been fully vaccinated, according to data from the Centers for Disease Control and Prevention, which is just over half of the US population.4 An electronic survey conducted in the United States with more than 5 million responses found that, of those who were hesitant about receiving the vaccine, 49% reported a fear of adverse effects and 48% reported a lack of trust in the vaccine.5
This QI project sought to target unvaccinated individuals admitted to the internal medicine inpatient service. Vaccinating hospitalized patients is especially important since they are sicker than the general population and at higher risk of having poor outcomes from COVID-19. Inpatient vaccine initiatives, such as administering influenza vaccine prior to discharge, have been successfully implemented in the past.6 One large COVID-19 vaccination program featured an admission order set to increase the rates of vaccination among hospitalized patients.7 Our QI project piloted a multidisciplinary approach involving the nursing staff, pharmacy, information technology (IT) department, and internal medicine housestaff to increase COVID-19 vaccination rates among hospitalized patients on the medical service. This project aimed to increase inpatient vaccination rates through interventions targeting both primary providers as well as the patients themselves.
Methods
Setting and Interventions
This project was conducted at the George Washington University Hospital (GWUH) in Washington, DC. The clinicians involved in the study were the internal medicine housestaff, and the patients included were adults admitted to the resident medicine ward teams. The project was exempt by the institutional review board and did not require informed consent.
The quality improvement initiative had 3 phases, each featuring a different intervention (Table 1). The first phase involved sending a weekly announcement (via email and a secure health care messaging app) to current residents rotating on the inpatient medicine service. The announcement contained information regarding COVID-19 vaccine availability at the hospital, instructions on ordering the vaccine, and the process of coordinating with pharmacy to facilitate vaccine administration. Thereafter, residents were educated on the process of giving a COVID-19 vaccine to a patient from start to finish. Due to the nature of the residency schedule, different housestaff members rotated in and out of the medicine wards during the intervention periods. The weekly email was sent to the entire internal medicine housestaff, informing all residents about the QI project, while the weekly secure messages served as reminders and were only sent to residents currently on the medicine wards.
In the second phase, we posted paper flyers throughout the hospital to remind housestaff to give the vaccine and again educate them on the process of ordering the vaccine. For the third intervention, a COVID-19 vaccine educational pamphlet was developed for distribution to inpatients at GWUH. The pamphlet included information on vaccine efficacy, safety, side effects, and eligibility. The pamphlet was incorporated in the admission packet that every patient receives upon admission to the hospital. The patients reviewed the pamphlets with nursing staff, who would answer any questions, with residents available to discuss any outstanding concerns.
Measures and Data Gathering
The primary endpoint of the study was inpatient vaccination rate, defined as the number of COVID-19 vaccines administered divided by the number of patients eligible to receive a vaccine (not fully vaccinated). During initial triage, nursing staff documented vaccination status in the electronic health record (EHR), checking a box in a data entry form if a patient had received 0, 1, or 2 doses of the COVID-19 vaccine. The GWUH IT department generated data from this form to determine the number of patients eligible to receive a COVID-19 vaccine. Data were extracted from the medication administration record in the EHR to determine the number of vaccines that were administered to patients during their hospitalization on the inpatient medical service. Each month, the IT department extracted data for the number of eligible patients and the number of vaccines administered. This yielded the monthly vaccination rates. The monthly vaccination rates in the period prior to starting the QI initiative were compared to the rates in the period after the interventions were implemented.
Of note, during the course of this project, patients became eligible for a third COVID-19 vaccine (booster). We decided to continue with the original aim of vaccinating adults who had only received 0 or 1 dose of the vaccine. Therefore, the eligibility criteria remained the same throughout the study. We obtained retrospective data to ensure that the vaccines being counted toward the vaccination rate were vaccines given to patients not yet fully vaccinated and not vaccines given as boosters.
Results
From August to October 2021, the baseline average monthly vaccination rate of patients on the medicine service who were eligible to receive a COVID-19 vaccine was 10.7%. After the first intervention, the vaccination rate increased to 19.7% in November 2021 (Table 2). The second intervention yielded vaccination rates of 11.4% and 11.8% in December 2021 and January 2022, respectively. During the final phase in February 2022, the vaccination rate was 19.0%. At the conclusion of the study, the mean vaccination rate for the intervention months was 15.4% (Figure 1). Process stability and variation are demonstrated with a statistical process control chart (Figure 2).
Discussion
For this housestaff-driven QI project, we implemented an inpatient COVID-19 vaccination campaign consisting of 3 phases that targeted both providers and patients. During the intervention period, we observed an increased vaccination rate compared to the period just prior to implementation of the QI project. While our interventions may certainly have boosted vaccination rates, we understand other variables could have contributed to increased rates as well. The emergence of variants in the United States, such as omicron in December 2021,8 could have precipitated a demand for vaccinations among patients. Holidays in November and December may also have increased patients’ desire to get vaccinated before travel.
We encountered a number of roadblocks that challenged our project, including difficulty identifying patients who were eligible for the vaccine, logistical vaccine administration challenges, and hesitancy among the inpatient population. Accurately identifying patients who were eligible for a vaccine in the EHR was especially challenging in the setting of rapidly changing guidelines regarding COVID-19 vaccination. In September 2021, the US Food and Drug Administration authorized the Pfizer booster for certain populations and later, in November 2021, for all adults. This meant that some fully vaccinated hospitalized patients (those with 2 doses) then qualified for an additional dose of the vaccine and received a dose during hospitalization. To determine the true vaccination rate, we obtained retrospective data that allowed us to track each vaccine administered. If a patient had already received 2 doses of the COVID-19 vaccine, the vaccine administered was counted as a booster and excluded from the calculation of the vaccination rate. Future PDSA cycles could include updating the EHR to capture the whole range of COVID-19 vaccination status (unvaccinated, partially vaccinated, fully vaccinated, fully vaccinated with 1 booster, fully vaccinated with 2 boosters).
We also encountered logistical challenges with the administration of the COVID-19 vaccine to hospitalized patients. During the intervention period, our pharmacy department required 5 COVID-19 vaccination orders before opening a vial and administering the vaccine doses in order to reduce waste. This policy may have limited our ability to vaccinate eligible inpatients because we were not always able to identify 5 patients simultaneously on the service who were eligible and consented to the vaccine.
The majority of patients who were interested in receiving COVID-19 vaccination had already been vaccinated in the outpatient setting. This fact made the inpatient internal medicine subset of patients a particularly challenging population to target, given their possible hesitancy regarding vaccination. By utilizing a multidisciplinary team and increasing communication of providers and nursing staff, we helped to increase the COVID-19 vaccination rates at our hospital from 10.7% to 15.4%.
Future Directions
Future interventions to consider include increasing the availability of other approved COVID-19 vaccines at our hospital besides the Pfizer-BioNTech vaccine. Furthermore, incorporating the vaccine into the admission order set would help initiate the vaccination process early in the hospital course. We encourage other institutions to utilize similar approaches to not only remind providers about inpatient vaccination, but also educate and encourage patients to receive the vaccine. These measures will help institutions increase inpatient COVID-19 vaccination rates in a high-risk population.
Corresponding author: Anna Rubin, MD, Department of Medicine, The George Washington University School of Medicine and Health Sciences, Washington, DC; [email protected]
Disclosures: None reported.
1. Trends in number of COVID-19 cases and deaths in the US reported to CDC, by state/territory. Centers for Disease Control and Prevention. Accessed February 25, 2022. https://covid.cdc.gov/covid-data-tracker/#trends_dailycases
2. Polack FP, Thomas SJ, Kitchin N, et al. Safety and efficacy of the BNT162B2 MRNA COVID-19 vaccine. N Engl J Med. 2020;383(27):2603-2615. doi:10.1056/nejmoa2034577
3. Hall V, Foulkes S, Insalata F, et al. Protection against SARS-COV-2 after covid-19 vaccination and previous infection. N Engl J Med. 2022;386(13):1207-1220. doi:10.1056/nejmoa2118691
4. Trends in number of COVID-19 vaccinations in the US. Centers for Disease Control and Prevention. Accessed February 25, 2022. https://covid.cdc.gov/covid-data-tracker/#vaccination-trends_vacctrends-fully-cum
5. King WC, Rubinstein M, Reinhart A, Mejia R. Time trends, factors associated with, and reasons for covid-19 vaccine hesitancy: A massive online survey of US adults from January-May 2021. PLOS ONE. 2021;16(12). doi:10.1371/journal.pone.0260731
6. Cohen ES, Ogrinc G, Taylor T, et al. Influenza vaccination rates for hospitalised patients: A multiyear quality improvement effort. BMJ Qual Saf. 2015;24(3):221-227. doi:10.1136/bmjqs-2014-003556
7. Berger RE, Diaz DC, Chacko S, et al. Implementation of an inpatient covid-19 vaccination program. NEJM Catalyst. 2021;2(10). doi:10.1056/cat.21.0235
8. CDC COVID-19 Response Team. SARS-CoV-2 B.1.1.529 (Omicron) Variant - United States, December 1-8, 2021. MMWR Morb Mortal Wkly Rep. 2021;70(50):1731-1734. doi:10.15585/mmwr.mm7050e1
Children and COVID: New cases took a downturn in September
After 2 weeks of increases in the number of new COVID-19 cases in children – a trend that just happened to coincide with the start of a new school year – there were fewer cases reported during the first full week of September, according to the American Academy of Pediatrics and the Children’s Hospital Association.
, the AAP and CHA said in their weekly COVID-19 report, noting also that seven states and the District of Columbia no longer update their online dashboards while others publish new data less often than every week.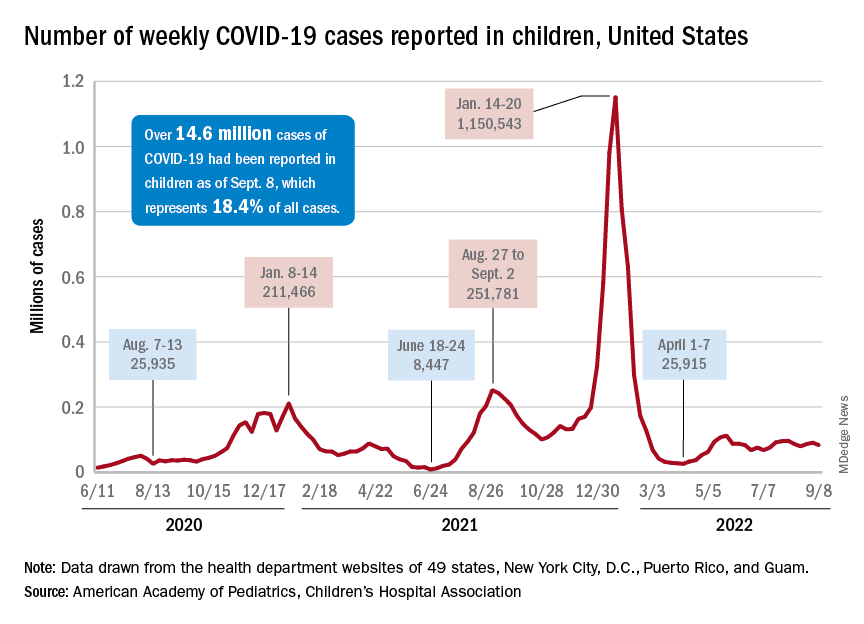
The drop in new cases was accompanied by declines in emergency department visits and hospital admissions, both of which had shown some signs of resurgence in mid- to late August. The brief rise in ED visits seemed to be age-related, occurring in those aged 12 years and older but not in younger children, whose ED visit rate fell steadily through August. Through the first week of September, however, 7-day averages were down for both those aged 12-15 and for 16- to 17-year-olds, the Centers for Disease Control and Prevention reported.
The rate of new hospital admissions of children with confirmed COVID-19, available only for ages 0-17 years, has declined every day since Aug. 28, when it reached 0.44 per 100,000 population after a week of climbing, the CDC said on its COVID Data Tracker.
Cumulatively, about 156,000 children were hospitalized with COVID from Aug. 1, 2020 to Sept. 10, 2022, according to the CDC, which puts the total number of pediatric cases at just over 15 million and deaths at 1,778. Those last two figures represent 17.4% and about 0.4% of all U.S. cases and deaths. The AAP and CHA estimate that about 14.6 million child cases have been reported so far, which is 18.4% of cases in all ages.
Vaccinations are slowly adding up
On the prevention side of the health care system’s response to COVID, the CDC’s cumulative numbers looked like this as of Sept. 6:
- 1.1 million children under age 5 (about 5.8% of the age group) had received at least one dose of vaccine, and 280,000 (1.4%) were fully vaccinated.
- Almost 11 million (38.2%) children aged 5-11 had gotten one dose, and 8.9 million (31.1%) were fully vaccinated.
- 17.9 million (70.8%) children aged 12-17 had received at least one dose, and 15.3 million (60.5%) were fully vaccinated.
Over the 14 days ending Sept. 7, children aged 2-4 years made up the largest group (21.4%) of Americans getting their first vaccine doses, while those aged 5-11 years were the third largest age group at 16.7% of all vaccinees (25- to 49-year-olds were second). The situation was reversed for vaccine completion over the last 2 weeks: Those aged 5-11 were first at 24.7%, and the 2- to 4-year-olds were third at 16.7% (those aged 25-49 were second again), according to the COVID Data Tracker.
Integrase inhibitors and gestational weight gain: Should women worry?
In recent years, increased use of integrase strand transferase inhibitor (INSTI) antiviral treatment (ART) has raised concerns about weight gain and adverse outcomes in patients with HIV. This is especially true regarding possible excessive gestational weight gain, which in women without HIV has been associated with maternal gestational diabetes, hypertensive and liver conditions, as well as related risks for preterm birth, fetal macrosomia, and higher weight after birth.
Unfortunately, few studies in pregnant women with HIV have moved out of the controlled environment into real-world settings, potentially limiting current knowledge about the impact of gestational weight gain – as well as strategies to both prevent it and the associated adverse outcomes.
That is what a team of infectious disease specialists at the Hospital Federal dos Servidores do Estado in Rio de Janeiro recently sought to answer among a cohort of INSTI-experienced and INSTI-naive women with BMIs less than 25 kg/m2 (underweight/normal weight) and higher than 25 kg/m2.
Surprising findings
The investigators determined that rates of excessive weight gain were significantly higher in INSTI-naive women with BMI less than 25 who experienced rates as high as 31.6%, compared with approximately 12% of women who conceived while on INSTIs, regardless of BMI values at baseline (P = .004).
However, rates of unfavorable pregnancy outcomes (for example, small for gestational age, preterm birth, stillbirth, death) appeared to be low overall and similar among all the study groups.
“We had some discussions when we were working on this and thought that the weight gain might have adverse effects,” Trevon Fuller, PhD, lead author and a postdoctoral student at the Hospital Federal dos Servidores do Estado, told this news organization.
“But it looked like the weight gain might actually be good, to the extent that we didn’t see any harm to the mom or the baby of those underweight or normal weight women who were naive to INSTIs,” he explained.
Dr. Fuller and his team enrolled 198 pregnant women living with HIV who sought care at the Hospital Federal dos Servidores do Estado – a national reference center for USAID’s Prevention of Mother to Child Transmission strategic program – between October 2014 and October 2021.
Participants were divided into two primary cohorts: BMI less than 25 at enrollment (n = 74) or BMI of 25 or higher (n = 124), then further divided by timing of INSTI-based combined ART:
- INSTI-naive: women using INSTI-based ART (raltegravir [Isentress] 400 mg twice per day or dolutegravir [Tivicay] 50 mg/day plus 2 non-nucleoside reverse transcriptase inhibitors – lamivudine plus tenofovir disoproxil fumarate or lamivudine plus zidovudine) for 4 weeks between baseline and near delivery.
- INSTI-experienced: women who became pregnant while using INSTIs for at least 6 months before conception.
Among underweight/normal weight participants, 77% (n = 57) were INSTI-naive and 23% (n = 17) INSTI-experienced, and among overweight/obese participants, 81.5% (n = 101) were INSTI-naive, and 18.5% (n = 23) were experienced.
Maternal age, which did not differ significantly by BMI or treatment experience, was a median of 28 years, and most participants were non-White. All participants were virally suppressed near delivery.
Study findings, which were published online in HIV Medicine, highlighted that median weight near delivery in participants who were overweight/obese at baseline was similar regardless of whether they were treatment-experienced (90 kg [198 lb]) or treatment-naive (82.3 kg [181 lb]), P = .026.
However, participants who were underweight/normal weight who were INSTI-naive had significantly higher rates of gestational weight gain (31.5%, 18/57), compared with those of underweight/normal weight who were INSTI-experienced (11.8%, 2/17), P = .004. Notably, this gain was significant in all categories of change (that is, low < 0.18 kg/week, normal 0.18-0.59 kg/week), and high > 0.59 kg/week).
“One of the things that we took away was that this weight gain is primarily happening with women who are starting INSTIs,” said Dr. Fuller.
“The data suggest that [it] might be temporary in the sense that there’s not going to be continuous weight gain but that it will probably approach some type of horizontal asymptote,” he added.
Although obstetric and neonatal outcomes were secondary measures, the investigators did not observe any significantly different outcomes when comparing the groups, and there were no stillbirths, neonatal deaths, or macrosomia.
Preterm delivery rates in underweight/normal weight participants who were INSTI-experienced (11.8%, 2/17) and INSTI-naive (5.3%, 3/57) were similar to overweight/obese participants who were INSTI-experienced (13%, 3/23) and INSTI-naive (6.9%, 7/101).
The same was true for low birthweight.
Still, the study appears to raise more questions than it answers, Sigal Yawetz, MD, an infectious disease specialist at Brigham and Women’s Hospital, Boston, said in an interview – a factor that she said is common also in some of the more recent randomized controlled studies, such as IMPAACT PROMISE.
Dr. Yawetz, who was not involved in the study, also noted, “The groups were small, so comparisons within the groups are difficult, and so many people were excluded that it’s hard to know if there were adverse outcomes related to this ... It’s very confounded.”
The World Health Organization estimates that there are roughly 1.3 million pregnant women with HIV, 81% of whom are on antiretroviral therapy. Although the literature continues to evolve, data suggest that in general, Black women are at greater risk for gestational weight gain.
“We have to remember that women who gain excess weight in pregnancy are still going to be with this weight following pregnancy as well,” Dr. Yawetz said. “So, it might impact their pregnancy but also their health after delivery and for subsequent pregnancies, which we don’t have data for yet.”
Dr. Fuller agrees that more data are needed and mentioned that the team plans to study this further, ideally with larger sample sizes.
Yet, despite the lingering questions, there is a silver lining, one that Dr. Yawetz was emphatic about.
“I really welcome people doing studies on this because we really need the data. By far, integrase inhibitors are the first-line regimen all over the world for pregnant women, and if you look at the gestalt or full picture, this is the best regimen to give pregnant women,” she said.
Dr. Fuller and Dr. Yawetz report no relevant financial relationships. The study was independently supported.
A version of this article first appeared on Medscape.com.
CDC warns of enterovirus strain linked to polio-like condition
, according to a Health Network Alert advisory by the Centers for Disease Control and Prevention.
In August, health care providers and hospitals notified the CDC of an increase in severe respiratory illness in children who also tested positive for rhinovirus (RV) or enterovirus (EV). Additional testing revealed that some children were positive for EV-D68, which primarily causes acute respiratory illness. However, the virus has been associated with acute flaccid myelitis (AFM), a rare neurologic condition involving muscle weakness.
Also, in July and August 2022, surveillance networks reported an increase in EV-D68 activity compared with the same months in 2019, 2020, and 2021, the agency said in the alert. As of Aug. 30, the CDC has not received any reports of AFM beginning this year; however, spikes in EV-D68 typically come before cases of AFM, they said.
“Something we are always on the lookout for in the late summer and fall is AFM cases,” said Rick Malley, MD, of the division of infectious disease at Boston Children’s Hospital, in an interview with this news organization. “Unfortunately, we kind of expect them during enterovirus season,” he said. That season is thought to peak in the late summer and early fall.
Since the CDC began tracking AFM in August 2014, there have been 692 confirmed cases in the United States. AFM cases spiked in 2014, 2016, and 2018, mostly in young children. In 2021, there were 28 confirmed cases across 15 states. The CDC did not specify the age of those cases, but in 2018 – when EV-D68 most recently circulated at high levels – the median age of children who visited the emergency department or were hospitalized for EV-D68–associated respiratory illness was 3 years.
“[AFM] can be very severe and it can be very scary for the parents of children who have it,” Dr. Malley said, “but given the prevalence of enteroviruses in the community, you have to conclude it’s a relatively rare event in susceptible individuals. Why some get it and others don’t is unfortunately unclear at this moment.”
The CDC recommends that providers consider EV-D68 as a possible cause for acute, severe respiratory illness in children. If the cause of a respiratory illness in a severely ill patient is not clear, health professionals should test for RVs and EVs, if this is not already part of a typical diagnostic workflow, the agency said. Currently, there are no vaccines or specific treatments for RV or EV, and the CDC recommends supportive clinical management.
The advisory also urged providers to “strongly consider AFM in patients with acute flaccid limb weakness, especially after respiratory illness or fever, and between the months of August and November 2022.”
For any patient presenting with possible AFM, clinicians should collect samples from multiple sources, including cerebrospinal fluid, serum, stool, and a nasopharyngeal or oropharyngeal swab. Samples should be taken “as early as possible and preferably on the day of onset of limb weakness,” the alert said. There is currently no specific medicine for AFM, the agency said, though recommended interventions may vary for each patient.
A version of this article first appeared on Medscape.com.
Post-COVID fatigue, exercise intolerance signal ME/CFS
A new study provides yet more evidence that a significant subset of people who experience persistent fatigue and exercise intolerance following COVID-19 will meet diagnostic criteria for myalgic encephalomyelitis/chronic fatigue syndrome (ME/CFS).
Data from the prospective observational study of 42 patients with “post-COVID-19 syndrome (PCS),” including persistent fatigue and exercise intolerance, suggest that a large proportion will meet strict diagnostic criteria for ME/CFS, including the hallmark postexertional malaise (PEM). Still others may experience similar disability but lack duration and/or severity requirements for the diagnosis.

Moreover, disease severity and symptom burden were found similar in those with ME/CFS following COVID-19 and in a group of 19 age- and sex-matched individuals with ME/CFS that wasn’t associated with COVID-19.
“The major finding is that ME/CFS is indeed part of the spectrum of the post-COVID syndrome and very similar to the ME/CFS we know after other infectious triggers,” senior author Carmen Scheibenbogen, MD, acting director of the Institute for Medical Immunology at the Charité University Medicine Campus Virchow-Klinikum, Berlin, told this news organization.
Importantly, from a clinical standpoint, both diminished hand-grip strength (HGS) and orthostatic intolerance were common across all patient groups, as were several laboratory values, Claudia Kedor, MD, and colleagues at Charité report in the paper, published online in Nature Communications.
Of the 42 with PCS, including persistent fatigue and exercise intolerance lasting at least 6 months, 19 met the rigorous Canadian Consensus Criteria (CCC) for ME/CFS, established in 2003, which require PEM, along with sleep dysfunction, significant persistent fatigue, pain, and several other symptoms from neurological/cognitive, autonomic, neuroendocrine, and immune categories that persist for at least 6 months.
Of the 23 who did not meet the CCC criteria, 18 still experienced PEM but for less than the required 14 hours set by the authors based on recent data. The original CCC had suggested 24 hours as the PEM duration. Eight subjects met all the Canadian criteria except for the neurological/cognitive symptoms. None of the 42 had evidence of severe depression.
The previously widely used 1994 “Fukuda” criteria for ME/CFS are no longer recommended because they don’t require PEM, which is now considered a key symptom. The more recent 2015 Institute (now Academy) of Medicine criteria don’t define the length of PEM, the authors note in the paper.
Dr. Scheibenbogen said, “Post-COVID has a spectrum of syndromes and conditions. We see that a subset of patients have similar symptoms of ME/CFS but don’t fulfill the CCC, although they may meet less stringent criteria. We think this is of relevance for both diagnostic markers and development of therapy, because there may be different pathomechanisms between the subsets of post-COVID patients.”
She pointed to other studies from her group suggesting that inflammation is present early in post-COVID (not yet published), while in the subset that goes on to ME/CFS, autoantibodies or endothelial dysfunction play a more important role. «At the moment, it’s quite complex, and I don’t think in the end we will have just one pathomechanism. So I think we’ll need to develop various treatment strategies.”
Asked to comment on the new data, Anthony L. Komaroff, MD, professor of medicine at Harvard Medical School, senior physician at Brigham and Women’s Hospital, both in Boston, and editor in chief of the Harvard Health Letter, told this news organization, “This paper adds to the evidence that an illness with symptoms that meet criteria for ME/CFS can follow COVID-19 in nearly half of those patients who have lingering symptoms. This can occur even in people who initially have only mild symptoms from COVID-19, although it is more likely to happen in the people who are sickest when they first get COVID-19. And those who meet criteria for ME/CFS were seriously impaired in their ability to function, [both] at work and at home.”
But, Dr. Komaroff also cautioned, “the study does not help in determining what fraction of all people who are infected with SARS-CoV-2 go on to develop a condition like ME/CFS, nor how long that condition will last. It is crucial that we get answers to these questions, as the impact on the economy, the health care system, and the disability system could be substantial.”
He pointed to a recent report from the Brookings Institution (2022 Aug 24. “New data shows long Covid is keeping as many as 4 million people out of work” Katie Bach) “finding that “long COVID may be a major contributor to the shortage of job applicants plaguing many businesses.”
Biomarkers include hand-grip strength, orthostatic intolerance, lab measures
Hand-grip strength, as assessed by 10 repeat grips at maximum force and repeated after 60 minutes, were lower for all those meeting ME/CFS criteria, compared with the healthy controls. Hand-grip strength parameters were also positively correlated with laboratory hemoglobin measures in both PCS groups who did and didn’t meet the Canadian ME/CFS criteria.
A total of three patients with PCS who didn’t meet ME/CFS criteria and seven with PCS who met ME/CFS criteria had sitting blood pressures of greater than 140 mm Hg systolic and/or greater than 90 mm Hg diastolic. Five patients with PCS – four who met ME/CFS criteria and one who didn’t – fulfilled criteria for postural orthostatic tachycardia syndrome. Orthostatic hypotension was diagnosed in a total of seven with PCS, including one who did not meet ME/CFS criteria and the rest who did.
Among significant laboratory findings, mannose-binding lectin deficiency, which is associated with increased infection susceptibility and found in only about 6% of historical controls, was found more frequently in both of the PCS cohorts (17% of those with ME/CFS and 23% of those without) than it has been in the past among those with ME/CFS, compared with historical controls (15%).
There was only slight elevation in C-reactive protein, the most commonly measured marker of inflammation. However, another marker indicating inflammation within the last 3-4 months, interleukin 8 assessed in erythrocytes, was above normal in 37% with PCS and ME/CFS and in 48% with PCS who did not meet the ME/CFS criteria.
Elevated antinuclear antibodies, anti–thyroid peroxidase antibodies, vitamin D deficiencies, and folic acid deficiencies were all seen in small numbers of the PCS patients. Angiotensin-converting enzyme 1 levels were below the normal range in 31% of all patients.
“We must anticipate that this pandemic has the potential to dramatically increase the number of ME/CFS patients,” Dr. Kedor and colleagues write. “At the same time, it offers the unique chance to identify ME/CFS patients in a very early stage of disease and apply interventions such as pacing and coping early with a better therapeutic prognosis. Further, it is an unprecedented opportunity to understand the underlying pathomechanism and characterize targets for specific treatment approaches.”
Dr. Scheibenbogen and Dr. Komaroff reported no relevant financial relationships.
A version of this article first appeared on Medscape.com.
A new study provides yet more evidence that a significant subset of people who experience persistent fatigue and exercise intolerance following COVID-19 will meet diagnostic criteria for myalgic encephalomyelitis/chronic fatigue syndrome (ME/CFS).
Data from the prospective observational study of 42 patients with “post-COVID-19 syndrome (PCS),” including persistent fatigue and exercise intolerance, suggest that a large proportion will meet strict diagnostic criteria for ME/CFS, including the hallmark postexertional malaise (PEM). Still others may experience similar disability but lack duration and/or severity requirements for the diagnosis.
Moreover, disease severity and symptom burden were found similar in those with ME/CFS following COVID-19 and in a group of 19 age- and sex-matched individuals with ME/CFS that wasn’t associated with COVID-19.
“The major finding is that ME/CFS is indeed part of the spectrum of the post-COVID syndrome and very similar to the ME/CFS we know after other infectious triggers,” senior author Carmen Scheibenbogen, MD, acting director of the Institute for Medical Immunology at the Charité University Medicine Campus Virchow-Klinikum, Berlin, told this news organization.
Importantly, from a clinical standpoint, both diminished hand-grip strength (HGS) and orthostatic intolerance were common across all patient groups, as were several laboratory values, Claudia Kedor, MD, and colleagues at Charité report in the paper, published online in Nature Communications.
Of the 42 with PCS, including persistent fatigue and exercise intolerance lasting at least 6 months, 19 met the rigorous Canadian Consensus Criteria (CCC) for ME/CFS, established in 2003, which require PEM, along with sleep dysfunction, significant persistent fatigue, pain, and several other symptoms from neurological/cognitive, autonomic, neuroendocrine, and immune categories that persist for at least 6 months.
Of the 23 who did not meet the CCC criteria, 18 still experienced PEM but for less than the required 14 hours set by the authors based on recent data. The original CCC had suggested 24 hours as the PEM duration. Eight subjects met all the Canadian criteria except for the neurological/cognitive symptoms. None of the 42 had evidence of severe depression.
The previously widely used 1994 “Fukuda” criteria for ME/CFS are no longer recommended because they don’t require PEM, which is now considered a key symptom. The more recent 2015 Institute (now Academy) of Medicine criteria don’t define the length of PEM, the authors note in the paper.
Dr. Scheibenbogen said, “Post-COVID has a spectrum of syndromes and conditions. We see that a subset of patients have similar symptoms of ME/CFS but don’t fulfill the CCC, although they may meet less stringent criteria. We think this is of relevance for both diagnostic markers and development of therapy, because there may be different pathomechanisms between the subsets of post-COVID patients.”
She pointed to other studies from her group suggesting that inflammation is present early in post-COVID (not yet published), while in the subset that goes on to ME/CFS, autoantibodies or endothelial dysfunction play a more important role. «At the moment, it’s quite complex, and I don’t think in the end we will have just one pathomechanism. So I think we’ll need to develop various treatment strategies.”
Asked to comment on the new data, Anthony L. Komaroff, MD, professor of medicine at Harvard Medical School, senior physician at Brigham and Women’s Hospital, both in Boston, and editor in chief of the Harvard Health Letter, told this news organization, “This paper adds to the evidence that an illness with symptoms that meet criteria for ME/CFS can follow COVID-19 in nearly half of those patients who have lingering symptoms. This can occur even in people who initially have only mild symptoms from COVID-19, although it is more likely to happen in the people who are sickest when they first get COVID-19. And those who meet criteria for ME/CFS were seriously impaired in their ability to function, [both] at work and at home.”
But, Dr. Komaroff also cautioned, “the study does not help in determining what fraction of all people who are infected with SARS-CoV-2 go on to develop a condition like ME/CFS, nor how long that condition will last. It is crucial that we get answers to these questions, as the impact on the economy, the health care system, and the disability system could be substantial.”
He pointed to a recent report from the Brookings Institution (2022 Aug 24. “New data shows long Covid is keeping as many as 4 million people out of work” Katie Bach) “finding that “long COVID may be a major contributor to the shortage of job applicants plaguing many businesses.”
Biomarkers include hand-grip strength, orthostatic intolerance, lab measures
Hand-grip strength, as assessed by 10 repeat grips at maximum force and repeated after 60 minutes, were lower for all those meeting ME/CFS criteria, compared with the healthy controls. Hand-grip strength parameters were also positively correlated with laboratory hemoglobin measures in both PCS groups who did and didn’t meet the Canadian ME/CFS criteria.
A total of three patients with PCS who didn’t meet ME/CFS criteria and seven with PCS who met ME/CFS criteria had sitting blood pressures of greater than 140 mm Hg systolic and/or greater than 90 mm Hg diastolic. Five patients with PCS – four who met ME/CFS criteria and one who didn’t – fulfilled criteria for postural orthostatic tachycardia syndrome. Orthostatic hypotension was diagnosed in a total of seven with PCS, including one who did not meet ME/CFS criteria and the rest who did.
Among significant laboratory findings, mannose-binding lectin deficiency, which is associated with increased infection susceptibility and found in only about 6% of historical controls, was found more frequently in both of the PCS cohorts (17% of those with ME/CFS and 23% of those without) than it has been in the past among those with ME/CFS, compared with historical controls (15%).
There was only slight elevation in C-reactive protein, the most commonly measured marker of inflammation. However, another marker indicating inflammation within the last 3-4 months, interleukin 8 assessed in erythrocytes, was above normal in 37% with PCS and ME/CFS and in 48% with PCS who did not meet the ME/CFS criteria.
Elevated antinuclear antibodies, anti–thyroid peroxidase antibodies, vitamin D deficiencies, and folic acid deficiencies were all seen in small numbers of the PCS patients. Angiotensin-converting enzyme 1 levels were below the normal range in 31% of all patients.
“We must anticipate that this pandemic has the potential to dramatically increase the number of ME/CFS patients,” Dr. Kedor and colleagues write. “At the same time, it offers the unique chance to identify ME/CFS patients in a very early stage of disease and apply interventions such as pacing and coping early with a better therapeutic prognosis. Further, it is an unprecedented opportunity to understand the underlying pathomechanism and characterize targets for specific treatment approaches.”
Dr. Scheibenbogen and Dr. Komaroff reported no relevant financial relationships.
A version of this article first appeared on Medscape.com.
FROM NATURE COMMUNICATIONS
N.Y. governor declares state disaster emergency to boost polio vaccination
New York Governor Kathy Hochul declared a state disaster emergency on Sept. 9 after the polio virus has been detected in another county. The order allows EMS workers, midwives, and pharmacists to administer the vaccine and permits physicians and nurse practitioners to issue standing orders for polio vaccines.
“On polio, we simply cannot roll the dice,” New York State Health Commissioner Dr. Mary T. Bassett said in a news release. “If you or your child are unvaccinated or not up to date with vaccinations, the risk of paralytic disease is real. I urge New Yorkers to not accept any risk at all.”
In July, an unvaccinated adult man in Rockland County, which is north of New York City, was diagnosed with polio virus. It was the first confirmed case of the virus in the United States since 2013.
New York state health officials have not announced any additional polio cases. Since as early as April, polio has also been detected in wastewater samples in New York City and in Rockland, Orange, and Sullivan counties. In August, the virus was detected in wastewater from Nassau County on Long Island.
New York’s statewide polio vaccination rate is 79%, and the New York State Department of Health is aiming for a rate over 90%, the announcement said. In some counties, vaccination rates are far below the state average, including Rockland County (60%), Orange County (59%), and Sullivan County (62%). Nassau County’s polio vaccination rate is similar to the state average.
“Polio immunization is safe and effective – protecting nearly all people against disease who receive the recommended doses,” Dr. Basset said; “Do not wait to vaccinate.”
A version of this article first appeared on Medscape.com.
Congenital cytomegalovirus declined in wake of COVID-19
Congenital cytomegalovirus cases declined significantly during the COVID-19 pandemic, compared with a period before the pandemic, based on data from nearly 20,000 newborns.
A study originated to explore racial and ethnic differences in congenital cytomegalovirus (cCMV) began in 2016, but was halted in April 2020 because of the COVID-19 pandemic, wrote Mark R. Schleiss, MD, of the University of Minnesota, Minneapolis, and colleagues. The study resumed for a period from August 2020 to December 2021, and the researchers compared data on cCMV before and during the pandemic. The prepandemic period included data from April 2016 to March 2020.
“We have been screening for congenital CMV infection in Minnesota for 6 years as a part of a multicenter collaborative study that I lead as the primary investigator,” Dr. Schleiss said in an interview. “Our efforts have contributed to the decision, vetted through the Minnesota Legislature and signed into law in 2021 (the “Vivian Act”), to begin universal screening for all newborns in Minnesota in 2023. In the context of this ongoing screening/surveillance study, it was important and scientifically very interesting to examine the impact of the COVID-19 pandemic on the risk of congenital CMV infection,” he explained.
The findings were published in a research letter in JAMA Network Open. A total of 15,697 newborns were screened before the pandemic and 4,222 were screened during the pandemic period at six hospitals. The majority of the mothers participating during the prepandemic and pandemic periods were non-Hispanic White (71% and 60%, respectively).
Overall, the percentage screened prevalence for cCMV was 79% in the prepandemic period and 21% during the pandemic, with rates of 4.5 per 1,000 and 1.4 per 1,000, respectively.
Although the highest percentage of cCMV cases occurred in newborns of mothers aged 25 years and older (86%), the prevalence was highest among newborns of mothers aged 24 years and younger (6.0 per 1,000). The prevalence of cCMV overall was higher in infants of non-Hispanic Black mothers vs. non-Hispanic White mothers, but not significantly different (5.1 per 1,000 vs. 4.6 per 1,000) and among second newborns vs. first newborns (6.0 vs. 3.2 per 1,000, respectively).
Factors related to COVID-19, including reduced day care attendance, behavioral changes, and mitigation measures at childcare facilities such as smaller classes and increased hand hygiene and disinfection may have contributed to this decrease in cCMV in the pandemic period, the researchers wrote in their discussion.
The comparable prevalence in newborns of non-Hispanic Black and White mothers contrasts with previous studies showing a higher prevalence in children of non-Hispanic Black mothers, the researchers noted in their discussion.
The study was limited by several factors, including the variation in time points for enrollment at different sites and the exclusion of families in the newborn nursery with positive COVID-19 results during the pandemic, they wrote. More research is needed on the potential effects of behavioral interventions to reduce CMV risk during pregnancy, as well as future CMV vaccination for childbearing-aged women and young children, they concluded.
However, the researchers were surprised by the impact of COVID-19 on the prevalence of cCMV, Dr. Schleiss said in an interview. “We have had the knowledge for many years that CMV infections in young women are commonly acquired through interactions with their toddlers. These interactions – sharing food, wiping drool and nasal discharge from the toddler’s nose, changing diapers, kissing the child on the mouth – can transmit CMV,” he said. In addition, toddlers may acquire CMV from group day care; the child then sheds CMV and transmits the virus to their pregnant mother, who then transmits the virus across the placenta, leading to cCMV infection in the newborn, Dr. Schleiss explained.
Although the researchers expected a decrease in CMV in the wake of closures of group day care, increased home schooling, decreased interactions among children, hygienic precautions, and social isolation, the decrease exceeded their expectations, said Dr. Schleiss. “Our previous work showed that in the 5-year period leading up to the pandemic, about one baby in every 200 births was born with CMV. Between August 2020 and December 2021, the number decreased to one baby in every 1,000 births,” a difference he and his team found striking.
The message from the study is that CMV can be prevented, said Dr. Schleiss. “Hygienic precautions during pregnancy had a big impact. Since congenital CMV infection is the most common congenital infection in the United States, and probably globally, that causes disabilities in children, the implications are highly significant,” he said. “The hygienic precautions we all have engaged in during the pandemic, such as masking, handwashing, and infection prevention behaviors, were almost certainly responsible for the reduction in CMV transmission, which in turn protected mothers and newborns from the potentially devastating effects of the CMV virus,” he noted.
Looking ahead, “Vaccines are moving forward in clinical trials that aim to confer immunity on young women of childbearing age to protect future pregnancies against transmission of CMV to the newborn infant; it would be very important to examine in future studies whether hygienic precautions would have the same impact as a potential vaccine,” Dr. Schleiss said. More research is needed to examine the effect of education of women about CMV transmission, he added. “We think it is very important to share this knowledge from our study with the pediatric community, since pediatricians can be important in counseling women about future pregnancies and the risks of CMV acquisition and transmission,” he noted.
Implications for other viruses
Although CMV poses minimal risk for healthy populations, irreversible complications for infants born with congenital CMV, especially hearing loss, are very concerning, said Catherine Haut, DNP, CPNP-AC/PC, a pediatric nurse practitioner in Rehoboth Beach, Del., in an interview.
“The study of viral transmission during a time of isolation, masking, and other mitigation procedures for COVID-19 assists in awareness that other viruses may also be limited with the use of these measures,” she said.
Dr. Haut was not surprised by the findings, given that CMV is transmitted primarily through direct contact with body fluids and that more than 50% of American adults have been infected by age 40, according to the Centers for Disease Control and Prevention, she said.
The take-home message for pediatricians, Dr. Haut said, is measures to prevent transmission of viral infection can yield significant positive health outcomes for the pediatric population; however, the effect of isolation, which has been associated with a higher rate of mental health problems, should not be ignored.
“Despite appropriate statistical analyses and presentation of findings in this study, the population sampled during the pandemic was less than 30% of the pre-COVID sampling, representing a study limitation,” and conducting research in a single state limits generalizability, Dr. Haut noted. “I agree with the authors that additional study is necessary to better understand prevention measures and apply these methods to reduce CMV transmission. Pursuit of CMV immunization opportunities is also needed,” she said.
The study was supported by the Centers for Disease Control and Prevention, the National Vaccine Program Office, the Minnesota Department of Health Newborn Screening Program, and the University of South Carolina Disability Research and Dissemination Center. Lead author Dr. Schleiss disclosed grants from the CDC, the National Institutes of Health, and the DRDC during the conduct of the study; he also disclosed receiving personal fees from Moderna, Sanofi, GlaxoSmithKline, and Merck unrelated to the study. Dr. Haut had no financial conflicts to disclose and serves on the Editorial Advisory Board of Pediatric News.
FROM JAMA NETWORK OPEN
Pediatric vaccines & infectious diseases, 2022
Introduction
ICYMI articles featuring 9 important developments of the past year – and COVID is still here
By Christopher J. Harrison, MD
Table of contents
Antibiotics use and vaccine antibody levels
Commentary
Emerging tick-borne pathogen has spread to state of Georgia
Commentary
WHO, UNICEF warn about increased risk of measles outbreaks
Commentary
Babies die as congenital syphilis continues a decade-long surge across the U.S.
Commentary
Meningococcal vaccine shows moderate protective effect against gonorrhea
Commentary
Adolescents are undertested for STIs
Commentary
TB treatment can be shortened for most children: Study
Commentary
Nirsevimab protects healthy infants from RSV
Commentary
Norovirus vaccine candidates employ different approaches
Commentary