User login
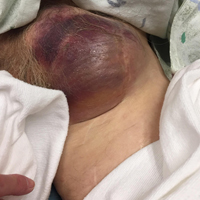
Aortic dissection presenting as ischemic limb
A 40-year-old man with a history of hypertension and alcohol abuse presented with acute onset of mild chest tightness, left leg pain, and increasing agitation, which prevented us from obtaining additional meaningful information from him.
On admission, his heart rate was 120 beats per minute, blood pressure 211/122 mm Hg, respiratory rate 18 per minute, and oxygen saturation 92% on room air. Given his history of alcohol abuse, we checked his blood ethanol level, which was less than 0.01%, well below the legal limit for intoxication.
We gave the patient intravenous lorazepam for possible alcohol withdrawal and started labetalol by intravenous infusion to lower his blood pressure.

On physical examination, his left lower extremity was cold and without pulses, including the femoral pulse. Suspecting acute arterial thrombosis, we ordered immediate computed tomographic (CT) angiography of the abdomen and pelvis with left lower extremity runoff. The images showed dissection of the abdominal aorta with extension to both the left and right common iliac arteries and the origin of the right external iliac artery. There was resultant occlusion of the left external iliac artery (Figure 1).

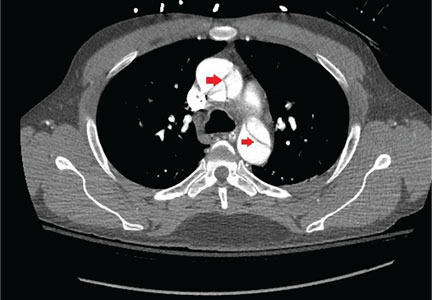
Immediate CT angiography of the chest was then performed, which revealed dissection of the thoracic aorta as well, starting superior to the aortic valve annulus and involving the ascending aorta, aortic arch, and the entire descending thoracic aorta (Figure 2).
The patient underwent emergency surgical repair of the aortic root, ascending aorta, and aortic arch. Residual dissection of the descending aorta was managed conservatively with blood pressure control using intravenous labetalol initially, which was then switched to oral carvedilol, and the pulses returned in his left lower extremity. He had an unremarkable postoperative recovery and was discharged after 1 week.
AORTIC DISSECTION AND MALPERFUSION SYNDROME
Aortic dissection is most often associated with acute onset of sharp chest pain and upper back pain. On rare occasions, it can have an atypical presentation such as stroke, paraplegia, mesenteric ischemia, or lower limb malperfusion.1
Extension of aortic dissection into the iliac and femoral arteries can cause impaired or absent blood flow to the lower extremity. These pulse deficits are a part of limb malperfusion syndrome. Symptoms of malperfusion syndrome vary greatly and depend on the vessels involved. Malperfusion of the branches of the aortic arch can result in stroke or altered sensorium. Compromise of intra-abdominal vessels due to dissection can involve the mesenteric bed, the renal arteries, or both, resulting in laboratory derangements such as lactic acidosis and renal failure.
How aortic dissection and malperfusion syndrome occur
Over time, shear forces on the aortic wall result in degeneration of the tunica intima and media. Dissection occurs when deterioration of the intima causes propagation of blood through a cleavage plane into the outer portion of the diseased media, forming a false lumen.
Anterograde or retrograde progression of dissection depends on the balance of the pressure gradient between true and false lumens.2 With every systolic ventricular contraction, a fluid and pressure wave travels down both lumens (true and false). However, the pressure gradient between the false and true lumens allows the more pliable intimal flap to bulge into the true lumen and ostia of branch vessels, resulting in static or dynamic obstruction.
Static obstruction occurs when the false lumen projects completely into the branch vessel and there is resultant thrombosis. As the name implies, dynamic obstruction is intermittent and is responsible for 80% of the cases of malperfusion syndrome.3 Dynamic obstruction has 2 distinct mechanisms: hypoperfusion through the true lumen due to impaired flow, and prolapse of the false lumen into a branch vessel.
Factors that exacerbate hypoperfusion through the true lumen and make obliteration by the false lumen more likely include large circumference of the dissected aorta, rapid heart rate, and high systolic pressure.4 Therefore, it is important to control the heart rate and blood pressure using beta-blockers in cases of aortic dissection with malperfusion syndrome. This treatment may resolve the dynamic obstruction through expansion and resumption of perfusion through the true lumen.5
MANAGEMENT OF MALPERFUSION SYNDROME
Aortic dissection can be classified as either Stanford type A (involving the ascending aorta) or type B (involving the descending aorta). Type B dissection associated with malperfusion syndrome is termed “complicated” type B aortic dissection. Our patient had both Stanford type A and complicated type B aortic dissection.
Unlike type A aortic dissection, which requires definitive open surgical repair, complicated type B aortic dissection occasionally responds to medical management alone. A plausible explanation for resolution of limb malperfusion with optimal blood pressure control is expansion of the true lumen and obliteration of the false lumen, as was likely the case in our patient.
In most cases, however, limb malperfusion persists despite optimal medical management. In such patients, endovascular graft stenting or open surgical repair may be needed. Open surgical repair procedures like bypass grafting or surgical fenestration are associated with significant rates of mortality and morbidity.5 Therefore, an endovascular approach rather than conventional surgical repair for complicated type B aortic dissection is advocated after optimal medical management.6 Endovascular repair also promotes favorable aortic remodeling without the morbidity associated with open surgical repair.
- Namana V, Balasubramanian R, Kariyanna PT, Sarasam R, Namana S, Shetty V. Aortic dissection with hemopericardium and thrombosed left common iliac artery presenting as acute limb ischemia: a case report and review. Am J Med Case Rep 2015; 3(10):338–343. doi:10.12691/ajmcr-3-10-9
- Crawford TC, Beaulieu RJ, Ehlert BA, Ratchford EV, Black JH 3rd. Malperfusion syndromes in aortic dissections. Vasc Med 2016; 21(3):264–273. doi:10.1177/1358863X15625371
- Williams DM, Lee DY, Hamilton BH, et al. The dissected aorta: percutaneous treatment of ischemic complications—principles and results. J Vasc Interv Radiol 1997; 8(4):605–625. pmid:9232578
- Chung JW, Elkins C, Sakai T, et al. True-lumen collapse in aortic dissection: part II. Evaluation of treatment methods in phantoms with pulsatile flow. Radiology 2000; 214(1):99–106. doi:10.1148/radiology.214.1.r00ja3499
- Gargiulo M, Bianchini Massoni C, Gallitto E, et al. Lower limb malperfusion in type B aortic dissection: a systematic review. Ann Cardiothorac Surg 2014; 3(4):351–367. doi:10.3978/j.issn.2225-319X.2014.07.05
- Dake MD, Kato N, Mitchell RS, et al. Endovascular stent-graft placement for the treatment of acute aortic dissection. N Engl J Med 1999; 340(20):1546–1552. doi:10.1056/NEJM199905203402004
A 40-year-old man with a history of hypertension and alcohol abuse presented with acute onset of mild chest tightness, left leg pain, and increasing agitation, which prevented us from obtaining additional meaningful information from him.
On admission, his heart rate was 120 beats per minute, blood pressure 211/122 mm Hg, respiratory rate 18 per minute, and oxygen saturation 92% on room air. Given his history of alcohol abuse, we checked his blood ethanol level, which was less than 0.01%, well below the legal limit for intoxication.
We gave the patient intravenous lorazepam for possible alcohol withdrawal and started labetalol by intravenous infusion to lower his blood pressure.
On physical examination, his left lower extremity was cold and without pulses, including the femoral pulse. Suspecting acute arterial thrombosis, we ordered immediate computed tomographic (CT) angiography of the abdomen and pelvis with left lower extremity runoff. The images showed dissection of the abdominal aorta with extension to both the left and right common iliac arteries and the origin of the right external iliac artery. There was resultant occlusion of the left external iliac artery (Figure 1).
Immediate CT angiography of the chest was then performed, which revealed dissection of the thoracic aorta as well, starting superior to the aortic valve annulus and involving the ascending aorta, aortic arch, and the entire descending thoracic aorta (Figure 2).
The patient underwent emergency surgical repair of the aortic root, ascending aorta, and aortic arch. Residual dissection of the descending aorta was managed conservatively with blood pressure control using intravenous labetalol initially, which was then switched to oral carvedilol, and the pulses returned in his left lower extremity. He had an unremarkable postoperative recovery and was discharged after 1 week.
AORTIC DISSECTION AND MALPERFUSION SYNDROME
Aortic dissection is most often associated with acute onset of sharp chest pain and upper back pain. On rare occasions, it can have an atypical presentation such as stroke, paraplegia, mesenteric ischemia, or lower limb malperfusion.1
Extension of aortic dissection into the iliac and femoral arteries can cause impaired or absent blood flow to the lower extremity. These pulse deficits are a part of limb malperfusion syndrome. Symptoms of malperfusion syndrome vary greatly and depend on the vessels involved. Malperfusion of the branches of the aortic arch can result in stroke or altered sensorium. Compromise of intra-abdominal vessels due to dissection can involve the mesenteric bed, the renal arteries, or both, resulting in laboratory derangements such as lactic acidosis and renal failure.
How aortic dissection and malperfusion syndrome occur
Over time, shear forces on the aortic wall result in degeneration of the tunica intima and media. Dissection occurs when deterioration of the intima causes propagation of blood through a cleavage plane into the outer portion of the diseased media, forming a false lumen.
Anterograde or retrograde progression of dissection depends on the balance of the pressure gradient between true and false lumens.2 With every systolic ventricular contraction, a fluid and pressure wave travels down both lumens (true and false). However, the pressure gradient between the false and true lumens allows the more pliable intimal flap to bulge into the true lumen and ostia of branch vessels, resulting in static or dynamic obstruction.
Static obstruction occurs when the false lumen projects completely into the branch vessel and there is resultant thrombosis. As the name implies, dynamic obstruction is intermittent and is responsible for 80% of the cases of malperfusion syndrome.3 Dynamic obstruction has 2 distinct mechanisms: hypoperfusion through the true lumen due to impaired flow, and prolapse of the false lumen into a branch vessel.
Factors that exacerbate hypoperfusion through the true lumen and make obliteration by the false lumen more likely include large circumference of the dissected aorta, rapid heart rate, and high systolic pressure.4 Therefore, it is important to control the heart rate and blood pressure using beta-blockers in cases of aortic dissection with malperfusion syndrome. This treatment may resolve the dynamic obstruction through expansion and resumption of perfusion through the true lumen.5
MANAGEMENT OF MALPERFUSION SYNDROME
Aortic dissection can be classified as either Stanford type A (involving the ascending aorta) or type B (involving the descending aorta). Type B dissection associated with malperfusion syndrome is termed “complicated” type B aortic dissection. Our patient had both Stanford type A and complicated type B aortic dissection.
Unlike type A aortic dissection, which requires definitive open surgical repair, complicated type B aortic dissection occasionally responds to medical management alone. A plausible explanation for resolution of limb malperfusion with optimal blood pressure control is expansion of the true lumen and obliteration of the false lumen, as was likely the case in our patient.
In most cases, however, limb malperfusion persists despite optimal medical management. In such patients, endovascular graft stenting or open surgical repair may be needed. Open surgical repair procedures like bypass grafting or surgical fenestration are associated with significant rates of mortality and morbidity.5 Therefore, an endovascular approach rather than conventional surgical repair for complicated type B aortic dissection is advocated after optimal medical management.6 Endovascular repair also promotes favorable aortic remodeling without the morbidity associated with open surgical repair.
- Namana V, Balasubramanian R, Kariyanna PT, Sarasam R, Namana S, Shetty V. Aortic dissection with hemopericardium and thrombosed left common iliac artery presenting as acute limb ischemia: a case report and review. Am J Med Case Rep 2015; 3(10):338–343. doi:10.12691/ajmcr-3-10-9
- Crawford TC, Beaulieu RJ, Ehlert BA, Ratchford EV, Black JH 3rd. Malperfusion syndromes in aortic dissections. Vasc Med 2016; 21(3):264–273. doi:10.1177/1358863X15625371
- Williams DM, Lee DY, Hamilton BH, et al. The dissected aorta: percutaneous treatment of ischemic complications—principles and results. J Vasc Interv Radiol 1997; 8(4):605–625. pmid:9232578
- Chung JW, Elkins C, Sakai T, et al. True-lumen collapse in aortic dissection: part II. Evaluation of treatment methods in phantoms with pulsatile flow. Radiology 2000; 214(1):99–106. doi:10.1148/radiology.214.1.r00ja3499
- Gargiulo M, Bianchini Massoni C, Gallitto E, et al. Lower limb malperfusion in type B aortic dissection: a systematic review. Ann Cardiothorac Surg 2014; 3(4):351–367. doi:10.3978/j.issn.2225-319X.2014.07.05
- Dake MD, Kato N, Mitchell RS, et al. Endovascular stent-graft placement for the treatment of acute aortic dissection. N Engl J Med 1999; 340(20):1546–1552. doi:10.1056/NEJM199905203402004
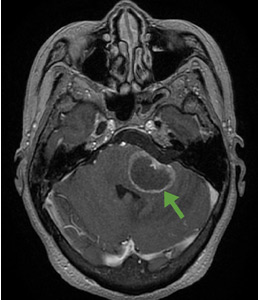
Central nervous system lymphoma mimicking Bell palsy
A 59-year-old woman presented with drooling out of the left side of her mouth and inability to close her left eye. She had no ear pain, hearing loss, or skin rash. The facial palsy affected all branches of the left facial nerve. This explained her inability to close her left eyelid and the generalized weakness of the left side of the face, including her forehead and angle of the mouth. No other signs of pontine dysfunction were noted.
The symptoms had begun 2 months earlier, and computed tomography (CT) of the head performed at a nearby clinic 3 days after the onset of symptoms showed no abnormalities. She was given a diagnosis of incomplete Bell palsy and was prescribed prednisolone and valacyclovir. However, her symptoms had not improved after 2 months of treatment, and so she presented to our hospital.
Physical examination revealed moderate nerve dysfunction (House-Brackmann grade III, with grade I normal and grade VI total paralysis) and generalized weakness on the left side of her face including her forehead.1 She had no loss in facial sensation or hearing and no ataxia or ocular motility disorders.
.")
.")
BELL PALSY
Peripheral facial nerve palsy is classified either as Bell palsy, which is idiopathic, or as secondary facial nerve palsy. Because Bell palsy accounts for 60% to 70% of all cases,2 treatment with oral steroids is indicated when no abnormal findings other than lateral peripheral facial nerve palsy are observed. Antiviral drugs may provide added benefit, although academic societies do not currently recommend combined therapy.3 However, 85% of patients with Bell palsy improve within 3 weeks without treatment, and 94% of patients with incomplete Bell palsy—defined by normal to severe dysfunction, ie, not total paralysis, based on House-Brackmann score—eventually achieve complete remission.2
Therefore, although progression of symptoms or lack of improvement at 2 months does not rule out Bell palsy, it should prompt a detailed imaging evaluation to rule out an underlying condition such as tumor (in the pons, cerebellopontine angle, parotid gland, middle ear, or petrosal bone), infection (herpes simplex, varicella zoster, Ramsey-Hunt syndrome, or otitis media), trauma, or systemic disease (diabetes mellitus, multiple sclerosis, sarcoidosis, or systemic lupus erythematosus).4
According to a review of common causes of facial nerve palsy, the most common finding in 224 patients misdiagnosed with Bell palsy was tumor (38%).5 This indicates the value of magnetic resonance imaging of the head rather than CT when secondary facial nerve palsy is suspected, as CT is not sensitive to brainstem lesions.
- House JW, Brackmann DE. Facial nerve grading system. Otolaryngol Head Neck 1985; 93(2):146–147. doi:10.1177/019459988509300202
- Peitersen E. Bell’s palsy: the spontaneous course of 2,500 peripheral facial nerve palsies of different etiologies. Acta Otolaryngol Suppl 2002; suppl 549:4–30. pmid:12482166
- De Almeida JR, Al Khabori M, Guyatt GH, et al. Combined corticosteroid and antiviral treatment for Bell palsy: a systematic review and meta-analysis. JAMA 2009; 302(9):985–993. doi:10.1001/jama.2009.1243
- Alaani A, Hogg R, Saravanappa N, Irving RM. An analysis of diagnostic delay in unilateral facial paralysis. J Laryngol Otol 2005; 119(3):184–188. pmid:15845188
- May M, Klein SR. Differential diagnosis of facial nerve palsy. Otolaryngol Clin North Am 1991; 24(3):613–645. pmid:1762779
A 59-year-old woman presented with drooling out of the left side of her mouth and inability to close her left eye. She had no ear pain, hearing loss, or skin rash. The facial palsy affected all branches of the left facial nerve. This explained her inability to close her left eyelid and the generalized weakness of the left side of the face, including her forehead and angle of the mouth. No other signs of pontine dysfunction were noted.
The symptoms had begun 2 months earlier, and computed tomography (CT) of the head performed at a nearby clinic 3 days after the onset of symptoms showed no abnormalities. She was given a diagnosis of incomplete Bell palsy and was prescribed prednisolone and valacyclovir. However, her symptoms had not improved after 2 months of treatment, and so she presented to our hospital.
Physical examination revealed moderate nerve dysfunction (House-Brackmann grade III, with grade I normal and grade VI total paralysis) and generalized weakness on the left side of her face including her forehead.1 She had no loss in facial sensation or hearing and no ataxia or ocular motility disorders.
BELL PALSY
Peripheral facial nerve palsy is classified either as Bell palsy, which is idiopathic, or as secondary facial nerve palsy. Because Bell palsy accounts for 60% to 70% of all cases,2 treatment with oral steroids is indicated when no abnormal findings other than lateral peripheral facial nerve palsy are observed. Antiviral drugs may provide added benefit, although academic societies do not currently recommend combined therapy.3 However, 85% of patients with Bell palsy improve within 3 weeks without treatment, and 94% of patients with incomplete Bell palsy—defined by normal to severe dysfunction, ie, not total paralysis, based on House-Brackmann score—eventually achieve complete remission.2
Therefore, although progression of symptoms or lack of improvement at 2 months does not rule out Bell palsy, it should prompt a detailed imaging evaluation to rule out an underlying condition such as tumor (in the pons, cerebellopontine angle, parotid gland, middle ear, or petrosal bone), infection (herpes simplex, varicella zoster, Ramsey-Hunt syndrome, or otitis media), trauma, or systemic disease (diabetes mellitus, multiple sclerosis, sarcoidosis, or systemic lupus erythematosus).4
According to a review of common causes of facial nerve palsy, the most common finding in 224 patients misdiagnosed with Bell palsy was tumor (38%).5 This indicates the value of magnetic resonance imaging of the head rather than CT when secondary facial nerve palsy is suspected, as CT is not sensitive to brainstem lesions.
- House JW, Brackmann DE. Facial nerve grading system. Otolaryngol Head Neck 1985; 93(2):146–147. doi:10.1177/019459988509300202
- Peitersen E. Bell’s palsy: the spontaneous course of 2,500 peripheral facial nerve palsies of different etiologies. Acta Otolaryngol Suppl 2002; suppl 549:4–30. pmid:12482166
- De Almeida JR, Al Khabori M, Guyatt GH, et al. Combined corticosteroid and antiviral treatment for Bell palsy: a systematic review and meta-analysis. JAMA 2009; 302(9):985–993. doi:10.1001/jama.2009.1243
- Alaani A, Hogg R, Saravanappa N, Irving RM. An analysis of diagnostic delay in unilateral facial paralysis. J Laryngol Otol 2005; 119(3):184–188. pmid:15845188
- May M, Klein SR. Differential diagnosis of facial nerve palsy. Otolaryngol Clin North Am 1991; 24(3):613–645. pmid:1762779
Is a detailed neurologic physical examination always necessary?
The article in this issue by Shikino et al1 on a mimic of Bell palsy gives us an opportunity to discuss the question posed by the title of this editorial. The obvious short answer is “no.”
Any experienced clinician will acknowledge that the extent of the physical examination and the extent of information obtained during the history should be determined by the problem being evaluated at the time and by the setting in which it takes place. The difficulty, of course, is that this relies on the judgment of the clinician, and this may or may not pass the test of hindsight.
Verghese et al2 have eloquently emphasized the hazards of an incomplete or inadequate physical examination. Their study was not designed to determine the prevalence of deficient physical examination, either in its extent or its accuracy. Their purpose was to promote the necessity of proper teaching and performance of examination technique.
The neurologic examination is one of the last bastions of physical assessment.3 Despite remarkable advances in imaging and physiologic techniques, the neurologic physical assessment remains critical for diagnosis and management of the neurologic patient. One of my mentors in neurology used to urge residents to examine patients and record the results of the examination as if every patient would subsequently be the subject of a clinicopathologic conference. Anyone who has reviewed a case for a conference or a case report can identify with that sentiment, wishing that some missing piece of information were available. Yet everyone also recognizes the difficulties, if not the impossibility, of achieving that ideal result.
But recording information obtained during the history or physical examination is important even in the course of a daily routine evaluation. I find myself wishing that a previous examiner had commented on whether the muscle stretch reflexes were somewhat hypoactive (eg, “1+”) or on the brisk side (“3+”) rather than “physiologic.” Was the right leg actually globally weak (“4/5”), or was there a discrepancy between proximal and distal muscles or between the physiologic flexors and the extensors?
This can make a big difference in following a patient’s neurologic progress, even over a short time span. It might tell us whether we are dealing with weakness from a peripheral neuromuscular disorder (eg, Guillain-Barré syndrome) or from a myelopathy due to impending spinal cord compression.
It should be mentioned that although Guillain-Barré syndrome is characterized as an ascending paralysis, ie, beginning distally and spreading rostrally, it is one of the few peripheral neuropathies that can present with predominant proximal weakness. It is, in fact, a radiculoneuropathy. But spinal cord (upper motor neuron) disorders preferentially weaken the physiologic flexors of the lower limbs (hamstrings and ankle dorsiflexors), leading to the characteristic extensor posture of the spastic leg. Other findings that can help differential peripheral vs spinal cord disorders include distal sensory loss and hypoactive or absent muscle stretch reflexes in a peripheral neuropathy, compared with dissociated sensory loss (eg, impaired pain and temperature sensation in one leg with reduced vibration perception and proprioception in the other) along with hyperreflexia with cord lesions.
Therefore, a careful neurologic examination may tell us whether magnetic resonance imaging of the spine or an electrodiagnostic study should be the next step.
Shikino et al describe a patient who presented with what looked like idiopathic facial palsy (Bell palsy) but turned out to be the result of a primary central nervous system (CNS) cause. Would a more detailed neurologic examination have identified this as a CNS disorder? Would more specific information about the degree and distribution of facial paresis have facilitated earlier recognition of a progressive process, making idiopathic facial palsy less likely? How much elevation of the eyebrow occurred with voluntary activation, how many millimeters of sclera were visible with gentle eyelid closure? How much space remained between the lips on attempted lip closure?
Upper facial muscle weakness is typically not seen in CNS disorders, although facial nerve or nucleus involvement at the pontine level can impair eyelid and frontalis function. Such lesions would usually be accompanied by “neighborhood” signs such as subtle ipsilateral lateral rectus or abducens palsy, involvement of the vestibular nuclei with vertigo, or facial sensory impairment from disruption of the descending trigeminal nucleus and tract. These would be “pertinent negatives” for excluding a brainstem lesion, and ipsilateral motor, sensory, or “higher cortical” functions would obviously signal a supratentorial CNS disorder.
In the case described by Shikino et al, observation and recording of the amount of facial motor function at the initial visit, 3 days after onset, could facilitate recognition of an aberrant course even a few days later and prompt further investigation at an early follow-up visit (idiopathic palsy is almost invariably maximal by 72 hours). I would assume that no additional clinical information was available to the subsequent examiner in this case, 2 months later, rather than suggesting that such information was omitted for the sake of parsimony.
Would any of this have made a difference? Probably not, but we need all the help we can get in medicine. Remember that every bit of information you obtain from your history or physical examination that you do not record disappears with you and is irretrievably lost.
- Shikino K, Suzuki S, Uehara T, Ikusaka M. Primary central nervous system lymphoma mimicking Bell palsy. Cleve Clin J Med 2018: 85(6)442–443. doi:10.3949/ccjm.85a.17061
- Verghese A, Charlton B, Kassirer JP, Ramsey M, Ioannidis JP. Inadequacies of physical examination as a cause of medical errors and adverse events: a collection of vignettes. Am J Med 2015; 128(12):1322–1324.e3. doi:10.1016/j.amjmed.2015.06.004
- Berger JR. Neurologists: the last bedside physician-scientists. JAMA Neurol 2013; 70(8):965–966. doi:10.1001/jamaneurol.2013.2977
The article in this issue by Shikino et al1 on a mimic of Bell palsy gives us an opportunity to discuss the question posed by the title of this editorial. The obvious short answer is “no.”
Any experienced clinician will acknowledge that the extent of the physical examination and the extent of information obtained during the history should be determined by the problem being evaluated at the time and by the setting in which it takes place. The difficulty, of course, is that this relies on the judgment of the clinician, and this may or may not pass the test of hindsight.
Verghese et al2 have eloquently emphasized the hazards of an incomplete or inadequate physical examination. Their study was not designed to determine the prevalence of deficient physical examination, either in its extent or its accuracy. Their purpose was to promote the necessity of proper teaching and performance of examination technique.
The neurologic examination is one of the last bastions of physical assessment.3 Despite remarkable advances in imaging and physiologic techniques, the neurologic physical assessment remains critical for diagnosis and management of the neurologic patient. One of my mentors in neurology used to urge residents to examine patients and record the results of the examination as if every patient would subsequently be the subject of a clinicopathologic conference. Anyone who has reviewed a case for a conference or a case report can identify with that sentiment, wishing that some missing piece of information were available. Yet everyone also recognizes the difficulties, if not the impossibility, of achieving that ideal result.
But recording information obtained during the history or physical examination is important even in the course of a daily routine evaluation. I find myself wishing that a previous examiner had commented on whether the muscle stretch reflexes were somewhat hypoactive (eg, “1+”) or on the brisk side (“3+”) rather than “physiologic.” Was the right leg actually globally weak (“4/5”), or was there a discrepancy between proximal and distal muscles or between the physiologic flexors and the extensors?
This can make a big difference in following a patient’s neurologic progress, even over a short time span. It might tell us whether we are dealing with weakness from a peripheral neuromuscular disorder (eg, Guillain-Barré syndrome) or from a myelopathy due to impending spinal cord compression.
It should be mentioned that although Guillain-Barré syndrome is characterized as an ascending paralysis, ie, beginning distally and spreading rostrally, it is one of the few peripheral neuropathies that can present with predominant proximal weakness. It is, in fact, a radiculoneuropathy. But spinal cord (upper motor neuron) disorders preferentially weaken the physiologic flexors of the lower limbs (hamstrings and ankle dorsiflexors), leading to the characteristic extensor posture of the spastic leg. Other findings that can help differential peripheral vs spinal cord disorders include distal sensory loss and hypoactive or absent muscle stretch reflexes in a peripheral neuropathy, compared with dissociated sensory loss (eg, impaired pain and temperature sensation in one leg with reduced vibration perception and proprioception in the other) along with hyperreflexia with cord lesions.
Therefore, a careful neurologic examination may tell us whether magnetic resonance imaging of the spine or an electrodiagnostic study should be the next step.
Shikino et al describe a patient who presented with what looked like idiopathic facial palsy (Bell palsy) but turned out to be the result of a primary central nervous system (CNS) cause. Would a more detailed neurologic examination have identified this as a CNS disorder? Would more specific information about the degree and distribution of facial paresis have facilitated earlier recognition of a progressive process, making idiopathic facial palsy less likely? How much elevation of the eyebrow occurred with voluntary activation, how many millimeters of sclera were visible with gentle eyelid closure? How much space remained between the lips on attempted lip closure?
Upper facial muscle weakness is typically not seen in CNS disorders, although facial nerve or nucleus involvement at the pontine level can impair eyelid and frontalis function. Such lesions would usually be accompanied by “neighborhood” signs such as subtle ipsilateral lateral rectus or abducens palsy, involvement of the vestibular nuclei with vertigo, or facial sensory impairment from disruption of the descending trigeminal nucleus and tract. These would be “pertinent negatives” for excluding a brainstem lesion, and ipsilateral motor, sensory, or “higher cortical” functions would obviously signal a supratentorial CNS disorder.
In the case described by Shikino et al, observation and recording of the amount of facial motor function at the initial visit, 3 days after onset, could facilitate recognition of an aberrant course even a few days later and prompt further investigation at an early follow-up visit (idiopathic palsy is almost invariably maximal by 72 hours). I would assume that no additional clinical information was available to the subsequent examiner in this case, 2 months later, rather than suggesting that such information was omitted for the sake of parsimony.
Would any of this have made a difference? Probably not, but we need all the help we can get in medicine. Remember that every bit of information you obtain from your history or physical examination that you do not record disappears with you and is irretrievably lost.
- Shikino K, Suzuki S, Uehara T, Ikusaka M. Primary central nervous system lymphoma mimicking Bell palsy. Cleve Clin J Med 2018: 85(6)442–443. doi:10.3949/ccjm.85a.17061
- Verghese A, Charlton B, Kassirer JP, Ramsey M, Ioannidis JP. Inadequacies of physical examination as a cause of medical errors and adverse events: a collection of vignettes. Am J Med 2015; 128(12):1322–1324.e3. doi:10.1016/j.amjmed.2015.06.004
- Berger JR. Neurologists: the last bedside physician-scientists. JAMA Neurol 2013; 70(8):965–966. doi:10.1001/jamaneurol.2013.2977
Evaluating suspected pulmonary hypertension: A structured approach
Pulmonary arterial hypertension (PAH) is a hemodynamic disorder that affects small and medium-size pulmonary arteries through cellular proliferation and luminal narrowing.1 Increased pulmonary vascular resistance causes restricted blood flow in these arteries, leading to elevated pulmonary arterial pressure and afterload on the right ventricle. Despite advances in therapy, death usually occurs as a result of right ventricular failure.

- Group 1—PAH, due to narrowed pulmonary arteries
- Group 2—due to left heart disease
- Group 3—due to lung disease or hypoxia, or both
- Group 4—due to chronic thromboembolism or other pulmonary artery obstruction
- Group 5—due to uncertain or multifactorial causes.
Experts recognize the morbidity and mortality associated with pulmonary hypertension now more than in the past, and they emphasize recognizing it early. Guidelines for its diagnosis and treatment were updated in 2015.1
Below, we use a case to discuss recommendations for initial evaluation and classification of pulmonary hypertension, particularly PAH.
A PATIENT SUSPECTED OF HAVING PULMONARY HYPERTENSION
A 63-year-old woman with a 25-pack-year history of tobacco use, as well as pulmonary embolism and coronary artery disease, presents to her primary care physician with exertional dyspnea. She had been a clerk at a hardware store and physically active until she took early retirement 8 months ago because of increasing fatigue. She initially felt the fatigue was simply “a sign of getting old.”
Since retiring, she has noticed the slow onset of progressive dyspnea on exertion. She can no longer climb more than 1 flight of stairs or walk more than 1 block. She also complains of mild, fluctuating edema in her lower extremities over the past month. She quit smoking 8 years ago after undergoing placement of a drug-eluting stent in the mid-left circumflex artery. After this, she received clopidogrel and was followed by a cardiologist for 2 years but stopped taking the medication because of bruising. She has not seen her cardiologist in more than 5 years.
She underwent elective right total knee arthroplasty 3 years ago, complicated by acute deep vein thrombosis in the right common femoral vein. Computed tomography (CT) at that time did not reveal pulmonary emboli. She received warfarin therapy for 3 months.
She reports no current cough, chest pain, lightheadedness, or syncope. She has no orthopnea, and she feels normal at rest.
Her family history is unremarkable, and she has had no exposure to illicit substances, environmental toxins, or dietary supplements. She takes aspirin 81 mg daily, metoprolol 25 mg twice daily, lisinopril 10 mg daily, and simvastatin 40 mg at bedtime.
Her primary care physician detects a murmur in the left lower sternal border and sends her for transthoracic echocardiography, which demonstrates mild right ventricular dilation, right atrial dilation, and mildly reduced right ventricular function. The calculated right ventricular systolic pressure is 69 mm Hg. The left ventricle shows mild concentric hypertrophy; the left atrium is normal in size.
DIAGNOSTIC EVALUATION OF SUSPECTED PULMONARY HYPERTENSION

CLINICAL MANIFESTATIONS

Symptoms and signs. As in the patient described above, the first symptoms such as exertional dyspnea, fatigue, and lightheadedness usually arise in situations that call for increased cardiac output.4 As right ventricular function worsens, symptoms start to occur at rest, and signs of increased right ventricular preload appear, such as abdominal and lower-extremity edema and pericardial effusion. Syncope is a sign of severe right ventricular dysfunction.5
Physical examination. Look for signs of increased right ventricular loading and failure, eg:
- An accentuated intensity and persistent splitting of the second heart sound
- A prominent parasternal heave
- A prominent jugular “a” wave
- A systolic murmur along the left sternal border at the fourth intercostal space, which may worsen with breath-holding
- Pitting lower-extremity edema
- Hepatomegaly
- Hepatojugular reflux
- Hepatic pulsatility.6
ECHOCARDIOGRAPHY IN SUSPECTED PULMONARY HYPERTENSION

Many practitioners rely heavily on the estimated right ventricular systolic pressure in diagnosing pulmonary hypertension. In theory, this number should be nearly the same as the pulmonary arterial systolic pressure. However, technical and patient-related aspects of transthoracic echocardiography often limit accurate measurement of the right ventricular systolic pressure, and readings often differ from those measured with right heart catheterization.8

Our patient had a markedly elevated right ventricular systolic pressure and signs of right ventricular dysfunction, suggesting a high probability of pulmonary hypertension.
EVALUATING LEFT HEART DISEASE (WHO GROUP 2)
More than 75% of cases of pulmonary hypertension are directly related to left ventricular dysfunction or mitral or aortic valve disease (WHO group 2).1 Since group 2 differs markedly from group 1 (PAH) in its pathophysiology and treatment, it is important to distinguish between them.
Compared with WHO group 1 patients, those in group 2 tend to be older, more of them are male, and more of them have comorbidities such as metabolic syndrome, hypertension, and coronary artery disease.1,9 A combination of risk factors and clinical findings should be considered in identifying these patients.10
Transthoracic echocardiography is used to detect features of systolic and diastolic dysfunction. Left atrial enlargement is a clue that left heart disease may be present. In addition, signs of left ventricular or valvular dysfunction on electrocardiography or chest radiography are often helpful.
When estimated right ventricular systolic pressures are only minimally abnormal and no significant right ventricular dysfunction exists, further diagnostic evaluation is not warranted. However, because no single identifying feature or variable can readily distinguish group 2 from the other WHO groups, further evaluation should be considered if the right ventricular systolic pressure is significantly elevated or right ventricular dysfunction exists.
Our patient had several risk factors for left heart disease, including a history of smoking and coronary artery disease. Nonetheless, findings consistent with severe right ventricular dysfunction necessitated further evaluation for other possible causes of her suspected pulmonary hypertension.
Postcapillary pulmonary hypertension
In patients for whom further evaluation is pursued, the diagnosis of WHO group 2 pulmonary hypertension is ultimately based on findings consistent with postcapillary or “passive” pulmonary hypertension on right heart catheterization. Although mean pulmonary arterial pressures must be at least 25 mm Hg to certify the diagnosis of pulmonary hypertension, a pulmonary artery occlusion pressure greater than 15 mm Hg (normal 6–12) and pulmonary vascular resistance of 3 Wood units or less (normal 0.3–1.6) suggests the pulmonary hypertension is due to elevated left atrial pressure (ie, postcapillary) rather than precapillary pulmonary arterial remodeling.
Mixed pre- and postcapillary pulmonary hypertension
Distinguishing pulmonary venous hypertension from PAH is important, since their management differs. In particular, PAH-specific therapies (ie, prostacyclin analogues, prostaglandin I2 receptor agonists, endothelin receptor antagonists, phosphodiesterase-5 inhibitors, and cyclic guanosine monophosphate stimulators) can have a detrimental effect in WHO group 2 patients by causing increased pulmonary capillary leakage with pulmonary edema.11,12
In some patients, chronic passive congestion in the pulmonary venous circulation causes additional disruption of the homeostatic milieu regulating precapillary smooth muscle and endothelial function. These changes result in structural remodeling of precapillary arterioles and increased precapillary vascular resistance, creating a “mixed” pulmonary hypertension with both pre- and postcapillary abnormalities.
There is controversy over the ideal way to identify these patients but little disagreement that they face a worse prognosis than those without precapillary remodeling.13 In light of this, efforts have been made to characterize this cohort.
Historically, mixed pre- and postcapillary pulmonary hypertension was defined as the combination of all of the following:
- Mean pulmonary arterial pressure ≥ 25 mm Hg
- Pulmonary artery occlusion pressure > 15 mm Hg
- Transpulmonary gradient (the mean pulmonary arterial pressure minus the pulmonary artery occlusion pressure) > 12 mm Hg.14
However, the utility of the transpulmonary gradient for distinguishing mixed pulmonary hypertension has been questioned because of concerns over its susceptibility to variations in stroke volume and loading conditions.15
The diastolic pulmonary gradient (the pulmonary arterial diastolic pressure minus the pulmonary artery occlusion pressure) has been proposed as an alternative to the transpulmonary gradient under the theory that it is less sensitive to fluctuation from variations in flow or loading.15
Current guidelines1 suggest that a patient who has all of the following should be considered to have mixed pulmonary hypertension:
- A mean pulmonary arterial pressure > 25 mm Hg
- A pulmonary artery occlusion pressure > 15 mm Hg
- A diastolic pulmonary gradient > 7 mm Hg or a pulmonary vascular resistance > 3 Wood units, or both.
Occult group 2 pulmonary hypertension
Currently, the diagnosis of WHO group 2 pulmonary hypertension is based on elevated resting pulmonary artery occlusion pressure. However, some patients with WHO group 2 pulmonary hypertension and transiently low preload from aggressive diuresis or fasting may have a low pulmonary artery occlusion pressure during right heart catheterization and be misdiagnosed as having WHO group 1 PAH.12,16
This concern was acknowledged in the 2015 Ambrisentan and Tadalafil in Patients With Pulmonary Arterial Hypertension (AMBITION) study after investigators changed the protocol to exclude patients who technically met the criteria for WHO group 1 PAH, but had borderline-elevated pulmonary artery occlusion pressure and additional risk factors worrisome for left heart disease and occult WHO group 2 pulmonary hypertension.17,18
Several strategies, including passive leg-raising, fluid challenge, and exercise during diagnostic right heart catheterization, have been proposed to better classify these patients.19 Unfortunately, due to a lack of standardization of normal values and methodology for executing these maneuvers, consensus is lacking over their routine use, and recommendations for their use have not been provided.1
EVALUATION OF LUNG DISEASE (WHO GROUP 3)
All patients with suspected pulmonary hypertension should also be assessed for underlying pulmonary parenchymal or physiologic disease.
WHO group 3 consists of pulmonary disorders that, over an extended time, can lead to pulmonary hypertension. The most common of these disorders include chronic obstructive pulmonary disease, interstitial lung disease, and combined pulmonary fibrosis and emphysema.1
Pulmonary hypertension in these patients is precapillary, and changes in pulmonary vascular resistance are influenced by multiple factors, the most significant of which is alveolar hypoxia. Hypoxia induces pulmonary artery vasoconstrictionn (in contrast to the reflexive hemodynamics seen in peripheral tissues, where systemic vascular tone is generally lower in states of hypoxia) as a mechanism to divert pulmonary blood flow to well-ventilated portions of the lung and maintain ventilation-perfusion matching.
Repeated chronic hypoxia also alters cellular structure and function of pulmonary vessels and leads to medial hypertrophy and increased vascular tone, thus contributing to the development of pulmonary hypertension in many of these patients.20
Obstructive sleep apnea. Up to 70% of patients with obstructive sleep apnea have pulmonary hypertension.21 Chronic repetitive hypoxia throughout the night increases the levels of reactive oxygen species and alters cellular and molecular signaling, thus inducing vascular remodeling. In addition, apneic events during sleep promote catecholamine-driven elevations in systemic blood pressure. Over time, patients are at higher risk of developing left ventricular dysfunction and concomitant postcapillary group 2 pulmonary hypertension.22 Because typical methods of obstructive sleep apnea screening (eg, the Epworth Sleep Scale) have been historically poor at discriminating PAH patients with obstructive sleep apnea from those without, patients diagnosed with PAH should be considered for formal sleep testing.23,24
Pulmonary function tests, chest imaging
Pulmonary function tests and high-resolution computed tomography are essential to any PAH evaluation and help to exclude WHO group 3 pulmonary hypertension.1
An abnormal result on CT or spirometry can help point toward parenchymal lung disease. Normal spirometry and lung volumes with an isolated reduction in the diffusing capacity of the lung for carbon monoxide (Dlco) is typical of patients with WHO group 1 PAH.

In our patient, CT of the chest did not show any evidence of parenchymal lung disease, and pulmonary function tests showed no evidence of obstruction or restriction. There was a moderate decrease in Dlco, which did not reach normal limits when adjusted for lung volumes. In this setting, further evaluation of her PAH was warranted.
EVALUATION OF THROMBOEMBOLIC DISEASE (WHO GROUP 4)
Once pulmonary hypertension due to underlying left heart disease or parenchymal lung disease has been excluded, testing for chronic thromboembolic pulmonary hypertension is necessary, even in the absence of prior known pulmonary embolism. Identifying these patients is paramount, as chronic thromboembolic pulmonary hypertension (WHO group 4) is the only type of pulmonary hypertension for which a definitive cure is available.26
Up to 9% of patients who survive acute pulmonary embolism exhibit features of chronic proximal thrombosis and remodeling of distal pulmonary arteries.27
It remains unknown exactly why some patients develop chronic thromboembolic pulmonary hypertension and others do not, but the pathophysiology involves inappropriate thrombus resolution after venous thromboembolic events. Monocyte recruitment (which plays an important role in thrombus resolution) is reduced, angiogenesis is impaired (preventing effective vascular collateralization), and abnormal fibroblast proliferation leads to distal pulmonary vascular wall thickening.28 There is some evidence of increased thrombophilic risk in this population, and approximately 10% to 20% of patients are positive for antiphospholipid antibodies or lupus anticoagulant.29,30
Patients with chronic thromboembolic pulmonary hypertension usually present with symptoms similar to those of WHO group 1 PAH. Up to one-quarter of patients have no recollection of prior pulmonary embolism.31 As the disease progresses, signs and symptoms related to elevated pulmonary vascular resistance and right ventricular dysfunction are common.32,33
Although thrombi usually resolve quickly, the diagnosis of chronic thromboembolic pulmonary hypertension should be made only after at least 3 months of appropriate anticoagulation to avoid treatment of transient hemodynamic changes often seen after an acute pulmonary embolism.1
Radiographic changes associated with chronic thromboembolic pulmonary hypertension are distinct from the intraluminal filling defects seen with acute thromboembolism, since chronic thrombi tend to become organized and eccentric. On imaging, one may see features of rapid luminal narrowing or eccentric filling defects rather than the conventional central filling defects of acute pulmonary embolism. These changes are often overlooked by radiologists who are not specifically looking for chronic thromboembolic pulmonary hypertension.34 For this reason, the sensitivity and specificity of identifying chronic thromboembolic disease using radionuclide ventilation-perfusion lung scanning is superior to that of CT angiography.
All patients with suspected PAH should undergo a ventilation-perfusion scan.1,35 In patients with ventilation-perfusion mismatch on radionuclide scanning, pulmonary angiography can fulfill multiple goals of measuring pulmonary arterial pressures, identifying the extent and location of chronic thromboemboli, and can determine whether surgical thromboendarterectomy is feasible.
If chronic thromboembolic pulmonary hypertension is identified, it is imperative that patients be referred to a center of excellence specializing in its management regardless of symptom severity, as surgery can be curative and may prevent development of progressive right ventricular dysfunction.36
Our patient’s ventilation-perfusion scan was normal, effectively ruling out the possibility of chronic thromboembolism as a cause of her pulmonary hypertension.
RIGHT HEART CATHETERIZATION
Once the above-mentioned conditions have been evaluated, patients with suspected PAH should be referred to a pulmonary hypertension center of excellence to undergo right heart catheterization. If this test reveals PAH, further vasoreactivity testing should be performed if the etiology of the PAH is considered to be idiopathic, heritable, or drug-induced.1
Vasoreactivity is most commonly tested using 20 ppm of inhaled nitric oxide, but alternative formulations including intravenous epoprostenol, intravenous adenosine, or inhaled iloprost are acceptable. Patients who have a positive vasoreactive test usually respond well to high-dose calcium channel blocker therapy and have a significantly better prognosis than other patients with PAH.37
Patients with WHO group 1 PAH who do not have idiopathic, heritable, or drug-induced PAH have not been shown to have favorable outcomes using calcium channel blockers even if they have a positive vasoreactive response. A positive vasoreactive response is defined as a drop in mean pulmonary arterial pressure of at least 10 mm Hg to an absolute level of 40 mm Hg or less. Cardiac output should be preserved or elevated compared with baseline values during the challenge.1
In reality, only 10% to 15% of patients with idiopathic PAH have a positive vasoreactive response, and half of these patients stop responding within 1 year.38 Therefore, clinicians should not assume that calcium channel blockers will be successful in the long term in a vasoreactive patient, and these patients should have follow-up right heart catheterization after 3 to 6 months and annually thereafter to ensure continued vasoreactivity.1
In patients who are no longer vasoreactive or whose functional status is worse than New York Heart Association functional class I or II, conventional PAH-specific therapy should be started.
LOOKING FOR CAUSES OF ‘IDIOPATHIC’ PAH
Pulmonary hypertension is considered the final common pathway of many varied diseases and syndromes, and therefore one cannot say it is idiopathic without making a robust effort to identify features of alternative causes and rule out other contributing factors.
Although the exact etiology of idiopathic PAH is unclear, well-characterized imbalances in vascular homeostasis have been identified. These include processes that promote vasoconstriction, cell proliferation, and thrombosis (thromboxane A2, endothelin-1, and serotonin) and those that suppress prostacyclin, nitric oxide, and vasoactive intestinal peptide-mediated vasodilation.1 Furthermore, an abnormal angiogenic response to hypoxia and vascular endothelial growth factor has been observed.39
Before considering a diagnosis of idiopathic PAH, a careful history is essential. Other causative agents include appetite-suppressing medications, such as fenfluramine derivatives or stimulants such as amphetamines. Human immunodeficiency virus (HIV) or hepatitis, a history of splenectomy, and prior thyroid or liver disease are also common causes of PAH. Joint pain, myalgias, Raynaud features, or a rash characteristic of connective tissue disease can be identified on history and physical examination. Worldwide, chronic exposure to high-altitude climates and exposure to schistosomiasis are significant causes of PAH, but are rarely seen in developed nations. Confirmatory serum tests for HIV, antinuclear antibody, scleroderma antibody, and thyroid function are essential.1
Genetic factors
If patients report having relatives with possible or probable PAH, genetic counseling is recommended, particularly for rare but causative gene mutations.
BMPR2, the gene that codes for the bone morphogenetic protein receptor type 2, can carry mutations with variable penetrance over the patient’s lifetime depending on other genetic polymorphisms, concurrent inflammation, and the patient’s sex.40
The population carrier estimates of BMPR2 mutations are only 0.001% to 0.01%, but mutations in this gene are identified in approximately 25% of nonfamilial PAH patients and in over 75% of those with a familial inheritance pattern. The BMPR2 protein is a part of the transforming growth factor beta family and is partially responsible for control of vascular cell proliferation. Mutations in this gene lead to PAH at a younger age than in those with mutation-negative idiopathic PAH and to a more severe clinical phenotype in terms of pulmonary vascular resistance and cardiac function.40
Other mutations. Although BMPR2 is the most commonly identified gene mutation in patients with PAH, other gene mutations within this family have also been recognized. These include mutations in the genes for activin receptor-like kinase 1 and endoglin, which, although better known for their association with hereditary hemorrhagic telangiectasia, can lead directly to PAH.40
More recently, a novel autosomal recessive gene mutation in eukaryotic translation initiation factor 2 alpha kinase 4 (EIF2AK4) has been identified in patients with pulmonary veno-occlusive disease41 and pulmonary capillary hemangiomatosis,42 which are specific subclasses of WHO group 1 PAH. The mechanistic parallels between EIF2AK4 and these diseases are not clear, but the prevalence of disease in those with a familial inheritance pattern and an EIF2AK4 mutation is nearly 100%.41 Thus, identification of this mutation has been accepted as a way to confirm pulmonary veno-occlusive disease and pulmonary capillary hemangiomatosis in patients suspected of PAH with features of these diseases.43,44
GROUP 5: MISCELLANEOUS FORMS OF PULMONARY HYPERTENSION
WHO group 5 pulmonary hypertension encompasses disorders whose pathophysiology does not fit neatly within the context of the other pulmonary hypertension subtypes. Nonetheless, appreciation of these disorders is important in determining the etiology and appropriate therapy for patients with pulmonary hypertension. The mechanism driving abnormal pulmonary arterial pressures in patients with group 5 pulmonary hypertension is not always clear and may involve intrinsic or extrinsic factors.1
Diseases within group 5 include those that cause extrinsic compression of the pulmonary arteries (ie, fibrosing mediastinitis) or intrinsic elevations in pulmonary vascular resistance (sarcoidosis, pulmonary Langerhans cell histiocytosis, sickle cell anemia, polycythemia vera, and malignancy).
The most common cause of pulmonary hypertension in this category is sarcoidosis. Current theories suggest that, for most patients, invasion of granulomatous inflammation within the arterial walls induces PAH via fibrotic or inflammatory vascular occlusion. Extrinsic compression due to lymphadenopathy, right or left ventricular dysfunction due to cardiac myocite infiltration, and endothelin-induced pulmonary vasoconstriction are other possible links between the PAH and sarcoidosis.45
PROGNOSTIC RISK STRATIFICATION IN THE PATIENTS WITH PAH

Cardiac magnetic resonance imaging (MRI) has gained popularity as a noninvasive and reproducible alternative to echocardiography. Image fidelity and characterization of right ventricular function and right ventricular ejection fraction are all more accurate than with echocardiography, and serial MRI has proven valuable in its ability to guide patient prognosis.46
However, MRI is more expensive than echocardiography, and some patients cannot tolerate the procedure. In addition, for those who can tolerate it, MRI is not a suitable alternative to right heart catheterization, since it cannot accurately estimate pulmonary artery occlusion pressure or pulmonary arterial pressures.1 For these reasons, cardiac MRI use varies across pulmonary hypertension centers.
A goal of treatment is to reduce a patient’s risk. While no consensus has been achieved over which PAH-specific therapy to start with, evidence is robust that using more than 1 class of agent is beneficial, capitalizing on multiple therapeutic targets.17,47
In our patient, right heart catheterization revealed PAH with a mean pulmonary arterial pressure of 44 mm Hg, pulmonary artery occlusion pressure 6 mm Hg, and a cardiac index of 2.1 L/min/m2. Ancillary testing for alternative causes of PAH was unrevealing, as was vasoreactivity testing. Our patient could walk only 314 meters on her 6-minute walk test and had an initial NT-proBNP level of 750 ng/L.
Based on these and the findings during her evaluation, she would be classified as having intermediate-risk PAH with an estimated 1-year mortality risk of 5% to 10%.1 Appropriate therapy and follow-up would be guided by this determination. Specific therapy is beyond the scope of this article but we would start her on dual oral therapy with close follow-up to reassess her 1-year mortality risk. If there were no improvement over a short period of time, we would add further therapy.
- Galiè N, Humbert M, Vachiery JL, et al. 2015 ESC/ERS guidelines for the diagnosis and treatment of pulmonary hypertension: the Joint Task Force for the Diagnosis and Treatment of Pulmonary Hypertension of the European Society of Cardiology (ESC) and the European Respiratory Society (ERS): Endorsed by: Association for European Paediatric and Congenital Cardiology (AEPC), International Society for Heart and Lung Transplantation (ISHLT). Eur Respir J 2015; 46(4):903–975. doi:10.1183/13993003.01032-2015
- Galiè N, Rubin LJ, Hoeper M, et al. Treatment of patients with mildly symptomatic pulmonary arterial hypertension with bosentan (EARLY study): a double-blind, randomized controlled trial. Lancet 2008; 371(9630):2093–2100. doi:10.1016/S0140-6736(08)60919-8
- Howard LS. Prognostic factors in pulmonary arterial hypertension: assessing the course of the disease. Eur Respir Rev 2011; 20:236–242. doi:10.1183/09059180.00006711
- Brown LM, Chen H, Halpern S, et al. Delay in recognition of pulmonary arterial hypertension: factors identified from the REVEAL registry. Chest 2011; 140:19–26. doi:10.1378/chest.10-1166
- Elliot CG, Farber H, Frost A, Liou TG, Turner M. REVEAL Registry: medical history and time to diagnosis of enrolled patients. Chest 2007; 132(4):631a. doi:10.1378/chest.132.4_MeetingAbstracts.631a
- Minai OA, Budev MM. Diagnostic strategies for suspected pulmonary arterial hypertension: a primer for the internist. Cleve Clin J Med 2007; 74(10):737–747. pmid:17941295
- Badesch DB, Raskob GE, Elliott CG, et al. Pulmonary arterial hypertension: baseline characteristics from the REVEAL registry. Chest 2010; 137(2):376–387. doi:10.1378/chest.09-1140
- Fisher MR, Forfia PR, Chamera E, et al. Accuracy of Doppler echocardiography in the hemodynamic assessment of pulmonary hypertension. Am J Respir Crit Care Med 2009; 179(7):615–621. doi:10.1164/rccm.200811-1691OC
- Robbins IM, Newman JH, Johnson RF, et al. Association of the metabolic syndrome with pulmonary venous hypertension. Chest 2009; 136(1):31–36. doi:10.1378/chest.08-2008
- Rosenkranz S, Gibbs JS, Wachter R, De Marco T, Vonk-Noordegraaf A, Vachiery JL. Left ventricular heart failure and pulmonary hypertension. Eur Heart J 2016; 37(12):942–954. doi:10.1093/eurheartj/ehv512
- Opitz CF, Hoeper MM, Gibbs JSR, et al. Pre-capillary, combined, and post-capillary pulmonary hypertension: a pathophysiological continuum. J Am Coll Cardiol 2016; 68:368–378. doi: 10.1016/j.jacc.2016.05.047
- Robbins IM, Hemnes AR, Pugh ME, et al. High prevalence of occult pulmonary venous hypertension revealed by fluid challenge in pulmonary hypertension. Circ Heart Fail 2014; 7(1):116–122. doi:10.1161/CIRCHEARTFAILURE.113.000468
- Gerges C, Gerges M, Lang MB, et al. Diastolic pulmonary vascular pressure gradient: a predictor of prognosis in “out-of-proportion” pulmonary hypertension. Chest 2013; 143(3):758–766. doi:10.1378/chest.12-1653
- Task Force for Diagnosis and Treatment of Pulmonary Hypertension of European Society of Cardiology (ESC); European Respiratory Society (ERS); International Society of Heart and Lung Transplantation (ISHLT); Galiè N, Hoeper MM, Humbert M, et al. Guidelines for the diagnosis and treatment of pulmonary hypertension. Eur Respir J 2009; 34(6):1219–1263. doi:10.1183/09031936.00139009
- Naeije R, Vachiery JL, Yerly P, Vanderpool R. The transpulmonary pressure gradient for the diagnosis of pulmonary vascular disease. Eur Respir J 2013; 41(1):217–223. doi:10.1183/09031936.00074312
- Frost AE, Badesch DB, Miller DP, Benza RL, Meltzer LA, McGoon MD. Evaluation of the predictive value of a clinical worsening definition using 2-year outcomes in patients with pulmonary arterial hypertension: a REVEAL registry analysis. Chest 2013; 144(5):1521–1529. doi:10.1378/chest.12-3023
- Galiè N, Barberà JA, Frost AE, et al; AMBITION Investigators. Initial use of ambrisentan plus tadalafil in pulmonary arterial hypertension. N Engl J Med 2015; 373(9):834–844. doi:10.1056/NEJMoa1413687
- Farr G, Shah K, Markley R, Abbate A, Salloum FN, Grinnan D. Development of pulmonary hypertension in heart failure with preserved ejection fraction. Prog Cardiovasc Dis 2016; 59(1):52–58. doi:10.1016/j.pcad.2016.06.002
- Hoeper MM, Barberà JA, Channick RN, et al. Diagnosis, assessment, and treatment of non-pulmonary arterial hypertension pulmonary hypertension. J Am Coll Cardiol 2009; 54(suppl 1):S85–S96. doi:10.1016/j.jacc.2009.04.008
- Chaouat A, Naeije R, Weitzenblum E. Pulmonary hypertension in COPD. Eur Respir J 2008; 32(5):1371–1385. doi:10.1183/09031936.00015608
- Minai OA, Ricaurte B, Kaw R, et al. Frequency and impact of pulmonary hypertension in patients with obstructive sleep apnea syndrome. Am J Cardiol 2009; 104(9):1300–1306. doi:10.1016/j.amjcard.2009.06.048
- Kholdani C, Fares WH, Mohsenin V. Pulmonary hypertension in obstructive sleep apnea: is it clinically significant? A critical analysis of the association and pathophysiology. Pulm Circ 2015; 5(2):220–227. doi:10.1086/679995
- Prisco DL, Sica AL, Talwar A, et al. Correlation of pulmonary hypertension severity with metrics of comorbid sleep-disordered breathing. Sleep Breath 2011; 15(4):633–639. doi:10.1007/s11325-010-0411-y
- Dumitrascu R, Tiede H, Eckermann J, et al. Sleep apnea in precapillary pulmonary hypertension. Sleep Med 2013; 14(3):247–251. doi:10.1016/j.sleep.2012.11.013
- Arcasoy SM, Christie JD, Ferrari VA, et al. Echocardiographic assessment of pulmonary hypertension in patients with advanced lung disease. Am J Respir Crit Care Med 2003; 167(5):735–740. doi:10.1164/rccm.200210-1130OC
- Pepke-Zaba J, Jansa P, Kim NH, Naeije R, Simonneau G. Chronic thromboembolic pulmonary hypertension: role of medical therapy. Eur Respir J 2013; 41(4):985–990. doi:10.1183/09031936.00201612
- Guérin L, Couturaud F, Parent F, et al. Prevalence of chronic thromboembolic pulmonary hypertension after acute pulmonary embolism. Prevalence of CTEPH after pulmonary embolism. Thromb Haemost 2014; 112(3):598–605. doi:10.1160/TH13-07-0538
- Lang IM, Pesavento R, Bonderman D, Yuan JX. Risk factors and basic mechanisms of chronic thromboembolic pulmonary hypertension: a current understanding. Eur Respir J 2013; 41(2):462–468. doi:10.1183/09031936.00049312
- Pepke-Zaba J. Diagnostic testing to guide the management of chronic thromboembolic pulmonary hypertension: state of the art. Eur Respir Rev 2010; 19(115):55–58. doi:10.1183/09059180.00007209
- Bonderman D, Turecek PL, Jakowitsch J, et al. High prevalence of elevated clotting factor VIII in chronic thromboembolic pulmonary hypertension. Thromb Haemost 2003; 90(3):372–376. doi:10.1160/TH03-02-0067
- Pepke-Zaba J, Delcroix M, Lang I, et al. Chronic thromboembolic pulmonary hypertension (CTEPH): results from an international prospective registry. Circulation 2011; 124(18):1973–1981. doi:10.1161/CIRCULATIONAHA.110.015008
- Kim NH, Delcroix M, Jenkins DP, et al. Chronic thromboembolic pulmonary hypertension. J Am Coll Cardiol 2013; 62:(suppl 25):D92–D99. doi:10.1016/j.jacc.2013.10.024
- Moser KM, Auger WR, Fedullo PF. Chronic major-vessel thromboembolic pulmonary hypertension. Circulation 1990; 81(6):1735–1743. pmid:2188751
- McNeil K, Dunning J. Chronic thromboembolic pulmonary hypertension (CTEPH). Heart 2007; 93(9):1152–1158. doi:10.1136/hrt.2004.053603
- Tunariu N, Gibbs SJ, Win Z, et al. Ventilation-perfusion scintigraphy is more sensitive than multidetector CTPA in detecting chronic thromboembolic pulmonary disease as a treatable cause of pulmonary hypertension. J Nucl Med 2007; 48(5):680–684. doi:10.2967/jnumed.106.039438
- Fedullo P, Kerr KM, Kim NH, Auger WR. Chronic thromboembolic pulmonary hypertension. Am J Respir Crit Care Med 2011; 183(12):1605–1613. doi:10.1164/rccm.201011-1854CI
- Rich S, Kaufmann E, Levy PS. The effect of high doses of calcium-channel blockers on survival in primary pulmonary hypertension. N Engl J Med 1992; 327(2):76–81. doi:10.1056/NEJM199207093270203
- Sitbon O, Humbert M, Jaıs X, et al. Long-term response to calcium channel blockers in idiopathic pulmonary arterial hypertension. Circulation 2005; 111(23):3105–3111. doi:10.1161/CIRCULATIONAHA.104.488486
- Chin KM, Rubin LJ. Pulmonary arterial hypertension. J Am Coll Cardiol 2008; 51(16):1527–1538. doi:10.1016/j.jacc.2008.01.024
- Soubrier F, Chung WK, Machado R, et al. Genetics and genomics of pulmonary arterial hypertension. J Am Coll Cardiol 2013; 62(suppl 25):D13–D21. doi:10.1016/j.jacc.2013.10.035
- Eyries M, Montani D, Girerd B, et al. EIF2AK4 mutations cause pulmonary veno-occlusive disease, a recessive form of pulmonary hypertension. Nat Genet 2014; 46(1):65–69. doi: 10.1038/ng.2844
- Best DH, Sumner KL, Austin ED, et al. EIF2AK4 mutations in pulmonary capillary hemangiomatosis. Chest 2014; 145(2):231–236. doi:10.1378/chest.13-2366
- Best DH, Sumner KL, Smith BP, et al. EIF2AK4 mutations in patients diagnosed with pulmonary arterial hypertension. Chest 2017; 151(4):821–828. doi:10.1016/j.chest.2016.11.014
- Hadinnapola C, Bleda M, Haimel M, et al; NIHR BioResource–Rare Diseases Consortium; UK National Cohort Study of Idiopathic and Heritable PAH. Phenotypic characterization of EIF2AK4 mutation carriers in a large cohort of patients diagnosed clinically with pulmonary arterial hypertension. Circulation 2017; 136(21):2022–2033. doi:10.1161/CIRCULATIONAHA.117.028351
- Diaz-Guzman E, Farver C, Parambil J, Culver DA. Pulmonary hypertension caused by sarcoidosis. Clin Chest Med 2008; 29(3):549–563. doi:10.1016/j.ccm.2008.03.010
- Mauritz GJ, Kind T, Marcus JT, et al. Progressive changes in right ventricular geometric shortening and long-term survival in pulmonary arterial hypertension. Chest 2012; 141(4):935–943. doi:10.1378/chest.10-3277
- Galiè N, Palazzini M, Manes A. Pulmonary arterial hypertension: from the kingdom of the near-dead to multiple clinical trial meta-analyses. Eur Heart J 2010; 31(17):2080–2086. doi:10.1093/eurheartj/ehq152
Pulmonary arterial hypertension (PAH) is a hemodynamic disorder that affects small and medium-size pulmonary arteries through cellular proliferation and luminal narrowing.1 Increased pulmonary vascular resistance causes restricted blood flow in these arteries, leading to elevated pulmonary arterial pressure and afterload on the right ventricle. Despite advances in therapy, death usually occurs as a result of right ventricular failure.
- Group 1—PAH, due to narrowed pulmonary arteries
- Group 2—due to left heart disease
- Group 3—due to lung disease or hypoxia, or both
- Group 4—due to chronic thromboembolism or other pulmonary artery obstruction
- Group 5—due to uncertain or multifactorial causes.
Experts recognize the morbidity and mortality associated with pulmonary hypertension now more than in the past, and they emphasize recognizing it early. Guidelines for its diagnosis and treatment were updated in 2015.1
Below, we use a case to discuss recommendations for initial evaluation and classification of pulmonary hypertension, particularly PAH.
A PATIENT SUSPECTED OF HAVING PULMONARY HYPERTENSION
A 63-year-old woman with a 25-pack-year history of tobacco use, as well as pulmonary embolism and coronary artery disease, presents to her primary care physician with exertional dyspnea. She had been a clerk at a hardware store and physically active until she took early retirement 8 months ago because of increasing fatigue. She initially felt the fatigue was simply “a sign of getting old.”
Since retiring, she has noticed the slow onset of progressive dyspnea on exertion. She can no longer climb more than 1 flight of stairs or walk more than 1 block. She also complains of mild, fluctuating edema in her lower extremities over the past month. She quit smoking 8 years ago after undergoing placement of a drug-eluting stent in the mid-left circumflex artery. After this, she received clopidogrel and was followed by a cardiologist for 2 years but stopped taking the medication because of bruising. She has not seen her cardiologist in more than 5 years.
She underwent elective right total knee arthroplasty 3 years ago, complicated by acute deep vein thrombosis in the right common femoral vein. Computed tomography (CT) at that time did not reveal pulmonary emboli. She received warfarin therapy for 3 months.
She reports no current cough, chest pain, lightheadedness, or syncope. She has no orthopnea, and she feels normal at rest.
Her family history is unremarkable, and she has had no exposure to illicit substances, environmental toxins, or dietary supplements. She takes aspirin 81 mg daily, metoprolol 25 mg twice daily, lisinopril 10 mg daily, and simvastatin 40 mg at bedtime.
Her primary care physician detects a murmur in the left lower sternal border and sends her for transthoracic echocardiography, which demonstrates mild right ventricular dilation, right atrial dilation, and mildly reduced right ventricular function. The calculated right ventricular systolic pressure is 69 mm Hg. The left ventricle shows mild concentric hypertrophy; the left atrium is normal in size.
DIAGNOSTIC EVALUATION OF SUSPECTED PULMONARY HYPERTENSION
CLINICAL MANIFESTATIONS
Symptoms and signs. As in the patient described above, the first symptoms such as exertional dyspnea, fatigue, and lightheadedness usually arise in situations that call for increased cardiac output.4 As right ventricular function worsens, symptoms start to occur at rest, and signs of increased right ventricular preload appear, such as abdominal and lower-extremity edema and pericardial effusion. Syncope is a sign of severe right ventricular dysfunction.5
Physical examination. Look for signs of increased right ventricular loading and failure, eg:
- An accentuated intensity and persistent splitting of the second heart sound
- A prominent parasternal heave
- A prominent jugular “a” wave
- A systolic murmur along the left sternal border at the fourth intercostal space, which may worsen with breath-holding
- Pitting lower-extremity edema
- Hepatomegaly
- Hepatojugular reflux
- Hepatic pulsatility.6
ECHOCARDIOGRAPHY IN SUSPECTED PULMONARY HYPERTENSION
Many practitioners rely heavily on the estimated right ventricular systolic pressure in diagnosing pulmonary hypertension. In theory, this number should be nearly the same as the pulmonary arterial systolic pressure. However, technical and patient-related aspects of transthoracic echocardiography often limit accurate measurement of the right ventricular systolic pressure, and readings often differ from those measured with right heart catheterization.8
Our patient had a markedly elevated right ventricular systolic pressure and signs of right ventricular dysfunction, suggesting a high probability of pulmonary hypertension.
EVALUATING LEFT HEART DISEASE (WHO GROUP 2)
More than 75% of cases of pulmonary hypertension are directly related to left ventricular dysfunction or mitral or aortic valve disease (WHO group 2).1 Since group 2 differs markedly from group 1 (PAH) in its pathophysiology and treatment, it is important to distinguish between them.
Compared with WHO group 1 patients, those in group 2 tend to be older, more of them are male, and more of them have comorbidities such as metabolic syndrome, hypertension, and coronary artery disease.1,9 A combination of risk factors and clinical findings should be considered in identifying these patients.10
Transthoracic echocardiography is used to detect features of systolic and diastolic dysfunction. Left atrial enlargement is a clue that left heart disease may be present. In addition, signs of left ventricular or valvular dysfunction on electrocardiography or chest radiography are often helpful.
When estimated right ventricular systolic pressures are only minimally abnormal and no significant right ventricular dysfunction exists, further diagnostic evaluation is not warranted. However, because no single identifying feature or variable can readily distinguish group 2 from the other WHO groups, further evaluation should be considered if the right ventricular systolic pressure is significantly elevated or right ventricular dysfunction exists.
Our patient had several risk factors for left heart disease, including a history of smoking and coronary artery disease. Nonetheless, findings consistent with severe right ventricular dysfunction necessitated further evaluation for other possible causes of her suspected pulmonary hypertension.
Postcapillary pulmonary hypertension
In patients for whom further evaluation is pursued, the diagnosis of WHO group 2 pulmonary hypertension is ultimately based on findings consistent with postcapillary or “passive” pulmonary hypertension on right heart catheterization. Although mean pulmonary arterial pressures must be at least 25 mm Hg to certify the diagnosis of pulmonary hypertension, a pulmonary artery occlusion pressure greater than 15 mm Hg (normal 6–12) and pulmonary vascular resistance of 3 Wood units or less (normal 0.3–1.6) suggests the pulmonary hypertension is due to elevated left atrial pressure (ie, postcapillary) rather than precapillary pulmonary arterial remodeling.
Mixed pre- and postcapillary pulmonary hypertension
Distinguishing pulmonary venous hypertension from PAH is important, since their management differs. In particular, PAH-specific therapies (ie, prostacyclin analogues, prostaglandin I2 receptor agonists, endothelin receptor antagonists, phosphodiesterase-5 inhibitors, and cyclic guanosine monophosphate stimulators) can have a detrimental effect in WHO group 2 patients by causing increased pulmonary capillary leakage with pulmonary edema.11,12
In some patients, chronic passive congestion in the pulmonary venous circulation causes additional disruption of the homeostatic milieu regulating precapillary smooth muscle and endothelial function. These changes result in structural remodeling of precapillary arterioles and increased precapillary vascular resistance, creating a “mixed” pulmonary hypertension with both pre- and postcapillary abnormalities.
There is controversy over the ideal way to identify these patients but little disagreement that they face a worse prognosis than those without precapillary remodeling.13 In light of this, efforts have been made to characterize this cohort.
Historically, mixed pre- and postcapillary pulmonary hypertension was defined as the combination of all of the following:
- Mean pulmonary arterial pressure ≥ 25 mm Hg
- Pulmonary artery occlusion pressure > 15 mm Hg
- Transpulmonary gradient (the mean pulmonary arterial pressure minus the pulmonary artery occlusion pressure) > 12 mm Hg.14
However, the utility of the transpulmonary gradient for distinguishing mixed pulmonary hypertension has been questioned because of concerns over its susceptibility to variations in stroke volume and loading conditions.15
The diastolic pulmonary gradient (the pulmonary arterial diastolic pressure minus the pulmonary artery occlusion pressure) has been proposed as an alternative to the transpulmonary gradient under the theory that it is less sensitive to fluctuation from variations in flow or loading.15
Current guidelines1 suggest that a patient who has all of the following should be considered to have mixed pulmonary hypertension:
- A mean pulmonary arterial pressure > 25 mm Hg
- A pulmonary artery occlusion pressure > 15 mm Hg
- A diastolic pulmonary gradient > 7 mm Hg or a pulmonary vascular resistance > 3 Wood units, or both.
Occult group 2 pulmonary hypertension
Currently, the diagnosis of WHO group 2 pulmonary hypertension is based on elevated resting pulmonary artery occlusion pressure. However, some patients with WHO group 2 pulmonary hypertension and transiently low preload from aggressive diuresis or fasting may have a low pulmonary artery occlusion pressure during right heart catheterization and be misdiagnosed as having WHO group 1 PAH.12,16
This concern was acknowledged in the 2015 Ambrisentan and Tadalafil in Patients With Pulmonary Arterial Hypertension (AMBITION) study after investigators changed the protocol to exclude patients who technically met the criteria for WHO group 1 PAH, but had borderline-elevated pulmonary artery occlusion pressure and additional risk factors worrisome for left heart disease and occult WHO group 2 pulmonary hypertension.17,18
Several strategies, including passive leg-raising, fluid challenge, and exercise during diagnostic right heart catheterization, have been proposed to better classify these patients.19 Unfortunately, due to a lack of standardization of normal values and methodology for executing these maneuvers, consensus is lacking over their routine use, and recommendations for their use have not been provided.1
EVALUATION OF LUNG DISEASE (WHO GROUP 3)
All patients with suspected pulmonary hypertension should also be assessed for underlying pulmonary parenchymal or physiologic disease.
WHO group 3 consists of pulmonary disorders that, over an extended time, can lead to pulmonary hypertension. The most common of these disorders include chronic obstructive pulmonary disease, interstitial lung disease, and combined pulmonary fibrosis and emphysema.1
Pulmonary hypertension in these patients is precapillary, and changes in pulmonary vascular resistance are influenced by multiple factors, the most significant of which is alveolar hypoxia. Hypoxia induces pulmonary artery vasoconstrictionn (in contrast to the reflexive hemodynamics seen in peripheral tissues, where systemic vascular tone is generally lower in states of hypoxia) as a mechanism to divert pulmonary blood flow to well-ventilated portions of the lung and maintain ventilation-perfusion matching.
Repeated chronic hypoxia also alters cellular structure and function of pulmonary vessels and leads to medial hypertrophy and increased vascular tone, thus contributing to the development of pulmonary hypertension in many of these patients.20
Obstructive sleep apnea. Up to 70% of patients with obstructive sleep apnea have pulmonary hypertension.21 Chronic repetitive hypoxia throughout the night increases the levels of reactive oxygen species and alters cellular and molecular signaling, thus inducing vascular remodeling. In addition, apneic events during sleep promote catecholamine-driven elevations in systemic blood pressure. Over time, patients are at higher risk of developing left ventricular dysfunction and concomitant postcapillary group 2 pulmonary hypertension.22 Because typical methods of obstructive sleep apnea screening (eg, the Epworth Sleep Scale) have been historically poor at discriminating PAH patients with obstructive sleep apnea from those without, patients diagnosed with PAH should be considered for formal sleep testing.23,24
Pulmonary function tests, chest imaging
Pulmonary function tests and high-resolution computed tomography are essential to any PAH evaluation and help to exclude WHO group 3 pulmonary hypertension.1
An abnormal result on CT or spirometry can help point toward parenchymal lung disease. Normal spirometry and lung volumes with an isolated reduction in the diffusing capacity of the lung for carbon monoxide (Dlco) is typical of patients with WHO group 1 PAH.
In our patient, CT of the chest did not show any evidence of parenchymal lung disease, and pulmonary function tests showed no evidence of obstruction or restriction. There was a moderate decrease in Dlco, which did not reach normal limits when adjusted for lung volumes. In this setting, further evaluation of her PAH was warranted.
EVALUATION OF THROMBOEMBOLIC DISEASE (WHO GROUP 4)
Once pulmonary hypertension due to underlying left heart disease or parenchymal lung disease has been excluded, testing for chronic thromboembolic pulmonary hypertension is necessary, even in the absence of prior known pulmonary embolism. Identifying these patients is paramount, as chronic thromboembolic pulmonary hypertension (WHO group 4) is the only type of pulmonary hypertension for which a definitive cure is available.26
Up to 9% of patients who survive acute pulmonary embolism exhibit features of chronic proximal thrombosis and remodeling of distal pulmonary arteries.27
It remains unknown exactly why some patients develop chronic thromboembolic pulmonary hypertension and others do not, but the pathophysiology involves inappropriate thrombus resolution after venous thromboembolic events. Monocyte recruitment (which plays an important role in thrombus resolution) is reduced, angiogenesis is impaired (preventing effective vascular collateralization), and abnormal fibroblast proliferation leads to distal pulmonary vascular wall thickening.28 There is some evidence of increased thrombophilic risk in this population, and approximately 10% to 20% of patients are positive for antiphospholipid antibodies or lupus anticoagulant.29,30
Patients with chronic thromboembolic pulmonary hypertension usually present with symptoms similar to those of WHO group 1 PAH. Up to one-quarter of patients have no recollection of prior pulmonary embolism.31 As the disease progresses, signs and symptoms related to elevated pulmonary vascular resistance and right ventricular dysfunction are common.32,33
Although thrombi usually resolve quickly, the diagnosis of chronic thromboembolic pulmonary hypertension should be made only after at least 3 months of appropriate anticoagulation to avoid treatment of transient hemodynamic changes often seen after an acute pulmonary embolism.1
Radiographic changes associated with chronic thromboembolic pulmonary hypertension are distinct from the intraluminal filling defects seen with acute thromboembolism, since chronic thrombi tend to become organized and eccentric. On imaging, one may see features of rapid luminal narrowing or eccentric filling defects rather than the conventional central filling defects of acute pulmonary embolism. These changes are often overlooked by radiologists who are not specifically looking for chronic thromboembolic pulmonary hypertension.34 For this reason, the sensitivity and specificity of identifying chronic thromboembolic disease using radionuclide ventilation-perfusion lung scanning is superior to that of CT angiography.
All patients with suspected PAH should undergo a ventilation-perfusion scan.1,35 In patients with ventilation-perfusion mismatch on radionuclide scanning, pulmonary angiography can fulfill multiple goals of measuring pulmonary arterial pressures, identifying the extent and location of chronic thromboemboli, and can determine whether surgical thromboendarterectomy is feasible.
If chronic thromboembolic pulmonary hypertension is identified, it is imperative that patients be referred to a center of excellence specializing in its management regardless of symptom severity, as surgery can be curative and may prevent development of progressive right ventricular dysfunction.36
Our patient’s ventilation-perfusion scan was normal, effectively ruling out the possibility of chronic thromboembolism as a cause of her pulmonary hypertension.
RIGHT HEART CATHETERIZATION
Once the above-mentioned conditions have been evaluated, patients with suspected PAH should be referred to a pulmonary hypertension center of excellence to undergo right heart catheterization. If this test reveals PAH, further vasoreactivity testing should be performed if the etiology of the PAH is considered to be idiopathic, heritable, or drug-induced.1
Vasoreactivity is most commonly tested using 20 ppm of inhaled nitric oxide, but alternative formulations including intravenous epoprostenol, intravenous adenosine, or inhaled iloprost are acceptable. Patients who have a positive vasoreactive test usually respond well to high-dose calcium channel blocker therapy and have a significantly better prognosis than other patients with PAH.37
Patients with WHO group 1 PAH who do not have idiopathic, heritable, or drug-induced PAH have not been shown to have favorable outcomes using calcium channel blockers even if they have a positive vasoreactive response. A positive vasoreactive response is defined as a drop in mean pulmonary arterial pressure of at least 10 mm Hg to an absolute level of 40 mm Hg or less. Cardiac output should be preserved or elevated compared with baseline values during the challenge.1
In reality, only 10% to 15% of patients with idiopathic PAH have a positive vasoreactive response, and half of these patients stop responding within 1 year.38 Therefore, clinicians should not assume that calcium channel blockers will be successful in the long term in a vasoreactive patient, and these patients should have follow-up right heart catheterization after 3 to 6 months and annually thereafter to ensure continued vasoreactivity.1
In patients who are no longer vasoreactive or whose functional status is worse than New York Heart Association functional class I or II, conventional PAH-specific therapy should be started.
LOOKING FOR CAUSES OF ‘IDIOPATHIC’ PAH
Pulmonary hypertension is considered the final common pathway of many varied diseases and syndromes, and therefore one cannot say it is idiopathic without making a robust effort to identify features of alternative causes and rule out other contributing factors.
Although the exact etiology of idiopathic PAH is unclear, well-characterized imbalances in vascular homeostasis have been identified. These include processes that promote vasoconstriction, cell proliferation, and thrombosis (thromboxane A2, endothelin-1, and serotonin) and those that suppress prostacyclin, nitric oxide, and vasoactive intestinal peptide-mediated vasodilation.1 Furthermore, an abnormal angiogenic response to hypoxia and vascular endothelial growth factor has been observed.39
Before considering a diagnosis of idiopathic PAH, a careful history is essential. Other causative agents include appetite-suppressing medications, such as fenfluramine derivatives or stimulants such as amphetamines. Human immunodeficiency virus (HIV) or hepatitis, a history of splenectomy, and prior thyroid or liver disease are also common causes of PAH. Joint pain, myalgias, Raynaud features, or a rash characteristic of connective tissue disease can be identified on history and physical examination. Worldwide, chronic exposure to high-altitude climates and exposure to schistosomiasis are significant causes of PAH, but are rarely seen in developed nations. Confirmatory serum tests for HIV, antinuclear antibody, scleroderma antibody, and thyroid function are essential.1
Genetic factors
If patients report having relatives with possible or probable PAH, genetic counseling is recommended, particularly for rare but causative gene mutations.
BMPR2, the gene that codes for the bone morphogenetic protein receptor type 2, can carry mutations with variable penetrance over the patient’s lifetime depending on other genetic polymorphisms, concurrent inflammation, and the patient’s sex.40
The population carrier estimates of BMPR2 mutations are only 0.001% to 0.01%, but mutations in this gene are identified in approximately 25% of nonfamilial PAH patients and in over 75% of those with a familial inheritance pattern. The BMPR2 protein is a part of the transforming growth factor beta family and is partially responsible for control of vascular cell proliferation. Mutations in this gene lead to PAH at a younger age than in those with mutation-negative idiopathic PAH and to a more severe clinical phenotype in terms of pulmonary vascular resistance and cardiac function.40
Other mutations. Although BMPR2 is the most commonly identified gene mutation in patients with PAH, other gene mutations within this family have also been recognized. These include mutations in the genes for activin receptor-like kinase 1 and endoglin, which, although better known for their association with hereditary hemorrhagic telangiectasia, can lead directly to PAH.40
More recently, a novel autosomal recessive gene mutation in eukaryotic translation initiation factor 2 alpha kinase 4 (EIF2AK4) has been identified in patients with pulmonary veno-occlusive disease41 and pulmonary capillary hemangiomatosis,42 which are specific subclasses of WHO group 1 PAH. The mechanistic parallels between EIF2AK4 and these diseases are not clear, but the prevalence of disease in those with a familial inheritance pattern and an EIF2AK4 mutation is nearly 100%.41 Thus, identification of this mutation has been accepted as a way to confirm pulmonary veno-occlusive disease and pulmonary capillary hemangiomatosis in patients suspected of PAH with features of these diseases.43,44
GROUP 5: MISCELLANEOUS FORMS OF PULMONARY HYPERTENSION
WHO group 5 pulmonary hypertension encompasses disorders whose pathophysiology does not fit neatly within the context of the other pulmonary hypertension subtypes. Nonetheless, appreciation of these disorders is important in determining the etiology and appropriate therapy for patients with pulmonary hypertension. The mechanism driving abnormal pulmonary arterial pressures in patients with group 5 pulmonary hypertension is not always clear and may involve intrinsic or extrinsic factors.1
Diseases within group 5 include those that cause extrinsic compression of the pulmonary arteries (ie, fibrosing mediastinitis) or intrinsic elevations in pulmonary vascular resistance (sarcoidosis, pulmonary Langerhans cell histiocytosis, sickle cell anemia, polycythemia vera, and malignancy).
The most common cause of pulmonary hypertension in this category is sarcoidosis. Current theories suggest that, for most patients, invasion of granulomatous inflammation within the arterial walls induces PAH via fibrotic or inflammatory vascular occlusion. Extrinsic compression due to lymphadenopathy, right or left ventricular dysfunction due to cardiac myocite infiltration, and endothelin-induced pulmonary vasoconstriction are other possible links between the PAH and sarcoidosis.45
PROGNOSTIC RISK STRATIFICATION IN THE PATIENTS WITH PAH
Cardiac magnetic resonance imaging (MRI) has gained popularity as a noninvasive and reproducible alternative to echocardiography. Image fidelity and characterization of right ventricular function and right ventricular ejection fraction are all more accurate than with echocardiography, and serial MRI has proven valuable in its ability to guide patient prognosis.46
However, MRI is more expensive than echocardiography, and some patients cannot tolerate the procedure. In addition, for those who can tolerate it, MRI is not a suitable alternative to right heart catheterization, since it cannot accurately estimate pulmonary artery occlusion pressure or pulmonary arterial pressures.1 For these reasons, cardiac MRI use varies across pulmonary hypertension centers.
A goal of treatment is to reduce a patient’s risk. While no consensus has been achieved over which PAH-specific therapy to start with, evidence is robust that using more than 1 class of agent is beneficial, capitalizing on multiple therapeutic targets.17,47
In our patient, right heart catheterization revealed PAH with a mean pulmonary arterial pressure of 44 mm Hg, pulmonary artery occlusion pressure 6 mm Hg, and a cardiac index of 2.1 L/min/m2. Ancillary testing for alternative causes of PAH was unrevealing, as was vasoreactivity testing. Our patient could walk only 314 meters on her 6-minute walk test and had an initial NT-proBNP level of 750 ng/L.
Based on these and the findings during her evaluation, she would be classified as having intermediate-risk PAH with an estimated 1-year mortality risk of 5% to 10%.1 Appropriate therapy and follow-up would be guided by this determination. Specific therapy is beyond the scope of this article but we would start her on dual oral therapy with close follow-up to reassess her 1-year mortality risk. If there were no improvement over a short period of time, we would add further therapy.
- Galiè N, Humbert M, Vachiery JL, et al. 2015 ESC/ERS guidelines for the diagnosis and treatment of pulmonary hypertension: the Joint Task Force for the Diagnosis and Treatment of Pulmonary Hypertension of the European Society of Cardiology (ESC) and the European Respiratory Society (ERS): Endorsed by: Association for European Paediatric and Congenital Cardiology (AEPC), International Society for Heart and Lung Transplantation (ISHLT). Eur Respir J 2015; 46(4):903–975. doi:10.1183/13993003.01032-2015
- Galiè N, Rubin LJ, Hoeper M, et al. Treatment of patients with mildly symptomatic pulmonary arterial hypertension with bosentan (EARLY study): a double-blind, randomized controlled trial. Lancet 2008; 371(9630):2093–2100. doi:10.1016/S0140-6736(08)60919-8
- Howard LS. Prognostic factors in pulmonary arterial hypertension: assessing the course of the disease. Eur Respir Rev 2011; 20:236–242. doi:10.1183/09059180.00006711
- Brown LM, Chen H, Halpern S, et al. Delay in recognition of pulmonary arterial hypertension: factors identified from the REVEAL registry. Chest 2011; 140:19–26. doi:10.1378/chest.10-1166
- Elliot CG, Farber H, Frost A, Liou TG, Turner M. REVEAL Registry: medical history and time to diagnosis of enrolled patients. Chest 2007; 132(4):631a. doi:10.1378/chest.132.4_MeetingAbstracts.631a
- Minai OA, Budev MM. Diagnostic strategies for suspected pulmonary arterial hypertension: a primer for the internist. Cleve Clin J Med 2007; 74(10):737–747. pmid:17941295
- Badesch DB, Raskob GE, Elliott CG, et al. Pulmonary arterial hypertension: baseline characteristics from the REVEAL registry. Chest 2010; 137(2):376–387. doi:10.1378/chest.09-1140
- Fisher MR, Forfia PR, Chamera E, et al. Accuracy of Doppler echocardiography in the hemodynamic assessment of pulmonary hypertension. Am J Respir Crit Care Med 2009; 179(7):615–621. doi:10.1164/rccm.200811-1691OC
- Robbins IM, Newman JH, Johnson RF, et al. Association of the metabolic syndrome with pulmonary venous hypertension. Chest 2009; 136(1):31–36. doi:10.1378/chest.08-2008
- Rosenkranz S, Gibbs JS, Wachter R, De Marco T, Vonk-Noordegraaf A, Vachiery JL. Left ventricular heart failure and pulmonary hypertension. Eur Heart J 2016; 37(12):942–954. doi:10.1093/eurheartj/ehv512
- Opitz CF, Hoeper MM, Gibbs JSR, et al. Pre-capillary, combined, and post-capillary pulmonary hypertension: a pathophysiological continuum. J Am Coll Cardiol 2016; 68:368–378. doi: 10.1016/j.jacc.2016.05.047
- Robbins IM, Hemnes AR, Pugh ME, et al. High prevalence of occult pulmonary venous hypertension revealed by fluid challenge in pulmonary hypertension. Circ Heart Fail 2014; 7(1):116–122. doi:10.1161/CIRCHEARTFAILURE.113.000468
- Gerges C, Gerges M, Lang MB, et al. Diastolic pulmonary vascular pressure gradient: a predictor of prognosis in “out-of-proportion” pulmonary hypertension. Chest 2013; 143(3):758–766. doi:10.1378/chest.12-1653
- Task Force for Diagnosis and Treatment of Pulmonary Hypertension of European Society of Cardiology (ESC); European Respiratory Society (ERS); International Society of Heart and Lung Transplantation (ISHLT); Galiè N, Hoeper MM, Humbert M, et al. Guidelines for the diagnosis and treatment of pulmonary hypertension. Eur Respir J 2009; 34(6):1219–1263. doi:10.1183/09031936.00139009
- Naeije R, Vachiery JL, Yerly P, Vanderpool R. The transpulmonary pressure gradient for the diagnosis of pulmonary vascular disease. Eur Respir J 2013; 41(1):217–223. doi:10.1183/09031936.00074312
- Frost AE, Badesch DB, Miller DP, Benza RL, Meltzer LA, McGoon MD. Evaluation of the predictive value of a clinical worsening definition using 2-year outcomes in patients with pulmonary arterial hypertension: a REVEAL registry analysis. Chest 2013; 144(5):1521–1529. doi:10.1378/chest.12-3023
- Galiè N, Barberà JA, Frost AE, et al; AMBITION Investigators. Initial use of ambrisentan plus tadalafil in pulmonary arterial hypertension. N Engl J Med 2015; 373(9):834–844. doi:10.1056/NEJMoa1413687
- Farr G, Shah K, Markley R, Abbate A, Salloum FN, Grinnan D. Development of pulmonary hypertension in heart failure with preserved ejection fraction. Prog Cardiovasc Dis 2016; 59(1):52–58. doi:10.1016/j.pcad.2016.06.002
- Hoeper MM, Barberà JA, Channick RN, et al. Diagnosis, assessment, and treatment of non-pulmonary arterial hypertension pulmonary hypertension. J Am Coll Cardiol 2009; 54(suppl 1):S85–S96. doi:10.1016/j.jacc.2009.04.008
- Chaouat A, Naeije R, Weitzenblum E. Pulmonary hypertension in COPD. Eur Respir J 2008; 32(5):1371–1385. doi:10.1183/09031936.00015608
- Minai OA, Ricaurte B, Kaw R, et al. Frequency and impact of pulmonary hypertension in patients with obstructive sleep apnea syndrome. Am J Cardiol 2009; 104(9):1300–1306. doi:10.1016/j.amjcard.2009.06.048
- Kholdani C, Fares WH, Mohsenin V. Pulmonary hypertension in obstructive sleep apnea: is it clinically significant? A critical analysis of the association and pathophysiology. Pulm Circ 2015; 5(2):220–227. doi:10.1086/679995
- Prisco DL, Sica AL, Talwar A, et al. Correlation of pulmonary hypertension severity with metrics of comorbid sleep-disordered breathing. Sleep Breath 2011; 15(4):633–639. doi:10.1007/s11325-010-0411-y
- Dumitrascu R, Tiede H, Eckermann J, et al. Sleep apnea in precapillary pulmonary hypertension. Sleep Med 2013; 14(3):247–251. doi:10.1016/j.sleep.2012.11.013
- Arcasoy SM, Christie JD, Ferrari VA, et al. Echocardiographic assessment of pulmonary hypertension in patients with advanced lung disease. Am J Respir Crit Care Med 2003; 167(5):735–740. doi:10.1164/rccm.200210-1130OC
- Pepke-Zaba J, Jansa P, Kim NH, Naeije R, Simonneau G. Chronic thromboembolic pulmonary hypertension: role of medical therapy. Eur Respir J 2013; 41(4):985–990. doi:10.1183/09031936.00201612
- Guérin L, Couturaud F, Parent F, et al. Prevalence of chronic thromboembolic pulmonary hypertension after acute pulmonary embolism. Prevalence of CTEPH after pulmonary embolism. Thromb Haemost 2014; 112(3):598–605. doi:10.1160/TH13-07-0538
- Lang IM, Pesavento R, Bonderman D, Yuan JX. Risk factors and basic mechanisms of chronic thromboembolic pulmonary hypertension: a current understanding. Eur Respir J 2013; 41(2):462–468. doi:10.1183/09031936.00049312
- Pepke-Zaba J. Diagnostic testing to guide the management of chronic thromboembolic pulmonary hypertension: state of the art. Eur Respir Rev 2010; 19(115):55–58. doi:10.1183/09059180.00007209
- Bonderman D, Turecek PL, Jakowitsch J, et al. High prevalence of elevated clotting factor VIII in chronic thromboembolic pulmonary hypertension. Thromb Haemost 2003; 90(3):372–376. doi:10.1160/TH03-02-0067
- Pepke-Zaba J, Delcroix M, Lang I, et al. Chronic thromboembolic pulmonary hypertension (CTEPH): results from an international prospective registry. Circulation 2011; 124(18):1973–1981. doi:10.1161/CIRCULATIONAHA.110.015008
- Kim NH, Delcroix M, Jenkins DP, et al. Chronic thromboembolic pulmonary hypertension. J Am Coll Cardiol 2013; 62:(suppl 25):D92–D99. doi:10.1016/j.jacc.2013.10.024
- Moser KM, Auger WR, Fedullo PF. Chronic major-vessel thromboembolic pulmonary hypertension. Circulation 1990; 81(6):1735–1743. pmid:2188751
- McNeil K, Dunning J. Chronic thromboembolic pulmonary hypertension (CTEPH). Heart 2007; 93(9):1152–1158. doi:10.1136/hrt.2004.053603
- Tunariu N, Gibbs SJ, Win Z, et al. Ventilation-perfusion scintigraphy is more sensitive than multidetector CTPA in detecting chronic thromboembolic pulmonary disease as a treatable cause of pulmonary hypertension. J Nucl Med 2007; 48(5):680–684. doi:10.2967/jnumed.106.039438
- Fedullo P, Kerr KM, Kim NH, Auger WR. Chronic thromboembolic pulmonary hypertension. Am J Respir Crit Care Med 2011; 183(12):1605–1613. doi:10.1164/rccm.201011-1854CI
- Rich S, Kaufmann E, Levy PS. The effect of high doses of calcium-channel blockers on survival in primary pulmonary hypertension. N Engl J Med 1992; 327(2):76–81. doi:10.1056/NEJM199207093270203
- Sitbon O, Humbert M, Jaıs X, et al. Long-term response to calcium channel blockers in idiopathic pulmonary arterial hypertension. Circulation 2005; 111(23):3105–3111. doi:10.1161/CIRCULATIONAHA.104.488486
- Chin KM, Rubin LJ. Pulmonary arterial hypertension. J Am Coll Cardiol 2008; 51(16):1527–1538. doi:10.1016/j.jacc.2008.01.024
- Soubrier F, Chung WK, Machado R, et al. Genetics and genomics of pulmonary arterial hypertension. J Am Coll Cardiol 2013; 62(suppl 25):D13–D21. doi:10.1016/j.jacc.2013.10.035
- Eyries M, Montani D, Girerd B, et al. EIF2AK4 mutations cause pulmonary veno-occlusive disease, a recessive form of pulmonary hypertension. Nat Genet 2014; 46(1):65–69. doi: 10.1038/ng.2844
- Best DH, Sumner KL, Austin ED, et al. EIF2AK4 mutations in pulmonary capillary hemangiomatosis. Chest 2014; 145(2):231–236. doi:10.1378/chest.13-2366
- Best DH, Sumner KL, Smith BP, et al. EIF2AK4 mutations in patients diagnosed with pulmonary arterial hypertension. Chest 2017; 151(4):821–828. doi:10.1016/j.chest.2016.11.014
- Hadinnapola C, Bleda M, Haimel M, et al; NIHR BioResource–Rare Diseases Consortium; UK National Cohort Study of Idiopathic and Heritable PAH. Phenotypic characterization of EIF2AK4 mutation carriers in a large cohort of patients diagnosed clinically with pulmonary arterial hypertension. Circulation 2017; 136(21):2022–2033. doi:10.1161/CIRCULATIONAHA.117.028351
- Diaz-Guzman E, Farver C, Parambil J, Culver DA. Pulmonary hypertension caused by sarcoidosis. Clin Chest Med 2008; 29(3):549–563. doi:10.1016/j.ccm.2008.03.010
- Mauritz GJ, Kind T, Marcus JT, et al. Progressive changes in right ventricular geometric shortening and long-term survival in pulmonary arterial hypertension. Chest 2012; 141(4):935–943. doi:10.1378/chest.10-3277
- Galiè N, Palazzini M, Manes A. Pulmonary arterial hypertension: from the kingdom of the near-dead to multiple clinical trial meta-analyses. Eur Heart J 2010; 31(17):2080–2086. doi:10.1093/eurheartj/ehq152
KEY POINTS
- PAH has nonspecific symptoms, largely attributable to right ventricular dysfunction but seen in a host of other common cardiopulmonary ailments.
- In a patient suspected of having pulmonary hypertension, it is important to take a methodic diagnostic approach to identify underlying contributors and minimize unnecessary testing.
- Patients suspected of having PAH should be referred to a pulmonary hypertension center of excellence for evaluation and right heart catheterization.
- Once testing is complete, therapy and management should be guided both by data obtained during the initial evaluation and by factors with prognostic significance. This approach has changed PAH from a disease with a grim outlook to one in which appropriate evaluation and guidance can improve patient outcomes.
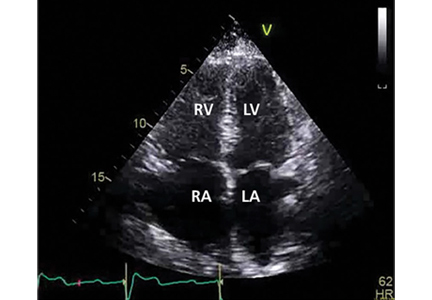
An MRI Analysis of the Pelvis to Determine the Ideal Method for Ultrasound-Guided Bone Marrow Aspiration from the Iliac Crest
ABSTRACT
Use of mesenchymal stem cells from bone marrow has gained significant popularity. The iliac crest has been determined to be an effective site for harvesting mesenchymal stem cells. Review of the literature reveals that multiple techniques are used to harvest bone marrow aspirate from the iliac crest, but the descriptions are based on the experience of various authors as opposed to studied anatomy. A safe, reliable, and reproducible method for aspiration has yet to be studied and described. We hypothesized that there would be an ideal angle and distance for aspiration that would be the safest, most consistent, and most reliable. Using magnetic resonance imaging (MRI), we reviewed 26 total lumbar spine MRI scans (13 males, 13 females) and found that an angle of 24° should be used when entering the most medial aspect of the posterior superior iliac spine (PSIS) and that this angle did not differ between the sexes. The distance that the trocar can advance after entry before hitting the anterior ilium wall varied significantly between males and females, being 7.53 cm in males and 6.74 cm in females. In addition, the size of the PSIS table was significantly different between males and females (1.20 cm and 0.96 cm, respectively). No other significant differences in the measurements gathered were found. Using the data gleaned from this study, we developed an aspiration technique. This method uses ultrasound to determine the location of the PSIS and the entry point on the PSIS. This contrasts with most techniques that use landmark palpation, which is known to be unreliable and inaccurate. The described technique for aspiration from the PSIS is safe, reliable, reproducible, and substantiated by data.
The iliac crest is an effective site for harvesting bone marrow stem cells. It allows for easy access and is superficial in most individuals, allowing for a relatively quick and simple procedure. Use of mesenchymal stem cells (MSCs) for treatment of orthopedic injuries has grown recently. Whereas overall use has increased, review of the literature reveals very few techniques for iliac crest aspiration,1 but these are not based on anatomic relationships or studies. Hernigou and colleagues2,3 attempted to quantitatively evaluate potential “sectors” allowing for safe aspiration using cadaver and computed tomographic reconstruction imaging. We used magnetic resonance imaging (MRI) to analyze aspiration parameters. Owing to the ilium’s anatomy, improper positioning or aspiration technique during aspiration can result in serious injury.2,4-6 We hypothesized that there is an ideal angle and positioning for bone marrow aspiration from the posterior superior iliac spine (PSIS) that is safe, consistent, and reproducible. Although most aspiration techniques use landmark palpation, this is unreliable and inaccurate, especially when compared with ultrasound-guided injections7-16 and procedures.9,12,17-19 We describe our technique using ultrasound to visualize patient anatomy and accurately determine anatomic entry with the trocar.
METHODS
MRI scans of 26 patients (13 males, 13 females) were reviewed to determine average angles and distances. Axial T2-weighted views of the lumbar spine were used in all analyses. The sacroiliac (SI) joint angle was defined as the angle formed between the vector through the midline of the pelvis and the vector that is parallel to the SI joint. The approach angle was defined as the angle formed between the vector of the most medial aspect of the PSIS through the ilium to the anterior wall and the vector through the midline of the pelvis (Figure 1). 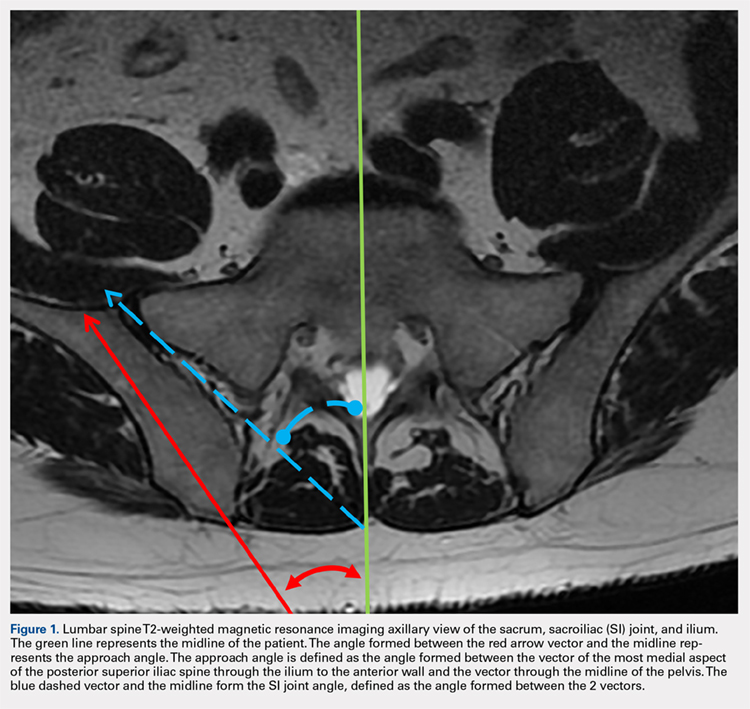
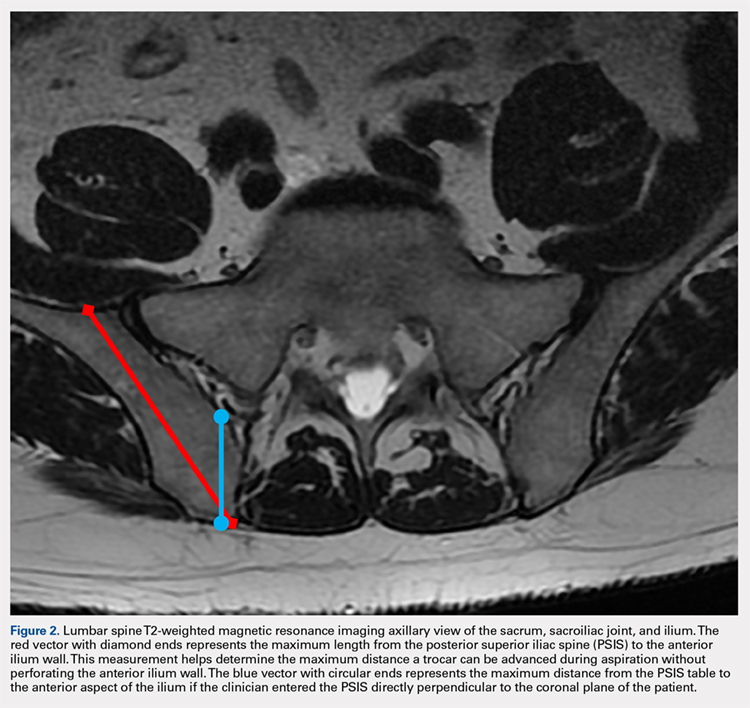
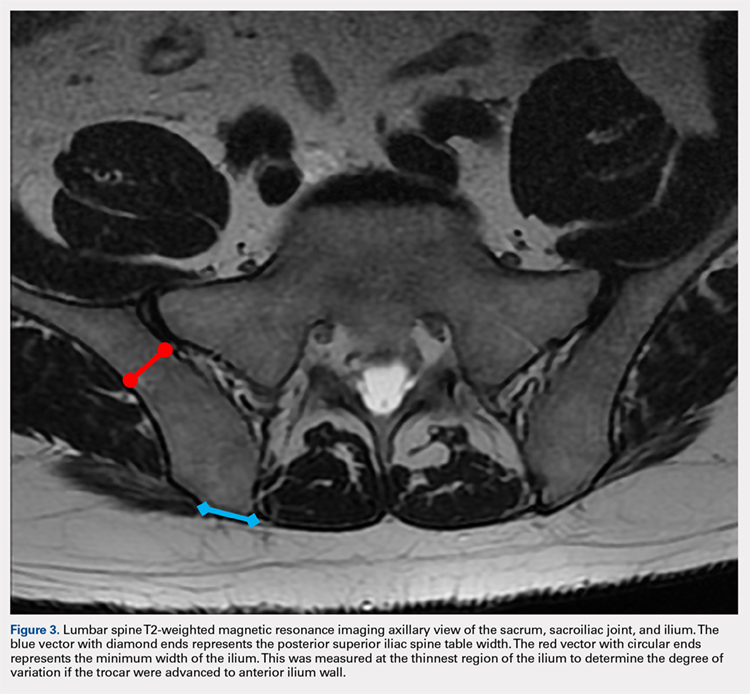
Continue to: For the 13 males, the mean SI joint...
RESULTS
The results are reported in the Table.
Table. Measurements of Patients Taken on Axial T2-Weighted Views of Lumbosacral MRI Scansa
Patient | SI Joint Angle (°) | Approach Angle (°) | PSIS Table Width (cm) | PSIS to Anterior Ilium Wall (cm) | Perpendicular Distance PSIS to Anterior Joint (cm) | Post Ilium Wall to SI Joint Width (cm) |
Males | ||||||
1 | 28.80 | 19.50 | 1.24 | 8.80 | 4.16 | 1.52 |
2 | 31.80 | 27.60 | 1.70 | 7.89 | 3.49 | 1.02 |
3 | 33.70 | 27.70 | 1.12 | 8.14 | 3.15 | 1.28 |
4 | 23.70 | 26.40 | 0.95 | 6.66 | 3.22 | 0.65 |
5 | 35.90 | 28.40 | 0.84 | 7.60 | 2.57 | 0.95 |
6 | 33.80 | 29.30 | 1.20 | 7.73 | 2.34 | 0.90 |
7 | 30.30 | 21.20 | 1.36 | 8.44 | 3.95 | 1.18 |
8 | 34.50 | 20.40 | 1.53 | 7.08 | 3.98 | 1.56 |
9 | 28.70 | 24.00 | 1.34 | 8.19 | 3.51 | 1.31 |
10 | 22.40 | 20.10 | 1.37 | 7.30 | 3.87 | 1.28 |
11 | 33.60 | 20.80 | 0.88 | 6.43 | 3.26 | 0.94 |
12 | 48.50 | 31.00 | 1.15 | 6.69 | 2.97 | 1.38 |
13 | 20.20 | 20.90 | 0.94 | 6.95 | 3.79 | 1.05 |
Averages | 31.22 | 24.41 | 1.20 | 7.53 | 3.40 | 1.16 |
Standard Deviation | 7.18 | 4.11 | 0.26 | 0.75 | 0.56 | 0.26 |
Females | ||||||
14 | 22.80 | 23.20 | 1.54 | 7.21 | 3.45 | 1.39 |
15 | 33.30 | 21.40 | 1.09 | 7.26 | 3.57 | 0.98 |
16 | 19.70 | 15.60 | 0.78 | 8.32 | 3.76 | 0.86 |
17 | 17.50 | 15.60 | 0.61 | 7.57 | 3.37 | 1.03 |
18 | 48.20 | 26.60 | 0.94 | 6.62 | 3.16 | 0.71 |
19 | 38.20 | 28.30 | 0.90 | 6.32 | 2.23 | 0.91 |
20 | 44.50 | 31.70 | 0.99 | 6.19 | 3.06 | 0.76 |
21 | 24.10 | 18.00 | 0.92 | 6.99 | 3.23 | 0.71 |
22 | 17.20 | 14.80 | 0.81 | 6.00 | 2.81 | 1.13 |
23 | 42.00 | 38.50 | 1.00 | 5.33 | 2.47 | 1.42 |
24 | 32.00 | 25.50 | 0.98 | 6.01 | 2.79 | 1.21 |
25 | 24.70 | 24.80 | 0.87 | 6.09 | 2.79 | 1.02 |
26 | 19.80 | 22.30 | 1.04 | 7.71 | 2.37 | 1.36 |
Averages | 29.54 | 23.56 | 0.96 | 6.74 | 3.00 | 1.04 |
Standard Deviation | 10.84 | 6.88 | 0.21 | 0.85 | 0.48 | 0.25 |
All patients Averages | 30.38 | 23.98 | 1.08 | 7.14 | 3.20 | 1.10 |
Standard Deviation | 9.05 | 5.57 | 0.26 | 0.88 | 0.55 | 0.26 |
aStatistical significance is denoted as P < .02.
Abbreviations: MRI, magnetic resonance imaging; PSIS, posterior iliac spine; SI, sacroiliac.
For the 13 males, the mean SI joint angle was 31.22° ± 7.18° (range, 20.20° to 48.50°). The mean approach angle was 24.41° ± 4.11° (range, 19.50° to 31.00°). The mean PSIS table width was 1.20 cm ± 0.26 cm (range, 0.84 cm to 1.70 cm). The mean distance from the PSIS to the anterior ilium wall was 7.53 cm ± 0.75 cm (range, 6.43 cm to 8.80 cm). The mean perpendicular distance from the PSIS table to the anterior ilium was 3.40 cm ± 0.56 cm (range, 2.34 cm to 4.16 cm). The mean minimum width of the ilium to the SI joint was 1.16 cm ± 0.26 cm (range, 0.65 cm to 1.56 cm).
For the 13 females, the mean SI joint angle was 29.54° ± 10.84° (range, 17.20° to 48.20°). The mean approach angle was 23.56° ± 6.88° (range, 14.80° to 38.50°). The mean PSIS table width was 0.96 cm ± 0.21 cm (range, 0.61 cm to 1.54 cm). The mean distance from the PSIS to the anterior ilium wall was 6.74 cm ± 0.85 cm (range, 5.33 cm to 8.32 cm). The mean perpendicular distance from the PSIS table to the anterior ilium was 3.00 cm ± 0.48 cm (range, 2.23 cm to 3.76 cm). The mean minimum width of the ilium to the SI joint was 1.04 cm ± 0.25 cm (range, 0.71 cm to 1.42 cm).
For the 26 total patients, the mean SI joint angle was 30.38° ± 9.05° (range, 17.20° to 48.50°). The mean approach angle was 23.98° ± 5.57° (range, 14.80° to 38.50°). The mean PSIS table width was 1.08 cm ± 0.26 cm (range, 0.61 cm to 1.70 cm). The mean distance from the PSIS to the anterior ilium wall was 7.14 cm ± 0.88 cm (range, 5.33 cm to 8.80 cm). The mean perpendicular distance from the PSIS table to the anterior ilium was 3.20 cm ± 0.55 cm (range, 2.23 cm to 4.16 cm). The mean minimum width of the ilium to the SI joint was 1.10 cm ± 0.26 cm (range, 0.65 cm to 1.56 cm).
There was a statistically significant difference between the male and female groups for the maximum distance the trocar can be advanced from the PSIS to the anterior ilium wall (P < .02), and a statistically significant difference for the PSIS table width (P < .02). There were no significant differences between the male and female groups for the approach angle, the SI joint angle, the perpendicular distance from the PSIS to the anterior ilium, and the minimum width of the ilium to the SI joint.
Continue to: The patient is brought to the procedure...
TECHNIQUE: ILIAC CREST (PSIS) BONE MARROW ASPIRATION
The patient is brought to the procedure room and placed in a prone position. The donor site is prepared and draped in the usual sterile manner. Ultrasound is used to identify the median sacral crest in a short-axis view. The probe is then moved laterally to identify the PSIS (Figures 4A, 4B). 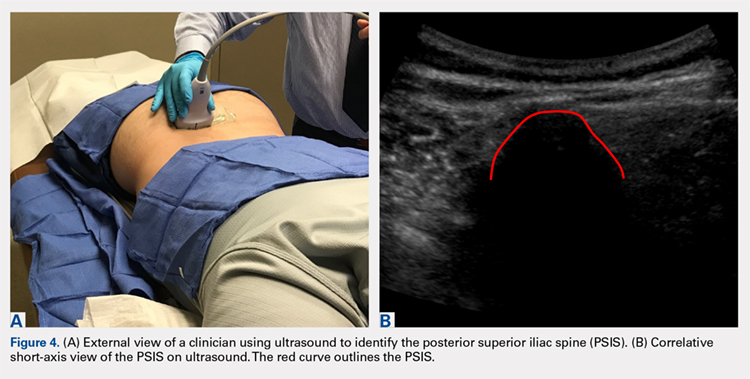
The crosshairs on the ultrasound probe are used to mark the center lines of each plane. The central point marks the location of the PSIS. Alternatively, an in-plane technique can be used to place a spinal needle on the exact entry point on the PSIS. Once the PSIS and entry point are identified, the site is blocked with 10 mL of 0.5% ropivacaine.
Prior to introduction of the trocar, all instrumentation is primed with heparin and syringes are prepped with anticoagulant citrate dextrose solution, solution A. A stab incision is made at the site. The trocar is placed at the entry point, which should be centered in a superior-inferior plane and at the most medial point of the PSIS. Starting with the trocar vertical, the trocar is angled laterally 24° by dropping the hand medially toward the midline. No angulation cephalad or caudad is necessary, but cephalad must be avoided so as not to skive superiorly. This angle, which is recommended for both males and females, allows for the greatest distance the trocar can travel in bone before hitting the anterior ilium wall. A standard deviation of 5.57° is present, which should be considered. Steady pressure should be applied with a slight twisting motion on the PSIS. If advancement of the trocar is too difficult, a mallet or drill can be used to assist in penetration.
With the trocar advanced into the bone 1 cm, the trocar needle is removed while the cannula remains in place. The syringe is attached to the top of the cannula. The syringe plunger is pulled back to aspirate 20 mL of bone marrow. The cannula and syringe assembly are advanced 2 cm farther into the bone to allow for aspiration of a new location within the bone marrow cavity, and 20 mL of bone marrow are again aspirated. This is done a final time, advancing the trocar another 2 cm and aspirating a final 20 mL of bone marrow. The entire process should yield roughly 60 mL of bone marrow from one side. If desired, the same process can be repeated for the contralateral PSIS to yield a total of 120 mL of bone marrow from the 2 sites.
Based on our data, the average distance to the anterior ilium wall was 7 cm, but the shortest distance noted in this study was 5 cm. On the basis of the data presented, this technique allows for safe advancement based on even the shortest measured distance, without fear of puncturing the anterior ilium wall. Perforation could damage the femoral nerve and the internal or external iliac artery or vein that lie anterior to the ilium.
Continue to: We hypothesized that there...
DISCUSSION
We hypothesized that there would be an optimal angle of entry and maximal safe distance the trocar could advance through the ilium when aspirating. Because male and female pelvic anatomy differs, we also hypothesized that there would be differences in distance and size measurements for males and females. Our results supported our hypothesis that there is an ideal approach angle. The results also showed that the maximum distance the trocar can advance and the width of the PSIS table differ significantly between males and females.
Although pelvic anatomy differs between males and females, there should be an ideal entry angle that would allow maximum advancement into the ilium without perforating the anterior wall, which we defined as the approach angle. In our comparison of 26 MRI scans, we found that the approach angle did not differ significantly between the 2 groups (13 males, 13 females). This allows clinicians to enter the PSIS at roughly 24° medial to the parasagittal line, maximizing the space before puncturing into the anterior pelvis in either males or females.
If clinicians were to enter perpendicular to the patient’s PSIS, they would, on average, be able to advance only 3.20 cm before encountering the SI joint. When entering at 24° as we recommend, the average distance increases to 7.14 cm. Although the angle did not differ significantly, there was a significant difference between males and females in the length from the PSIS to the anterior wall, with males having 7.53 cm distance and females 6.74 cm. This is an important measurement because if the anterior ilium wall is punctured, the femoral nerve and the common, internal and external iliac arteries and veins could be damaged, resulting in retroperitoneal hemorrhage.
A fatality in 2001 in the United Kingdom led to a national audit of bone marrow aspiration and biopsies.4-6 Although these procedures were done primarily for patients with cancer, hemorrhagic events were the most frequent and serious events. This audit led to the identification of many risk factors. Bain4-6 conducted reviews of bone marrow aspirations and biopsies in the United Kingdom from 2002 to 2004. Of a total of 53,088 procedures conducted during that time frame, 48 (0.09%) adverse events occurred, with 29 (0.05%) being hemorrhagic events. Although infrequent, hemorrhagic adverse events represent significant morbidity. Reviews such as those conducted by Bain4-6 highlight the importance of a study that helps determine the optimal parameters for aspiration to ensure safety and reliability.
Hernigou and colleagues2,3 conducted studies analyzing different “sectors” in an attempt to develop a safe aspiration technique. They found that obese patients were at higher risk, and some sites of aspiration (sectors 1, 4, 5) had increased risk for perforation and damage to surrounding structures. Their sector 6, which incorporated the entirety of the PSIS table, was considered the safest, most reliable site for trocar introduction.2,3 Hernigou and colleagues,2 in comparing the bone mass of the sectors, also noted that sector 6 has the greatest bone thickness close to the entry point, making it the most favorable site. The PSIS is not just a point; it is more a “table.” The PSIS can be palpated posteriorly, but this is inaccurate and unreliable, particularly in larger individuals. The PSIS table can be identified on ultrasound before introducing the trocar, which is a more reliable method of landmark identification than palpation guidance, just as in ultrasound-guided injections7-16 and procedures.9,12,17-19
Continue to: If the PSIS is not accurately...
If the PSIS is not accurately identified, penetration laterally will result in entering the ilium wing, where it is quite narrow. We found the distance between the posterior ilium wall and the SI joint to be only 1.10 cm wide (Figure 3); we defined this area as the narrow corridor. Superior and lateral entry could damage the superior cluneal nerves coming over the iliac crest, which are located 6 cm lateral to the SI joint. Inferior and lateral entry 6 cm below the PSIS could reach the greater sciatic foramen, damaging the sacral plexus and superior gluteal artery and vein. If the entry slips above the PSIS over the pelvis, the trocar could enter the retroperitoneal space and damage the femoral nerve and common iliac artery and vein, leading to a retroperitoneal hemorrhage.4-6,20
MSCs are found as perivascular cells and lie in the cortices of bones.21 Following the approach angle and directed line from the PSIS to the anterior ilium wall described in this study (Figures 1 and 2), the trocar would pass through the narrow corridor as it advances farther into the ilium. The minimum width of this corridor was measured in this study and, on average, was 1.10 cm wide from cortex to cortex (Figure 3). As the bone marrow is aspirated from this narrow corridor, the clinician is gathering MSCs from both the lateral and medial cortices of the ilium. By aspirating from a greater surface area of the cortices, it is believed that this will increase the total collection of MSCs.
CONCLUSION
Although there are reports in the literature that describe techniques for bone marrow aspiration from the iliac crest, the techniques are very general and vague regarding the ideal angles and methods. Studies have attempted to quantify the safest entry sites for aspiration but have not detailed ideal parameters for collection. Blind aspiration from the iliac crest can have serious implications if adverse events occur, and thus there is a need for a safe and reliable method of aspiration from the iliac crest. Ultrasound guidance to identify anatomy, as opposed to palpation guidance, ensures anatomic placement of the trocar while minimizing the risk of aspiration. Based on the measurements gathered in this study, an optimal angle of entry and safe distance of penetration have been identified. Using our data and relevant literature, we developed a technique for a safe, consistent, and reliable method of bone marrow aspiration out of the iliac crest.
1. Chahla J, Mannava S, Cinque ME, Geeslin AG, Codina D, LaPrade RF. Bone marrow aspirate concentrate harvesting and processing technique. Arthrosc Tech. 2017;6(2):e441-e445. doi:10.1016/j.eats.2016.10.024.
2. Hernigou J, Alves A, Homma Y, Guissou I, Hernigou P. Anatomy of the ilium for bone marrow aspiration: map of sectors and implication for safe trocar placement. Int Orthop. 2014;38(12):2585-2590. doi:10.1007/s00264-014-2353-7.
3. Hernigou J, Picard L, Alves A, Silvera J, Homma Y, Hernigou P. Understanding bone safety zones during bone marrow aspiration from the iliac crest: the sector rule. Int Orthop. 2014;38(11):2377-2384. doi:10.1007/s00264-014-2343-9.
4. Bain BJ. Bone marrow biopsy morbidity: review of 2003. J Clin Pathol. 2005;58(4):406-408. doi:10.1136/jcp.2004.022178.
5. Bain BJ. Bone marrow biopsy morbidity and mortality: 2002 data. Clin Lab Haematol. 2004;26(5):315-318. doi:10.1111/j.1365-2257.2004.00630.x.
6. Bain BJ. Morbidity associated with bone marrow aspiration and trephine biopsy - a review of UK data for 2004. Haematologica. 2006;91(9):1293-1294.
7. Berkoff DJ, Miller LE, Block JE. Clinical utility of ultrasound guidance for intra-articular knee injections: a review. Clin Interv Aging. 2012;7:89-95. doi:10.2147/CIA.S29265.
8. Henkus HE, Cobben LP, Coerkamp EG, Nelissen RG, van Arkel ER. The accuracy of subacromial injections: a prospective randomized magnetic resonance imaging study. Arthroscopy. 2006;22(3):277-282. doi:10.1016/j.arthro.2005.12.019.
9. Hirahara AM, Panero AJ. A guide to ultrasound of the shoulder, part 3: interventional and procedural uses. Am J Orthop. 2016;45(7):440-445.
10. Jackson DW, Evans NA, Thomas BM. Accuracy of needle placement into the intra-articular space of the knee. J Bone Joint Surg Am. 2002;84-A(9):1522-1527.
11. Naredo E, Cabero F, Beneyto P, et al. A randomized comparative study of short term response to blind versus sonographic-guided injection of local corticosteroids in patients with painful shoulder. J Rheumatol. 2004;31(2):308-314.
12. Panero AJ, Hirahara AM. A guide to ultrasound of the shoulder, part 2: the diagnostic evaluation. Am J Orthop. 2016;45(4):233-238.
13. Sethi PM, El Attrache N. Accuracy of intra-articular injection of the glenohumeral joint: a cadaveric study. Orthopedics. 2006;29(2):149-152.
14. Sibbit WL Jr, Peisajovich A, Michael AA, et al. Does sonographic needle guidance affect the clinical outcome of intraarticular injections? J Rheumatol. 2009;36(9):1892-1902. doi:10.3899/jrheum.090013.
15. Smith J, Brault JS, Rizzo M, Sayeed YA, Finnoff JT. Accuracy of sonographically guided and palpation guided scaphotrapeziotrapezoid joint injections. J Ultrasound Med. 2011;30(11):1509-1515. doi:10.7863/jum.2011.30.11.1509.
16. Yamakado K. The targeting accuracy of subacromial injection to the shoulder: an arthrographic evaluation. Arthroscopy. 2002;18(8):887-891.
17. Hirahara AM, Andersen WJ. Ultrasound-guided percutaneous reconstruction of the anterolateral ligament: surgical technique and case report. Am J Orthop. 2016;45(7):418-422, 460.
18. Hirahara AM, Andersen WJ. Ultrasound-guided percutaneous repair of medial patellofemoral ligament: surgical technique and outcomes. Am J Orthop. 2017;46(3):152-157.
19. Hirahara AM, Mackay G, Andersen WJ. Ultrasound-guided InternalBrace of the medial collateral ligament. Arthrosc Tech. Submitted.
20. Jamaludin WFW, Mukari SAM, Wahid SFA. Retroperitoneal hemorrhage associated with bone marrow trephine biopsy. Am J Case Rep. 2013;14:489-493. doi:10.12659/AJCR.889274.
21. Bianco P, Cao X, Frenette PS, et al. The meaning, the sense and the significance: translating the science of mesenchymal stem cells into medicine. Nat Med. 2013;19(1):35-42. doi:10.1038/nm.3028.
ABSTRACT
Use of mesenchymal stem cells from bone marrow has gained significant popularity. The iliac crest has been determined to be an effective site for harvesting mesenchymal stem cells. Review of the literature reveals that multiple techniques are used to harvest bone marrow aspirate from the iliac crest, but the descriptions are based on the experience of various authors as opposed to studied anatomy. A safe, reliable, and reproducible method for aspiration has yet to be studied and described. We hypothesized that there would be an ideal angle and distance for aspiration that would be the safest, most consistent, and most reliable. Using magnetic resonance imaging (MRI), we reviewed 26 total lumbar spine MRI scans (13 males, 13 females) and found that an angle of 24° should be used when entering the most medial aspect of the posterior superior iliac spine (PSIS) and that this angle did not differ between the sexes. The distance that the trocar can advance after entry before hitting the anterior ilium wall varied significantly between males and females, being 7.53 cm in males and 6.74 cm in females. In addition, the size of the PSIS table was significantly different between males and females (1.20 cm and 0.96 cm, respectively). No other significant differences in the measurements gathered were found. Using the data gleaned from this study, we developed an aspiration technique. This method uses ultrasound to determine the location of the PSIS and the entry point on the PSIS. This contrasts with most techniques that use landmark palpation, which is known to be unreliable and inaccurate. The described technique for aspiration from the PSIS is safe, reliable, reproducible, and substantiated by data.
The iliac crest is an effective site for harvesting bone marrow stem cells. It allows for easy access and is superficial in most individuals, allowing for a relatively quick and simple procedure. Use of mesenchymal stem cells (MSCs) for treatment of orthopedic injuries has grown recently. Whereas overall use has increased, review of the literature reveals very few techniques for iliac crest aspiration,1 but these are not based on anatomic relationships or studies. Hernigou and colleagues2,3 attempted to quantitatively evaluate potential “sectors” allowing for safe aspiration using cadaver and computed tomographic reconstruction imaging. We used magnetic resonance imaging (MRI) to analyze aspiration parameters. Owing to the ilium’s anatomy, improper positioning or aspiration technique during aspiration can result in serious injury.2,4-6 We hypothesized that there is an ideal angle and positioning for bone marrow aspiration from the posterior superior iliac spine (PSIS) that is safe, consistent, and reproducible. Although most aspiration techniques use landmark palpation, this is unreliable and inaccurate, especially when compared with ultrasound-guided injections7-16 and procedures.9,12,17-19 We describe our technique using ultrasound to visualize patient anatomy and accurately determine anatomic entry with the trocar.
METHODS
MRI scans of 26 patients (13 males, 13 females) were reviewed to determine average angles and distances. Axial T2-weighted views of the lumbar spine were used in all analyses. The sacroiliac (SI) joint angle was defined as the angle formed between the vector through the midline of the pelvis and the vector that is parallel to the SI joint. The approach angle was defined as the angle formed between the vector of the most medial aspect of the PSIS through the ilium to the anterior wall and the vector through the midline of the pelvis (Figure 1).
Continue to: For the 13 males, the mean SI joint...
RESULTS
The results are reported in the Table.
Table. Measurements of Patients Taken on Axial T2-Weighted Views of Lumbosacral MRI Scansa
Patient | SI Joint Angle (°) | Approach Angle (°) | PSIS Table Width (cm) | PSIS to Anterior Ilium Wall (cm) | Perpendicular Distance PSIS to Anterior Joint (cm) | Post Ilium Wall to SI Joint Width (cm) |
Males | ||||||
1 | 28.80 | 19.50 | 1.24 | 8.80 | 4.16 | 1.52 |
2 | 31.80 | 27.60 | 1.70 | 7.89 | 3.49 | 1.02 |
3 | 33.70 | 27.70 | 1.12 | 8.14 | 3.15 | 1.28 |
4 | 23.70 | 26.40 | 0.95 | 6.66 | 3.22 | 0.65 |
5 | 35.90 | 28.40 | 0.84 | 7.60 | 2.57 | 0.95 |
6 | 33.80 | 29.30 | 1.20 | 7.73 | 2.34 | 0.90 |
7 | 30.30 | 21.20 | 1.36 | 8.44 | 3.95 | 1.18 |
8 | 34.50 | 20.40 | 1.53 | 7.08 | 3.98 | 1.56 |
9 | 28.70 | 24.00 | 1.34 | 8.19 | 3.51 | 1.31 |
10 | 22.40 | 20.10 | 1.37 | 7.30 | 3.87 | 1.28 |
11 | 33.60 | 20.80 | 0.88 | 6.43 | 3.26 | 0.94 |
12 | 48.50 | 31.00 | 1.15 | 6.69 | 2.97 | 1.38 |
13 | 20.20 | 20.90 | 0.94 | 6.95 | 3.79 | 1.05 |
Averages | 31.22 | 24.41 | 1.20 | 7.53 | 3.40 | 1.16 |
Standard Deviation | 7.18 | 4.11 | 0.26 | 0.75 | 0.56 | 0.26 |
Females | ||||||
14 | 22.80 | 23.20 | 1.54 | 7.21 | 3.45 | 1.39 |
15 | 33.30 | 21.40 | 1.09 | 7.26 | 3.57 | 0.98 |
16 | 19.70 | 15.60 | 0.78 | 8.32 | 3.76 | 0.86 |
17 | 17.50 | 15.60 | 0.61 | 7.57 | 3.37 | 1.03 |
18 | 48.20 | 26.60 | 0.94 | 6.62 | 3.16 | 0.71 |
19 | 38.20 | 28.30 | 0.90 | 6.32 | 2.23 | 0.91 |
20 | 44.50 | 31.70 | 0.99 | 6.19 | 3.06 | 0.76 |
21 | 24.10 | 18.00 | 0.92 | 6.99 | 3.23 | 0.71 |
22 | 17.20 | 14.80 | 0.81 | 6.00 | 2.81 | 1.13 |
23 | 42.00 | 38.50 | 1.00 | 5.33 | 2.47 | 1.42 |
24 | 32.00 | 25.50 | 0.98 | 6.01 | 2.79 | 1.21 |
25 | 24.70 | 24.80 | 0.87 | 6.09 | 2.79 | 1.02 |
26 | 19.80 | 22.30 | 1.04 | 7.71 | 2.37 | 1.36 |
Averages | 29.54 | 23.56 | 0.96 | 6.74 | 3.00 | 1.04 |
Standard Deviation | 10.84 | 6.88 | 0.21 | 0.85 | 0.48 | 0.25 |
All patients Averages | 30.38 | 23.98 | 1.08 | 7.14 | 3.20 | 1.10 |
Standard Deviation | 9.05 | 5.57 | 0.26 | 0.88 | 0.55 | 0.26 |
aStatistical significance is denoted as P < .02.
Abbreviations: MRI, magnetic resonance imaging; PSIS, posterior iliac spine; SI, sacroiliac.
For the 13 males, the mean SI joint angle was 31.22° ± 7.18° (range, 20.20° to 48.50°). The mean approach angle was 24.41° ± 4.11° (range, 19.50° to 31.00°). The mean PSIS table width was 1.20 cm ± 0.26 cm (range, 0.84 cm to 1.70 cm). The mean distance from the PSIS to the anterior ilium wall was 7.53 cm ± 0.75 cm (range, 6.43 cm to 8.80 cm). The mean perpendicular distance from the PSIS table to the anterior ilium was 3.40 cm ± 0.56 cm (range, 2.34 cm to 4.16 cm). The mean minimum width of the ilium to the SI joint was 1.16 cm ± 0.26 cm (range, 0.65 cm to 1.56 cm).
For the 13 females, the mean SI joint angle was 29.54° ± 10.84° (range, 17.20° to 48.20°). The mean approach angle was 23.56° ± 6.88° (range, 14.80° to 38.50°). The mean PSIS table width was 0.96 cm ± 0.21 cm (range, 0.61 cm to 1.54 cm). The mean distance from the PSIS to the anterior ilium wall was 6.74 cm ± 0.85 cm (range, 5.33 cm to 8.32 cm). The mean perpendicular distance from the PSIS table to the anterior ilium was 3.00 cm ± 0.48 cm (range, 2.23 cm to 3.76 cm). The mean minimum width of the ilium to the SI joint was 1.04 cm ± 0.25 cm (range, 0.71 cm to 1.42 cm).
For the 26 total patients, the mean SI joint angle was 30.38° ± 9.05° (range, 17.20° to 48.50°). The mean approach angle was 23.98° ± 5.57° (range, 14.80° to 38.50°). The mean PSIS table width was 1.08 cm ± 0.26 cm (range, 0.61 cm to 1.70 cm). The mean distance from the PSIS to the anterior ilium wall was 7.14 cm ± 0.88 cm (range, 5.33 cm to 8.80 cm). The mean perpendicular distance from the PSIS table to the anterior ilium was 3.20 cm ± 0.55 cm (range, 2.23 cm to 4.16 cm). The mean minimum width of the ilium to the SI joint was 1.10 cm ± 0.26 cm (range, 0.65 cm to 1.56 cm).
There was a statistically significant difference between the male and female groups for the maximum distance the trocar can be advanced from the PSIS to the anterior ilium wall (P < .02), and a statistically significant difference for the PSIS table width (P < .02). There were no significant differences between the male and female groups for the approach angle, the SI joint angle, the perpendicular distance from the PSIS to the anterior ilium, and the minimum width of the ilium to the SI joint.
Continue to: The patient is brought to the procedure...
TECHNIQUE: ILIAC CREST (PSIS) BONE MARROW ASPIRATION
The patient is brought to the procedure room and placed in a prone position. The donor site is prepared and draped in the usual sterile manner. Ultrasound is used to identify the median sacral crest in a short-axis view. The probe is then moved laterally to identify the PSIS (Figures 4A, 4B).
The crosshairs on the ultrasound probe are used to mark the center lines of each plane. The central point marks the location of the PSIS. Alternatively, an in-plane technique can be used to place a spinal needle on the exact entry point on the PSIS. Once the PSIS and entry point are identified, the site is blocked with 10 mL of 0.5% ropivacaine.
Prior to introduction of the trocar, all instrumentation is primed with heparin and syringes are prepped with anticoagulant citrate dextrose solution, solution A. A stab incision is made at the site. The trocar is placed at the entry point, which should be centered in a superior-inferior plane and at the most medial point of the PSIS. Starting with the trocar vertical, the trocar is angled laterally 24° by dropping the hand medially toward the midline. No angulation cephalad or caudad is necessary, but cephalad must be avoided so as not to skive superiorly. This angle, which is recommended for both males and females, allows for the greatest distance the trocar can travel in bone before hitting the anterior ilium wall. A standard deviation of 5.57° is present, which should be considered. Steady pressure should be applied with a slight twisting motion on the PSIS. If advancement of the trocar is too difficult, a mallet or drill can be used to assist in penetration.
With the trocar advanced into the bone 1 cm, the trocar needle is removed while the cannula remains in place. The syringe is attached to the top of the cannula. The syringe plunger is pulled back to aspirate 20 mL of bone marrow. The cannula and syringe assembly are advanced 2 cm farther into the bone to allow for aspiration of a new location within the bone marrow cavity, and 20 mL of bone marrow are again aspirated. This is done a final time, advancing the trocar another 2 cm and aspirating a final 20 mL of bone marrow. The entire process should yield roughly 60 mL of bone marrow from one side. If desired, the same process can be repeated for the contralateral PSIS to yield a total of 120 mL of bone marrow from the 2 sites.
Based on our data, the average distance to the anterior ilium wall was 7 cm, but the shortest distance noted in this study was 5 cm. On the basis of the data presented, this technique allows for safe advancement based on even the shortest measured distance, without fear of puncturing the anterior ilium wall. Perforation could damage the femoral nerve and the internal or external iliac artery or vein that lie anterior to the ilium.
Continue to: We hypothesized that there...
DISCUSSION
We hypothesized that there would be an optimal angle of entry and maximal safe distance the trocar could advance through the ilium when aspirating. Because male and female pelvic anatomy differs, we also hypothesized that there would be differences in distance and size measurements for males and females. Our results supported our hypothesis that there is an ideal approach angle. The results also showed that the maximum distance the trocar can advance and the width of the PSIS table differ significantly between males and females.
Although pelvic anatomy differs between males and females, there should be an ideal entry angle that would allow maximum advancement into the ilium without perforating the anterior wall, which we defined as the approach angle. In our comparison of 26 MRI scans, we found that the approach angle did not differ significantly between the 2 groups (13 males, 13 females). This allows clinicians to enter the PSIS at roughly 24° medial to the parasagittal line, maximizing the space before puncturing into the anterior pelvis in either males or females.
If clinicians were to enter perpendicular to the patient’s PSIS, they would, on average, be able to advance only 3.20 cm before encountering the SI joint. When entering at 24° as we recommend, the average distance increases to 7.14 cm. Although the angle did not differ significantly, there was a significant difference between males and females in the length from the PSIS to the anterior wall, with males having 7.53 cm distance and females 6.74 cm. This is an important measurement because if the anterior ilium wall is punctured, the femoral nerve and the common, internal and external iliac arteries and veins could be damaged, resulting in retroperitoneal hemorrhage.
A fatality in 2001 in the United Kingdom led to a national audit of bone marrow aspiration and biopsies.4-6 Although these procedures were done primarily for patients with cancer, hemorrhagic events were the most frequent and serious events. This audit led to the identification of many risk factors. Bain4-6 conducted reviews of bone marrow aspirations and biopsies in the United Kingdom from 2002 to 2004. Of a total of 53,088 procedures conducted during that time frame, 48 (0.09%) adverse events occurred, with 29 (0.05%) being hemorrhagic events. Although infrequent, hemorrhagic adverse events represent significant morbidity. Reviews such as those conducted by Bain4-6 highlight the importance of a study that helps determine the optimal parameters for aspiration to ensure safety and reliability.
Hernigou and colleagues2,3 conducted studies analyzing different “sectors” in an attempt to develop a safe aspiration technique. They found that obese patients were at higher risk, and some sites of aspiration (sectors 1, 4, 5) had increased risk for perforation and damage to surrounding structures. Their sector 6, which incorporated the entirety of the PSIS table, was considered the safest, most reliable site for trocar introduction.2,3 Hernigou and colleagues,2 in comparing the bone mass of the sectors, also noted that sector 6 has the greatest bone thickness close to the entry point, making it the most favorable site. The PSIS is not just a point; it is more a “table.” The PSIS can be palpated posteriorly, but this is inaccurate and unreliable, particularly in larger individuals. The PSIS table can be identified on ultrasound before introducing the trocar, which is a more reliable method of landmark identification than palpation guidance, just as in ultrasound-guided injections7-16 and procedures.9,12,17-19
Continue to: If the PSIS is not accurately...
If the PSIS is not accurately identified, penetration laterally will result in entering the ilium wing, where it is quite narrow. We found the distance between the posterior ilium wall and the SI joint to be only 1.10 cm wide (Figure 3); we defined this area as the narrow corridor. Superior and lateral entry could damage the superior cluneal nerves coming over the iliac crest, which are located 6 cm lateral to the SI joint. Inferior and lateral entry 6 cm below the PSIS could reach the greater sciatic foramen, damaging the sacral plexus and superior gluteal artery and vein. If the entry slips above the PSIS over the pelvis, the trocar could enter the retroperitoneal space and damage the femoral nerve and common iliac artery and vein, leading to a retroperitoneal hemorrhage.4-6,20
MSCs are found as perivascular cells and lie in the cortices of bones.21 Following the approach angle and directed line from the PSIS to the anterior ilium wall described in this study (Figures 1 and 2), the trocar would pass through the narrow corridor as it advances farther into the ilium. The minimum width of this corridor was measured in this study and, on average, was 1.10 cm wide from cortex to cortex (Figure 3). As the bone marrow is aspirated from this narrow corridor, the clinician is gathering MSCs from both the lateral and medial cortices of the ilium. By aspirating from a greater surface area of the cortices, it is believed that this will increase the total collection of MSCs.
CONCLUSION
Although there are reports in the literature that describe techniques for bone marrow aspiration from the iliac crest, the techniques are very general and vague regarding the ideal angles and methods. Studies have attempted to quantify the safest entry sites for aspiration but have not detailed ideal parameters for collection. Blind aspiration from the iliac crest can have serious implications if adverse events occur, and thus there is a need for a safe and reliable method of aspiration from the iliac crest. Ultrasound guidance to identify anatomy, as opposed to palpation guidance, ensures anatomic placement of the trocar while minimizing the risk of aspiration. Based on the measurements gathered in this study, an optimal angle of entry and safe distance of penetration have been identified. Using our data and relevant literature, we developed a technique for a safe, consistent, and reliable method of bone marrow aspiration out of the iliac crest.
1. Chahla J, Mannava S, Cinque ME, Geeslin AG, Codina D, LaPrade RF. Bone marrow aspirate concentrate harvesting and processing technique. Arthrosc Tech. 2017;6(2):e441-e445. doi:10.1016/j.eats.2016.10.024.
2. Hernigou J, Alves A, Homma Y, Guissou I, Hernigou P. Anatomy of the ilium for bone marrow aspiration: map of sectors and implication for safe trocar placement. Int Orthop. 2014;38(12):2585-2590. doi:10.1007/s00264-014-2353-7.
3. Hernigou J, Picard L, Alves A, Silvera J, Homma Y, Hernigou P. Understanding bone safety zones during bone marrow aspiration from the iliac crest: the sector rule. Int Orthop. 2014;38(11):2377-2384. doi:10.1007/s00264-014-2343-9.
4. Bain BJ. Bone marrow biopsy morbidity: review of 2003. J Clin Pathol. 2005;58(4):406-408. doi:10.1136/jcp.2004.022178.
5. Bain BJ. Bone marrow biopsy morbidity and mortality: 2002 data. Clin Lab Haematol. 2004;26(5):315-318. doi:10.1111/j.1365-2257.2004.00630.x.
6. Bain BJ. Morbidity associated with bone marrow aspiration and trephine biopsy - a review of UK data for 2004. Haematologica. 2006;91(9):1293-1294.
7. Berkoff DJ, Miller LE, Block JE. Clinical utility of ultrasound guidance for intra-articular knee injections: a review. Clin Interv Aging. 2012;7:89-95. doi:10.2147/CIA.S29265.
8. Henkus HE, Cobben LP, Coerkamp EG, Nelissen RG, van Arkel ER. The accuracy of subacromial injections: a prospective randomized magnetic resonance imaging study. Arthroscopy. 2006;22(3):277-282. doi:10.1016/j.arthro.2005.12.019.
9. Hirahara AM, Panero AJ. A guide to ultrasound of the shoulder, part 3: interventional and procedural uses. Am J Orthop. 2016;45(7):440-445.
10. Jackson DW, Evans NA, Thomas BM. Accuracy of needle placement into the intra-articular space of the knee. J Bone Joint Surg Am. 2002;84-A(9):1522-1527.
11. Naredo E, Cabero F, Beneyto P, et al. A randomized comparative study of short term response to blind versus sonographic-guided injection of local corticosteroids in patients with painful shoulder. J Rheumatol. 2004;31(2):308-314.
12. Panero AJ, Hirahara AM. A guide to ultrasound of the shoulder, part 2: the diagnostic evaluation. Am J Orthop. 2016;45(4):233-238.
13. Sethi PM, El Attrache N. Accuracy of intra-articular injection of the glenohumeral joint: a cadaveric study. Orthopedics. 2006;29(2):149-152.
14. Sibbit WL Jr, Peisajovich A, Michael AA, et al. Does sonographic needle guidance affect the clinical outcome of intraarticular injections? J Rheumatol. 2009;36(9):1892-1902. doi:10.3899/jrheum.090013.
15. Smith J, Brault JS, Rizzo M, Sayeed YA, Finnoff JT. Accuracy of sonographically guided and palpation guided scaphotrapeziotrapezoid joint injections. J Ultrasound Med. 2011;30(11):1509-1515. doi:10.7863/jum.2011.30.11.1509.
16. Yamakado K. The targeting accuracy of subacromial injection to the shoulder: an arthrographic evaluation. Arthroscopy. 2002;18(8):887-891.
17. Hirahara AM, Andersen WJ. Ultrasound-guided percutaneous reconstruction of the anterolateral ligament: surgical technique and case report. Am J Orthop. 2016;45(7):418-422, 460.
18. Hirahara AM, Andersen WJ. Ultrasound-guided percutaneous repair of medial patellofemoral ligament: surgical technique and outcomes. Am J Orthop. 2017;46(3):152-157.
19. Hirahara AM, Mackay G, Andersen WJ. Ultrasound-guided InternalBrace of the medial collateral ligament. Arthrosc Tech. Submitted.
20. Jamaludin WFW, Mukari SAM, Wahid SFA. Retroperitoneal hemorrhage associated with bone marrow trephine biopsy. Am J Case Rep. 2013;14:489-493. doi:10.12659/AJCR.889274.
21. Bianco P, Cao X, Frenette PS, et al. The meaning, the sense and the significance: translating the science of mesenchymal stem cells into medicine. Nat Med. 2013;19(1):35-42. doi:10.1038/nm.3028.
TAKE-HOME POINTS
- There is an ideal angle and distance for optimization of a bone marrow harvest from the iliac crest.
- Ultrasound is a reliable technology that allows clinicians to accurately and consistently identify the PSIS and avoid neurovascular structures.
- This safe, reliable bone marrow aspiration technique can lower the risk of serious potential complications.
- The ideal angle does not differ significantly between sexes, but the safe distance a clinician can advance does.
- The PSIS should be considered a “table” as opposed to a protuberance.
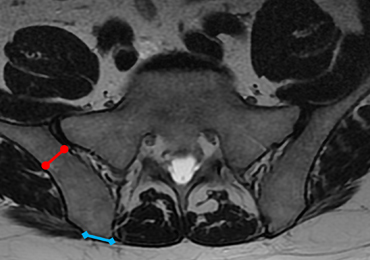
Safety of MRI in patients with implantable cardiac devices
Clinical question: Is MRI safe for patients who have implanted ICD or pacemakers that have not been deemed to be “MRI conditional” by the Food and Drug Administration?
Background: The majority of patients with implantable cardiac devices have a clinical indication for MRI within 10 years. Devices that meet certain criteria specified by the Food and Drug Administration are not felt to pose any safety hazards and are deemed “MRI conditional.” Those that do not meet these criteria are referred to as “legacy” devices and are considered to be a contraindication to MRI by the FDA and device manufacturers. The majority of ICDs and pacemakers currently in use are legacy devices and access to MRI for patients who have these devices has been very limited. This study is the first large prospective study to evaluate the safety of an MRI protocol in patients with legacy ICDs and pacemakers.
Study design: Prospective nonrandomized study.
Setting: Single academic medical center.

Synopsis: During 2003-2015, 1,509 patients with ICDs (629 patients) and pacemakers (880 patients) were enrolled and underwent 2,103 MRI examinations supervised by either an electrophysiologist or a registered nurse with cardiac device programming experience.
Study outcomes included safety and device function immediately after MRI and change in device parameters both immediately after MRI and at long-term follow-up. The most important clinical adverse event that occurred was a reset of device to backup settings referred to as “power on reset” that occurred in nine examinations. Of these nine events, one was associated with mild physical discomfort, one led to device replacement, and one was associated with transient inhibition of pacing. Small changes in P- or R-wave amplitude and atrial or ventricular capture were noted at long-term follow-up. However, none of these were large enough to result in lead revision or device reprogramming. Notable limitations of this study include that it is a single-center study limiting its ability to be generalized and that nearly 20% of patients were lost to long term follow up.
Bottom line: When performed at an institution with an established safety protocol, MRI examinations in patients with legacy devices are not associated with clinically significant adverse safety events or changes in device function that require reprogramming. Multicenter studies are necessary to determine if these results can be generalizable.
Citation: Nazarian S et al. Safety of magnetic resonance imaging in patients with cardiac devices. N Engl J Med. 2017 Dec 28;377(26):2555-64.
Dr. Scaletta is a hospitalist at Denver Health Medical Center and an assistant professor of medicine at the University of Colorado at Denver, Aurora.
Clinical question: Is MRI safe for patients who have implanted ICD or pacemakers that have not been deemed to be “MRI conditional” by the Food and Drug Administration?
Background: The majority of patients with implantable cardiac devices have a clinical indication for MRI within 10 years. Devices that meet certain criteria specified by the Food and Drug Administration are not felt to pose any safety hazards and are deemed “MRI conditional.” Those that do not meet these criteria are referred to as “legacy” devices and are considered to be a contraindication to MRI by the FDA and device manufacturers. The majority of ICDs and pacemakers currently in use are legacy devices and access to MRI for patients who have these devices has been very limited. This study is the first large prospective study to evaluate the safety of an MRI protocol in patients with legacy ICDs and pacemakers.
Study design: Prospective nonrandomized study.
Setting: Single academic medical center.
Synopsis: During 2003-2015, 1,509 patients with ICDs (629 patients) and pacemakers (880 patients) were enrolled and underwent 2,103 MRI examinations supervised by either an electrophysiologist or a registered nurse with cardiac device programming experience.
Study outcomes included safety and device function immediately after MRI and change in device parameters both immediately after MRI and at long-term follow-up. The most important clinical adverse event that occurred was a reset of device to backup settings referred to as “power on reset” that occurred in nine examinations. Of these nine events, one was associated with mild physical discomfort, one led to device replacement, and one was associated with transient inhibition of pacing. Small changes in P- or R-wave amplitude and atrial or ventricular capture were noted at long-term follow-up. However, none of these were large enough to result in lead revision or device reprogramming. Notable limitations of this study include that it is a single-center study limiting its ability to be generalized and that nearly 20% of patients were lost to long term follow up.
Bottom line: When performed at an institution with an established safety protocol, MRI examinations in patients with legacy devices are not associated with clinically significant adverse safety events or changes in device function that require reprogramming. Multicenter studies are necessary to determine if these results can be generalizable.
Citation: Nazarian S et al. Safety of magnetic resonance imaging in patients with cardiac devices. N Engl J Med. 2017 Dec 28;377(26):2555-64.
Dr. Scaletta is a hospitalist at Denver Health Medical Center and an assistant professor of medicine at the University of Colorado at Denver, Aurora.

Magnetic Resonance Imaging Evaluation of the Distal Biceps Tendon
ABSTRACT
Injuries to the distal biceps occur at the tendinous insertion at the radial tuberosity. Distal biceps injuries range from tendinosis to partial tears to non-retracted and retracted complete tears. Acute and chronic complete tears result from a tendinous avulsion at the radial tuberosity. Acute tears result from a strong force exerted on an eccentric biceps contraction, leading to tendon injury.
Distal biceps tendon injuries are uncommon (1.2 per 100,000 patients in one study).1 An underlying degenerative component is involved in all distal biceps tendon tears and tendinosis.2 Partial tears can be caused by the same mechanism or by no particular inciting event.3 Magnetic resonance imaging (MRI) is the optimal imaging modality for distal tendon tears because of its excellent specificity and sensitivity in the detection of complete tears.4,5 Imaging also accurately diagnoses and characterizes partial tears and tendinosis.5 On MRI, fast spin-echo intermediate-weighted and T2-weighted or short tau inversion recovery (STIR) sequences are normally obtained to assess tendon integrity. Along with standard axial and sagittal views, the FABS (flexed elbow, abducted shoulder, supinated forearm) view is an important tool in the diagnosis of distal biceps tendon tears.6 The FABS view is obtained with the patient prone with the shoulder abducted 180° (above the head), with the elbow flexed to 90°, and the forearm supinated. This position allows a longitudinal view of along the entire length of the distal tendon.
Complete distal biceps tears can usually be diagnosed by history and physical examinations. However, imaging can be helpful when intact brachialis function can compensate for a completely torn tendon. MRI is also useful in the setting of a complete tear to locate the torn tendon stump, and assess the degree of retraction for tendon retrieval7,8 and quality of the tendon stump for repair. For associated rupture of the lacertus, the degree of proximal tendon retraction can be significant (Figures 1A, 1B). 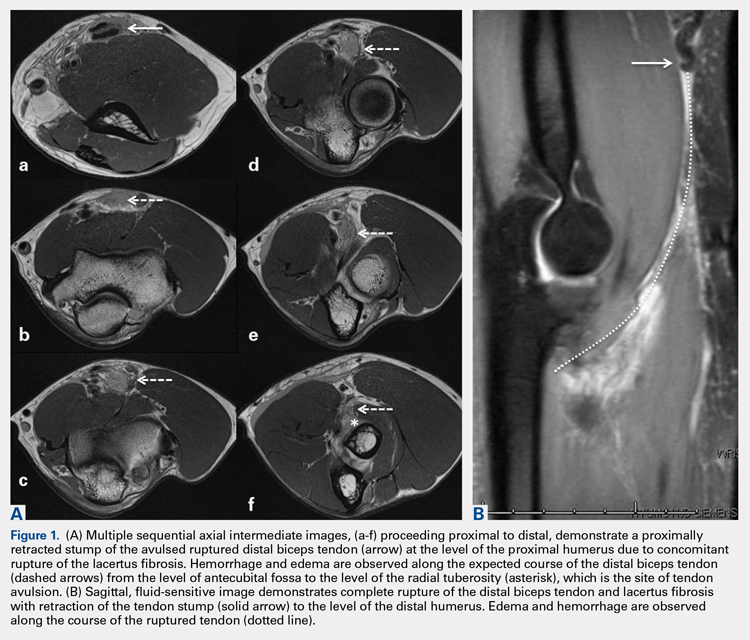
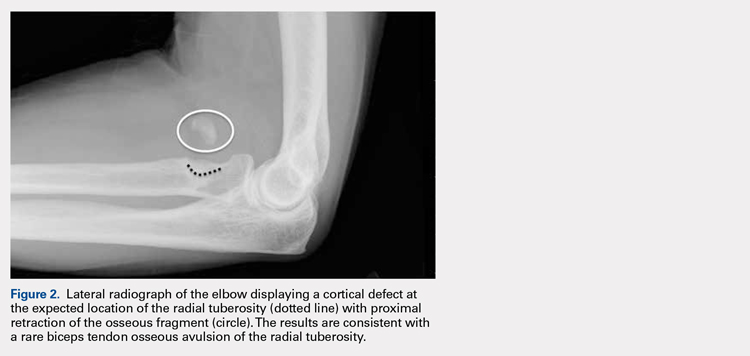
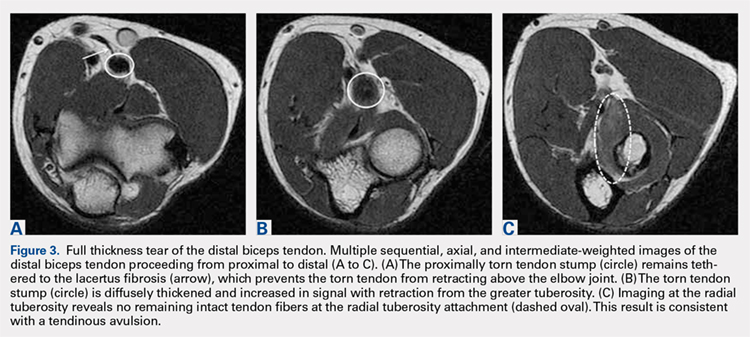
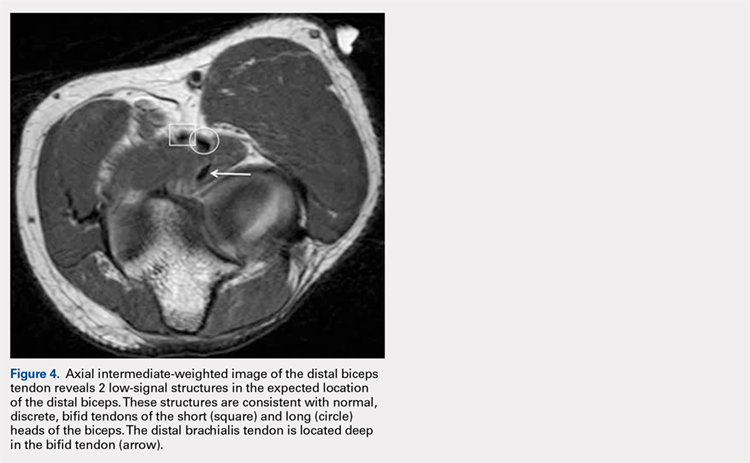
Continue to: Partial distal bicep tears...
Partial distal bicep tears are characterized on MRI by focal or partial detachment of the tendon at the radial tuberosity with fluid filling the site of the tear. The degree of partial tearing can be assessed on MRI (Figures 5A, 5B).
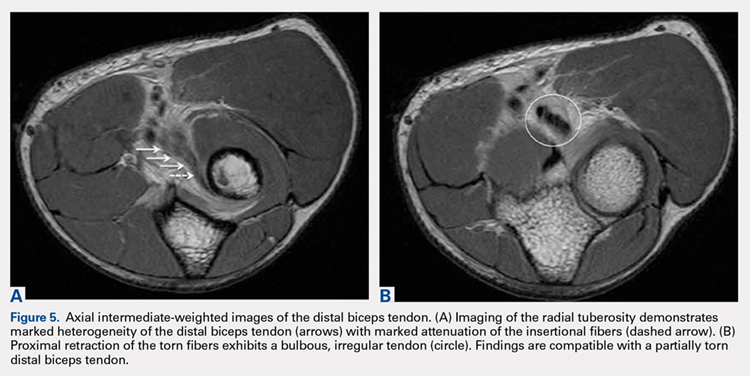
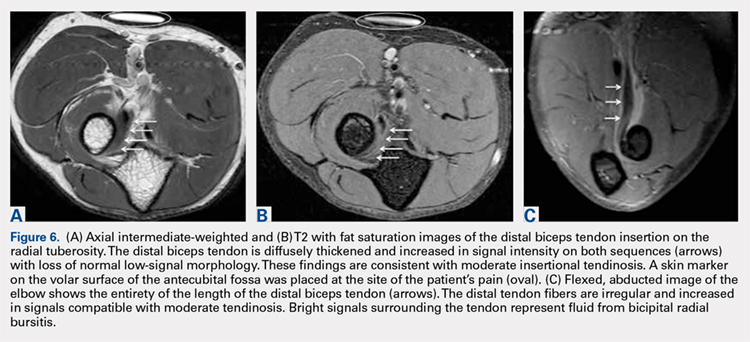
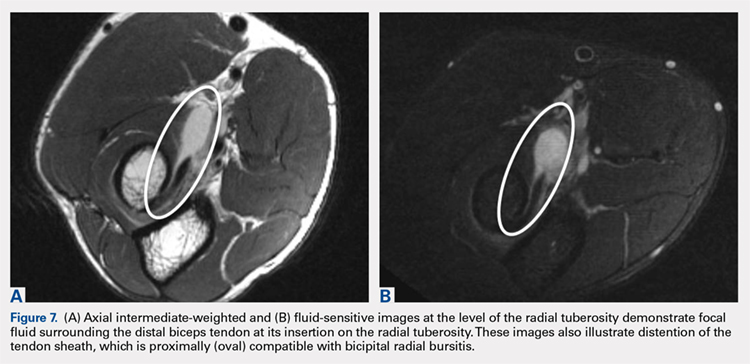
MRI is useful in assessing the distal biceps tendon in the postoperative setting to evaluate the integrity of a repaired tendon. Cortical fixation button technique for repair creates minimal susceptibility artifacts on MRI. Postoperative MRI typically demonstrates a transverse hole drilled through the proximal radius at the site of the tuberosity with a cortical fixation button flush against the posterior radial cortex (Figures 8A-8D). 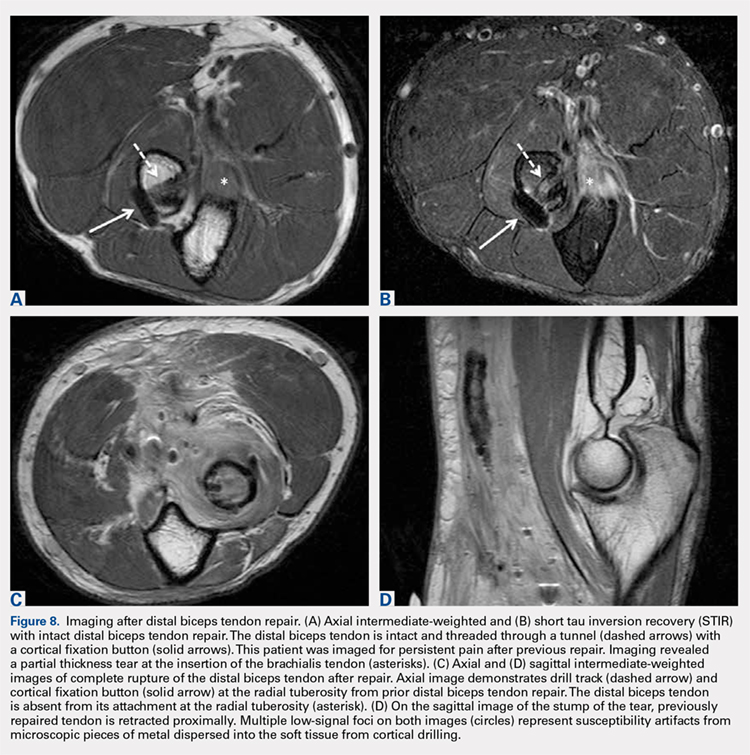
1. Safran M, Graham S. Distal biceps tendon ruptures. Clin Orthop Relat Res. 2002;404:275-283.
2. Kannus P, Józsa L. Histopathological changes preceding spontaneous rupture of a tendon. A controlled study of 891 patients. J Bone Joint Surg Am. 1991;73(10):1507-1525. doi:10.2106/00004623-199173100-00009.
3. Frazier M, Boardman M, Westland M, Imbriglia J. Surgical treatment of partial distal biceps tendon ruptures. J Hand Surg Am. 2010;35(7):1111-1114. doi:10.1016/j.jhsa.2010.04.024.
4. Festa A, Mulieri P, Newman J, Spitz D, Leslie B. Effectiveness of magnetic resonance imaging in detecting partial and complete distal biceps tendon rupture. J Hand Surg Am. 2010;35(1):77-83. doi:10.1016/j.jhsa.2009.08.016.
5. O'Driscoll S, Goncalves L, Dietz P. The hook test for distal biceps tendon avulsion. Am J Sports Med. 2007;35(11):1865-1869. doi:10.1177/0363546507305016.
6. Giuffrè B, Moss M. Optimal positioning for MRI of the distal biceps brachii tendon: flexed abducted supinated view. Am J Roentgenol. 2004;182(4):944-946. doi:10.2214/ajr.182.4.1820944.
7. Falchook F, Zlatkin M, Erbacher G, Moulton J, Bisset G. Murphy B. Rupture of the distal biceps tendon: evaluation with MR imaging. Radiology. 1994;190(3):659-663. doi:10.1148/radiology.190.3.8115606.
8. Fitzgerald S, Curry D, Erickson S, Quinn S, Friedman H. Distal biceps tendon injury: MR imaging diagnosis. Radiology. 1994;191(1):203-206. doi:10.1148/radiology.191.1.8134571.
9. Lehuec J, Zipoli B, Liquois F, Moinard M, Chauveaux D, Le Rebeller A. Distal rupture of the biceps tendon MRI evaluation and surgical repair. J Shoulder Elbow Surg. 1996;5(2):S49.
10. Dirim B, Brouha S, Pretterklieber M, et al. Terminal bifurcation of the biceps brachii muscle and tendon: anatomic considerations and clinical implications. Am J Roentgenol. 2008;191(6):W248-W255. doi:10.2214/AJR.08.1048.
11. Quach T, Jazayeri R, Sherman O, Rosen J. Distal biceps tendon injuries--current treatment options. Bull NYU Hosp Jt Dis. 2010;68(2):103-111.
ABSTRACT
Injuries to the distal biceps occur at the tendinous insertion at the radial tuberosity. Distal biceps injuries range from tendinosis to partial tears to non-retracted and retracted complete tears. Acute and chronic complete tears result from a tendinous avulsion at the radial tuberosity. Acute tears result from a strong force exerted on an eccentric biceps contraction, leading to tendon injury.
Distal biceps tendon injuries are uncommon (1.2 per 100,000 patients in one study).1 An underlying degenerative component is involved in all distal biceps tendon tears and tendinosis.2 Partial tears can be caused by the same mechanism or by no particular inciting event.3 Magnetic resonance imaging (MRI) is the optimal imaging modality for distal tendon tears because of its excellent specificity and sensitivity in the detection of complete tears.4,5 Imaging also accurately diagnoses and characterizes partial tears and tendinosis.5 On MRI, fast spin-echo intermediate-weighted and T2-weighted or short tau inversion recovery (STIR) sequences are normally obtained to assess tendon integrity. Along with standard axial and sagittal views, the FABS (flexed elbow, abducted shoulder, supinated forearm) view is an important tool in the diagnosis of distal biceps tendon tears.6 The FABS view is obtained with the patient prone with the shoulder abducted 180° (above the head), with the elbow flexed to 90°, and the forearm supinated. This position allows a longitudinal view of along the entire length of the distal tendon.
Complete distal biceps tears can usually be diagnosed by history and physical examinations. However, imaging can be helpful when intact brachialis function can compensate for a completely torn tendon. MRI is also useful in the setting of a complete tear to locate the torn tendon stump, and assess the degree of retraction for tendon retrieval7,8 and quality of the tendon stump for repair. For associated rupture of the lacertus, the degree of proximal tendon retraction can be significant (Figures 1A, 1B).
Continue to: Partial distal bicep tears...
Partial distal bicep tears are characterized on MRI by focal or partial detachment of the tendon at the radial tuberosity with fluid filling the site of the tear. The degree of partial tearing can be assessed on MRI (Figures 5A, 5B).
MRI is useful in assessing the distal biceps tendon in the postoperative setting to evaluate the integrity of a repaired tendon. Cortical fixation button technique for repair creates minimal susceptibility artifacts on MRI. Postoperative MRI typically demonstrates a transverse hole drilled through the proximal radius at the site of the tuberosity with a cortical fixation button flush against the posterior radial cortex (Figures 8A-8D).
1. Safran M, Graham S. Distal biceps tendon ruptures. Clin Orthop Relat Res. 2002;404:275-283.
2. Kannus P, Józsa L. Histopathological changes preceding spontaneous rupture of a tendon. A controlled study of 891 patients. J Bone Joint Surg Am. 1991;73(10):1507-1525. doi:10.2106/00004623-199173100-00009.
3. Frazier M, Boardman M, Westland M, Imbriglia J. Surgical treatment of partial distal biceps tendon ruptures. J Hand Surg Am. 2010;35(7):1111-1114. doi:10.1016/j.jhsa.2010.04.024.
4. Festa A, Mulieri P, Newman J, Spitz D, Leslie B. Effectiveness of magnetic resonance imaging in detecting partial and complete distal biceps tendon rupture. J Hand Surg Am. 2010;35(1):77-83. doi:10.1016/j.jhsa.2009.08.016.
5. O'Driscoll S, Goncalves L, Dietz P. The hook test for distal biceps tendon avulsion. Am J Sports Med. 2007;35(11):1865-1869. doi:10.1177/0363546507305016.
6. Giuffrè B, Moss M. Optimal positioning for MRI of the distal biceps brachii tendon: flexed abducted supinated view. Am J Roentgenol. 2004;182(4):944-946. doi:10.2214/ajr.182.4.1820944.
7. Falchook F, Zlatkin M, Erbacher G, Moulton J, Bisset G. Murphy B. Rupture of the distal biceps tendon: evaluation with MR imaging. Radiology. 1994;190(3):659-663. doi:10.1148/radiology.190.3.8115606.
8. Fitzgerald S, Curry D, Erickson S, Quinn S, Friedman H. Distal biceps tendon injury: MR imaging diagnosis. Radiology. 1994;191(1):203-206. doi:10.1148/radiology.191.1.8134571.
9. Lehuec J, Zipoli B, Liquois F, Moinard M, Chauveaux D, Le Rebeller A. Distal rupture of the biceps tendon MRI evaluation and surgical repair. J Shoulder Elbow Surg. 1996;5(2):S49.
10. Dirim B, Brouha S, Pretterklieber M, et al. Terminal bifurcation of the biceps brachii muscle and tendon: anatomic considerations and clinical implications. Am J Roentgenol. 2008;191(6):W248-W255. doi:10.2214/AJR.08.1048.
11. Quach T, Jazayeri R, Sherman O, Rosen J. Distal biceps tendon injuries--current treatment options. Bull NYU Hosp Jt Dis. 2010;68(2):103-111.
TAKE-HOME POINTS
- There are a variety of injuries to the distal biceps tendon.
- Injuries vary from tendinosis to full thickness, retracted tears.
- The degree of retraction of full thickness tears depends on the integrity of the lacertus fibrosis.
- The FABS view allows for MRI of the entire length of the distal biceps tendon.
- MRI is the most useful imaging modality to determine the integrity of the postoperative biceps tendon.
Radiographic Study of Humeral Stem in Shoulder Arthroplasty After Lesser Tuberosity Osteotomy or Subscapularis Tenotomy
ABSTRACT
Lesser tuberosity osteotomy (LTO) and subscapularis tenotomy (ST) are used for takedown of the subscapularis during shoulder arthroplasty. LTO offers the theoretical but unproven benefit of improved healing and function of the subscapularis. However, humeral stem subsidence and loosening may be greater when osteotomy is performed, which may compromise functional outcomes. Our hypothesis is that no difference in proximal collar press-fit humeral stem subsidence or loosening exists, with no impairment of functional outcomes using the LTO technique.
During the surgical approach for total shoulder arthroplasty (TSA), the subscapularis is taken down for adequate exposure to the glenohumeral joint. Various methods are available for taking down the subscapularis, including lesser tuberosity osteotomy (LTO) and a subscapularis tenotomy (ST). LTO offers the theoretical but unproven benefit of improved healing and function of the subscapularis secondary to bone-to-bone healing. One concern, however, is that humeral stem subsidence may be greater when an osteotomy is performed owing to compromise of metaphyseal cortical bone, which may compromise functional outcomes. The humeral stem design may also influence subsidence when metaphyseal bone proximally is compromised. This is a concern in both metaphyseal and diaphyseal fitting stems. Metaphyseal collars on diaphyseal fitting stems rely on adequate bone stock in the metaphysis to provide the additional support needed. Also, posterior subluxation remains a challenge in shoulder arthroplasty. The integrity of the subscapularis is important in prevention of posterior subluxation.1 To our knowledge, no study to date has directly compared differences in humeral stem subsidence, loosening, or posterior subluxation between LTO and ST techniques with any humeral stem design. Our hypothesis is that no difference in proximal collar press-fit humeral stem subsidence or loosening exists, with no impairment of functional outcomes using the LTO technique. We also hypothesize that no difference in posterior subluxation exists between LTO and ST techniques.
MATERIALS AND METHODS
INCLUSION CRITERIA
Consecutive patients with a minimum of 12 months of radiographic follow-up were selected from 2007 to 2010 after TSA was performed by 1 of the senior authors (Dr. Miller and Dr. Voloshin). Study patients underwent primary TSA for primary osteoarthritis or rheumatoid arthritis.
EXCLUSION CRITERIA
Patients were excluded if they underwent TSA for posttraumatic glenohumeral arthritis, hemiarthroplasty, or osteonecrosis. Patients were also excluded if a rotator cuff tear was discovered intraoperatively or if they had a history of a rotator cuff repair. Additional exclusion criteria included postoperative trauma to the operative shoulder, postoperative infection, extensive documentation of chronic pain, and underlying neurologic disorder (eg, Parkinson disease, dystonia). Patients with a history of diabetes mellitus were not excluded.
SURGICAL TECHNIQUE
All patients underwent TSA via a deltopectoral approach in a modified beach chair position. Biceps tendons were tenodesed at the level of the pectoralis major. All patients received the same proximal collar press-fit implant (Bigliani-Flatow; Zimmer Biomet). These stems provide rotational stability in the metaphyseal segment via fins, vertical stability with the proximal collar, and distal fixation via an interference fit. All parts of the procedure were performed in similar fashion with the exception of ST vs LTO (Figures 1A-1D). 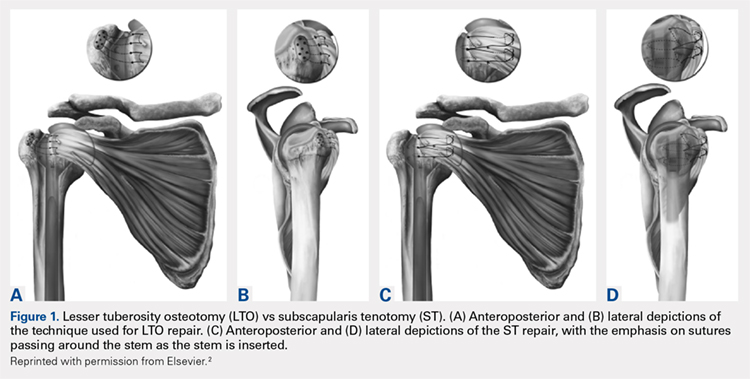
Continue to: LTO was performed as the primary...
LESSER TUBEROSITY OSTEOTOMY
LTO was performed as the primary or preferred technique of 1 surgeon. After completion of the biceps tenodesis, the lesser tuberosity is reflected off with the subscapularis intact using an osteotome. After placement of the press-fit humeral stem, the LTO is repaired using No. 5 Ethibond Excel sutures (Ethicon) passed through previously created bone tunnels in the greater tuberosity. These sutures are tied over metal buttons over the lateral cortex of the greater tuberosity. Last, the lateral corner of the rotator interval is repaired using a single No. 2 FiberWire (Arthrex).2
SUBSCAPULARIS TENOTOMY
ST is the preferred surgical technique of the second surgeon. After a biceps tenodesis, the subscapularis tendon is released from the lesser tuberosity at the margin of the bicipital groove. Through careful dissection, a single flap including the underlying capsule is created and reflected medially to the level of the coracoid. After placement of the press-fit humeral stem and humeral head, the subscapularis is repaired back in place through previous bone tunnels and with a No. 5 Ethibond Excel suture under the appropriate tension. Then, the lateral corner of the rotator interval is closed using a single No. 2 Ethibond Excel suture in a figure-of-eight fashion.2
RADIOGRAPHIC ANALYSIS
The primary variables analyzed were subsidence and loosening. Additional variables, including humeral-acromial distance (HAD) and subluxation index, were also analyzed to assess for any additional impact caused by subsidence or loosening.3 All radiographic measurements were taken from the Grashey (true anteroposterior) view, except subluxation index, which was calculated using the axillary view. All radiographic measurements were completed by 3 independent reviewers. All radiographs were completed in a consistent manner according to postoperative protocols.
HAD was measured preoperatively, immediately postoperatively, and at final follow-up at a minimum of 1 year. The HAD was measured from the lowest point on the acromion to the humerus using a perpendicular line (Figure 2). 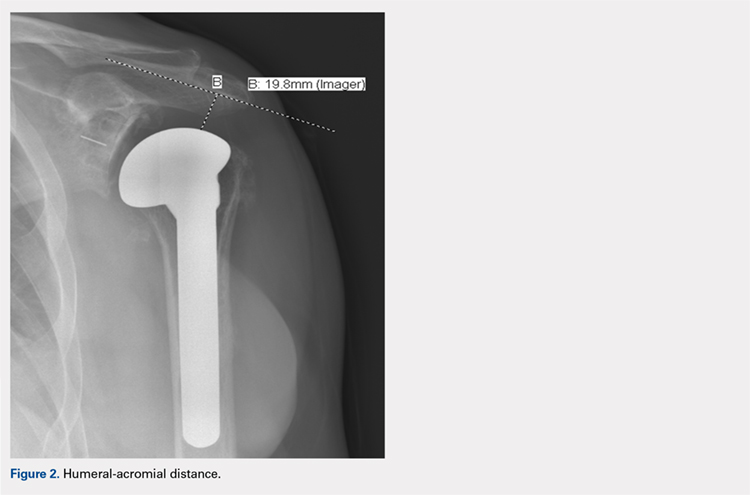
Subsidence of the prosthesis was calculated by determining the difference between immediate postoperative heights of the prosthesis in comparison to the value of the final follow-up films. To calculate the height, 2 lines were drawn, 1 line was drawn perpendicular to the top of the prosthetic head and 1 perpendicular to the top of the greater tuberosity (Figure 3). 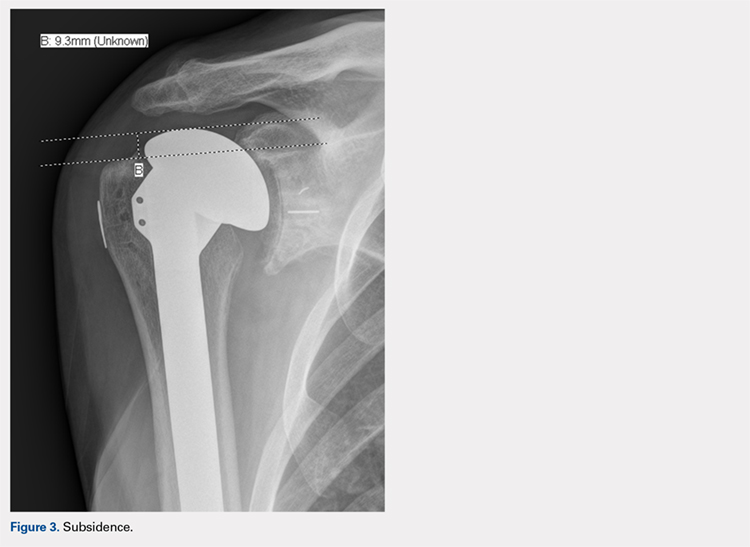
Continue to: Posterior subluxation is indicated...
Posterior subluxation is indicated by a value >65%, a centered head is between 35% and 65%, and anterior subluxation is indicated by a value <35% (Figure 4).3
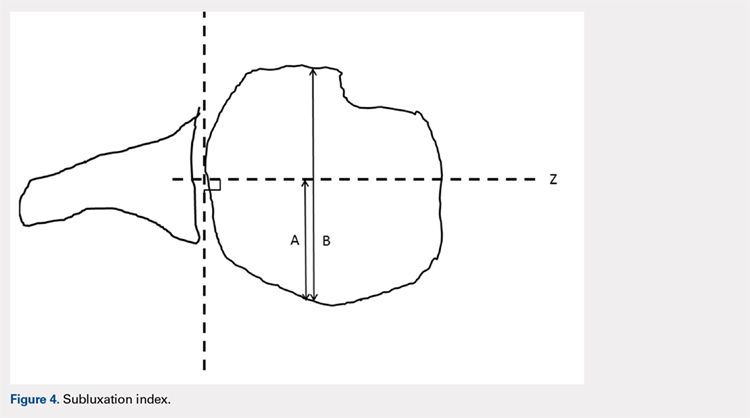
The humeral stems were evaluated for loosening by assessing for lucency on final radiographic follow-up films. These were evaluated in a zonal fashion as demonstrated by Sanchez-Sotelo and colleagues4 and in Figure 5. 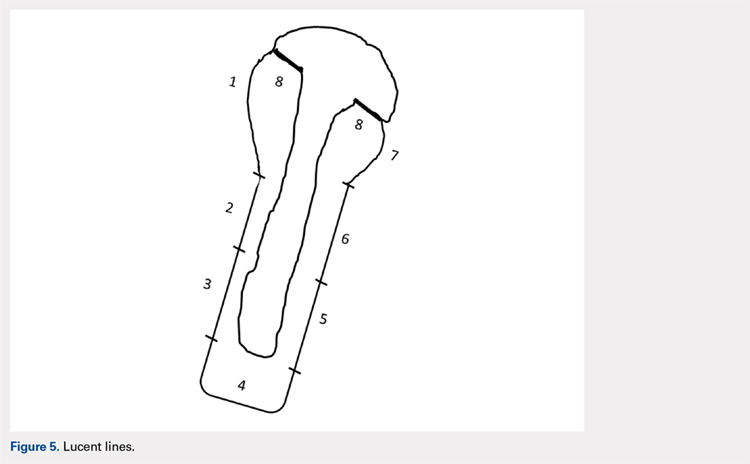
FUNCTIONAL OUTCOME EVALUATION
Before clinical evaluation, each study patient completed the Western Ontario Osteoarthritis of the Shoulder (WOOS) index; the Disabilities of the Hand, Arm and Shoulder (DASH) questionnaire, and the pain and function sections of the Constant score. The functional outcomes scores were captured postoperatively from October to November 2011. The WOOS is a validated outcome measure specific to osteoarthritis of the shoulder and has been used in prior studies evaluating outcomes of TSA.5-7 Previous studies have determined that the minimal clinically important difference for the WOOS score is 15 on a normalized 0 to 100 scale (100 being the best). The DASH score is a validated outcome measure for disorders of the upper extremity but is not specific to osteoarthritis of the shoulder.8 The Constant score is a validated outcome measure for a number of shoulder disorders, including TSA.9,10
STATISTICAL ANALYSIS
Statistical analyses were completed by a trained biostatistician. A power analysis was calculated using the noninferiority test to determine if adequate data had been obtained for this study. This was calculated by using previously accepted data demonstrating a statistically significant difference for subsidence and HAD. The data from these studies were used to make assumptions regarding accepted standard deviations and noninferiority margins, as calculated from the mean values of the 2 groups analyzed in each respective study.4,11 This analysis demonstrated power of 0.97 and 0.85 for the subsidence and HAD, respectively, given the current sample sizes. Intraclass coefficients were calculated to evaluate the measurements obtained during the radiographic analysis to determine the interrater agreement. Two samples’ t tests were calculated for the variables analyzed, along with P values and means.
RESULTS
DEMOGRAPHICS
A total of 51 consecutive patients were retrospectively selected for analysis. Of these, 16 patients were excluded from the study because they had <9 months of radiographic follow-up and were unavailable for further follow-up evaluation. Of the remaining 35 patients available for analysis, 4 patients had bilateral TSA, providing 39 shoulders for evaluation. Demographic characteristics of the study cohort are reported in Table 1.
| Table 1. Demographic Characteristics | |||
| Tenotomy (n = 24) | Osteotomy (n = 15) | P-value | |
| Age | 68.2 [7.4] | 70.2 [7.1] | 0.46 |
| Follow-up | 20.6 [11.5] | 18.5 [6.25] | 0.94 |
| Females | 7 (29%) | 6 (40%) | 0.58 |
| Dominant shoulder | 14 (58%) | 8 (53%) | 0.81 |
| Primary Diagnosis | |||
| Osteoarthritis | 22 (92%) | 15 (100%) | |
| Rheumatoid arthritis | 2 (8%) | 0 (0%) |
Fifteen patients underwent LTO, and 24 underwent ST. One patient underwent a tenotomy of the right shoulder and LTO of the left shoulder. Three LTOs were performed by the surgeon who primarily performed ST, owing to potential benefits of LTO. He eventually returned to his preferred technique of ST because of surgeon preference. Three ST procedures were completed by the surgeon who typically performed LTO at the start of the series prior to establishing LTO as his preferred technique. There was no significant difference between the study populations in terms of age, follow-up, male-to-female ratio, hand dominance, and primary diagnosis of osteoarthritis vs rheumatoid arthritis.
Continue to: There was no significant difference...
RADIOGRAPHIC DATA
There was no significant difference in preoperative HAD between the LTO and ST groups (9.5 ± 2.4 mm vs 10.9 ± 2.7 mm, P = .11). The immediate postoperative HAD was statistically significant between the LTO and ST groups (11.9 ± 3.7 mm vs 15.9 ± 4.5 mm, P = .005). There was as statistically significant difference noted in the final follow-up films between the LTO and ST groups (11.8 ± 3.2 mm vs 14.5 ± 3.9 mm, P = .025) (Table 2).
Table 2. Radiographic Data | |||||
Humeral Acromial Distance | |||||
| LTO | ST | P-Value | ||
Preoperative, mm | 9.5 | [2.4] | 10.9 | [2.7] | 0.11 |
Postoperative, mm | 11.9 | [3.7] | 15.9 | [4.5] | 0.005 |
Final follow-up, mm | 11.8 | [3.2] | 14.5 | [3.9] | 0.025 |
Subsidence | |||||
| LTO | ST | P-Value | ||
Subsidence, mm | 2.8 | [3.1] | 2.5 | [3.1] | 0.72 |
Subluxation Index | |||||
| LTO | ST | P-Value | ||
Preoperative, % | 0.55 | [0.06] | 0.54 | [0.07] | 0.45 |
Postoperative, % | 0.55 | [0.09] | 0.48 | [0.05] | 0.015 |
Lucent Lines | |||||
| LTO | ST | P-Value | ||
Lines >2 mm, % | 0.00 | 0.08 | 0.51 | ||
Abbreviations: LTO, lesser tuberosity osteotomy; ST, subscapularis tenotomy.
There were no statistically significant differences found in subsidence between LTO and ST groups at final follow-up (2.8 mm ± 3.1 mm vs 2.5 mm ± 3.1 mm, P = .72) (Table 2). No statistically significant difference was noted in the subluxation index between the LTO and ST groups (0.55% ± .06% vs 0.54% ± 0.07%, P = .45), but there was a statistically significant difference noted postoperatively between the LTO and ST groups (0.55% ± 0.09% vs .48% ± 0.05%, P = .015) (Table 2).
Two stems were noted to have lucent lines >2 mm, both within the ST cohort. Each had 1 stem zone >2 mm, 1 in zone 7, and 1 in zone 4. No statistically significant difference was identified between the LTO and ST groups (0/15 vs 2/24, P = .51) (Table 2).
FUNCTIONAL OUTCOMES
Study patients were evaluated using functional outcome scores, including the Constant, WOOS, and DASH scores (Table 3).
| Table 3. Functional Data | |||||
| LTO | ST | P-Value | |||
| WOOS index | 93.3 | [5.3] | 81.5 | [20.8] | 0.013 |
| DASH score | 8.4 | [6.6] | 13.8 | [4.9] | 0.13 |
| Constant score | 83.3 | [9.1] | 81.8 | [10.1] | 0.64 |
Abbreviations: DASH, disabilities of the arm, shoulder and hand; WOOS, Western Ontario Osteoarthritis of the Shoulder.
No statistically significant differences were noted in the DASH scores (8.4 ± 6.6 vs 13.8 ± 4.9, P = .13) or Constant scores (83.3 ± 9.1 vs 81.8 ± 10.1, P = .64) between the LTO and ST cohorts. There was a statistically significant difference between the WOOS scores (93.3 ± 5.3 vs 81.5 ± 20.8, P = .013). Because separate radiographic reviews were done by 3 independent personnel at 3 different times, it was important to ensure agreement among the reviewers. This was compared using the intraclass correlation coefficients. In the statistical analysis completed, the intraclass coefficients showed the 3 reviewers agreed with each other throughout the radiographic analysis (Table 4).
| Table 4. Testing Agreement: ICC | ||||
| ICC | CI, 2.5% | CI, 97.5% | ||
| HAD | Preoperative | 0.4451 | 0.2202 | 0.6443 |
| Postoperative | 0.6997 | 0.4836 | 0.834 | |
| Final follow-up | 0.5575 | 0.3592 | 0.7218 | |
| Subsidence | 0.6863 | 0.5349 | 0.807 | |
| SI | Preoperative | 0.3087 | 0.1061 | 0.5213 |
| Final follow-up | 0.5364 | 0.299 | 0.7186 |
Abbreviations: CI, confidence interval; HAD, humeral acromial distance; ICC, intraclass correlation coefficient; SI, subluxation index.
DISCUSSION
At final follow-up, we identified no statistically significant difference between the LTO and ST patients in subsidence, lucent lines >2 mm, or functional outcomes (Constant and DASH scores) in patients who underwent TSA with the same proximal collar press-fit humeral stem. In regard to the functional outcome scores, although the WOOS score was statistically significant (P = .013) between the LTO and ST cohorts, we do not feel that this is clinically relevant because it does not reach the minimal clinically important difference threshold of 15 points.8
A statistically significant difference was noted in postoperative subluxation index but was not clinically relevant, because the values between the LTO and ST groups (0.55 vs 0.48) still showed a centered humeral head. Gerber and colleagues3 discussed using a value of 0.65 as a measure of posterior humeral head subluxation, whereas Walch and colleagues12 defined posterior humeral head subluxation as a value >0.55. On the basis of these numbers, the values obtained in this study demonstrated that the postoperative values were still centered on the glenoid, and therefore were not clinically significant.3,12
Continue to: In regard to HAD, there...
In regard to HAD, there was a statistically significant difference noted postoperatively (P = .005) and at final follow-up (P = .025) between the LTO and ST cohorts. Saupe and colleagues13 demonstrated that a HAD <7 mm was considered abnormal and reflected subacromial space narrowing. The values noted in the LTO and ST patients on postoperative and final follow-up radiographs were statistically significant (Table 2), but not clinically relevant because both were >7 mm. A potential source for the variation in HAD may be due to X-ray position and angle.
Studies have shown a concern regarding the integrity of the subscapularis after tenotomy or peel used in TSA with abnormal subscapularis function.14,15 Miller and colleagues15 reported 41 patients, nearly two-thirds, of whom described subscapularis dysfunction. Those authors’ response to the poor clinical outcomes was to remove a fleck of bone with the tendon to achieve “bone-to-bone” healing.14 Gerber and colleagues16 reported on a series of patients using LTO and repair in TSA with 75% and 89% intact subscapularis function on clinical testing.16 Studies by Qureshi and colleagues17 and Scalise and colleagues18 showed similar results after LTO. Biomechanical studies have shown mixed results. Ponce and colleagues19 showed biomechanically superior results for LTO in comparison to the various repair techniques for ST. In another study, Giuseffi and colleagues20 showed no difference in LTO vs ST during biomechanical testing. In response to the increased concern regarding subscapularis integrity, Caplan and colleagues21 reported on 45 arthroplasties in 43 patients with improved postoperative testing with intact subscapularis testing in 90% to 100% of patients. A level 1 randomized control trial conducted by Lapner and colleagues22 did not demonstrate any clear clinical advantage of LTO vs ST. Controversy still exists regarding which is the preferred technique for TSA.
Sanchez-Sotelo and colleagues4 evaluated uncemented humeral components in 72 patients who underwent TSA. They found a humeral component was at risk for loosening if a radiolucent line ≥2 mm was present in at least 3 radiographic zones. They also evaluated tilt or subsidence by measurement and whether the components were observed to have changed. Their measured values correlated with their observed values. That study provided a benchmark for evaluation of loosening and subsidence used during this study.4 Although radiographic follow-up is limited in this study, we feel that any potential subsidence secondary to use of the LTO technique would be radiographically apparent at 1 year. There were 16 patients without adequate radiographic follow-up included in the study. However, we feel that this was not a large concern, because the study was adequately powered with the patients available to determine a difference based on subsidence.
CONCLUSION
We found no difference in subsidence, lucent lines >2 mm, posterior subluxation, and the Constant and DASH functional outcome scores when we compared TSA performed by a LTO with an ST technique with proximal collar press-fit humeral stem. These data cannot be extrapolated to metaphyseal fit stems, which may exhibit different settling characteristics in the setting of the LTO technique.
This paper will be judged for the Resident Writer’s Award.
1. Blasier R, Soslowsky L, Malicky D, Palmer M. Posterior glenohumeral subluxation: Active and passive stabilization in a biomechanical model. J Bone Joint Surg Am. 1997;79-A(3):433-440.
2. Buckley T, Miller R, Nicandri G, Lewis R, Voloshin I. Analysis of subscapularis integrity and function after lesser tuberosity osteotomy versus subscapularis tenotomy in total shoulder arthroplasty using ultrasound and validated clinical outcome measures. J Shoulder Elbow Surg. 2014;23(9):1309-1317. doi:10.1016/j.jse.2013.12.009.
3. Gerber C, Costouros JG, Sukthankar A, Fucentese SF. Static posterior humeral head subluxation and total shoulder arthroplasty. J Shoulder Elbow Surg. 2009;18(4):505-510. doi:10.1016/j.jse.2009.03.003.
4. Sanchez-Sotelo J, Wright TW, O'Driscoll SW, Cofield RH, Rowland CM. Radiographic assessment of uncemented humeral components in total shoulder arthroplasty. J Arthroplasty. 2001;16(2):180-187.
5. Litchfield RB, McKee MD, Balyk R, et al. Cemented versus uncemented fixation of humeral components in total shoulder arthroplasty for osteoarthrtitis of the shoulder: A prospective, randomized, double-blind clinical trial-A JOINTs Canada Project. J Shoulder Elbow Surg. 2013;20(4):529-536. doi:10.1016/j.jse.2011.01.041.
6. Lo IK, Griffin S, Kirkley A. The development of a disease specific quality of life measurement tool for osteoarthritis of the shoulder: The Western Ontario Osteoarthritis of the Shoulder (WOOS) index. Osteoarthritis Cartilage. 2001;9(8):771-778. doi:10.1053/joca.2001.0474
7. Lo IK, Litchfield RB, Griffin S, Faber K, Patterson SD, Kirkley A. Quality of life outcome following hemiarthroplasty or total shoulder arthroplasty in patients with osteoarthritis. A prospective, randomized trial. J Bone Joint Surg Am. 2005;87(10):2178-2185. doi:10.2106/JBJS.D.02198
8. Hudak PL, Amadio PC, Bombardier C. Development of an upper extremity outcome measure: the DASH (disabilities of the arm, shoulder and hand) [corrected]. The Upper Extremity Collaborative Group (UECG). Am J Ind Med. 1996;29(6):602-608. doi:10.1002/(SICI)1097-0274(199606)29:6<602::AID-AJIM4>3.0.CO;2-L.
9. Constant CR, Gerber C, Emery RJ, Sojbjerg JO, Gohlke F, Boileau P. A review of the constant score: Modifications and guidelines for its use. J Shoulder Elbow Surg. 2008;17(2):355-361. doi:10.1016/j.jse.2007.06.022.
10. Constant CR, Murley AH. A clinical method of functional assessment of the shoulder. Clin Orthop Relat Res. 1987;(214):160-164.
11. Mayerhoefer ME, Breitenseher MJ, Wurnig C, Roposch A. Shoulder impingement: Relationship of clinical symptoms and imaging criteria. Clin J Sport Med. 2009;19(2):83-89. doi:10.1097/JSM.0b013e318198e2e3.
12. Walch G, Badet R, Boulahia A, Khoury A. Morphologic study of the glenoid in primary glenohumeral osteoarthritis. J Arthroplasy. 1999;14(6):756-760.
13. Saupe N, Pfirmann CW, Schmid MR, et al. Association between rotator cuff abnormalities and reduced acromiohumeral distance. AJR Am J Roentgenol. 2006;187(2):376-382. doi:10.2214/AJR.05.0435.
14. Jackson J, Cil A, Smith J, Steinmann SP. Integrity and function of the subscapularis after total shoulder arthroplasty. J Shoulder Elbow Surg. 2010;19(7):1085-1090. doi:10.1016/j.jse.2010.04.001.
15. Miller SL, Hazrati Y, Klepps S, Chiang A, Flatow EL. Loss of subscapularis function after total shoulder replacement: a seldom recognized problem. J Shoulder Elbow Surg. 2003;12(1):29-34. doi:10.1067/mse.2003.128195.
16. Gerber C, Yian EH, Pfirrmann AW, Zumstein MA, Werner CM. Subscapularis muscle function and structure after total shoulder replacement with lesser tuberosity osteotomy and repair. J Bone Joint Surg Am. 2005;87(8):1739-1745. doi:10.2106/JBJS.D.02788.
17. Qureshi S, Hsiao A, Klug RA, Lee E, Braman J, Flatow EL. Subscapularis function after total shoulder replacement: results with lesser tuberosity osteotomy. J Shoulder Elbow Surg. 2008;17(1): 68-72. doi:10.1016/j.jse.2007.04.018.
18. Scalise JJ, Ciccone J, Iannotti JP. Clinical, radiographic and ultrasonographic comparison of subscapularis tenotomy and lesser tuberosity osteotomy for total shoulder arthroplasty. J Bone Joint Surg Am. 2010;92(7):1627-1634. doi:10.2106/JBJS.G.01461.
19. Ponce BA, Ahluwalia RS, Mazzocca AD, Gobezie RG, Warner JJ, Millett PJ. Biomechanical and clinical evaluation of a novel lesser tuberosity in total shoulder arthroplasty. J Bone Joint Surg Am. 2005;87 Suppl 2:1-8.
20. Giuseffi SA, Wongtriratanachai P, Omae H, et al. Biomechanical comparison of lesser tuberosity osteotomy versus subscapularis tenotomy in total shoulder arthroplasty. J Shoulder Elbow Surg. 2012;21(8):1087-1095. doi:10.1016/j.jse.2011.07.008.
21. Caplan JL, Whitfield W, Nevasier RJ. Subscapularis function after primary tendon to tendon repair in patients after replacement arthroplasty of the shoulder. J Shoulder Elbow Surg. 2009;18(2):193-196. doi:10.1016/j.jse.2008.10.019.
22. Lapner PLC, Sabri E, Rakhra K, Bell K, Athwal GS. Comparison of LTO to subscapularis peel in shoulder arthroplasty. J Bone Joint Surg Am. 2012;94(24):2239-2246. doi:10.2106/JBJS.K.01365.
ABSTRACT
Lesser tuberosity osteotomy (LTO) and subscapularis tenotomy (ST) are used for takedown of the subscapularis during shoulder arthroplasty. LTO offers the theoretical but unproven benefit of improved healing and function of the subscapularis. However, humeral stem subsidence and loosening may be greater when osteotomy is performed, which may compromise functional outcomes. Our hypothesis is that no difference in proximal collar press-fit humeral stem subsidence or loosening exists, with no impairment of functional outcomes using the LTO technique.
During the surgical approach for total shoulder arthroplasty (TSA), the subscapularis is taken down for adequate exposure to the glenohumeral joint. Various methods are available for taking down the subscapularis, including lesser tuberosity osteotomy (LTO) and a subscapularis tenotomy (ST). LTO offers the theoretical but unproven benefit of improved healing and function of the subscapularis secondary to bone-to-bone healing. One concern, however, is that humeral stem subsidence may be greater when an osteotomy is performed owing to compromise of metaphyseal cortical bone, which may compromise functional outcomes. The humeral stem design may also influence subsidence when metaphyseal bone proximally is compromised. This is a concern in both metaphyseal and diaphyseal fitting stems. Metaphyseal collars on diaphyseal fitting stems rely on adequate bone stock in the metaphysis to provide the additional support needed. Also, posterior subluxation remains a challenge in shoulder arthroplasty. The integrity of the subscapularis is important in prevention of posterior subluxation.1 To our knowledge, no study to date has directly compared differences in humeral stem subsidence, loosening, or posterior subluxation between LTO and ST techniques with any humeral stem design. Our hypothesis is that no difference in proximal collar press-fit humeral stem subsidence or loosening exists, with no impairment of functional outcomes using the LTO technique. We also hypothesize that no difference in posterior subluxation exists between LTO and ST techniques.
MATERIALS AND METHODS
INCLUSION CRITERIA
Consecutive patients with a minimum of 12 months of radiographic follow-up were selected from 2007 to 2010 after TSA was performed by 1 of the senior authors (Dr. Miller and Dr. Voloshin). Study patients underwent primary TSA for primary osteoarthritis or rheumatoid arthritis.
EXCLUSION CRITERIA
Patients were excluded if they underwent TSA for posttraumatic glenohumeral arthritis, hemiarthroplasty, or osteonecrosis. Patients were also excluded if a rotator cuff tear was discovered intraoperatively or if they had a history of a rotator cuff repair. Additional exclusion criteria included postoperative trauma to the operative shoulder, postoperative infection, extensive documentation of chronic pain, and underlying neurologic disorder (eg, Parkinson disease, dystonia). Patients with a history of diabetes mellitus were not excluded.
SURGICAL TECHNIQUE
All patients underwent TSA via a deltopectoral approach in a modified beach chair position. Biceps tendons were tenodesed at the level of the pectoralis major. All patients received the same proximal collar press-fit implant (Bigliani-Flatow; Zimmer Biomet). These stems provide rotational stability in the metaphyseal segment via fins, vertical stability with the proximal collar, and distal fixation via an interference fit. All parts of the procedure were performed in similar fashion with the exception of ST vs LTO (Figures 1A-1D).
Continue to: LTO was performed as the primary...
LESSER TUBEROSITY OSTEOTOMY
LTO was performed as the primary or preferred technique of 1 surgeon. After completion of the biceps tenodesis, the lesser tuberosity is reflected off with the subscapularis intact using an osteotome. After placement of the press-fit humeral stem, the LTO is repaired using No. 5 Ethibond Excel sutures (Ethicon) passed through previously created bone tunnels in the greater tuberosity. These sutures are tied over metal buttons over the lateral cortex of the greater tuberosity. Last, the lateral corner of the rotator interval is repaired using a single No. 2 FiberWire (Arthrex).2
SUBSCAPULARIS TENOTOMY
ST is the preferred surgical technique of the second surgeon. After a biceps tenodesis, the subscapularis tendon is released from the lesser tuberosity at the margin of the bicipital groove. Through careful dissection, a single flap including the underlying capsule is created and reflected medially to the level of the coracoid. After placement of the press-fit humeral stem and humeral head, the subscapularis is repaired back in place through previous bone tunnels and with a No. 5 Ethibond Excel suture under the appropriate tension. Then, the lateral corner of the rotator interval is closed using a single No. 2 Ethibond Excel suture in a figure-of-eight fashion.2
RADIOGRAPHIC ANALYSIS
The primary variables analyzed were subsidence and loosening. Additional variables, including humeral-acromial distance (HAD) and subluxation index, were also analyzed to assess for any additional impact caused by subsidence or loosening.3 All radiographic measurements were taken from the Grashey (true anteroposterior) view, except subluxation index, which was calculated using the axillary view. All radiographic measurements were completed by 3 independent reviewers. All radiographs were completed in a consistent manner according to postoperative protocols.
HAD was measured preoperatively, immediately postoperatively, and at final follow-up at a minimum of 1 year. The HAD was measured from the lowest point on the acromion to the humerus using a perpendicular line (Figure 2).
Subsidence of the prosthesis was calculated by determining the difference between immediate postoperative heights of the prosthesis in comparison to the value of the final follow-up films. To calculate the height, 2 lines were drawn, 1 line was drawn perpendicular to the top of the prosthetic head and 1 perpendicular to the top of the greater tuberosity (Figure 3).
Continue to: Posterior subluxation is indicated...
Posterior subluxation is indicated by a value >65%, a centered head is between 35% and 65%, and anterior subluxation is indicated by a value <35% (Figure 4).3
The humeral stems were evaluated for loosening by assessing for lucency on final radiographic follow-up films. These were evaluated in a zonal fashion as demonstrated by Sanchez-Sotelo and colleagues4 and in Figure 5.
FUNCTIONAL OUTCOME EVALUATION
Before clinical evaluation, each study patient completed the Western Ontario Osteoarthritis of the Shoulder (WOOS) index; the Disabilities of the Hand, Arm and Shoulder (DASH) questionnaire, and the pain and function sections of the Constant score. The functional outcomes scores were captured postoperatively from October to November 2011. The WOOS is a validated outcome measure specific to osteoarthritis of the shoulder and has been used in prior studies evaluating outcomes of TSA.5-7 Previous studies have determined that the minimal clinically important difference for the WOOS score is 15 on a normalized 0 to 100 scale (100 being the best). The DASH score is a validated outcome measure for disorders of the upper extremity but is not specific to osteoarthritis of the shoulder.8 The Constant score is a validated outcome measure for a number of shoulder disorders, including TSA.9,10
STATISTICAL ANALYSIS
Statistical analyses were completed by a trained biostatistician. A power analysis was calculated using the noninferiority test to determine if adequate data had been obtained for this study. This was calculated by using previously accepted data demonstrating a statistically significant difference for subsidence and HAD. The data from these studies were used to make assumptions regarding accepted standard deviations and noninferiority margins, as calculated from the mean values of the 2 groups analyzed in each respective study.4,11 This analysis demonstrated power of 0.97 and 0.85 for the subsidence and HAD, respectively, given the current sample sizes. Intraclass coefficients were calculated to evaluate the measurements obtained during the radiographic analysis to determine the interrater agreement. Two samples’ t tests were calculated for the variables analyzed, along with P values and means.
RESULTS
DEMOGRAPHICS
A total of 51 consecutive patients were retrospectively selected for analysis. Of these, 16 patients were excluded from the study because they had <9 months of radiographic follow-up and were unavailable for further follow-up evaluation. Of the remaining 35 patients available for analysis, 4 patients had bilateral TSA, providing 39 shoulders for evaluation. Demographic characteristics of the study cohort are reported in Table 1.
| Table 1. Demographic Characteristics | |||
| Tenotomy (n = 24) | Osteotomy (n = 15) | P-value | |
| Age | 68.2 [7.4] | 70.2 [7.1] | 0.46 |
| Follow-up | 20.6 [11.5] | 18.5 [6.25] | 0.94 |
| Females | 7 (29%) | 6 (40%) | 0.58 |
| Dominant shoulder | 14 (58%) | 8 (53%) | 0.81 |
| Primary Diagnosis | |||
| Osteoarthritis | 22 (92%) | 15 (100%) | |
| Rheumatoid arthritis | 2 (8%) | 0 (0%) |
Fifteen patients underwent LTO, and 24 underwent ST. One patient underwent a tenotomy of the right shoulder and LTO of the left shoulder. Three LTOs were performed by the surgeon who primarily performed ST, owing to potential benefits of LTO. He eventually returned to his preferred technique of ST because of surgeon preference. Three ST procedures were completed by the surgeon who typically performed LTO at the start of the series prior to establishing LTO as his preferred technique. There was no significant difference between the study populations in terms of age, follow-up, male-to-female ratio, hand dominance, and primary diagnosis of osteoarthritis vs rheumatoid arthritis.
Continue to: There was no significant difference...
RADIOGRAPHIC DATA
There was no significant difference in preoperative HAD between the LTO and ST groups (9.5 ± 2.4 mm vs 10.9 ± 2.7 mm, P = .11). The immediate postoperative HAD was statistically significant between the LTO and ST groups (11.9 ± 3.7 mm vs 15.9 ± 4.5 mm, P = .005). There was as statistically significant difference noted in the final follow-up films between the LTO and ST groups (11.8 ± 3.2 mm vs 14.5 ± 3.9 mm, P = .025) (Table 2).
Table 2. Radiographic Data | |||||
Humeral Acromial Distance | |||||
| LTO | ST | P-Value | ||
Preoperative, mm | 9.5 | [2.4] | 10.9 | [2.7] | 0.11 |
Postoperative, mm | 11.9 | [3.7] | 15.9 | [4.5] | 0.005 |
Final follow-up, mm | 11.8 | [3.2] | 14.5 | [3.9] | 0.025 |
Subsidence | |||||
| LTO | ST | P-Value | ||
Subsidence, mm | 2.8 | [3.1] | 2.5 | [3.1] | 0.72 |
Subluxation Index | |||||
| LTO | ST | P-Value | ||
Preoperative, % | 0.55 | [0.06] | 0.54 | [0.07] | 0.45 |
Postoperative, % | 0.55 | [0.09] | 0.48 | [0.05] | 0.015 |
Lucent Lines | |||||
| LTO | ST | P-Value | ||
Lines >2 mm, % | 0.00 | 0.08 | 0.51 | ||
Abbreviations: LTO, lesser tuberosity osteotomy; ST, subscapularis tenotomy.
There were no statistically significant differences found in subsidence between LTO and ST groups at final follow-up (2.8 mm ± 3.1 mm vs 2.5 mm ± 3.1 mm, P = .72) (Table 2). No statistically significant difference was noted in the subluxation index between the LTO and ST groups (0.55% ± .06% vs 0.54% ± 0.07%, P = .45), but there was a statistically significant difference noted postoperatively between the LTO and ST groups (0.55% ± 0.09% vs .48% ± 0.05%, P = .015) (Table 2).
Two stems were noted to have lucent lines >2 mm, both within the ST cohort. Each had 1 stem zone >2 mm, 1 in zone 7, and 1 in zone 4. No statistically significant difference was identified between the LTO and ST groups (0/15 vs 2/24, P = .51) (Table 2).
FUNCTIONAL OUTCOMES
Study patients were evaluated using functional outcome scores, including the Constant, WOOS, and DASH scores (Table 3).
| Table 3. Functional Data | |||||
| LTO | ST | P-Value | |||
| WOOS index | 93.3 | [5.3] | 81.5 | [20.8] | 0.013 |
| DASH score | 8.4 | [6.6] | 13.8 | [4.9] | 0.13 |
| Constant score | 83.3 | [9.1] | 81.8 | [10.1] | 0.64 |
Abbreviations: DASH, disabilities of the arm, shoulder and hand; WOOS, Western Ontario Osteoarthritis of the Shoulder.
No statistically significant differences were noted in the DASH scores (8.4 ± 6.6 vs 13.8 ± 4.9, P = .13) or Constant scores (83.3 ± 9.1 vs 81.8 ± 10.1, P = .64) between the LTO and ST cohorts. There was a statistically significant difference between the WOOS scores (93.3 ± 5.3 vs 81.5 ± 20.8, P = .013). Because separate radiographic reviews were done by 3 independent personnel at 3 different times, it was important to ensure agreement among the reviewers. This was compared using the intraclass correlation coefficients. In the statistical analysis completed, the intraclass coefficients showed the 3 reviewers agreed with each other throughout the radiographic analysis (Table 4).
| Table 4. Testing Agreement: ICC | ||||
| ICC | CI, 2.5% | CI, 97.5% | ||
| HAD | Preoperative | 0.4451 | 0.2202 | 0.6443 |
| Postoperative | 0.6997 | 0.4836 | 0.834 | |
| Final follow-up | 0.5575 | 0.3592 | 0.7218 | |
| Subsidence | 0.6863 | 0.5349 | 0.807 | |
| SI | Preoperative | 0.3087 | 0.1061 | 0.5213 |
| Final follow-up | 0.5364 | 0.299 | 0.7186 |
Abbreviations: CI, confidence interval; HAD, humeral acromial distance; ICC, intraclass correlation coefficient; SI, subluxation index.
DISCUSSION
At final follow-up, we identified no statistically significant difference between the LTO and ST patients in subsidence, lucent lines >2 mm, or functional outcomes (Constant and DASH scores) in patients who underwent TSA with the same proximal collar press-fit humeral stem. In regard to the functional outcome scores, although the WOOS score was statistically significant (P = .013) between the LTO and ST cohorts, we do not feel that this is clinically relevant because it does not reach the minimal clinically important difference threshold of 15 points.8
A statistically significant difference was noted in postoperative subluxation index but was not clinically relevant, because the values between the LTO and ST groups (0.55 vs 0.48) still showed a centered humeral head. Gerber and colleagues3 discussed using a value of 0.65 as a measure of posterior humeral head subluxation, whereas Walch and colleagues12 defined posterior humeral head subluxation as a value >0.55. On the basis of these numbers, the values obtained in this study demonstrated that the postoperative values were still centered on the glenoid, and therefore were not clinically significant.3,12
Continue to: In regard to HAD, there...
In regard to HAD, there was a statistically significant difference noted postoperatively (P = .005) and at final follow-up (P = .025) between the LTO and ST cohorts. Saupe and colleagues13 demonstrated that a HAD <7 mm was considered abnormal and reflected subacromial space narrowing. The values noted in the LTO and ST patients on postoperative and final follow-up radiographs were statistically significant (Table 2), but not clinically relevant because both were >7 mm. A potential source for the variation in HAD may be due to X-ray position and angle.
Studies have shown a concern regarding the integrity of the subscapularis after tenotomy or peel used in TSA with abnormal subscapularis function.14,15 Miller and colleagues15 reported 41 patients, nearly two-thirds, of whom described subscapularis dysfunction. Those authors’ response to the poor clinical outcomes was to remove a fleck of bone with the tendon to achieve “bone-to-bone” healing.14 Gerber and colleagues16 reported on a series of patients using LTO and repair in TSA with 75% and 89% intact subscapularis function on clinical testing.16 Studies by Qureshi and colleagues17 and Scalise and colleagues18 showed similar results after LTO. Biomechanical studies have shown mixed results. Ponce and colleagues19 showed biomechanically superior results for LTO in comparison to the various repair techniques for ST. In another study, Giuseffi and colleagues20 showed no difference in LTO vs ST during biomechanical testing. In response to the increased concern regarding subscapularis integrity, Caplan and colleagues21 reported on 45 arthroplasties in 43 patients with improved postoperative testing with intact subscapularis testing in 90% to 100% of patients. A level 1 randomized control trial conducted by Lapner and colleagues22 did not demonstrate any clear clinical advantage of LTO vs ST. Controversy still exists regarding which is the preferred technique for TSA.
Sanchez-Sotelo and colleagues4 evaluated uncemented humeral components in 72 patients who underwent TSA. They found a humeral component was at risk for loosening if a radiolucent line ≥2 mm was present in at least 3 radiographic zones. They also evaluated tilt or subsidence by measurement and whether the components were observed to have changed. Their measured values correlated with their observed values. That study provided a benchmark for evaluation of loosening and subsidence used during this study.4 Although radiographic follow-up is limited in this study, we feel that any potential subsidence secondary to use of the LTO technique would be radiographically apparent at 1 year. There were 16 patients without adequate radiographic follow-up included in the study. However, we feel that this was not a large concern, because the study was adequately powered with the patients available to determine a difference based on subsidence.
CONCLUSION
We found no difference in subsidence, lucent lines >2 mm, posterior subluxation, and the Constant and DASH functional outcome scores when we compared TSA performed by a LTO with an ST technique with proximal collar press-fit humeral stem. These data cannot be extrapolated to metaphyseal fit stems, which may exhibit different settling characteristics in the setting of the LTO technique.
This paper will be judged for the Resident Writer’s Award.
1. Blasier R, Soslowsky L, Malicky D, Palmer M. Posterior glenohumeral subluxation: Active and passive stabilization in a biomechanical model. J Bone Joint Surg Am. 1997;79-A(3):433-440.
2. Buckley T, Miller R, Nicandri G, Lewis R, Voloshin I. Analysis of subscapularis integrity and function after lesser tuberosity osteotomy versus subscapularis tenotomy in total shoulder arthroplasty using ultrasound and validated clinical outcome measures. J Shoulder Elbow Surg. 2014;23(9):1309-1317. doi:10.1016/j.jse.2013.12.009.
3. Gerber C, Costouros JG, Sukthankar A, Fucentese SF. Static posterior humeral head subluxation and total shoulder arthroplasty. J Shoulder Elbow Surg. 2009;18(4):505-510. doi:10.1016/j.jse.2009.03.003.
4. Sanchez-Sotelo J, Wright TW, O'Driscoll SW, Cofield RH, Rowland CM. Radiographic assessment of uncemented humeral components in total shoulder arthroplasty. J Arthroplasty. 2001;16(2):180-187.
5. Litchfield RB, McKee MD, Balyk R, et al. Cemented versus uncemented fixation of humeral components in total shoulder arthroplasty for osteoarthrtitis of the shoulder: A prospective, randomized, double-blind clinical trial-A JOINTs Canada Project. J Shoulder Elbow Surg. 2013;20(4):529-536. doi:10.1016/j.jse.2011.01.041.
6. Lo IK, Griffin S, Kirkley A. The development of a disease specific quality of life measurement tool for osteoarthritis of the shoulder: The Western Ontario Osteoarthritis of the Shoulder (WOOS) index. Osteoarthritis Cartilage. 2001;9(8):771-778. doi:10.1053/joca.2001.0474
7. Lo IK, Litchfield RB, Griffin S, Faber K, Patterson SD, Kirkley A. Quality of life outcome following hemiarthroplasty or total shoulder arthroplasty in patients with osteoarthritis. A prospective, randomized trial. J Bone Joint Surg Am. 2005;87(10):2178-2185. doi:10.2106/JBJS.D.02198
8. Hudak PL, Amadio PC, Bombardier C. Development of an upper extremity outcome measure: the DASH (disabilities of the arm, shoulder and hand) [corrected]. The Upper Extremity Collaborative Group (UECG). Am J Ind Med. 1996;29(6):602-608. doi:10.1002/(SICI)1097-0274(199606)29:6<602::AID-AJIM4>3.0.CO;2-L.
9. Constant CR, Gerber C, Emery RJ, Sojbjerg JO, Gohlke F, Boileau P. A review of the constant score: Modifications and guidelines for its use. J Shoulder Elbow Surg. 2008;17(2):355-361. doi:10.1016/j.jse.2007.06.022.
10. Constant CR, Murley AH. A clinical method of functional assessment of the shoulder. Clin Orthop Relat Res. 1987;(214):160-164.
11. Mayerhoefer ME, Breitenseher MJ, Wurnig C, Roposch A. Shoulder impingement: Relationship of clinical symptoms and imaging criteria. Clin J Sport Med. 2009;19(2):83-89. doi:10.1097/JSM.0b013e318198e2e3.
12. Walch G, Badet R, Boulahia A, Khoury A. Morphologic study of the glenoid in primary glenohumeral osteoarthritis. J Arthroplasy. 1999;14(6):756-760.
13. Saupe N, Pfirmann CW, Schmid MR, et al. Association between rotator cuff abnormalities and reduced acromiohumeral distance. AJR Am J Roentgenol. 2006;187(2):376-382. doi:10.2214/AJR.05.0435.
14. Jackson J, Cil A, Smith J, Steinmann SP. Integrity and function of the subscapularis after total shoulder arthroplasty. J Shoulder Elbow Surg. 2010;19(7):1085-1090. doi:10.1016/j.jse.2010.04.001.
15. Miller SL, Hazrati Y, Klepps S, Chiang A, Flatow EL. Loss of subscapularis function after total shoulder replacement: a seldom recognized problem. J Shoulder Elbow Surg. 2003;12(1):29-34. doi:10.1067/mse.2003.128195.
16. Gerber C, Yian EH, Pfirrmann AW, Zumstein MA, Werner CM. Subscapularis muscle function and structure after total shoulder replacement with lesser tuberosity osteotomy and repair. J Bone Joint Surg Am. 2005;87(8):1739-1745. doi:10.2106/JBJS.D.02788.
17. Qureshi S, Hsiao A, Klug RA, Lee E, Braman J, Flatow EL. Subscapularis function after total shoulder replacement: results with lesser tuberosity osteotomy. J Shoulder Elbow Surg. 2008;17(1): 68-72. doi:10.1016/j.jse.2007.04.018.
18. Scalise JJ, Ciccone J, Iannotti JP. Clinical, radiographic and ultrasonographic comparison of subscapularis tenotomy and lesser tuberosity osteotomy for total shoulder arthroplasty. J Bone Joint Surg Am. 2010;92(7):1627-1634. doi:10.2106/JBJS.G.01461.
19. Ponce BA, Ahluwalia RS, Mazzocca AD, Gobezie RG, Warner JJ, Millett PJ. Biomechanical and clinical evaluation of a novel lesser tuberosity in total shoulder arthroplasty. J Bone Joint Surg Am. 2005;87 Suppl 2:1-8.
20. Giuseffi SA, Wongtriratanachai P, Omae H, et al. Biomechanical comparison of lesser tuberosity osteotomy versus subscapularis tenotomy in total shoulder arthroplasty. J Shoulder Elbow Surg. 2012;21(8):1087-1095. doi:10.1016/j.jse.2011.07.008.
21. Caplan JL, Whitfield W, Nevasier RJ. Subscapularis function after primary tendon to tendon repair in patients after replacement arthroplasty of the shoulder. J Shoulder Elbow Surg. 2009;18(2):193-196. doi:10.1016/j.jse.2008.10.019.
22. Lapner PLC, Sabri E, Rakhra K, Bell K, Athwal GS. Comparison of LTO to subscapularis peel in shoulder arthroplasty. J Bone Joint Surg Am. 2012;94(24):2239-2246. doi:10.2106/JBJS.K.01365.
TAKE-HOME POINTS
- LTO and ST remain viable options for takedown of the subscapularis.
- No difference exists in subsidence, lucent lines, and posterior subluxation on radiographic evaluation between LTO and ST.
- No clinically significant difference exists between outcome scores of patients with either technique.
- HAD was statistically significant but not clinically relevant between the 2 techniques.
- Results from the study do not apply to metaphyseal fitting stems, only diaphyseal fitting stems.
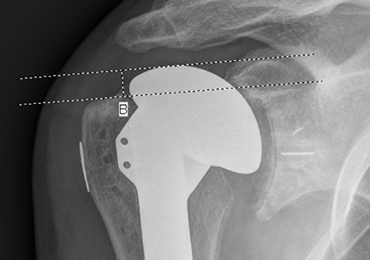
The Potential Value of Dual-Energy X-Ray Absorptiometry in Orthopedics
ABSTRACT
Dual-energy X-ray absorptiometry (DXA) is a well-established technology with an important and well-known role in measuring bone mineral density (BMD) for the purpose of determining fracture risk, diagnosing osteoporosis, and monitoring treatment efficacy. However, aside from the assessment of bone status, DXA is likely underutilized in the field of orthopedics, and most orthopedists may not be aware of the full capabilities of DXA, particularly with regard to total body scans and body composition assessment. For example, DXA would be a valuable tool for monitoring body composition after surgery where compensatory changes in the affected limb may lead to right-left asymmetry (eg, tracking lean mass change after knee surgery), rehabilitation regimens for athletes, congenital and metabolic disorders that affect the musculoskeletal system, or monitoring sarcopenia and frailty in the elderly. Furthermore, preoperative and postoperative regional scans can track BMD changes during healing or alert surgeons to impending problems such as loss of periprosthetic bone, which could lead to implant failure. This article discusses the capabilities of DXA and how this technology could be better used to the advantage of the attending orthopedist.
Dual-energy X-ray absorptiometry, abbreviated as “DXA,” (although usually abbreviated in older literature as “DEXA”) was first introduced in 1987 (Hologic QDR-1000 system, Hologic, Inc) and immediately made all previous forms of radiation-based bone mineral density (BMD) measurement systems obsolete.1 Since then, there have been many generations of the technology, with the main US manufacturers in 2017 being Hologic, Inc. and GE Lunar. There are 2 forms of DXA, peripheral systems (which usually measure BMD only in the radius, finger bones, or calcaneus) and central systems (which measure the radius, proximal femur [“hip”], lumbar spine, total body, and custom sites). The general principle of how DXA works is based on the differential attenuation of photons by bone, fat, and lean mass.2 The DXA technique uses a low- and high-energy X-ray beam produced by an X-ray tube. With the low-energy beam, attenuation by bone is greater than attenuation by soft tissue. With the high-energy beam, attenuation by bone and soft tissues are similar. The dual X-ray beams are passed through the body regions being scanned (usually posterioanteriorly), and the differential attenuation by bone and soft tissue is analyzed to produce BMD estimates. In addition, a high-quality image is produced to enable the operator of the DXA system to verify that the appropriate body region was scanned. It is important to realize that DXA is 2-dimensional (which is sometimes cited as a weakness of DXA), and the units of BMD are grams of mineral per centimeter squared (g/cm2).
Continue to: When assessing bone status...
When assessing bone status for the purpose of determining if a patient is normal, osteopenic, or osteoporotic, the skeletal sites (called regions of interest [ROI]) typically scanned are the proximal femur, lumbar spine, and radius. The BMD of the patient is then compared to a manufacturer-provided normative database of young adults (the logic being that the BMD in the young adult normative population represents maximal peak bone mass). Total body BMD and body composition can also be quantified (grams of lean and fat mass), and custom scans can be designed for other skeletal sites. Specifically, a patient’s BMD is compared to a database of sex- and age-adjusted normal values, and the deviation from normal is expressed as a T-score (the number of standard deviations the patient's BMD is above or below the average BMD of the young adult reference population) and Z-scores (the number of standard deviations a patient's BMD is above or below the average BMD of a sex- and age-matched reference population).3 The International Society for Clinical Densitometry (ISCD) has developed and published well-accepted guidelines used to assist in acquiring high-quality DXA scans and for the diagnosis of osteoporosis using BMD. The accuracy and, especially, the precision of DXA scans can be remarkable when they are performed by trained technologists, and thus, serial scans can be performed to monitor BMD and body composition changes with aging or in response to treatment.
Because of the nature of the scan mechanics and speed, the effective radiation dose with DXA is very low, expressed in microSieverts.4,5 Generally, the radiation exposure from a series of the lumbar spine, proximal femur, and distal radius is about the same as daily background radiation. Even total body scans present very low exposure due to the scan speed at which any 1 body part is exposed for only a fraction of a second.
BENEFITS OF USING DXA FOR THE ORTHEOPEDIST
At the time of this writing in 2018, the presumption could be made that most physicians in the specialties of internal medicine, rheumatology, endocrinology, radiology, and orthopedics were familiar with the capabilities of DXA to assess BMD for the purpose of diagnosing osteoporosis. However, DXA is likely underused for other purposes, as orthopedists may be unaware of the full capabilities of DXA. Printouts after a scan contain more information than simply BMD, and there are more features and applications of DXA that can potentially be useful to orthopedists.
BONE SIZE
Data from a DXA scan are expressed not only as g/cm2 (BMD) but also as total grams in the ROI (known as bone mineral content, abbreviated as BMC), and cm2 (area of the ROI). These data may appear on a separate page, being considered ancillary results. The latter 2 variables are rarely included on a report sent to a referring physician; therefore, awareness of their value is probably limited. However, there are instances where such information could be valuable when interpreting results, especially bone size.6,7 For example, on occasion, patients present with osteopenic lumbar vertebrate but larger than normal vertebral size (area). Many studies have shown that bone size is directly related to bone strength and thus fracture risk.8,9 Although an understudied phenomenon, large vertebral body size could be protective, counteracting a lower than optimal BMD. Further, because the area of the ROI is measured, it is possible to calculate the bone width (or measure directly with a ruler tool in the software if available) for the area measured. This is especially feasible for tubular bones such as the midshaft of the radius, or more specifically, the classic DXA ROI being the area approximately one third the length of the radius from the distal end, the radius 33% region (actually based on ulna length). Consequently, it is possible to use the width of the radius 33% ROI in addition to BMD and T-score when assessing fracture risk.
CASE STUDY
A 60-year-old man had a DXA series of the lumbar spine, proximal femur, and whole body. His total body T-score was 0.6 (normal), and his total proximal femur T-score was −0.8 (normal), but his lumbar spine vertebrae 2 to 4 T-score was −1.9. As the patient was osteopenic based on the lumbar spine T-score, some physicians may have initiated antiresorptive therapy, especially if other risk factors for fracture were present. Further examination of the ancillary results of the DXA scan revealed that the vertebral body height T-score was a remarkable 1.11 and 1.53 after adjustment for stature (automatic software calculation). These results suggested that the patient had vertebral bodies of above average size, which theoretically would be protective against fracture even though the BMD T-score was below normal. For this patient, this finding mitigated immediate concern about the lumbar spine T-score of −1.9. Although vertebral body size is not typically used in assessing fracture risk, it is useful information that could be factored into the decision to start treatment or watch for further change with aging.
Continue to: Case Series: Distal Radius Fractures...
CASE SERIES: DISTAL RADIUS FRACTURES
Table 1 summarizes the data comparing radius 33% ROI T-scores and ROI width in patients who fractured the contralateral radius and normal nonfractured controls.10
Table 1. Comparison of Radius Width at the 33% Region of Interest (ROI) and Bone Mineral Density T-Scores in Premenopausal Women With and Without Fractures
| 33% ROI T-score | Width of ROI, cm |
White women with distal radius fractures |
|
|
Premenopausal (<49 years), n = 36 | -0.2 + 0.9 | 1.22 + 0.11a |
Controls matched for race, age, BMIb |
|
|
Premenopausal (<49 years), n = 65 | -0.1 + 0.8 | 1.45 + 0.25 |
For premenopausal women with distal radius fractures, the width of the radius at the radius 33% ROI was significantly smaller than that in controls. However, there was no difference in T-scores between premenopausal women with distal radius fractures and controls. Thus, bone width more accurately identified women with fractures than T-scores based on BMD, and the orthopedist could use bone size in addition to BMD to predict fracture risk in a patient.
PREPARATION FOR SURGERY
For some procedures, there is potential benefit of assessing bone status prior to surgery. That is, determination of low BMD could potentially influence the type of hardware or fixation techniques used in surgery. Various studies have shown that poor bone quality and low BMD can impair purchase with various types of fixation.11-13 Low preoperative BMD has been shown to be related to high implant migration.14 Knowledge of BMD could influence the choice of screw type used or the type of implant metal (titanium vs cobalt chrome). Another example is predicting the risk of spine curvature progression in adolescent idiopathic scoliosis.15-17 It has been reported that low BMD is a risk factor for progression.15 Knowledge of BMD could potentially help with patient management strategies. For example, a patient with low BMD and vitamin D deficiency could be treated (vitamin D supplementation) prior to planning surgery in an effort to improve the low BMD.
PERIOPROSTHETIC BMD
It is possible to monitor changes in BMD around implants using the periprosthetic software application (this usually needs to be purchased separately from standard software that is installed with a system set-up). Dramatic loss of bone due to stress shielding after total hip arthroplasty (THA) can be a risk factor for implant migration or potentially outright failure of fixation or breakthrough. If bone loss occurs and is observed in the early stages, then antiresorptive treatment can be initiated to limit further loss.18,19 (Figure 1) shows the image from a periprosthetic scan. 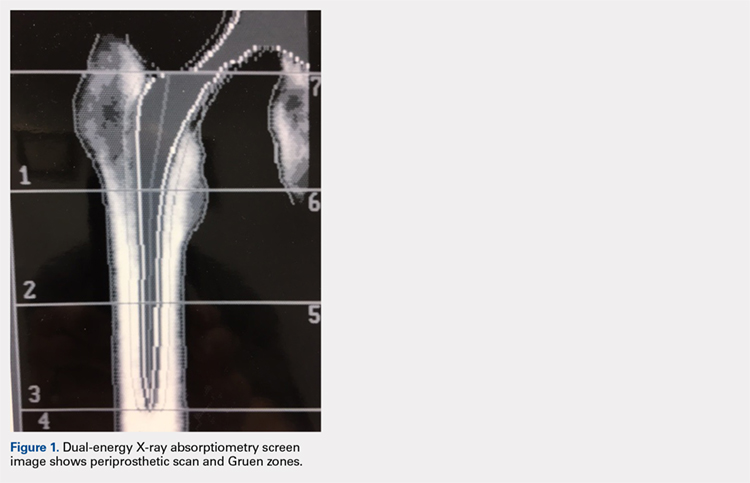
Continue to: A 60-year-old, 215-lb man...
CASE REPORT
A 60-year-old, 215-lb man had a total hip replacement using a newly introduced cemented collared cobalt-chromium alloy femoral stem. A baseline periprosthetic DXA scan was performed 6 weeks postoperatively. Compared to baseline, the change in BMD in the Gruen zone 5 was −8.2%, +6.5%, +4.9%, and +9.46% at 3, 6, 12, and 24 months, respectively. In contrast, dramatic BMD loss was seen in Gruen zone 7 (calcar region): −33.2%, −40.8%, −37.1%, and −34.1% at 3, 6, 12, and 24 months, respectively. Similar findings in other patients led to discontinuation of use of this stem in favor of a collarless stem in which less BMD loss was seen in Gruen zone 7. Although additional technologist training is required and scans may not be reimbursable, for research purposes or for evaluating new component prototypes, the periprosthetic DXA scan capability can be useful.
Various other custom scans can be used to detect and quantify vertebral fractures (vertebral fracture assessment application), monitor healing of fractures by scanning through radiolucent cast materials, or for research purposes to assess BMD at unusual locations.21-23 Other new innovations, such as the ability to perform full-length scans of the femoral shaft and to quantify focal thickening of the lateral cortex to identify beaking, an abnormality associated with atypical femur fracture after long-term bisphosphonate use, continue to expand the utility of DXA. Using standard software, cadaver bones can be scanned prior to biomechanical testing for a variety of purposes, such as ensuring proper matching specimens in test groups. It has been reported that the common practice of using contralateral bone specimens can lead to bias, as the BMD can be significantly different in right and left bones from the same individual.9,24
TOTAL BODY BMD AND BODY COMPOSITION SCANS
Perhaps the least understood capability of DXA from our experience working with orthopedists is the ability to perform total body scans and to obtain not only total body and regional BMD but also body composition data, namely grams of lean and fat mass.25 Soft tissue (no bone pixels) is partitioned into fat and lean body mass by a calibration procedure (lean mass = total soft tissue –fat mass). DXA has become the standard for body composition assessment given the ease of data acquisition (a total body scan takes only a few minutes), accuracy, and precision of measurements. Compared with other methods (eg, skinfold thickness, bioelectrical impedance, and underwater weighing), it is the only method that gives regional values for fat mass, lean mass, and BMC (this allows the ability to compare left vs right sides).25-27 The ability to perform regional measurements cannot be overstated, as stable body weight belies potential changes with age and disease that relate to redistribution of fat and lean mass. It is not possible to identify, let alone track, such changes by measuring gross body weight on a scale or with BMI calculations. However, redistribution of fat and lean mass can be monitored in great detail using DXA. Figures 2 and 3 show the typical output from a DXA total body/body composition scan. 
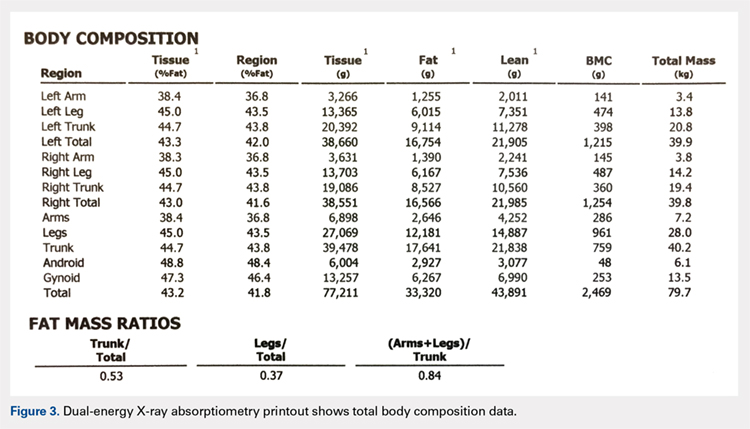
Total body scans with body composition analyses have many applications. For example, monitoring growth and development or treatment in patients with congenital deformity, metabolic bone disease, osteoporosis, and frailty; patients undergoing rehabilitation; and patients having surgery that could affect the use of a contralateral limb with potential hypertrophy or atrophy. Accurate assessment of percent body fat and fat distribution may help surgeons to improve risk stratification and surgical outcome.28-30 Fracture risk has been associated with muscle area.28 Simple measurements of quadriceps size underestimates atrophy, and total body composition can quantitate lean mass.30
In sports medicine, body composition assessments could be useful to monitor postoperative recovery and effectiveness of rehabilitation protocols after injury, effectiveness of conditioning and training programs, developmental changes due to sports participation, and for obtaining baseline assessment at the time of preseason physicals.27,31-34 In athletes, baseline status and morphological adaptations to training have traditionally been measured by anthropometry (eg, skinfold thickness, BMI, limb circumference, etc.), but DXA total body scanning allows for much more detailed assessments with the possibility of subregional quantitation. There is evidence for sports-specific body composition profiles and characteristic adaptations.27,31-34 Using DXA, adaptive changes as a result of training as well as changes and recovery after surgery or injury can be monitored. For example, quadriceps atrophy usually occurs to some extent after ACL repair, and bone mineral loss and muscle atrophy occur after a limb has been immobilized with a cast. DXA body composition assessment could be used to monitor leg lean mass after surgery for comparison with presurgery values or those of the contralateral noninjured side, or to track recovery of bone mineral and muscle after a cast is removed. Some technical sports, such as tennis and baseball pitching, are known to result in limb asymmetry; DXA body composition could be used to monitor development of right-left arm asymmetry in tennis players or baseball pitchers, and then measures could be taken to balance the asymmetry. Wrestlers and elite dancers are expected to maintain strict weight requirements, but diets are often poor, and as such, DXA body composition could be used to track the effects of dieting and training by comparing serial measurements to baseline to ensure that weight changes include preservation or gain of muscle mass.31
Continue to: For older patients...
For older patients being followed after orthopedic care, there is a growing concern about age-related loss of muscle mass, or sarcopenia, which can lead to functional impairment (eg, balance, gait, etc.), and physical disability leading to falling and increased risk of fracture.35-40 Even obese patients can be sarcopenic (a concept known as sarcopenic obesity), and their large body mass can mask the relative deficiency of lean mass.40 DXA total body scans can be used to monitor patients at risk for sarcopenia.
Finally, DXA total body composition scans are underused in the pediatric population. Given the low radiation burden, DXA can be used safely in children of all ages. In addition to the same uses as in adults for presurgical assessment, monitoring bone and soft-tissue changes after treatment and rehabilitation, scans can be used to monitor growth and development.41
CASE STUDY: MONITORING DEVELOPMENT AND TREATMENT
A 12-year-old boy with polyostotic fibrous dysplasia (McCune Albright Syndrome) was started on treatment with cyclic pamidronate to mitigate bone pain and reduce fracture risk. Use of DXA was planned to provide evidence of treatment efficacy by documenting increasing BMD. However, the severe skeletal deformity prevented standard site-specific DXA scans, and consequently, total body scans were effectively used to acquire the BMD data needed to monitor treatment (Figure 4). 

CASE STUDY: AGE-RELATED SARCOPENIA
Figure 5 shows images of a 64-year-old woman who was followed after a distal radius fracture. A total body scan and body composition assessment was performed in 2002. At follow-up in 2004, total body weight seemed stable with only a seemingly benign 5.1-lb loss of weight, and the patient’s overall physical appearance was unchanged (Table 2).
Table 2. Age-Related Changes Potentially Leading to Sarcopenia
| Baseline, 2002 | Follow-up, 2004 | Change, % |
Body weight, kg | 57.9 (127.6 lb) | 55.6 (122.5 lb) | 4 |
BMI | 20.6 | 19.8 |
|
Total body fat, g | 13,619 | 13,390 | −1.7 |
Total body percent fat | 23.5 | 24.1 |
|
Total body lean, g | 42,038 | 39,949 | −5.0 |
Dual-energy X-ray absorptiometry scans were performed using a GE Lunar Prodigy system.
However, body composition assessment revealed a disproportionate loss of lean mass, with a resultant total percent body fat increase. This imbalance between the change in fat and lean mass could lead to clinical sarcopenia unless appropriate dietary and exercise measures are taken. Such subtle developing imbalances in body composition could only be quantitated using DXA total body scans.
Continue to: It is not uncommon...
CASE STUDY: WEIGHT CHANGE IN A RECREATIONAL ATHLETE
It is not uncommon to encounter patients who have substantial weight changes as a result of lifestyle changes, such as dieting. It is also possible that body weight remains stable, but variable changes occur in the amount and distribution of fat and lean mass. Combining exercise with dieting is more likely to be associated with preservation or gain of lean mass. Such a case is presented. After a knee injury, a club tennis player reported gaining 30 lb in the subsequent 12 months. She enrolled in a DXA study, and serial body composition assessments were performed as she started a diet program and exercised on a treadmill and stationary bike. Table 3 shows body composition changes from baseline.
Table 3. Body Composition Changes After Dieting and Exercise
|
|
| Total Body | ||
| Weight, lb | Body Mass Index | Bone Mineral Density, g/cm2 | Fat, g | Lean, g |
Baseline | 160 | 27.5 | 1.245 | 29,023 | 39,610 |
12-month follow-up | 148 | 25.4 | 1.230 | 22,581 | 41,979 |
Dual-energy X-ray absorptiometry scans were performed using a GE Lunar Prodigy system.
Although gross weight using a scale clearly showed progress in losing weight, it did not provide information about redistribution of fat and lean mass. The DXA body composition assessment showed that at follow up, there was a 22% decrease in total grams of fat and a 6% increase in lean mass (changes were uniform over different body regions). Her BMI still categorized her as being overweight; however, her body composition changes demonstrated that diet and exercise were producing positive results.
CONCLUSION
There are many ways in which DXA technology could provide orthopedists with valuable baseline and postoperative and post-treatment information about their patients. This technology could be used more effectively by orthopedists in both general clinical practice and research.
1. Miller PD. The history of bone densitometry. Bone. 2017;104:4-6 [Epub ahead of print].
2. Blake GM, Fogelman I. Technical principles of dual energy X ray absorptiometry. Semin Nucl Med. 1997;27(3):210-228.
3. Faulkner KG. The tale of the T-score: review and perspective. Osteoporo Int. 2005;16(4):347-352. doi:10.1007/s00198-004-1779-y.
4. Solomou G, Damilakis J. Radiation exposure in bone densitometry. Semin Musculoskelet Radiol. 2016;20(4):392-398. doi:10.1055/s-0036-1592430.
5. Adams J. Bone densitometry in children. Semin Musculoskelet Radiol. 2016;20(3):254-268. doi:10.1055/s-0036-1592369.
6. Duan Y, Parfitt AM, Seeman E. Vertebral bone mass, size, and volumetric density in women with spinal fractures. J Bone Miner Res. 1999;14(10):1796-1802. doi:10.1359/jbmr.1999.14.10.1796.
7. Szaulc P, Munoz F, Duboeuf F, Delmas PD. Low width of tubular bones is associated with increased risk of fragility fracture in elderly men–the MINOS study. Bone 2006;38(4):595-602. doi:10.1016/j.bone.2005.09.004.
8. Mi J, Li K, Zhao X, Zhao CQ, Li H, Zhao J. Vertebral body compressive strength evaluated by dual-energy x-ray absorptiometry and Hounsfield units in vitro. J Clin Densitom. 2018;21(1):148-153. doi:10.1016/j.jocd.2016.08.011.
9. Ambrose CG, Kiebzak GM, Sabonghy EP, et al. Biomechanical testing of cadaveric specimens: importance of bone mineral density assessment. Foot Ankle Int. 2002;23(9):850-855. doi:10.1177/107110070202300913.
10. Kiebzak G, Sassard WR. Smaller radius width in women with distal radius fractures compared to women without fractures. Cureus. 2017;9(12):e1950. doi:10.775/cureus.1950.
11. Krappinger D, Bizzotto N, Riedmann S, Kammerlander C, Hengg C, Kralinger FS. Predicting failure after surgical fixation of proximal humerus fractures. Injury 2011;42(11):1283-1288. doi:10.1016/j.injury.2011.01.017.
12. Suhm N, Hengg C, Schwyn R, Windolf M, Quarz V, Hänni M. Mechanical torque measurement predicts load to implant cut-out: a biomechanical study investigating DHS anchorage in femoral heads. Arch Orthop Trauma Surg. 2007;127(6):469-474. doi:10.1007/s00402-006-0265-8.
13. Persiani P, Ranaldi FM, Graci J, et al. Isolated olecranon fractures in children affected by osteogenesis imperfecta type I treated with single screw or tension band wiring system: outcomes and pitfalls in relation to bone mineral density. Medicine (Baltimore). 2017;96(20):e6766. doi:10.1097/MD.0000000000006766.
14. Andersen MR, Winther NS, Lind T, Schrøder HM, Flivik G, Petersen MM. Low preoperative BMD is related to high migration of tibia components in uncemented TKA–92 patients in a combined DEXA and RSA study with 2-year follow-up. J Arthroplasty. 2017;32(7):2141-2146. doi:10.1016/j.arth.2017.02.032.
15. Yip BH, Yu FW, Wang Z, et al. Prognostic value of bone mineral density on curve progression: A longitudinal cohort study of 513 girls with adolescent idiopathic scoliosis. Sci Rep. 2016;6:39220. doi:10.1038/srep39220.
16. Pourabbas Tahvildari B, Erfani MA, Nouraei H, Sadeghian M. Evaluation of bone mineral status in adolescent idiopathic scoliosis. Clin Orthop Surg. 2014;6(2):180-184. doi:10.4055/cios.2014.6.2.180.
17. Li XF, Li H, Liu ZD, Dai LY. Low bone mineral status in adolescent idiopathic scoliosis. Eur Spine J. 2008;17(11):1431-1440. doi:10.1007/s00586-008-0757-z.
18. Venesmaa PK, Kröger HP, Miettinen HJ, Jurvelin JS, Suomalainen OT, Alhava EM. Monitoring of periprosthetic BMD after uncemented total hip arthroplasty with dual-energy X-ray absorptiometry--a 3-year follow-up study. J Bone Miner Res. 2001;16(6):1056-1061. doi:10.1359/jbmr.2001.16.6.1056.
19. Arabmotlagh M, Pilz M, Warzecha J, Rauschmann M. Changes of femoral periprosthetic bone mineral density 6 years after treatment with alendronate following total hip arthroplasty J Orthop Res. 2009;27(2):183-188. doi:10.1002/jor.20748.
20. Gruen TA, McNeice GM, Amstutz HC. Modes of failure of cemented stem-type femoral components: a radiographic analysis of loosening. Clin Orthop Relat Res. 1979;(141):17-27.
21. Zeytinoglu M, Jain RK, Vokes TJ. Vertebral fracture assessment: Enhancing the diagnosis, prevention, and treatment of osteoporosis. Bone. 2017;104:54-65. doi:10.1016/j.bone.2017.03.004.
22. Kiebzak GM. Radiolucent casting tape allows for accurate measurement of forearm bone mineral density using dual-energy X-ray absorptiometry. J Clin Densitom. 1998;1(4):369-374.
23. Sung KH, Chung CY, Lee KM, et al. Correlation between central and peripheral bone mineral density around the elbow measured by dual-energy x-ray absorptiometry in healthy children and adolescents. J Clin Densitom. 2017;20(1):114-119. doi:10.1016/j.jocd.2016.04.007.
24. Hamdy R, Kiebzak GM, Seier E, Watts NB. The prevalence of significant left-right differences in hip bone mineral density. Osteoporos Int. 2006;17(12):1772-1780. doi:10.1007/s00198-006-0192-0.
25. Kelly TL, Berger N, Richardson TL. DXA body composition: Theory and practice. Appl Radiat Isot. 1998;49(5-6):511-513.
26. Kiebzak GM, Leamy LJ, Pierson LM, Nord RH, Zhang ZY. Measurement precision of body composition variables using the lunar DPX-L densitometer. J Clin Densitom. 2000;3(1):35-41.
27. Bilborough JC, Greenway k, Par D, Coutts AJ. The accuracy and precision of DXA for assessing body composition in team sport athletes. J Sports Sci. 2014;32(19):1821-1828. doi:10.1080/02640414.2014.926380.
28. Malkov S, Cawthon PM, Peters KW, et al. Health ABC Study. Hip fractures risk in older men and women associated with DXA-derived measures of thigh subcutaneous fat thickness, cross-sectional muscle area, and muscle density. J Bone Miner Res. 2015;30(8):1414-1421. doi:10.1002/jbmr.2469.
29. Arangio GA, Chen C, Klady M, Reed JF. Thigh muscle size and strength after anterior cruciate ligament reconstruction and rehabilitation. J Orthop Sports Phys Ther. 1997;26(5):238-245. doi:10.2519/jospt.1997.26.5.238.
30. Ledford CK, Millikan PD, Nickel BT, et al. Percent body fat Is more predictive of function after total joint arthroplasty than body mass index. J Bone Joint Surg. 2016;98(10):849-857. doi:10.2106/JBJS.15.00509.
31. Berlet G, Kiebzak GM, Dandar A, et al. Prospective analysis of body composition and SF36 profiles in professional dancers over a 7-month season: is there a correlation to injury? J Dance Med Sci. 2002;6(2):54-61.
32. Grant JA, Bedi A, Kurz J, Bancroft R, Gagnier JJ, Miller BS. Ability of preseason body composition and physical fitness to predict the risk of injury in male collegiate hockey players. Sports Health. 2015;7(1):45-51. doi:10.1177/1941738114540445.
33. Stewart AD, Hannan J. Subregional tissue morphometry in male athletes and controls using DXA. Int J Sport Nutr Exerc Metab. 2000;10(2):157-169. doi:10.1123/ijsnem.10.2.157.
34. Sannicandro I, Cofano G, Rosa RA, Piccinno A. Balance training exercises decrease lower-limb strength asymmetry in young tennis players. J Sports Sci Med. 2014;13(2):397-402.
35. Guglielmi G, Ponti F, Agostini M, Amadori M, Battista G, Bazzocchi A. The role of DXA in sarcopenia. Aging Clin Exp Res. 2016;28(6):1047-1060. doi:10.1007/s40520-016-0589-3.
36. Janssen I, Baumgartner RN, Ross R, Rosenberg IH, Roubenoff R. Skeletal muscle cutpoints associated with elevated physical disability risk in older men and women. Am J Epidemiol. 2004;159(4):413-421.
37. Landi F, Calvani R, Ortolani E, et al. The association between sarcopenia and functional outcomes among older patients with hip fracture undergoing in-hospital rehabilitation. Osteoporos Int. 2017;28(5):1569-1576. doi:10.1007/s00198-017-3929-z.
38. Roh YH, Noh JH, Gong HS, Baek GH. Effect of low appendicular lean mass, grip strength, and gait speed on the functional outcome after surgery for distal radius fractures. Arch Osteoporos. 2017;12(1):41. doi:10.1007/s11657-017-0335-2.
39. Miller MS, Callahan DM, Toth MJ. Skeletal muscle myofilament adaptations to aging, disease, and disuse and their effects on whole muscle performance in older adult humans. Front Physiol. 2014;5:369. doi:10.3389/fphys.2014.00369.
40. Waters DJ, Baumgartner RN. Sarcopenia and obesity. Clin Geriatr Med. 2011;27(3):401-421. doi:10.1016/j.cger.2011.03.007.
41. Bachrach LK, Gordon CM. Bone densitometry in children and adolescents. Pediatrics. 2016;138(4):e20162398. doi:10.1542/peds.2016-2398.
ABSTRACT
Dual-energy X-ray absorptiometry (DXA) is a well-established technology with an important and well-known role in measuring bone mineral density (BMD) for the purpose of determining fracture risk, diagnosing osteoporosis, and monitoring treatment efficacy. However, aside from the assessment of bone status, DXA is likely underutilized in the field of orthopedics, and most orthopedists may not be aware of the full capabilities of DXA, particularly with regard to total body scans and body composition assessment. For example, DXA would be a valuable tool for monitoring body composition after surgery where compensatory changes in the affected limb may lead to right-left asymmetry (eg, tracking lean mass change after knee surgery), rehabilitation regimens for athletes, congenital and metabolic disorders that affect the musculoskeletal system, or monitoring sarcopenia and frailty in the elderly. Furthermore, preoperative and postoperative regional scans can track BMD changes during healing or alert surgeons to impending problems such as loss of periprosthetic bone, which could lead to implant failure. This article discusses the capabilities of DXA and how this technology could be better used to the advantage of the attending orthopedist.
Dual-energy X-ray absorptiometry, abbreviated as “DXA,” (although usually abbreviated in older literature as “DEXA”) was first introduced in 1987 (Hologic QDR-1000 system, Hologic, Inc) and immediately made all previous forms of radiation-based bone mineral density (BMD) measurement systems obsolete.1 Since then, there have been many generations of the technology, with the main US manufacturers in 2017 being Hologic, Inc. and GE Lunar. There are 2 forms of DXA, peripheral systems (which usually measure BMD only in the radius, finger bones, or calcaneus) and central systems (which measure the radius, proximal femur [“hip”], lumbar spine, total body, and custom sites). The general principle of how DXA works is based on the differential attenuation of photons by bone, fat, and lean mass.2 The DXA technique uses a low- and high-energy X-ray beam produced by an X-ray tube. With the low-energy beam, attenuation by bone is greater than attenuation by soft tissue. With the high-energy beam, attenuation by bone and soft tissues are similar. The dual X-ray beams are passed through the body regions being scanned (usually posterioanteriorly), and the differential attenuation by bone and soft tissue is analyzed to produce BMD estimates. In addition, a high-quality image is produced to enable the operator of the DXA system to verify that the appropriate body region was scanned. It is important to realize that DXA is 2-dimensional (which is sometimes cited as a weakness of DXA), and the units of BMD are grams of mineral per centimeter squared (g/cm2).
Continue to: When assessing bone status...
When assessing bone status for the purpose of determining if a patient is normal, osteopenic, or osteoporotic, the skeletal sites (called regions of interest [ROI]) typically scanned are the proximal femur, lumbar spine, and radius. The BMD of the patient is then compared to a manufacturer-provided normative database of young adults (the logic being that the BMD in the young adult normative population represents maximal peak bone mass). Total body BMD and body composition can also be quantified (grams of lean and fat mass), and custom scans can be designed for other skeletal sites. Specifically, a patient’s BMD is compared to a database of sex- and age-adjusted normal values, and the deviation from normal is expressed as a T-score (the number of standard deviations the patient's BMD is above or below the average BMD of the young adult reference population) and Z-scores (the number of standard deviations a patient's BMD is above or below the average BMD of a sex- and age-matched reference population).3 The International Society for Clinical Densitometry (ISCD) has developed and published well-accepted guidelines used to assist in acquiring high-quality DXA scans and for the diagnosis of osteoporosis using BMD. The accuracy and, especially, the precision of DXA scans can be remarkable when they are performed by trained technologists, and thus, serial scans can be performed to monitor BMD and body composition changes with aging or in response to treatment.
Because of the nature of the scan mechanics and speed, the effective radiation dose with DXA is very low, expressed in microSieverts.4,5 Generally, the radiation exposure from a series of the lumbar spine, proximal femur, and distal radius is about the same as daily background radiation. Even total body scans present very low exposure due to the scan speed at which any 1 body part is exposed for only a fraction of a second.
BENEFITS OF USING DXA FOR THE ORTHEOPEDIST
At the time of this writing in 2018, the presumption could be made that most physicians in the specialties of internal medicine, rheumatology, endocrinology, radiology, and orthopedics were familiar with the capabilities of DXA to assess BMD for the purpose of diagnosing osteoporosis. However, DXA is likely underused for other purposes, as orthopedists may be unaware of the full capabilities of DXA. Printouts after a scan contain more information than simply BMD, and there are more features and applications of DXA that can potentially be useful to orthopedists.
BONE SIZE
Data from a DXA scan are expressed not only as g/cm2 (BMD) but also as total grams in the ROI (known as bone mineral content, abbreviated as BMC), and cm2 (area of the ROI). These data may appear on a separate page, being considered ancillary results. The latter 2 variables are rarely included on a report sent to a referring physician; therefore, awareness of their value is probably limited. However, there are instances where such information could be valuable when interpreting results, especially bone size.6,7 For example, on occasion, patients present with osteopenic lumbar vertebrate but larger than normal vertebral size (area). Many studies have shown that bone size is directly related to bone strength and thus fracture risk.8,9 Although an understudied phenomenon, large vertebral body size could be protective, counteracting a lower than optimal BMD. Further, because the area of the ROI is measured, it is possible to calculate the bone width (or measure directly with a ruler tool in the software if available) for the area measured. This is especially feasible for tubular bones such as the midshaft of the radius, or more specifically, the classic DXA ROI being the area approximately one third the length of the radius from the distal end, the radius 33% region (actually based on ulna length). Consequently, it is possible to use the width of the radius 33% ROI in addition to BMD and T-score when assessing fracture risk.
CASE STUDY
A 60-year-old man had a DXA series of the lumbar spine, proximal femur, and whole body. His total body T-score was 0.6 (normal), and his total proximal femur T-score was −0.8 (normal), but his lumbar spine vertebrae 2 to 4 T-score was −1.9. As the patient was osteopenic based on the lumbar spine T-score, some physicians may have initiated antiresorptive therapy, especially if other risk factors for fracture were present. Further examination of the ancillary results of the DXA scan revealed that the vertebral body height T-score was a remarkable 1.11 and 1.53 after adjustment for stature (automatic software calculation). These results suggested that the patient had vertebral bodies of above average size, which theoretically would be protective against fracture even though the BMD T-score was below normal. For this patient, this finding mitigated immediate concern about the lumbar spine T-score of −1.9. Although vertebral body size is not typically used in assessing fracture risk, it is useful information that could be factored into the decision to start treatment or watch for further change with aging.
Continue to: Case Series: Distal Radius Fractures...
CASE SERIES: DISTAL RADIUS FRACTURES
Table 1 summarizes the data comparing radius 33% ROI T-scores and ROI width in patients who fractured the contralateral radius and normal nonfractured controls.10
Table 1. Comparison of Radius Width at the 33% Region of Interest (ROI) and Bone Mineral Density T-Scores in Premenopausal Women With and Without Fractures
| 33% ROI T-score | Width of ROI, cm |
White women with distal radius fractures |
|
|
Premenopausal (<49 years), n = 36 | -0.2 + 0.9 | 1.22 + 0.11a |
Controls matched for race, age, BMIb |
|
|
Premenopausal (<49 years), n = 65 | -0.1 + 0.8 | 1.45 + 0.25 |
For premenopausal women with distal radius fractures, the width of the radius at the radius 33% ROI was significantly smaller than that in controls. However, there was no difference in T-scores between premenopausal women with distal radius fractures and controls. Thus, bone width more accurately identified women with fractures than T-scores based on BMD, and the orthopedist could use bone size in addition to BMD to predict fracture risk in a patient.
PREPARATION FOR SURGERY
For some procedures, there is potential benefit of assessing bone status prior to surgery. That is, determination of low BMD could potentially influence the type of hardware or fixation techniques used in surgery. Various studies have shown that poor bone quality and low BMD can impair purchase with various types of fixation.11-13 Low preoperative BMD has been shown to be related to high implant migration.14 Knowledge of BMD could influence the choice of screw type used or the type of implant metal (titanium vs cobalt chrome). Another example is predicting the risk of spine curvature progression in adolescent idiopathic scoliosis.15-17 It has been reported that low BMD is a risk factor for progression.15 Knowledge of BMD could potentially help with patient management strategies. For example, a patient with low BMD and vitamin D deficiency could be treated (vitamin D supplementation) prior to planning surgery in an effort to improve the low BMD.
PERIOPROSTHETIC BMD
It is possible to monitor changes in BMD around implants using the periprosthetic software application (this usually needs to be purchased separately from standard software that is installed with a system set-up). Dramatic loss of bone due to stress shielding after total hip arthroplasty (THA) can be a risk factor for implant migration or potentially outright failure of fixation or breakthrough. If bone loss occurs and is observed in the early stages, then antiresorptive treatment can be initiated to limit further loss.18,19 (Figure 1) shows the image from a periprosthetic scan.
Continue to: A 60-year-old, 215-lb man...
CASE REPORT
A 60-year-old, 215-lb man had a total hip replacement using a newly introduced cemented collared cobalt-chromium alloy femoral stem. A baseline periprosthetic DXA scan was performed 6 weeks postoperatively. Compared to baseline, the change in BMD in the Gruen zone 5 was −8.2%, +6.5%, +4.9%, and +9.46% at 3, 6, 12, and 24 months, respectively. In contrast, dramatic BMD loss was seen in Gruen zone 7 (calcar region): −33.2%, −40.8%, −37.1%, and −34.1% at 3, 6, 12, and 24 months, respectively. Similar findings in other patients led to discontinuation of use of this stem in favor of a collarless stem in which less BMD loss was seen in Gruen zone 7. Although additional technologist training is required and scans may not be reimbursable, for research purposes or for evaluating new component prototypes, the periprosthetic DXA scan capability can be useful.
Various other custom scans can be used to detect and quantify vertebral fractures (vertebral fracture assessment application), monitor healing of fractures by scanning through radiolucent cast materials, or for research purposes to assess BMD at unusual locations.21-23 Other new innovations, such as the ability to perform full-length scans of the femoral shaft and to quantify focal thickening of the lateral cortex to identify beaking, an abnormality associated with atypical femur fracture after long-term bisphosphonate use, continue to expand the utility of DXA. Using standard software, cadaver bones can be scanned prior to biomechanical testing for a variety of purposes, such as ensuring proper matching specimens in test groups. It has been reported that the common practice of using contralateral bone specimens can lead to bias, as the BMD can be significantly different in right and left bones from the same individual.9,24
TOTAL BODY BMD AND BODY COMPOSITION SCANS
Perhaps the least understood capability of DXA from our experience working with orthopedists is the ability to perform total body scans and to obtain not only total body and regional BMD but also body composition data, namely grams of lean and fat mass.25 Soft tissue (no bone pixels) is partitioned into fat and lean body mass by a calibration procedure (lean mass = total soft tissue –fat mass). DXA has become the standard for body composition assessment given the ease of data acquisition (a total body scan takes only a few minutes), accuracy, and precision of measurements. Compared with other methods (eg, skinfold thickness, bioelectrical impedance, and underwater weighing), it is the only method that gives regional values for fat mass, lean mass, and BMC (this allows the ability to compare left vs right sides).25-27 The ability to perform regional measurements cannot be overstated, as stable body weight belies potential changes with age and disease that relate to redistribution of fat and lean mass. It is not possible to identify, let alone track, such changes by measuring gross body weight on a scale or with BMI calculations. However, redistribution of fat and lean mass can be monitored in great detail using DXA. Figures 2 and 3 show the typical output from a DXA total body/body composition scan.
Total body scans with body composition analyses have many applications. For example, monitoring growth and development or treatment in patients with congenital deformity, metabolic bone disease, osteoporosis, and frailty; patients undergoing rehabilitation; and patients having surgery that could affect the use of a contralateral limb with potential hypertrophy or atrophy. Accurate assessment of percent body fat and fat distribution may help surgeons to improve risk stratification and surgical outcome.28-30 Fracture risk has been associated with muscle area.28 Simple measurements of quadriceps size underestimates atrophy, and total body composition can quantitate lean mass.30
In sports medicine, body composition assessments could be useful to monitor postoperative recovery and effectiveness of rehabilitation protocols after injury, effectiveness of conditioning and training programs, developmental changes due to sports participation, and for obtaining baseline assessment at the time of preseason physicals.27,31-34 In athletes, baseline status and morphological adaptations to training have traditionally been measured by anthropometry (eg, skinfold thickness, BMI, limb circumference, etc.), but DXA total body scanning allows for much more detailed assessments with the possibility of subregional quantitation. There is evidence for sports-specific body composition profiles and characteristic adaptations.27,31-34 Using DXA, adaptive changes as a result of training as well as changes and recovery after surgery or injury can be monitored. For example, quadriceps atrophy usually occurs to some extent after ACL repair, and bone mineral loss and muscle atrophy occur after a limb has been immobilized with a cast. DXA body composition assessment could be used to monitor leg lean mass after surgery for comparison with presurgery values or those of the contralateral noninjured side, or to track recovery of bone mineral and muscle after a cast is removed. Some technical sports, such as tennis and baseball pitching, are known to result in limb asymmetry; DXA body composition could be used to monitor development of right-left arm asymmetry in tennis players or baseball pitchers, and then measures could be taken to balance the asymmetry. Wrestlers and elite dancers are expected to maintain strict weight requirements, but diets are often poor, and as such, DXA body composition could be used to track the effects of dieting and training by comparing serial measurements to baseline to ensure that weight changes include preservation or gain of muscle mass.31
Continue to: For older patients...
For older patients being followed after orthopedic care, there is a growing concern about age-related loss of muscle mass, or sarcopenia, which can lead to functional impairment (eg, balance, gait, etc.), and physical disability leading to falling and increased risk of fracture.35-40 Even obese patients can be sarcopenic (a concept known as sarcopenic obesity), and their large body mass can mask the relative deficiency of lean mass.40 DXA total body scans can be used to monitor patients at risk for sarcopenia.
Finally, DXA total body composition scans are underused in the pediatric population. Given the low radiation burden, DXA can be used safely in children of all ages. In addition to the same uses as in adults for presurgical assessment, monitoring bone and soft-tissue changes after treatment and rehabilitation, scans can be used to monitor growth and development.41
CASE STUDY: MONITORING DEVELOPMENT AND TREATMENT
A 12-year-old boy with polyostotic fibrous dysplasia (McCune Albright Syndrome) was started on treatment with cyclic pamidronate to mitigate bone pain and reduce fracture risk. Use of DXA was planned to provide evidence of treatment efficacy by documenting increasing BMD. However, the severe skeletal deformity prevented standard site-specific DXA scans, and consequently, total body scans were effectively used to acquire the BMD data needed to monitor treatment (Figure 4).
CASE STUDY: AGE-RELATED SARCOPENIA
Figure 5 shows images of a 64-year-old woman who was followed after a distal radius fracture. A total body scan and body composition assessment was performed in 2002. At follow-up in 2004, total body weight seemed stable with only a seemingly benign 5.1-lb loss of weight, and the patient’s overall physical appearance was unchanged (Table 2).
Table 2. Age-Related Changes Potentially Leading to Sarcopenia
| Baseline, 2002 | Follow-up, 2004 | Change, % |
Body weight, kg | 57.9 (127.6 lb) | 55.6 (122.5 lb) | 4 |
BMI | 20.6 | 19.8 |
|
Total body fat, g | 13,619 | 13,390 | −1.7 |
Total body percent fat | 23.5 | 24.1 |
|
Total body lean, g | 42,038 | 39,949 | −5.0 |
Dual-energy X-ray absorptiometry scans were performed using a GE Lunar Prodigy system.
However, body composition assessment revealed a disproportionate loss of lean mass, with a resultant total percent body fat increase. This imbalance between the change in fat and lean mass could lead to clinical sarcopenia unless appropriate dietary and exercise measures are taken. Such subtle developing imbalances in body composition could only be quantitated using DXA total body scans.
Continue to: It is not uncommon...
CASE STUDY: WEIGHT CHANGE IN A RECREATIONAL ATHLETE
It is not uncommon to encounter patients who have substantial weight changes as a result of lifestyle changes, such as dieting. It is also possible that body weight remains stable, but variable changes occur in the amount and distribution of fat and lean mass. Combining exercise with dieting is more likely to be associated with preservation or gain of lean mass. Such a case is presented. After a knee injury, a club tennis player reported gaining 30 lb in the subsequent 12 months. She enrolled in a DXA study, and serial body composition assessments were performed as she started a diet program and exercised on a treadmill and stationary bike. Table 3 shows body composition changes from baseline.
Table 3. Body Composition Changes After Dieting and Exercise
|
|
| Total Body | ||
| Weight, lb | Body Mass Index | Bone Mineral Density, g/cm2 | Fat, g | Lean, g |
Baseline | 160 | 27.5 | 1.245 | 29,023 | 39,610 |
12-month follow-up | 148 | 25.4 | 1.230 | 22,581 | 41,979 |
Dual-energy X-ray absorptiometry scans were performed using a GE Lunar Prodigy system.
Although gross weight using a scale clearly showed progress in losing weight, it did not provide information about redistribution of fat and lean mass. The DXA body composition assessment showed that at follow up, there was a 22% decrease in total grams of fat and a 6% increase in lean mass (changes were uniform over different body regions). Her BMI still categorized her as being overweight; however, her body composition changes demonstrated that diet and exercise were producing positive results.
CONCLUSION
There are many ways in which DXA technology could provide orthopedists with valuable baseline and postoperative and post-treatment information about their patients. This technology could be used more effectively by orthopedists in both general clinical practice and research.
1. Miller PD. The history of bone densitometry. Bone. 2017;104:4-6 [Epub ahead of print].
2. Blake GM, Fogelman I. Technical principles of dual energy X ray absorptiometry. Semin Nucl Med. 1997;27(3):210-228.
3. Faulkner KG. The tale of the T-score: review and perspective. Osteoporo Int. 2005;16(4):347-352. doi:10.1007/s00198-004-1779-y.
4. Solomou G, Damilakis J. Radiation exposure in bone densitometry. Semin Musculoskelet Radiol. 2016;20(4):392-398. doi:10.1055/s-0036-1592430.
5. Adams J. Bone densitometry in children. Semin Musculoskelet Radiol. 2016;20(3):254-268. doi:10.1055/s-0036-1592369.
6. Duan Y, Parfitt AM, Seeman E. Vertebral bone mass, size, and volumetric density in women with spinal fractures. J Bone Miner Res. 1999;14(10):1796-1802. doi:10.1359/jbmr.1999.14.10.1796.
7. Szaulc P, Munoz F, Duboeuf F, Delmas PD. Low width of tubular bones is associated with increased risk of fragility fracture in elderly men–the MINOS study. Bone 2006;38(4):595-602. doi:10.1016/j.bone.2005.09.004.
8. Mi J, Li K, Zhao X, Zhao CQ, Li H, Zhao J. Vertebral body compressive strength evaluated by dual-energy x-ray absorptiometry and Hounsfield units in vitro. J Clin Densitom. 2018;21(1):148-153. doi:10.1016/j.jocd.2016.08.011.
9. Ambrose CG, Kiebzak GM, Sabonghy EP, et al. Biomechanical testing of cadaveric specimens: importance of bone mineral density assessment. Foot Ankle Int. 2002;23(9):850-855. doi:10.1177/107110070202300913.
10. Kiebzak G, Sassard WR. Smaller radius width in women with distal radius fractures compared to women without fractures. Cureus. 2017;9(12):e1950. doi:10.775/cureus.1950.
11. Krappinger D, Bizzotto N, Riedmann S, Kammerlander C, Hengg C, Kralinger FS. Predicting failure after surgical fixation of proximal humerus fractures. Injury 2011;42(11):1283-1288. doi:10.1016/j.injury.2011.01.017.
12. Suhm N, Hengg C, Schwyn R, Windolf M, Quarz V, Hänni M. Mechanical torque measurement predicts load to implant cut-out: a biomechanical study investigating DHS anchorage in femoral heads. Arch Orthop Trauma Surg. 2007;127(6):469-474. doi:10.1007/s00402-006-0265-8.
13. Persiani P, Ranaldi FM, Graci J, et al. Isolated olecranon fractures in children affected by osteogenesis imperfecta type I treated with single screw or tension band wiring system: outcomes and pitfalls in relation to bone mineral density. Medicine (Baltimore). 2017;96(20):e6766. doi:10.1097/MD.0000000000006766.
14. Andersen MR, Winther NS, Lind T, Schrøder HM, Flivik G, Petersen MM. Low preoperative BMD is related to high migration of tibia components in uncemented TKA–92 patients in a combined DEXA and RSA study with 2-year follow-up. J Arthroplasty. 2017;32(7):2141-2146. doi:10.1016/j.arth.2017.02.032.
15. Yip BH, Yu FW, Wang Z, et al. Prognostic value of bone mineral density on curve progression: A longitudinal cohort study of 513 girls with adolescent idiopathic scoliosis. Sci Rep. 2016;6:39220. doi:10.1038/srep39220.
16. Pourabbas Tahvildari B, Erfani MA, Nouraei H, Sadeghian M. Evaluation of bone mineral status in adolescent idiopathic scoliosis. Clin Orthop Surg. 2014;6(2):180-184. doi:10.4055/cios.2014.6.2.180.
17. Li XF, Li H, Liu ZD, Dai LY. Low bone mineral status in adolescent idiopathic scoliosis. Eur Spine J. 2008;17(11):1431-1440. doi:10.1007/s00586-008-0757-z.
18. Venesmaa PK, Kröger HP, Miettinen HJ, Jurvelin JS, Suomalainen OT, Alhava EM. Monitoring of periprosthetic BMD after uncemented total hip arthroplasty with dual-energy X-ray absorptiometry--a 3-year follow-up study. J Bone Miner Res. 2001;16(6):1056-1061. doi:10.1359/jbmr.2001.16.6.1056.
19. Arabmotlagh M, Pilz M, Warzecha J, Rauschmann M. Changes of femoral periprosthetic bone mineral density 6 years after treatment with alendronate following total hip arthroplasty J Orthop Res. 2009;27(2):183-188. doi:10.1002/jor.20748.
20. Gruen TA, McNeice GM, Amstutz HC. Modes of failure of cemented stem-type femoral components: a radiographic analysis of loosening. Clin Orthop Relat Res. 1979;(141):17-27.
21. Zeytinoglu M, Jain RK, Vokes TJ. Vertebral fracture assessment: Enhancing the diagnosis, prevention, and treatment of osteoporosis. Bone. 2017;104:54-65. doi:10.1016/j.bone.2017.03.004.
22. Kiebzak GM. Radiolucent casting tape allows for accurate measurement of forearm bone mineral density using dual-energy X-ray absorptiometry. J Clin Densitom. 1998;1(4):369-374.
23. Sung KH, Chung CY, Lee KM, et al. Correlation between central and peripheral bone mineral density around the elbow measured by dual-energy x-ray absorptiometry in healthy children and adolescents. J Clin Densitom. 2017;20(1):114-119. doi:10.1016/j.jocd.2016.04.007.
24. Hamdy R, Kiebzak GM, Seier E, Watts NB. The prevalence of significant left-right differences in hip bone mineral density. Osteoporos Int. 2006;17(12):1772-1780. doi:10.1007/s00198-006-0192-0.
25. Kelly TL, Berger N, Richardson TL. DXA body composition: Theory and practice. Appl Radiat Isot. 1998;49(5-6):511-513.
26. Kiebzak GM, Leamy LJ, Pierson LM, Nord RH, Zhang ZY. Measurement precision of body composition variables using the lunar DPX-L densitometer. J Clin Densitom. 2000;3(1):35-41.
27. Bilborough JC, Greenway k, Par D, Coutts AJ. The accuracy and precision of DXA for assessing body composition in team sport athletes. J Sports Sci. 2014;32(19):1821-1828. doi:10.1080/02640414.2014.926380.
28. Malkov S, Cawthon PM, Peters KW, et al. Health ABC Study. Hip fractures risk in older men and women associated with DXA-derived measures of thigh subcutaneous fat thickness, cross-sectional muscle area, and muscle density. J Bone Miner Res. 2015;30(8):1414-1421. doi:10.1002/jbmr.2469.
29. Arangio GA, Chen C, Klady M, Reed JF. Thigh muscle size and strength after anterior cruciate ligament reconstruction and rehabilitation. J Orthop Sports Phys Ther. 1997;26(5):238-245. doi:10.2519/jospt.1997.26.5.238.
30. Ledford CK, Millikan PD, Nickel BT, et al. Percent body fat Is more predictive of function after total joint arthroplasty than body mass index. J Bone Joint Surg. 2016;98(10):849-857. doi:10.2106/JBJS.15.00509.
31. Berlet G, Kiebzak GM, Dandar A, et al. Prospective analysis of body composition and SF36 profiles in professional dancers over a 7-month season: is there a correlation to injury? J Dance Med Sci. 2002;6(2):54-61.
32. Grant JA, Bedi A, Kurz J, Bancroft R, Gagnier JJ, Miller BS. Ability of preseason body composition and physical fitness to predict the risk of injury in male collegiate hockey players. Sports Health. 2015;7(1):45-51. doi:10.1177/1941738114540445.
33. Stewart AD, Hannan J. Subregional tissue morphometry in male athletes and controls using DXA. Int J Sport Nutr Exerc Metab. 2000;10(2):157-169. doi:10.1123/ijsnem.10.2.157.
34. Sannicandro I, Cofano G, Rosa RA, Piccinno A. Balance training exercises decrease lower-limb strength asymmetry in young tennis players. J Sports Sci Med. 2014;13(2):397-402.
35. Guglielmi G, Ponti F, Agostini M, Amadori M, Battista G, Bazzocchi A. The role of DXA in sarcopenia. Aging Clin Exp Res. 2016;28(6):1047-1060. doi:10.1007/s40520-016-0589-3.
36. Janssen I, Baumgartner RN, Ross R, Rosenberg IH, Roubenoff R. Skeletal muscle cutpoints associated with elevated physical disability risk in older men and women. Am J Epidemiol. 2004;159(4):413-421.
37. Landi F, Calvani R, Ortolani E, et al. The association between sarcopenia and functional outcomes among older patients with hip fracture undergoing in-hospital rehabilitation. Osteoporos Int. 2017;28(5):1569-1576. doi:10.1007/s00198-017-3929-z.
38. Roh YH, Noh JH, Gong HS, Baek GH. Effect of low appendicular lean mass, grip strength, and gait speed on the functional outcome after surgery for distal radius fractures. Arch Osteoporos. 2017;12(1):41. doi:10.1007/s11657-017-0335-2.
39. Miller MS, Callahan DM, Toth MJ. Skeletal muscle myofilament adaptations to aging, disease, and disuse and their effects on whole muscle performance in older adult humans. Front Physiol. 2014;5:369. doi:10.3389/fphys.2014.00369.
40. Waters DJ, Baumgartner RN. Sarcopenia and obesity. Clin Geriatr Med. 2011;27(3):401-421. doi:10.1016/j.cger.2011.03.007.
41. Bachrach LK, Gordon CM. Bone densitometry in children and adolescents. Pediatrics. 2016;138(4):e20162398. doi:10.1542/peds.2016-2398.
TAKE-HOME POINTS
- DXA is underutilized technology in orthopedics.
- More data ("ancillary data") are often available from a DXA scan then typically included in a standard report from a referral center.
- Most orthopedists are likely unaware of the detailed body composition data available with a total body scan.
- Preoperative DXA scans and knowledge of BMD may be informative when planning the type of fixation and implant metal to used.
- Serial follow-up body composition scans can be useful in monitoring the course of bone healing (mineralization) and soft tissue changes (fat and lean mass).
Emergency Imaging: Femoral Pseudoaneurysm
Case
An 84-year-old man, who was a resident at a local nursing home, presented for evaluation after the nursing staff noticed an increasingly swollen mass on the patient’s left groin. The patient’s medical history was significant for bilateral aortofemoral graft surgery, dementia, hypertension, and severe peripheral artery disease (PAD). He was not on any anticoagulation or antiplatelet agents. Due to the patient’s dementia, he was unable to provide a history regarding the onset of the swelling or any other signs or symptoms.
On examination, the patient did not appear in distress. His son, who was the patient’s durable power of attorney, was likewise unable to provide a clear timeframe regarding onset of the mass. The patient had no recent history of trauma and had not undergone any recent medical procedures. Vital signs at presentation were: blood pressure, 110/70 mm Hg; heart rate, 84 beats/min; respiratory rate, 13 breaths/min; and temperature, 98.6°F. Oxygen saturation was 94% on room air.
Clinical examination revealed a pulsatile, purple left groin mass and bruit. The mass was located around the left inguinal ligament and extended down the proximal, inner thigh (Figure 1). There was no drainage or lesions from the mass. Inspection of the patient’s hip demonstrated decreased adduction, limited by the mass; otherwise, there was normal range of motion. The dorsalis pedis and posterior tibial pulses were equal and intact, and the rest of the physical examination was unremarkable.
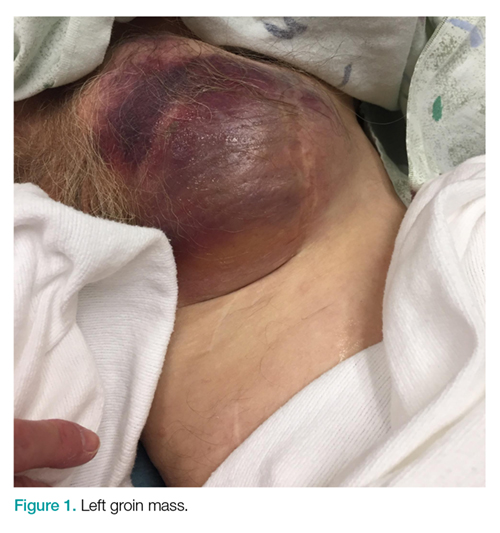
The patient tolerated the examination without focal signs of discomfort. A Doppler ultrasound revealed findings consistent with a common femoral pseudoaneurysm (PSA) (Figure 2). For better visualization and extension, a computed tomography angiogram (CTA) was obtained, which demonstrated a PSA measuring 11.7 x 10.7 x 7.3 cm; there was no active extravasation (Figure 3).
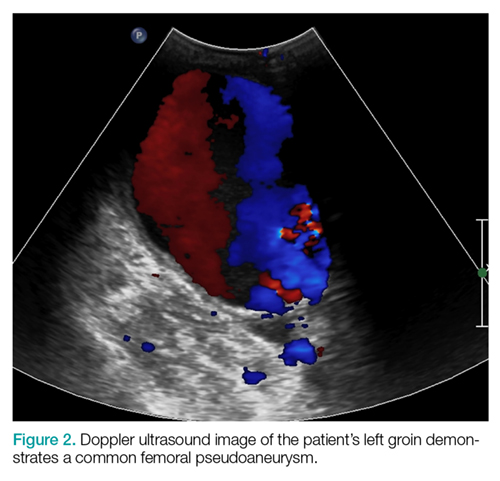
The patient was started on intravenous normal saline while vascular surgery services was consulted for management and repair. After a discussion with the son regarding the patient’s wishes, surgical intervention was refused and the patient was conservatively managed and transitioned to hospice care.
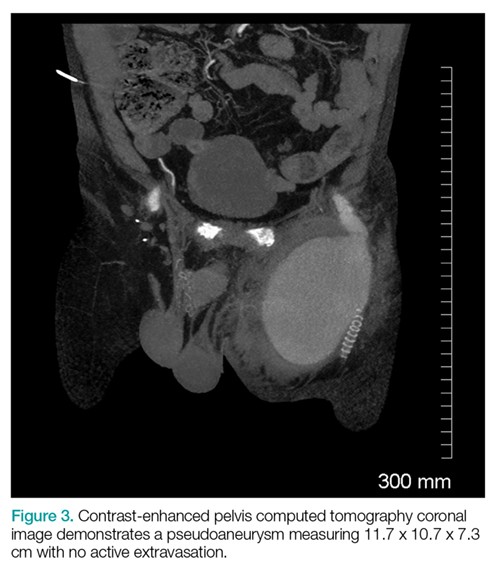
Discussion
A true aneurysm differs from a PSA in that true aneurysms involve all three layers of the vessel wall. A PSA consists partly of the vessel wall and partly of encapsulating fibrous tissue or surrounding tissue.
Etiology
Femoral artery PSAs can be iatrogenic, for example, develop following cardiac catheterization or at the anastomotic site of previous surgery.1 The incidence of diagnostic postcatheterization PSA ranges from 0.05% to 2%, whereas interventional postcatheterization PSA ranges from 2% to 6%.2
With the increasing number of peripheral coronary diagnostics and interventions, emergency physicians should include PSA in the differential diagnosis of patients with a recent or remote history of catheterization or bypass grafts. Less commonly, femoral PSAs are caused by non-surgical trauma or infection (ie, mycotic PSA). Patient risk factors for development of PSA include obesity, hypertension, PAD, and anticoagulation.3 Patients with femoral artery PSAs may present with a painful or painless pulsatile mass. Mass effect of the PSA can compress nearby neurovascular structures, leading to femoral neuropathies or limb edema secondary to venous obstruction.4 Complications of embolization or thrombosis can cause limb ischemia, neuropathy, and claudication, while rupture may present with a rapidly expanding groin hematoma. Additionally, sizeable PSAs can cause overlying skin necrosis.5
Imaging Studies
Diagnosis of a PSA can be made through Doppler ultrasound, which is the preferred imaging modality due to its accuracy, noninvasive nature, and low cost. Doppler ultrasound has been found to have a sensitivity of 94% and specificity of 97% in detecting PSAs. Additional imaging with CTA can provide further definition of vasculopathy.6 Treatment should be considered for patients with a symptomatic femoral PSA, a PSA measuring more than 3 cm, or patients who are on anticoagulation therapy. Studies have shown that observation-only and follow-up may be appropriate for patients with a PSA measuring less than 3 cm. A study by Toursarkissian et al7 found that the majority of PSAs smaller than 3 cm spontaneously resolved in a mean of 23 days without limb-threatening complications.
Treatment
Traditionally, open surgical repair techniques were the only treatment option for PSAs. However, in the early 1990s, the advent of new techniques such as stenting, coil insertion, ultrasound-guided compression, and ultrasound-guided thrombin injection, have developed as alternatives to open surgical repair; there has been variable success to these minimally invasive approaches.5,8
Ultrasound-Guided Compression. A conservative approach to treating PSAs, ultrasound-guided compression requires sustained compression by a skilled physician. This technique is associated with significant discomfort to the patient.5 Ultrasound-Guided Thrombin Injection. This technique is the treatment of choice for postcatheterization PSA. However, this intervention is contraindicated in patients who have concerning features such as an infected PSA, rapid expansion, skin necrosis, or signs of limb ischemia. Additionally, ultrasound-guided thrombin injection is not appropriate for use in patients with a PSA occurring at anastomosis of a synthetic graft and native artery.5
Conclusion
Based on our patient’s clinical presentation and history of aortofemoral bypass surgery, we suspected a femoral PSA. While the PSA noted in our patient was sizeable, imaging studies and clinical examination showed no sign of limb ischemia or rupture.
Femoral PSAs are usually iatrogenic in nature, typically developing shortly after catheterization or a previous bypass surgery. The most serious complication of a PSA is rupture, but a thorough examination of the distal extremity is warranted to assess for limb ischemia as well. Ultrasound imaging is considered the modality of choice based on its high sensitivity and sensitivity for detecting PSAs.
Small PSAs (<3 cm) can be managed medically, but larger PSAs (>3 cm) require treatment. Newer techniques, including stenting, coil insertion, ultrasound-guided compression, and ultrasound-guided thrombin injection are alternatives to open surgical repair of larger, uncomplicated PSAs. However, urgent open surgical repair is the only option when there is evidence of a ruptured PSA, ischemia, or skin necrosis.
1. Faggioli GL, Stella A, Gargiulo M, Tarantini S, D’Addato M, Ricotta JJ. Morphology of small aneurysms: definition and impact on risk of rupture. Am J Surg. 1994;168(2):131-135.
2. Hessel SJ, Adams DF, Abrams HL. Complications of angiography. Radiology. 1981;138(2):273-281. doi:10.1148/radiology.138.2.7455105.
3. Petrou E, Malakos I, Kampanarou S, Doulas N, Voudris V. Life-threatening rupture of a femoral pseudoaneurysm after cardiac catheterization. Open Cardiovasc Med J. 2016;10:201-204. doi:10.2174/1874192401610010201.
4. Mees B, Robinson D, Verhagen H, Chuen J. Non-aortic aneurysms—natural history and recommendations for referral and treatment. Aust Fam Physician. 2013;42(6):370-374.
5. Webber GW, Jang J, Gustavson S, Olin JW. Contemporary management of postcatheterization pseudoaneurysms. Circulation. 2007;115(20):2666-2674. doi:10.1161/CIRCULATIONAHA.106.681973.
6. Coughlin BF, Paushter DM. Peripheral pseudoaneurysms: evaluation with duplex US. Radiology. 1988;168(2):339-342. doi:10.1148/radiology.168.2.3293107.
7. Toursarkissian B, Allen BT, Petrinec D, et al. Spontaneous closure of selected iatrogenic pseudoaneurysms and arteriovenous fistulae. J Vasc Surg. 1997;25(5):803-809; discussion 808-809.
8. Corriere MA, Guzman RJ. True and false aneurysms of the femoral artery. Semin Vasc Surg. 2005;18(4):216-223. doi:10.1053/j.semvascsurg.2005.09.008.
Case
An 84-year-old man, who was a resident at a local nursing home, presented for evaluation after the nursing staff noticed an increasingly swollen mass on the patient’s left groin. The patient’s medical history was significant for bilateral aortofemoral graft surgery, dementia, hypertension, and severe peripheral artery disease (PAD). He was not on any anticoagulation or antiplatelet agents. Due to the patient’s dementia, he was unable to provide a history regarding the onset of the swelling or any other signs or symptoms.
On examination, the patient did not appear in distress. His son, who was the patient’s durable power of attorney, was likewise unable to provide a clear timeframe regarding onset of the mass. The patient had no recent history of trauma and had not undergone any recent medical procedures. Vital signs at presentation were: blood pressure, 110/70 mm Hg; heart rate, 84 beats/min; respiratory rate, 13 breaths/min; and temperature, 98.6°F. Oxygen saturation was 94% on room air.
Clinical examination revealed a pulsatile, purple left groin mass and bruit. The mass was located around the left inguinal ligament and extended down the proximal, inner thigh (Figure 1). There was no drainage or lesions from the mass. Inspection of the patient’s hip demonstrated decreased adduction, limited by the mass; otherwise, there was normal range of motion. The dorsalis pedis and posterior tibial pulses were equal and intact, and the rest of the physical examination was unremarkable.
The patient tolerated the examination without focal signs of discomfort. A Doppler ultrasound revealed findings consistent with a common femoral pseudoaneurysm (PSA) (Figure 2). For better visualization and extension, a computed tomography angiogram (CTA) was obtained, which demonstrated a PSA measuring 11.7 x 10.7 x 7.3 cm; there was no active extravasation (Figure 3).
The patient was started on intravenous normal saline while vascular surgery services was consulted for management and repair. After a discussion with the son regarding the patient’s wishes, surgical intervention was refused and the patient was conservatively managed and transitioned to hospice care.
Discussion
A true aneurysm differs from a PSA in that true aneurysms involve all three layers of the vessel wall. A PSA consists partly of the vessel wall and partly of encapsulating fibrous tissue or surrounding tissue.
Etiology
Femoral artery PSAs can be iatrogenic, for example, develop following cardiac catheterization or at the anastomotic site of previous surgery.1 The incidence of diagnostic postcatheterization PSA ranges from 0.05% to 2%, whereas interventional postcatheterization PSA ranges from 2% to 6%.2
With the increasing number of peripheral coronary diagnostics and interventions, emergency physicians should include PSA in the differential diagnosis of patients with a recent or remote history of catheterization or bypass grafts. Less commonly, femoral PSAs are caused by non-surgical trauma or infection (ie, mycotic PSA). Patient risk factors for development of PSA include obesity, hypertension, PAD, and anticoagulation.3 Patients with femoral artery PSAs may present with a painful or painless pulsatile mass. Mass effect of the PSA can compress nearby neurovascular structures, leading to femoral neuropathies or limb edema secondary to venous obstruction.4 Complications of embolization or thrombosis can cause limb ischemia, neuropathy, and claudication, while rupture may present with a rapidly expanding groin hematoma. Additionally, sizeable PSAs can cause overlying skin necrosis.5
Imaging Studies
Diagnosis of a PSA can be made through Doppler ultrasound, which is the preferred imaging modality due to its accuracy, noninvasive nature, and low cost. Doppler ultrasound has been found to have a sensitivity of 94% and specificity of 97% in detecting PSAs. Additional imaging with CTA can provide further definition of vasculopathy.6 Treatment should be considered for patients with a symptomatic femoral PSA, a PSA measuring more than 3 cm, or patients who are on anticoagulation therapy. Studies have shown that observation-only and follow-up may be appropriate for patients with a PSA measuring less than 3 cm. A study by Toursarkissian et al7 found that the majority of PSAs smaller than 3 cm spontaneously resolved in a mean of 23 days without limb-threatening complications.
Treatment
Traditionally, open surgical repair techniques were the only treatment option for PSAs. However, in the early 1990s, the advent of new techniques such as stenting, coil insertion, ultrasound-guided compression, and ultrasound-guided thrombin injection, have developed as alternatives to open surgical repair; there has been variable success to these minimally invasive approaches.5,8
Ultrasound-Guided Compression. A conservative approach to treating PSAs, ultrasound-guided compression requires sustained compression by a skilled physician. This technique is associated with significant discomfort to the patient.5 Ultrasound-Guided Thrombin Injection. This technique is the treatment of choice for postcatheterization PSA. However, this intervention is contraindicated in patients who have concerning features such as an infected PSA, rapid expansion, skin necrosis, or signs of limb ischemia. Additionally, ultrasound-guided thrombin injection is not appropriate for use in patients with a PSA occurring at anastomosis of a synthetic graft and native artery.5
Conclusion
Based on our patient’s clinical presentation and history of aortofemoral bypass surgery, we suspected a femoral PSA. While the PSA noted in our patient was sizeable, imaging studies and clinical examination showed no sign of limb ischemia or rupture.
Femoral PSAs are usually iatrogenic in nature, typically developing shortly after catheterization or a previous bypass surgery. The most serious complication of a PSA is rupture, but a thorough examination of the distal extremity is warranted to assess for limb ischemia as well. Ultrasound imaging is considered the modality of choice based on its high sensitivity and sensitivity for detecting PSAs.
Small PSAs (<3 cm) can be managed medically, but larger PSAs (>3 cm) require treatment. Newer techniques, including stenting, coil insertion, ultrasound-guided compression, and ultrasound-guided thrombin injection are alternatives to open surgical repair of larger, uncomplicated PSAs. However, urgent open surgical repair is the only option when there is evidence of a ruptured PSA, ischemia, or skin necrosis.
1. Faggioli GL, Stella A, Gargiulo M, Tarantini S, D’Addato M, Ricotta JJ. Morphology of small aneurysms: definition and impact on risk of rupture. Am J Surg. 1994;168(2):131-135.
2. Hessel SJ, Adams DF, Abrams HL. Complications of angiography. Radiology. 1981;138(2):273-281. doi:10.1148/radiology.138.2.7455105.
3. Petrou E, Malakos I, Kampanarou S, Doulas N, Voudris V. Life-threatening rupture of a femoral pseudoaneurysm after cardiac catheterization. Open Cardiovasc Med J. 2016;10:201-204. doi:10.2174/1874192401610010201.
4. Mees B, Robinson D, Verhagen H, Chuen J. Non-aortic aneurysms—natural history and recommendations for referral and treatment. Aust Fam Physician. 2013;42(6):370-374.
5. Webber GW, Jang J, Gustavson S, Olin JW. Contemporary management of postcatheterization pseudoaneurysms. Circulation. 2007;115(20):2666-2674. doi:10.1161/CIRCULATIONAHA.106.681973.
6. Coughlin BF, Paushter DM. Peripheral pseudoaneurysms: evaluation with duplex US. Radiology. 1988;168(2):339-342. doi:10.1148/radiology.168.2.3293107.
7. Toursarkissian B, Allen BT, Petrinec D, et al. Spontaneous closure of selected iatrogenic pseudoaneurysms and arteriovenous fistulae. J Vasc Surg. 1997;25(5):803-809; discussion 808-809.
8. Corriere MA, Guzman RJ. True and false aneurysms of the femoral artery. Semin Vasc Surg. 2005;18(4):216-223. doi:10.1053/j.semvascsurg.2005.09.008.