User login
New MI definition aims to better distinguish infarction from injury
MUNICH – The worldwide cardiology community’s newly revised universal definition of an MI refines the way that cardiologists distinguish between myocardial infarction and myocardial injury, said Joseph S. Alpert, MD, one of the two chairs of the definition-writing panel.
“We had three previous definitions, but there is still a lot of confusion [about distinguishing] between injury and infarction. We definitely hope that this fourth definition will further help people distinguish the two and help people determine whether or not a patient has an MI,” said Dr. Alpert following a session at the annual congress of the European Society of Cardiology that introduced some of the key elements of the new revision.
Days before the ESC congress, a task force formed by the European Society of Cardiology, the American College of Cardiology, the American Heart Association, and the World Heart Federation released the Fourth Universal Definition of Myocardial Infarction (2018) (J Am Coll Cardiol. 2018 Aug 24. doi: 10.1016/j.jacc.2018.08.1038), which follows the series of three prior MI definitions that these groups have issued since the first iteration came out in 2007 (J Am Coll Cardiol. 2007;50[22]:2173-95).
The new revision includes 5 “new concepts,” 14 updated concepts, and 6 new sections since the third universal definition from 2012. The change that topped Dr. Alpert’s list of key messages was the need to determine whether a rise in cardiac troponin, a key biomarker of cardiac damage, resulted from infarction or injury.
These two alternative diagnoses mean “a very different outlook for patients. Treatment is different, and their prognosis is different. It’s important to make the distinction,” said Dr. Alpert, professor of medicine at the University of Arizona in Tucson.
The new changes to making an MI diagnosis will likely help drive a couple of important changes in the way U.S. patients with suspected myocardial injury or infarction get assessed, he said in an interview. The first change will be wide uptake of high sensitivity cardiac troponin (hscTn) assays over the next 5 years or so, as the ability to measure this key diagnostic biomarker progresses from its initial Food and Drug Administration approval for the U.S. market in 2017 to “close to 100% of U.S. hospitals using it,” he predicted. A big issue that is currently slowing even quicker adoption of hscTn is that many hospitals, including the one where Dr. Alpert practices, still have laboratory contracts in place that tether them to older troponin-testing technologies and make it economically unfeasible to change until their contracts expire. The contract in place where Dr. Alpert practices runs out in 2019, and soon after that happens he expects to gain the ability to order a hscTn test.
The new, fourth definition says that hscTn is “recommended for routine clinical use,” but routine U.S. use “won’t be immediate because many hospitals will put in hscTn only when their old contract runs out,” he said.
Another practice-changing impact from the fourth definition may be expanded U.S. availability and use of MR imaging, which the fourth definition identified as the most informative and versatile of the several imaging options used to confirm or rule out an MI.
Cardiac MR “provides both functional and tissue characterization. It’s the technique with the most potential,” able to noninvasively identify “both the nature and extent of myocardial damage,” explained Chiara Bucciarelli-Ducci, MD, a cardiologist and imaging specialist at the Bristol (England) Heart Institute. A single cardiac MR scan “gives many answers,” said Dr. Bucciarelli-Ducci, who also served on the fourth definition task force and spoke at the session about the document’s revised imaging recommendations.

“In the setting of acute MI, cardiac MR can also be used to assess the presence and extent of myocardium at risk (myocardial edema), myocardial salvage, microvascular obstruction, intramyocardial hemorrhage, and infarct size, all markers of myocardial injury that have prognostic value,” according to the fourth definition. “In patients with possible acute MI but unobstructed coronary arteries, cardiac MR can help to diagnose alternative conditions such as myocarditis, Takotsubo syndrome, embolic infarction, or MI with spontaneous recanalization.”
“What’s turning out is that, a large number of patients with chest pain have an infection and not an MI, and cardiac MR can distinguish inflammation and myocarditis from infarction. We’re now doing a lot more MRs,” Dr. Alpert said. Although MR capability is not as widely available today as other imaging methods, like echocardiography and CT, over the next 5 years that will likely change, he said. But Dr. Alpert cautioned that not every patient with a suspected MI needs MR assessment. It’s best focused for selected patients with an uncertain diagnosis based on the core indicators of disease: history, ECG, changes in hscTn levels over time, and a chest x-ray. “MR is for when there are questions,” he said. When patients present with classic MI signs and symptoms the diagnosis can depend just on the basics, perhaps supplemented with a more widely available imaging method like echocardiography to look for wall motion abnormalities, he said. “If echo shows good left ventricular function you probably don’t need MR.” he said.
CT coronary angiography (CTCA) is another useful diagnostic tool, and right now is more widely available than MR. CTCA “may be used to diagnose coronary artery disease in patients with an acute coronary syndrome event in the emergency department or chest pain unit, particularly in low- to intermediate-risk patients with normal hscTn at presentation,” said the fourth definition. But Dr. Alpert cited the radiation dose from CT as a limiting factor. “We have patients who get repeat CT scans, and we know that increases their cancer risk. There is no such thing as a totally safe dose of radiation.” Lack of radiation exposure is another feature that makes MR imaging attractive.
Dr. Alpert had no disclosures. Dr. Bucciarelli-Ducci has had a financial relationship with Circle Cardiovascular Imaging.
MUNICH – The worldwide cardiology community’s newly revised universal definition of an MI refines the way that cardiologists distinguish between myocardial infarction and myocardial injury, said Joseph S. Alpert, MD, one of the two chairs of the definition-writing panel.
“We had three previous definitions, but there is still a lot of confusion [about distinguishing] between injury and infarction. We definitely hope that this fourth definition will further help people distinguish the two and help people determine whether or not a patient has an MI,” said Dr. Alpert following a session at the annual congress of the European Society of Cardiology that introduced some of the key elements of the new revision.
Days before the ESC congress, a task force formed by the European Society of Cardiology, the American College of Cardiology, the American Heart Association, and the World Heart Federation released the Fourth Universal Definition of Myocardial Infarction (2018) (J Am Coll Cardiol. 2018 Aug 24. doi: 10.1016/j.jacc.2018.08.1038), which follows the series of three prior MI definitions that these groups have issued since the first iteration came out in 2007 (J Am Coll Cardiol. 2007;50[22]:2173-95).
The new revision includes 5 “new concepts,” 14 updated concepts, and 6 new sections since the third universal definition from 2012. The change that topped Dr. Alpert’s list of key messages was the need to determine whether a rise in cardiac troponin, a key biomarker of cardiac damage, resulted from infarction or injury.
These two alternative diagnoses mean “a very different outlook for patients. Treatment is different, and their prognosis is different. It’s important to make the distinction,” said Dr. Alpert, professor of medicine at the University of Arizona in Tucson.
The new changes to making an MI diagnosis will likely help drive a couple of important changes in the way U.S. patients with suspected myocardial injury or infarction get assessed, he said in an interview. The first change will be wide uptake of high sensitivity cardiac troponin (hscTn) assays over the next 5 years or so, as the ability to measure this key diagnostic biomarker progresses from its initial Food and Drug Administration approval for the U.S. market in 2017 to “close to 100% of U.S. hospitals using it,” he predicted. A big issue that is currently slowing even quicker adoption of hscTn is that many hospitals, including the one where Dr. Alpert practices, still have laboratory contracts in place that tether them to older troponin-testing technologies and make it economically unfeasible to change until their contracts expire. The contract in place where Dr. Alpert practices runs out in 2019, and soon after that happens he expects to gain the ability to order a hscTn test.
The new, fourth definition says that hscTn is “recommended for routine clinical use,” but routine U.S. use “won’t be immediate because many hospitals will put in hscTn only when their old contract runs out,” he said.
Another practice-changing impact from the fourth definition may be expanded U.S. availability and use of MR imaging, which the fourth definition identified as the most informative and versatile of the several imaging options used to confirm or rule out an MI.
Cardiac MR “provides both functional and tissue characterization. It’s the technique with the most potential,” able to noninvasively identify “both the nature and extent of myocardial damage,” explained Chiara Bucciarelli-Ducci, MD, a cardiologist and imaging specialist at the Bristol (England) Heart Institute. A single cardiac MR scan “gives many answers,” said Dr. Bucciarelli-Ducci, who also served on the fourth definition task force and spoke at the session about the document’s revised imaging recommendations.
“In the setting of acute MI, cardiac MR can also be used to assess the presence and extent of myocardium at risk (myocardial edema), myocardial salvage, microvascular obstruction, intramyocardial hemorrhage, and infarct size, all markers of myocardial injury that have prognostic value,” according to the fourth definition. “In patients with possible acute MI but unobstructed coronary arteries, cardiac MR can help to diagnose alternative conditions such as myocarditis, Takotsubo syndrome, embolic infarction, or MI with spontaneous recanalization.”
“What’s turning out is that, a large number of patients with chest pain have an infection and not an MI, and cardiac MR can distinguish inflammation and myocarditis from infarction. We’re now doing a lot more MRs,” Dr. Alpert said. Although MR capability is not as widely available today as other imaging methods, like echocardiography and CT, over the next 5 years that will likely change, he said. But Dr. Alpert cautioned that not every patient with a suspected MI needs MR assessment. It’s best focused for selected patients with an uncertain diagnosis based on the core indicators of disease: history, ECG, changes in hscTn levels over time, and a chest x-ray. “MR is for when there are questions,” he said. When patients present with classic MI signs and symptoms the diagnosis can depend just on the basics, perhaps supplemented with a more widely available imaging method like echocardiography to look for wall motion abnormalities, he said. “If echo shows good left ventricular function you probably don’t need MR.” he said.
CT coronary angiography (CTCA) is another useful diagnostic tool, and right now is more widely available than MR. CTCA “may be used to diagnose coronary artery disease in patients with an acute coronary syndrome event in the emergency department or chest pain unit, particularly in low- to intermediate-risk patients with normal hscTn at presentation,” said the fourth definition. But Dr. Alpert cited the radiation dose from CT as a limiting factor. “We have patients who get repeat CT scans, and we know that increases their cancer risk. There is no such thing as a totally safe dose of radiation.” Lack of radiation exposure is another feature that makes MR imaging attractive.
Dr. Alpert had no disclosures. Dr. Bucciarelli-Ducci has had a financial relationship with Circle Cardiovascular Imaging.
REPORTING FROM THE ESC CONGRESS 2018
SCOT-HEART: CTA cuts MIs in patients with stable chest pain
MUNICH –
Although the absolute numbers were small – 48 clinical events in the intervention group and 81 among patients who had standard care – the difference was significant and wasn’t associated with any increase in invasive coronary procedures, David E. Newby, MD, said at the annual congress of the European Society of Cardiology.
The study, presented August 25, was published simultaneously in the New England Journal of Medicine (NEJM 2018; DOI: 10.1056/NEJMoa1805971
The data suggest that 63 patients with stable chest pain would need to undergo CTA to prevent one fatal or nonfatal myocardial infarction over 5 years, said Dr. Newby, the BHF John Wheatley professor of cardiology at the University of Edinburgh, Scotland.
He presented 5-year results of the SCOT-HEART study, an open-label trial that randomized 4,146 patients with stable chest pain to standard care plus CTA, or standard care alone. The primary endpoint was nonfatal myocardial infarction or death from coronary heart disease at 5 years. The 3-year results were previously reported.
“This is one of the most impactful studies in cardiovascular medicine. It’s a groundbreaking trial,” commented Todd C. Villines, MD, a designated discussant for the report at the meeting. SCOT-HEART “looked at the additive value of CTA compared with usual care using functional testing with an exercise stress test. It showed that when you visualize coronary atherosclerosis [with CTA] and change medical management based on whether or not plaque is present it drove a significant decrease in MIs,” noted Dr. Villines, a cardiologist affiliated with Georgetown University Medical School in Washington, and immediate past president of the Society of Cardiovascular CT.
Patients were recruited from 12 cardiology centers across Scotland and followed for a mean of 4.8 years, amassing 20,254 patient-years of follow-up. They were a mean of 57 years old; 41% had nonanginal chest pain, 35% typical angina, and 24% atypical angina About half were current or former smokers, a third had hypertension, and half had hypercholesterolemia. Resting EEG was normal in 85%.
Patients who underwent CTA were more likely to start preventive therapies (19% vs. 14.7%; odds ratio, 1.4) and antianginal therapies (13% vs. 10.7%; hazard ratio, 1.27). And although there were more revascularizations in that group early on, the numbers were similar by the end of follow-up (13.5% vs. 13%). After 12 months, CTA patients were 30% less likely to undergo invasive coronary angiography (HR, 0.70) and 41% less likely to undergo a coronary revascularization (HR, 0.59).
“This would be consistent with both the emergence of unrecognized disease and nonfatal myocardial infarction in the standard-care group and the reduction in disease progression in the CTA group owing to the implementation of lifestyle modifications and preventive therapies,” Dr. Newby and colleagues wrote in the NEJM paper.
The composite clinical endpoint occurred in 2.3% of the CTA group and 3.9% of the standard care group – a significant risk differential of 41% (HR, 0.59). The primary driver of this benefit was a significantly lower rate of nonfatal myocardial infarction (HR, 0.60) among CTA patients.
There was no evidence of a subgroup effect, Dr. Newby noted. Among the 48 CTA patients who experienced a clinical event, 22 had obstructive disease, 17 had nonobstructive disease, and three had normal coronary arteries (six patients assigned to the procedure didn’t return for it).
There was a slightly higher event rate among patients with possible angina than among those with nonanginal pain (3.1% vs. 1.8%), but the 5-year difference between the treatment groups was not significantly different.
“Our findings suggest that the use of CTA resulted in more correct diagnoses of coronary heart disease than standard care alone, which, in turn, led to the use of appropriate therapies and this change in management resulted in fewer clinical events in the CTA group than in the standard-care group,” Dr. Newby noted. “Patients who receive a correct diagnosis are also more likely to receive appropriate preventive therapies and may have greater motivation to implement healthy lifestyle modification.”
“The SCOT-HEART data solidify coronary CTA as the best first-line test for patients without established coronary disease,” especially now that a report documented that clinicians worldwide are performing coronary CTA using lower levels of radiation exposure to patients, commented Dr. Villines in an interview. During the same session where Dr. Newby reported the SCOT-HEART results, an international team of researchers reported results of a survey of CTA methods used at 61 centers in 32 countries, including several U.S. sites. The results from the survey showed that in 2017 patients undergoing coronary CTA received a median radiation dose of 2.7 mSv and a median dose-length product of 195 mGy*cm, both representing a 78% relative reduction compared with the median doses received during CTA when a similar survey ran in 2007 (Eur Heart J. 2018 Aug 25; doi:10.1093/eurheartj/ehy546).
In contrast, for patients with established coronary artery disease functional tests using stress imaging remain best, Dr. Villines said. “What SCOT-HEART said was that when you use coronary CTA in a population without established coronary disease you can identify not only whether the patient has obstructive disease but do they have coronary atherosclerosis, and that is prognostic and valuable. You miss that with functional testing.”
The Chief Scientist Office of the Scottish Government funded the study. Dr. Newby has received grants from Seimens. Dr. Villines had no relevant commercial disclosures.
Updated 8/27/18: Mitchel L. Zoler contributed commentary by Dr. Todd C. Villines, and additional data and discussion from the presentation, to this article.
SOURCE: Newby DE et al. NEJM 2018; DOI: 10.1056/NEJMoa1805971.
Clinical information gleaned from CTA can drive the treatment of chest pain far beyond simply making a correct diagnosis, Udo Hoffmann, MD, and James Udelson, MD, wrote in an accompanying editorial (NEJM 2018 DOI: 10.1056/NEJMo1809203).
The 41% lower rate of nonfatal myocardial infarction or death from coronary heart disease seen in the 5-year SCOT-HEART data came without the additional financial or clinical cost of invasive coronary procedures.
“The relative risk reductions observed in the SCOT-HEART trial are like those observed in recent secondary prevention trials, which prompts speculation about the mechanism. In trials of diagnostic testing strategies, it is the downstream management – presumably driven by the testing results – that affects outcomes.”
Coronary revascularization probably didn’t play a major role in the benefit, given the similar between-group rates. So, the key must lie elsewhere. A look at a similar study, which found quite different results, may help.
The Prospective Multicenter Imaging Study for Evaluation of Chest Pain (PROMISE) randomized similar chest pain patients to either CTA or functional testing but showed no significant benefit of CTA over 2 years. It compared CTA primarily to nuclear imaging or echocardiogram, with only 10% getting an exercise ECG. In SCOT-HEART the comparator standardized strategy was predominantly stress ECG testing, and only 10% had an imaging test.
“An analysis of PROMISE shows that a substantial proportion of myocardial infarctions occurred in patients with nonobstructive coronary artery disease identified by CTA – disease that would not be detected by functional testing. It would be reasonable to consider aggressive secondary prevention in these patients, although this specific approach has not been evaluated in a clinical trial. We also believe that leveraging data from trials such as SCOT-HEART and PROMISE may allow more efficient targeting of noninvasive testing while continuing to drive improvement in vascular outcomes.”
Dr. Hoffmann is a cardiac radiologist at Harvard Medical School and Dr. Udelson is director of the Nuclear Cardiology Laboratory at Tufts Medical Center, both of Boston.
MUNICH –
Although the absolute numbers were small – 48 clinical events in the intervention group and 81 among patients who had standard care – the difference was significant and wasn’t associated with any increase in invasive coronary procedures, David E. Newby, MD, said at the annual congress of the European Society of Cardiology.
The study, presented August 25, was published simultaneously in the New England Journal of Medicine (NEJM 2018; DOI: 10.1056/NEJMoa1805971
The data suggest that 63 patients with stable chest pain would need to undergo CTA to prevent one fatal or nonfatal myocardial infarction over 5 years, said Dr. Newby, the BHF John Wheatley professor of cardiology at the University of Edinburgh, Scotland.
He presented 5-year results of the SCOT-HEART study, an open-label trial that randomized 4,146 patients with stable chest pain to standard care plus CTA, or standard care alone. The primary endpoint was nonfatal myocardial infarction or death from coronary heart disease at 5 years. The 3-year results were previously reported.
“This is one of the most impactful studies in cardiovascular medicine. It’s a groundbreaking trial,” commented Todd C. Villines, MD, a designated discussant for the report at the meeting. SCOT-HEART “looked at the additive value of CTA compared with usual care using functional testing with an exercise stress test. It showed that when you visualize coronary atherosclerosis [with CTA] and change medical management based on whether or not plaque is present it drove a significant decrease in MIs,” noted Dr. Villines, a cardiologist affiliated with Georgetown University Medical School in Washington, and immediate past president of the Society of Cardiovascular CT.
Patients were recruited from 12 cardiology centers across Scotland and followed for a mean of 4.8 years, amassing 20,254 patient-years of follow-up. They were a mean of 57 years old; 41% had nonanginal chest pain, 35% typical angina, and 24% atypical angina About half were current or former smokers, a third had hypertension, and half had hypercholesterolemia. Resting EEG was normal in 85%.
Patients who underwent CTA were more likely to start preventive therapies (19% vs. 14.7%; odds ratio, 1.4) and antianginal therapies (13% vs. 10.7%; hazard ratio, 1.27). And although there were more revascularizations in that group early on, the numbers were similar by the end of follow-up (13.5% vs. 13%). After 12 months, CTA patients were 30% less likely to undergo invasive coronary angiography (HR, 0.70) and 41% less likely to undergo a coronary revascularization (HR, 0.59).
“This would be consistent with both the emergence of unrecognized disease and nonfatal myocardial infarction in the standard-care group and the reduction in disease progression in the CTA group owing to the implementation of lifestyle modifications and preventive therapies,” Dr. Newby and colleagues wrote in the NEJM paper.
The composite clinical endpoint occurred in 2.3% of the CTA group and 3.9% of the standard care group – a significant risk differential of 41% (HR, 0.59). The primary driver of this benefit was a significantly lower rate of nonfatal myocardial infarction (HR, 0.60) among CTA patients.
There was no evidence of a subgroup effect, Dr. Newby noted. Among the 48 CTA patients who experienced a clinical event, 22 had obstructive disease, 17 had nonobstructive disease, and three had normal coronary arteries (six patients assigned to the procedure didn’t return for it).
There was a slightly higher event rate among patients with possible angina than among those with nonanginal pain (3.1% vs. 1.8%), but the 5-year difference between the treatment groups was not significantly different.
“Our findings suggest that the use of CTA resulted in more correct diagnoses of coronary heart disease than standard care alone, which, in turn, led to the use of appropriate therapies and this change in management resulted in fewer clinical events in the CTA group than in the standard-care group,” Dr. Newby noted. “Patients who receive a correct diagnosis are also more likely to receive appropriate preventive therapies and may have greater motivation to implement healthy lifestyle modification.”
“The SCOT-HEART data solidify coronary CTA as the best first-line test for patients without established coronary disease,” especially now that a report documented that clinicians worldwide are performing coronary CTA using lower levels of radiation exposure to patients, commented Dr. Villines in an interview. During the same session where Dr. Newby reported the SCOT-HEART results, an international team of researchers reported results of a survey of CTA methods used at 61 centers in 32 countries, including several U.S. sites. The results from the survey showed that in 2017 patients undergoing coronary CTA received a median radiation dose of 2.7 mSv and a median dose-length product of 195 mGy*cm, both representing a 78% relative reduction compared with the median doses received during CTA when a similar survey ran in 2007 (Eur Heart J. 2018 Aug 25; doi:10.1093/eurheartj/ehy546).
In contrast, for patients with established coronary artery disease functional tests using stress imaging remain best, Dr. Villines said. “What SCOT-HEART said was that when you use coronary CTA in a population without established coronary disease you can identify not only whether the patient has obstructive disease but do they have coronary atherosclerosis, and that is prognostic and valuable. You miss that with functional testing.”
The Chief Scientist Office of the Scottish Government funded the study. Dr. Newby has received grants from Seimens. Dr. Villines had no relevant commercial disclosures.
Updated 8/27/18: Mitchel L. Zoler contributed commentary by Dr. Todd C. Villines, and additional data and discussion from the presentation, to this article.
SOURCE: Newby DE et al. NEJM 2018; DOI: 10.1056/NEJMoa1805971.
REPORTING FROM THE ESC CONGRESS 2018
Key clinical point: Coronary computed tomographic angiography reduced the risk of poor cardiovascular outcomes in patients with stable chest pain.
Major finding: Patients who had CTA were 41% less likely to have a nonfatal heart attack or cardiovascular death at 5 years.
Study details: SCOT-HEART randomized 4,146 patients to either CTA or standard diagnostic care.
Disclosures: The Chief Scientist Office of the Scottish Government funded the study. Dr. Newby has received grants from Seimens.
Source: Newby DE et al. NEJM 2018; DOI: 10.1056/NEJMoa1805971.
ED key to reducing pediatric asthma x-rays
ATLANTA – but accomplishing this goal takes more than a new clinical practice guideline, according to a quality improvement team at the Monroe Carell Jr. Children’s Hospital at Vanderbilt University, Nashville, Tenn.

The team eventually reduced the chest x-ray rate for pediatric asthma exacerbations from 30% to 15% without increasing 3-day all-cause readmissions, but it took some sleuthing in the ED and good relations with staff. “We were way out in left field when we started this. Working in silos is never ideal,” said senior project member David Johnson, MD, a pediatric hospitalist and assistant professor of pediatrics at Vanderbilt.
It’s been known for a while that chest x-rays are almost always a waste of time and money for asthma exacerbations, and national guidelines recommend against them. X-rays don’t improve outcomes and needlessly expose children to radiation.
In 2014, some of the providers at Vanderbilt, which has about 1,700 asthma encounters a year, realized that the institution’s 30% x-ray rate was a problem. The quality improvement team hoped a new guideline would address the issue, but that didn’t happen. “We roll out clinical practice guidelines” from on high, “and think people will magically change their behavior,” but they don’t, Dr. Johnson said at the annual Pediatric Hospital Medicine meeting.
The guideline was not being fully implemented. So the team asked the ED what was the standard procedure for a child presenting with asthma exacerbation. It turned out that the ED had a dyspnea order set that the team ”had no idea existed.” Chest x-rays were at the top of the list; next came blood gases, ventilation-perfusion scans, and leg Dopplers, he said.
The investigators tried to get rid of the whole order set but were unsuccessful. The ED department did, however, let the team eliminate chest x-rays in the default order set in July 2015. That helped, but more changes were needed.
The next conversation was to figure out why x-rays were being ordered in the first place. ED staff said they were worried about missing something, especially pneumonia. They also thought they were helping hospitalists by getting x-rays before sending kids to the ward even though, in reality, it didn’t matter whether x-rays were done a few hours later on the floor. ED providers also said that ill-appearing children often got better after a few hours but were kept back from discharge because x-ray results were still pending and that sometimes these results revealed problems at 3 a.m. that had nothing to do with why the patients were in the ED but still required a work-up.
This discussion opened a door. The ED staff didn’t want to order unnecessary x-rays, either. That led to talks about letting kids declare themselves a bit before x-rays were ordered. ED staff liked the idea, so the guidelines were updated in early 2016 to say that chest x-rays should only be ordered if there is persistent severe respiratory distress with hypoxia, there are focal findings that don’t improve after 12 hours of treatment, or there were concerns for pneumomediastinum or collapsed lung. The updated guidelines were posted in work areas and brought home by resident education. A reminder was added to the electronic medical record system that popped up when someone tried to order a chest x-ray for an child with asthma.
It worked. Chest x-ray rates in asthma fell to 15%, and have remained there since.
“We gave them permission to take their foot off the throttle and wait a little bit, and we don’t have more kids bouncing back from reduced x-rays.” The approach is “probably generalizable everywhere,” Dr. Johnson said.
It was essential that an ED fellow, Caroline Watnick, MD, led the effort and eventually bridged the gap between hospitalists and ED providers. In the end, “the change wasn’t something from the outside,” Dr. Johnson said.
There was no industry funding, and Dr. Johnson didn’t have any disclosures. The Pediatric Hospital Medicine meeting is sponsored by the Society of Hospital Medicine, the American Academy of Pediatrics, and the Academic Pediatric Association.
ATLANTA – but accomplishing this goal takes more than a new clinical practice guideline, according to a quality improvement team at the Monroe Carell Jr. Children’s Hospital at Vanderbilt University, Nashville, Tenn.
The team eventually reduced the chest x-ray rate for pediatric asthma exacerbations from 30% to 15% without increasing 3-day all-cause readmissions, but it took some sleuthing in the ED and good relations with staff. “We were way out in left field when we started this. Working in silos is never ideal,” said senior project member David Johnson, MD, a pediatric hospitalist and assistant professor of pediatrics at Vanderbilt.
It’s been known for a while that chest x-rays are almost always a waste of time and money for asthma exacerbations, and national guidelines recommend against them. X-rays don’t improve outcomes and needlessly expose children to radiation.
In 2014, some of the providers at Vanderbilt, which has about 1,700 asthma encounters a year, realized that the institution’s 30% x-ray rate was a problem. The quality improvement team hoped a new guideline would address the issue, but that didn’t happen. “We roll out clinical practice guidelines” from on high, “and think people will magically change their behavior,” but they don’t, Dr. Johnson said at the annual Pediatric Hospital Medicine meeting.
The guideline was not being fully implemented. So the team asked the ED what was the standard procedure for a child presenting with asthma exacerbation. It turned out that the ED had a dyspnea order set that the team ”had no idea existed.” Chest x-rays were at the top of the list; next came blood gases, ventilation-perfusion scans, and leg Dopplers, he said.
The investigators tried to get rid of the whole order set but were unsuccessful. The ED department did, however, let the team eliminate chest x-rays in the default order set in July 2015. That helped, but more changes were needed.
The next conversation was to figure out why x-rays were being ordered in the first place. ED staff said they were worried about missing something, especially pneumonia. They also thought they were helping hospitalists by getting x-rays before sending kids to the ward even though, in reality, it didn’t matter whether x-rays were done a few hours later on the floor. ED providers also said that ill-appearing children often got better after a few hours but were kept back from discharge because x-ray results were still pending and that sometimes these results revealed problems at 3 a.m. that had nothing to do with why the patients were in the ED but still required a work-up.
This discussion opened a door. The ED staff didn’t want to order unnecessary x-rays, either. That led to talks about letting kids declare themselves a bit before x-rays were ordered. ED staff liked the idea, so the guidelines were updated in early 2016 to say that chest x-rays should only be ordered if there is persistent severe respiratory distress with hypoxia, there are focal findings that don’t improve after 12 hours of treatment, or there were concerns for pneumomediastinum or collapsed lung. The updated guidelines were posted in work areas and brought home by resident education. A reminder was added to the electronic medical record system that popped up when someone tried to order a chest x-ray for an child with asthma.
It worked. Chest x-ray rates in asthma fell to 15%, and have remained there since.
“We gave them permission to take their foot off the throttle and wait a little bit, and we don’t have more kids bouncing back from reduced x-rays.” The approach is “probably generalizable everywhere,” Dr. Johnson said.
It was essential that an ED fellow, Caroline Watnick, MD, led the effort and eventually bridged the gap between hospitalists and ED providers. In the end, “the change wasn’t something from the outside,” Dr. Johnson said.
There was no industry funding, and Dr. Johnson didn’t have any disclosures. The Pediatric Hospital Medicine meeting is sponsored by the Society of Hospital Medicine, the American Academy of Pediatrics, and the Academic Pediatric Association.
REPORTING FROM PHM 2018
Key clinical point: Reduction of chest x-rays for routine pediatric asthma exacerbations in the ED can be accomplished with a team effort.
Major finding: A team project reduced x-rays for pediatric asthma exacerbations from 30% to 15% without increasing 3-day, all-cause readmissions.
Study details: Pre/post quality improvement analysis of asthma encounters in the Monroe Carell Jr. Children’s Hospital, Nashville, Tenn., starting in 2014.
Disclosures: There was no industry funding, and the presenter didn’t have any disclosures.
Neuroimaging may often be unneeded in ED seizure treatment
Neuroimaging may be appropriate only for specific types of patients with recurrent seizures who present at emergency departments because the scans are otherwise unlikely to prompt acute changes in treatment, a new multicenter study suggests. 
“Going forward, our results should help ED providers determine which patients are more likely to derive benefit from neuroimaging and which patients are not likely to benefit,” lead author Martin Salinsky, MD, of Oregon Health & Science University, Portland, said in an interview. “They can be more selective in ordering scans and reduce the total number obtained.”
As the study authors noted in their report, published July 18 in Epilepsia, “head CT is generally considered a benign procedure. However, overuse is problematic.”
The scans are costly and expose patients to radiation equivalent to 10 chest x-rays, the authors wrote. Scans can complicate care by clogging ED work flow and producing false positives, and patients often seize while undergoing scans, creating even more complications, they added.
“There is very little information in the medical literature that would help guide ED providers in their decision of whether to obtain neuroimaging on a patient who presents with a recurrent seizure,” Dr. Salinsky said. “Without this information, the tendency is to be cautious and obtain scans in more patients.”
For the study, the researchers tracked 822 consecutive ED visits for nonindex – recurrent – epileptic seizures at Oregon Health & Science University and VA Portland Health Care medical centers. (Nonindex seizures accounted for 78% of the total seizures that prompted ED care.)
The study subjects were adults treated for seizure as the main complaint. Patients who had a history of seizures but hadn’t had one for at least 5 years were excluded.
Of the total nonindex seizures, 46% of those resulted in neuroimaging.
“The overall yield of neuroimaging in this patient group was 2%-3%,” Dr. Salinsky said, referring to the percentage of patients whose scans resulted in an acute change in management.
False positives due to imaging artifacts were subsequently discovered in 3 of the 11 patients whose neuroimaging prompted an acute change in management. When the false positives were removed, the yield of acute management changes prompted by neuroimaging decreased to 2.1% overall.
“Three clinical factors – acute head trauma, prolonged alteration of consciousness, and focal neurological examination [at presentation] – were associated with an increased yield of imaging,” he said. “Absent all three factors, the yield in our patients was zero.”
At the two medical centers, the percentages of patients with acute head trauma were 10% and 15%. Prolonged alteration of consciousness occurred in 6% at both centers, and focal neurological examination at presentation was observed in 12% and 14%.
A fourth factor, presentation with status epilepticus/acute repetitive seizures, “bordered on statistical significance and might have reached significance in a larger series,” the authors wrote.
As they put it, “these results support a more conservative use of ED neuroimaging for nonindex seizures, based on clinical factors at the time of presentation. ... without specific indications, ED neuroimaging for nonindex seizures is unlikely to result in an acute change in care.”
The study authors estimated that hundreds of millions of dollars could be saved annually in the United States if neuroimaging in these ED patients could be cut in half.
No study funding was reported, and the authors reported no relevant disclosures.
SOURCE: Salinsky M et al. Epilepsia. 2018 July 18. doi: 10.1111/epi.14518
Neuroimaging may be appropriate only for specific types of patients with recurrent seizures who present at emergency departments because the scans are otherwise unlikely to prompt acute changes in treatment, a new multicenter study suggests.
“Going forward, our results should help ED providers determine which patients are more likely to derive benefit from neuroimaging and which patients are not likely to benefit,” lead author Martin Salinsky, MD, of Oregon Health & Science University, Portland, said in an interview. “They can be more selective in ordering scans and reduce the total number obtained.”
As the study authors noted in their report, published July 18 in Epilepsia, “head CT is generally considered a benign procedure. However, overuse is problematic.”
The scans are costly and expose patients to radiation equivalent to 10 chest x-rays, the authors wrote. Scans can complicate care by clogging ED work flow and producing false positives, and patients often seize while undergoing scans, creating even more complications, they added.
“There is very little information in the medical literature that would help guide ED providers in their decision of whether to obtain neuroimaging on a patient who presents with a recurrent seizure,” Dr. Salinsky said. “Without this information, the tendency is to be cautious and obtain scans in more patients.”
For the study, the researchers tracked 822 consecutive ED visits for nonindex – recurrent – epileptic seizures at Oregon Health & Science University and VA Portland Health Care medical centers. (Nonindex seizures accounted for 78% of the total seizures that prompted ED care.)
The study subjects were adults treated for seizure as the main complaint. Patients who had a history of seizures but hadn’t had one for at least 5 years were excluded.
Of the total nonindex seizures, 46% of those resulted in neuroimaging.
“The overall yield of neuroimaging in this patient group was 2%-3%,” Dr. Salinsky said, referring to the percentage of patients whose scans resulted in an acute change in management.
False positives due to imaging artifacts were subsequently discovered in 3 of the 11 patients whose neuroimaging prompted an acute change in management. When the false positives were removed, the yield of acute management changes prompted by neuroimaging decreased to 2.1% overall.
“Three clinical factors – acute head trauma, prolonged alteration of consciousness, and focal neurological examination [at presentation] – were associated with an increased yield of imaging,” he said. “Absent all three factors, the yield in our patients was zero.”
At the two medical centers, the percentages of patients with acute head trauma were 10% and 15%. Prolonged alteration of consciousness occurred in 6% at both centers, and focal neurological examination at presentation was observed in 12% and 14%.
A fourth factor, presentation with status epilepticus/acute repetitive seizures, “bordered on statistical significance and might have reached significance in a larger series,” the authors wrote.
As they put it, “these results support a more conservative use of ED neuroimaging for nonindex seizures, based on clinical factors at the time of presentation. ... without specific indications, ED neuroimaging for nonindex seizures is unlikely to result in an acute change in care.”
The study authors estimated that hundreds of millions of dollars could be saved annually in the United States if neuroimaging in these ED patients could be cut in half.
No study funding was reported, and the authors reported no relevant disclosures.
SOURCE: Salinsky M et al. Epilepsia. 2018 July 18. doi: 10.1111/epi.14518
FROM EPILEPSIA
Key clinical point: In emergency departments, patients with seizure disorders and nonindex seizures may need neuroimaging only if they have acute head trauma, prolonged alteration of consciousness, or focal neurological examination at presentation.
Major finding: Absent the three factors above, neuroimaging did not prompt any acute changes in management.
Study details: Retrospective examination of 822 consecutive ED visits for nonindex seizures in patients with seizure disorders at two medical centers.
Disclosures: No study funding was reported, and the study authors reported no relevant disclosures.
Source: Salinsky M et al. Epilepsia. 2018 Jul 18. doi: 10.1111/epi.14518.
High users of CT pulmonary angiograms have lower diagnostic yields
Clinical question: What physician characteristics are associated with CT pulmonary angiogram (CTPA) diagnostic yield?
Background: Overuse of CTPAs for pulmonary embolism evaluation exposes patients to unnecessary testing and harmful ionizing radiation. Physician characteristics influence ordering practice. Identifying specific characteristics can provide an intervention for reducing overutilization.
Study design: Retrospective analysis.
Setting: Academic teaching hospital in Montreal, Canada.
Synopsis: Investigators reviewed 1,394 CTPAs ordered by 182 physicians at an academic teaching hospital during 2014-2016, with 199 (14.3%) positive studies and 1,195 (85.7%) negative studies. Physician years of experience, physician sex, and emergency medicine specialty were not associated with diagnostic yield. However, the diagnostic yield decreased with the total number of scans ordered per physician. For every 10 additional scans ordered, the odds of a positive test were reduced (odds ratio, 0.76; 95% confidence interval, 0.73-0.79). For physicians who ordered more than 50 studies, the percentage of positive studies was only 5%.
This study’s results show that overuse of CTPA is associated with decreased diagnostic yield. A limitation of the study was that pretest probabilities for pulmonary embolism could not be calculated because of inadequate charting, which would have determined whether CTPA was the appropriate test (as opposed to D-dimer).
Bottom line: Physicians who order higher numbers of CTPAs have lower diagnostic yields.
Citation: Chong J et al. Association of lower diagnostic yield with high users of CT pulmonary angiogram. JAMA Intern Med. 2018 Mar 1;178(3):412-3.
Dr. Komsoukaniants is a hospitalist at UC San Diego Health and an assistant clinical professor at the University of California, San Diego.
Osmotic demyelination syndrome due to hyperosmolar hyperglycemia
A 55-year-old man with a 20-year history of type 2 diabetes mellitus was admitted to the hospital after presenting to the emergency department with an acute change in mental status. Three days earlier, he had begun to feel abdominal discomfort and dizziness, which gradually worsened.
On presentation, his Glasgow Coma Scale score was 13 out of 15 (eye-opening response 3 of 4, verbal response 4 of 5, motor response 6 of 6), his blood pressure was 221/114 mm Hg, and other vital signs were normal. Physical examination including a neurologic examination was normal. No gait abnormality or ataxia was noted.
When asked about current medications, he said that 2 years earlier he had missed an appointment with his primary care physician and so had never obtained refills of his diabetes medications.
Results of laboratory testing were as follows:
- Blood glucose 1,011 mg/dL (reference range 65–110)
- Hemoglobin A1c 17.8% (4%–5.6%)
- Sodium 126 mmol/L (135–145)
- Sodium corrected for serum glucose 141 mmol/L
- Potassium 3.2 mmol/L (3.5–5.0)
- Blood urea nitrogen 43.8 mg/dL (8–21)
- Calculated serum osmolality 324 mosm/kg (275–295).
Blood gas analysis showed no acidosis. Tests for urinary and serum ketones were negative. Computed tomography (CT) of the head without contrast was normal.
Based on the results of the evaluation, the patient’s condition was diagnosed as a hyperosmolar hyperglycemic state, presumably from dehydration and noncompliance with diabetes medications. His altered mental status was also attributed to this diagnosis. He was started on aggressive hydration and insulin infusion to correct the blood glucose level. Repeat laboratory testing 7 hours after admission revealed a blood glucose of 49 mg/dL, sodium 148 mmol/L, blood urea nitrogen 43 mg/dL, and calculated serum osmolality 290 mosm/kg.
The insulin infusion was suspended, and glucose infusion was started. With this treatment, his blood glucose level stabilized, but his Glasgow Coma Scale score was unchanged from the time of presentation. A neurologic examination at this time showed bilateral dysmetria. Cranial nerves were normal. Motor examination showed normal tone with a Medical Research Council score of 5 of 5 in all extremities. Sensory examination revealed a glove-and-stocking pattern of loss of vibratory sensation. Tendon reflexes were normal except for diminished bilateral knee-jerk and ankle-jerk responses.
.")
.")
OSMOTIC DEMYELINATION SYNDROME
.")
 were almost unchanged.")
Central pontine myelinolysis is a pivotal manifestation of the syndrome and is characterized by progressive lethargy, quadriparesis, dysarthria, ophthalmoplegia, dysphasia, ataxia, and reflex changes. Clinical symptoms of extrapontine myelinolysis are variable.4
Although CT may underestimate osmotic demyelination syndrome, the typical radiologic findings on brain MRI are hyperintense lesions in the central pons or associated extrapontine structures on T2-weighted and fluid-attenuated inversion recovery sequences.4
A precise definition of hyperosmolar hyperglycemia does not exist. The Joint British Diabetes Societies for Inpatient Care suggested the following features: a measured osmolality of 320 mosm/kg or higher, a blood glucose level of 541 mg/dL or higher, severe dehydration, and feeling unwell.5
Our patient’s clinical course and high hemoglobin A1c suggested prolonged hyperglycemia and high serum osmolality before his admission. After his admission, aggressive hydration and insulin therapy corrected the hyperglycemia and serum osmolality too rapidly for his brain cells to adjust to the change. It was reasonable to suspect a hyperosmolar hyperglycemic state as one of the main causes of his mental status change and ataxia. This, along with lack of improvement in his impaired metal status and new-onset ataxia despite treatment, led to suspicion of osmotic demyelination syndrome. His diminished bilateral knee-jerk and ankle-jerk responses more likely represented diabetic neuropathy rather than osmotic demyelination syndrome.
Osmotic demyelination syndrome has seldom been reported as a complication of hyperosmolar hyperglycemia.6–13 And extrapontine myelinolysis with hyperosmolar hyperglycemia is extremely rare, with only 2 reports to date to the best of our knowledge.6,10
There is no specific treatment for osmotic demyelination syndrome except for supportive care and treatment of coexisting conditions. Once an osmotic derangement is identified, we recommend correcting chronically elevated serum glucose values gradually to avoid overtreatment, just as we would do with elevated serum sodium levels. Changes in neurologic findings, serum blood glucose level, and serum osmolality should be followed closely. A review showed that a favorable recovery from osmotic demyelination syndrome is possible even with severe neurologic deficits.4
TAKE-AWAY POINTS
- Osmotic demyelination syndrome is a rare but severe complication of a hyperosmolar hyperglycemic state.
- Physicians should be aware not only of changes in serum sodium, but also of changes in serum osmolality and serum glucose.
- When a new-onset neurologic deficit is found during treatment of a hyperosmolar hyperglycemic state, suspect osmotic demyelination syndrome, monitor changes in serum osmolality, and consider brain MRI.
- Brown WD. Osmotic demyelination disorders: central pontine and extrapontine myelinolysis. Curr Opin Neurol 2000; 13(6):691–697. pmid:11148672
- Laureno R, Karp BI. Myelinolysis after correction of hyponatraemia. Ann Intern Med 1997; 126(1):57–62. pmid:8992924
- Adams RD, Victor M, Mancall EL. Central pontine myelinolysis: a hitherto undescribed disease occurring in alcoholic and malnourished patients. AMA Arch Neurol Psychiatry 1959; 81(2):154–172. pmid:13616772
- Singh TD, Fugate JE, Rabinstein AA. Central pontine and extrapontine myelinolysis: a systematic review. Eur J Neurol 2014; 21(12):1443–1450. doi:10.1111/ene.12571
- Scott AR; Joint British Diabetes Societies (JBDS) for Inpatient Care; JBDS Hyperosmolar Hyperglycaemic Guidelines Group. Management of hyperosmolar hyperglycaemic state in adults with diabetes. Diabet Med 2015; 32(6):714–724. doi:10.1111/dme.12757
- McComb RD, Pfeiffer RF, Casey JH, Wolcott G, Till DJ. Lateral pontine and extrapontine myelinolysis associated with hypernatremia and hyperglycemia. Clin Neuropathol 1989; 8(6):284–288. pmid:2695277
- O’Malley G, Moran C, Draman MS, et al. Central pontine myelinolysis complicating treatment of the hyperglycaemic hyperosmolar state. Ann Clin Biochem 2008; 45(pt 4):440–443. doi:10.1258/acb.2008.007171
- Burns JD, Kosa SC, Wijdicks EF. Central pontine myelinolysis in a patient with hyperosmolar hyperglycemia and consistently normal serum sodium. Neurocrit Care 2009; 11(2):251–254. doi:10.1007/s12028-009-9241-9
- Mao S, Liu Z, Ding M. Central pontine myelinolysis in a patient with epilepsia partialis continua and hyperglycaemic hyperosmolar state. Ann Clin Biochem 2011; 48(pt 1):79–82. doi:10.1258/acb.2010.010152. Epub 2010 Nov 23.
- Guerrero WR, Dababneh H, Nadeau SE. Hemiparesis, encephalopathy, and extrapontine osmotic myelinolysis in the setting of hyperosmolar hyperglycemia. J Clin Neurosci 2013; 20(6):894–896. doi:10.1016/j.jocn.2012.05.045
- Hegazi MO, Mashankar A. Central pontine myelinolysis in the hyperosmolar hyperglycaemic state. Med Princ Pract 2013; 22(1):96–99. doi:10.1159/000341718
- Rodríguez-Velver KV, Soto-Garcia AJ, Zapata-Rivera MA, Montes-Villarreal J, Villarreal-Pérez JZ, Rodríguez-Gutiérrez R. Osmotic demyelination syndrome as the initial manifestation of a hyperosmolar hyperglycemic state. Case Rep Neurol Med 2014; 2014:652523. doi:10.1155/2014/652523
- Chang YM. Central pontine myelinolysis associated with diabetic hyperglycemia. JSM Clin Case Rep 2014; 2(6):1059.
A 55-year-old man with a 20-year history of type 2 diabetes mellitus was admitted to the hospital after presenting to the emergency department with an acute change in mental status. Three days earlier, he had begun to feel abdominal discomfort and dizziness, which gradually worsened.
On presentation, his Glasgow Coma Scale score was 13 out of 15 (eye-opening response 3 of 4, verbal response 4 of 5, motor response 6 of 6), his blood pressure was 221/114 mm Hg, and other vital signs were normal. Physical examination including a neurologic examination was normal. No gait abnormality or ataxia was noted.
When asked about current medications, he said that 2 years earlier he had missed an appointment with his primary care physician and so had never obtained refills of his diabetes medications.
Results of laboratory testing were as follows:
- Blood glucose 1,011 mg/dL (reference range 65–110)
- Hemoglobin A1c 17.8% (4%–5.6%)
- Sodium 126 mmol/L (135–145)
- Sodium corrected for serum glucose 141 mmol/L
- Potassium 3.2 mmol/L (3.5–5.0)
- Blood urea nitrogen 43.8 mg/dL (8–21)
- Calculated serum osmolality 324 mosm/kg (275–295).
Blood gas analysis showed no acidosis. Tests for urinary and serum ketones were negative. Computed tomography (CT) of the head without contrast was normal.
Based on the results of the evaluation, the patient’s condition was diagnosed as a hyperosmolar hyperglycemic state, presumably from dehydration and noncompliance with diabetes medications. His altered mental status was also attributed to this diagnosis. He was started on aggressive hydration and insulin infusion to correct the blood glucose level. Repeat laboratory testing 7 hours after admission revealed a blood glucose of 49 mg/dL, sodium 148 mmol/L, blood urea nitrogen 43 mg/dL, and calculated serum osmolality 290 mosm/kg.
The insulin infusion was suspended, and glucose infusion was started. With this treatment, his blood glucose level stabilized, but his Glasgow Coma Scale score was unchanged from the time of presentation. A neurologic examination at this time showed bilateral dysmetria. Cranial nerves were normal. Motor examination showed normal tone with a Medical Research Council score of 5 of 5 in all extremities. Sensory examination revealed a glove-and-stocking pattern of loss of vibratory sensation. Tendon reflexes were normal except for diminished bilateral knee-jerk and ankle-jerk responses.
OSMOTIC DEMYELINATION SYNDROME
Central pontine myelinolysis is a pivotal manifestation of the syndrome and is characterized by progressive lethargy, quadriparesis, dysarthria, ophthalmoplegia, dysphasia, ataxia, and reflex changes. Clinical symptoms of extrapontine myelinolysis are variable.4
Although CT may underestimate osmotic demyelination syndrome, the typical radiologic findings on brain MRI are hyperintense lesions in the central pons or associated extrapontine structures on T2-weighted and fluid-attenuated inversion recovery sequences.4
A precise definition of hyperosmolar hyperglycemia does not exist. The Joint British Diabetes Societies for Inpatient Care suggested the following features: a measured osmolality of 320 mosm/kg or higher, a blood glucose level of 541 mg/dL or higher, severe dehydration, and feeling unwell.5
Our patient’s clinical course and high hemoglobin A1c suggested prolonged hyperglycemia and high serum osmolality before his admission. After his admission, aggressive hydration and insulin therapy corrected the hyperglycemia and serum osmolality too rapidly for his brain cells to adjust to the change. It was reasonable to suspect a hyperosmolar hyperglycemic state as one of the main causes of his mental status change and ataxia. This, along with lack of improvement in his impaired metal status and new-onset ataxia despite treatment, led to suspicion of osmotic demyelination syndrome. His diminished bilateral knee-jerk and ankle-jerk responses more likely represented diabetic neuropathy rather than osmotic demyelination syndrome.
Osmotic demyelination syndrome has seldom been reported as a complication of hyperosmolar hyperglycemia.6–13 And extrapontine myelinolysis with hyperosmolar hyperglycemia is extremely rare, with only 2 reports to date to the best of our knowledge.6,10
There is no specific treatment for osmotic demyelination syndrome except for supportive care and treatment of coexisting conditions. Once an osmotic derangement is identified, we recommend correcting chronically elevated serum glucose values gradually to avoid overtreatment, just as we would do with elevated serum sodium levels. Changes in neurologic findings, serum blood glucose level, and serum osmolality should be followed closely. A review showed that a favorable recovery from osmotic demyelination syndrome is possible even with severe neurologic deficits.4
TAKE-AWAY POINTS
- Osmotic demyelination syndrome is a rare but severe complication of a hyperosmolar hyperglycemic state.
- Physicians should be aware not only of changes in serum sodium, but also of changes in serum osmolality and serum glucose.
- When a new-onset neurologic deficit is found during treatment of a hyperosmolar hyperglycemic state, suspect osmotic demyelination syndrome, monitor changes in serum osmolality, and consider brain MRI.
- Brown WD. Osmotic demyelination disorders: central pontine and extrapontine myelinolysis. Curr Opin Neurol 2000; 13(6):691–697. pmid:11148672
- Laureno R, Karp BI. Myelinolysis after correction of hyponatraemia. Ann Intern Med 1997; 126(1):57–62. pmid:8992924
- Adams RD, Victor M, Mancall EL. Central pontine myelinolysis: a hitherto undescribed disease occurring in alcoholic and malnourished patients. AMA Arch Neurol Psychiatry 1959; 81(2):154–172. pmid:13616772
- Singh TD, Fugate JE, Rabinstein AA. Central pontine and extrapontine myelinolysis: a systematic review. Eur J Neurol 2014; 21(12):1443–1450. doi:10.1111/ene.12571
- Scott AR; Joint British Diabetes Societies (JBDS) for Inpatient Care; JBDS Hyperosmolar Hyperglycaemic Guidelines Group. Management of hyperosmolar hyperglycaemic state in adults with diabetes. Diabet Med 2015; 32(6):714–724. doi:10.1111/dme.12757
- McComb RD, Pfeiffer RF, Casey JH, Wolcott G, Till DJ. Lateral pontine and extrapontine myelinolysis associated with hypernatremia and hyperglycemia. Clin Neuropathol 1989; 8(6):284–288. pmid:2695277
- O’Malley G, Moran C, Draman MS, et al. Central pontine myelinolysis complicating treatment of the hyperglycaemic hyperosmolar state. Ann Clin Biochem 2008; 45(pt 4):440–443. doi:10.1258/acb.2008.007171
- Burns JD, Kosa SC, Wijdicks EF. Central pontine myelinolysis in a patient with hyperosmolar hyperglycemia and consistently normal serum sodium. Neurocrit Care 2009; 11(2):251–254. doi:10.1007/s12028-009-9241-9
- Mao S, Liu Z, Ding M. Central pontine myelinolysis in a patient with epilepsia partialis continua and hyperglycaemic hyperosmolar state. Ann Clin Biochem 2011; 48(pt 1):79–82. doi:10.1258/acb.2010.010152. Epub 2010 Nov 23.
- Guerrero WR, Dababneh H, Nadeau SE. Hemiparesis, encephalopathy, and extrapontine osmotic myelinolysis in the setting of hyperosmolar hyperglycemia. J Clin Neurosci 2013; 20(6):894–896. doi:10.1016/j.jocn.2012.05.045
- Hegazi MO, Mashankar A. Central pontine myelinolysis in the hyperosmolar hyperglycaemic state. Med Princ Pract 2013; 22(1):96–99. doi:10.1159/000341718
- Rodríguez-Velver KV, Soto-Garcia AJ, Zapata-Rivera MA, Montes-Villarreal J, Villarreal-Pérez JZ, Rodríguez-Gutiérrez R. Osmotic demyelination syndrome as the initial manifestation of a hyperosmolar hyperglycemic state. Case Rep Neurol Med 2014; 2014:652523. doi:10.1155/2014/652523
- Chang YM. Central pontine myelinolysis associated with diabetic hyperglycemia. JSM Clin Case Rep 2014; 2(6):1059.
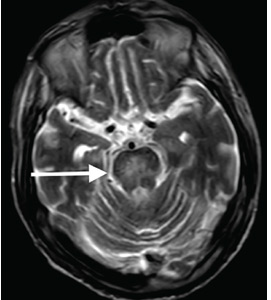
When does S aureus bacteremia require transesophageal echocardiography?
Staphylococcus aureus is the most common infective agent in native and prosthetic valve endocarditis, and 13% to 22% of patients with S aureus bacteremia have infective endocarditis.1
Transthoracic echocardiography (TTE) is a good starting point in the workup of suspected infective endocarditis, but transesophageal echocardiography (TEE) plays a key role in diagnosis and is indicated in patients with a high pretest probability of infective endocarditis, as in the following scenarios:
- Clinical picture consistent with infective endocarditis
- Presence of previously placed port or other indwelling vascular device
- Presence of a prosthetic valve or other prosthetic material
- Presence of a pacemaker
- History of valve disease
- Injection drug use
- Positive blood cultures after 72 hours despite appropriate antibiotic treatment
- Abnormal TTE result requiring better visualization of valvular anatomy and function and confirmation of local complications
- Absence of another reasonable explanation for S aureus bacteremia.
Forgoing TEE is reasonable in patients with normal results on TTE, no predisposing risk factors, a reasonable alternative explanation for S aureus bacteremia, and a low pretest probability of infective endocarditis.1 TEE may also be unnecessary if there is another disease focus requiring extended treatment (eg, vertebral infection) and there are no findings suggesting complicated infective endocarditis, eg, persistent bacteremia, symptoms of heart failure, and conduction abnormality.1
TEE also may be unnecessary in patients at low risk who have identifiable foci of bacteremia due to soft-tissue infection or a newly placed vascular catheter and whose bacteremia clears within 72 hours of the start of antibiotic therapy. These patients may be followed clinically for the development of new findings such as metastatic foci of infection (eg, septic pulmonary emboli, renal infarction, splenic abscess or infarction), the new onset of heart failure or cardiac conduction abnormality, or recurrence of previously cleared S aureus bacteremia. If these should develop, then a more invasive study such as TEE may be warranted.
INFECTIVE ENDOCARDITIS: EPIDEMIOLOGY AND MICROBIOLOGY
The US incidence rate of infective endocarditis has steadily increased, with an estimated 457,052 hospitalizations from 2000 to 2011. During that period, from 2000 to 2007, there was a marked increase in valve replacement surgeries.2 This trend is likely explained by an increase in the at-risk population—eg, elderly patients, patients with opiate dependence or diabetes, and patients on hemodialysis.
Although S aureus is the predominant pathogen in infective endocarditis,2–5 S aureus bacteremia is often observed in patients with skin or soft-tissue infection, prosthetic device infection, vascular graft or catheter infection, and bone and joint infections. S aureus bacteremia necessitates a search for the source of infection.
S aureus is a major pathogen in bloodstream infections, and up to 14% of patients with S aureus bacteremia have infective endocarditis as the primary source of infection.3 The pathogenesis of S aureus infective endocarditis is thought to be mediated by cell-wall factors that promote adhesion to the extracellular matrix of intravascular structures.3
A new localizing symptom such as back pain, joint pain, or swelling in a patient with S aureus bacteremia should trigger an investigation for metastatic infection.
Infectious disease consultation in patients with S aureus bacteremia is associated with improved outcomes and, thus, should be pursued.3
A cardiac surgery consult is recommended early on in cases of infective endocarditis caused by vancomycin-resistant enterococci, Pseudomonas aeruginosa, and fungi, as well as in patients with complications such as valvular insufficiency, perivalvular abscess, conduction abnormalities, persistent bacteremia, and metastatic foci of infection.6
RISK FACTORS
Risk factors for infective endocarditis include injection drug abuse, valvular heart disease, congenital heart disease (unrepaired, repaired with residual defects, or fully repaired within the past 6 months), previous infective endocarditis, prosthetic heart valve, and cardiac transplant.2–4,6 Other risk factors are poor dentition, hemodialysis, ventriculoatrial shunts, intravascular devices including vascular grafts, and pacemakers.2,3 Many risk factors for infective endocarditis and S aureus bacteremia overlap.3
DIAGNOSTIC PRINCIPLES
The clinical presentation of infective endocarditis can vary from a nonspecific infectious syndrome, to overt organ failure (heart failure, kidney failure), to an acute vascular catastrophe (arterial ischemia, cerebrovascular accidents, myocardial infarction). Patients may present with indolent symptoms such as fever, fatigue, and weight loss,6 or they may present at an advanced stage, with fulminant acute heart failure due to valvular insufficiency or with arrhythmias due to a perivalvular abscess infiltrating the conduction system. Extracardiac clinical manifestations may be related to direct infective metastatic foci such as septic emboli or to immunologic phenomena such as glomerulonephritis or Osler nodes.


ECHOCARDIOGRAPHY’S ROLE IN DIAGNOSIS
TTE plays an important role in diagnosis and risk stratification of infective endocarditis.6 TTE is usually done first because of its low cost, wide availability, and safety; it has a sensitivity of 70% and a specificity over 95%.8 While a normal result on TTE does not completely rule out infective endocarditis, completely normal valvular morphology and function on TTE make the diagnosis less likely.8,9
If suspicion remains high despite a normal study, repeating TTE at a later time may result in a higher diagnostic yield because of growth of the suspected vegetation. Otherwise, TEE should be considered.
TEE provides a higher spatial resolution and diagnostic yield than TTE, especially for detecting complex pathology such as pseudoaneurysm, valve perforation, or valvular abscess. TEE has a sensitivity and specificity of approximately 95% for infective endocarditis.8 It should be performed early in patients with preexisting valve disease, prosthetic cardiac material (eg, valves), or a pacemaker or implantable cardioverter-defibrillator.6,7
Detecting valve vegetation provides answers about the cause of S aureus bacteremia with its complications (eg, septic emboli, mycotic aneurysm) and informs decisions about the duration of antibiotic therapy and the need for surgery.3,6
As with any diagnostic test, it is important to compare the results of any recent study with those of previous studies whenever possible to differentiate new from old findings.
WHEN TO FORGO TEE IN S AUREUS BACTEREMIA
Because TEE is invasive and requires the patient to swallow an endoscopic probe,10 it is important to screen patients for esophageal disease, cervical spine conditions, and baseline respiratory insufficiency. Complications are rare but include esophageal perforation, esophageal bleeding, pharyngeal hematoma, and reactions to anesthesia.10
As with any diagnostic test, the clinician first needs to consider the patient’s pretest probability of the disease, the diagnostic accuracy, the associated risks and costs, and the implications of the results.
While TEE provides better diagnostic images than TTE, a normal TEE study does not exclude the diagnosis of infective endocarditis: small lesions and complications such as paravalvular abscess of a prosthetic aortic valve may still be missed. In such patients, a repeat TEE examination or additional imaging study (eg, gated computed tomographic angiography) should be considered.6
Noninfective sterile echodensities, valvular tumors such as papillary fibroelastomas, Lambl excrescences, and suture lines of prosthetic valves are among the conditions and factors that can cause a false-positive result on TEE.
- Young H, Knepper BC, Price CS, Heard S, Jenkins TC. Clinical reasoning of infectious diseases physicians behind the use or nonuse of transesophageal echocardiography in Staphylococcus aureus bacteremia. Open Forum Infect Dis 2016; 3(4):ofw204. doi:10.1093/ofid/ofw204
- Pant S, Patel NJ, Deshmukh A, et al. Trends in infective endocarditis incidence, microbiology, and valve replacement in the United States from 2000 to 2011. J Am Coll Cardiol 2015; 65(19):2070–2076. doi:10.1016/j.jacc.2015.03.518
- Tong SY, Davis JS, Eichenberger E, Holland TL, Fowler VG Jr. Staphylococcus aureus infections: epidemiology, pathophysiology, clinical manifestations, and management. Clin Microbiol Rev 2015; 28(3):603–661. doi:10.1128/CMR.00134-14
- Palraj BR, Baddour LM, Hess EP, et al. Predicting risk of endocarditis using a clinical tool (PREDICT): scoring system to guide use of echocardiography in the management of Staphylococcus aureus bacteremia. Clin Infect Dis 2015; 61(1):18–28. doi:10.1093/cid/civ235
- Barton T, Moir S, Rehmani H, Woolley I, Korman TM, Stuart RL. Low rates of endocarditis in healthcare-associated Staphylococcus aureus bacteremia suggest that echocardiography might not always be required. Eur J Clin Microbiol Infect Dis 2016; 35(1):49–55. doi:10.1007/s10096-015-2505-8
- Baddour LM, Wilson WR, Bayer AS, et al; American Heart Association Committee on Rheumatic Fever, Endocarditis, and Kawasaki Disease of the Council on Cardiovascular Disease in the Young, Council on Clinical Cardiology, Council on Cardiovascular Surgery and Anesthesia, and Stroke Council. Infective endocarditis in adults: diagnosis, antimicrobial therapy, and management of complications: a scientific statement for healthcare professionals from the American Heart Association. Circulation 2015; 132(15):1435–1486. doi10.1161/CIR.0000000000000296
- Li JS, Sexton DJ, Mick N, et al. Proposed modifications to the Duke criteria for the diagnosis of infective endocarditis. Clin Infect Dis 2000; 30(4):633–638. doi:10.1086/313753
- Habib G, Badano L, Tribouilloy C, et al; European Association of Echocardiography. Recommendations for the practice of echocardiography in infective endocarditis. Eur J Echocardiogr 2010; 11(2):202–219. doi:10.1093/ejechocard/jeq004
- Irani WN, Grayburn PA, Afridi I. A negative transthoracic echocardiogram obviates the need for transesophageal echocardiography in patients with suspected native valve active infective endocarditis. Am J Cardiol 1996; 78(1):101–103. pmid:8712097
- Hahn RT, Abraham T, Adams MS, et al. Guidelines for performing a comprehensive transesophageal echocardiographic examination: recommendations from the American Society of Echocardiography and the Society of Cardiovascular Anesthesiologists. J Am Soc Echocardiogr 2013; 26(9):921–964. doi:10.1016/j.echo.2013.07.009
Staphylococcus aureus is the most common infective agent in native and prosthetic valve endocarditis, and 13% to 22% of patients with S aureus bacteremia have infective endocarditis.1
Transthoracic echocardiography (TTE) is a good starting point in the workup of suspected infective endocarditis, but transesophageal echocardiography (TEE) plays a key role in diagnosis and is indicated in patients with a high pretest probability of infective endocarditis, as in the following scenarios:
- Clinical picture consistent with infective endocarditis
- Presence of previously placed port or other indwelling vascular device
- Presence of a prosthetic valve or other prosthetic material
- Presence of a pacemaker
- History of valve disease
- Injection drug use
- Positive blood cultures after 72 hours despite appropriate antibiotic treatment
- Abnormal TTE result requiring better visualization of valvular anatomy and function and confirmation of local complications
- Absence of another reasonable explanation for S aureus bacteremia.
Forgoing TEE is reasonable in patients with normal results on TTE, no predisposing risk factors, a reasonable alternative explanation for S aureus bacteremia, and a low pretest probability of infective endocarditis.1 TEE may also be unnecessary if there is another disease focus requiring extended treatment (eg, vertebral infection) and there are no findings suggesting complicated infective endocarditis, eg, persistent bacteremia, symptoms of heart failure, and conduction abnormality.1
TEE also may be unnecessary in patients at low risk who have identifiable foci of bacteremia due to soft-tissue infection or a newly placed vascular catheter and whose bacteremia clears within 72 hours of the start of antibiotic therapy. These patients may be followed clinically for the development of new findings such as metastatic foci of infection (eg, septic pulmonary emboli, renal infarction, splenic abscess or infarction), the new onset of heart failure or cardiac conduction abnormality, or recurrence of previously cleared S aureus bacteremia. If these should develop, then a more invasive study such as TEE may be warranted.
INFECTIVE ENDOCARDITIS: EPIDEMIOLOGY AND MICROBIOLOGY
The US incidence rate of infective endocarditis has steadily increased, with an estimated 457,052 hospitalizations from 2000 to 2011. During that period, from 2000 to 2007, there was a marked increase in valve replacement surgeries.2 This trend is likely explained by an increase in the at-risk population—eg, elderly patients, patients with opiate dependence or diabetes, and patients on hemodialysis.
Although S aureus is the predominant pathogen in infective endocarditis,2–5 S aureus bacteremia is often observed in patients with skin or soft-tissue infection, prosthetic device infection, vascular graft or catheter infection, and bone and joint infections. S aureus bacteremia necessitates a search for the source of infection.
S aureus is a major pathogen in bloodstream infections, and up to 14% of patients with S aureus bacteremia have infective endocarditis as the primary source of infection.3 The pathogenesis of S aureus infective endocarditis is thought to be mediated by cell-wall factors that promote adhesion to the extracellular matrix of intravascular structures.3
A new localizing symptom such as back pain, joint pain, or swelling in a patient with S aureus bacteremia should trigger an investigation for metastatic infection.
Infectious disease consultation in patients with S aureus bacteremia is associated with improved outcomes and, thus, should be pursued.3
A cardiac surgery consult is recommended early on in cases of infective endocarditis caused by vancomycin-resistant enterococci, Pseudomonas aeruginosa, and fungi, as well as in patients with complications such as valvular insufficiency, perivalvular abscess, conduction abnormalities, persistent bacteremia, and metastatic foci of infection.6
RISK FACTORS
Risk factors for infective endocarditis include injection drug abuse, valvular heart disease, congenital heart disease (unrepaired, repaired with residual defects, or fully repaired within the past 6 months), previous infective endocarditis, prosthetic heart valve, and cardiac transplant.2–4,6 Other risk factors are poor dentition, hemodialysis, ventriculoatrial shunts, intravascular devices including vascular grafts, and pacemakers.2,3 Many risk factors for infective endocarditis and S aureus bacteremia overlap.3
DIAGNOSTIC PRINCIPLES
The clinical presentation of infective endocarditis can vary from a nonspecific infectious syndrome, to overt organ failure (heart failure, kidney failure), to an acute vascular catastrophe (arterial ischemia, cerebrovascular accidents, myocardial infarction). Patients may present with indolent symptoms such as fever, fatigue, and weight loss,6 or they may present at an advanced stage, with fulminant acute heart failure due to valvular insufficiency or with arrhythmias due to a perivalvular abscess infiltrating the conduction system. Extracardiac clinical manifestations may be related to direct infective metastatic foci such as septic emboli or to immunologic phenomena such as glomerulonephritis or Osler nodes.
ECHOCARDIOGRAPHY’S ROLE IN DIAGNOSIS
TTE plays an important role in diagnosis and risk stratification of infective endocarditis.6 TTE is usually done first because of its low cost, wide availability, and safety; it has a sensitivity of 70% and a specificity over 95%.8 While a normal result on TTE does not completely rule out infective endocarditis, completely normal valvular morphology and function on TTE make the diagnosis less likely.8,9
If suspicion remains high despite a normal study, repeating TTE at a later time may result in a higher diagnostic yield because of growth of the suspected vegetation. Otherwise, TEE should be considered.
TEE provides a higher spatial resolution and diagnostic yield than TTE, especially for detecting complex pathology such as pseudoaneurysm, valve perforation, or valvular abscess. TEE has a sensitivity and specificity of approximately 95% for infective endocarditis.8 It should be performed early in patients with preexisting valve disease, prosthetic cardiac material (eg, valves), or a pacemaker or implantable cardioverter-defibrillator.6,7
Detecting valve vegetation provides answers about the cause of S aureus bacteremia with its complications (eg, septic emboli, mycotic aneurysm) and informs decisions about the duration of antibiotic therapy and the need for surgery.3,6
As with any diagnostic test, it is important to compare the results of any recent study with those of previous studies whenever possible to differentiate new from old findings.
WHEN TO FORGO TEE IN S AUREUS BACTEREMIA
Because TEE is invasive and requires the patient to swallow an endoscopic probe,10 it is important to screen patients for esophageal disease, cervical spine conditions, and baseline respiratory insufficiency. Complications are rare but include esophageal perforation, esophageal bleeding, pharyngeal hematoma, and reactions to anesthesia.10
As with any diagnostic test, the clinician first needs to consider the patient’s pretest probability of the disease, the diagnostic accuracy, the associated risks and costs, and the implications of the results.
While TEE provides better diagnostic images than TTE, a normal TEE study does not exclude the diagnosis of infective endocarditis: small lesions and complications such as paravalvular abscess of a prosthetic aortic valve may still be missed. In such patients, a repeat TEE examination or additional imaging study (eg, gated computed tomographic angiography) should be considered.6
Noninfective sterile echodensities, valvular tumors such as papillary fibroelastomas, Lambl excrescences, and suture lines of prosthetic valves are among the conditions and factors that can cause a false-positive result on TEE.
- Young H, Knepper BC, Price CS, Heard S, Jenkins TC. Clinical reasoning of infectious diseases physicians behind the use or nonuse of transesophageal echocardiography in Staphylococcus aureus bacteremia. Open Forum Infect Dis 2016; 3(4):ofw204. doi:10.1093/ofid/ofw204
- Pant S, Patel NJ, Deshmukh A, et al. Trends in infective endocarditis incidence, microbiology, and valve replacement in the United States from 2000 to 2011. J Am Coll Cardiol 2015; 65(19):2070–2076. doi:10.1016/j.jacc.2015.03.518
- Tong SY, Davis JS, Eichenberger E, Holland TL, Fowler VG Jr. Staphylococcus aureus infections: epidemiology, pathophysiology, clinical manifestations, and management. Clin Microbiol Rev 2015; 28(3):603–661. doi:10.1128/CMR.00134-14
- Palraj BR, Baddour LM, Hess EP, et al. Predicting risk of endocarditis using a clinical tool (PREDICT): scoring system to guide use of echocardiography in the management of Staphylococcus aureus bacteremia. Clin Infect Dis 2015; 61(1):18–28. doi:10.1093/cid/civ235
- Barton T, Moir S, Rehmani H, Woolley I, Korman TM, Stuart RL. Low rates of endocarditis in healthcare-associated Staphylococcus aureus bacteremia suggest that echocardiography might not always be required. Eur J Clin Microbiol Infect Dis 2016; 35(1):49–55. doi:10.1007/s10096-015-2505-8
- Baddour LM, Wilson WR, Bayer AS, et al; American Heart Association Committee on Rheumatic Fever, Endocarditis, and Kawasaki Disease of the Council on Cardiovascular Disease in the Young, Council on Clinical Cardiology, Council on Cardiovascular Surgery and Anesthesia, and Stroke Council. Infective endocarditis in adults: diagnosis, antimicrobial therapy, and management of complications: a scientific statement for healthcare professionals from the American Heart Association. Circulation 2015; 132(15):1435–1486. doi10.1161/CIR.0000000000000296
- Li JS, Sexton DJ, Mick N, et al. Proposed modifications to the Duke criteria for the diagnosis of infective endocarditis. Clin Infect Dis 2000; 30(4):633–638. doi:10.1086/313753
- Habib G, Badano L, Tribouilloy C, et al; European Association of Echocardiography. Recommendations for the practice of echocardiography in infective endocarditis. Eur J Echocardiogr 2010; 11(2):202–219. doi:10.1093/ejechocard/jeq004
- Irani WN, Grayburn PA, Afridi I. A negative transthoracic echocardiogram obviates the need for transesophageal echocardiography in patients with suspected native valve active infective endocarditis. Am J Cardiol 1996; 78(1):101–103. pmid:8712097
- Hahn RT, Abraham T, Adams MS, et al. Guidelines for performing a comprehensive transesophageal echocardiographic examination: recommendations from the American Society of Echocardiography and the Society of Cardiovascular Anesthesiologists. J Am Soc Echocardiogr 2013; 26(9):921–964. doi:10.1016/j.echo.2013.07.009

S aureus bacteremia: TEE and infectious disease consultation
Morbidity and mortality rates in patients with Staphylococcus aureus bacteremia remain high even though diagnostic tests have improved and antibiotic therapy is effective. Diagnosis and management are made more complex by difficulties in finding the source of bacteremia and sites of metastatic infection.
S aureus bacteremia is a finding that demands further investigation, since up to 25% of people who have it may have endocarditis, a condition with even worse consequences.1 The ability of S aureus to infect normal valves2,3 adds to the challenge. In the mid-20th century, Wilson and Hamburger4 demonstrated that 64% of patients with S aureus bacteremia had evidence of valvular infection at autopsy. In a more recent case series of patients with S aureus endocarditis, the diagnosis was established at autopsy in 32%.5
Specific clinical findings in patients with complicated S aureus bacteremia—those who have a site of infection remote from or extended beyond the primary focus—may be useful in determining the need for additional diagnostic and therapeutic measures.
In a prospective cohort study, Fowler et al6 identified several factors that predicted complicated S aureus bacteremia (including but not limited to endocarditis):
- Prolonged bacteremia (> 48–72 hours after initiation of therapy)
- Community onset
- Fever persisting more than 72 hours
- Skin findings suggesting systemic infection.
THE ROLE OF ECHOCARDIOGRAPHY
Infective endocarditis may be difficult to detect in patients with S aureus bacteremia; experts recommend routine use of echocardiography in this process.7,8 Transesophageal echocardiography (TEE) detects more cases of endocarditis than transthoracic echocardiography (TTE),9,10 but access, cost, and risks lead to questions about its utility.
Guidance for the use of echocardiography in S aureus bacteremia1,10–14 continues to evolve. Consensus seems to be emerging that the risk of endocarditis is lower in patients with S aureus bacteremia who:
- Do not have a prosthetic valve or other permanent intracardiac device
- Have sterile blood cultures within 96 hours after the initial set
- Are not hemodialysis-dependent
- Developed the bacteremia in a healthcare setting
- Have no secondary focus of infection
- Have no clinical signs of infective endocarditis.
Heriot et al14 point out that studies of risk-stratification approaches to echocardiography in patients with S aureus bacteremia are difficult to interpret, as there are questions regarding the validity of the studies and the balance of the risks and benefits.1 The question of timing of TEE remains largely unexplored, both in initial screening and in follow-up of previously undiagnosed cases of S aureus endocarditis.
In this issue of the Journal, Mirrakhimov et al15 weigh in on use of a risk-stratification model to guide use of TEE in patients with S aureus bacteremia. Their comments about avoiding TEE in patients who have an alternative explanation for S aureus bacteremia and a low pretest probability for infectious endocarditis and in patients with a disease focus that requires extended treatment are derived from a survey of infectious disease physicians.16
ROLE OF INFECTIOUS DISEASE CONSULTATION
Infectious disease consultation reduces mortality rates and healthcare costs for a variety of infections, with endocarditis as a prime example.17 For S aureus bacteremia, a large and growing body of literature demonstrates the impact of infectious disease consultation, including improved adherence to guidelines and quality measures,18–20 lower in-hospital mortality rates18–21 and earlier hospital discharge.18 In the era of “curbside consults” and “e-consultation,” it is interesting to note the enduring value of bedside, in-person consultation in the management of S aureus bacteremia.20
Many people with S aureus bacteremia should undergo TEE. Until the evidence becomes more robust, the decision to forgo TEE must be made with caution. The expertise of infectious disease physicians in the diagnosis and management of endocarditis can assist clinicians working with the often-complex patients who develop S aureus bacteremia. If the goal is to improve outcomes, infectious disease consultation may be at least as important as appropriate selection of patients for TEE.
- Rasmussen RV, Høst U, Arpi M, et al. Prevalence of infective endocarditis in patients with Staphylococcus aureus bacteraemia: the value of screening with echocardiography. Eur J Echocardiogr 2011; 12(6):414–420. doi:10.1093/ejechocard/jer023
- Vogler, WR, Dorney ER. Bacterial endocarditis in normal heart. Bull Emory Univ Clin 1961; 1:21–31.
- Thayer WS. Bacterial or infective endocarditis. Edinburgh Med J 1931; 38:237–265, 307–334.
- Wilson R, Hamburger M. Fifteen years’ experience with staphylococcus septicemia in large city hospital: analysis of fifty-five cases in Cincinnati General Hospital 1940 to 1954. Am J Med 1957; 22(3):437–457. pmid:13402795
- Røder BL, Wandall DA, Frimodt-Møllar N, Espersen F, Skinhøj P, Rosdahl VT. Clinical features of Staphylococcus aureus endocarditis: a 10-year experience in Denmark. Arch Intern Med 1999; 159(5):462–469. pmid:10074954
- Fowler VG Jr, Olsen MK, Corey GR, et al. Clinical identifiers of complicated Staphylococcus aureus bacteremia. Arch Intern Med 2003; 163(17):2066–2072. doi:10.1001/archinte.163.17.2066
- Baddour LM, Wilson WR, Bayer AS, et al; American Heart Association Committee on Rheumatic Fever, Endocarditis, and Kawasaki Disease of the Council on Cardiovascular Disease in the Young, Council on Clinical Cardiology, Council on Cardiovascular Surgery and Anesthesia, and Stroke Council. Infective endocarditis in adults: diagnosis, antimicrobial therapy, and management of complications: a scientific statement for healthcare professionals from the American Heart Association. Circulation 2015; 132(15):1435–1486. doi:10.1161/CIR.0000000000000296
- Liu C, Bayer A, Cosgrove SE, et al. Clinical practice guidelines by the Infectious Diseases Society of America for the treatment of methicillin-resistant Staphylococcus aureus infections in adults and children: executive summary. Clin Infect Dis 2011; 52(3):285–292. doi:10.1093/cid/cir034
- Reynolds HR, Jagen MA, Tunick PA, Kronzon I. Sensitivity of transthoracic versus transesophageal echocardiography for the detection of native valve vegetations in the modern era. J Am Soc Echocardiogr 2003; 16(1):67–70. doi:10.1067/mje.2003.43
- Holland TL, Arnold C, Fowler VG Jr. Clinical management of Staphylococcus aureus bacteremia: a review. JAMA 2014; 312(13):1330–1341. doi:10.1001/jama.2014.9743
- Kaasch AJ, Folwler VG Jr, Rieg S, et al. Use of a simple criteria set for guiding echocardiography in nosocomial Staphylococcus aureus bacteremia. Clin Infect Dis 2011; 53(1):1–9. doi:10.1093/cid/cir320
- Palraj BR, Baddour LM, Hess EP, et al. Predicting risk of endocarditis using a clinical tool (PREDICT): scoring system to guide use of echocardiography in the management of Staphylococcus aureus bacteremia. Clin Infect Dis 2015; 61(1):18–28. doi:10.1093/cid/civ235
- Bai AD, Agarawal A, Steinberg M, et al. Clinical predictors and clinical prediction rules to estimate initial patient risk for infective endocarditis in Staphylococcus aureus bacteremia: a systematic review and meta-analysis. Clin Microbiol Infect 2017; 23(12):900-906. doi:10.1016/j.cmi.2017.04.025
- Heriot GS, Cronin K, Tong SYC, Cheng AC, Liew D. Criteria for identifying patients with Staphylococcus aureus bacteremia who are at low risk of endocarditis: a systematic review. Open Forum Infect Dis 2017; 4(4):ofx261. doi:10.1093/ofid/ofx261
- Mirrakhimov AE, Jesinger ME, Ayach T, Gray A. When does S aureus bacteremia require transesophageal echocardiography? Cleve Clin J Med 2018; 85(7):517–520. doi:10.3949/ccjm.85a.16095
- Young H, Knepper BC, Price CS, Heard S, Jenkins TC. Clinical reasoning of infectious diseases physicians behind the use or nonuse of transesophageal echocardiography in Staphylococcus aureus bacteremia. Open Forum Infect Dis 2016; 3(4):ofw204. doi:10.1093/ofid/ofw204
- Schmitt S, McQuillen DP, Nahass R, et al. Infectious diseases specialty intervention is associated with decreased mortality and lower healthcare costs. Clin Infect Dis 2014; 58(1):22–28. doi:10.1093/cid/cit610
- Bai AD, Showler A, Burry L, et al. Impact of infectious disease consultation on quality of care, mortality, and length of stay in Staphylococcus aureus bacteremia: results from a large multicenter cohort study. Clin Infect Dis. 2015; 60(10):1451–1461. doi:10.1093/cid/civ120
- Buehrle K, Pisano J, Han Z, Pettit NN. Guideline compliance and clinical outcomes among patients with Staphylococcus aureus bacteremia with infectious diseases consultation in addition to antimicrobial stewardship-directed review. Am J Infect Control 2017; 45(7):713–716. doi:10.1016/j.ajic.2017.02.030
- Saunderson RB, Gouliouris T, Nickerson EK, et al. Impact of routine bedside infectious disease consultation on clinical management and outcome of Staphylococcus aureus bacteremia in adults. Clin Microbiol Infect 2015; 21(8):779–785. doi:10.1016/j.cmi.2015.05.026
- Lahey T, Shah R, Gittzus J, Schwartzman J, Kirkland K. Infectious diseases consultation lowers mortality from Staphylococcus aureus bacteremia. Medicine (Baltimore). 2009; 88(5):263–267. doi:10.1097/MD.0b013e3181b8fccb
Morbidity and mortality rates in patients with Staphylococcus aureus bacteremia remain high even though diagnostic tests have improved and antibiotic therapy is effective. Diagnosis and management are made more complex by difficulties in finding the source of bacteremia and sites of metastatic infection.
S aureus bacteremia is a finding that demands further investigation, since up to 25% of people who have it may have endocarditis, a condition with even worse consequences.1 The ability of S aureus to infect normal valves2,3 adds to the challenge. In the mid-20th century, Wilson and Hamburger4 demonstrated that 64% of patients with S aureus bacteremia had evidence of valvular infection at autopsy. In a more recent case series of patients with S aureus endocarditis, the diagnosis was established at autopsy in 32%.5
Specific clinical findings in patients with complicated S aureus bacteremia—those who have a site of infection remote from or extended beyond the primary focus—may be useful in determining the need for additional diagnostic and therapeutic measures.
In a prospective cohort study, Fowler et al6 identified several factors that predicted complicated S aureus bacteremia (including but not limited to endocarditis):
- Prolonged bacteremia (> 48–72 hours after initiation of therapy)
- Community onset
- Fever persisting more than 72 hours
- Skin findings suggesting systemic infection.
THE ROLE OF ECHOCARDIOGRAPHY
Infective endocarditis may be difficult to detect in patients with S aureus bacteremia; experts recommend routine use of echocardiography in this process.7,8 Transesophageal echocardiography (TEE) detects more cases of endocarditis than transthoracic echocardiography (TTE),9,10 but access, cost, and risks lead to questions about its utility.
Guidance for the use of echocardiography in S aureus bacteremia1,10–14 continues to evolve. Consensus seems to be emerging that the risk of endocarditis is lower in patients with S aureus bacteremia who:
- Do not have a prosthetic valve or other permanent intracardiac device
- Have sterile blood cultures within 96 hours after the initial set
- Are not hemodialysis-dependent
- Developed the bacteremia in a healthcare setting
- Have no secondary focus of infection
- Have no clinical signs of infective endocarditis.
Heriot et al14 point out that studies of risk-stratification approaches to echocardiography in patients with S aureus bacteremia are difficult to interpret, as there are questions regarding the validity of the studies and the balance of the risks and benefits.1 The question of timing of TEE remains largely unexplored, both in initial screening and in follow-up of previously undiagnosed cases of S aureus endocarditis.
In this issue of the Journal, Mirrakhimov et al15 weigh in on use of a risk-stratification model to guide use of TEE in patients with S aureus bacteremia. Their comments about avoiding TEE in patients who have an alternative explanation for S aureus bacteremia and a low pretest probability for infectious endocarditis and in patients with a disease focus that requires extended treatment are derived from a survey of infectious disease physicians.16
ROLE OF INFECTIOUS DISEASE CONSULTATION
Infectious disease consultation reduces mortality rates and healthcare costs for a variety of infections, with endocarditis as a prime example.17 For S aureus bacteremia, a large and growing body of literature demonstrates the impact of infectious disease consultation, including improved adherence to guidelines and quality measures,18–20 lower in-hospital mortality rates18–21 and earlier hospital discharge.18 In the era of “curbside consults” and “e-consultation,” it is interesting to note the enduring value of bedside, in-person consultation in the management of S aureus bacteremia.20
Many people with S aureus bacteremia should undergo TEE. Until the evidence becomes more robust, the decision to forgo TEE must be made with caution. The expertise of infectious disease physicians in the diagnosis and management of endocarditis can assist clinicians working with the often-complex patients who develop S aureus bacteremia. If the goal is to improve outcomes, infectious disease consultation may be at least as important as appropriate selection of patients for TEE.
- Rasmussen RV, Høst U, Arpi M, et al. Prevalence of infective endocarditis in patients with Staphylococcus aureus bacteraemia: the value of screening with echocardiography. Eur J Echocardiogr 2011; 12(6):414–420. doi:10.1093/ejechocard/jer023
- Vogler, WR, Dorney ER. Bacterial endocarditis in normal heart. Bull Emory Univ Clin 1961; 1:21–31.
- Thayer WS. Bacterial or infective endocarditis. Edinburgh Med J 1931; 38:237–265, 307–334.
- Wilson R, Hamburger M. Fifteen years’ experience with staphylococcus septicemia in large city hospital: analysis of fifty-five cases in Cincinnati General Hospital 1940 to 1954. Am J Med 1957; 22(3):437–457. pmid:13402795
- Røder BL, Wandall DA, Frimodt-Møllar N, Espersen F, Skinhøj P, Rosdahl VT. Clinical features of Staphylococcus aureus endocarditis: a 10-year experience in Denmark. Arch Intern Med 1999; 159(5):462–469. pmid:10074954
- Fowler VG Jr, Olsen MK, Corey GR, et al. Clinical identifiers of complicated Staphylococcus aureus bacteremia. Arch Intern Med 2003; 163(17):2066–2072. doi:10.1001/archinte.163.17.2066
- Baddour LM, Wilson WR, Bayer AS, et al; American Heart Association Committee on Rheumatic Fever, Endocarditis, and Kawasaki Disease of the Council on Cardiovascular Disease in the Young, Council on Clinical Cardiology, Council on Cardiovascular Surgery and Anesthesia, and Stroke Council. Infective endocarditis in adults: diagnosis, antimicrobial therapy, and management of complications: a scientific statement for healthcare professionals from the American Heart Association. Circulation 2015; 132(15):1435–1486. doi:10.1161/CIR.0000000000000296
- Liu C, Bayer A, Cosgrove SE, et al. Clinical practice guidelines by the Infectious Diseases Society of America for the treatment of methicillin-resistant Staphylococcus aureus infections in adults and children: executive summary. Clin Infect Dis 2011; 52(3):285–292. doi:10.1093/cid/cir034
- Reynolds HR, Jagen MA, Tunick PA, Kronzon I. Sensitivity of transthoracic versus transesophageal echocardiography for the detection of native valve vegetations in the modern era. J Am Soc Echocardiogr 2003; 16(1):67–70. doi:10.1067/mje.2003.43
- Holland TL, Arnold C, Fowler VG Jr. Clinical management of Staphylococcus aureus bacteremia: a review. JAMA 2014; 312(13):1330–1341. doi:10.1001/jama.2014.9743
- Kaasch AJ, Folwler VG Jr, Rieg S, et al. Use of a simple criteria set for guiding echocardiography in nosocomial Staphylococcus aureus bacteremia. Clin Infect Dis 2011; 53(1):1–9. doi:10.1093/cid/cir320
- Palraj BR, Baddour LM, Hess EP, et al. Predicting risk of endocarditis using a clinical tool (PREDICT): scoring system to guide use of echocardiography in the management of Staphylococcus aureus bacteremia. Clin Infect Dis 2015; 61(1):18–28. doi:10.1093/cid/civ235
- Bai AD, Agarawal A, Steinberg M, et al. Clinical predictors and clinical prediction rules to estimate initial patient risk for infective endocarditis in Staphylococcus aureus bacteremia: a systematic review and meta-analysis. Clin Microbiol Infect 2017; 23(12):900-906. doi:10.1016/j.cmi.2017.04.025
- Heriot GS, Cronin K, Tong SYC, Cheng AC, Liew D. Criteria for identifying patients with Staphylococcus aureus bacteremia who are at low risk of endocarditis: a systematic review. Open Forum Infect Dis 2017; 4(4):ofx261. doi:10.1093/ofid/ofx261
- Mirrakhimov AE, Jesinger ME, Ayach T, Gray A. When does S aureus bacteremia require transesophageal echocardiography? Cleve Clin J Med 2018; 85(7):517–520. doi:10.3949/ccjm.85a.16095
- Young H, Knepper BC, Price CS, Heard S, Jenkins TC. Clinical reasoning of infectious diseases physicians behind the use or nonuse of transesophageal echocardiography in Staphylococcus aureus bacteremia. Open Forum Infect Dis 2016; 3(4):ofw204. doi:10.1093/ofid/ofw204
- Schmitt S, McQuillen DP, Nahass R, et al. Infectious diseases specialty intervention is associated with decreased mortality and lower healthcare costs. Clin Infect Dis 2014; 58(1):22–28. doi:10.1093/cid/cit610
- Bai AD, Showler A, Burry L, et al. Impact of infectious disease consultation on quality of care, mortality, and length of stay in Staphylococcus aureus bacteremia: results from a large multicenter cohort study. Clin Infect Dis. 2015; 60(10):1451–1461. doi:10.1093/cid/civ120
- Buehrle K, Pisano J, Han Z, Pettit NN. Guideline compliance and clinical outcomes among patients with Staphylococcus aureus bacteremia with infectious diseases consultation in addition to antimicrobial stewardship-directed review. Am J Infect Control 2017; 45(7):713–716. doi:10.1016/j.ajic.2017.02.030
- Saunderson RB, Gouliouris T, Nickerson EK, et al. Impact of routine bedside infectious disease consultation on clinical management and outcome of Staphylococcus aureus bacteremia in adults. Clin Microbiol Infect 2015; 21(8):779–785. doi:10.1016/j.cmi.2015.05.026
- Lahey T, Shah R, Gittzus J, Schwartzman J, Kirkland K. Infectious diseases consultation lowers mortality from Staphylococcus aureus bacteremia. Medicine (Baltimore). 2009; 88(5):263–267. doi:10.1097/MD.0b013e3181b8fccb

Impact of Sagittal Rotation on Axial Glenoid Width Measurement in the Setting of Glenoid Bone Loss
ABSTRACT
Standard 2-dimensional (2-D) computed tomography (CT) scans of the shoulder are often aligned to the plane of the body as opposed to the plane of the scapula, which may challenge the ability to accurately measure glenoid width and glenoid bone loss (GBL). The purpose of this study is to determine the effect of sagittal rotation of the glenoid on axial anterior-posterior (AP) glenoid width measurements in the setting of anterior GBL.
Forty-three CT scans from consecutive patients with anterior GBL (minimum 10%) were reformatted utilizing open-source DICOM software (OsiriX MD). Patients were grouped according to extent of GBL: I, 10% to 14.9% (N = 12); II, 15% to 19.9% (N = 16); and III, >20% (N = 15). The uncorrected (UNCORR) and corrected (CORR) images were assessed in the axial plane at 5 standardized cuts and measured for AP glenoid width.
For groups I and III, UNCORR scans underestimated axial AP width (and thus overestimated anterior GBL) in cuts 1 and 2, while in cuts 3 to 5, the axial AP width was overestimated (GBL was underestimated). In Group II, axial AP width was underestimated (GBL was overestimated), while in cuts 2 to 5, the axial AP width was overestimated (GBL was underestimated). Overall, AP glenoid width was consistently underestimated in cut 1, the most caudal cut; while AP glenoid width was consistently overestimated in cuts 3 to 5, the more cephalad cuts.
UNCORR 2-D CT scans inaccurately estimated glenoid width and the degree of anterior GBL. This data suggests that corrected 2D CT scans or a 3-dimensional (3-D) reconstruction can help in accurately defining the anterior GBL in patients with shoulder instability.
The treatment of glenohumeral instability has substantially evolved over the past several decades. The understanding of glenoid bone loss (GBL), in particular, has advanced to such a level that we utilize the quantification of GBL for surgical decision-making. Unrecognized and/or untreated GBL is associated with recurrent instability, pain, and disability. Controversy exists, however, regarding the precise amount of anterior GBL that is significant enough to warrant surgical treatment. While historically, 25%1,2 of anterior GBL was thought to be the critical number required to warrant osseous augmentation, studies that are more recent have highlighted the need to perform osseous glenoid reconstruction with lesser degrees of GBL, particularly in the contact athlete.3-9 As small differences in the amount of GBL can change surgical decision-making from an all-soft tissue repair to an osseous reconstruction, it is paramount that we have accurate, valid, and reproducible methods for calculating GBL.
Continue to: Historically, plain radiographs...
Historically, plain radiographs have been the mainstay for evaluating the glenohumeral joint, including Grashey and axillary views, allowing clinicians to evaluate the congruency of the glenohumeral joint and to assess bone loss on both the glenoid and humeral head.1,10 While large, acute fractures of the glenoid are fairly evident on radiographs, including the Grashey view,11 shoulders with chronic and/or attritional anterior GBL are more difficult to evaluate, and often do not provide the information necessary to guide surgical decision-making.
Computed tomography (CT) of the shoulder has become the most commonly utilized imaging modality in the evaluation of patients with shoulder instability associated with GBL. Standard 2-dimensional (2-D) CT scans of the shoulder are often aligned to the plane of the body as opposed to the plane of the scapula/glenoid, as standard protocols often fail to account for the anterior sagittal rotation of the scapula/glenoid, similar to the disadvantage of standard radiographs. While 3-dimensional (3-D) CT reconstructions eliminate the effect of gantry angles, and thus allow for an en face view of the glenoid, 3-D reconstructions are not always available, and cannot always be measured.12-14 Thus, improved methodology for utilizing standard 2D scans is warranted, as the ability to correctly align the axial CT scan to the axis of the glenoid may allow for more accurate GBL measurements, which will ultimately impact surgical decision-making. Recently, Gross and colleagues15 reported the effect of sagittal rotation of the glenoid on axial measurements of anterior-posterior (AP) glenoid width and glenoid version in normal glenoids, without bone loss, and found that the mean angle of correction needed to align the sagittal plane was 20.1° ± 1.2° of rotation. To the authors’ knowledge, this same methodology has not been applied to patients with clinically meaningful anterior GBL. Given that the average glenoid width in human shoulders is 24.4 mm ± 2.9 mm,16 1 mm of glenoid bone loss (GBL) corresponds to approximately 4% of the glenoid width, and thus even subtle differences in the interpretation of GBL may have substantial clinical implications. Therefore, the purpose of this study is to determine the effect of sagittal rotation of the glenoid on axial AP glenoid width measurements in the setting of clinically significant anterior GBL.
METHODS
This study was approved by Massachusetts General Hospital Institutional Review Board. A retrospective review of consecutive patients with a diagnosis of anterior shoulder instability between 2009 and 2013 was conducted. Inclusion criteria comprised patients with a minimum of 10% anterior GBL, an available CT scan of the affected shoulder, and no history of prior ipsilateral surgeries. Exclusion criteria comprised evidence of degenerative changes to the glenoid and/or humeral head, as well as prior ipsilateral shoulder surgery. Sixty consecutive patients were originally identified as having anterior shoulder instability, and 17 were excluded based on the inclusion/exclusion criteria, leaving 43 patients (43 shoulders) available for inclusion. Shoulder CT scans from all 43 patients were reformatted utilizing open-source DICOM software (OsiriX MD, version 2.5.1 65-bit) multi-planar reconstruction (MPR).
CT PROTOCOL
All patients underwent a standard glenohumeral CT scan using a Siemens Sensation 64 Scanner (Siemens), a 64-detector scanner. Scans were acquired with 0.6 mm of collimation, 140 kV, and 300 mA-seconds. Slice thickness was set to 2 mm. All patient information was de-identified for analysis.
The uncorrected (UNCORR) scans were defined as the default orientation on the scanner. In the UNCORR scans, the axial, coronal, and sagittal views were oriented relative to the scanner gantry table, as opposed to the anatomy of the glenoid. The corrected (CORR) CT scans were aligned in all 3 planes relative to the glenoid face, and thus the cuts were perpendicular to the long axis of the glenoid.15 This resulted in sagittal cuts perpendicular to the 12-o’clock to 6-o’clock axis in the sagittal plane (Figure 1). 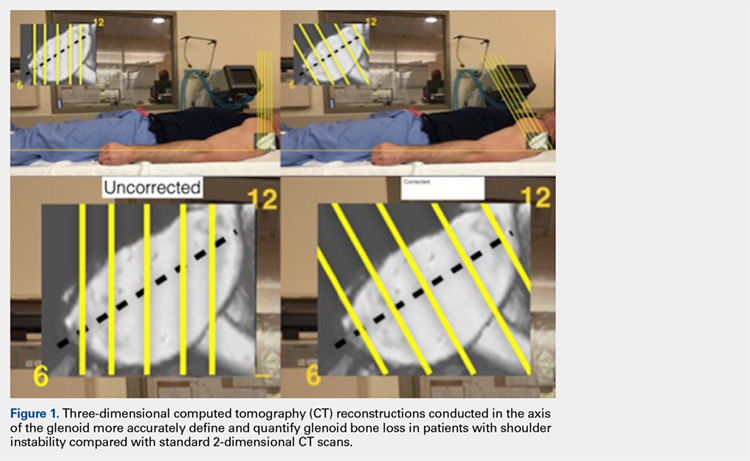
Continue to: In a de-identified fashion...
IMAGE ANALYSIS AND REFORMATTING
In a de-identified fashion, all CT scans were imported and analyzed using open-source Digital Imaging and Communications in Medicine (DICOM) software (OsiriX MD, version 2.5.1 64-bit). By following a previously developed method, CT scans were reformatted using OsiriX MPR. The OsiriX software has an MPR function that allows simultaneous manipulation of 2-D CT scans in 3 orthogonal planes: axial, sagittal, and coronal. In the MPR mode, the alternation of 1 plane directly affects the orientation of the remaining 2 planes. Thus, by using an MPR, one can analyze the impact that a default CT scan performed relative to the gantry of the table, UNCORR, has on the axial images.
First, the en face view was obtained via a 2-step process: alignment of the axial plane to account for the scapular angle, followed by alignment of the coronal plane to adjust for the glenoid inclination.15 These 2 adjustments provided a true en face sagittal glenoid view. The final adjustment step was a sagittal en face rotation of the glenoid such that the superior and inferior glenoid tubercles were placed on the 12-o’clock to 6-o’clock axis (CORR scan). Previous studies have identified a central longitudinal axis that was used in this method to align the supraglenoid tubercle with the 12-o’clock to 6-o’clock axis on the glenoid face.15,17,18 The standard error of mean was 1.21°. This new CORR view resulted in axial cuts through the glenoid that were oriented perpendicular to the 12-o’clock to 6-o’clock axis. The UNCORR and CORR images were assessed in the axial plane at 5 standardized cuts and measured for AP glenoid width by 2 independent observers in a blinded, randomized fashion. When the measured AP width of the UNCORR scan was less than that measured on the CORR scan, the AP width of the glenoid was considered underestimated, and the degree of GBL was considered overestimated (Figure 2). 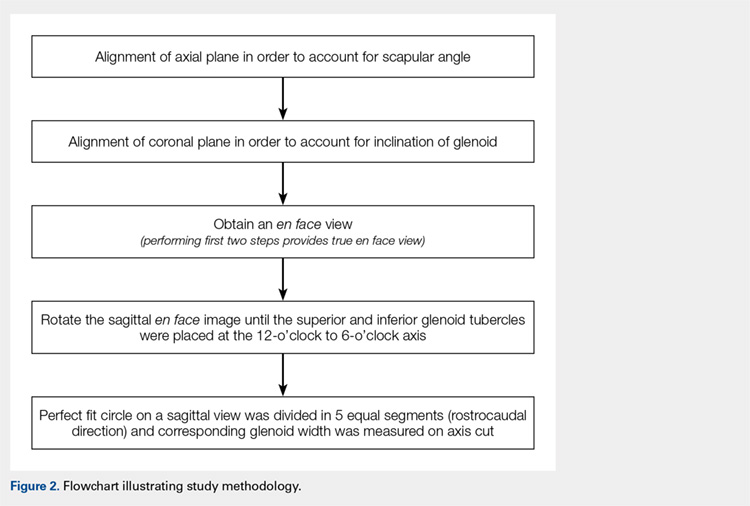
SCAPULAR ANGLE
Scapular angle measurements were performed on the axial view as the angle between a line through the long axis of the body of the scapula, and a line parallel to the CT gantry table.15,19 Subsequently, the axial plane was aligned to the glenoid surface.
CORONAL INCLINATION
Coronal inclination measurements were performed on the sagittal view as the angle between a line tangential to the face of the glenoid and a line perpendicular to the CT gantry table. Positive values represented superior inclination, while negative values represented inferior glenoid inclination.15
SAGITTAL ROTATION
Sagittal rotation measurements were performed using the built-in angle measurement tool in OsiriX in the sagittal plane since the degree of rotation required aligning the long axis of the glenoid to the 12-o’clock to 6-o’clock axis. The amount of rotation was defined as the rotation angle.15
Continue to: Similarly, as described by Gross...
GLENOID WIDTH
Similarly, as described by Gross and colleagues,15 the sagittal en face view was divided via 5 cuts, throughout a superimposed best-fit circle that closely represents the glenoid.9,15,20 For both the UNCORR and CORR, glenoid width (AP distance) was measured on the axial image at the widest point from AP cortex across the glenoid face.
PATIENT GROUPS
Utilizing the en face 3-D CT reconstruction view of the glenoid as the gold standard, patients were placed into 1 of 3 groups according to the degree of anterior GBL measured via the surface method.9,20 The groups were as follows:
I. 10% to 14.9% (N = 12)
II. 15% to 19.9% (N = 16)
III. >20% (N = 15)
STATISTICAL METHODS
Paired t-tests were used to compare all measurements between CORR and UNCORR scans for each of the 5 cuts. A P-value of .05 was used as the threshold for statistical significance in 2-tailed comparisons. Mean and standard errors are presented with standard deviations throughout the study. For interobserver reliability, the measurements between the observers, the intraclass correlation coefficient was calculated. All statistics were performed with SPSS (Version 22).
RESULTS
The study cohort was comprised of 19 left shoulders (44%) and 24 right shoulders (56%), including 36 male patients (84%) and 7 female patients (16%). The average age was 27.8 years (range, 21-40 years). The variability in measured difference, with respect to AP width, was 1.05 mm. The UNCORR CT scans required a mean correction for coronal inclination of 7.0° ± 5.8° (range, -8°-6°). The UNCORR CT scans required a mean correction for scapular angle of 30.2° ± 8.0° (range, 15°-49°). The mean angle of sagittal rotation required to align the glenoid face with the 12-o’clock to 6-o’clock axis was 24.2° ± 5.1 ° (range, 13°-30°). These results are summarized in Table 1.
Table 1. Mean Correction Values Required to Correct the Uncorrected Images to the Corrected Images | |||
Anatomic alignment | Mean (degrees) | Range (degrees) | SD (degrees) |
Scapular angle | 30.2 | 15-49 | 8.0 |
Coronal Inclination | 7.0 | -8-6 | 5.8 |
Sagittal rotation | 24.2 | 13-30 | 5.1 |
For all measurements, the intraclass correlation coefficient for independent observers for all cuts within the 3 groups was r >.900 in all cases.
On an optimized CT scan, over 5 standardized cuts across a best-fit circle of the inferior glenoid, there was a statistically significant absolute mean difference of 12.6% in axial AP glenoid width (2.86 mm ± 2.00 mm, P =.016) when compared with the UNCORR scan. This corresponds to a 3% to 21% error in measurement of the AP width of the glenoid.
Continue to: For the entire cohort...
For the entire cohort of 43 patients, the UNCORR scans underestimated the axial AP width (and thus overestimated GBL) in cut 1 (P =.003), and overestimated the axial AP width (and thus underestimated GBL) in cuts 3 to 5 (P < .001 for all) compared with that of the CORR scans. There was no significant difference between the UNCORR and CORR scans in cut 2 (P = .331).
For groups I (10%-14.9% GBL) and III (>20% GBL), the UNCORR scans underestimated the axial AP width (and thus overestimated anterior GBL) in cuts 1 and 2, while in cuts 3 to 5, the axial AP width was overestimated (GBL was underestimated) (Tables 2, 3). In Group II (15%-19.9% GBL), the axial AP width was underestimated (GBL was overestimated), while in cuts 2 to 5, the axial AP width was overestimated (GBL was underestimated). Overall, AP glenoid width was consistently underestimated in cut 1, the most caudal cut, while AP glenoid width was consistently overestimated in cuts 3 to 5, the more cephalad cuts.
Table 2. Absolute Mean Difference in Axial AP Width (mm) Between Corrected and Uncorrected Images (% difference) | |||||
Cut 1 (Caudal) | Cut 2 | Cut 3 (Center) | Cut 4 | Cut 5 (Cephalad) | |
Group I: 10%-14.9% GBL | 2.4 mm (15.3%) | 1.8 mm (9.0%) | 1.8 mm (7.7%) | 3.0 mm (11.7%) | 4.0 mm (16.8%) |
Group II: 15%-19.9% GBL | 1.8 mm (13.1%) | 1.7 mm (7.9%) | 2.8 mm (10.6%) | 4.1 mm (14.4%) | 4.8 mm (16.9%) |
Group III: >20% | 2.8 mm (16.1%) | 1.9 mm (8.0%) | 2.3 mm (10.3) | 4.4 mm (16.6%) | 5.2 mm (17.0%) |
Abbreviations: AP, anterior-posterior; GBL, glenoid bone loss.
Table 3. Mean AP Glenoid Width Based on CORR and UNCORR Images for the Entire Cohort of 43 Patients | |||||
Axial cut | Mean AP width (mm) | Mean AP width (mm) | Absolute mean AP width difference (mm) | Absolute mean AP width difference (%) | P value |
(Caudal) 1 | 16.6208 | 18.4958 | -1.875 | 14.7768 | .0029565 |
2 | 20.6558 | 21.3166 | -0.661 | 3.6137 | .3310965 |
3 | 24.2583 | 22.3125 | 1.946 | 7.8042 | <.0001 |
4 | 26.1291 | 21.8916 | 4.238 | 15.8449 | <.0001 |
(Rostral) 5 | 26.0875 | 20.4875 | 5.6 | 20.9717 | <.0001 |
Abbreviations: AP, anterior-posterior; CORR, corrected; UNCORR, uncorrected.
DISCUSSION
The principle findings of this study demonstrate that UNCORR conventional 2-D CT scans inaccurately estimate glenoid width as well as inaccurately quantify the degree of anterior GBL. Underestimations of GBL may lead to insufficient treatment of clinically meaningful GBL, thereby increasing the risk of instability recurrence; whereas overestimations of GBL may lead to unnecessary treatment, subjecting patients to increased surgical morbidity. Therefore, the authors recommend correcting the orientation of the scapula in cases wherein clinical decisions are entirely based on 2-D CT, or using alternative methods for quantifying GBL, specifically in the form of 3-D reconstructions.
The use of axial imaging, with CT scans and/or magnetic resonance imaging, is growing in popularity for evaluation of both glenoid anatomy and GBL. Nevertheless, despite our improved ability to critically evaluate the glenoid using these advanced imaging modalities, the images themselves require scrutiny by clinicians to determine if the images accurately depict the true anatomy of the glenoid. As demonstrated by Gross and colleagues,15 conventional 2D CT scan protocols are not optimized to the anatomy of the glenohumeral joint, even in patients without GBL. Due to the alignment of the image relative to the plane of the scapula as opposed to the plane of the glenoid, UNCORR scans result in significantly different measurements of glenoid version (2.0° ± 0.1°) and AP glenoid width (1.2 mm ± 0.42 mm) compared with corrected scans, requiring an average 20.1° ± 1.2° of correction to align the sagittal plane. In the present study involving the patients with GBL, we also found that conventional, UNCORR 2-D CT scan protocols inaccurately estimate glenoid width and the degree of anterior GBL. In particular, AP glenoid width was consistently underestimated in the more caudal cuts, while AP glenoid width was consistently overestimated in the more cephalad cuts. Thus, anterior GBL was overestimated (AP glenoid width was underestimated) in the more caudal cuts, whereas anterior GBL was underestimated in the more cranial cuts (AP glenoid width was overestimated). Given that approximately 1 mm of glenoid bone corresponds to approximately 4% of glenoid width,16 even subtle differences in the interpretation of GBL may lead to gross overestimation/underestimation of bone loss, with significant clinical implications.
In the anterior instability patient population, clinical decision-making is often based on the degree of GBL as determined by advanced imaging modalities. In addition to other patient-specific factors, including age, gender, activity level, type of sport, and number of prior dislocations and/or prior surgeries, the quantity of GBL will often determine which surgical procedure needs to be performed. Typically, patients with >20% to 25% anterior GBL are indicated for a glenoid reconstruction procedure, most commonly via the Latarjet procedure (coracoid transfer).21-27 The Latarjet procedure remains an excellent technique for appropriately indicated patients, with historically good clinical outcomes and low recurrence rates. Complications associated with the Latarjet procedure, however, are not uncommon, including devastating neuropraxia of the axillary and musculocutaneous nerves, and occasionally permanent neurologic deficits.28 Thus, it is critical to avoid overtreating patients with recurrent instability and GBL. As demonstrated by this study, depending on the cranial-to-caudal location on the glenoid, current 2-D CT techniques may underestimate AP glenoid width, resulting in an overestimation of GBL, potentially leading to the decision to proceed with glenoid bone reconstruction when such a procedure is not required. On the contrary, overestimation of AP glenoid width, which occurs in the more cephalad cuts of the glenoid, is perhaps more worrisome, as the resulting underestimation of GBL may lead to inadequate treatment of patients with recurrent instability. Certainly, one of the main risk factors for failed soft tissue shoulder stabilization is a failure to address GBL. If clinical decisions are made based on UNCORR 2-D CT scans, which are often inaccurate with respect to AP glenoid width by an average 2.86 mm ± 2.00 mm (equivalent to 12.6% ± 6.9% GBL) as determined in this study, patients who truly require osseous glenoid reconstructions may be indicated for only soft tissue stabilization, based on the underestimation of GBL.
Continue to: The current gold standard...
The current gold standard for GBL measurement is a perfect-fit circle performed on a 3-D CT scan.22 To that end, it would have been useful to measure the glenoids from this study on 3-D CT scans and compare the data with both UNCORR and CORR measurements. This would have provided a better understanding to what extent the CORR measurements on 2-D scans are relatable with the gold standard. As 3-D CT scans provide a better en face view of the glenoid, more accurate GBL measurements, and ease of 3-D manipulation, they have become more widely used across the country.29,30 Nevertheless, in situations where 3-D imaging is more challenging to obtain because of technology or cost limitations, having a strategy for ensuring proper orientation of 2-D scans would have a substantial impact on clinical decision-making. If such corrections are not made, the inaccuracy of current 2-D scanning protocols justifies the cost 3-D reconstruction protocols. The difference in GBL measurements are critical in cases of increasingly large degrees of GBL, as in these instances, the inferior glenoid becomes more of an inverted-pear shape as opposed to a perfect circle, and differences in CORR and UNCORR images are likely to be more profound.
LIMITATIONS
This study has limitations, such as the relatively small sample size and the selection bias by the reviewers with potential differences in interobserver reliability. Further, minor modifications during the reformatting process may be found with each attempt to manipulate the images and may result in minor, insignificant differences in AP width measurements. Performing 1 or more additional CT scans on the same cohort of patients would have been helpful; however, due to the increased risk of radiation exposure, this was not performed. Performing CT scans on cadaveric specimens with GBL and applying the study methodology would also have been helpful to provide independent verification of our clinical findings; however, specimens were not available for this study. Another limitation of this study is that we did not compare our findings with the findings of glenoid width, and bone loss, as determined using the circle method, which is commonly utilized when 3-D reconstructions are available. In this study, the purpose was to utilize only the 2-D reformatted images, with the assumption that 3-D reconstructions are not always available, and cannot always be measured. To minimize selection bias, the investigators measured the correction effects within groups of patients with similar degrees of GBL (10%-14.9%, 15%-19.9%, and >20%). In addition, not all the selected patients showed degenerative glenoid changes or irregular glenoid shape indicating previous bone augmentation.
CONCLUSIONS
UNCORR 2D CT scans inaccurately estimate glenoid width and the degree of anterior GBL. The clinical implications of these findings are profound and suggest corrected 2D CT scans or 3D reconstruction allow measurements to be taken in the axis of the glenoid to accurately define the anatomy and quantity of anterior GBL in patients with shoulder instability.
1. Cerciello S, Edwards TB, Walch G. Chronic anterior glenohumeral instability in soccer players: results for a series of 28 shoulders treated with the Latarjet procedure. J Orthop Traumatol. 2012;13(4):197-202. doi:10.1007/s10195-012-0201-3.
2. Itoi E, Lee SB, Berglund LJ, Berge LL, An KN. The effect of a glenoid defect on anteroinferior stability of the shoulder after Bankart repair: a cadaveric study. J Bone Joint Surg Am. 2000;82(1):35-46.
3. Bhatia S, Ghodadra NS, Romeo AA, et al. The importance of the recognition and treatment of glenoid bone loss in an athletic population. Sports Health. 2011;3(5):435-440. doi:10.1177/1941738111414126.
4. Lo IK, Parten PM, Burkhart SS. The inverted pear glenoid: an indicator of significant glenoid bone loss. Arthroscopy. 2004;20(2):169-174. doi:10.1016/j.arthro.2003.11.036.
5. Mologne TS, Provencher MT, Menzel KA, Vachon TA, Dewing CB. Arthroscopic stabilization in patients with an inverted pear glenoid: results in patients with bone loss of the anterior glenoid. Am J Sports Med. 2007;35(8):1276-1283. doi:10.1177/0363546507300262.
6. Piasecki DP, Verma NN, Romeo AA, Levine WN, Bach BR Jr, Provencher MT. Glenoid bone deficiency in recurrent anterior shoulder instability: diagnosis and management. J Am Acad Orthop Surg. 2009;17(8):482-493.
7. Provencher MT, Bhatia S, Ghodadra NS, et al. Recurrent shoulder instability: current concepts for evaluation and management of glenoid bone loss. J Bone Joint Surg Am. 2010;92(suppl 2):133-151. doi:10.2106/JBJS.J.00906.
8. Rowe CR, Zarins B, Ciullo JV. Recurrent anterior dislocation of the shoulder after surgical repair. Apparent causes of failure and treatment. J Bone Joint Surg Am. 1984;66(2):159-168.
9. Sugaya H, Moriishi J, Dohi M, Kon Y, Tsuchiya A. Glenoid rim morphology in recurrent anterior glenohumeral instability. J Bone Joint Surg Am. 2003;85-A(5):878-884.
10. Edwards TB, Boulahia A, Walch G. Radiographic analysis of bone defects in chronic anterior shoulder instability. Arthroscopy. 2003;19(7):732-739.
11. Jankauskas L, Rudiger HA, Pfirrmann CW, Jost B, Gerber C. Loss of the sclerotic line of the glenoid on anteroposterior radiographs of the shoulder: a diagnostic sign for an osseous defect of the anterior glenoid rim. J Shoulder Elbow Surg. 2010;19(1):151-156. doi:10.1016/j.jse.2009.04.013.
12. Altan E, Ozbaydar MU, Tonbul M, Yalcin L. Comparison of two different measurement methods to determine glenoid bone defects: area or width? J Shoulder Elbow Surg. 2014;23(8):1215-1222. doi:10.1016/j.jse.2013.11.029.
13. Bishop JY, Jones GL, Rerko MA, Donaldson C, Group MS. 3-D CT is the most reliable imaging modality when quantifying glenoid bone loss. Clin Orthop Relat Res. 2013;471(4):1251-1256. doi:10.1007/s11999-012-2607-x.
14. Chuang TY, Adams CR, Burkhart SS. Use of preoperative three-dimensional computed tomography to quantify glenoid bone loss in shoulder instability. Arthroscopy. 2008; 24(4):376-382. doi:10.1016/j.arthro.2007.10.008.
15. Gross DJ, Golijanin P, Dumont GD, et al. The effect of sagittal rotation of the glenoid on axial glenoid width and glenoid version in computed tomography scan imaging. J Shoulder Elbow Surg. 2016;25(1):61-68. doi:10.1016/j.jse.2015.06.017.
16. Lenart BA, Freedman R, Van Thiel GS, et al. Magnetic resonance imaging evaluation of normal glenoid length and width: an anatomic study. Arthroscopy. 2014;30(8):915-920. doi:10.1016/j.arthro.2014.03.006.
17. Bois AJ, Fening SD, Polster J, Jones MH, Miniaci A. Quantifying glenoid bone loss in anterior shoulder instability: reliability and accuracy of 2-dimensional and 3-dimensional computed tomography measurement techniques. Am J Sports Med. 2012;40(11):2569-2577. doi:10.1177/0363546512458247.
18. Griffith JF, Antonio GE, Tong CW, Ming CK. Anterior shoulder dislocation: quantification of glenoid bone loss with CT. AJR Am J Roentgenol. 2003;180(5):1423-1430. doi:10.2214/ajr.180.5.1801423.
19. Hoenecke HR Jr, Hermida JC, Flores-Hernandez C, D'Lima DD. Accuracy of CT-based measurements of glenoid version for total shoulder arthroplasty. J Shoulder Elbow Surg. 2010;19(2):166-171. doi:10.1016/j.jse.2009.08.009.
20. Huijsmans PE, de Witte PB, de Villiers RV, et al. Recurrent anterior shoulder instability: accuracy of estimations of glenoid bone loss with computed tomography is insufficient for therapeutic decision-making. Skeletal Radiol. 2011;40(10):1329-1334. doi:10.1007/s00256-011-1184-5.
21. Bhatia S, Frank RM, Ghodadra NS, et al. The outcomes and surgical techniques of the latarjet procedure. Arthroscopy. 2014;30(2):227-235. doi:10.1016/j.arthro.2013.10.013.
22. Cunningham G, Benchouk S, Kherad O, Ladermann A. Comparison of arthroscopic and open Latarjet with a learning curve analysis. Knee Surg Sports Traumatol Arthrosc. 2015;24(2):540-545. doi:10.1007/s00167-015-3910-3.
23. Fedorka CJ, Mulcahey MK. Recurrent anterior shoulder instability: a review of the Latarjet procedure and its postoperative rehabilitation. Phys Sportsmed. 2015;43(1):73-79. doi:10.1080/00913847.2015.1005543.
24. Flinkkila T, Sirniö K. Open Latarjet procedure for failed arthroscopic Bankart repair. Orthop Traumatol Surg Res. 2015;101(1):35-38. doi:10.1016/j.otsr.2014.11.005.
25. Hovelius L, Sandström B, Saebö M. One hundred eighteen Bristow-Latarjet repairs for recurrent anterior dislocation of the shoulder prospectively followed for fifteen years: study II-the evolution of dislocation arthropathy. J Shoulder Elbow Surg. 2006;15(3):279-289. doi:10.1016/j.jse.2005.09.014.
26. Hovelius L, Sandström B, Sundgren K, Saebö M. One hundred eighteen Bristow-Latarjet repairs for recurrent anterior dislocation of the shoulder prospectively followed for fifteen years: study I--clinical results. J Shoulder Elbow Surg. 2004;13(5):509-516. doi:10.1016/S1058274604000916.
27. Hovelius L, Vikerfors O, Olofsson A, Svensson O, Rahme H. Bristow-Latarjet and Bankart: a comparative study of shoulder stabilization in 185 shoulders during a seventeen-year follow-up. J Shoulder Elbow Surg. 2011;20(7):1095-1101. doi:10.1016/j.jse.2011.02.005.
28. Gupta A, Delaney R, Petkin K, Lafosse L. Complications of the Latarjet procedure. Curr Rev Musculoskelet Med. 2015;8(1):59-66. doi:10.1007/s12178-015-9258-y.
29. Kwon YW, Powell KA, Yum JK, Brems JJ, Iannotti JP. Use of three-dimensional computed tomography for the analysis of the glenoid anatomy. J Shoulder Elbow Surg. 2005;14(1):85-90. doi:10.1016/j.jse.2004.04.011.
30. Saito H, Itoi E, Sugaya H, Minagawa H, Yamamoto N, Tuoheti Y. Location of the glenoid defect in shoulders with recurrent anterior dislocation. Am J Sports Med. 2005;33(6):889-893. doi:10.1177/0363546504271521.
ABSTRACT
Standard 2-dimensional (2-D) computed tomography (CT) scans of the shoulder are often aligned to the plane of the body as opposed to the plane of the scapula, which may challenge the ability to accurately measure glenoid width and glenoid bone loss (GBL). The purpose of this study is to determine the effect of sagittal rotation of the glenoid on axial anterior-posterior (AP) glenoid width measurements in the setting of anterior GBL.
Forty-three CT scans from consecutive patients with anterior GBL (minimum 10%) were reformatted utilizing open-source DICOM software (OsiriX MD). Patients were grouped according to extent of GBL: I, 10% to 14.9% (N = 12); II, 15% to 19.9% (N = 16); and III, >20% (N = 15). The uncorrected (UNCORR) and corrected (CORR) images were assessed in the axial plane at 5 standardized cuts and measured for AP glenoid width.
For groups I and III, UNCORR scans underestimated axial AP width (and thus overestimated anterior GBL) in cuts 1 and 2, while in cuts 3 to 5, the axial AP width was overestimated (GBL was underestimated). In Group II, axial AP width was underestimated (GBL was overestimated), while in cuts 2 to 5, the axial AP width was overestimated (GBL was underestimated). Overall, AP glenoid width was consistently underestimated in cut 1, the most caudal cut; while AP glenoid width was consistently overestimated in cuts 3 to 5, the more cephalad cuts.
UNCORR 2-D CT scans inaccurately estimated glenoid width and the degree of anterior GBL. This data suggests that corrected 2D CT scans or a 3-dimensional (3-D) reconstruction can help in accurately defining the anterior GBL in patients with shoulder instability.
The treatment of glenohumeral instability has substantially evolved over the past several decades. The understanding of glenoid bone loss (GBL), in particular, has advanced to such a level that we utilize the quantification of GBL for surgical decision-making. Unrecognized and/or untreated GBL is associated with recurrent instability, pain, and disability. Controversy exists, however, regarding the precise amount of anterior GBL that is significant enough to warrant surgical treatment. While historically, 25%1,2 of anterior GBL was thought to be the critical number required to warrant osseous augmentation, studies that are more recent have highlighted the need to perform osseous glenoid reconstruction with lesser degrees of GBL, particularly in the contact athlete.3-9 As small differences in the amount of GBL can change surgical decision-making from an all-soft tissue repair to an osseous reconstruction, it is paramount that we have accurate, valid, and reproducible methods for calculating GBL.
Continue to: Historically, plain radiographs...
Historically, plain radiographs have been the mainstay for evaluating the glenohumeral joint, including Grashey and axillary views, allowing clinicians to evaluate the congruency of the glenohumeral joint and to assess bone loss on both the glenoid and humeral head.1,10 While large, acute fractures of the glenoid are fairly evident on radiographs, including the Grashey view,11 shoulders with chronic and/or attritional anterior GBL are more difficult to evaluate, and often do not provide the information necessary to guide surgical decision-making.
Computed tomography (CT) of the shoulder has become the most commonly utilized imaging modality in the evaluation of patients with shoulder instability associated with GBL. Standard 2-dimensional (2-D) CT scans of the shoulder are often aligned to the plane of the body as opposed to the plane of the scapula/glenoid, as standard protocols often fail to account for the anterior sagittal rotation of the scapula/glenoid, similar to the disadvantage of standard radiographs. While 3-dimensional (3-D) CT reconstructions eliminate the effect of gantry angles, and thus allow for an en face view of the glenoid, 3-D reconstructions are not always available, and cannot always be measured.12-14 Thus, improved methodology for utilizing standard 2D scans is warranted, as the ability to correctly align the axial CT scan to the axis of the glenoid may allow for more accurate GBL measurements, which will ultimately impact surgical decision-making. Recently, Gross and colleagues15 reported the effect of sagittal rotation of the glenoid on axial measurements of anterior-posterior (AP) glenoid width and glenoid version in normal glenoids, without bone loss, and found that the mean angle of correction needed to align the sagittal plane was 20.1° ± 1.2° of rotation. To the authors’ knowledge, this same methodology has not been applied to patients with clinically meaningful anterior GBL. Given that the average glenoid width in human shoulders is 24.4 mm ± 2.9 mm,16 1 mm of glenoid bone loss (GBL) corresponds to approximately 4% of the glenoid width, and thus even subtle differences in the interpretation of GBL may have substantial clinical implications. Therefore, the purpose of this study is to determine the effect of sagittal rotation of the glenoid on axial AP glenoid width measurements in the setting of clinically significant anterior GBL.
METHODS
This study was approved by Massachusetts General Hospital Institutional Review Board. A retrospective review of consecutive patients with a diagnosis of anterior shoulder instability between 2009 and 2013 was conducted. Inclusion criteria comprised patients with a minimum of 10% anterior GBL, an available CT scan of the affected shoulder, and no history of prior ipsilateral surgeries. Exclusion criteria comprised evidence of degenerative changes to the glenoid and/or humeral head, as well as prior ipsilateral shoulder surgery. Sixty consecutive patients were originally identified as having anterior shoulder instability, and 17 were excluded based on the inclusion/exclusion criteria, leaving 43 patients (43 shoulders) available for inclusion. Shoulder CT scans from all 43 patients were reformatted utilizing open-source DICOM software (OsiriX MD, version 2.5.1 65-bit) multi-planar reconstruction (MPR).
CT PROTOCOL
All patients underwent a standard glenohumeral CT scan using a Siemens Sensation 64 Scanner (Siemens), a 64-detector scanner. Scans were acquired with 0.6 mm of collimation, 140 kV, and 300 mA-seconds. Slice thickness was set to 2 mm. All patient information was de-identified for analysis.
The uncorrected (UNCORR) scans were defined as the default orientation on the scanner. In the UNCORR scans, the axial, coronal, and sagittal views were oriented relative to the scanner gantry table, as opposed to the anatomy of the glenoid. The corrected (CORR) CT scans were aligned in all 3 planes relative to the glenoid face, and thus the cuts were perpendicular to the long axis of the glenoid.15 This resulted in sagittal cuts perpendicular to the 12-o’clock to 6-o’clock axis in the sagittal plane (Figure 1).
Continue to: In a de-identified fashion...
IMAGE ANALYSIS AND REFORMATTING
In a de-identified fashion, all CT scans were imported and analyzed using open-source Digital Imaging and Communications in Medicine (DICOM) software (OsiriX MD, version 2.5.1 64-bit). By following a previously developed method, CT scans were reformatted using OsiriX MPR. The OsiriX software has an MPR function that allows simultaneous manipulation of 2-D CT scans in 3 orthogonal planes: axial, sagittal, and coronal. In the MPR mode, the alternation of 1 plane directly affects the orientation of the remaining 2 planes. Thus, by using an MPR, one can analyze the impact that a default CT scan performed relative to the gantry of the table, UNCORR, has on the axial images.
First, the en face view was obtained via a 2-step process: alignment of the axial plane to account for the scapular angle, followed by alignment of the coronal plane to adjust for the glenoid inclination.15 These 2 adjustments provided a true en face sagittal glenoid view. The final adjustment step was a sagittal en face rotation of the glenoid such that the superior and inferior glenoid tubercles were placed on the 12-o’clock to 6-o’clock axis (CORR scan). Previous studies have identified a central longitudinal axis that was used in this method to align the supraglenoid tubercle with the 12-o’clock to 6-o’clock axis on the glenoid face.15,17,18 The standard error of mean was 1.21°. This new CORR view resulted in axial cuts through the glenoid that were oriented perpendicular to the 12-o’clock to 6-o’clock axis. The UNCORR and CORR images were assessed in the axial plane at 5 standardized cuts and measured for AP glenoid width by 2 independent observers in a blinded, randomized fashion. When the measured AP width of the UNCORR scan was less than that measured on the CORR scan, the AP width of the glenoid was considered underestimated, and the degree of GBL was considered overestimated (Figure 2).
SCAPULAR ANGLE
Scapular angle measurements were performed on the axial view as the angle between a line through the long axis of the body of the scapula, and a line parallel to the CT gantry table.15,19 Subsequently, the axial plane was aligned to the glenoid surface.
CORONAL INCLINATION
Coronal inclination measurements were performed on the sagittal view as the angle between a line tangential to the face of the glenoid and a line perpendicular to the CT gantry table. Positive values represented superior inclination, while negative values represented inferior glenoid inclination.15
SAGITTAL ROTATION
Sagittal rotation measurements were performed using the built-in angle measurement tool in OsiriX in the sagittal plane since the degree of rotation required aligning the long axis of the glenoid to the 12-o’clock to 6-o’clock axis. The amount of rotation was defined as the rotation angle.15
Continue to: Similarly, as described by Gross...
GLENOID WIDTH
Similarly, as described by Gross and colleagues,15 the sagittal en face view was divided via 5 cuts, throughout a superimposed best-fit circle that closely represents the glenoid.9,15,20 For both the UNCORR and CORR, glenoid width (AP distance) was measured on the axial image at the widest point from AP cortex across the glenoid face.
PATIENT GROUPS
Utilizing the en face 3-D CT reconstruction view of the glenoid as the gold standard, patients were placed into 1 of 3 groups according to the degree of anterior GBL measured via the surface method.9,20 The groups were as follows:
I. 10% to 14.9% (N = 12)
II. 15% to 19.9% (N = 16)
III. >20% (N = 15)
STATISTICAL METHODS
Paired t-tests were used to compare all measurements between CORR and UNCORR scans for each of the 5 cuts. A P-value of .05 was used as the threshold for statistical significance in 2-tailed comparisons. Mean and standard errors are presented with standard deviations throughout the study. For interobserver reliability, the measurements between the observers, the intraclass correlation coefficient was calculated. All statistics were performed with SPSS (Version 22).
RESULTS
The study cohort was comprised of 19 left shoulders (44%) and 24 right shoulders (56%), including 36 male patients (84%) and 7 female patients (16%). The average age was 27.8 years (range, 21-40 years). The variability in measured difference, with respect to AP width, was 1.05 mm. The UNCORR CT scans required a mean correction for coronal inclination of 7.0° ± 5.8° (range, -8°-6°). The UNCORR CT scans required a mean correction for scapular angle of 30.2° ± 8.0° (range, 15°-49°). The mean angle of sagittal rotation required to align the glenoid face with the 12-o’clock to 6-o’clock axis was 24.2° ± 5.1 ° (range, 13°-30°). These results are summarized in Table 1.
Table 1. Mean Correction Values Required to Correct the Uncorrected Images to the Corrected Images | |||
Anatomic alignment | Mean (degrees) | Range (degrees) | SD (degrees) |
Scapular angle | 30.2 | 15-49 | 8.0 |
Coronal Inclination | 7.0 | -8-6 | 5.8 |
Sagittal rotation | 24.2 | 13-30 | 5.1 |
For all measurements, the intraclass correlation coefficient for independent observers for all cuts within the 3 groups was r >.900 in all cases.
On an optimized CT scan, over 5 standardized cuts across a best-fit circle of the inferior glenoid, there was a statistically significant absolute mean difference of 12.6% in axial AP glenoid width (2.86 mm ± 2.00 mm, P =.016) when compared with the UNCORR scan. This corresponds to a 3% to 21% error in measurement of the AP width of the glenoid.
Continue to: For the entire cohort...
For the entire cohort of 43 patients, the UNCORR scans underestimated the axial AP width (and thus overestimated GBL) in cut 1 (P =.003), and overestimated the axial AP width (and thus underestimated GBL) in cuts 3 to 5 (P < .001 for all) compared with that of the CORR scans. There was no significant difference between the UNCORR and CORR scans in cut 2 (P = .331).
For groups I (10%-14.9% GBL) and III (>20% GBL), the UNCORR scans underestimated the axial AP width (and thus overestimated anterior GBL) in cuts 1 and 2, while in cuts 3 to 5, the axial AP width was overestimated (GBL was underestimated) (Tables 2, 3). In Group II (15%-19.9% GBL), the axial AP width was underestimated (GBL was overestimated), while in cuts 2 to 5, the axial AP width was overestimated (GBL was underestimated). Overall, AP glenoid width was consistently underestimated in cut 1, the most caudal cut, while AP glenoid width was consistently overestimated in cuts 3 to 5, the more cephalad cuts.
Table 2. Absolute Mean Difference in Axial AP Width (mm) Between Corrected and Uncorrected Images (% difference) | |||||
Cut 1 (Caudal) | Cut 2 | Cut 3 (Center) | Cut 4 | Cut 5 (Cephalad) | |
Group I: 10%-14.9% GBL | 2.4 mm (15.3%) | 1.8 mm (9.0%) | 1.8 mm (7.7%) | 3.0 mm (11.7%) | 4.0 mm (16.8%) |
Group II: 15%-19.9% GBL | 1.8 mm (13.1%) | 1.7 mm (7.9%) | 2.8 mm (10.6%) | 4.1 mm (14.4%) | 4.8 mm (16.9%) |
Group III: >20% | 2.8 mm (16.1%) | 1.9 mm (8.0%) | 2.3 mm (10.3) | 4.4 mm (16.6%) | 5.2 mm (17.0%) |
Abbreviations: AP, anterior-posterior; GBL, glenoid bone loss.
Table 3. Mean AP Glenoid Width Based on CORR and UNCORR Images for the Entire Cohort of 43 Patients | |||||
Axial cut | Mean AP width (mm) | Mean AP width (mm) | Absolute mean AP width difference (mm) | Absolute mean AP width difference (%) | P value |
(Caudal) 1 | 16.6208 | 18.4958 | -1.875 | 14.7768 | .0029565 |
2 | 20.6558 | 21.3166 | -0.661 | 3.6137 | .3310965 |
3 | 24.2583 | 22.3125 | 1.946 | 7.8042 | <.0001 |
4 | 26.1291 | 21.8916 | 4.238 | 15.8449 | <.0001 |
(Rostral) 5 | 26.0875 | 20.4875 | 5.6 | 20.9717 | <.0001 |
Abbreviations: AP, anterior-posterior; CORR, corrected; UNCORR, uncorrected.
DISCUSSION
The principle findings of this study demonstrate that UNCORR conventional 2-D CT scans inaccurately estimate glenoid width as well as inaccurately quantify the degree of anterior GBL. Underestimations of GBL may lead to insufficient treatment of clinically meaningful GBL, thereby increasing the risk of instability recurrence; whereas overestimations of GBL may lead to unnecessary treatment, subjecting patients to increased surgical morbidity. Therefore, the authors recommend correcting the orientation of the scapula in cases wherein clinical decisions are entirely based on 2-D CT, or using alternative methods for quantifying GBL, specifically in the form of 3-D reconstructions.
The use of axial imaging, with CT scans and/or magnetic resonance imaging, is growing in popularity for evaluation of both glenoid anatomy and GBL. Nevertheless, despite our improved ability to critically evaluate the glenoid using these advanced imaging modalities, the images themselves require scrutiny by clinicians to determine if the images accurately depict the true anatomy of the glenoid. As demonstrated by Gross and colleagues,15 conventional 2D CT scan protocols are not optimized to the anatomy of the glenohumeral joint, even in patients without GBL. Due to the alignment of the image relative to the plane of the scapula as opposed to the plane of the glenoid, UNCORR scans result in significantly different measurements of glenoid version (2.0° ± 0.1°) and AP glenoid width (1.2 mm ± 0.42 mm) compared with corrected scans, requiring an average 20.1° ± 1.2° of correction to align the sagittal plane. In the present study involving the patients with GBL, we also found that conventional, UNCORR 2-D CT scan protocols inaccurately estimate glenoid width and the degree of anterior GBL. In particular, AP glenoid width was consistently underestimated in the more caudal cuts, while AP glenoid width was consistently overestimated in the more cephalad cuts. Thus, anterior GBL was overestimated (AP glenoid width was underestimated) in the more caudal cuts, whereas anterior GBL was underestimated in the more cranial cuts (AP glenoid width was overestimated). Given that approximately 1 mm of glenoid bone corresponds to approximately 4% of glenoid width,16 even subtle differences in the interpretation of GBL may lead to gross overestimation/underestimation of bone loss, with significant clinical implications.
In the anterior instability patient population, clinical decision-making is often based on the degree of GBL as determined by advanced imaging modalities. In addition to other patient-specific factors, including age, gender, activity level, type of sport, and number of prior dislocations and/or prior surgeries, the quantity of GBL will often determine which surgical procedure needs to be performed. Typically, patients with >20% to 25% anterior GBL are indicated for a glenoid reconstruction procedure, most commonly via the Latarjet procedure (coracoid transfer).21-27 The Latarjet procedure remains an excellent technique for appropriately indicated patients, with historically good clinical outcomes and low recurrence rates. Complications associated with the Latarjet procedure, however, are not uncommon, including devastating neuropraxia of the axillary and musculocutaneous nerves, and occasionally permanent neurologic deficits.28 Thus, it is critical to avoid overtreating patients with recurrent instability and GBL. As demonstrated by this study, depending on the cranial-to-caudal location on the glenoid, current 2-D CT techniques may underestimate AP glenoid width, resulting in an overestimation of GBL, potentially leading to the decision to proceed with glenoid bone reconstruction when such a procedure is not required. On the contrary, overestimation of AP glenoid width, which occurs in the more cephalad cuts of the glenoid, is perhaps more worrisome, as the resulting underestimation of GBL may lead to inadequate treatment of patients with recurrent instability. Certainly, one of the main risk factors for failed soft tissue shoulder stabilization is a failure to address GBL. If clinical decisions are made based on UNCORR 2-D CT scans, which are often inaccurate with respect to AP glenoid width by an average 2.86 mm ± 2.00 mm (equivalent to 12.6% ± 6.9% GBL) as determined in this study, patients who truly require osseous glenoid reconstructions may be indicated for only soft tissue stabilization, based on the underestimation of GBL.
Continue to: The current gold standard...
The current gold standard for GBL measurement is a perfect-fit circle performed on a 3-D CT scan.22 To that end, it would have been useful to measure the glenoids from this study on 3-D CT scans and compare the data with both UNCORR and CORR measurements. This would have provided a better understanding to what extent the CORR measurements on 2-D scans are relatable with the gold standard. As 3-D CT scans provide a better en face view of the glenoid, more accurate GBL measurements, and ease of 3-D manipulation, they have become more widely used across the country.29,30 Nevertheless, in situations where 3-D imaging is more challenging to obtain because of technology or cost limitations, having a strategy for ensuring proper orientation of 2-D scans would have a substantial impact on clinical decision-making. If such corrections are not made, the inaccuracy of current 2-D scanning protocols justifies the cost 3-D reconstruction protocols. The difference in GBL measurements are critical in cases of increasingly large degrees of GBL, as in these instances, the inferior glenoid becomes more of an inverted-pear shape as opposed to a perfect circle, and differences in CORR and UNCORR images are likely to be more profound.
LIMITATIONS
This study has limitations, such as the relatively small sample size and the selection bias by the reviewers with potential differences in interobserver reliability. Further, minor modifications during the reformatting process may be found with each attempt to manipulate the images and may result in minor, insignificant differences in AP width measurements. Performing 1 or more additional CT scans on the same cohort of patients would have been helpful; however, due to the increased risk of radiation exposure, this was not performed. Performing CT scans on cadaveric specimens with GBL and applying the study methodology would also have been helpful to provide independent verification of our clinical findings; however, specimens were not available for this study. Another limitation of this study is that we did not compare our findings with the findings of glenoid width, and bone loss, as determined using the circle method, which is commonly utilized when 3-D reconstructions are available. In this study, the purpose was to utilize only the 2-D reformatted images, with the assumption that 3-D reconstructions are not always available, and cannot always be measured. To minimize selection bias, the investigators measured the correction effects within groups of patients with similar degrees of GBL (10%-14.9%, 15%-19.9%, and >20%). In addition, not all the selected patients showed degenerative glenoid changes or irregular glenoid shape indicating previous bone augmentation.
CONCLUSIONS
UNCORR 2D CT scans inaccurately estimate glenoid width and the degree of anterior GBL. The clinical implications of these findings are profound and suggest corrected 2D CT scans or 3D reconstruction allow measurements to be taken in the axis of the glenoid to accurately define the anatomy and quantity of anterior GBL in patients with shoulder instability.
1. Cerciello S, Edwards TB, Walch G. Chronic anterior glenohumeral instability in soccer players: results for a series of 28 shoulders treated with the Latarjet procedure. J Orthop Traumatol. 2012;13(4):197-202. doi:10.1007/s10195-012-0201-3.
2. Itoi E, Lee SB, Berglund LJ, Berge LL, An KN. The effect of a glenoid defect on anteroinferior stability of the shoulder after Bankart repair: a cadaveric study. J Bone Joint Surg Am. 2000;82(1):35-46.
3. Bhatia S, Ghodadra NS, Romeo AA, et al. The importance of the recognition and treatment of glenoid bone loss in an athletic population. Sports Health. 2011;3(5):435-440. doi:10.1177/1941738111414126.
4. Lo IK, Parten PM, Burkhart SS. The inverted pear glenoid: an indicator of significant glenoid bone loss. Arthroscopy. 2004;20(2):169-174. doi:10.1016/j.arthro.2003.11.036.
5. Mologne TS, Provencher MT, Menzel KA, Vachon TA, Dewing CB. Arthroscopic stabilization in patients with an inverted pear glenoid: results in patients with bone loss of the anterior glenoid. Am J Sports Med. 2007;35(8):1276-1283. doi:10.1177/0363546507300262.
6. Piasecki DP, Verma NN, Romeo AA, Levine WN, Bach BR Jr, Provencher MT. Glenoid bone deficiency in recurrent anterior shoulder instability: diagnosis and management. J Am Acad Orthop Surg. 2009;17(8):482-493.
7. Provencher MT, Bhatia S, Ghodadra NS, et al. Recurrent shoulder instability: current concepts for evaluation and management of glenoid bone loss. J Bone Joint Surg Am. 2010;92(suppl 2):133-151. doi:10.2106/JBJS.J.00906.
8. Rowe CR, Zarins B, Ciullo JV. Recurrent anterior dislocation of the shoulder after surgical repair. Apparent causes of failure and treatment. J Bone Joint Surg Am. 1984;66(2):159-168.
9. Sugaya H, Moriishi J, Dohi M, Kon Y, Tsuchiya A. Glenoid rim morphology in recurrent anterior glenohumeral instability. J Bone Joint Surg Am. 2003;85-A(5):878-884.
10. Edwards TB, Boulahia A, Walch G. Radiographic analysis of bone defects in chronic anterior shoulder instability. Arthroscopy. 2003;19(7):732-739.
11. Jankauskas L, Rudiger HA, Pfirrmann CW, Jost B, Gerber C. Loss of the sclerotic line of the glenoid on anteroposterior radiographs of the shoulder: a diagnostic sign for an osseous defect of the anterior glenoid rim. J Shoulder Elbow Surg. 2010;19(1):151-156. doi:10.1016/j.jse.2009.04.013.
12. Altan E, Ozbaydar MU, Tonbul M, Yalcin L. Comparison of two different measurement methods to determine glenoid bone defects: area or width? J Shoulder Elbow Surg. 2014;23(8):1215-1222. doi:10.1016/j.jse.2013.11.029.
13. Bishop JY, Jones GL, Rerko MA, Donaldson C, Group MS. 3-D CT is the most reliable imaging modality when quantifying glenoid bone loss. Clin Orthop Relat Res. 2013;471(4):1251-1256. doi:10.1007/s11999-012-2607-x.
14. Chuang TY, Adams CR, Burkhart SS. Use of preoperative three-dimensional computed tomography to quantify glenoid bone loss in shoulder instability. Arthroscopy. 2008; 24(4):376-382. doi:10.1016/j.arthro.2007.10.008.
15. Gross DJ, Golijanin P, Dumont GD, et al. The effect of sagittal rotation of the glenoid on axial glenoid width and glenoid version in computed tomography scan imaging. J Shoulder Elbow Surg. 2016;25(1):61-68. doi:10.1016/j.jse.2015.06.017.
16. Lenart BA, Freedman R, Van Thiel GS, et al. Magnetic resonance imaging evaluation of normal glenoid length and width: an anatomic study. Arthroscopy. 2014;30(8):915-920. doi:10.1016/j.arthro.2014.03.006.
17. Bois AJ, Fening SD, Polster J, Jones MH, Miniaci A. Quantifying glenoid bone loss in anterior shoulder instability: reliability and accuracy of 2-dimensional and 3-dimensional computed tomography measurement techniques. Am J Sports Med. 2012;40(11):2569-2577. doi:10.1177/0363546512458247.
18. Griffith JF, Antonio GE, Tong CW, Ming CK. Anterior shoulder dislocation: quantification of glenoid bone loss with CT. AJR Am J Roentgenol. 2003;180(5):1423-1430. doi:10.2214/ajr.180.5.1801423.
19. Hoenecke HR Jr, Hermida JC, Flores-Hernandez C, D'Lima DD. Accuracy of CT-based measurements of glenoid version for total shoulder arthroplasty. J Shoulder Elbow Surg. 2010;19(2):166-171. doi:10.1016/j.jse.2009.08.009.
20. Huijsmans PE, de Witte PB, de Villiers RV, et al. Recurrent anterior shoulder instability: accuracy of estimations of glenoid bone loss with computed tomography is insufficient for therapeutic decision-making. Skeletal Radiol. 2011;40(10):1329-1334. doi:10.1007/s00256-011-1184-5.
21. Bhatia S, Frank RM, Ghodadra NS, et al. The outcomes and surgical techniques of the latarjet procedure. Arthroscopy. 2014;30(2):227-235. doi:10.1016/j.arthro.2013.10.013.
22. Cunningham G, Benchouk S, Kherad O, Ladermann A. Comparison of arthroscopic and open Latarjet with a learning curve analysis. Knee Surg Sports Traumatol Arthrosc. 2015;24(2):540-545. doi:10.1007/s00167-015-3910-3.
23. Fedorka CJ, Mulcahey MK. Recurrent anterior shoulder instability: a review of the Latarjet procedure and its postoperative rehabilitation. Phys Sportsmed. 2015;43(1):73-79. doi:10.1080/00913847.2015.1005543.
24. Flinkkila T, Sirniö K. Open Latarjet procedure for failed arthroscopic Bankart repair. Orthop Traumatol Surg Res. 2015;101(1):35-38. doi:10.1016/j.otsr.2014.11.005.
25. Hovelius L, Sandström B, Saebö M. One hundred eighteen Bristow-Latarjet repairs for recurrent anterior dislocation of the shoulder prospectively followed for fifteen years: study II-the evolution of dislocation arthropathy. J Shoulder Elbow Surg. 2006;15(3):279-289. doi:10.1016/j.jse.2005.09.014.
26. Hovelius L, Sandström B, Sundgren K, Saebö M. One hundred eighteen Bristow-Latarjet repairs for recurrent anterior dislocation of the shoulder prospectively followed for fifteen years: study I--clinical results. J Shoulder Elbow Surg. 2004;13(5):509-516. doi:10.1016/S1058274604000916.
27. Hovelius L, Vikerfors O, Olofsson A, Svensson O, Rahme H. Bristow-Latarjet and Bankart: a comparative study of shoulder stabilization in 185 shoulders during a seventeen-year follow-up. J Shoulder Elbow Surg. 2011;20(7):1095-1101. doi:10.1016/j.jse.2011.02.005.
28. Gupta A, Delaney R, Petkin K, Lafosse L. Complications of the Latarjet procedure. Curr Rev Musculoskelet Med. 2015;8(1):59-66. doi:10.1007/s12178-015-9258-y.
29. Kwon YW, Powell KA, Yum JK, Brems JJ, Iannotti JP. Use of three-dimensional computed tomography for the analysis of the glenoid anatomy. J Shoulder Elbow Surg. 2005;14(1):85-90. doi:10.1016/j.jse.2004.04.011.
30. Saito H, Itoi E, Sugaya H, Minagawa H, Yamamoto N, Tuoheti Y. Location of the glenoid defect in shoulders with recurrent anterior dislocation. Am J Sports Med. 2005;33(6):889-893. doi:10.1177/0363546504271521.
TAKE-HOME POINTS
- Standard 2-D CT scans of the shoulder are often aligned to the plane of the body as opposed to the plane of the scapula, which may challenge the ability to accurately measure glenoid width and GBL.
- Underestimations of GBL may lead to insufficient treatment of clinically meaningful GBL, thereby increasing the risk of instability recurrence; whereas overestimations of GBL may lead to unnecessary treatment, subjecting patients to increased surgical morbidity.
- AP glenoid width was consistently underestimated in uncorrected axial cut 1, the most caudal cut.
- AP glenoid width was consistently overestimated in uncorrected axial cuts 3 to 5, the more cephalad cuts.
- CORR 2-D CT scans or a 3-D reconstruction can help in accurately defining the anterior GBL in patients with shoulder instability.
Thoracic aortic aneurysm: How to counsel, when to refer
Thoracic aortic aneurysm (TAA) needs to be detected, monitored, and managed in a timely manner to prevent a serious consequence such as acute dissection or rupture. But only about 5% of patients experience symptoms before an acute event occurs, and for the other 95% the first “symptom” is often death.1 Most cases are detected either incidentally with echocardiography, computed tomography (CT), or magnetic resonance imaging (MRI) during workup for another condition. Patients may also be diagnosed during workup of a murmur or after a family member is found to have an aneurysm. Therefore, its true incidence is difficult to determine.2
With these facts in mind, how would you manage the following 2 cases?
Case 1: Bicuspid aortic valve, ascending aortic aneurysm
A 45-year-old man with stage 1 hypertension presents for evaluation of a bicuspid aortic valve and ascending aortic aneurysm. He has several first-degree relatives with similar conditions, and his brother recently underwent elective aortic repair. At the urging of his primary care physician, he underwent screening echocardiography, which demonstrated a “dilated root and ascending aorta” 4.6 cm in diameter. He presents today to discuss management options and how the aneurysm could affect his everyday life.
Case 2: Marfan syndrome in a young woman
A 24-year-old woman with Marfan syndrome diagnosed in adolescence presents for annual follow-up. She has many family members with the same condition, and several have undergone prophylactic aortic root repair. Her aortic root has been monitored annually for progression of dilation, and today it is 4.6 cm in diameter, a 3-mm increase from the last measurement. She has grade 2+ aortic insufficiency (on a scale of 1+ to 4+) based on echocardiography, but she has no symptoms. She is curious about what size her aortic root will need to reach for surgery to be considered.
LIKELY UNDERDETECTED
TAA is being detected more often than in the past thanks to better detection methods and heightened awareness among physicians and patients. While an incidence rate of 10.4 per 100,000 patient-years is often cited,3 this figure likely underestimates the true incidence of this clinically silent condition. The most robust data come from studies based on in-hospital diagnostic codes coupled with data from autopsies for out-of-hospital deaths.
Olsson et al,4 in a 2016 study in Sweden, found the incidence of TAA and aortic dissection to be 16.3 per 100,000 per year for men and 9.1 per 100,000 per year for women.
Clouse et al5 reported the incidence of thoracic aortic dissection as 3.5 per 100,000 patient-years, and the same figure for thoracic aortic rupture.
Aneurysmal disease accounts for 52,000 deaths per year in the United States, making it the 19th most common cause of death.6 These figures are likely lower than the true mortality rate for this condition, given that aortic dissection is often mistaken for acute myocardial infarction or other acute event if an autopsy is not done to confirm the cause of death.7
RISK FACTORS FOR THORACIC AORTIC ANEURYSM
Risk factors for TAA include genetic conditions that lead to aortic medial weakness or destruction such as Loeys-Dietz syndrome and Marfan syndrome.2 In addition, family history is important even in the absence of known genetic mutations. Other risk factors include conditions that increase aortic wall stress, such as hypertension, cocaine abuse, extreme weightlifting, trauma, and aortic coarctation.2
DIAMETER INCREASES WITH AGE, BODY SURFACE AREA

Normal dimensions for the aortic segments differ depending on age, sex, and body surface area.8,44,45 The size of the aortic root may also vary depending on how it is measured, due to the root’s trefoil shape. Measured sinus to sinus, the root is larger than when measured sinus to commissure on CT angiography or cardiac MRI. It is also larger when measured leading edge to leading edge than inner edge to inner edge on echocardiography.10
TAA is defined as an aortic diameter at least 50% greater than the upper limit of normal.8

Geometric changes in the curvature of the ascending aorta, aortic arch, and descending thoracic aorta can occur as the result of hypertension, atherosclerosis, or connective tissue disease.
HOW IS TAA DIAGNOSED?


Imaging tests
 that tapers to normal dimensions at the sinotubular junction (yellow arrow) and ascending aorta.")


It is particularly important to obtain a gated CTA image in patients with aortic root aneurysm to avoid motion artifact and possible erroneous measurements. Gated CTA is done with electrocardiographic synchronization and allows for image processing to correct for cardiac motion.
HOW IS TAA CLASSIFIED?
TAA can be caused by a variety of inherited and sporadic conditions. These differences in pathogenesis lend themselves to classification of aneurysms into groups. Table 3 highlights the most common conditions associated with TAA.13
Bicuspid aortic valve aortopathy
From 1% to 2% of people have a bicuspid aortic valve, with a 3-to-1 male predominance.14,15 Aortic dilation occurs in 35% to 80% of people who have a bicuspid aortic valve, conferring a risk of dissection 8 times higher than in the general population.16–18
The pathogenic mechanisms that lead to this condition are widely debated, although a combination of genetic defects leading to intrinsic weakening of the aortic wall and hemodynamic effects likely contribute.19 Evidence of hemodynamic contributions to aortic dilation comes from findings that particular patterns of cusp fusion of the bicuspid aortic valve result in changes in transvalvular flow, placing more stress on specific regions of the ascending aorta.20,21 These hemodynamic alterations result in patterns of aortic dilation that depend on cusp fusion and the presence of valvular disease.
Multiple small studies found that replacing bicuspid aortic valves reduced the rate of aortic dilation, suggesting that hemodynamic factors may play a larger role than intrinsic wall properties in genetically susceptible individuals.22,23 However, larger studies are needed before any definitive conclusions can be made.
HOW IS ANEURYSM MANAGED ON AN OUTPATIENT BASIS?
Patients with a new diagnosis of TAA should be referred to a cardiologist with expertise in managing aortic disease or to a cardiac surgeon specializing in aortic surgery, depending on the initial size of the aneurysm.
Control blood pressure with beta-blockers
Medical management for patients with TAA has historically been limited to strict blood pressure control aimed at reducing aortic wall stress, mainly with beta-blockers.
Are angiotensin II receptor blockers (ARBs) beneficial? Studies in a mouse model of Marfan syndrome revealed that the ARB losartan attenuated aortic root growth.24 The results of early, small studies in humans were promising,25–27 but larger randomized trials have shown no advantage of losartan over beta-blockers in slowing aortic root growth.28 These negative results led many to question the effectiveness of losartan, although some point out that no studies have shown even beta-blockers to be beneficial in reducing the clinical end points of death or dissection.29 On the other hand, patients with certain FBN1 mutations respond more readily than others to losartan.30 Additional clinical trials of ARBs in Marfan syndrome are ongoing.
Current guidelines recommend stringent blood pressure control and smoking cessation for patients with a small aneurysm not requiring surgery and for those who are considered unsuitable for surgical or percutaneous intervention (level of evidence C, the lowest).2 For patients with TAA, it is considered reasonable to give beta-blockers. Angiotensin-converting enzyme inhibitors or ARBs may be used in combination with beta-blockers, titrated to the lowest tolerable blood pressure without adverse effects (level of evidence B).2
The recommended target blood pressure is less than 140/90 mm Hg, or 130/80 mm Hg in those with diabetes or chronic kidney disease (level of evidence B).2 However, we recommend more stringent blood pressure control: ie, less than 130/80 mm Hg for all patients with aortic aneurysm and a heart rate goal of 70 beats per minute or less, as tolerated.
Activity restriction
Activity restrictions for patients with TAA are largely based on theory, and certain activities may require more modification than others. For example, heavy lifting should be discouraged, as it may increase blood pressure significantly for short periods of time.2,31 The increased wall stress, in theory, could initiate dissection or rupture. However, moderate-intensity aerobic activity is rarely associated with significant elevations in blood pressure and should be encouraged. Stressful emotional states have been anecdotally associated with aortic dissection; thus, measures to reduce stress may offer some benefit.31
Our recommendations. While there are no published guidelines regarding activity restrictions in patients with TAA, we use a graded approach based on aortic diameter:
- 4.0 to 4.4 cm—lift no more than 75 pounds
- 4.5 to 5 cm—lift no more than 50 pounds
- 5 cm—lift no more than 25 pounds.
We also recommend not lifting anything heavier than half of one’s body weight and to avoid breath-holding or performing the Valsalva maneuver while lifting. Although these recommendations are somewhat arbitrary, based on theory and a large clinical experience at our aortic center, they seem reasonable and practical.
Activity restrictions should be stringent and individualized in patients with Marfan, Loeys-Dietz, or Ehlers-Danlos syndrome due to increased risk of dissection or rupture even if the aorta is normal in size.
We sometimes recommend exercise stress testing to assess the heart rate and blood pressure response to exercise, and we are developing research protocols to help tailor activity recommendations.
WHEN SHOULD A PATIENT BE REFERRED?
To a cardiologist at the time of diagnosis
As soon as TAA is diagnosed, the patient should be referred to a cardiologist who has special interest in aortic disease. This will allow for appropriate and timely decisions about medical management, imaging, follow-up, and referral to surgery. Additional recommendations for screening of family members and referral to clinical geneticists can be discussed at this juncture. Activity restrictions should be reviewed at the initial evaluation.
To a surgeon relatively early
Size thresholds for surgical intervention are discussed below, but one should not wait until these thresholds are reached to send the patient for surgical consultation. It is beneficial to the state of mind of a potential surgical candidate to have early discussions pertaining to the types of operations available, their outcomes, and associated risks and benefits. If a patient’s aortic size remains stable over time, he or she may be followed by the cardiologist until significant size or growth has been documented, at which time the patient and surgeon can reconvene to discuss options for definitive treatment.
To a clinical geneticist
If 1 or more first-degree relatives of a patient with TAA or dissection are found to have aneurysmal disease, referral to a clinical geneticist is very important for genetic testing of multiple genes that have been implicated in thoracic aortic aneurysm and dissection.
WHEN SHOULD TAA BE REPAIRED?
Surgery to prevent rupture or dissection remains the definitive treatment of TAA when size thresholds are reached, and symptomatic aneurysm should be operated on regardless of the size. However, rarely are thoracic aneurysms symptomatic unless they rupture or dissect. The size criteria are based on underlying genetic etiology if known and on the behavior and natural course of TAA.
Size and other factors
Treatment should be tailored to the patient’s clinical scenario, family history, and estimated risk of rupture or dissection, balanced against the individual center’s outcomes of elective aortic replacement.32 For example, young and otherwise healthy patients with TAA and a family history of aortic dissection (who may be more likely to have connective tissue disorders such as Marfan syndrome, Loeys-Dietz syndrome, or vascular Ehler-Danlos syndrome) may elect to undergo repair when the aneurysm reaches or nearly reaches the diameter of that of the family member’s aorta when dissection occurred.2 On the other hand, TAA of degenerative etiology (eg, related to smoking or hypertension) measuring less than 5.5 cm in an older patient with comorbidities poses a lower risk of a catastrophic event such as dissection or rupture than the risk of surgery.11
Thresholds for surgery. Once the diameter of the ascending aorta reaches 6 cm, the likelihood of an acute dissection is 31%.11 A similar threshold is reached for the descending aorta at a size of 7 cm.11 Therefore, to avoid high-risk emergency surgery on an acutely dissected aorta, surgery on an ascending aortic aneurysm of degenerative etiology is usually suggested when the aneurysm reaches 5.5 cm or a documented growth rate greater than 0.5 cm/year.2,33
Additionally, in patients already undergoing surgery for valvular or coronary disease, prophylactic aortic replacement is recommended if the ascending aorta is larger than 4.5 cm. The threshold for intervention is lower in patients with connective tissue disease (> 5.0 cm for Marfan syndrome, 4.4–4.6 cm for Loeys-Dietz syndrome).2,33
Observational studies suggest that the risk of aortic complications in patients with bicuspid aortic valve aortopathy is low overall, though significantly greater than in the general population.18,34,35 These findings led to changes in the 2014 American College of Cardiology/American Heart Association guidelines on valvular heart disease,36 suggesting a surgical threshold of 5.5 cm in the absence of significant valve disease or family history of dissection of an aorta of smaller diameter.
A 2015 study of dissection risk in patients with bicuspid aortic valve aortopathy by our group found a dramatic increase in risk of aortic dissection for ascending aortic diameters greater than 5.3 cm, and a gradual increase in risk for aortic root diameters greater than 5.0 cm.37 In addition, a near-constant 3% to 4% risk of dissection was present for aortic diameters ranging from 4.7 cm to 5.0 cm, revealing that watchful waiting carries its own inherent risks.37 In our surgical experience with this population, the hospital mortality rate and risk of stroke from aortic surgery were 0.25% and 0.75%, respectively.37 Thus, the decision to operate for aortic aneurysm in the setting of a bicuspid aortic valve should take into account patient-specific factors and institutional outcomes.
A statement of clarification in the American College of Cardiology/American Heart Association guidelines was published in 2015, recommending surgery for patients with an aortic diameter of 5.0 cm or greater if the patient is at low risk and the surgery is performed by an experienced surgical team at a center with established surgical expertise in this condition.38 However, current recommendations are for surgery at 5.5 cm if the above conditions are not met.
Ratio of aortic cross-sectional area to height
Although size alone has long been used to guide surgical intervention, a recent review from the International Registry of Aortic Dissection revealed that 59% of patients suffered aortic dissection at diameters less than 5.5 cm, and that patients with certain connective tissue diseases such as Loeys-Dietz syndrome or familial thoracic aneurysm and dissection had a documented propensity for dissection at smaller diameters.39–41
Size indices such as the aortic cross-sectional area indexed to height have been implemented in guidelines for certain patient populations (eg, 10 cm2/m in Marfan syndrome) and provide better risk stratification than size cutoffs alone.2,42
The ratio of aortic cross-sectional area to the patient’s height has also been applied to patients with bicuspid aortic valve-associated aortopathy and to those with a dilated aorta and a tricuspid aortic valve.43,44 Notably, a ratio greater than 10 cm2/m has been associated with aortic dissection in these groups, and this cutoff provides better stratification for prediction of death than traditional size metrics.27,28
HOW SHOULD PATIENTS BE SCREENED? WHAT FOLLOW-UP IS NECESSARY?
Initial screening and follow-up
Follow-up of TAA depends on the initial aortic size or rate of growth, or both. For patients presenting for the first time with TAA, it is reasonable to obtain definitive aortic imaging with CT or magnetic resonance angiography (MRA), then to repeat imaging at 6 months to document stability. If the aortic dimensions remain stable, then annual follow-up with CT or MRA is reasonable.2

Our flow chart of initial screening and follow-up is shown in Figure 5.
Screening of family members
In our center, we routinely recommend screening of all first-degree relatives of patients with TAA. Aortic imaging with echocardiography plus CT or MRI should be considered to detect asymptomatic disease.2 In patients with a strong family history (ie, multiple relatives affected with aortic aneurysm, dissection, or sudden cardiac death), genetic screening and testing for known mutations are recommended for the patient as well as for the family members.
If a mutation is identified in a family, then first-degree relatives should undergo genetic screening for the mutation and aortic imaging.2 Imaging in second-degree relatives may also be considered if one or more first-degree relatives are found to have aortic dilation.2
We recommend similar screening of first-degree family members of patients with bicuspid aortic valve aortopathy. In patients with young children, we recommend obtaining an echocardiogram of the child to look for a bicuspid aortic valve or aortic dilation. If an abnormality is detected or suspected, dedicated imaging with MRA to assess aortic dimensions is warranted.
BACK TO OUR PATIENT WITH A BICUSPID AORTIC VALVE
Our patient with a bicuspid aortic valve had a 4.6-cm root, an ascending aortic aneurysm, and several affected family members.
We would obtain dedicated aortic imaging at this patient’s initial visit with either gated CT with contrast or MRA, and we would obtain a cardioaortic surgery consult. We would repeat these studies at a follow-up visit 6 months later to detect any aortic growth compared with initial studies, and follow up annually thereafter. Echocardiography can also be done at the initial visit to determine if valvular disease is present that may influence clinical decisions.
Surgery would likely be recommended once the root reached a maximum area-to-height ratio greater than 10 cm2/m, or if the valve became severely dysfunctional during follow-up.
BACK TO OUR PATIENT WITH MARFAN SYNDROME
The young woman with Marfan syndrome has a 4.6-cm aortic root aneurysm and 2+ aortic insufficiency. Her question pertains to the threshold at which an operation would be considered. This question is complicated and is influenced by several concurrent clinical features in her presentation.
Starting with size criteria, patients with Marfan syndrome should be considered for elective aortic root repair at a diameter greater than 5 cm. However, an aortic cross-sectional area-to-height ratio greater than 10 cm2/m may provide a more robust metric for clinical decision-making than aortic diameter alone. Additional factors such as degree of aortic insufficiency and deleterious left ventricular remodeling may urge one to consider aortic root repair at a diameter of 4.5 cm.
These factors, including rate of growth and the surgeon’s assessment about his or her ability to preserve the aortic valve during repair, should be considered collectively in this scenario.
- Elefteriades JA, Farkas EA. Thoracic aortic aneurysm clinically pertinent controversies and uncertainties. J Am Coll Cardiol 2010; 55(9):841–857. doi:10.1016/j.jacc.2009.08.084
- Hiratzka LF, Bakris GL, Beckman JA, et al. 2010 ACCF/AHA/AATS/ACR/ASA/SCA/SCAI/SIR/STS/SVM guidelines for the diagnosis and management of patients with thoracic aortic disease: executive summary. Anesth Analg 2010; 111(2):279–315. doi:10.1213/ANE.0b013e3181dd869b
- Clouse WD, Hallett JW Jr, Schaff HV, Gayari MM, Ilstrup DM, Melton LJ 3rd. Improved prognosis of thoracic aortic aneurysms: a population-based study. JAMA 1998; 280(22):1926–1929. pmid:9851478
- Olsson C, Thelin S, Ståhle E, Ekbom A, Granath F. Thoracic aortic aneurysm and dissection: increasing prevalence and improved outcomes reported in a nationwide population-based study of more than 14,000 cases from 1987 to 2002. Circulation 2006; 114(24):2611–2618. doi:10.1161/CIRCULATIONAHA.106.630400
- Clouse WD, Hallett JW Jr, Schaff HV, et al. Acute aortic dissection: population-based incidence compared with degenerative aortic aneurysm rupture. Mayo Clin Proc 2004; 79(2):176–180. pmid:14959911
- US Centers for Disease Control and Prevention (CDC). National Center for Injury Prevention and Control. WISQARS leading causes of death reports, 1999 – 2007. https://webappa.cdc.gov/sasweb/ncipc/leadcaus10.html. Accessed May 21, 2018.
- Hansen MS, Nogareda GJ, Hutchison SJ. Frequency of and inappropriate treatment of misdiagnosis of acute aortic dissection. Am J Cardiol 2007; 99(6):852–856. doi:10.1016/j.amjcard.2006.10.055
- Goldfinger JZ, Halperin JL, Marin ML, Stewart AS, Eagle KA, Fuster V. Thoracic aortic aneurysm and dissection. J Am Coll Cardiol 2014; 64(16):1725–1739. doi:10.1016/j.jacc.2014.08.025
- Kumar V, Abbas A, Aster J. Robbins and Cotran Pathologic Basis of Disease. 9th ed. Philadelphia, PA: Elsevier/Saunders; 2015.
- Wolak A, Gransar H, Thomson LE, et al. Aortic size assessment by noncontrast cardiac computed tomography: normal limits by age, gender, and body surface area. JACC Cardiovasc Imaging 2008; 1(2):200–209. doi:10.1016/j.jcmg.2007.11.005
- Elefteriades JA. Natural history of thoracic aortic aneurysms: indications for surgery, and surgical versus nonsurgical risks. Ann Thorac Surg 2002; 74(5):S1877–S1880; discussion S1892–S1898. pmid:12440685
- Smith AD, Schoenhagen P. CT imaging for acute aortic syndrome. Cleve Clin J Med 2008; 75(1):7–17. pmid:18236724
- Cury M, Zeidan F, Lobato AC. Aortic disease in the young: genetic aneurysm syndromes, connective tissue disorders, and familial aortic aneurysms and dissections. Int J Vasc Med 2013(2013); 2013:267215. doi:10.1155/2013/267215
- Hoffman JI, Kaplan S. The incidence of congenital heart disease. J Am Coll Cardiol 2002; 39(12):1890–1900. doi:10.1016/S0735-1097(02)01886-7
- Fedak PW, Verma S, David TE, Leask RL, Weisel RD, Butany J. Clinical and pathophysiological implications of a bicuspid aortic valve. Circulation 2002; 106(8):900–904. pmid:12186790
- Della Corte A, Bancone C, Quarto C, et al. Predictors of ascending aortic dilatation with bicuspid aortic valve: a wide spectrum of disease expression. Eur J Cardiothorac Surg 2007; 31(3):397–405. doi:10.1016/j.ejcts.2006.12.006
- Jackson V, Petrini J, Caidahl K, et al. Bicuspid aortic valve leaflet morphology in relation to aortic root morphology: a study of 300 patients undergoing open-heart surgery. Eur J Cardiothorac Surg 2011; 40(3):e118–e124. doi:10.1016/j.ejcts.2011.04.014
- Michelena HI, Khanna AD, Mahoney D, et al. Incidence of aortic complications in patients with bicuspid aortic valves. JAMA 2011; 306(10):1104–1112. doi:10.1001/jama.2011.1286
- Verma S, Siu SC. Aortic dilatation in patients with bicuspid aortic valve. N Engl J Med 2014; 370(20):1920–1929. doi:10.1056/NEJMra1207059
- Barker AJ, Markl M, Bürk J, et al. Bicuspid aortic valve is associated with altered wall shear stress in the ascending aorta. Circ Cardiovasc Imaging 2012; 5(4):457–466. doi:10.1161/CIRCIMAGING.112.973370
- Hope MD, Hope TA, Meadows AK, et al. Bicuspid aortic valve: four-dimensional MR evaluation of ascending aortic systolic flow patterns. Radiology 2010; 255(1):53–61. doi:10.1148/radiol.09091437
- Abdulkareem N, Soppa G, Jones S, Valencia O, Smelt J, Jahangiri M. Dilatation of the remaining aorta after aortic valve or aortic root replacement in patients with bicuspid aortic valve: a 5-year follow-up. Ann Thorac Surg 2013; 96(1):43–49. doi:10.1016/j.athoracsur.2013.03.086
- Regeer MV, Versteegh MI, Klautz RJ, et al. Effect of aortic valve replacement on aortic root dilatation rate in patients with bicuspid and tricuspid aortic valves. Ann Thorac Surg 2016; 102(6):1981–1987. doi:10.1016/j.athoracsur.2016.05.038
- Habashi JP, Judge DP, Holm TM, et al. Losartan, an AT1 antagonist, prevents aortic aneurysm in a mouse model of Marfan syndrome. Science 2006; 312(5770):117–121. doi:10.1126/science.1124287
- Brooke BS, Habashi JP, Judge DP, Patel N, Loeys B, Dietz HC 3rd. Angiotensin II blockade and aortic-root dilation in Marfan’s syndrome. N Engl J Med 2008; 358(26):2787–2795. doi:10.1056/NEJMoa0706585
- Chiu HH, Wu MH, Wang JK, et al. Losartan added to ß-blockade therapy for aortic root dilation in Marfan syndrome: a randomized, open-label pilot study. Mayo Clin Proc 2013; 88(3):271–276. doi:10.1016/j.mayocp.2012.11.005
- Groenink M, den Hartog AW, Franken R, et al. Losartan reduces aortic dilatation rate in adults with Marfan syndrome: a randomized controlled trial. Eur Heart J 2013; 34(45):3491–3500. doi:10.1093/eurheartj/eht334
- Lacro RV, Dietz HC, Sleeper LA, et al; Pediatric Heart Network Investigators. Atenolol versus losartan in children and young adults with Marfan’s syndrome. N Engl J Med 2014; 371(22):2061–2071. doi:10.1056/NEJMoa1404731
- Ziganshin BA, Mukherjee SK, Elefteriades JA, et al. Atenolol versus losartan in Marfan’s syndrome (letters). N Engl J Med 2015; 372(10):977–981. doi:10.1056/NEJMc1500128
- Franken R, den Hartog AW, Radonic T, et al. Beneficial outcome of losartan therapy depends on type of FBN1 mutation in Marfan syndrome. Circ Cardiovasc Genet 2015; 8(2):383–388. doi:10.1161/CIRCGENETICS.114.000950
- Elefteriades JA. Thoracic aortic aneurysm: reading the enemy’s playbook. Curr Probl Cardiol 2008; 33(5):203–277. doi:10.1016/j.cpcardiol.2008.01.004
- Idrees JJ, Roselli EE, Lowry AM, et al. Outcomes after elective proximal aortic replacement: a matched comparison of isolated versus multicomponent operations. Ann Thorac Surg 2016; 101(6):2185–2192. doi:10.1016/j.athoracsur.2015.12.026
- Hiratzka LF, Creager MA, Isselbacher EM, et al. Surgery for aortic dilatation in patients with bicuspid aortic valves: a statement of clarification from the American College of Cardiology/American Heart Association Task Force on Clinical Practice Guidelines. J Thorac Cardiovasc Surg 2016; 151(4):959–966. doi:10.1016/j.jtcvs.2015.12.001
- Tzemos N, Therrien J, Yip J, et al. Outcomes in adults with bicuspid aortic valves. JAMA 2008; 300(11):1317–1325. doi:10.1001/jama.300.11.1317
- Davies RR, Goldstein LJ, Coady MA, et al. Yearly rupture or dissection rates for thoracic aortic aneurysms: simple prediction based on size. Ann Thorac Surg 2002; 73(1):17–28. pmid:11834007
- Nishimura RA, Otto CM, Bono RO, et al. 2014 AHA/ACC guideline for the management of patients with valvular heart disease: executive summary: a report of the American College of Cardiology/American heart Association Task Force on Practice Guidelines. Circulation 2014; 129(23):2440–2492. doi:10.1161/CIR.0000000000000029
- Wojnarski CM, Svensson LG, Roselli EE, et al. Aortic dissection in patients with bicuspid aortic valve–associated aneurysms. Ann Thorac Surg 2015; 100(5):1666–1674. doi:10.1016/j.athoracsur.2015.04.126
- Hiratzka LF, Creager MA, Isselbacher EM, et al. Surgery for aortic dilatation in patients with bicuspid aortic valves: a statement of clarification from the American College of Cardiology/American Heart Association Task Force on Clinical Practice Guidelines. Circulation 2016; 133(7):680–686. doi:10.1161/CIR.0000000000000331
- Pape LA, Tsai TT, Isselbacher EM, et al; International Registry of Acute Aortic Dissection (IRAD) Investigators. Aortic diameter > or = 5.5 cm is not a good predictor of type A aortic dissection: observations from the International Registry of Acute Aortic Dissection (IRAD). Circulation 2007; 116(10):1120–1127. doi:10.1161/CIRCULATIONAHA.107.702720
- Loeys BL, Schwarze U, Holm T, et al. Aneurysm syndromes caused by mutations in the TGF-beta receptor. N Engl J Med 2006; 355(8):788–798. doi:10.1056/NEJMoa055695
- Guo DC, Pannu H, Tran-Fadulu V, et al. Mutations in smooth muscle alpha-actin (ACTA2) lead to thoracic aortic aneurysms and dissections. Nat Genet 2007; 39(12):1488–1493. doi:10.1038/ng.2007.6
- Svensson LG, Khitin L. Aortic cross-sectional area/height ratio timing of aortic surgery in asymptomatic patients with Marfan syndrome. J Thorac Cardiovasc Surg 2002; 123(2):360–361. pmid:11828302
- Svensson LG, Kim KH, Lytle BW, Cosgrove DM. Relationship of aortic cross-sectional area to height ratio and the risk of aortic dissection in patients with bicuspid aortic valves. J Thorac Cardiovasc Surg 2003; 126(3):892–893. pmid:14502185
- Masri A, Kalahasti V, Svensson LG, et al. Aortic cross-sectional area/height ratio and outcomes in patients with a trileaflet aortic valve and a dilated aorta. Circulation 2016; 134(22):1724–1737. doi:10.1161/CIRCULATIONAHA.116.022995
Thoracic aortic aneurysm (TAA) needs to be detected, monitored, and managed in a timely manner to prevent a serious consequence such as acute dissection or rupture. But only about 5% of patients experience symptoms before an acute event occurs, and for the other 95% the first “symptom” is often death.1 Most cases are detected either incidentally with echocardiography, computed tomography (CT), or magnetic resonance imaging (MRI) during workup for another condition. Patients may also be diagnosed during workup of a murmur or after a family member is found to have an aneurysm. Therefore, its true incidence is difficult to determine.2
With these facts in mind, how would you manage the following 2 cases?
Case 1: Bicuspid aortic valve, ascending aortic aneurysm
A 45-year-old man with stage 1 hypertension presents for evaluation of a bicuspid aortic valve and ascending aortic aneurysm. He has several first-degree relatives with similar conditions, and his brother recently underwent elective aortic repair. At the urging of his primary care physician, he underwent screening echocardiography, which demonstrated a “dilated root and ascending aorta” 4.6 cm in diameter. He presents today to discuss management options and how the aneurysm could affect his everyday life.
Case 2: Marfan syndrome in a young woman
A 24-year-old woman with Marfan syndrome diagnosed in adolescence presents for annual follow-up. She has many family members with the same condition, and several have undergone prophylactic aortic root repair. Her aortic root has been monitored annually for progression of dilation, and today it is 4.6 cm in diameter, a 3-mm increase from the last measurement. She has grade 2+ aortic insufficiency (on a scale of 1+ to 4+) based on echocardiography, but she has no symptoms. She is curious about what size her aortic root will need to reach for surgery to be considered.
LIKELY UNDERDETECTED
TAA is being detected more often than in the past thanks to better detection methods and heightened awareness among physicians and patients. While an incidence rate of 10.4 per 100,000 patient-years is often cited,3 this figure likely underestimates the true incidence of this clinically silent condition. The most robust data come from studies based on in-hospital diagnostic codes coupled with data from autopsies for out-of-hospital deaths.
Olsson et al,4 in a 2016 study in Sweden, found the incidence of TAA and aortic dissection to be 16.3 per 100,000 per year for men and 9.1 per 100,000 per year for women.
Clouse et al5 reported the incidence of thoracic aortic dissection as 3.5 per 100,000 patient-years, and the same figure for thoracic aortic rupture.
Aneurysmal disease accounts for 52,000 deaths per year in the United States, making it the 19th most common cause of death.6 These figures are likely lower than the true mortality rate for this condition, given that aortic dissection is often mistaken for acute myocardial infarction or other acute event if an autopsy is not done to confirm the cause of death.7
RISK FACTORS FOR THORACIC AORTIC ANEURYSM
Risk factors for TAA include genetic conditions that lead to aortic medial weakness or destruction such as Loeys-Dietz syndrome and Marfan syndrome.2 In addition, family history is important even in the absence of known genetic mutations. Other risk factors include conditions that increase aortic wall stress, such as hypertension, cocaine abuse, extreme weightlifting, trauma, and aortic coarctation.2
DIAMETER INCREASES WITH AGE, BODY SURFACE AREA
Normal dimensions for the aortic segments differ depending on age, sex, and body surface area.8,44,45 The size of the aortic root may also vary depending on how it is measured, due to the root’s trefoil shape. Measured sinus to sinus, the root is larger than when measured sinus to commissure on CT angiography or cardiac MRI. It is also larger when measured leading edge to leading edge than inner edge to inner edge on echocardiography.10
TAA is defined as an aortic diameter at least 50% greater than the upper limit of normal.8
Geometric changes in the curvature of the ascending aorta, aortic arch, and descending thoracic aorta can occur as the result of hypertension, atherosclerosis, or connective tissue disease.
HOW IS TAA DIAGNOSED?
Imaging tests
It is particularly important to obtain a gated CTA image in patients with aortic root aneurysm to avoid motion artifact and possible erroneous measurements. Gated CTA is done with electrocardiographic synchronization and allows for image processing to correct for cardiac motion.
HOW IS TAA CLASSIFIED?
TAA can be caused by a variety of inherited and sporadic conditions. These differences in pathogenesis lend themselves to classification of aneurysms into groups. Table 3 highlights the most common conditions associated with TAA.13
Bicuspid aortic valve aortopathy
From 1% to 2% of people have a bicuspid aortic valve, with a 3-to-1 male predominance.14,15 Aortic dilation occurs in 35% to 80% of people who have a bicuspid aortic valve, conferring a risk of dissection 8 times higher than in the general population.16–18
The pathogenic mechanisms that lead to this condition are widely debated, although a combination of genetic defects leading to intrinsic weakening of the aortic wall and hemodynamic effects likely contribute.19 Evidence of hemodynamic contributions to aortic dilation comes from findings that particular patterns of cusp fusion of the bicuspid aortic valve result in changes in transvalvular flow, placing more stress on specific regions of the ascending aorta.20,21 These hemodynamic alterations result in patterns of aortic dilation that depend on cusp fusion and the presence of valvular disease.
Multiple small studies found that replacing bicuspid aortic valves reduced the rate of aortic dilation, suggesting that hemodynamic factors may play a larger role than intrinsic wall properties in genetically susceptible individuals.22,23 However, larger studies are needed before any definitive conclusions can be made.
HOW IS ANEURYSM MANAGED ON AN OUTPATIENT BASIS?
Patients with a new diagnosis of TAA should be referred to a cardiologist with expertise in managing aortic disease or to a cardiac surgeon specializing in aortic surgery, depending on the initial size of the aneurysm.
Control blood pressure with beta-blockers
Medical management for patients with TAA has historically been limited to strict blood pressure control aimed at reducing aortic wall stress, mainly with beta-blockers.
Are angiotensin II receptor blockers (ARBs) beneficial? Studies in a mouse model of Marfan syndrome revealed that the ARB losartan attenuated aortic root growth.24 The results of early, small studies in humans were promising,25–27 but larger randomized trials have shown no advantage of losartan over beta-blockers in slowing aortic root growth.28 These negative results led many to question the effectiveness of losartan, although some point out that no studies have shown even beta-blockers to be beneficial in reducing the clinical end points of death or dissection.29 On the other hand, patients with certain FBN1 mutations respond more readily than others to losartan.30 Additional clinical trials of ARBs in Marfan syndrome are ongoing.
Current guidelines recommend stringent blood pressure control and smoking cessation for patients with a small aneurysm not requiring surgery and for those who are considered unsuitable for surgical or percutaneous intervention (level of evidence C, the lowest).2 For patients with TAA, it is considered reasonable to give beta-blockers. Angiotensin-converting enzyme inhibitors or ARBs may be used in combination with beta-blockers, titrated to the lowest tolerable blood pressure without adverse effects (level of evidence B).2
The recommended target blood pressure is less than 140/90 mm Hg, or 130/80 mm Hg in those with diabetes or chronic kidney disease (level of evidence B).2 However, we recommend more stringent blood pressure control: ie, less than 130/80 mm Hg for all patients with aortic aneurysm and a heart rate goal of 70 beats per minute or less, as tolerated.
Activity restriction
Activity restrictions for patients with TAA are largely based on theory, and certain activities may require more modification than others. For example, heavy lifting should be discouraged, as it may increase blood pressure significantly for short periods of time.2,31 The increased wall stress, in theory, could initiate dissection or rupture. However, moderate-intensity aerobic activity is rarely associated with significant elevations in blood pressure and should be encouraged. Stressful emotional states have been anecdotally associated with aortic dissection; thus, measures to reduce stress may offer some benefit.31
Our recommendations. While there are no published guidelines regarding activity restrictions in patients with TAA, we use a graded approach based on aortic diameter:
- 4.0 to 4.4 cm—lift no more than 75 pounds
- 4.5 to 5 cm—lift no more than 50 pounds
- 5 cm—lift no more than 25 pounds.
We also recommend not lifting anything heavier than half of one’s body weight and to avoid breath-holding or performing the Valsalva maneuver while lifting. Although these recommendations are somewhat arbitrary, based on theory and a large clinical experience at our aortic center, they seem reasonable and practical.
Activity restrictions should be stringent and individualized in patients with Marfan, Loeys-Dietz, or Ehlers-Danlos syndrome due to increased risk of dissection or rupture even if the aorta is normal in size.
We sometimes recommend exercise stress testing to assess the heart rate and blood pressure response to exercise, and we are developing research protocols to help tailor activity recommendations.
WHEN SHOULD A PATIENT BE REFERRED?
To a cardiologist at the time of diagnosis
As soon as TAA is diagnosed, the patient should be referred to a cardiologist who has special interest in aortic disease. This will allow for appropriate and timely decisions about medical management, imaging, follow-up, and referral to surgery. Additional recommendations for screening of family members and referral to clinical geneticists can be discussed at this juncture. Activity restrictions should be reviewed at the initial evaluation.
To a surgeon relatively early
Size thresholds for surgical intervention are discussed below, but one should not wait until these thresholds are reached to send the patient for surgical consultation. It is beneficial to the state of mind of a potential surgical candidate to have early discussions pertaining to the types of operations available, their outcomes, and associated risks and benefits. If a patient’s aortic size remains stable over time, he or she may be followed by the cardiologist until significant size or growth has been documented, at which time the patient and surgeon can reconvene to discuss options for definitive treatment.
To a clinical geneticist
If 1 or more first-degree relatives of a patient with TAA or dissection are found to have aneurysmal disease, referral to a clinical geneticist is very important for genetic testing of multiple genes that have been implicated in thoracic aortic aneurysm and dissection.
WHEN SHOULD TAA BE REPAIRED?
Surgery to prevent rupture or dissection remains the definitive treatment of TAA when size thresholds are reached, and symptomatic aneurysm should be operated on regardless of the size. However, rarely are thoracic aneurysms symptomatic unless they rupture or dissect. The size criteria are based on underlying genetic etiology if known and on the behavior and natural course of TAA.
Size and other factors
Treatment should be tailored to the patient’s clinical scenario, family history, and estimated risk of rupture or dissection, balanced against the individual center’s outcomes of elective aortic replacement.32 For example, young and otherwise healthy patients with TAA and a family history of aortic dissection (who may be more likely to have connective tissue disorders such as Marfan syndrome, Loeys-Dietz syndrome, or vascular Ehler-Danlos syndrome) may elect to undergo repair when the aneurysm reaches or nearly reaches the diameter of that of the family member’s aorta when dissection occurred.2 On the other hand, TAA of degenerative etiology (eg, related to smoking or hypertension) measuring less than 5.5 cm in an older patient with comorbidities poses a lower risk of a catastrophic event such as dissection or rupture than the risk of surgery.11
Thresholds for surgery. Once the diameter of the ascending aorta reaches 6 cm, the likelihood of an acute dissection is 31%.11 A similar threshold is reached for the descending aorta at a size of 7 cm.11 Therefore, to avoid high-risk emergency surgery on an acutely dissected aorta, surgery on an ascending aortic aneurysm of degenerative etiology is usually suggested when the aneurysm reaches 5.5 cm or a documented growth rate greater than 0.5 cm/year.2,33
Additionally, in patients already undergoing surgery for valvular or coronary disease, prophylactic aortic replacement is recommended if the ascending aorta is larger than 4.5 cm. The threshold for intervention is lower in patients with connective tissue disease (> 5.0 cm for Marfan syndrome, 4.4–4.6 cm for Loeys-Dietz syndrome).2,33
Observational studies suggest that the risk of aortic complications in patients with bicuspid aortic valve aortopathy is low overall, though significantly greater than in the general population.18,34,35 These findings led to changes in the 2014 American College of Cardiology/American Heart Association guidelines on valvular heart disease,36 suggesting a surgical threshold of 5.5 cm in the absence of significant valve disease or family history of dissection of an aorta of smaller diameter.
A 2015 study of dissection risk in patients with bicuspid aortic valve aortopathy by our group found a dramatic increase in risk of aortic dissection for ascending aortic diameters greater than 5.3 cm, and a gradual increase in risk for aortic root diameters greater than 5.0 cm.37 In addition, a near-constant 3% to 4% risk of dissection was present for aortic diameters ranging from 4.7 cm to 5.0 cm, revealing that watchful waiting carries its own inherent risks.37 In our surgical experience with this population, the hospital mortality rate and risk of stroke from aortic surgery were 0.25% and 0.75%, respectively.37 Thus, the decision to operate for aortic aneurysm in the setting of a bicuspid aortic valve should take into account patient-specific factors and institutional outcomes.
A statement of clarification in the American College of Cardiology/American Heart Association guidelines was published in 2015, recommending surgery for patients with an aortic diameter of 5.0 cm or greater if the patient is at low risk and the surgery is performed by an experienced surgical team at a center with established surgical expertise in this condition.38 However, current recommendations are for surgery at 5.5 cm if the above conditions are not met.
Ratio of aortic cross-sectional area to height
Although size alone has long been used to guide surgical intervention, a recent review from the International Registry of Aortic Dissection revealed that 59% of patients suffered aortic dissection at diameters less than 5.5 cm, and that patients with certain connective tissue diseases such as Loeys-Dietz syndrome or familial thoracic aneurysm and dissection had a documented propensity for dissection at smaller diameters.39–41
Size indices such as the aortic cross-sectional area indexed to height have been implemented in guidelines for certain patient populations (eg, 10 cm2/m in Marfan syndrome) and provide better risk stratification than size cutoffs alone.2,42
The ratio of aortic cross-sectional area to the patient’s height has also been applied to patients with bicuspid aortic valve-associated aortopathy and to those with a dilated aorta and a tricuspid aortic valve.43,44 Notably, a ratio greater than 10 cm2/m has been associated with aortic dissection in these groups, and this cutoff provides better stratification for prediction of death than traditional size metrics.27,28
HOW SHOULD PATIENTS BE SCREENED? WHAT FOLLOW-UP IS NECESSARY?
Initial screening and follow-up
Follow-up of TAA depends on the initial aortic size or rate of growth, or both. For patients presenting for the first time with TAA, it is reasonable to obtain definitive aortic imaging with CT or magnetic resonance angiography (MRA), then to repeat imaging at 6 months to document stability. If the aortic dimensions remain stable, then annual follow-up with CT or MRA is reasonable.2
Our flow chart of initial screening and follow-up is shown in Figure 5.
Screening of family members
In our center, we routinely recommend screening of all first-degree relatives of patients with TAA. Aortic imaging with echocardiography plus CT or MRI should be considered to detect asymptomatic disease.2 In patients with a strong family history (ie, multiple relatives affected with aortic aneurysm, dissection, or sudden cardiac death), genetic screening and testing for known mutations are recommended for the patient as well as for the family members.
If a mutation is identified in a family, then first-degree relatives should undergo genetic screening for the mutation and aortic imaging.2 Imaging in second-degree relatives may also be considered if one or more first-degree relatives are found to have aortic dilation.2
We recommend similar screening of first-degree family members of patients with bicuspid aortic valve aortopathy. In patients with young children, we recommend obtaining an echocardiogram of the child to look for a bicuspid aortic valve or aortic dilation. If an abnormality is detected or suspected, dedicated imaging with MRA to assess aortic dimensions is warranted.
BACK TO OUR PATIENT WITH A BICUSPID AORTIC VALVE
Our patient with a bicuspid aortic valve had a 4.6-cm root, an ascending aortic aneurysm, and several affected family members.
We would obtain dedicated aortic imaging at this patient’s initial visit with either gated CT with contrast or MRA, and we would obtain a cardioaortic surgery consult. We would repeat these studies at a follow-up visit 6 months later to detect any aortic growth compared with initial studies, and follow up annually thereafter. Echocardiography can also be done at the initial visit to determine if valvular disease is present that may influence clinical decisions.
Surgery would likely be recommended once the root reached a maximum area-to-height ratio greater than 10 cm2/m, or if the valve became severely dysfunctional during follow-up.
BACK TO OUR PATIENT WITH MARFAN SYNDROME
The young woman with Marfan syndrome has a 4.6-cm aortic root aneurysm and 2+ aortic insufficiency. Her question pertains to the threshold at which an operation would be considered. This question is complicated and is influenced by several concurrent clinical features in her presentation.
Starting with size criteria, patients with Marfan syndrome should be considered for elective aortic root repair at a diameter greater than 5 cm. However, an aortic cross-sectional area-to-height ratio greater than 10 cm2/m may provide a more robust metric for clinical decision-making than aortic diameter alone. Additional factors such as degree of aortic insufficiency and deleterious left ventricular remodeling may urge one to consider aortic root repair at a diameter of 4.5 cm.
These factors, including rate of growth and the surgeon’s assessment about his or her ability to preserve the aortic valve during repair, should be considered collectively in this scenario.
- Elefteriades JA, Farkas EA. Thoracic aortic aneurysm clinically pertinent controversies and uncertainties. J Am Coll Cardiol 2010; 55(9):841–857. doi:10.1016/j.jacc.2009.08.084
- Hiratzka LF, Bakris GL, Beckman JA, et al. 2010 ACCF/AHA/AATS/ACR/ASA/SCA/SCAI/SIR/STS/SVM guidelines for the diagnosis and management of patients with thoracic aortic disease: executive summary. Anesth Analg 2010; 111(2):279–315. doi:10.1213/ANE.0b013e3181dd869b
- Clouse WD, Hallett JW Jr, Schaff HV, Gayari MM, Ilstrup DM, Melton LJ 3rd. Improved prognosis of thoracic aortic aneurysms: a population-based study. JAMA 1998; 280(22):1926–1929. pmid:9851478
- Olsson C, Thelin S, Ståhle E, Ekbom A, Granath F. Thoracic aortic aneurysm and dissection: increasing prevalence and improved outcomes reported in a nationwide population-based study of more than 14,000 cases from 1987 to 2002. Circulation 2006; 114(24):2611–2618. doi:10.1161/CIRCULATIONAHA.106.630400
- Clouse WD, Hallett JW Jr, Schaff HV, et al. Acute aortic dissection: population-based incidence compared with degenerative aortic aneurysm rupture. Mayo Clin Proc 2004; 79(2):176–180. pmid:14959911
- US Centers for Disease Control and Prevention (CDC). National Center for Injury Prevention and Control. WISQARS leading causes of death reports, 1999 – 2007. https://webappa.cdc.gov/sasweb/ncipc/leadcaus10.html. Accessed May 21, 2018.
- Hansen MS, Nogareda GJ, Hutchison SJ. Frequency of and inappropriate treatment of misdiagnosis of acute aortic dissection. Am J Cardiol 2007; 99(6):852–856. doi:10.1016/j.amjcard.2006.10.055
- Goldfinger JZ, Halperin JL, Marin ML, Stewart AS, Eagle KA, Fuster V. Thoracic aortic aneurysm and dissection. J Am Coll Cardiol 2014; 64(16):1725–1739. doi:10.1016/j.jacc.2014.08.025
- Kumar V, Abbas A, Aster J. Robbins and Cotran Pathologic Basis of Disease. 9th ed. Philadelphia, PA: Elsevier/Saunders; 2015.
- Wolak A, Gransar H, Thomson LE, et al. Aortic size assessment by noncontrast cardiac computed tomography: normal limits by age, gender, and body surface area. JACC Cardiovasc Imaging 2008; 1(2):200–209. doi:10.1016/j.jcmg.2007.11.005
- Elefteriades JA. Natural history of thoracic aortic aneurysms: indications for surgery, and surgical versus nonsurgical risks. Ann Thorac Surg 2002; 74(5):S1877–S1880; discussion S1892–S1898. pmid:12440685
- Smith AD, Schoenhagen P. CT imaging for acute aortic syndrome. Cleve Clin J Med 2008; 75(1):7–17. pmid:18236724
- Cury M, Zeidan F, Lobato AC. Aortic disease in the young: genetic aneurysm syndromes, connective tissue disorders, and familial aortic aneurysms and dissections. Int J Vasc Med 2013(2013); 2013:267215. doi:10.1155/2013/267215
- Hoffman JI, Kaplan S. The incidence of congenital heart disease. J Am Coll Cardiol 2002; 39(12):1890–1900. doi:10.1016/S0735-1097(02)01886-7
- Fedak PW, Verma S, David TE, Leask RL, Weisel RD, Butany J. Clinical and pathophysiological implications of a bicuspid aortic valve. Circulation 2002; 106(8):900–904. pmid:12186790
- Della Corte A, Bancone C, Quarto C, et al. Predictors of ascending aortic dilatation with bicuspid aortic valve: a wide spectrum of disease expression. Eur J Cardiothorac Surg 2007; 31(3):397–405. doi:10.1016/j.ejcts.2006.12.006
- Jackson V, Petrini J, Caidahl K, et al. Bicuspid aortic valve leaflet morphology in relation to aortic root morphology: a study of 300 patients undergoing open-heart surgery. Eur J Cardiothorac Surg 2011; 40(3):e118–e124. doi:10.1016/j.ejcts.2011.04.014
- Michelena HI, Khanna AD, Mahoney D, et al. Incidence of aortic complications in patients with bicuspid aortic valves. JAMA 2011; 306(10):1104–1112. doi:10.1001/jama.2011.1286
- Verma S, Siu SC. Aortic dilatation in patients with bicuspid aortic valve. N Engl J Med 2014; 370(20):1920–1929. doi:10.1056/NEJMra1207059
- Barker AJ, Markl M, Bürk J, et al. Bicuspid aortic valve is associated with altered wall shear stress in the ascending aorta. Circ Cardiovasc Imaging 2012; 5(4):457–466. doi:10.1161/CIRCIMAGING.112.973370
- Hope MD, Hope TA, Meadows AK, et al. Bicuspid aortic valve: four-dimensional MR evaluation of ascending aortic systolic flow patterns. Radiology 2010; 255(1):53–61. doi:10.1148/radiol.09091437
- Abdulkareem N, Soppa G, Jones S, Valencia O, Smelt J, Jahangiri M. Dilatation of the remaining aorta after aortic valve or aortic root replacement in patients with bicuspid aortic valve: a 5-year follow-up. Ann Thorac Surg 2013; 96(1):43–49. doi:10.1016/j.athoracsur.2013.03.086
- Regeer MV, Versteegh MI, Klautz RJ, et al. Effect of aortic valve replacement on aortic root dilatation rate in patients with bicuspid and tricuspid aortic valves. Ann Thorac Surg 2016; 102(6):1981–1987. doi:10.1016/j.athoracsur.2016.05.038
- Habashi JP, Judge DP, Holm TM, et al. Losartan, an AT1 antagonist, prevents aortic aneurysm in a mouse model of Marfan syndrome. Science 2006; 312(5770):117–121. doi:10.1126/science.1124287
- Brooke BS, Habashi JP, Judge DP, Patel N, Loeys B, Dietz HC 3rd. Angiotensin II blockade and aortic-root dilation in Marfan’s syndrome. N Engl J Med 2008; 358(26):2787–2795. doi:10.1056/NEJMoa0706585
- Chiu HH, Wu MH, Wang JK, et al. Losartan added to ß-blockade therapy for aortic root dilation in Marfan syndrome: a randomized, open-label pilot study. Mayo Clin Proc 2013; 88(3):271–276. doi:10.1016/j.mayocp.2012.11.005
- Groenink M, den Hartog AW, Franken R, et al. Losartan reduces aortic dilatation rate in adults with Marfan syndrome: a randomized controlled trial. Eur Heart J 2013; 34(45):3491–3500. doi:10.1093/eurheartj/eht334
- Lacro RV, Dietz HC, Sleeper LA, et al; Pediatric Heart Network Investigators. Atenolol versus losartan in children and young adults with Marfan’s syndrome. N Engl J Med 2014; 371(22):2061–2071. doi:10.1056/NEJMoa1404731
- Ziganshin BA, Mukherjee SK, Elefteriades JA, et al. Atenolol versus losartan in Marfan’s syndrome (letters). N Engl J Med 2015; 372(10):977–981. doi:10.1056/NEJMc1500128
- Franken R, den Hartog AW, Radonic T, et al. Beneficial outcome of losartan therapy depends on type of FBN1 mutation in Marfan syndrome. Circ Cardiovasc Genet 2015; 8(2):383–388. doi:10.1161/CIRCGENETICS.114.000950
- Elefteriades JA. Thoracic aortic aneurysm: reading the enemy’s playbook. Curr Probl Cardiol 2008; 33(5):203–277. doi:10.1016/j.cpcardiol.2008.01.004
- Idrees JJ, Roselli EE, Lowry AM, et al. Outcomes after elective proximal aortic replacement: a matched comparison of isolated versus multicomponent operations. Ann Thorac Surg 2016; 101(6):2185–2192. doi:10.1016/j.athoracsur.2015.12.026
- Hiratzka LF, Creager MA, Isselbacher EM, et al. Surgery for aortic dilatation in patients with bicuspid aortic valves: a statement of clarification from the American College of Cardiology/American Heart Association Task Force on Clinical Practice Guidelines. J Thorac Cardiovasc Surg 2016; 151(4):959–966. doi:10.1016/j.jtcvs.2015.12.001
- Tzemos N, Therrien J, Yip J, et al. Outcomes in adults with bicuspid aortic valves. JAMA 2008; 300(11):1317–1325. doi:10.1001/jama.300.11.1317
- Davies RR, Goldstein LJ, Coady MA, et al. Yearly rupture or dissection rates for thoracic aortic aneurysms: simple prediction based on size. Ann Thorac Surg 2002; 73(1):17–28. pmid:11834007
- Nishimura RA, Otto CM, Bono RO, et al. 2014 AHA/ACC guideline for the management of patients with valvular heart disease: executive summary: a report of the American College of Cardiology/American heart Association Task Force on Practice Guidelines. Circulation 2014; 129(23):2440–2492. doi:10.1161/CIR.0000000000000029
- Wojnarski CM, Svensson LG, Roselli EE, et al. Aortic dissection in patients with bicuspid aortic valve–associated aneurysms. Ann Thorac Surg 2015; 100(5):1666–1674. doi:10.1016/j.athoracsur.2015.04.126
- Hiratzka LF, Creager MA, Isselbacher EM, et al. Surgery for aortic dilatation in patients with bicuspid aortic valves: a statement of clarification from the American College of Cardiology/American Heart Association Task Force on Clinical Practice Guidelines. Circulation 2016; 133(7):680–686. doi:10.1161/CIR.0000000000000331
- Pape LA, Tsai TT, Isselbacher EM, et al; International Registry of Acute Aortic Dissection (IRAD) Investigators. Aortic diameter > or = 5.5 cm is not a good predictor of type A aortic dissection: observations from the International Registry of Acute Aortic Dissection (IRAD). Circulation 2007; 116(10):1120–1127. doi:10.1161/CIRCULATIONAHA.107.702720
- Loeys BL, Schwarze U, Holm T, et al. Aneurysm syndromes caused by mutations in the TGF-beta receptor. N Engl J Med 2006; 355(8):788–798. doi:10.1056/NEJMoa055695
- Guo DC, Pannu H, Tran-Fadulu V, et al. Mutations in smooth muscle alpha-actin (ACTA2) lead to thoracic aortic aneurysms and dissections. Nat Genet 2007; 39(12):1488–1493. doi:10.1038/ng.2007.6
- Svensson LG, Khitin L. Aortic cross-sectional area/height ratio timing of aortic surgery in asymptomatic patients with Marfan syndrome. J Thorac Cardiovasc Surg 2002; 123(2):360–361. pmid:11828302
- Svensson LG, Kim KH, Lytle BW, Cosgrove DM. Relationship of aortic cross-sectional area to height ratio and the risk of aortic dissection in patients with bicuspid aortic valves. J Thorac Cardiovasc Surg 2003; 126(3):892–893. pmid:14502185
- Masri A, Kalahasti V, Svensson LG, et al. Aortic cross-sectional area/height ratio and outcomes in patients with a trileaflet aortic valve and a dilated aorta. Circulation 2016; 134(22):1724–1737. doi:10.1161/CIRCULATIONAHA.116.022995
KEY POINTS
- Screening and referral depend on clinical context. A size-based model to determine screening, referral, follow-up, and management serves most cases but should be modified in the context of connective tissue disease or family history of aneurysm and dissection.
- Medical management involves strict blood pressure and heart rate control with beta-blockers and angiotensin-converting enzyme inhibitors or angiotensin II receptor blockers. Activity modifications should be tailored to the individual, although extreme isometric exercises and heavy lifting should be discouraged.
- Patients with TAA should be followed up annually, unless the patient is presenting for initial evaluation or significant changes are seen with dedicated imaging.
