User login
Imaging Strategies and Outcomes in Children Hospitalized with Cervical Lymphadenitis
Cervical lymphadenitis is a common superficial neck infection in childhood. While most children with cervical lymphadenitis recover with antibiotic therapy, a subset can develop an abscess that may require surgical drainage. Radiologic imaging, most commonly ultrasound or computed tomography (CT), is often performed to identify such an abscess.1-3 However, no national standards exist to guide clinician decision making around imaging in this population. In the absence of evidence-based guidelines, variability in frequency, timing, and modality of imaging likely exists in children hospitalized with cervical lymphadenitis.
As demonstrated for several other common pediatric conditions,4,5 variability in imaging practices may contribute to overutilization of resources in children with cervical lymphadenitis. In particular, routinely conducting imaging on presentation may constitute overuse, as children with cervical lymphadenitis who present with less than 72 hours of neck swelling rarely undergo surgical drainage within the first 24 hours of hospitalization.1,6,7 Imaging performed on presentation is often repeated later during hospitalization, particularly if the patient has not improved with antibiotic therapy. The net result may be unnecessary, redundant radiologic studies. Furthermore, serious complications such as bacteremia, extension of infection into the retropharyngeal space, or involvement of the airway or vasculature rarely occur in children with cervical lymphadenitis.6,8 In this context, deferring initial imaging in this population is unlikely to lead to adverse outcomes and may reduce radiation exposure.
The overall objectives of this study are to describe hospital-level variation in imaging practices for pediatric cervical lymphadenitis and to examine the association between early imaging and outcomes in this population.
METHODS
Study Design and Data Source
We conducted a multicenter, cross-sectional study using the Pediatric Health Information Systems (PHIS) database, which contains administrative and billing data from 49 geographically diverse children’s hospitals across the United States (US) affiliated with the Children’s Hospital Association (Lenexa, Kansas). PHIS includes data on patient demographics, discharge diagnoses, and procedures using the International Classification of Diseases, 9th (ICD-9) and 10th Revision (ICD-10) diagnosis codes, as well as daily billed resource utilization for laboratory tests, imaging studies, and medications. Encrypted medical record numbers permit longitudinal identification of children across multiple visits to the same hospital. Use of de-identified PHIS data was deemed to be nonhuman subjects research; our approach to validation of ICD codes using local electronic medical record review was reviewed and approved by the Cincinnati Children’s Hospital Medical Center Institutional Review Board.
Study Population
Our study team developed an algorithm to identify children with cervical lymphadenitis and minimize misclassification using PHIS (Appendix A). All children with lymphadenitis-related ICD-9 and ICD-10 discharge diagnosis codes were eligible for inclusion.
This algorithm was subsequently applied to the PHIS database. Children ages two months to 18 years hospitalized at participating PHIS institutions between July 2013 and December 2017 with a diagnosis of cervical lymphadenitis as per th
Measures of Interest
To examine hospital-level variation in imaging practices, we measured the proportion of children at each hospital who underwent any neck imaging study, CT or ultrasound imaging, early imaging, and multiple imaging studies within a single hospitalization. Neck imaging was defined as the presence of a billing code for ultrasound, CT, or magnetic resonance imaging (MRI) study of the neck (Appendix B). Early imaging was defined as neck imaging conducted on day 0 of hospitalization (ie, calendar day of admission and ending at midnight). Multiple imaging studies were defined as the receipt of more than one imaging study, regardless of timing or modality. We also measured the proportion of children by hospital who received surgical drainage, defined by the presence of procedure codes for incision and drainage of abscess of the neck (Appendix B).
In examining patient-level association between early imaging and clinical outcomes, our primary outcome of interest was the receipt of multiple imaging studies. Secondary outcomes included rates of surgical drainage, length of stay (in hospital days), and rates of lymphadenitis-related hospital readmission within 30 days of index discharge.
Covariates
Baseline demographic characteristics included age, gender, race/ethnicity, and insurance type. We measured ED visits associated with lymphadenitis-related diagnosis codes in the 30 days prior to admission as a proxy measure for illness duration prior to presentation. To approximate illness severity, we included the following covariates: rates of intensive care unit admission on presentation, rates of receipt of intravenous (IV) analgesia (Appendix B) on hospital days prior to surgical drainage, and rates of receipt of broad-spectrum antibiotics on day 0 or 1 of hospitalization. Broad-spectrum antibiotics (Appendix B) were defined by an independent three-person review of available antibiotic codes (SD, SSS, and JT); differences were resolved by group consensus.
Analysis
Categorical variables were described using frequencies and percentages, while continuous data were described using median and interquartile range. We described hospital-level variation in imaging practices by calculating and comparing the proportion of children at each hospital who underwent any neck imaging study, CT imaging, ultrasound imaging, early imaging, multiple imaging studies, and surgical drainage.
Patient-level demographics and clinical characteristics were compared across groups using chi-square test. To examine the association between early imaging and outcomes, we used generalized linear or logistic mixed effects models to control for patient demographic characteristics and clinical markers of illness duration and severity, with a random effect for hospital to account for clustering. Patient demographics in the model defined a priori included age, race/ethnicity, and insurance type; clinical characteristics included prior ED visit for lymphadenitis, initial intensive care unit (ICU) admission, use of IV analgesia, and use of broad-spectrum antibiotics on day 0 or 1 of hospitalization. To assess the potential for misclassification related to the availability of calendar day but not time of imaging in PHIS, we conducted a secondary analysis to examine the patient-level association between early imaging and outcomes using an alternative definition for early imaging (defined as imaging conducted on day 0 or day 1 of hospitalization).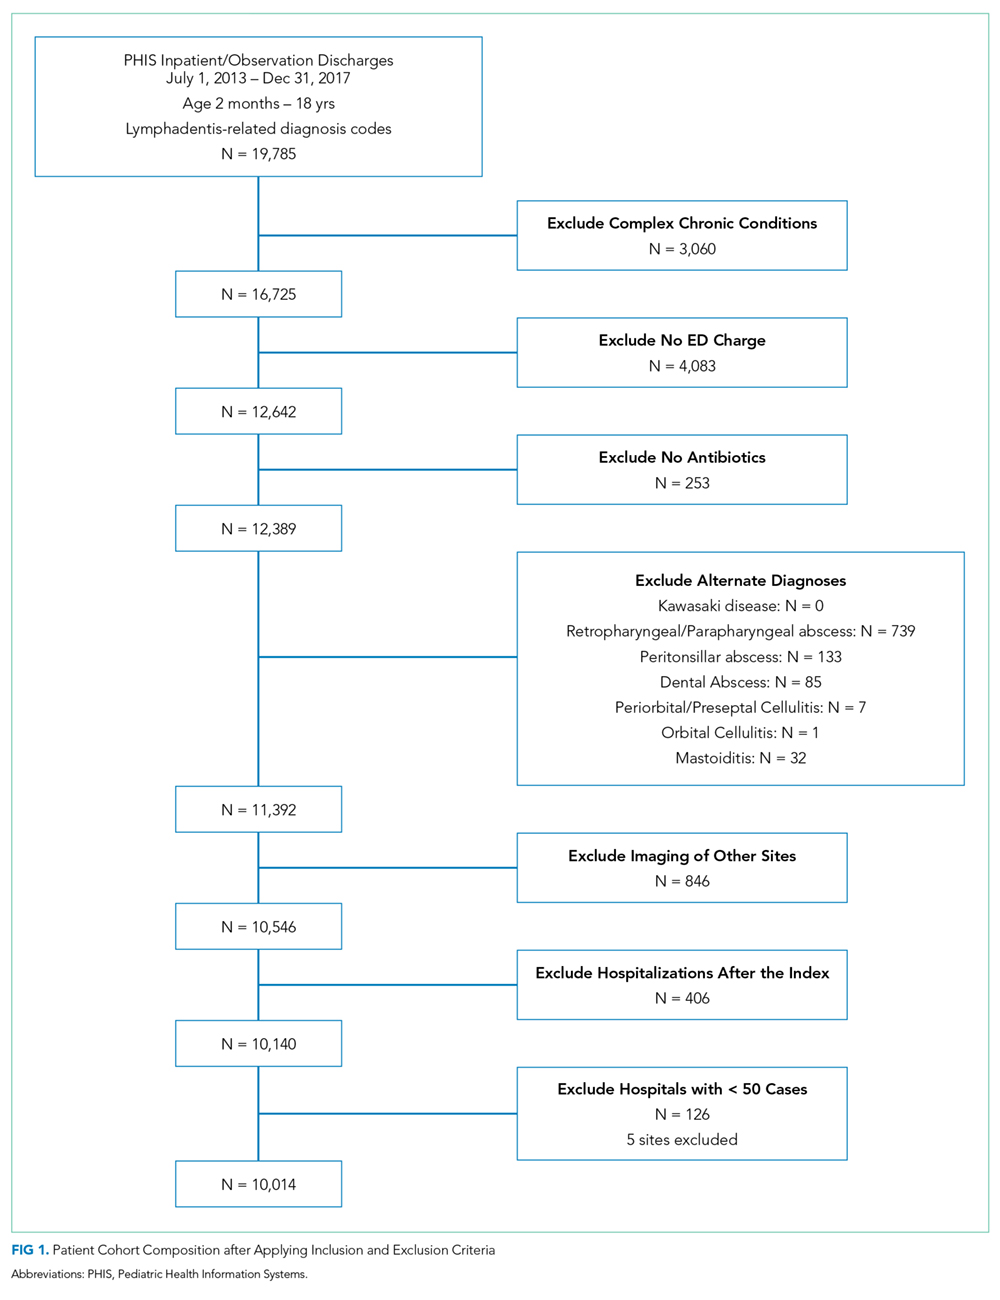
All statistical analyses were performed by using SAS version 9.4 (SAS Institute, Cary, North Carolina); P < .05 was considered statistically significant.
RESULTS
We identified 19,785 PHIS hospitalizations with lymphadenitis-related discharge diagnosis codes between July 1, 2013 and December 31, 2017. Applying our algorithm and exclusion criteria, we assembled a cohort of 10,014 children hospitalized with cervical lymphadenitis (Figure 1). Two-thirds of the children in our cohort were <4 years old, 42% were non-Hispanic white, and 63% had a government payor (Table 1). Neck imaging (ultrasound, CT, or MRI) was conducted in 8,103 (81%) children. CT imaging was performed in 4,097 (41%) of children, and early imaging was conducted in 6,111 (61%) of children with cervical lymphadenitis.
We noted hospital-level variation in rates of any neck imaging (median: 82.1%, interquartile range [IQR]: 77.7%-85.5%, full range: 68.7%-93.1%), CT imaging (median: 42.3%, IQR: 26.7%-55.2%, full range: 12.0%-81.5%), early imaging (median: 64.4%, IQR: 59.8%-68.4%, full range: 13.8%-76.9%), and multiple imaging studies (median: 23.7%, IQR: 18.6%-28.9%, full range: 1.2%-40.7%; Figure 2). Rates of surgical drainage also varied by hospital (median: 35.1%, IQR: 31.3%-42.0%, full range: 17.1%-54.5%).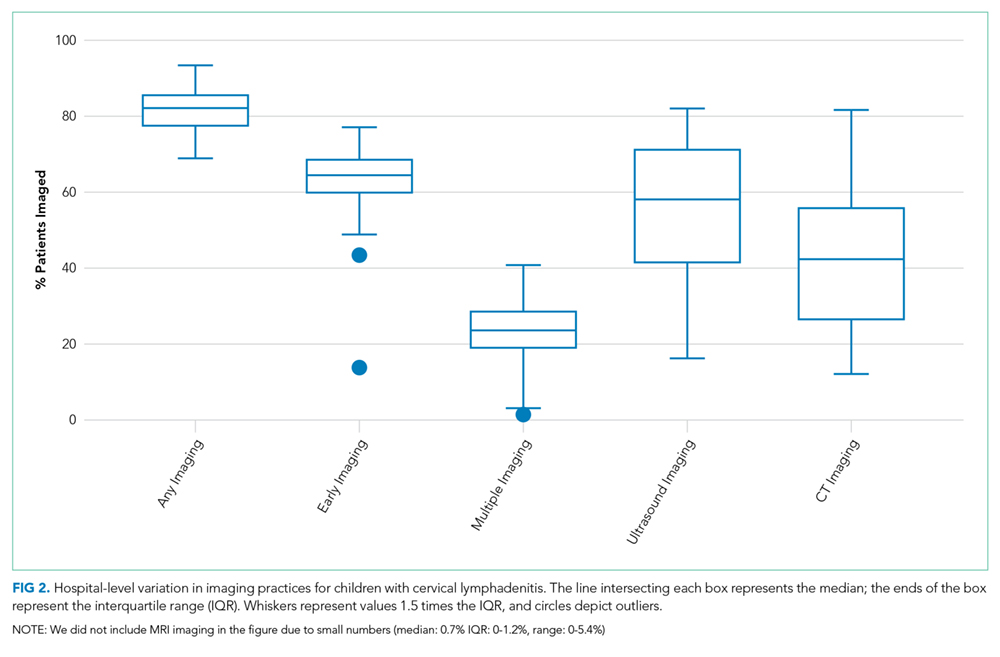
At the patient level, children who received early imaging were more likely to be <1 year old (21% vs 16%, P < .001), or Hispanic or Black when compared with children who did not receive early imaging (Table 1). Children who received early imaging were more likely to have had an ED visit for lymphadenitis in the preceding 30 days (8% vs 6%, P = .001). However, they were less likely to have received broad-spectrum antibiotics on admission (6% vs 8%, P < .001; Table 1). Of the 6,111 patients who received early imaging, 2,538 (41.5%) received CT imaging and 3,902 (63.9%) received ultrasound imaging on day 0. Of the 2,272 patients receiving multiple imaging studies, 116 (5.1%) received two or more CT scans.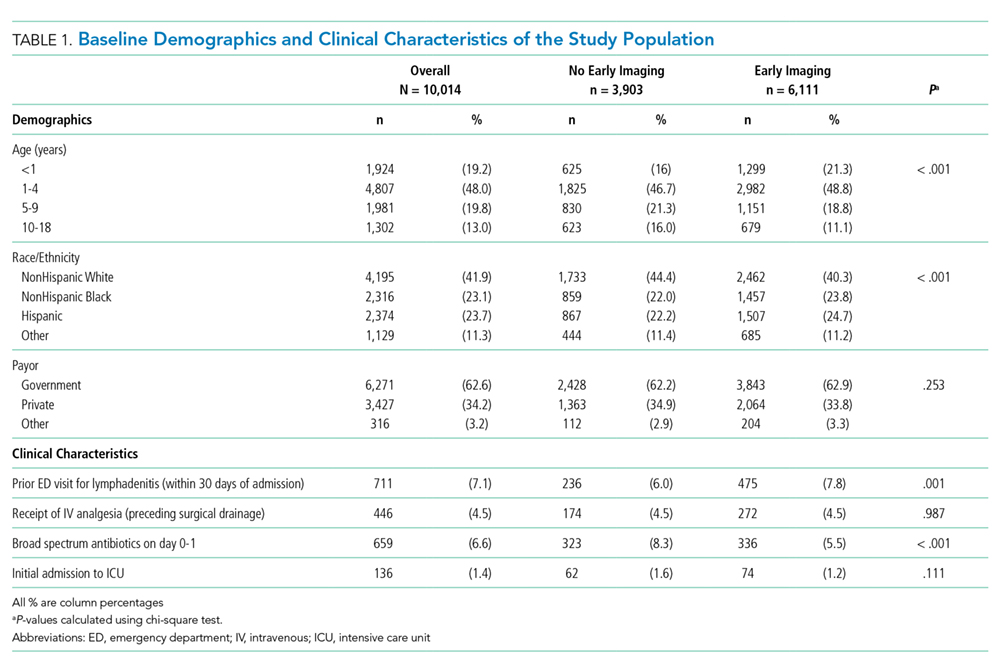
In multivariable analysis at the patient level, early imaging was associated with higher adjusted odds of receiving multiple imaging studies (adjusted odds ratio [aOR] 3.0, 95% CI: 2.6-3.6). Similarly, early imaging was associated with higher adjusted odds of surgical drainage (aOR: 1.3, 95% CI: 1.1-1.4), increased 30-day readmission for lymphadenitis (aOR: 1.5, 95% CI: 1.2-1.9), and longer length of stay (adjusted rate ratio: 1.2, 95% CI: 1.1-1.2; Table 2). For the subset of patients who did not receive surgical drainage during the index admission, the adjusted odds ratio for the association between early imaging at index admission and 30-day readmission was 1.7 (95% CI: 1.3-2.1). About 63% of readmissions occurred within 7 days of index discharge; 89% occurred within 14 days (Appendix Figure).
In secondary analysis using an alternative definition for early imaging (ie, imaging conducted on day 0 or day 1 of hospitalization), the adjusted odds ratio for multiple imaging studies was 22.6 (95% CI: 15.8-32.4). The adjusted odds and rate ratios for the remaining outcomes were similar to our primary analysis.
DISCUSSION
In this large multicenter study of children with cervical lymphadenitis, we found variation in imaging practices across 44 US children’s hospitals. Children with cervical lymphadenitis who underwent early imaging were more likely to receive multiple imaging studies during a single hospitalization than those who did not receive early imaging. At the patient level, early imaging was also associated with higher rates of surgical drainage, more frequent 30-day readmission, and longer lengths of stay.
To our knowledge, imaging practices in the population of children hospitalized with cervical lymphadenitis have not been previously characterized in the US; one study from Atlanta, Georgia, describes imaging practices in all children evaluated in the ED.1 Single-center studies of children hospitalized with cervical lymphadenitis have been previously conducted in Canada6 and New Zealand,8 in which 42%-51% of children received imaging. In our study, most (81%) children hospitalized with lymphadenitis received some form of imaging, with 61% of all children receiving early imaging. Furthermore, 41% received CT imaging, as compared with 8%-10% of children in the aforementioned studies from Canada and New Zealand.6,8 This finding is consistent with a pattern of imaging overuse in the US, which has amongst the highest utilization rates globally for advanced imaging such as CT and MRI.10,11 Identifying opportunities to safely reduce routine imaging, particularly CT imaging, in this population could decrease unnecessary radiation exposure without compromising outcomes.
We also noted variability in imaging practices across PHIS hospitals. Some of this variability may be partially explained by differences in the patient population or illness severity across hospitals. However, given the absence of evidence-based best practices for children with cervical lymphadenitis, clinicians may rely on anecdotal experience or local practice culture to guide their decision making,12 leading to variability in frequency, timing, and modality of imaging.
At the patient level, we found that children who received early imaging were more likely to receive multiple imaging studies. This finding supports our hypothesis that clinicians often order a second imaging study when the initial imaging study does not clearly demonstrate an abscess, and the child subsequently fails to demonstrate clear improvement after 24-48 hours of antibiotics.
Furthermore, early imaging was associated with overall increased utilization in our cohort, including increased likelihood of surgical drainage, 30-day readmission for lymphadenitis, as well as longer lengths of stay. Confounding may be one explanation for this finding. For instance, clinicians may pursue early imaging in children who present with longer duration of symptoms or more severe illness on presentation, as these factors may be associated with abscess formation.1,6,7 These clinical covariates are not available in PHIS. Thus, we used prior ED visits for lymphadenitis to approximate illness duration, and initial admission to ICU, receipt of IV analgesia, and receipt of broad-spectrum antibiotics to approximate illness severity in an attempt to mitigate confounding.
On the other hand, it is also possible that a proportion of children with a small fluid collection on imaging may have improved with antibiotics alone. There is a growing body of evidence in children with other head and neck infections (eg, retropharyngeal abscess and orbital cellulitis with periosteal abscess)13-15 that suggests that children with small abscesses often improve with antibiotic therapy alone. In children with cervical lymphadenitis who have small or developing abscesses identified via routine imaging on presentation, clinicians may be driven to pursue a surgical intervention with uncertain benefit. Deferring routine imaging in this population may provide an opportunity to improve the value of care in children with lymphadenitis without adversely affecting outcomes.
This study has several limitations given our use of an administrative database. Children with lymphadenitis may have been misclassified as these patients were identified using discharge diagnosis codes
Furthermore, we were unable to measure the exact time of imaging study in PHIS; we used imaging conducted on hospital day 0 as a proxy measure for imaging conducted within the first 24 hours of presentation. With this definition, some children who had early imaging were likely misclassified as not having received early imaging. For example, a patient who arrived in the ED at 9
Additionally, there may be a subset of children who underwent imaging prior to presentation at the PHIS hospital ED for further workup and admission. Imaging conducted outside a PHIS hospital was not captured in this database. Similarly, children who had a readmission at a different hospital than their index admission would not be captured using PHIS. Finally, PHIS captures data from children’s hospitals; practices at these hospitals may not be generalizable to practices in the community hospital setting.
CONCLUSION
In conclusion, we found that imaging practices in children hospitalized with cervical lymphadenitis were widely variable across hospitals. Children receiving early imaging had more resource utilization and intervention when compared with children who did not receive early imaging. Our findings may represent a cascade effect, in which routinely conducted early imaging prompts clinicians to pursue more testing and interventions in this population. Future studies should obtain more detailed patient level covariates to further characterize clinical factors that may impact decisions around imaging and clinical outcomes for children with cervical lymphadenitis.
Acknowledgments
The authors would like to acknowledge the following investigators for their contributions to data interpretation and review of the final manuscript: Angela Choe MD, Cincinnati Children’s Hospital Medical Center, Cincinnati, Ohio; Margaret Rush MD, Children’s National Medical Center, Washington, DC; Ryosuke Takei MD, Children’s Hospital of Philadelphia, Philadelphia, Pennsylvania; Wallis Molchen DO, Texas Children’s Hospital, Houston, Texas; Stephanie Royer Moss MD, Cleveland Clinic, Cleveland, Ohio; Rebecca Dang, MD, Lucile Packard Children’s Hospital Stanford, Palo Alto, California; Joy Solano MD, Children’s Mercy Hospital Kansas, Overland Park, Kansas; Nathaniel P. Goodrich MD, Children’s Hospital & Medical Center, Omaha, Nebraska; Ngozi Eboh MD, Texas Tech University Health Sciences Center, Dallas, Texas; Ashley Jenkins MD, Cincinnati Children’s Hospital Medical Center, Cincinnati, Ohio; Rebecca Steuart MD, Cincinnati Children’s Hospital Medical Center, Cincinnati, Ohio; Sonya Tang Girdwood MD, PhD, Cincinnati Children’s Hospital Medical Center, Cincinnati, Ohio; Alissa McInerney MD, Maria Fareri Children’s Hospital at Westchester Medical Center, Valhalla, New York; Sumeet Banker MD, MPH, New York Presbyterian Morgan Stanley Children’s Hospital, New York, New York; Corrie McDaniel DO, Seattle Children’s Hospital, Seattle, Washington; Christiane Lenzen MD, Rady Children’s Hospital, San Diego, California; Aleisha Nabower MD, Children’s Hospital & Medical Center, Omaha, Nebraska; Waheeda Samady MD, Ann & Robert H. Lurie Children’s Hospital, Chicago, Illinois; Jennifer Chen MD, Rady Children’s Hospital, San Diego, California; Marquita Genies MD, MPH, John’s Hopkins Children’s Center, Baltimore, Maryland; Justin Lockwood MD, Children’s Hospital Colorado, Aurora, Colorado; David Synhorst MD, Children’s Mercy Hospital Kansas, Overland Park, Kansas.
1. Sauer MW, Sharma S, Hirsh DA et al. Acute neck infections in children: who is likely to undergo surgical drainage? Am J Emerg Med. 2013;31(6):906-909. https://doi.org/10.1016/j.ajem.2013.02.043.
2. Sethia R, Mahida JB, Subbarayan RA, et al. Evaluation of an imaging protocol using ultrasound as the primary diagnostic modality in pediatric patients with superficial soft tissue infections of the face and neck. Int J Pediatr Otorhinolaryngol. 2017;96:89-93. https://doi.org/10.1016/j.ijporl.2017.02.027.
3. Neff L, Newland JG, Sykes KJ, Selvarangan R, Wei JL. Microbiology and antimicrobial treatment of pediatric cervical lymphadenitis requiring surgical intervention. Int J Pediatr Otorhinolaryngol. 2013;77(5):817-820. https://doi.org/10.1016/j.ijporl.2013.02.018.
4. Brogan TV, Hall M, Williams DJ, et al. Variability in processes of care and outcomes among children hospitalized with community-acquired pneumonia. Pediatr Infect Dis J. 2012;31(10):1036-1041. https://doi.org/10.1097/INF.0b013e31825f2b10.
5. Conway PH, Keren R. Factors associated with variability in outcomes for children hospitalized with urinary tract infection. J Pediatr. 2009;154(6):789-796. https://doi.org/10.1016/j.jpeds.2009.01.010.
6. Luu TM, Chevalier I, Gauthier M et al. Acute adenitis in children: clinical course and factors predictive of surgical drainage. J Paediatr Child Health. 2005;41(5-6):273-277. https://doi.org/10.1111/j.1440-1754.2005.00610.x.
7. Golriz F, Bisset GS, 3rd, D’Amico B, et al. A clinical decision rule for the use of ultrasound in children presenting with acute inflammatory neck masses. Pediatr Rad. 2017;47(4):422-428. https://doi.org/10.1007/s00247-016-3774-9.
8. Courtney MJ, Miteff A, Mahadevan M. Management of pediatric lateral neck infections: does the adage “… never let the sun go down on undrained pus …” hold true? Int J Pediatr Otorhinolaryngol. 2007;71(1):95-100. https://doi.org/10.1016/j.ijporl.2006.09.009.
9. Feudtner C, Feinstein JA, Zhong W, Hall M, Dai D. Pediatric complex chronic conditions classification system version 2: updated for ICD-10 and complex medical technology dependence and transplantation. BMC Pediatr. 2014;14:199. https://doi.org/10.1186/1471-2431-14-199.
10. Papanicolas I, Woskie LR, Jha AK. Health care spending in the United States and other high-income countries. JAMA. 2018;319(10):1024-1039. https://doi.org/10.1001/jama.2018.1150.
11. Oren O, Kebebew E, Ioannidis JPA. Curbing unnecessary and wasted diagnostic imaging. JAMA. 2019;321(3):245-246. https://doi.org/10.1001/jama.2018.20295.
12. Palmer RH, Miller MR. Methodologic challenges in developing and implementing measures of quality for child health care. Ambul Pediatr Off J Ambul Pediatr Assoc. 2001;1(1):39-52. https://doi.org/10.1367/1539-4409(2001)001<0039:MCIDAI>2.0.CO;2.
13. Daya H, Lo S, Papsin BC, et al. Retropharyngeal and parapharyngeal infections in children: the Toronto experience. Int J Pediatr Otorhinolaryngol. 2005;69(1):81-86. https://doi.org/10.1016/j.ijporl.2004.08.010.
14. Wong SJ, Levi J. Management of pediatric orbital cellulitis: A systematic review. Int J Pediatr Otorhinolaryngol. 2018;110:123-129. https://doi.org/10.1016/j.ijporl.2018.05.006.
15. Wong DK, Brown C, Mills N, Spielmann P, Neeff M. To drain or not to drain-management of pediatric deep neck abscesses: a case-control study. Int J Pediatr Otorhinolaryngol. 2012;76(12):1810-1813. https://doi.org/10.1016/j.ijporl.2012.09.006.
Cervical lymphadenitis is a common superficial neck infection in childhood. While most children with cervical lymphadenitis recover with antibiotic therapy, a subset can develop an abscess that may require surgical drainage. Radiologic imaging, most commonly ultrasound or computed tomography (CT), is often performed to identify such an abscess.1-3 However, no national standards exist to guide clinician decision making around imaging in this population. In the absence of evidence-based guidelines, variability in frequency, timing, and modality of imaging likely exists in children hospitalized with cervical lymphadenitis.
As demonstrated for several other common pediatric conditions,4,5 variability in imaging practices may contribute to overutilization of resources in children with cervical lymphadenitis. In particular, routinely conducting imaging on presentation may constitute overuse, as children with cervical lymphadenitis who present with less than 72 hours of neck swelling rarely undergo surgical drainage within the first 24 hours of hospitalization.1,6,7 Imaging performed on presentation is often repeated later during hospitalization, particularly if the patient has not improved with antibiotic therapy. The net result may be unnecessary, redundant radiologic studies. Furthermore, serious complications such as bacteremia, extension of infection into the retropharyngeal space, or involvement of the airway or vasculature rarely occur in children with cervical lymphadenitis.6,8 In this context, deferring initial imaging in this population is unlikely to lead to adverse outcomes and may reduce radiation exposure.
The overall objectives of this study are to describe hospital-level variation in imaging practices for pediatric cervical lymphadenitis and to examine the association between early imaging and outcomes in this population.
METHODS
Study Design and Data Source
We conducted a multicenter, cross-sectional study using the Pediatric Health Information Systems (PHIS) database, which contains administrative and billing data from 49 geographically diverse children’s hospitals across the United States (US) affiliated with the Children’s Hospital Association (Lenexa, Kansas). PHIS includes data on patient demographics, discharge diagnoses, and procedures using the International Classification of Diseases, 9th (ICD-9) and 10th Revision (ICD-10) diagnosis codes, as well as daily billed resource utilization for laboratory tests, imaging studies, and medications. Encrypted medical record numbers permit longitudinal identification of children across multiple visits to the same hospital. Use of de-identified PHIS data was deemed to be nonhuman subjects research; our approach to validation of ICD codes using local electronic medical record review was reviewed and approved by the Cincinnati Children’s Hospital Medical Center Institutional Review Board.
Study Population
Our study team developed an algorithm to identify children with cervical lymphadenitis and minimize misclassification using PHIS (Appendix A). All children with lymphadenitis-related ICD-9 and ICD-10 discharge diagnosis codes were eligible for inclusion.
This algorithm was subsequently applied to the PHIS database. Children ages two months to 18 years hospitalized at participating PHIS institutions between July 2013 and December 2017 with a diagnosis of cervical lymphadenitis as per th
Measures of Interest
To examine hospital-level variation in imaging practices, we measured the proportion of children at each hospital who underwent any neck imaging study, CT or ultrasound imaging, early imaging, and multiple imaging studies within a single hospitalization. Neck imaging was defined as the presence of a billing code for ultrasound, CT, or magnetic resonance imaging (MRI) study of the neck (Appendix B). Early imaging was defined as neck imaging conducted on day 0 of hospitalization (ie, calendar day of admission and ending at midnight). Multiple imaging studies were defined as the receipt of more than one imaging study, regardless of timing or modality. We also measured the proportion of children by hospital who received surgical drainage, defined by the presence of procedure codes for incision and drainage of abscess of the neck (Appendix B).
In examining patient-level association between early imaging and clinical outcomes, our primary outcome of interest was the receipt of multiple imaging studies. Secondary outcomes included rates of surgical drainage, length of stay (in hospital days), and rates of lymphadenitis-related hospital readmission within 30 days of index discharge.
Covariates
Baseline demographic characteristics included age, gender, race/ethnicity, and insurance type. We measured ED visits associated with lymphadenitis-related diagnosis codes in the 30 days prior to admission as a proxy measure for illness duration prior to presentation. To approximate illness severity, we included the following covariates: rates of intensive care unit admission on presentation, rates of receipt of intravenous (IV) analgesia (Appendix B) on hospital days prior to surgical drainage, and rates of receipt of broad-spectrum antibiotics on day 0 or 1 of hospitalization. Broad-spectrum antibiotics (Appendix B) were defined by an independent three-person review of available antibiotic codes (SD, SSS, and JT); differences were resolved by group consensus.
Analysis
Categorical variables were described using frequencies and percentages, while continuous data were described using median and interquartile range. We described hospital-level variation in imaging practices by calculating and comparing the proportion of children at each hospital who underwent any neck imaging study, CT imaging, ultrasound imaging, early imaging, multiple imaging studies, and surgical drainage.
Patient-level demographics and clinical characteristics were compared across groups using chi-square test. To examine the association between early imaging and outcomes, we used generalized linear or logistic mixed effects models to control for patient demographic characteristics and clinical markers of illness duration and severity, with a random effect for hospital to account for clustering. Patient demographics in the model defined a priori included age, race/ethnicity, and insurance type; clinical characteristics included prior ED visit for lymphadenitis, initial intensive care unit (ICU) admission, use of IV analgesia, and use of broad-spectrum antibiotics on day 0 or 1 of hospitalization. To assess the potential for misclassification related to the availability of calendar day but not time of imaging in PHIS, we conducted a secondary analysis to examine the patient-level association between early imaging and outcomes using an alternative definition for early imaging (defined as imaging conducted on day 0 or day 1 of hospitalization).
All statistical analyses were performed by using SAS version 9.4 (SAS Institute, Cary, North Carolina); P < .05 was considered statistically significant.
RESULTS
We identified 19,785 PHIS hospitalizations with lymphadenitis-related discharge diagnosis codes between July 1, 2013 and December 31, 2017. Applying our algorithm and exclusion criteria, we assembled a cohort of 10,014 children hospitalized with cervical lymphadenitis (Figure 1). Two-thirds of the children in our cohort were <4 years old, 42% were non-Hispanic white, and 63% had a government payor (Table 1). Neck imaging (ultrasound, CT, or MRI) was conducted in 8,103 (81%) children. CT imaging was performed in 4,097 (41%) of children, and early imaging was conducted in 6,111 (61%) of children with cervical lymphadenitis.
We noted hospital-level variation in rates of any neck imaging (median: 82.1%, interquartile range [IQR]: 77.7%-85.5%, full range: 68.7%-93.1%), CT imaging (median: 42.3%, IQR: 26.7%-55.2%, full range: 12.0%-81.5%), early imaging (median: 64.4%, IQR: 59.8%-68.4%, full range: 13.8%-76.9%), and multiple imaging studies (median: 23.7%, IQR: 18.6%-28.9%, full range: 1.2%-40.7%; Figure 2). Rates of surgical drainage also varied by hospital (median: 35.1%, IQR: 31.3%-42.0%, full range: 17.1%-54.5%).
At the patient level, children who received early imaging were more likely to be <1 year old (21% vs 16%, P < .001), or Hispanic or Black when compared with children who did not receive early imaging (Table 1). Children who received early imaging were more likely to have had an ED visit for lymphadenitis in the preceding 30 days (8% vs 6%, P = .001). However, they were less likely to have received broad-spectrum antibiotics on admission (6% vs 8%, P < .001; Table 1). Of the 6,111 patients who received early imaging, 2,538 (41.5%) received CT imaging and 3,902 (63.9%) received ultrasound imaging on day 0. Of the 2,272 patients receiving multiple imaging studies, 116 (5.1%) received two or more CT scans.
In multivariable analysis at the patient level, early imaging was associated with higher adjusted odds of receiving multiple imaging studies (adjusted odds ratio [aOR] 3.0, 95% CI: 2.6-3.6). Similarly, early imaging was associated with higher adjusted odds of surgical drainage (aOR: 1.3, 95% CI: 1.1-1.4), increased 30-day readmission for lymphadenitis (aOR: 1.5, 95% CI: 1.2-1.9), and longer length of stay (adjusted rate ratio: 1.2, 95% CI: 1.1-1.2; Table 2). For the subset of patients who did not receive surgical drainage during the index admission, the adjusted odds ratio for the association between early imaging at index admission and 30-day readmission was 1.7 (95% CI: 1.3-2.1). About 63% of readmissions occurred within 7 days of index discharge; 89% occurred within 14 days (Appendix Figure).
In secondary analysis using an alternative definition for early imaging (ie, imaging conducted on day 0 or day 1 of hospitalization), the adjusted odds ratio for multiple imaging studies was 22.6 (95% CI: 15.8-32.4). The adjusted odds and rate ratios for the remaining outcomes were similar to our primary analysis.
DISCUSSION
In this large multicenter study of children with cervical lymphadenitis, we found variation in imaging practices across 44 US children’s hospitals. Children with cervical lymphadenitis who underwent early imaging were more likely to receive multiple imaging studies during a single hospitalization than those who did not receive early imaging. At the patient level, early imaging was also associated with higher rates of surgical drainage, more frequent 30-day readmission, and longer lengths of stay.
To our knowledge, imaging practices in the population of children hospitalized with cervical lymphadenitis have not been previously characterized in the US; one study from Atlanta, Georgia, describes imaging practices in all children evaluated in the ED.1 Single-center studies of children hospitalized with cervical lymphadenitis have been previously conducted in Canada6 and New Zealand,8 in which 42%-51% of children received imaging. In our study, most (81%) children hospitalized with lymphadenitis received some form of imaging, with 61% of all children receiving early imaging. Furthermore, 41% received CT imaging, as compared with 8%-10% of children in the aforementioned studies from Canada and New Zealand.6,8 This finding is consistent with a pattern of imaging overuse in the US, which has amongst the highest utilization rates globally for advanced imaging such as CT and MRI.10,11 Identifying opportunities to safely reduce routine imaging, particularly CT imaging, in this population could decrease unnecessary radiation exposure without compromising outcomes.
We also noted variability in imaging practices across PHIS hospitals. Some of this variability may be partially explained by differences in the patient population or illness severity across hospitals. However, given the absence of evidence-based best practices for children with cervical lymphadenitis, clinicians may rely on anecdotal experience or local practice culture to guide their decision making,12 leading to variability in frequency, timing, and modality of imaging.
At the patient level, we found that children who received early imaging were more likely to receive multiple imaging studies. This finding supports our hypothesis that clinicians often order a second imaging study when the initial imaging study does not clearly demonstrate an abscess, and the child subsequently fails to demonstrate clear improvement after 24-48 hours of antibiotics.
Furthermore, early imaging was associated with overall increased utilization in our cohort, including increased likelihood of surgical drainage, 30-day readmission for lymphadenitis, as well as longer lengths of stay. Confounding may be one explanation for this finding. For instance, clinicians may pursue early imaging in children who present with longer duration of symptoms or more severe illness on presentation, as these factors may be associated with abscess formation.1,6,7 These clinical covariates are not available in PHIS. Thus, we used prior ED visits for lymphadenitis to approximate illness duration, and initial admission to ICU, receipt of IV analgesia, and receipt of broad-spectrum antibiotics to approximate illness severity in an attempt to mitigate confounding.
On the other hand, it is also possible that a proportion of children with a small fluid collection on imaging may have improved with antibiotics alone. There is a growing body of evidence in children with other head and neck infections (eg, retropharyngeal abscess and orbital cellulitis with periosteal abscess)13-15 that suggests that children with small abscesses often improve with antibiotic therapy alone. In children with cervical lymphadenitis who have small or developing abscesses identified via routine imaging on presentation, clinicians may be driven to pursue a surgical intervention with uncertain benefit. Deferring routine imaging in this population may provide an opportunity to improve the value of care in children with lymphadenitis without adversely affecting outcomes.
This study has several limitations given our use of an administrative database. Children with lymphadenitis may have been misclassified as these patients were identified using discharge diagnosis codes
Furthermore, we were unable to measure the exact time of imaging study in PHIS; we used imaging conducted on hospital day 0 as a proxy measure for imaging conducted within the first 24 hours of presentation. With this definition, some children who had early imaging were likely misclassified as not having received early imaging. For example, a patient who arrived in the ED at 9
Additionally, there may be a subset of children who underwent imaging prior to presentation at the PHIS hospital ED for further workup and admission. Imaging conducted outside a PHIS hospital was not captured in this database. Similarly, children who had a readmission at a different hospital than their index admission would not be captured using PHIS. Finally, PHIS captures data from children’s hospitals; practices at these hospitals may not be generalizable to practices in the community hospital setting.
CONCLUSION
In conclusion, we found that imaging practices in children hospitalized with cervical lymphadenitis were widely variable across hospitals. Children receiving early imaging had more resource utilization and intervention when compared with children who did not receive early imaging. Our findings may represent a cascade effect, in which routinely conducted early imaging prompts clinicians to pursue more testing and interventions in this population. Future studies should obtain more detailed patient level covariates to further characterize clinical factors that may impact decisions around imaging and clinical outcomes for children with cervical lymphadenitis.
Acknowledgments
The authors would like to acknowledge the following investigators for their contributions to data interpretation and review of the final manuscript: Angela Choe MD, Cincinnati Children’s Hospital Medical Center, Cincinnati, Ohio; Margaret Rush MD, Children’s National Medical Center, Washington, DC; Ryosuke Takei MD, Children’s Hospital of Philadelphia, Philadelphia, Pennsylvania; Wallis Molchen DO, Texas Children’s Hospital, Houston, Texas; Stephanie Royer Moss MD, Cleveland Clinic, Cleveland, Ohio; Rebecca Dang, MD, Lucile Packard Children’s Hospital Stanford, Palo Alto, California; Joy Solano MD, Children’s Mercy Hospital Kansas, Overland Park, Kansas; Nathaniel P. Goodrich MD, Children’s Hospital & Medical Center, Omaha, Nebraska; Ngozi Eboh MD, Texas Tech University Health Sciences Center, Dallas, Texas; Ashley Jenkins MD, Cincinnati Children’s Hospital Medical Center, Cincinnati, Ohio; Rebecca Steuart MD, Cincinnati Children’s Hospital Medical Center, Cincinnati, Ohio; Sonya Tang Girdwood MD, PhD, Cincinnati Children’s Hospital Medical Center, Cincinnati, Ohio; Alissa McInerney MD, Maria Fareri Children’s Hospital at Westchester Medical Center, Valhalla, New York; Sumeet Banker MD, MPH, New York Presbyterian Morgan Stanley Children’s Hospital, New York, New York; Corrie McDaniel DO, Seattle Children’s Hospital, Seattle, Washington; Christiane Lenzen MD, Rady Children’s Hospital, San Diego, California; Aleisha Nabower MD, Children’s Hospital & Medical Center, Omaha, Nebraska; Waheeda Samady MD, Ann & Robert H. Lurie Children’s Hospital, Chicago, Illinois; Jennifer Chen MD, Rady Children’s Hospital, San Diego, California; Marquita Genies MD, MPH, John’s Hopkins Children’s Center, Baltimore, Maryland; Justin Lockwood MD, Children’s Hospital Colorado, Aurora, Colorado; David Synhorst MD, Children’s Mercy Hospital Kansas, Overland Park, Kansas.
1. Sauer MW, Sharma S, Hirsh DA et al. Acute neck infections in children: who is likely to undergo surgical drainage? Am J Emerg Med. 2013;31(6):906-909. https://doi.org/10.1016/j.ajem.2013.02.043.
2. Sethia R, Mahida JB, Subbarayan RA, et al. Evaluation of an imaging protocol using ultrasound as the primary diagnostic modality in pediatric patients with superficial soft tissue infections of the face and neck. Int J Pediatr Otorhinolaryngol. 2017;96:89-93. https://doi.org/10.1016/j.ijporl.2017.02.027.
3. Neff L, Newland JG, Sykes KJ, Selvarangan R, Wei JL. Microbiology and antimicrobial treatment of pediatric cervical lymphadenitis requiring surgical intervention. Int J Pediatr Otorhinolaryngol. 2013;77(5):817-820. https://doi.org/10.1016/j.ijporl.2013.02.018.
4. Brogan TV, Hall M, Williams DJ, et al. Variability in processes of care and outcomes among children hospitalized with community-acquired pneumonia. Pediatr Infect Dis J. 2012;31(10):1036-1041. https://doi.org/10.1097/INF.0b013e31825f2b10.
5. Conway PH, Keren R. Factors associated with variability in outcomes for children hospitalized with urinary tract infection. J Pediatr. 2009;154(6):789-796. https://doi.org/10.1016/j.jpeds.2009.01.010.
6. Luu TM, Chevalier I, Gauthier M et al. Acute adenitis in children: clinical course and factors predictive of surgical drainage. J Paediatr Child Health. 2005;41(5-6):273-277. https://doi.org/10.1111/j.1440-1754.2005.00610.x.
7. Golriz F, Bisset GS, 3rd, D’Amico B, et al. A clinical decision rule for the use of ultrasound in children presenting with acute inflammatory neck masses. Pediatr Rad. 2017;47(4):422-428. https://doi.org/10.1007/s00247-016-3774-9.
8. Courtney MJ, Miteff A, Mahadevan M. Management of pediatric lateral neck infections: does the adage “… never let the sun go down on undrained pus …” hold true? Int J Pediatr Otorhinolaryngol. 2007;71(1):95-100. https://doi.org/10.1016/j.ijporl.2006.09.009.
9. Feudtner C, Feinstein JA, Zhong W, Hall M, Dai D. Pediatric complex chronic conditions classification system version 2: updated for ICD-10 and complex medical technology dependence and transplantation. BMC Pediatr. 2014;14:199. https://doi.org/10.1186/1471-2431-14-199.
10. Papanicolas I, Woskie LR, Jha AK. Health care spending in the United States and other high-income countries. JAMA. 2018;319(10):1024-1039. https://doi.org/10.1001/jama.2018.1150.
11. Oren O, Kebebew E, Ioannidis JPA. Curbing unnecessary and wasted diagnostic imaging. JAMA. 2019;321(3):245-246. https://doi.org/10.1001/jama.2018.20295.
12. Palmer RH, Miller MR. Methodologic challenges in developing and implementing measures of quality for child health care. Ambul Pediatr Off J Ambul Pediatr Assoc. 2001;1(1):39-52. https://doi.org/10.1367/1539-4409(2001)001<0039:MCIDAI>2.0.CO;2.
13. Daya H, Lo S, Papsin BC, et al. Retropharyngeal and parapharyngeal infections in children: the Toronto experience. Int J Pediatr Otorhinolaryngol. 2005;69(1):81-86. https://doi.org/10.1016/j.ijporl.2004.08.010.
14. Wong SJ, Levi J. Management of pediatric orbital cellulitis: A systematic review. Int J Pediatr Otorhinolaryngol. 2018;110:123-129. https://doi.org/10.1016/j.ijporl.2018.05.006.
15. Wong DK, Brown C, Mills N, Spielmann P, Neeff M. To drain or not to drain-management of pediatric deep neck abscesses: a case-control study. Int J Pediatr Otorhinolaryngol. 2012;76(12):1810-1813. https://doi.org/10.1016/j.ijporl.2012.09.006.
© 2019 Society of Hospital Medicine
The Association between Limited English Proficiency and Sepsis Mortality
Sepsis is defined as a life-threatening organ dysfunction that occurs in response to systemic infection.1,2 It is frequently fatal, common in hospital medicine, and a leading contributor to critical illness, morbidity, and healthcare expenditures.2-5 While sepsis care and outcomes have improved in the past decade,6,7 inpatient mortality remains high.8
A number of studies have sought to determine whether race plays a role in sepsis mortality. While Black patients with sepsis have frequently been identified as having the highest rates of death,9-14 similar observations have been made for most non-White races/ethnicities.13-15 Studies have also demonstrated higher rates of hospital-acquired infections among Asian and Latino patients.16
There are several possible explanations for why racial minorities experience disparate outcomes in sepsis, including access to care, comorbidities, implicit biases, and biological or environmental factors,17-20 as well as characteristics of hospitals most likely to care for racial minorities.13,15,21 One explanation that has not been explored is that racial disparities in sepsis are mediated by language. Limited English proficiency (LEP) has previously been associated with increased rates of adverse hospital events,22 longer length of stay,23 and greater likelihood of readmission.24 LEP has also been shown to represent a significant barrier to accessing healthcare and preventive screening.25 The role of LEP in sepsis mortality, however, has yet to be examined.
The diverse patient population at the University of California, San Francisco (UCSF) provides a unique opportunity to build upon existing literature by further exploring racial differences in sepsis, specifically by investigating the role of LEP. The objective of this study was to determine the association between LEP and inpatient mortality among adults hospitalized with sepsis.
METHODS
Setting
The study was conducted at the University of California, San Francisco, California (UCSF), an 800-bed tertiary care, academic medical center. It was approved by the UCSF Institutional Review Board with waiver of informed consent. UCSF cares for a population of patients who are racially and linguistically diverse, with high proportions of patients of East Asian descent and with LEP. According to recent United States census estimates, more than half of San Francisco County residents identify as non-White (35% Asians, 15% Hispanic/Latino, 6% Black), and 44% report speaking a language other than English at home.26
Study Population and Data Collection
The UCSF Medical Center uses the electronic health record (EHR) Epic (Epic 2017, Epic Systems Corporation, Verona, Wisconsin). We obtained computerized EHR data from Clarity, the relational database that stores Epic’s inpatient data in thousands of tables. We identified all patients ≥18 years of age presenting to the emergency department (ED) between June 1, 2012 and December 31, 2016 with suspected serious infection, defined as having blood cultures ordered within 72 hours of ED presentation (N = 25,441). Patients who did not receive at least two doses of intravenous (IV) antibiotics within 48 hours were excluded, as they were unlikely to have serious infections.
We defined sepsis based on Sepsis-3 consensus guidelines2 as a change in sequential [sepsis-related] organ failure assessment (SOFA) score ≥2 within the first 48 hours of ED presentation. The SOFA score is comprised of six variables representing different organ systems, each rated 0-4 based on the degree of dysfunction.2 Patient vital signs, laboratory data, vasopressor medication doses, and ventilator settings were used to determine the exact timestamp at which each patient attained a change in SOFA score ≥2. Missing values were considered to be normal. To adjust for baseline organ dysfunction, SOFA elements associated with elevated bilirubin and/or creatinine were excluded for patients with chronic liver/kidney disease based on Elixhauser comorbidities.27 We chose to focus on the first 48 hours in an attempt to capture patients with the most severe illnesses and the highest probability of true sepsis.
All primary and secondary International Classification of Diseases (ICD)-9/10 diagnosis codes were extracted from Clarity coding tables at the time of hospital discharge. Diagnosis codes signifying bacterial infection were grouped into the following categories based on type/location: pneumonia; bacteremia; urinary tract infection; and skin and soft tissue infection. All remaining diagnostic codes indicating bacterial infections at other sites were categorized as “Other”. If no codes indicating infection were present, patients were categorized as “None coded”. Patients with discharge diagnosis codes of “sepsis” were also identified. Dates and times of antibiotic administrations were obtained from the medications table. Time to first antibiotic was defined as the time in minutes from ED presentation to initiation of the first IV antibacterial medication. This variable was transformed using a natural log transformation based on best fit for normal distribution.
We limited our analyses to 8,974 patients who were diagnosed with sepsis as defined above and had either (1) ≥4 qualifying antibiotic days (QADs) or (2) an ICD-9/10 discharge diagnosis code of “sepsis” (Figure). QADs were defined based on the recent publication by Rhee et al. as having received four or more consecutive days of antibiotics, with the first dose given IV within 48 hours of presentation.28 Patients who died or were discharged to hospice prior to the 4th QAD were also included. These additional parameters were added to increase specificity of the study sample for patients with true sepsis. Patients admitted to all levels of care (acute care, transitional care unit [TCU], intensive care unit [ICU]) and under all hospital services were included. There were no missing data for mortality, race, or language. We chose to focus on patients with sepsis in this initial study as this is a common diagnosis in hospital medicine that is enriched for high mortality.
Primary Outcome
The primary outcome of the study was inpatient mortality, which was obtained from the hospital encounters table in Clarity.
Primary Predictors
The primary predictor of interest was LEP. The encounter numbers from the dataset were used to link to self-reported demographic data, including “preferred language” and need for interpreter services. A manual chart review of 60 patients speaking the top six languages was conducted to verify the accuracy of the data on language and interpreter use (KNK). Defining the gold standard for LEP as having any chart note indicating non-English language and/or that an interpreter was used, the “interpreter needed” variable in Epic was found to have a positive predictive value for LEP of 100%. Therefore, patients in the study cohort were defined as having LEP if they met both of the following criteria: (1) a self-reported “preferred language” other than English and (2) having the “interpreter needed” variable indicating “yes”.
Covariate Data Collection
Additional data were obtained from the demographics tables, including age, race, sex, and insurance status. Race and ethnicity were combined into a single five-category variable including White, Asian, Black, Latino, and Other. This approach has been suggested as the best way to operationalize these variables29 and has been utilized by similar studies in the literature.9,14,15 We considered the Asian race to include all people of East Asian, Southeast Asian, or South Asian descent, which is consistent with the United States Census Bureau definition.30 Patients identifying as Native Hawaiians/Pacific Islanders, Native Americans/Alaskan Natives, as well as those with unspecified race or ethnicity, were categorized as Other. Insurance status was categorized as Commercial, Medicare, Medicaid, or Other.
We estimated illness severity in several ways. First, the total qualifying SOFA score was calculated for each patient, which was defined as the total score achieved at the time that SOFA criteria were first met (≥2, within 48 hours). Second, we dichotomized patients based on whether they had received mechanical ventilation at any point during hospitalization. Finally, we used admission location as a surrogate marker for severity at the time of initial hospitalization.
To estimate the burden of baseline comorbidities, we calculated the van Walraven score (VWS),31 a validated modification of the Elixhauser Comorbidity Index.27 This score conveys an estimated risk of in hospital death based on ICD-9/10 diagnosis codes for preexisting conditions, which ranges from <1% for the minimum score of –19 to >99% for the maximum score of 89.
Statistical Analyses
All statistical analyses were performed using Stata software version 15 (StataCorp LLC, College Station, Texas). Baseline demographics and patient characteristics were stratified by LEP. These were compared using two-sample t-tests or chi-squared tests of significance. Wilcoxon rank-sum tests were used for non-normally distributed variables. Inpatient mortality was compared across all races stratified by LEP using chi-squared tests of significance.
We fit a series of multivariable logistic regression models to examine the association between race and inpatient mortality adjusting for LEP and other patient/clinical characteristics. We first examined the unadjusted association between mortality and race; then adjusted for LEP alone; and finally adjusted for all covariates of interest, including LEP, age, sex, insurance status, year, admission level of care, VWS, total qualifying SOFA score, need for mechanical ventilation, site of infection, and time to first IV antibiotic. A subgroup analysis was also performed using the fully adjusted model restricted to patients who were mechanically ventilated. This population was selected because the patients (1) have among the highest severity of illness and (2) share a common barrier to communication, regardless of English proficiency.
Several potential interactions between LEP with other covariates were explored, including age, race, ICU admission level of care, and need for mechanical ventilation. Lastly, a mediation analysis was performed based on Baron & Kenny’s four-step model32 in order to calculate the proportion of the association between race and mortality explained by the proposed mediator (LEP).
To evaluate for the likelihood of residual confounding, we calculated an E-value, which is defined as the minimum strength of association that an unmeasured confounder would need to have with both the predictor and outcome variables, above and beyond the measured covariates, in order to fully explain away an observed predictor-outcome association.33,34
RESULTS
We identified 8,974 patients hospitalized with sepsis based on the above inclusion criteria. This represented a medically complex, racially and linguistically diverse population (Table 1). The cohort was comprised of 24% Asian, 12% Black, and 11% Latino patients. Among those categorized as Other race, Native Americans/Alaskan Natives and Native Hawaiians/Pacific Islanders accounted for 4% (n = 31) and 21% (n = 159), respectively. A fifth of all patients had LEP (n = 1,716), 62% of whom were Asian (n = 1,064). Patients with LEP tended to be older, female, and to have a greater number of comorbid conditions (Table 1). The total qualifying SOFA score was also higher among patients with LEP (median 5; interquartile range [IQR]: 4-8 vs 5; IQR: 3-7; P <.001), though there was no association between LEP and mechanical ventilation (P = .22). The prevalence of LEP differed significantly across races, with 50% LEP among Asians, 32% among Latinos, 5% among White patients (P < .001). Only eight Black patients had LEP. More than 40 unique languages were represented in the cohort, with English, Cantonese, Spanish, Russian, and Mandarin accounting for ~95% (Appendix Table 1). Among Latino patients, 63% spoke English and 36% spoke Spanish.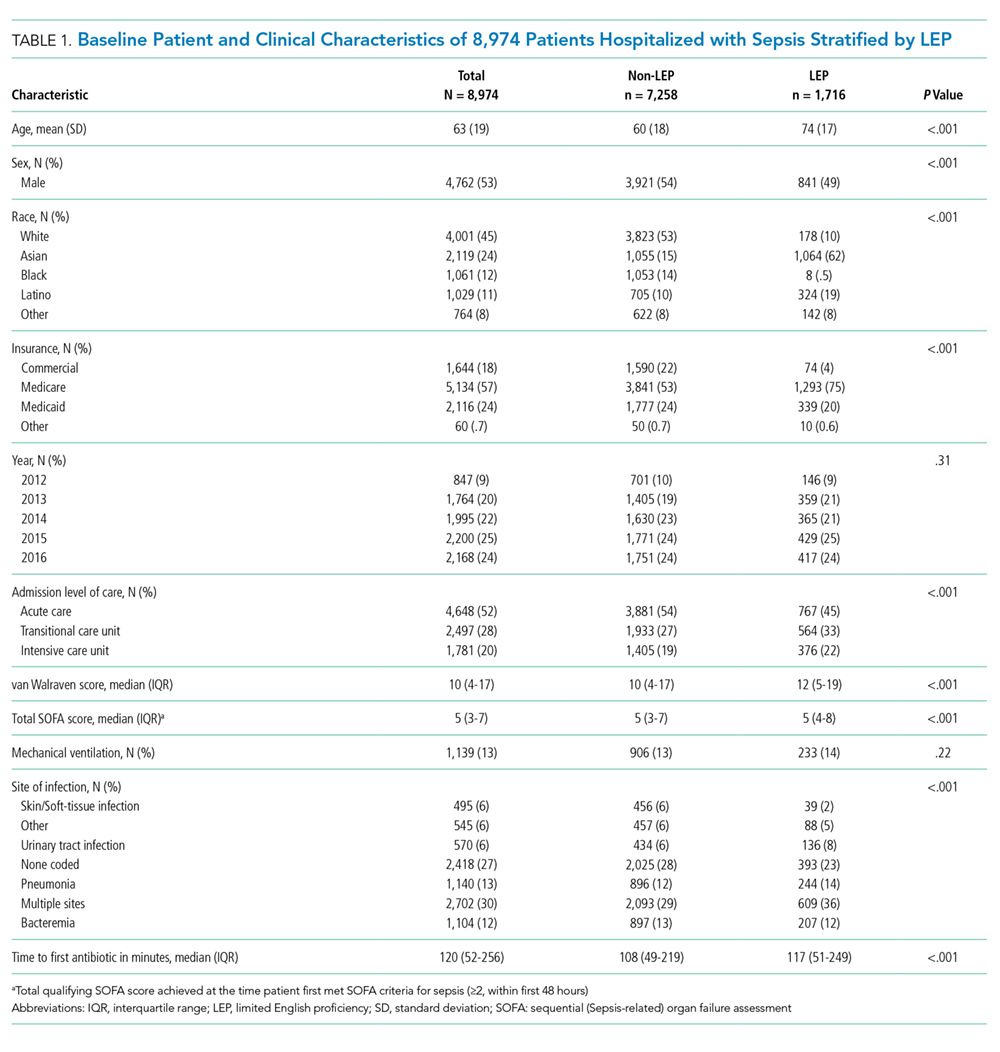
In-hospital mortality was significantly higher among patients who had LEP (n = 268/1,716, 16%) compared to non-LEP patients (n = 678/7,258, 9%), with 80% greater unadjusted odds of mortality (OR 1.80; 95% CI: 1.54-2.09; P < .001). Notably we also found that Asian race was associated with a 1.57 unadjusted odds of mortality compared to White race (95% CI: 1.34-1.85; P < .001). Age, VWS, total qualifying SOFA score, mechanical ventilation, and admission level of care all exhibited a positive dose-response association with mortality (Appendix Table 2). In unadjusted analyses, there was no evidence of interaction between LEP and age (P = .38), LEP and race (P = .45), LEP and ICU admission level of care (P = .31), or LEP and mechanical ventilation (P = .19). Asian patients had the highest overall mortality (14% total, 17% with LEP). LEP was associated with increased unadjusted mortality among White, Asian, and Other races compared to their non-LEP counterparts (Appendix Figure 1). There was no significant difference in mortality between Latino patients with and without LEP. The sample size for Black patients with LEP (n = 8) was too small to draw conclusions about mortality.
Following multivariable logistic regression modeling for the association between race and mortality, we found that the increased odds of death among Asian patients was partially attenuated after adjusting for LEP (odds ratio [OR] 1.23, 95% CI: 1.02-1.48; P = .03; Table 2). Meanwhile, LEP was associated with a 1.66 odds of mortality (95% CI: 1.38-1.99; P < .001) after adjustment for race. In the full multivariable model adjusting for demographics and clinical characteristics, illness severity, and comorbidities, LEP was associated with a 31% increase in the odds of mortality compared to non-LEP (95% CI: 1.06-1.63; P = .02). In this model, the association between Asian race and mortality was now fully attenuated, with a point estimate near 1.0 (OR 0.98; 95% CI: 0.79-1.22; P = .87). Markers of illness severity, including total qualifying SOFA score (OR 1.23; 95% CI: 1.20-1.27; P < .001) and need for mechanical ventilation (OR 1.88; 95% CI: 1.52-2.33; P < .001), were both associated with greater odds of death. Based on a four-step mediation analysis, LEP was found to be a partial mediator to the association between Asian race and mortality (76% proportion explained). The E-value for the association between LEP and mortality was 1.95, with an E-value for the corresponding confidence interval of 1.29.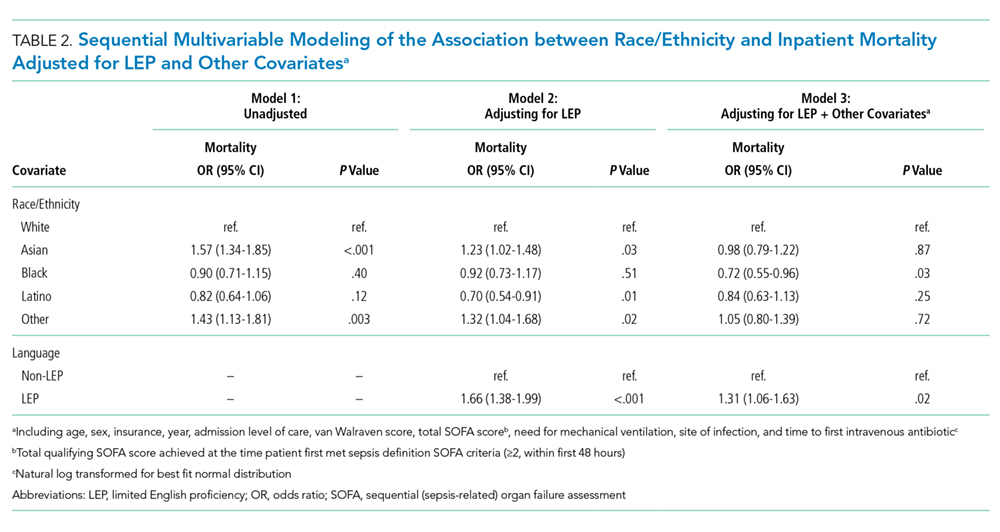
In a subgroup analysis using the fully adjusted model restricted to patients who were mechanically ventilated during hospitalization, the association between LEP and mortality was no longer present (OR 1.15; 95% CI: 0.76-1.72; P = .51).
DISCUSSION
At a single US academic medical center serving a diverse population, we found that LEP was associated with sepsis mortality across all races except Black and Latino, conveying a 31% increase in the odds of death after adjusting for illness severity, comorbidities, and baseline characteristics. The higher mortality among Asian patients was largely mediated by LEP (76% proportion explained). While previous studies have variably found Black, Asian, Latino, and other non-White races/ethnicities to be at an increased risk of death from sepsis,9-15 LEP has not been previously evaluated as a mediator of sepsis mortality. We were uniquely suited to uncover such an association due to the racial and linguistic diversity of our patient population. LEP has previously been implicated in poor health outcomes among hospitalized patients in general.22-24 Future studies will be necessary to determine whether similar associations between LEP and mortality are observed among broader patient populations outside of sepsis.
There are a number of possible explanations for how LEP could mediate the association between race and mortality. First, LEP is known to be associated with greater difficulties in accessing medical care,25 which could result in poorer baseline control of chronic comorbid conditions, fewer opportunities for preventive screening, and greater reluctance to seek medical attention when ill, theoretically leading to more severe presentations and worse outcomes. Indeed, LEP patients in our cohort had both a shorter median time to receiving their first antibiotic, as well as a higher total qualifying SOFA score, both of which may suggest more severe initial presentations. LEP is also known to contribute to, or exacerbate, the impact of low health literacy, which is itself associated with poor health.35 Second, implicit biases may also have been present, as they are known to be common among healthcare providers and have been shown to negatively impact patient care.36
Finally,it is possible that the association is related to the language barrier itself, which impacts providers’ ability to take an appropriate clinical history, and can lead to clinical errors or delays in care.37 The fact that the association between LEP and mortality was eliminated when the analysis was restricted to mechanically ventilated patients seems to support this, since differences in language proficiency become irrelevant in this subgroup. While we are unable to comment on causality based on this observational study, we included a directed acyclic graph (DAG) in the supplemental materials, which shows one proposed model for describing these associations (Appendix Figure 2).
Assuming that the language barrier itself does, at least in part, drive the observed association, LEP represents a potentially modifiable risk factor that could be a target for quality improvement interventions. There is evidence that the use of medical interpreters among patients with LEP leads to greater satisfaction, fewer errors, and improved clinical outcomes;38 however, several recent studies have documented underutilization of professional interpreter services, even when readily available.39,40 At our institution, phone and video interpreter services are available 24/7 for approximately 150 languages. Due to limitations inherent to the EHR, we were unable to ascertain the extent to which these services were used in the present study. Heavy clinical workloads, connectivity issues, and missing or faulty equipment represent theoretical barriers to utilization of these services.
There are some limitations to our study. First, by utilizing a large database of electronic data, the quality of our analyses was reliant on the accuracy of the EHR. Demographic data such as language may have been subject to misclassification due to self-reporting. We attempted to minimize this by also including the need for interpreter services within the definition of LEP, which was validated by manual chart review. Second, generalizability is limited in this single-center study conducted at an institution with unique demographics, wherein nearly two-thirds of the LEP patients were Asian, and the Chinese-speaking population outnumbered those who speak Spanish.
Finally, the most important limitation to our study is the potential for residual confounding. While we attempted to mitigate this by adjusting for as many clinically relevant covariates as possible, there may still be unmeasured confounders to the association between LEP and mortality, such as access to outpatient care, functional status, interpreter use, and other markers of illness severity like the number and type of supportive therapies received. Based on our E-value calculations, with an observed OR of 1.31 for the association between LEP and mortality, an unmeasured confounder with an OR of 1.95 would fully explain away this association, while an OR of 1.29 would shift the confidence interval to include the null. These values suggest at least some risk of residual confounding. The fact that our fully adjusted model included multiple covariates, including several markers of illness severity, does somewhat lessen the likelihood of a confounder achieving these values, since they represent the minimum strength of an unmeasured confounder above and beyond the measured covariates. Regardless, the finding that patients with LEP are more likely to die from sepsis remains an important one, recognizing the need for further studies including multicenter investigations.
In this study, we showed that LEP was associated with sepsis mortality across nearly all races in our cohort. While Asian race was associated with a higher unadjusted odds of death compared to White race, this was attenuated after adjusting for LEP. This may suggest that some of the racial disparities in sepsis identified in prior studies were in fact mediated by language proficiency. Further studies will be required to explore the causal nature of this novel association. If modifiable factors are identified, this could represent a potential target for future quality improvement initiatives aimed at improving sepsis outcomes.
Disclaimer
The contents are solely the responsibility of the authors and do not necessarily represent the official views of the University of California, San Francisco or the National Institutes of Health.
1. De Backer DD, Dorman T. Surviving sepsis guidelines: A continuous move toward better care of patients with sepsis. JAMA. 2017;317(8):807-808. https://doi.org/10.1001/jama.2017.0059.
2. Singer M, Deutschman CS, Seymour CW, et al. The third international consensus definitions for sepsis and septic shock (Sepsis-3). JAMA. 2016;315(8):801-810. https://doi.org/10.1001/jama.2016.0287.
3. Angus DC, Linde-Zwirble WT, Lidicker J, et al. Epidemiology of severe sepsis in the United States: analysis of incidence, outcome, and associated costs of care. Crit Care Med. 2001;29(7):1303-1310. https://doi.org/10.1097/00003246-200107000-00002.
4. Mayr FB, Yende S, Angus DC. Epidemiology of severe sepsis. Virulence. 2014;5(1):4-11. https://doi.org/10.4161/viru.27372.
5. Dellinger RP, Levy MM, Rhodes A, et al. Surviving Sepsis Campaign: international guidelines for management of severe sepsis and septic shock: 2012. Crit Care Med. 2013;41(2):580-637. https://doi.org/10.1097/CCM.0b013e31827e83af.
6. Levy MM, Rhodes A, Phillips GS, et al. Surviving Sepsis Campaign: association between performance metrics and outcomes in a 7.5-year study. Crit Care Med. 2015;43(1):3-12. https://doi.org/10.1097/CCM.0000000000000723.
7. Damiani E, Donati A, Serafini G, et al. Effect of performance improvement programs on compliance with sepsis bundles and mortality: a systematic review and meta-analysis of observational studies. PLOS ONE. 2015;10(5):e0125827. https://doi.org/10.1371/journal.pone.0125827.
8. Paoli CJ, Reynolds MA, Sinha M, Gitlin M, Crouser E. Epidemiology and costs of sepsis in the United States-an analysis based on timing of diagnosis and severity level. Crit Care Med. 2018;46(12):1889-1897. https://doi.org/10.1097/CCM.0000000000003342.
9. Barnato AE, Alexander SL, Linde-Zwirble WT, Angus DC. Racial variation in the incidence, care, and outcomes of severe sepsis: analysis of population, patient, and hospital characteristics. Am J Respir Crit Care Med [patient]. 2008;177(3):279-284. https://doi.org/10.1164/rccm.200703-480OC.
10. Mayr FB, Yende S, Linde-Zwirble WT, et al. Infection rate and acute organ dysfunction risk as explanations for racial differences in severe sepsis. JAMA. 2010;303(24):2495-2503. https://doi.org/10.1001/jama.2010.851.
11. Dombrovskiy VY, Martin AA, Sunderram J, Paz HL. Occurrence and outcomes of sepsis: influence of race. Crit Care Med. 2007;35(3):763-768. https://doi.org/10.1097/01.CCM.0000256726.80998.BF.
12. Yamane D, Huancahuari N, Hou P, Schuur J. Disparities in acute sepsis care: a systematic review. Crit Care. 2015;19(Suppl 1):22. https://doi.org/10.1186/cc14102.
13. Martin GS, Mannino DM, Eaton S, Moss M. The epidemiology of sepsis in the United States from 1979 through 2000. N Engl J Med. 2003;348(16):1546-1554. https://doi.org/10.1056/NEJMoa022139.
14. Melamed A, Sorvillo FJ. The burden of sepsis-associated mortality in the United States from 1999 to 2005: an analysis of multiple-cause-of-death data. Crit Care. 2009;13(1):R28. https://doi.org/10.1186/cc7733.
15. Jones JM, Fingar KR, Miller MA, et al. Racial disparities in sepsis-related in-hospital mortality: using a broad case capture method and multivariate controls for clinical and hospital variables, 2004-2013. Crit Care Med. 2017;45(12):e1209-e1217. https://doi.org/10.1097/CCM.0000000000002699.
16. Bakullari A, Metersky ML, Wang Y, et al. Racial and ethnic disparities in healthcare-associated infections in the United States, 2009–2011. Infect Control Hosp Epidemiol. 2014;35(S3):S10-S16. https://doi.org/10.1086/677827.
17. Institute of Medicine. Unequal Treatment: What Healthcare Providers Need to Know about Racial and Ethnic Disparities in Healthcare. Washington, DC: National Academy Press; 2002.
18. Vogel TR. Update and review of racial disparities in sepsis. Surg Infect. 2012;13(4):203-208. https://doi.org/10.1089/sur.2012.124.
19. Esper AM, Moss M, Lewis CA, et al. The role of infection and comorbidity: factors that influence disparities in sepsis. Crit Care Med. 2006;34(10):2576-2582. https://doi.org/10.1097/01.CCM.0000239114.50519.0E.
20. Soto GJ, Martin GS, Gong MN. Healthcare disparities in critical illness. Crit Care Med. 2013;41(12):2784-2793. https://doi.org/10.1097/CCM.0b013e3182a84a43.
21. Taylor SP, Karvetski CH, Templin MA, Taylor BT. Hospital differences drive antibiotic delays for black patients compared with white patients with suspected septic shock. Crit Care Med. 2018;46(2):e126-e131. https://doi.org/10.1097/CCM.0000000000002829.
22. Divi C, Koss RG, Schmaltz SP, Loeb JM. Language proficiency and adverse events in US hospitals: a pilot study. Int J Qual Health Care. 2007;19(2):60-67. https://doi.org/10.1093/intqhc/mzl069.
23. John-Baptiste A, Naglie G, Tomlinson G, et al. The effect of English language proficiency on length of stay and in-hospital mortality. J Gen Intern Med. 2004;19(3):221-228. https://doi.org/10.1111/j.1525-1497.2004.21205.x.
24. Karliner LS, Kim SE, Meltzer DO, Auerbach AD. Influence of language barriers on outcomes of hospital care for general medicine inpatients. J Hosp Med. 2010;5(5):276-282. https://doi.org/10.1002/jhm.658.
25. Hacker K, Anies M, Folb BL, Zallman L. Barriers to health care for undocumented immigrants: a literature review. Risk Manag Healthc Policy. 2015;8:175-183. https://doi.org/10.2147/RMHP.S70173.
26. QuickFacts: San Francisco County, California. U.S. Census Bureau (2016). https://www.census.gov/quickfacts/fact/table/sanfranciscocountycalifornia/RHI425216. Accessed May 15, 2018.
27. Moore BJ, White S, Washington R, Coenen N, Elixhauser A. Identifying increased risk of readmission and in-hospital mortality using hospital administrative data: The AHRQ Elixhauser comorbidity index. Med Care. 2017;55(7):698-705. https://doi.org/10.1097/MLR.0000000000000735.
28. Rhee C, Dantes R, Epstein L, et al. Incidence and trends of sepsis in us hospitals using clinical vs claims data, 2009-2014. JAMA. 2017;318(13):1241-1249. https://doi.org/10.1001/jama.2017.13836.
29. Howell J, Emerson MO, So M. What “should” we use? Evaluating the impact of five racial measures on markers of social inequality. Sociol Race Ethn. 2017;3(1):14-30. https://doi.org/10.1177/2332649216648465.
30. Reeves T, Claudett B. United States Census Bureau. Asian Pac Islander Popul. March 2002;2003.
31. van Walraven C, Austin PC, Jennings A, Quan H, Forster AJ. A modification of the Elixhauser comorbidity measures into a point system for hospital death using administrative data. Med Care. 2009;47(6):626-633. https://doi.org/10.1097/MLR.0b013e31819432e5.
32. Baron RM, Kenny DA. The moderator-mediator variable distinction in social psychological research: conceptual, strategic, and statistical considerations. J Pers Soc Psychol. 1986;51(6):1173-1182. https://doi.org/10.1037//0022-3514.51.6.1173. 33. VanderWeele TJ, Ding P. Sensitivity analysis in observational research: introducing the E-value. Ann Intern Med. 2017;167(4):268-274. https://doi.org/10.7326/M16-2607.
34. Mathur MB, Ding P, Riddell CA, VanderWeele TJ. Website and R package for computing E-values. Epidemiology. 2018;29(5):e45-e47. https://doi.org/10.1097/EDE.0000000000000864.
35. Sentell T, Braun KL. Low Health Literacy, Limited English proficiency, and health status in Asians, Latinos, and other racial/ethnic groups in California. J Health Commun. 2012;17 Supplement 3:82-99. https://doi.org/10.1080/10810730.2012.712621.
36. FitzGerald C, Hurst S. Implicit bias in healthcare professionals: a systematic review. BMC Med Eth. 2017;18(1):19. https://doi.org/10.1186/s12910-017-0179-8.
37. Flores G. The impact of medical interpreter services on the quality of health care: A systematic review. Med Care Res Rev. 2005;62(3):255-299. https://doi.org/10.1177/1077558705275416.
38. Karliner LS, Jacobs EA, Chen AH, Mutha S. Do professional interpreters improve clinical care for patients with limited English proficiency? A systematic review of the literature. Health Serv Res. 2007;42(2):727-754. https://doi.org/10.1111/j.1475-6773.2006.00629.x.
39. Diamond LC, Schenker Y, Curry L, Bradley EH, Fernandez A. Getting by: underuse of interpreters by resident physicians. J Gen Intern Med. 2009;24(2):256-262. https://doi.org/10.1007/s11606-008-0875-7.
40. López L, Rodriguez F, Huerta D, Soukup J, Hicks L. Use of interpreters by physicians for hospitalized limited English proficient patients and its impact on patient outcomes. J Gen Intern Med. 2015;30(6):783-789. https://doi.org/10.1007/s11606-015-3213-x.
Sepsis is defined as a life-threatening organ dysfunction that occurs in response to systemic infection.1,2 It is frequently fatal, common in hospital medicine, and a leading contributor to critical illness, morbidity, and healthcare expenditures.2-5 While sepsis care and outcomes have improved in the past decade,6,7 inpatient mortality remains high.8
A number of studies have sought to determine whether race plays a role in sepsis mortality. While Black patients with sepsis have frequently been identified as having the highest rates of death,9-14 similar observations have been made for most non-White races/ethnicities.13-15 Studies have also demonstrated higher rates of hospital-acquired infections among Asian and Latino patients.16
There are several possible explanations for why racial minorities experience disparate outcomes in sepsis, including access to care, comorbidities, implicit biases, and biological or environmental factors,17-20 as well as characteristics of hospitals most likely to care for racial minorities.13,15,21 One explanation that has not been explored is that racial disparities in sepsis are mediated by language. Limited English proficiency (LEP) has previously been associated with increased rates of adverse hospital events,22 longer length of stay,23 and greater likelihood of readmission.24 LEP has also been shown to represent a significant barrier to accessing healthcare and preventive screening.25 The role of LEP in sepsis mortality, however, has yet to be examined.
The diverse patient population at the University of California, San Francisco (UCSF) provides a unique opportunity to build upon existing literature by further exploring racial differences in sepsis, specifically by investigating the role of LEP. The objective of this study was to determine the association between LEP and inpatient mortality among adults hospitalized with sepsis.
METHODS
Setting
The study was conducted at the University of California, San Francisco, California (UCSF), an 800-bed tertiary care, academic medical center. It was approved by the UCSF Institutional Review Board with waiver of informed consent. UCSF cares for a population of patients who are racially and linguistically diverse, with high proportions of patients of East Asian descent and with LEP. According to recent United States census estimates, more than half of San Francisco County residents identify as non-White (35% Asians, 15% Hispanic/Latino, 6% Black), and 44% report speaking a language other than English at home.26
Study Population and Data Collection
The UCSF Medical Center uses the electronic health record (EHR) Epic (Epic 2017, Epic Systems Corporation, Verona, Wisconsin). We obtained computerized EHR data from Clarity, the relational database that stores Epic’s inpatient data in thousands of tables. We identified all patients ≥18 years of age presenting to the emergency department (ED) between June 1, 2012 and December 31, 2016 with suspected serious infection, defined as having blood cultures ordered within 72 hours of ED presentation (N = 25,441). Patients who did not receive at least two doses of intravenous (IV) antibiotics within 48 hours were excluded, as they were unlikely to have serious infections.
We defined sepsis based on Sepsis-3 consensus guidelines2 as a change in sequential [sepsis-related] organ failure assessment (SOFA) score ≥2 within the first 48 hours of ED presentation. The SOFA score is comprised of six variables representing different organ systems, each rated 0-4 based on the degree of dysfunction.2 Patient vital signs, laboratory data, vasopressor medication doses, and ventilator settings were used to determine the exact timestamp at which each patient attained a change in SOFA score ≥2. Missing values were considered to be normal. To adjust for baseline organ dysfunction, SOFA elements associated with elevated bilirubin and/or creatinine were excluded for patients with chronic liver/kidney disease based on Elixhauser comorbidities.27 We chose to focus on the first 48 hours in an attempt to capture patients with the most severe illnesses and the highest probability of true sepsis.
All primary and secondary International Classification of Diseases (ICD)-9/10 diagnosis codes were extracted from Clarity coding tables at the time of hospital discharge. Diagnosis codes signifying bacterial infection were grouped into the following categories based on type/location: pneumonia; bacteremia; urinary tract infection; and skin and soft tissue infection. All remaining diagnostic codes indicating bacterial infections at other sites were categorized as “Other”. If no codes indicating infection were present, patients were categorized as “None coded”. Patients with discharge diagnosis codes of “sepsis” were also identified. Dates and times of antibiotic administrations were obtained from the medications table. Time to first antibiotic was defined as the time in minutes from ED presentation to initiation of the first IV antibacterial medication. This variable was transformed using a natural log transformation based on best fit for normal distribution.
We limited our analyses to 8,974 patients who were diagnosed with sepsis as defined above and had either (1) ≥4 qualifying antibiotic days (QADs) or (2) an ICD-9/10 discharge diagnosis code of “sepsis” (Figure). QADs were defined based on the recent publication by Rhee et al. as having received four or more consecutive days of antibiotics, with the first dose given IV within 48 hours of presentation.28 Patients who died or were discharged to hospice prior to the 4th QAD were also included. These additional parameters were added to increase specificity of the study sample for patients with true sepsis. Patients admitted to all levels of care (acute care, transitional care unit [TCU], intensive care unit [ICU]) and under all hospital services were included. There were no missing data for mortality, race, or language. We chose to focus on patients with sepsis in this initial study as this is a common diagnosis in hospital medicine that is enriched for high mortality.
Primary Outcome
The primary outcome of the study was inpatient mortality, which was obtained from the hospital encounters table in Clarity.
Primary Predictors
The primary predictor of interest was LEP. The encounter numbers from the dataset were used to link to self-reported demographic data, including “preferred language” and need for interpreter services. A manual chart review of 60 patients speaking the top six languages was conducted to verify the accuracy of the data on language and interpreter use (KNK). Defining the gold standard for LEP as having any chart note indicating non-English language and/or that an interpreter was used, the “interpreter needed” variable in Epic was found to have a positive predictive value for LEP of 100%. Therefore, patients in the study cohort were defined as having LEP if they met both of the following criteria: (1) a self-reported “preferred language” other than English and (2) having the “interpreter needed” variable indicating “yes”.
Covariate Data Collection
Additional data were obtained from the demographics tables, including age, race, sex, and insurance status. Race and ethnicity were combined into a single five-category variable including White, Asian, Black, Latino, and Other. This approach has been suggested as the best way to operationalize these variables29 and has been utilized by similar studies in the literature.9,14,15 We considered the Asian race to include all people of East Asian, Southeast Asian, or South Asian descent, which is consistent with the United States Census Bureau definition.30 Patients identifying as Native Hawaiians/Pacific Islanders, Native Americans/Alaskan Natives, as well as those with unspecified race or ethnicity, were categorized as Other. Insurance status was categorized as Commercial, Medicare, Medicaid, or Other.
We estimated illness severity in several ways. First, the total qualifying SOFA score was calculated for each patient, which was defined as the total score achieved at the time that SOFA criteria were first met (≥2, within 48 hours). Second, we dichotomized patients based on whether they had received mechanical ventilation at any point during hospitalization. Finally, we used admission location as a surrogate marker for severity at the time of initial hospitalization.
To estimate the burden of baseline comorbidities, we calculated the van Walraven score (VWS),31 a validated modification of the Elixhauser Comorbidity Index.27 This score conveys an estimated risk of in hospital death based on ICD-9/10 diagnosis codes for preexisting conditions, which ranges from <1% for the minimum score of –19 to >99% for the maximum score of 89.
Statistical Analyses
All statistical analyses were performed using Stata software version 15 (StataCorp LLC, College Station, Texas). Baseline demographics and patient characteristics were stratified by LEP. These were compared using two-sample t-tests or chi-squared tests of significance. Wilcoxon rank-sum tests were used for non-normally distributed variables. Inpatient mortality was compared across all races stratified by LEP using chi-squared tests of significance.
We fit a series of multivariable logistic regression models to examine the association between race and inpatient mortality adjusting for LEP and other patient/clinical characteristics. We first examined the unadjusted association between mortality and race; then adjusted for LEP alone; and finally adjusted for all covariates of interest, including LEP, age, sex, insurance status, year, admission level of care, VWS, total qualifying SOFA score, need for mechanical ventilation, site of infection, and time to first IV antibiotic. A subgroup analysis was also performed using the fully adjusted model restricted to patients who were mechanically ventilated. This population was selected because the patients (1) have among the highest severity of illness and (2) share a common barrier to communication, regardless of English proficiency.
Several potential interactions between LEP with other covariates were explored, including age, race, ICU admission level of care, and need for mechanical ventilation. Lastly, a mediation analysis was performed based on Baron & Kenny’s four-step model32 in order to calculate the proportion of the association between race and mortality explained by the proposed mediator (LEP).
To evaluate for the likelihood of residual confounding, we calculated an E-value, which is defined as the minimum strength of association that an unmeasured confounder would need to have with both the predictor and outcome variables, above and beyond the measured covariates, in order to fully explain away an observed predictor-outcome association.33,34
RESULTS
We identified 8,974 patients hospitalized with sepsis based on the above inclusion criteria. This represented a medically complex, racially and linguistically diverse population (Table 1). The cohort was comprised of 24% Asian, 12% Black, and 11% Latino patients. Among those categorized as Other race, Native Americans/Alaskan Natives and Native Hawaiians/Pacific Islanders accounted for 4% (n = 31) and 21% (n = 159), respectively. A fifth of all patients had LEP (n = 1,716), 62% of whom were Asian (n = 1,064). Patients with LEP tended to be older, female, and to have a greater number of comorbid conditions (Table 1). The total qualifying SOFA score was also higher among patients with LEP (median 5; interquartile range [IQR]: 4-8 vs 5; IQR: 3-7; P <.001), though there was no association between LEP and mechanical ventilation (P = .22). The prevalence of LEP differed significantly across races, with 50% LEP among Asians, 32% among Latinos, 5% among White patients (P < .001). Only eight Black patients had LEP. More than 40 unique languages were represented in the cohort, with English, Cantonese, Spanish, Russian, and Mandarin accounting for ~95% (Appendix Table 1). Among Latino patients, 63% spoke English and 36% spoke Spanish.
In-hospital mortality was significantly higher among patients who had LEP (n = 268/1,716, 16%) compared to non-LEP patients (n = 678/7,258, 9%), with 80% greater unadjusted odds of mortality (OR 1.80; 95% CI: 1.54-2.09; P < .001). Notably we also found that Asian race was associated with a 1.57 unadjusted odds of mortality compared to White race (95% CI: 1.34-1.85; P < .001). Age, VWS, total qualifying SOFA score, mechanical ventilation, and admission level of care all exhibited a positive dose-response association with mortality (Appendix Table 2). In unadjusted analyses, there was no evidence of interaction between LEP and age (P = .38), LEP and race (P = .45), LEP and ICU admission level of care (P = .31), or LEP and mechanical ventilation (P = .19). Asian patients had the highest overall mortality (14% total, 17% with LEP). LEP was associated with increased unadjusted mortality among White, Asian, and Other races compared to their non-LEP counterparts (Appendix Figure 1). There was no significant difference in mortality between Latino patients with and without LEP. The sample size for Black patients with LEP (n = 8) was too small to draw conclusions about mortality.
Following multivariable logistic regression modeling for the association between race and mortality, we found that the increased odds of death among Asian patients was partially attenuated after adjusting for LEP (odds ratio [OR] 1.23, 95% CI: 1.02-1.48; P = .03; Table 2). Meanwhile, LEP was associated with a 1.66 odds of mortality (95% CI: 1.38-1.99; P < .001) after adjustment for race. In the full multivariable model adjusting for demographics and clinical characteristics, illness severity, and comorbidities, LEP was associated with a 31% increase in the odds of mortality compared to non-LEP (95% CI: 1.06-1.63; P = .02). In this model, the association between Asian race and mortality was now fully attenuated, with a point estimate near 1.0 (OR 0.98; 95% CI: 0.79-1.22; P = .87). Markers of illness severity, including total qualifying SOFA score (OR 1.23; 95% CI: 1.20-1.27; P < .001) and need for mechanical ventilation (OR 1.88; 95% CI: 1.52-2.33; P < .001), were both associated with greater odds of death. Based on a four-step mediation analysis, LEP was found to be a partial mediator to the association between Asian race and mortality (76% proportion explained). The E-value for the association between LEP and mortality was 1.95, with an E-value for the corresponding confidence interval of 1.29.
In a subgroup analysis using the fully adjusted model restricted to patients who were mechanically ventilated during hospitalization, the association between LEP and mortality was no longer present (OR 1.15; 95% CI: 0.76-1.72; P = .51).
DISCUSSION
At a single US academic medical center serving a diverse population, we found that LEP was associated with sepsis mortality across all races except Black and Latino, conveying a 31% increase in the odds of death after adjusting for illness severity, comorbidities, and baseline characteristics. The higher mortality among Asian patients was largely mediated by LEP (76% proportion explained). While previous studies have variably found Black, Asian, Latino, and other non-White races/ethnicities to be at an increased risk of death from sepsis,9-15 LEP has not been previously evaluated as a mediator of sepsis mortality. We were uniquely suited to uncover such an association due to the racial and linguistic diversity of our patient population. LEP has previously been implicated in poor health outcomes among hospitalized patients in general.22-24 Future studies will be necessary to determine whether similar associations between LEP and mortality are observed among broader patient populations outside of sepsis.
There are a number of possible explanations for how LEP could mediate the association between race and mortality. First, LEP is known to be associated with greater difficulties in accessing medical care,25 which could result in poorer baseline control of chronic comorbid conditions, fewer opportunities for preventive screening, and greater reluctance to seek medical attention when ill, theoretically leading to more severe presentations and worse outcomes. Indeed, LEP patients in our cohort had both a shorter median time to receiving their first antibiotic, as well as a higher total qualifying SOFA score, both of which may suggest more severe initial presentations. LEP is also known to contribute to, or exacerbate, the impact of low health literacy, which is itself associated with poor health.35 Second, implicit biases may also have been present, as they are known to be common among healthcare providers and have been shown to negatively impact patient care.36
Finally,it is possible that the association is related to the language barrier itself, which impacts providers’ ability to take an appropriate clinical history, and can lead to clinical errors or delays in care.37 The fact that the association between LEP and mortality was eliminated when the analysis was restricted to mechanically ventilated patients seems to support this, since differences in language proficiency become irrelevant in this subgroup. While we are unable to comment on causality based on this observational study, we included a directed acyclic graph (DAG) in the supplemental materials, which shows one proposed model for describing these associations (Appendix Figure 2).
Assuming that the language barrier itself does, at least in part, drive the observed association, LEP represents a potentially modifiable risk factor that could be a target for quality improvement interventions. There is evidence that the use of medical interpreters among patients with LEP leads to greater satisfaction, fewer errors, and improved clinical outcomes;38 however, several recent studies have documented underutilization of professional interpreter services, even when readily available.39,40 At our institution, phone and video interpreter services are available 24/7 for approximately 150 languages. Due to limitations inherent to the EHR, we were unable to ascertain the extent to which these services were used in the present study. Heavy clinical workloads, connectivity issues, and missing or faulty equipment represent theoretical barriers to utilization of these services.
There are some limitations to our study. First, by utilizing a large database of electronic data, the quality of our analyses was reliant on the accuracy of the EHR. Demographic data such as language may have been subject to misclassification due to self-reporting. We attempted to minimize this by also including the need for interpreter services within the definition of LEP, which was validated by manual chart review. Second, generalizability is limited in this single-center study conducted at an institution with unique demographics, wherein nearly two-thirds of the LEP patients were Asian, and the Chinese-speaking population outnumbered those who speak Spanish.
Finally, the most important limitation to our study is the potential for residual confounding. While we attempted to mitigate this by adjusting for as many clinically relevant covariates as possible, there may still be unmeasured confounders to the association between LEP and mortality, such as access to outpatient care, functional status, interpreter use, and other markers of illness severity like the number and type of supportive therapies received. Based on our E-value calculations, with an observed OR of 1.31 for the association between LEP and mortality, an unmeasured confounder with an OR of 1.95 would fully explain away this association, while an OR of 1.29 would shift the confidence interval to include the null. These values suggest at least some risk of residual confounding. The fact that our fully adjusted model included multiple covariates, including several markers of illness severity, does somewhat lessen the likelihood of a confounder achieving these values, since they represent the minimum strength of an unmeasured confounder above and beyond the measured covariates. Regardless, the finding that patients with LEP are more likely to die from sepsis remains an important one, recognizing the need for further studies including multicenter investigations.
In this study, we showed that LEP was associated with sepsis mortality across nearly all races in our cohort. While Asian race was associated with a higher unadjusted odds of death compared to White race, this was attenuated after adjusting for LEP. This may suggest that some of the racial disparities in sepsis identified in prior studies were in fact mediated by language proficiency. Further studies will be required to explore the causal nature of this novel association. If modifiable factors are identified, this could represent a potential target for future quality improvement initiatives aimed at improving sepsis outcomes.
Disclaimer
The contents are solely the responsibility of the authors and do not necessarily represent the official views of the University of California, San Francisco or the National Institutes of Health.
1. De Backer DD, Dorman T. Surviving sepsis guidelines: A continuous move toward better care of patients with sepsis. JAMA. 2017;317(8):807-808. https://doi.org/10.1001/jama.2017.0059.
2. Singer M, Deutschman CS, Seymour CW, et al. The third international consensus definitions for sepsis and septic shock (Sepsis-3). JAMA. 2016;315(8):801-810. https://doi.org/10.1001/jama.2016.0287.
3. Angus DC, Linde-Zwirble WT, Lidicker J, et al. Epidemiology of severe sepsis in the United States: analysis of incidence, outcome, and associated costs of care. Crit Care Med. 2001;29(7):1303-1310. https://doi.org/10.1097/00003246-200107000-00002.
4. Mayr FB, Yende S, Angus DC. Epidemiology of severe sepsis. Virulence. 2014;5(1):4-11. https://doi.org/10.4161/viru.27372.
5. Dellinger RP, Levy MM, Rhodes A, et al. Surviving Sepsis Campaign: international guidelines for management of severe sepsis and septic shock: 2012. Crit Care Med. 2013;41(2):580-637. https://doi.org/10.1097/CCM.0b013e31827e83af.
6. Levy MM, Rhodes A, Phillips GS, et al. Surviving Sepsis Campaign: association between performance metrics and outcomes in a 7.5-year study. Crit Care Med. 2015;43(1):3-12. https://doi.org/10.1097/CCM.0000000000000723.
7. Damiani E, Donati A, Serafini G, et al. Effect of performance improvement programs on compliance with sepsis bundles and mortality: a systematic review and meta-analysis of observational studies. PLOS ONE. 2015;10(5):e0125827. https://doi.org/10.1371/journal.pone.0125827.
8. Paoli CJ, Reynolds MA, Sinha M, Gitlin M, Crouser E. Epidemiology and costs of sepsis in the United States-an analysis based on timing of diagnosis and severity level. Crit Care Med. 2018;46(12):1889-1897. https://doi.org/10.1097/CCM.0000000000003342.
9. Barnato AE, Alexander SL, Linde-Zwirble WT, Angus DC. Racial variation in the incidence, care, and outcomes of severe sepsis: analysis of population, patient, and hospital characteristics. Am J Respir Crit Care Med [patient]. 2008;177(3):279-284. https://doi.org/10.1164/rccm.200703-480OC.
10. Mayr FB, Yende S, Linde-Zwirble WT, et al. Infection rate and acute organ dysfunction risk as explanations for racial differences in severe sepsis. JAMA. 2010;303(24):2495-2503. https://doi.org/10.1001/jama.2010.851.
11. Dombrovskiy VY, Martin AA, Sunderram J, Paz HL. Occurrence and outcomes of sepsis: influence of race. Crit Care Med. 2007;35(3):763-768. https://doi.org/10.1097/01.CCM.0000256726.80998.BF.
12. Yamane D, Huancahuari N, Hou P, Schuur J. Disparities in acute sepsis care: a systematic review. Crit Care. 2015;19(Suppl 1):22. https://doi.org/10.1186/cc14102.
13. Martin GS, Mannino DM, Eaton S, Moss M. The epidemiology of sepsis in the United States from 1979 through 2000. N Engl J Med. 2003;348(16):1546-1554. https://doi.org/10.1056/NEJMoa022139.
14. Melamed A, Sorvillo FJ. The burden of sepsis-associated mortality in the United States from 1999 to 2005: an analysis of multiple-cause-of-death data. Crit Care. 2009;13(1):R28. https://doi.org/10.1186/cc7733.
15. Jones JM, Fingar KR, Miller MA, et al. Racial disparities in sepsis-related in-hospital mortality: using a broad case capture method and multivariate controls for clinical and hospital variables, 2004-2013. Crit Care Med. 2017;45(12):e1209-e1217. https://doi.org/10.1097/CCM.0000000000002699.
16. Bakullari A, Metersky ML, Wang Y, et al. Racial and ethnic disparities in healthcare-associated infections in the United States, 2009–2011. Infect Control Hosp Epidemiol. 2014;35(S3):S10-S16. https://doi.org/10.1086/677827.
17. Institute of Medicine. Unequal Treatment: What Healthcare Providers Need to Know about Racial and Ethnic Disparities in Healthcare. Washington, DC: National Academy Press; 2002.
18. Vogel TR. Update and review of racial disparities in sepsis. Surg Infect. 2012;13(4):203-208. https://doi.org/10.1089/sur.2012.124.
19. Esper AM, Moss M, Lewis CA, et al. The role of infection and comorbidity: factors that influence disparities in sepsis. Crit Care Med. 2006;34(10):2576-2582. https://doi.org/10.1097/01.CCM.0000239114.50519.0E.
20. Soto GJ, Martin GS, Gong MN. Healthcare disparities in critical illness. Crit Care Med. 2013;41(12):2784-2793. https://doi.org/10.1097/CCM.0b013e3182a84a43.
21. Taylor SP, Karvetski CH, Templin MA, Taylor BT. Hospital differences drive antibiotic delays for black patients compared with white patients with suspected septic shock. Crit Care Med. 2018;46(2):e126-e131. https://doi.org/10.1097/CCM.0000000000002829.
22. Divi C, Koss RG, Schmaltz SP, Loeb JM. Language proficiency and adverse events in US hospitals: a pilot study. Int J Qual Health Care. 2007;19(2):60-67. https://doi.org/10.1093/intqhc/mzl069.
23. John-Baptiste A, Naglie G, Tomlinson G, et al. The effect of English language proficiency on length of stay and in-hospital mortality. J Gen Intern Med. 2004;19(3):221-228. https://doi.org/10.1111/j.1525-1497.2004.21205.x.
24. Karliner LS, Kim SE, Meltzer DO, Auerbach AD. Influence of language barriers on outcomes of hospital care for general medicine inpatients. J Hosp Med. 2010;5(5):276-282. https://doi.org/10.1002/jhm.658.
25. Hacker K, Anies M, Folb BL, Zallman L. Barriers to health care for undocumented immigrants: a literature review. Risk Manag Healthc Policy. 2015;8:175-183. https://doi.org/10.2147/RMHP.S70173.
26. QuickFacts: San Francisco County, California. U.S. Census Bureau (2016). https://www.census.gov/quickfacts/fact/table/sanfranciscocountycalifornia/RHI425216. Accessed May 15, 2018.
27. Moore BJ, White S, Washington R, Coenen N, Elixhauser A. Identifying increased risk of readmission and in-hospital mortality using hospital administrative data: The AHRQ Elixhauser comorbidity index. Med Care. 2017;55(7):698-705. https://doi.org/10.1097/MLR.0000000000000735.
28. Rhee C, Dantes R, Epstein L, et al. Incidence and trends of sepsis in us hospitals using clinical vs claims data, 2009-2014. JAMA. 2017;318(13):1241-1249. https://doi.org/10.1001/jama.2017.13836.
29. Howell J, Emerson MO, So M. What “should” we use? Evaluating the impact of five racial measures on markers of social inequality. Sociol Race Ethn. 2017;3(1):14-30. https://doi.org/10.1177/2332649216648465.
30. Reeves T, Claudett B. United States Census Bureau. Asian Pac Islander Popul. March 2002;2003.
31. van Walraven C, Austin PC, Jennings A, Quan H, Forster AJ. A modification of the Elixhauser comorbidity measures into a point system for hospital death using administrative data. Med Care. 2009;47(6):626-633. https://doi.org/10.1097/MLR.0b013e31819432e5.
32. Baron RM, Kenny DA. The moderator-mediator variable distinction in social psychological research: conceptual, strategic, and statistical considerations. J Pers Soc Psychol. 1986;51(6):1173-1182. https://doi.org/10.1037//0022-3514.51.6.1173.33. VanderWeele TJ, Ding P. Sensitivity analysis in observational research: introducing the E-value. Ann Intern Med. 2017;167(4):268-274. https://doi.org/10.7326/M16-2607.
34. Mathur MB, Ding P, Riddell CA, VanderWeele TJ. Website and R package for computing E-values. Epidemiology. 2018;29(5):e45-e47. https://doi.org/10.1097/EDE.0000000000000864.
35. Sentell T, Braun KL. Low Health Literacy, Limited English proficiency, and health status in Asians, Latinos, and other racial/ethnic groups in California. J Health Commun. 2012;17 Supplement 3:82-99. https://doi.org/10.1080/10810730.2012.712621.
36. FitzGerald C, Hurst S. Implicit bias in healthcare professionals: a systematic review. BMC Med Eth. 2017;18(1):19. https://doi.org/10.1186/s12910-017-0179-8.
37. Flores G. The impact of medical interpreter services on the quality of health care: A systematic review. Med Care Res Rev. 2005;62(3):255-299. https://doi.org/10.1177/1077558705275416.
38. Karliner LS, Jacobs EA, Chen AH, Mutha S. Do professional interpreters improve clinical care for patients with limited English proficiency? A systematic review of the literature. Health Serv Res. 2007;42(2):727-754. https://doi.org/10.1111/j.1475-6773.2006.00629.x.
39. Diamond LC, Schenker Y, Curry L, Bradley EH, Fernandez A. Getting by: underuse of interpreters by resident physicians. J Gen Intern Med. 2009;24(2):256-262. https://doi.org/10.1007/s11606-008-0875-7.
40. López L, Rodriguez F, Huerta D, Soukup J, Hicks L. Use of interpreters by physicians for hospitalized limited English proficient patients and its impact on patient outcomes. J Gen Intern Med. 2015;30(6):783-789. https://doi.org/10.1007/s11606-015-3213-x.
© 2019 Society of Hospital Medicine
Impact on Length of Stay of a Hospital Medicine Emergency Department Boarder Service
Emergency department (ED) crowding and boarding of patients awaiting admission to the hospital (ED boarding) are growing problems with important clinical care and public safety implications.1-4 Increased ED boarding times have been associated with lower patient satisfaction, inadequate care of critically ill patients, adverse events, and increased mortality.3,5-7 Furthermore, ED boarding can diminish the ED’s ability to evaluate new patients.5,8,9 ED boarding is more severe in hospitals with high inpatient occupancy with resultant disproportionate burden on large urban institutions.2,4,5,10
Earlier studies suggest, but have not consistently shown, an association between longer ED length of stay (LOS) and longer overall hospital LOS.5 This association implies that the additional time spent in the ED waiting for a bed does not meaningfully contribute to advancing the required inpatient care. Thus, this waiting time is “dead time” that is added to the overall hospital duration.
The complexity and the volume of medical patients boarding in the ED can challenge the resources of an already overtaxed ED staff. Potential solutions to mitigate ED boarding of medicine patients generally focus on reducing barriers to timely movement of patients from the ED to an inpatient unit.1,3,11-13 Ultimately, these barriers are a function of inadequate hospital capacity (eg, hospital beds, staffing) and are difficult to overcome. Two primary strategies have been used to reduce these barriers. One strategy focuses on shifting inpatient discharge times earlier to better match inpatient bed supply with ED demand.14-19 Another common strategy is utilizing inpatient attendings to triage and better match bed needs to bed availability.20-22
A separate area of interest, and the focus of this study, is the deployment of inpatient teams to hasten delivery of inpatient care to patients waiting in the ED.8,23 One institution implemented an “ED hospitalist” model.23 Another created a hospital medicine team to provide inpatient medical care to ED boarder patients and to lend clinical input to bed management.8
At our large, urban academic medical center, the Department of Medicine in collaboration with the Department of Emergency Medicine created a full-time hospital medicine team dedicated to providing care in the ED for patients awaiting admission to a general medicine unit. We present our multiyear experience with this ED-based hospital medicine team. We hypothesized that this new team would expedite inpatient care delivery to medical boarder patients, thereby reducing the overall hospital LOS.
METHODS
Study Setting and Design
This retrospective cross-sectional study, approved by the Institutional Review Board, was conducted at a 1,011-bed academic medical center in the northeast United States. The study period was July 1, 2016 through June 30, 2018, which was divided into Academic Year 16 (AY) (July 1, 2016 to June 30, 2017) and AY17 (July 1, 2017 to June 30, 2018).
The Hospital Medicine Unit (HMU) was a 60 full-time equivalent hospital medicine group consisting of 80 physicians and 25 advanced practice providers (APPs). During the study, the general medical services cared for an average of 260 patients per day on inpatient units with a wide variety of diagnoses and comorbidities. The ED had 48 monitored bed spaces for adult patients, as well as two dedicated ED observation units with 32 beds. The observation units are separate units within the hospital, staffed by ED clinicians, and were not included in this study. In 2016, the ED had a total of 110,741 patient visits and 13,908 patients were admitted to a medical service.
In 2010, the Department of Public Health for the state in which the medical center resides defined an ED boarder (EDB) patient as “a patient who remains in the ED two hours after the decision to admit.”24 According to this definition, any patient waiting for an inpatient bed for more than two hours after a bed request was considered as an EDB. Operationally, further distinctions were made between patients who were “eligible” for care by an internal medicine team in the ED versus those who were actually “covered”. Before the intervention outlined in the current study, some care was provided by resident and hospitalist teams to eligible EDB patients from 2010 to 2015, although this was limited in scope. From July 1, 2015 to June 30, 2016, there was no coverage of medicine EDB patients.
Intervention
ED Boarder Service Staffing
On July 1, 2016, the HMU deployed a dedicated full-time team of clinicians to care for boarding patients, which was known as the EDB service. The service was created with the goal of seeing a maximum of 25 patients over 24 hours.
Inpatient medicine attending physicians (hospitalists) and APPs worked on the EDB service. During the day (7
There was a dedicated nursing team for the EDB service. For AY16, there were two daytime EDB nurses and one night nurse, all with a coverage ratio of three to four patients per nurse. For AY17, there were four to five daytime nurses and two to three nighttime nurses with the same coverage ratio as that for AY16. EDB nurses received special training on caring for boarder patients and followed the usual inpatient nursing protocols and assessments. During each shift, an EDB charge nurse worked in conjunction with the hospitalist, bed management, and inpatient units to determine patients requiring coverage by the EDB team.
Patient Eligibility
Similar to the workflow before the intervention, the ED team was responsible for determining a patient’s need for admission to a medical service. Patients were eligible for EDB service coverage if they waited in the ED for more than two hours after the request for an inpatient bed was made. The EDB charge nurse was responsible for identifying all eligible boarder patients based on time elapsed since bed request. Patients were not eligible for the hospital medicine EDB service if they were in the ED observation units or were being admitted to the intensive care unit, cardiology service, oncology service, or any service outside of the Department of Medicine.
The EDB service did not automatically assume care of all eligible patients. Instead, eligible patients were accepted based on several factors including EDB clinician census, anticipated availability of an inpatient bed, and clinical appropriateness as deemed by the physician. If the EDB physician census was fewer than 10 patients and an eligible patient was not expected to move to an inpatient unit within the next hour, the patient was accepted by the EDB service. Patients who were not accepted by the EDB service remained under the care of the ED team until either the patient received an inpatient bed or space became available on the EDB service census. Eligible EDB patients who received an inpatient bed before being picked up by the EDB service were considered as noncovered EDB patients. Alternatively, an eligible patient may initially be declined from EDB service coverage due to, for example, a high census but later accepted when capacity allowed—this patient would be considered a covered EDB patient.
Handoff and Coordination
When an eligible patient was accepted onto the EDB service, clinical handoff between the ED and EDB teams occurred. The EDB physician wrote admission orders, including the inpatient admission order. Once on the EDB service, when space allowed, the patient was physically moved to a dedicated geographic space (8 beds) within the ED designed for the EDB service. When the dedicated EDB area was full, new patients would remain in their original patient bay and receive care from the EDB service. Multidisciplinary rounds with nursing, inpatient clinicians, and case management that normally occur every weekday on inpatient units were adapted to occur on the EDB service to discuss patient care needs. The duration of the patient’s stay in the ED, including the time on the EDB service, was dictated by bed availability rather than by clinical discretion of the EDB clinician. When an EDB patient was assigned a ready inpatient bed, the EDB clinician immediately passed off clinical care to the inpatient medical team. There was no change in the process of assigning patients to inpatient beds during the intervention period.
Study Population
This study included patients who were admitted to the general medical services through the ED during the defined period. We excluded medicine patients who did not pass through the ED (eg, direct admissions or outside transfer) as well as patients admitted to a specialty service (cardiology, oncology) or the intensive care unit. Patients admitted to a nonmedical service were also excluded.
Two hours following a bed request, an ED patient was designated as an eligible EDB patient. Operationally, and for the purposes of this study, patients were separated into three groups: (1) an eligible EDB patient for whom the EDB service assumed care for any portion of their ED stay was considered as a “covered ED boarder,” (2) an eligible EDB patient who did not have any coverage by the EDB service at any point during their ED stay was considered as a “noncovered boarder,” and (3) a patient who received an inpatient bed within two hours of bed request was considered as a “nonboarder”. Patients admitted to a specialty service, intensive care unit, or nonmedical services were not included in any of the abovementioned three groups.
We defined metrics to quantify the extent of EDB team coverage. First, the number of covered EDB patients was divided by all medicine boarders (covered + noncovered) to determine the percentage of medicine EDBs covered. Second, the total patient hours spent under the care of the EDB service was divided by the total boarding hours for all medicine boarders to determine the percentage of boarder hours covered.
Data Sources and Collection
The Electronic Health Record (EHR; Epic Systems Corporation, Verona, Wisconsin) captured whether patients were eligible EDBs. For covered EDB patients, the time when care was assumed by the EDB service was captured electronically. Patient demographics, admitting diagnoses, time stamps throughout the hospitalization, admission volumes, LOS, and discharge disposition were extracted from the EHR.
Primary and Secondary Outcome Measures
The primary outcome of this study was hospital LOS defined as the time from ED arrival to hospital departure (Figure). Secondary outcomes included ED LOS (time from ED arrival to ED departure) and the rate of 30-day ED readmission to the study institution.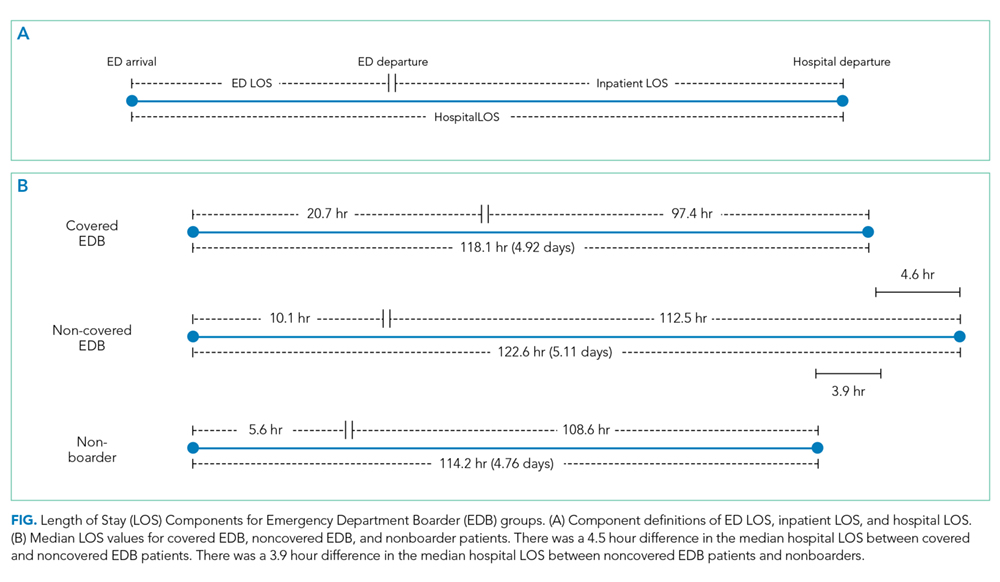
Statistical Analysis
SAS version 9.4 (SAS Institute, Cary, North Carolina) was used for all statistical analyses. Continuous outcomes were compared using the Mann–Whitney test and dichotomized outcomes were compared using chi-square tests. We further analyzed the differences in the primary and secondary outcomes between covered and noncovered EDB groups using a multivariable regression analysis adjusting for age, gender, race, academic year, hour of the day, and day of the week at the time of becoming an EDB. We used quantile regression and linear regression with log-transformed continuous outcomes and logistic regression for the dichotomized outcome. A P value of .05 was used as a threshold for statistical significance.
RESULTS
Study Population and Demographics
There were a total of 16,668 patients admitted from the ED to the general medical services during the study period (Table 1). There were 8,776 (53%) patients in the covered EDB group, 5,866 (35%) patients in the noncovered EDB group, and 2,026 (12%) patients in the nonboarder group. There were more patients admitted during AY17 compared with AY16 (8,934 vs 7,734 patients, respectively, Appendix 1). Patient demographics, including age, gender, race, insurance coverage, admitting diagnoses, and discharge disposition, were similar among all three patient groups (Table 1). A majority of patients in the covered EDB and nonboarder groups presented to the ED in the afternoon, whereas noncovered EDB patients presented more in the morning (Table 1). Consistent with this pattern, inpatient bed requests for covered EDB and nonboarder patients were more frequent between 7 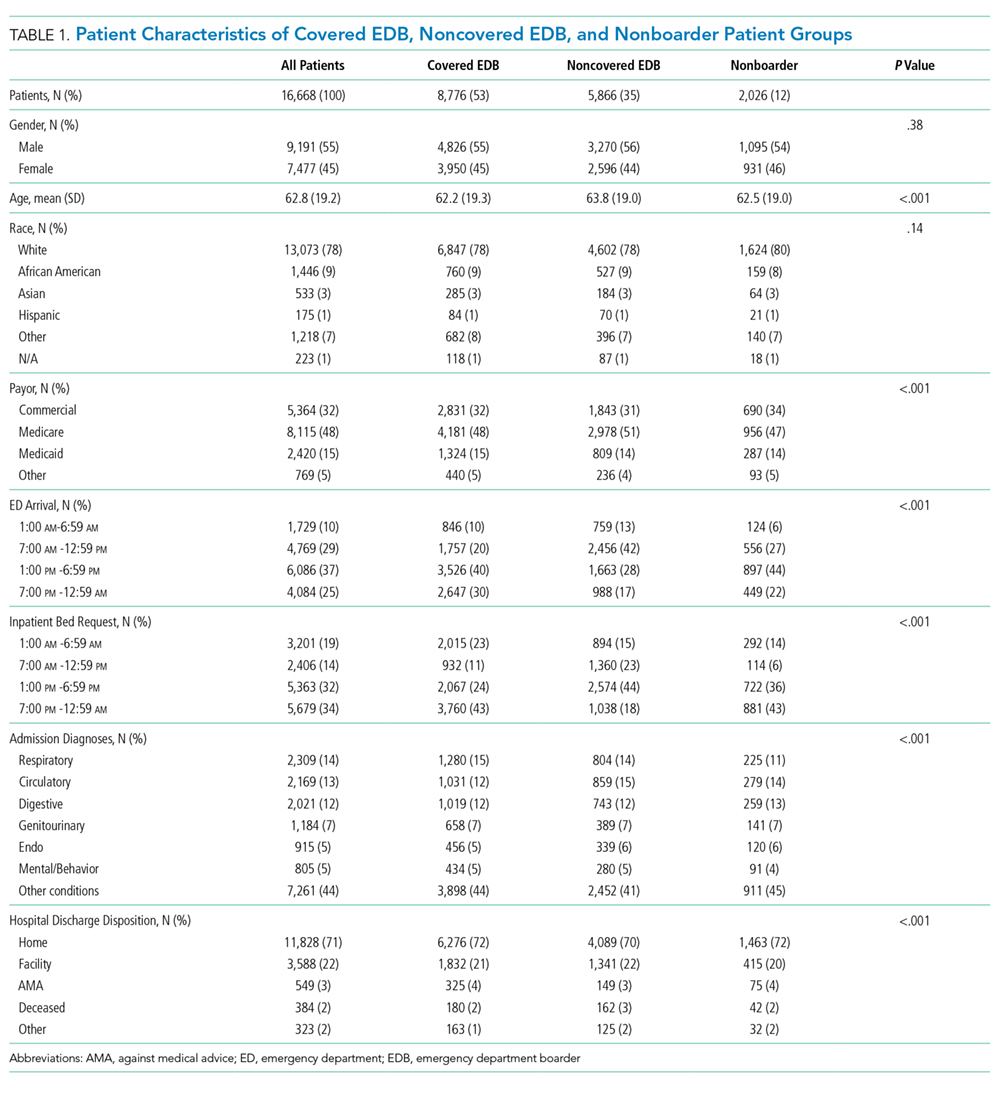
Hospital Length of Stay
Nonboarders had the shortest median hospital LOS (4.76; interquartile range [IQR] 2.90-7.22 days). Covered EDB patients had a median hospital LOS that was 4.6 hours (0.19 day) shorter compared with noncovered EDB patients (4.92 [IQR 3.00-8.03] days vs 5.11 [IQR 3.16-8.34 days]; Table 2). The differences among the three groups were all significant in the univariate comparison (P < .001). Multivariable regression controlling for patient age, gender, race, academic year, and hour and day of the week at the time of becoming an EDB demonstrated that the difference in hospital LOS between covered and noncovered EDB patients remained significant (P < .001).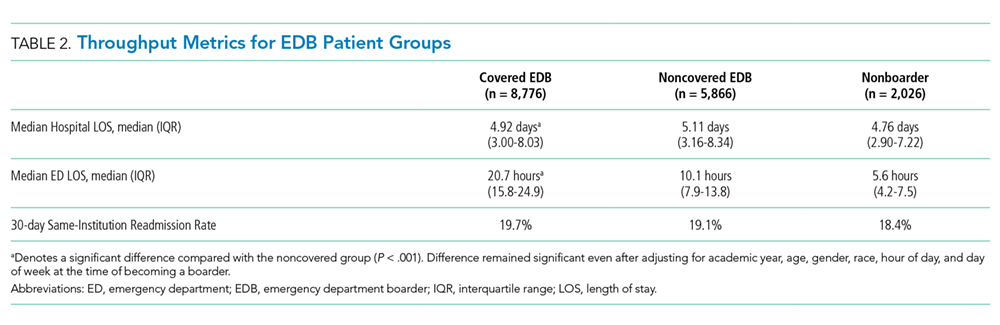
ED Length of Stay and 30-Day ED Readmission
Covered EDB patients had a longer median ED LOS compared with noncovered EDB patients and nonboarder patients (20.7 [IQR 15.8-24.9] hours vs 10.1 [IQR 7.9-13.8] hours vs 5.6 [IQR 4.2-7.5] hours, respectively, Table 2). These differences remained significant in the multivariable regression models (P < .001). Finally, the 30-day same-institution ED readmission rate was similar between covered and noncovered EDB patients.
DISCUSSION
We present two years of data describing a hospital medicine-led team designed to enhance the care of medical patients boarding in the ED. The period spent boarding in the ED is a vulnerable time for patients, and we created the EDB service with the goal of delivering inpatient medicine-led care to ED patients awaiting their inpatient bed.
When a bed request is made in an efficient ideal world, patients could be immediately transferred to an open inpatient bed to initiate care. In our study, patients who were not EDBs (ie, waited for less than two hours for their inpatient bed) had the most time-efficient care as they had the shortest ED and hospital LOS. However, nonboarders represented only 12% of patients and the majority of patients admitted to medicine were boarders. Patients covered by the EDB service had an overall hospital LOS that was 4.6 hours shorter compared with noncovered EDB patients despite having an ED LOS that was 15.1 hours longer. These LOS differences were observed without any difference to 30-day ED readmission rates.
Given that not all boarding patients were cared by the EDB service, the role of selection bias in our study warrants discussion. Similar to other studies, ED LOS for our patient cohort is heavily influenced by the availability of inpatient beds.10-12 The EDB service handed off patients they were covering as soon as an inpatient bed became available. Although there was discretion from the EDB charge nurse and the EDB physician about which patient to accept, this was primarily focused on choosing patients who did not have a pending inpatient bed (eg, a patient who was assigned a bed but was awaiting room cleaning). Importantly, there was no change in the bed assignment process as a part of the intervention. Our intervention’s design did not allow for elucidation of causation; however, we believe that the longer ED LOS for covered EDB patients compared with noncovered EDB patients reflects the fact that the team chose patients with a higher expected ED LOS rather than that the patients had a longer LOS due to being cared by the service. Consistent with this, patients covered by the EDB service tended to have bed requests placed during the night shift compared with noncovered EDB patients; patients with bed requests at night are more likely to wait longer for their inpatient bed given that inpatient beds are generally freed up in the afternoon. We acknowledge that it is impossible to completely rule out the possibility that patient factors (eg, infectious precautions) influence inpatient bed wait time and could be another factor influencing the probability of EDB service coverage.
The current study adds to the expanding literature on EDB care models. Briones et al. demonstrated that an “ED hospitalist” led to increased care delivery as measured by an increased follow-up on laboratory results and medication orders.23 However, their study was not structured to demonstrate LOS changes.23 In another study, Chadaga et al. reported about their experience with a hospital medicine team providing care for EDB patients, similar to our study.8 Their hospital medicine team consisted of a hospitalist and APP deployed in the ED during the day, with night coverage provided by existing ED clinicians. They demonstrated less ED diversion, more ED discharges, and positive perceptions among the ED team.8 However, there was no impact on ED or hospital LOS, although their results may have been limited by the short duration of postintervention data and the lack of nighttime coverage.8 Finally, a modeling study demonstrated a reduction in ED LOS by adding ED clinicians only for patients being discharged from the ED and not for those being admitted, although there was no explicit adjustment for LOS accounting for initiation of inpatient care in the ED.15 Extending the current literature, our study suggests that a hospitalist team providing continuous coverage to a large portion of EDB patients could shorten the overall hospital LOS for boarding patients, but even this was not enough to reduce LOS to the same level as that of patients who did not board.
Practically, there were challenges to creating the EDB service described in our study. Additional clinical staff (physician, APP, and nursing) were hired for the team, requiring a financial commitment from the institution. The new team required space within the ED footprint incurring construction costs. Before the existence of the EDB service, other ancillary services (eg, physical therapy) were unaccustomed to seeing ED patients, and thus new workflows were created. Another challenge was that internal medicine clinicians were not used to caring for patients for short durations of time before passing off clinical care to another team. This required a different approach, focusing on acute issues rather than conducting an exhaustive evaluation. Finally, the EDB service workflow introduced an additional handoff, increasing discontinuity of care. These challenges are factors to consider for institutions considering a similar EDB team and should be weighed against other interventions to alleviate ED boarding or improve throughput such as expanding inpatient capacity.
Ideal metrics to track the coverage and performance of an EDB service such as the one described in this study are undefined. It was difficult to know whether the goal should be complete coverage given the increase in handoffs, particularly for patients with short boarding times. This EDB service covered 59.9% of boarding patients and 62.9% of total boarding hours. Factors that contributed to covering less than 100% included physician staffing that was insufficient to meet demand and discretion to not accept patients expected to quickly get an inpatient bed. Therefore, the percentage of patients and boarding hours covered are crude metrics and further investigation is needed to develop optimal metrics for an EDB team.
Future studies on care models for EDB patients are warranted. Recognizing that EDB teams require additional resources, studies to define which patients receive the most benefit from EDB coverage will be helpful. Moreover, the EDB team composition may need to adapt to different environments (eg, academic, urban, nonacademic, rural). Diving deeper to study whether specific patient populations benefit more than others from care by the EDB service, as measured by hospital LOS or other outcomes, would be important. Clinical outcomes, in addition to throughput metrics such as LOS, must be analyzed to understand whether factors such as increased handoffs outweigh any benefits in throughput.
There were several limitations to this study. First, it was performed at a single academic institution, potentially limiting its generalizability. However, although some workflows and team coverage structures may be institution-specific, the concept of a hospital medicine-led EDB team providing earlier inpatient care can be adapted locally and may probably achieve similar benefits. Our study population included only patients destined for general medical admission; thus, it is uncertain whether the gains demonstrated in our study would be realized for patients boarding for nonmedical services. In addition, considering the observational nature of this study, it is difficult to prove the causation that a hospitalist EDB service solely led to reductions in hospital LOS. Finally, we did not adjust for nor measure whether ED clinicians provided different care to patients whom they felt were destined for the EDB service.
In summary, nonboarder patients had the shortest overall LOS; however, among those patients who boarded, coverage by a hospitalist-led team was associated with a shorter LOS. Given the limited inpatient capacity, eliminating ED boarding is often not possible. We present a model to expedite inpatient care and allow ED clinicians to focus on newly arriving ED patients. Additional studies are required to better understand how to optimally care for patients boarding in the ED.
1. Asplin BR, Magid DJ, Rhodes KV, Solberg LI, Lurie N, Camargo CA, Jr. A conceptual model of emergency department crowding. Ann Emerg Med. 2003;42(2):173-180. https://doi.org/10.1067/mem.2003.302.
2. Trzeciak S, Rivers EP. Emergency department overcrowding in the United States: an emerging threat to patient safety and public health. Emerg Med J. 2003;20(5):402-405. https://doi.org/10.1136/emj.20.5.402.
3. Olshaker JS. Managing emergency department overcrowding. Emerg Med Clin North Am. 2009;27(4):593-603. https://doi.org/10.1016/jemc.2009.07.004.
4. Richardson LD, Asplin BR, Lowe RA. Emergency department crowding as a health policy issue: past development, future directions. Ann Emerg Med. 2002;40(4):388-393. https://doi.org/10.1067/mem.2002.128012.
5. Bernstein SL, Aronsky D, Duseja R, et al. The effect of emergency department crowding on clinically oriented outcomes. Acad Emerg Med. 2009;16(1):1-10. https://doi.org/10.1111/j.1553-2712.2008.00295.x.
6. Singer AJ, Thode HC, Jr., Viccellio P, Pines JM. The association between length of emergency department boarding and mortality. Acad Emerg Med. 2011;18(12):1324-1329. https://doi.org/10.1111/j.1553-2712.2011.01236.x.
7. Silvester KM, Mohammed MA, Harriman P, Girolami A, Downes TW. Timely care for frail older people referred to hospital improves efficiency and reduces mortality without the need for extra resources. Age Ageing. 2014;43(4):472-477. https://doi.org/10.1093/ageing/aft170.
8. Chadaga SR, Shockley L, Keniston A, et al. Hospitalist-led medicine emergency department team: associations with throughput, timeliness of patient care, and satisfaction. J Hosp Med. 2012;7(7):562-566. https://doi.org/10.1002/jhm.1957.
9. Lucas R, Farley H, Twanmoh J, Urumov A, Evans B, Olsen N. Measuring the opportunity loss of time spent boarding admitted patients in the emergency department: a multihospital analysis. J Healthc Manag. 2009;54(2):117-124; discussion 124-115. https://doi.org/10.1097/00115514-200903000-00009.
10. Forster AJ, Stiell I, Wells G, Lee AJ, van Walraven C. The effect of hospital occupancy on emergency department length of stay and patient disposition. Acad Emerg Med. 2003;10(2):127-133. https://doi.org/10.1111/j.1553-2712.2003.tb00029.x.
11. Hoot NR, Aronsky D. Systematic review of emergency department crowding: causes, effects, and solutions. Ann Emerg Med. 2008;52(2):126-136. https://doi.org/10.1016/j.annemergmed.2008.03.014.
12. Asaro PV, Lewis LM, Boxerman SB. The impact of input and output factors on emergency department throughput. Acad Emerg Med. 2007;14(3):235-242. https://doi.org/10.1197/j.aem.2006.10.104.
13. Khare RK, Powell ES, Reinhardt G, Lucenti M. Adding more beds to the emergency department or reducing admitted patient boarding times: which has a more significant influence on emergency department congestion? Ann Emerg Med. 2009;53(5):575-585. https://doi.org/10.1016/j.annemergmed.2008.07.009.
14. Wertheimer B, Jacobs RE, Bailey M, et al. Discharge before noon: an achievable hospital goal. J Hosp Med. 2014;9(4):210-214. https://doi.org/10.1002/jhm.2154.
15. Paul JA, Lin L. Models for improving patient throughput and waiting at hospital emergency departments. J Emerg Med. 2012;43(6):1119-1126. https://doi.org/10.1016/j.jemermed.2012.01.063.
16. Wertheimer B, Jacobs RE, Iturrate E, Bailey M, Hochman K. Discharge before noon: effect on throughput and sustainability. J Hosp Med. 2015;10(10):664-669. https://doi.org/10.1002/jhm.2412.
17. Khanna S, Sier D, Boyle J, Zeitz K. Discharge timeliness and its impact on hospital crowding and emergency department flow performance. Emerg Med Australas. 2016;28(2):164-170. https://doi.org/10.1111/1742-6723.12543.
18. Patel H, Morduchowicz S, Mourad M. Using a systematic framework of interventions to improve early discharges. Jt Comm J Qual Patient Saf. 2017;43(4):189-196. https://doi.org/10.1016/j.jcjq.2016.12.003.
19. Powell ES, Khare RK, Venkatesh AK, Van Roo BD, Adams JG, Reinhardt G. The relationship between inpatient discharge timing and emergency department boarding. J Emerg Med. 2012;42(2):186-196. https://doi.org/10.1016/j.jemermed.2010.06.028.
20. Howell E, Bessman E, Kravet S, Kolodner K, Marshall R, Wright S. Active bed management by hospitalists and emergency department throughput. Ann Intern Med. 2008;149(11):804-811. https://doi.org/10.7326/0003-4819-149-11-200812020-00006.
21. Howell E, Bessman E, Marshall R, Wright S. Hospitalist bed management effecting throughput from the emergency department to the intensive care unit. J Crit Care. 2010;25(2):184-189. https://doi.org/10.1016/j.jcrc.2009.08.004.
22. Howell EE, Bessman ES, Rubin HR. Hospitalists and an innovative emergency department admission process. J Gen Intern Med. 2004;19(3):266-268. https://doi.org/10.1111/j.1525-1497.2004.30431.x.
23. Briones A, Markoff B, Kathuria N, et al. A model of a hospitalist role in the care of admitted patients in the emergency department. J Hosp Med. 2010;5(6):360-364. https://doi.org/10.1002/jhm.636.
24. Auerbach J. Reducing emergency department patient boarding and submitting code help policies to the Department of Public Health. In: Executive Office of Health and Human Services. Boston: Department of Public Health; 2010.
Emergency department (ED) crowding and boarding of patients awaiting admission to the hospital (ED boarding) are growing problems with important clinical care and public safety implications.1-4 Increased ED boarding times have been associated with lower patient satisfaction, inadequate care of critically ill patients, adverse events, and increased mortality.3,5-7 Furthermore, ED boarding can diminish the ED’s ability to evaluate new patients.5,8,9 ED boarding is more severe in hospitals with high inpatient occupancy with resultant disproportionate burden on large urban institutions.2,4,5,10
Earlier studies suggest, but have not consistently shown, an association between longer ED length of stay (LOS) and longer overall hospital LOS.5 This association implies that the additional time spent in the ED waiting for a bed does not meaningfully contribute to advancing the required inpatient care. Thus, this waiting time is “dead time” that is added to the overall hospital duration.
The complexity and the volume of medical patients boarding in the ED can challenge the resources of an already overtaxed ED staff. Potential solutions to mitigate ED boarding of medicine patients generally focus on reducing barriers to timely movement of patients from the ED to an inpatient unit.1,3,11-13 Ultimately, these barriers are a function of inadequate hospital capacity (eg, hospital beds, staffing) and are difficult to overcome. Two primary strategies have been used to reduce these barriers. One strategy focuses on shifting inpatient discharge times earlier to better match inpatient bed supply with ED demand.14-19 Another common strategy is utilizing inpatient attendings to triage and better match bed needs to bed availability.20-22
A separate area of interest, and the focus of this study, is the deployment of inpatient teams to hasten delivery of inpatient care to patients waiting in the ED.8,23 One institution implemented an “ED hospitalist” model.23 Another created a hospital medicine team to provide inpatient medical care to ED boarder patients and to lend clinical input to bed management.8
At our large, urban academic medical center, the Department of Medicine in collaboration with the Department of Emergency Medicine created a full-time hospital medicine team dedicated to providing care in the ED for patients awaiting admission to a general medicine unit. We present our multiyear experience with this ED-based hospital medicine team. We hypothesized that this new team would expedite inpatient care delivery to medical boarder patients, thereby reducing the overall hospital LOS.
METHODS
Study Setting and Design
This retrospective cross-sectional study, approved by the Institutional Review Board, was conducted at a 1,011-bed academic medical center in the northeast United States. The study period was July 1, 2016 through June 30, 2018, which was divided into Academic Year 16 (AY) (July 1, 2016 to June 30, 2017) and AY17 (July 1, 2017 to June 30, 2018).
The Hospital Medicine Unit (HMU) was a 60 full-time equivalent hospital medicine group consisting of 80 physicians and 25 advanced practice providers (APPs). During the study, the general medical services cared for an average of 260 patients per day on inpatient units with a wide variety of diagnoses and comorbidities. The ED had 48 monitored bed spaces for adult patients, as well as two dedicated ED observation units with 32 beds. The observation units are separate units within the hospital, staffed by ED clinicians, and were not included in this study. In 2016, the ED had a total of 110,741 patient visits and 13,908 patients were admitted to a medical service.
In 2010, the Department of Public Health for the state in which the medical center resides defined an ED boarder (EDB) patient as “a patient who remains in the ED two hours after the decision to admit.”24 According to this definition, any patient waiting for an inpatient bed for more than two hours after a bed request was considered as an EDB. Operationally, further distinctions were made between patients who were “eligible” for care by an internal medicine team in the ED versus those who were actually “covered”. Before the intervention outlined in the current study, some care was provided by resident and hospitalist teams to eligible EDB patients from 2010 to 2015, although this was limited in scope. From July 1, 2015 to June 30, 2016, there was no coverage of medicine EDB patients.
Intervention
ED Boarder Service Staffing
On July 1, 2016, the HMU deployed a dedicated full-time team of clinicians to care for boarding patients, which was known as the EDB service. The service was created with the goal of seeing a maximum of 25 patients over 24 hours.
Inpatient medicine attending physicians (hospitalists) and APPs worked on the EDB service. During the day (7
There was a dedicated nursing team for the EDB service. For AY16, there were two daytime EDB nurses and one night nurse, all with a coverage ratio of three to four patients per nurse. For AY17, there were four to five daytime nurses and two to three nighttime nurses with the same coverage ratio as that for AY16. EDB nurses received special training on caring for boarder patients and followed the usual inpatient nursing protocols and assessments. During each shift, an EDB charge nurse worked in conjunction with the hospitalist, bed management, and inpatient units to determine patients requiring coverage by the EDB team.
Patient Eligibility
Similar to the workflow before the intervention, the ED team was responsible for determining a patient’s need for admission to a medical service. Patients were eligible for EDB service coverage if they waited in the ED for more than two hours after the request for an inpatient bed was made. The EDB charge nurse was responsible for identifying all eligible boarder patients based on time elapsed since bed request. Patients were not eligible for the hospital medicine EDB service if they were in the ED observation units or were being admitted to the intensive care unit, cardiology service, oncology service, or any service outside of the Department of Medicine.
The EDB service did not automatically assume care of all eligible patients. Instead, eligible patients were accepted based on several factors including EDB clinician census, anticipated availability of an inpatient bed, and clinical appropriateness as deemed by the physician. If the EDB physician census was fewer than 10 patients and an eligible patient was not expected to move to an inpatient unit within the next hour, the patient was accepted by the EDB service. Patients who were not accepted by the EDB service remained under the care of the ED team until either the patient received an inpatient bed or space became available on the EDB service census. Eligible EDB patients who received an inpatient bed before being picked up by the EDB service were considered as noncovered EDB patients. Alternatively, an eligible patient may initially be declined from EDB service coverage due to, for example, a high census but later accepted when capacity allowed—this patient would be considered a covered EDB patient.
Handoff and Coordination
When an eligible patient was accepted onto the EDB service, clinical handoff between the ED and EDB teams occurred. The EDB physician wrote admission orders, including the inpatient admission order. Once on the EDB service, when space allowed, the patient was physically moved to a dedicated geographic space (8 beds) within the ED designed for the EDB service. When the dedicated EDB area was full, new patients would remain in their original patient bay and receive care from the EDB service. Multidisciplinary rounds with nursing, inpatient clinicians, and case management that normally occur every weekday on inpatient units were adapted to occur on the EDB service to discuss patient care needs. The duration of the patient’s stay in the ED, including the time on the EDB service, was dictated by bed availability rather than by clinical discretion of the EDB clinician. When an EDB patient was assigned a ready inpatient bed, the EDB clinician immediately passed off clinical care to the inpatient medical team. There was no change in the process of assigning patients to inpatient beds during the intervention period.
Study Population
This study included patients who were admitted to the general medical services through the ED during the defined period. We excluded medicine patients who did not pass through the ED (eg, direct admissions or outside transfer) as well as patients admitted to a specialty service (cardiology, oncology) or the intensive care unit. Patients admitted to a nonmedical service were also excluded.
Two hours following a bed request, an ED patient was designated as an eligible EDB patient. Operationally, and for the purposes of this study, patients were separated into three groups: (1) an eligible EDB patient for whom the EDB service assumed care for any portion of their ED stay was considered as a “covered ED boarder,” (2) an eligible EDB patient who did not have any coverage by the EDB service at any point during their ED stay was considered as a “noncovered boarder,” and (3) a patient who received an inpatient bed within two hours of bed request was considered as a “nonboarder”. Patients admitted to a specialty service, intensive care unit, or nonmedical services were not included in any of the abovementioned three groups.
We defined metrics to quantify the extent of EDB team coverage. First, the number of covered EDB patients was divided by all medicine boarders (covered + noncovered) to determine the percentage of medicine EDBs covered. Second, the total patient hours spent under the care of the EDB service was divided by the total boarding hours for all medicine boarders to determine the percentage of boarder hours covered.
Data Sources and Collection
The Electronic Health Record (EHR; Epic Systems Corporation, Verona, Wisconsin) captured whether patients were eligible EDBs. For covered EDB patients, the time when care was assumed by the EDB service was captured electronically. Patient demographics, admitting diagnoses, time stamps throughout the hospitalization, admission volumes, LOS, and discharge disposition were extracted from the EHR.
Primary and Secondary Outcome Measures
The primary outcome of this study was hospital LOS defined as the time from ED arrival to hospital departure (Figure). Secondary outcomes included ED LOS (time from ED arrival to ED departure) and the rate of 30-day ED readmission to the study institution.
Statistical Analysis
SAS version 9.4 (SAS Institute, Cary, North Carolina) was used for all statistical analyses. Continuous outcomes were compared using the Mann–Whitney test and dichotomized outcomes were compared using chi-square tests. We further analyzed the differences in the primary and secondary outcomes between covered and noncovered EDB groups using a multivariable regression analysis adjusting for age, gender, race, academic year, hour of the day, and day of the week at the time of becoming an EDB. We used quantile regression and linear regression with log-transformed continuous outcomes and logistic regression for the dichotomized outcome. A P value of .05 was used as a threshold for statistical significance.
RESULTS
Study Population and Demographics
There were a total of 16,668 patients admitted from the ED to the general medical services during the study period (Table 1). There were 8,776 (53%) patients in the covered EDB group, 5,866 (35%) patients in the noncovered EDB group, and 2,026 (12%) patients in the nonboarder group. There were more patients admitted during AY17 compared with AY16 (8,934 vs 7,734 patients, respectively, Appendix 1). Patient demographics, including age, gender, race, insurance coverage, admitting diagnoses, and discharge disposition, were similar among all three patient groups (Table 1). A majority of patients in the covered EDB and nonboarder groups presented to the ED in the afternoon, whereas noncovered EDB patients presented more in the morning (Table 1). Consistent with this pattern, inpatient bed requests for covered EDB and nonboarder patients were more frequent between 7
Hospital Length of Stay
Nonboarders had the shortest median hospital LOS (4.76; interquartile range [IQR] 2.90-7.22 days). Covered EDB patients had a median hospital LOS that was 4.6 hours (0.19 day) shorter compared with noncovered EDB patients (4.92 [IQR 3.00-8.03] days vs 5.11 [IQR 3.16-8.34 days]; Table 2). The differences among the three groups were all significant in the univariate comparison (P < .001). Multivariable regression controlling for patient age, gender, race, academic year, and hour and day of the week at the time of becoming an EDB demonstrated that the difference in hospital LOS between covered and noncovered EDB patients remained significant (P < .001).
ED Length of Stay and 30-Day ED Readmission
Covered EDB patients had a longer median ED LOS compared with noncovered EDB patients and nonboarder patients (20.7 [IQR 15.8-24.9] hours vs 10.1 [IQR 7.9-13.8] hours vs 5.6 [IQR 4.2-7.5] hours, respectively, Table 2). These differences remained significant in the multivariable regression models (P < .001). Finally, the 30-day same-institution ED readmission rate was similar between covered and noncovered EDB patients.
DISCUSSION
We present two years of data describing a hospital medicine-led team designed to enhance the care of medical patients boarding in the ED. The period spent boarding in the ED is a vulnerable time for patients, and we created the EDB service with the goal of delivering inpatient medicine-led care to ED patients awaiting their inpatient bed.
When a bed request is made in an efficient ideal world, patients could be immediately transferred to an open inpatient bed to initiate care. In our study, patients who were not EDBs (ie, waited for less than two hours for their inpatient bed) had the most time-efficient care as they had the shortest ED and hospital LOS. However, nonboarders represented only 12% of patients and the majority of patients admitted to medicine were boarders. Patients covered by the EDB service had an overall hospital LOS that was 4.6 hours shorter compared with noncovered EDB patients despite having an ED LOS that was 15.1 hours longer. These LOS differences were observed without any difference to 30-day ED readmission rates.
Given that not all boarding patients were cared by the EDB service, the role of selection bias in our study warrants discussion. Similar to other studies, ED LOS for our patient cohort is heavily influenced by the availability of inpatient beds.10-12 The EDB service handed off patients they were covering as soon as an inpatient bed became available. Although there was discretion from the EDB charge nurse and the EDB physician about which patient to accept, this was primarily focused on choosing patients who did not have a pending inpatient bed (eg, a patient who was assigned a bed but was awaiting room cleaning). Importantly, there was no change in the bed assignment process as a part of the intervention. Our intervention’s design did not allow for elucidation of causation; however, we believe that the longer ED LOS for covered EDB patients compared with noncovered EDB patients reflects the fact that the team chose patients with a higher expected ED LOS rather than that the patients had a longer LOS due to being cared by the service. Consistent with this, patients covered by the EDB service tended to have bed requests placed during the night shift compared with noncovered EDB patients; patients with bed requests at night are more likely to wait longer for their inpatient bed given that inpatient beds are generally freed up in the afternoon. We acknowledge that it is impossible to completely rule out the possibility that patient factors (eg, infectious precautions) influence inpatient bed wait time and could be another factor influencing the probability of EDB service coverage.
The current study adds to the expanding literature on EDB care models. Briones et al. demonstrated that an “ED hospitalist” led to increased care delivery as measured by an increased follow-up on laboratory results and medication orders.23 However, their study was not structured to demonstrate LOS changes.23 In another study, Chadaga et al. reported about their experience with a hospital medicine team providing care for EDB patients, similar to our study.8 Their hospital medicine team consisted of a hospitalist and APP deployed in the ED during the day, with night coverage provided by existing ED clinicians. They demonstrated less ED diversion, more ED discharges, and positive perceptions among the ED team.8 However, there was no impact on ED or hospital LOS, although their results may have been limited by the short duration of postintervention data and the lack of nighttime coverage.8 Finally, a modeling study demonstrated a reduction in ED LOS by adding ED clinicians only for patients being discharged from the ED and not for those being admitted, although there was no explicit adjustment for LOS accounting for initiation of inpatient care in the ED.15 Extending the current literature, our study suggests that a hospitalist team providing continuous coverage to a large portion of EDB patients could shorten the overall hospital LOS for boarding patients, but even this was not enough to reduce LOS to the same level as that of patients who did not board.
Practically, there were challenges to creating the EDB service described in our study. Additional clinical staff (physician, APP, and nursing) were hired for the team, requiring a financial commitment from the institution. The new team required space within the ED footprint incurring construction costs. Before the existence of the EDB service, other ancillary services (eg, physical therapy) were unaccustomed to seeing ED patients, and thus new workflows were created. Another challenge was that internal medicine clinicians were not used to caring for patients for short durations of time before passing off clinical care to another team. This required a different approach, focusing on acute issues rather than conducting an exhaustive evaluation. Finally, the EDB service workflow introduced an additional handoff, increasing discontinuity of care. These challenges are factors to consider for institutions considering a similar EDB team and should be weighed against other interventions to alleviate ED boarding or improve throughput such as expanding inpatient capacity.
Ideal metrics to track the coverage and performance of an EDB service such as the one described in this study are undefined. It was difficult to know whether the goal should be complete coverage given the increase in handoffs, particularly for patients with short boarding times. This EDB service covered 59.9% of boarding patients and 62.9% of total boarding hours. Factors that contributed to covering less than 100% included physician staffing that was insufficient to meet demand and discretion to not accept patients expected to quickly get an inpatient bed. Therefore, the percentage of patients and boarding hours covered are crude metrics and further investigation is needed to develop optimal metrics for an EDB team.
Future studies on care models for EDB patients are warranted. Recognizing that EDB teams require additional resources, studies to define which patients receive the most benefit from EDB coverage will be helpful. Moreover, the EDB team composition may need to adapt to different environments (eg, academic, urban, nonacademic, rural). Diving deeper to study whether specific patient populations benefit more than others from care by the EDB service, as measured by hospital LOS or other outcomes, would be important. Clinical outcomes, in addition to throughput metrics such as LOS, must be analyzed to understand whether factors such as increased handoffs outweigh any benefits in throughput.
There were several limitations to this study. First, it was performed at a single academic institution, potentially limiting its generalizability. However, although some workflows and team coverage structures may be institution-specific, the concept of a hospital medicine-led EDB team providing earlier inpatient care can be adapted locally and may probably achieve similar benefits. Our study population included only patients destined for general medical admission; thus, it is uncertain whether the gains demonstrated in our study would be realized for patients boarding for nonmedical services. In addition, considering the observational nature of this study, it is difficult to prove the causation that a hospitalist EDB service solely led to reductions in hospital LOS. Finally, we did not adjust for nor measure whether ED clinicians provided different care to patients whom they felt were destined for the EDB service.
In summary, nonboarder patients had the shortest overall LOS; however, among those patients who boarded, coverage by a hospitalist-led team was associated with a shorter LOS. Given the limited inpatient capacity, eliminating ED boarding is often not possible. We present a model to expedite inpatient care and allow ED clinicians to focus on newly arriving ED patients. Additional studies are required to better understand how to optimally care for patients boarding in the ED.
1. Asplin BR, Magid DJ, Rhodes KV, Solberg LI, Lurie N, Camargo CA, Jr. A conceptual model of emergency department crowding. Ann Emerg Med. 2003;42(2):173-180. https://doi.org/10.1067/mem.2003.302.
2. Trzeciak S, Rivers EP. Emergency department overcrowding in the United States: an emerging threat to patient safety and public health. Emerg Med J. 2003;20(5):402-405. https://doi.org/10.1136/emj.20.5.402.
3. Olshaker JS. Managing emergency department overcrowding. Emerg Med Clin North Am. 2009;27(4):593-603. https://doi.org/10.1016/jemc.2009.07.004.
4. Richardson LD, Asplin BR, Lowe RA. Emergency department crowding as a health policy issue: past development, future directions. Ann Emerg Med. 2002;40(4):388-393. https://doi.org/10.1067/mem.2002.128012.
5. Bernstein SL, Aronsky D, Duseja R, et al. The effect of emergency department crowding on clinically oriented outcomes. Acad Emerg Med. 2009;16(1):1-10. https://doi.org/10.1111/j.1553-2712.2008.00295.x.
6. Singer AJ, Thode HC, Jr., Viccellio P, Pines JM. The association between length of emergency department boarding and mortality. Acad Emerg Med. 2011;18(12):1324-1329. https://doi.org/10.1111/j.1553-2712.2011.01236.x.
7. Silvester KM, Mohammed MA, Harriman P, Girolami A, Downes TW. Timely care for frail older people referred to hospital improves efficiency and reduces mortality without the need for extra resources. Age Ageing. 2014;43(4):472-477. https://doi.org/10.1093/ageing/aft170.
8. Chadaga SR, Shockley L, Keniston A, et al. Hospitalist-led medicine emergency department team: associations with throughput, timeliness of patient care, and satisfaction. J Hosp Med. 2012;7(7):562-566. https://doi.org/10.1002/jhm.1957.
9. Lucas R, Farley H, Twanmoh J, Urumov A, Evans B, Olsen N. Measuring the opportunity loss of time spent boarding admitted patients in the emergency department: a multihospital analysis. J Healthc Manag. 2009;54(2):117-124; discussion 124-115. https://doi.org/10.1097/00115514-200903000-00009.
10. Forster AJ, Stiell I, Wells G, Lee AJ, van Walraven C. The effect of hospital occupancy on emergency department length of stay and patient disposition. Acad Emerg Med. 2003;10(2):127-133. https://doi.org/10.1111/j.1553-2712.2003.tb00029.x.
11. Hoot NR, Aronsky D. Systematic review of emergency department crowding: causes, effects, and solutions. Ann Emerg Med. 2008;52(2):126-136. https://doi.org/10.1016/j.annemergmed.2008.03.014.
12. Asaro PV, Lewis LM, Boxerman SB. The impact of input and output factors on emergency department throughput. Acad Emerg Med. 2007;14(3):235-242. https://doi.org/10.1197/j.aem.2006.10.104.
13. Khare RK, Powell ES, Reinhardt G, Lucenti M. Adding more beds to the emergency department or reducing admitted patient boarding times: which has a more significant influence on emergency department congestion? Ann Emerg Med. 2009;53(5):575-585. https://doi.org/10.1016/j.annemergmed.2008.07.009.
14. Wertheimer B, Jacobs RE, Bailey M, et al. Discharge before noon: an achievable hospital goal. J Hosp Med. 2014;9(4):210-214. https://doi.org/10.1002/jhm.2154.
15. Paul JA, Lin L. Models for improving patient throughput and waiting at hospital emergency departments. J Emerg Med. 2012;43(6):1119-1126. https://doi.org/10.1016/j.jemermed.2012.01.063.
16. Wertheimer B, Jacobs RE, Iturrate E, Bailey M, Hochman K. Discharge before noon: effect on throughput and sustainability. J Hosp Med. 2015;10(10):664-669. https://doi.org/10.1002/jhm.2412.
17. Khanna S, Sier D, Boyle J, Zeitz K. Discharge timeliness and its impact on hospital crowding and emergency department flow performance. Emerg Med Australas. 2016;28(2):164-170. https://doi.org/10.1111/1742-6723.12543.
18. Patel H, Morduchowicz S, Mourad M. Using a systematic framework of interventions to improve early discharges. Jt Comm J Qual Patient Saf. 2017;43(4):189-196. https://doi.org/10.1016/j.jcjq.2016.12.003.
19. Powell ES, Khare RK, Venkatesh AK, Van Roo BD, Adams JG, Reinhardt G. The relationship between inpatient discharge timing and emergency department boarding. J Emerg Med. 2012;42(2):186-196. https://doi.org/10.1016/j.jemermed.2010.06.028.
20. Howell E, Bessman E, Kravet S, Kolodner K, Marshall R, Wright S. Active bed management by hospitalists and emergency department throughput. Ann Intern Med. 2008;149(11):804-811. https://doi.org/10.7326/0003-4819-149-11-200812020-00006.
21. Howell E, Bessman E, Marshall R, Wright S. Hospitalist bed management effecting throughput from the emergency department to the intensive care unit. J Crit Care. 2010;25(2):184-189. https://doi.org/10.1016/j.jcrc.2009.08.004.
22. Howell EE, Bessman ES, Rubin HR. Hospitalists and an innovative emergency department admission process. J Gen Intern Med. 2004;19(3):266-268. https://doi.org/10.1111/j.1525-1497.2004.30431.x.
23. Briones A, Markoff B, Kathuria N, et al. A model of a hospitalist role in the care of admitted patients in the emergency department. J Hosp Med. 2010;5(6):360-364. https://doi.org/10.1002/jhm.636.
24. Auerbach J. Reducing emergency department patient boarding and submitting code help policies to the Department of Public Health. In: Executive Office of Health and Human Services. Boston: Department of Public Health; 2010.
© 2020 Society of Hospital Medicine
Antibiotics for Aspiration Pneumonia in Neurologically Impaired Children
Neurologic impairment (NI) encompasses static and progressive diseases of the central and/or peripheral nervous systems that result in functional and intellectual impairments.1 While a variety of neurologic diseases are responsible for NI (eg, hypoxic-ischemic encephalopathy, muscular dystrophy), consequences of these diseases extend beyond neurologic manifestations.1 These children are at an increased risk for aspiration of oral and gastric contents given their common comorbidities of dysphagia, gastroesophageal reflux, impaired cough, and respiratory muscle weakness.2 While aspiration may manifest as a self-resolving pneumonitis, the presence of oral or enteric bacteria in aspirated material may result in the development of bacterial pneumonia. Children with NI hospitalized with aspiration pneumonia have higher complication rates, longer and costlier hospitalizations, and higher readmission rates when compared with children with nonaspiration pneumonia.3
While pediatric aspiration pneumonia is commonly attributed to anaerobic bacteria, this is largely based on extrapolation from epidemiologic studies that were conducted in past decades.4-8 A single randomized controlled trial found that penicillin and clindamycin, antimicrobials with similar antimicrobial activity against anaerobes, to be equally effective.9 However, the recent literature emphasizes the polymicrobial nature of aspiration pneumonia in adults, with the common isolation of Gram-negative enteric bacteria.10 Further, while Pseudomonas aeruginosa is often identified in respiratory cultures from children with NI and chronic respiratory insufficiency,11,12 the significance of P. aeruginosa in lower airways remains unclear.
We designed this study to compare hospital outcomes associated with the most commonly prescribed empiric antimicrobial therapies for aspiration pneumonia in children with NI.
MATERIALS AND METHODS
Study Design and Data Source
This multicenter, retrospective cohort study used the Pediatric Health Information System (PHIS) database. PHIS, an administrative database of 50 not-for-profit tertiary care pediatric hospitals, contains data regarding patient demographics, diagnoses and procedures, and daily billed resource utilization, including laboratory and imaging studies. Data quality and reliability are assured through the Children’s Hospital Association (CHA; Lenexa, Kansas) and participating hospitals. Due to incomplete data through the study period and data quality issues, six hospitals were excluded.
STUDY POPULATION
Inclusion Criteria
Children 1-18 years of age who were discharged between July 1, 2007 and June 30, 2015 were included if they had a NI diagnosis,1 a principal diagnosis indicative of aspiration pneumonia (507.x),3,13,14 and received antibiotics in the first two calendar days of admission. NI was determined using previously defined International Classification of Diseases, Ninth Revision-Clinical Modification (ICD-9-CM) diagnosis codes.1 We only included children who received antibiotics in the first two calendar days of admission to minimize the likelihood of including children admitted for other reasons who acquired aspiration pneumonia after hospitalization. For children with multiple hospitalizations, one admission was randomly selected for inclusion to minimize weighting results toward repeat visits.
Exclusion Criteria
Children transferred from another hospital were excluded as records from their initial presentation, including treatment and outcomes, were not available. We also excluded children with tracheostomy15,16 or chronic ventilator dependence,17 those with a diagnosis of human immunodeficiency virus or tuberculosis, and children who received chemotherapy during hospitalization given expected differences in etiology, treatment, and outcomes.18
Exposure
The primary exposure was antibiotic therapy received in the first two days of admission. Antibiotics were classified by their antimicrobial spectra of activity as defined by The Sanford Guide to Antimicrobial Therapy19 against the most commonly recognized pathogens of aspiration pneumonia: anaerobes, Gram-negatives, and P. aeruginosa (Appendix Table 1).10,20 For example, penicillin G and clindamycin were among the antibiotics classified as providing anaerobic coverage alone, whereas ceftriaxone was classified as providing Gram-negative coverage alone and ampicillin-sulbactam or as combination therapy with clindamycin and ceftriaxone were classified as providing anaerobic and Gram-negative coverage. Piperacillin-tazobactam and meropenem were classified as providing anaerobic, Gram-negative, and P. aeruginosa coverage. We excluded antibiotics that do not provide coverage against anaerobes, Gram-negative, or P. aeruginosa (eg, ampicillin, azithromycin) or that provide coverage against Gram-negative and P. aeruginosa, but not anaerobes (eg, cefepime, tobramycin), as these therapies were prescribed for <5% of the cohort. We chose not to examine the coverage for Streptococcus pneumonia or Staphylococcus aureus as antibiotics included in this analysis covered these bacteria for 99.9% of our cohort.
OUTCOMES
Outcomes included acute respiratory failure during hospitalization, intensive care unit (ICU) transfer, and hospital length of stay (LOS). Acute respiratory failure during hospitalization was defined as the presence of Clinical Transaction Classification (CTC) or ICD-9 procedure code for noninvasive or invasive mechanical ventilation on day two or later of hospitalization, with or without the need for respiratory support on day 0 or day 1 (Appendix Table 2). Given the variability in hospital policies that may drive ICU admission criteria for complex patients, our outcome of ICU transfer was defined as the requirement for ICU level care on day two or later of hospitalization without ICU admission. Acute respiratory failure and ICU care occurring within the first two hospital days were not classified as outcomes because these early events likely reflect illness severity at presentation rather than outcomes attributable to treatment failure; these were included as markers of severity in the models.
Patient Demographics and Clinical Characteristics
Demographic and clinical characteristics that might influence antibiotic choice and/or hospital outcomes were assessed. Clinical characteristics included complex chronic conditions,21-23 medical technology assistance,24 performance of diagnostic testing, and markers of severe illness on presentation. Diagnostic testing included bacterial cultures (blood, respiratory, urine) and chest radiograph performance in the first two days of hospitalization. Results of diagnostic testing are not available in the PHIS. Illness severity on presentation included acute respiratory failure, pleural drainage, receipt of vasoactive agents, and transfusion of blood products in the first two days of hospitalization (Appendix Table 2).17,25,26
STASTICAL ANALYSIS
Continuous data were described with median and interquartile ranges (IQR) due to nonnormal distribution. Categorical data were described with frequencies and percentages. Patient demographics, clinical characteristics, and hospital outcomes were stratified by empiric antimicrobial coverage and compared using chi-square and Kruskal–Wallis tests as appropriate.
Generalized linear mixed-effects models with random hospital intercepts were derived to assess the independent effect of antimicrobial spectra of activity on outcomes of acute respiratory failure, ICU transfer, and LOS while adjusting for important differences in demographic and clinical characteristics. LOS had a nonnormal distribution. Thus, we used an exponential distribution. Covariates were chosen a priori given the clinical and biological relevance to exposure and outcomes—age, presence of complex chronic condition diagnoses, the number of complex chronic conditions, technology dependence, the performance of diagnostic tests on presentation, and illness severity on presentation. ICU admission was included as a covariate in acute respiratory failure and LOS outcome models. The results of the model for acute respiratory failure and ICU transfer are presented as adjusted odds ratios (OR) with a 95% CI. LOS results are presented as adjusted rate ratios (RR) with 95% CI.
All analyses were performed with SAS 9.3 (SAS Institute, Cary, North Carolina). P values <.05 were considered statistically significant. Cincinnati Children’s Hospital Medical Center Institutional Review Board considered this deidentified dataset study as not human subjects research.
RESULTS
Study Cohort
At the 44 hospitals included, 4,812 children with NI hospitalized with the diagnosis of aspiration pneumonia met the eligibility criteria. However, 79 received antibiotics with the spectra of activity not examined, leaving 4,733 children in our final analysis (Appendix Figure). Demographic and clinical characteristics of the study cohort are shown in Table 1. Median age was five years (interquartile range [IQR]: 2-11 years). Most subjects were male (53.9%), non-Hispanic white (47.9%), and publicly insured (63.6%). There was a slight variation in the distribution of admissions across seasons (spring 31.6%, summer 19.2%, fall 21.3%, and winter 27.9%). One-third of children had four or more comorbid CCCs (complex chronic conditions; 34.2%). The three most common nonneurologic CCC diagnosis categories were gastrointestinal (63.1%), congenital and/or genetic defects (36.9%), and respiratory (8.9%). Assistance with medical technologies was also common (82%)—particularly gastrointestinal (63.1%) and neurologic/neuromuscular (9.8%) technologies. The vast majority of children (92.5%) had either a chest radiograph (90.5%), respiratory viral study (33.7%), or respiratory culture (10.0%) obtained on presentation. A minority required noninvasive or invasive respiratory support (25.4%), vasoactive agents (8.9%), blood products (1.2%), or pleural drainage (0.3%) in the first two hospital days.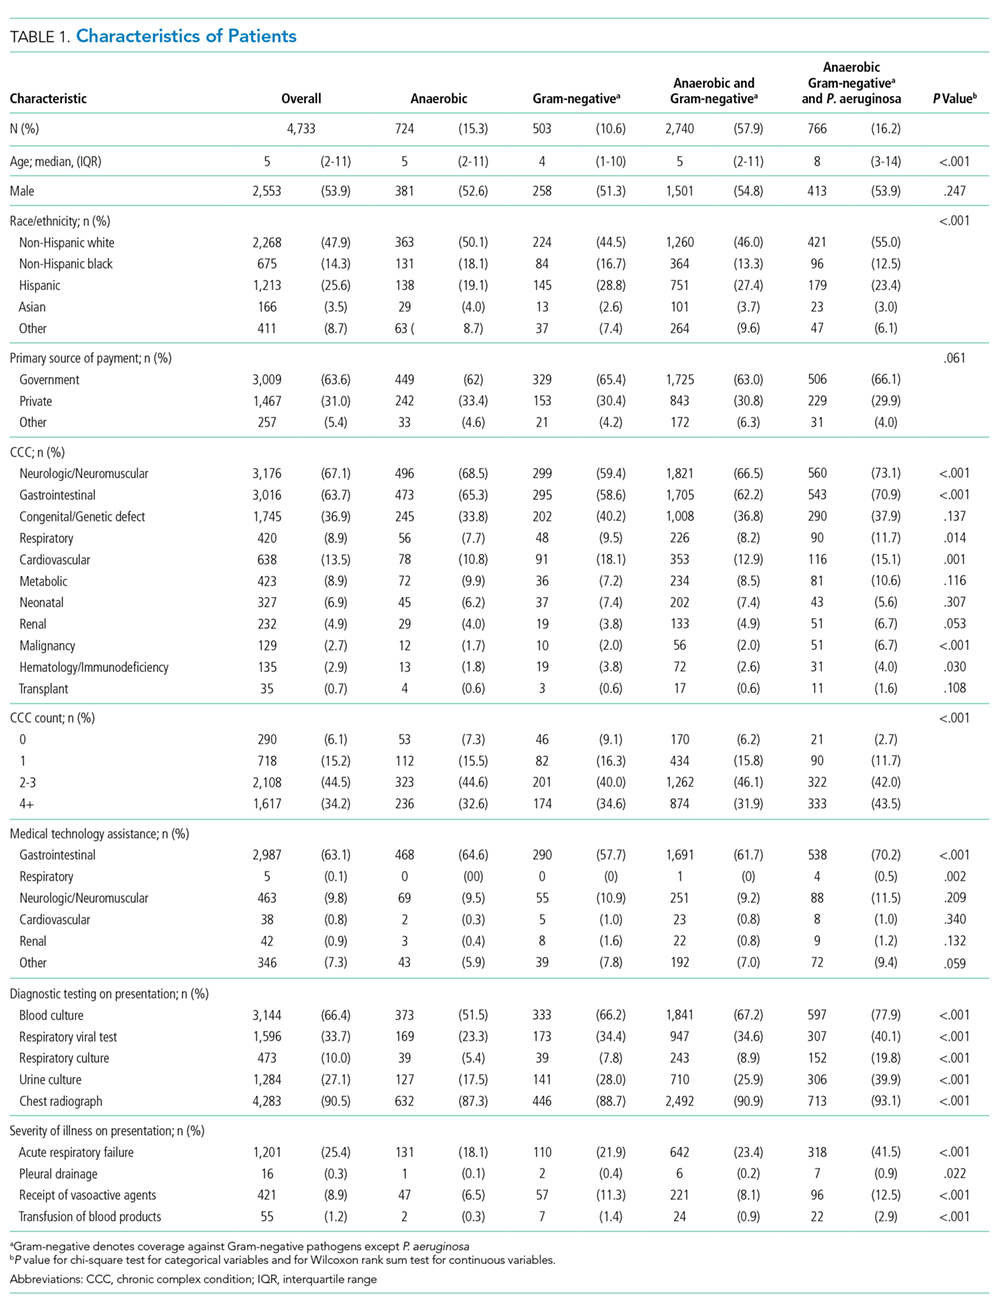
Spectrum of Antimicrobial Coverage
Most children (57.9%) received anaerobic and Gram-negative coverage; 16.2% received anaerobic, Gram-negative and P. aeruginosa coverage; 15.3% received anaerobic coverage alone; and 10.6% received Gram-negative coverage alone. Empiric antimicrobial coverage varied substantially across hospitals: anaerobic coverage was prescribed for 0%-44% of patients; Gram-negative coverage was prescribed for 3%-26% of patients; anaerobic and Gram-negative coverage was prescribed for 25%-90% of patients; and anaerobic, Gram-negative, and P. aeruginosa coverage was prescribed for 0%-65% of patients (Figure 1).
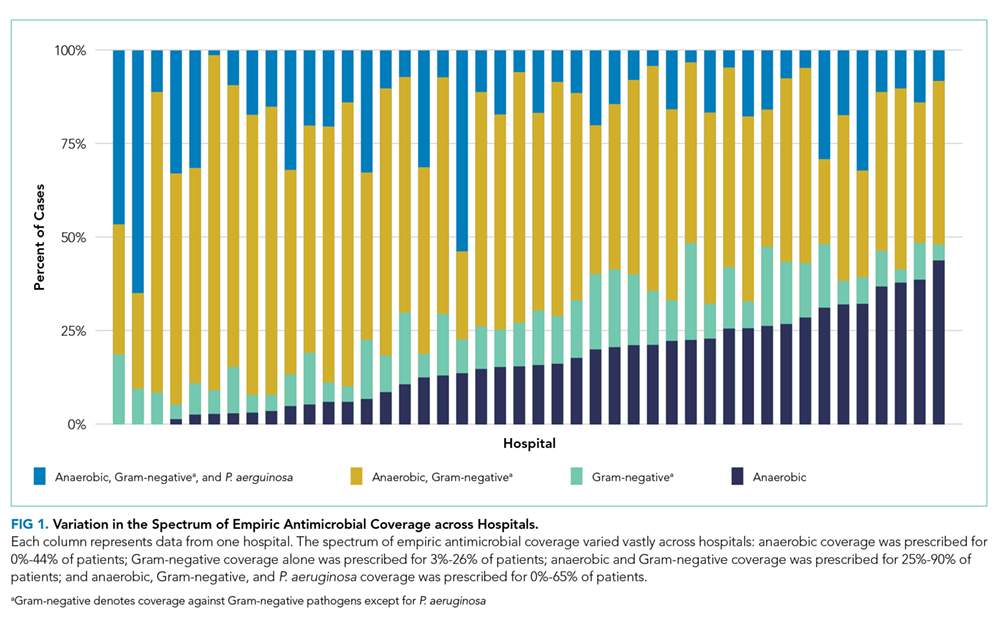
Outcomes
Acute Respiratory Failure
One-quarter (25.4%) of patients had acute respiratory failure on presentation; 22.5% required respiratory support (continued from presentation or were new) on day two or later of hospitalization (Table 2). In the adjusted analysis, children receiving Gram-negative coverage alone had two-fold greater odds (OR 2.15, 95% CI: 1.41-3.27) and children receiving anaerobic and Gram-negative coverage had 1.6-fold greater odds (OR 1.65, 95% CI: 1.19-2.28), of respiratory failure during hospitalization compared with those receiving anaerobic coverage alone (Figure 2). Odds of respiratory failure during hospitalization did not significantly differ for children receiving anaerobic, Gram-negative, and P. aeruginosa coverage compared with those receiving anaerobic coverage alone.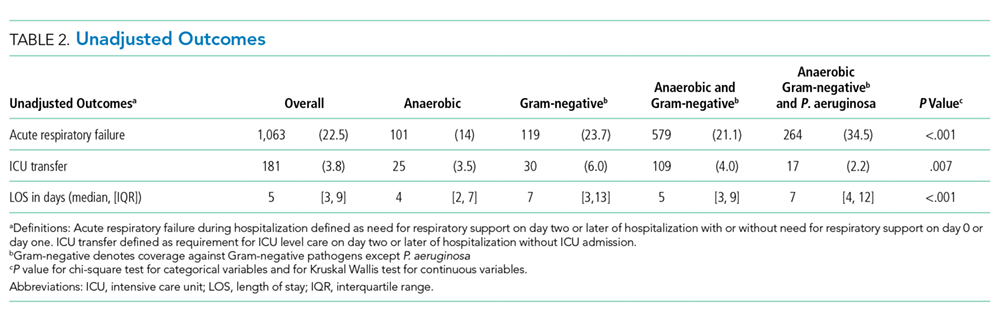
ICU Transfer
Nearly thirty percent (29.0%) of children required ICU admission, with an additional 3.8% requiring ICU transfer following admission (Table 2). In the multivariable analysis, the odds of an ICU transfer were greater for children receiving Gram-negative coverage alone (OR 1.80, 95% CI: 1.03-3.14) compared with those receiving anaerobic coverage alone. There was no statistical difference in ICU transfer for those receiving anaerobic and Gram-negative coverage (with or without P. aeruginosa coverage) compared with those receiving anaerobic coverage alone (Figure 2).
Length of Stay
Median hospital LOS for the total cohort was five days (IQR: 3-9 days; Table 2). In the multivariable analysis, children receiving Gram-negative coverage alone had a longer LOS (RR 1.28; 95% CI: 1.16-1.41) compared with those receiving anaerobic coverage alone, whereas children receiving anaerobic, Gram-negative, and P. aeruginosa coverage had a shorter LOS (RR 0.83; 95% CI: 0.76-0.90) than those receiving anaerobic coverage alone (Figure 2). There was no statistical difference in the LOS between children receiving anaerobic and Gram-negative coverage and those receiving anaerobic coverage alone.
DISCUSSION
In this multicenter study of children with NI hospitalized with aspiration pneumonia, we found substantial variation in empiric antimicrobial coverage for children with aspiration pneumonia. When comparing outcomes across groups, children who received anaerobic and Gram-negative coverage had outcomes similar to children who received anaerobic therapy alone. However, children who did not receive anaerobic coverage (ie, Gram-negative coverage alone) had worse outcomes, most notably a greater than two-fold increase in the odds of experiencing acute respiratory failure during hospitalization when compared with children receiving anaerobic therapy. These findings support prior literature that has highlighted the importance of anaerobic therapy in the treatment of aspiration pneumonia. The benefit of antibiotics targeting Gram-negative organisms, in addition to anaerobes, remains uncertain.
The variability in empiric antimicrobial coverage likely reflects the paucity of available information on oral and/or enteric bacteria required to identify them as causative organisms in aspiration pneumonia. In part, this problem is due to the difficulty in obtaining adequate sputum for culture from pediatric patients.27 While it may be more feasible to obtain tracheal aspirates for respiratory culture in children with a tracheostomy, interpretation of culture results remains challenging because the lower airways of children with tracheostomy are commonly colonized with bacterial pathogens.28 Thus, physicians are often left to choose empiric antimicrobial coverage with inadequate supporting evidence.29 Although the polymicrobial nature of aspiration pneumonia is well recognized in adult and pediatric literature,10,30 it is less clear which organisms are of pathological significance and require treatment.
The treatment standard for aspiration pneumonia has long included anaerobic therapy.29 The worse outcomes of children not receiving anaerobic therapy (ie, Gram-negative coverage alone) compared with children who received anaerobic therapy support the continued importance of anaerobic therapy in the treatment of aspiration pneumonia for hospitalized children with NI. The role of antibiotics covering Gram-negative organisms is less clear. Recent studies suggest the role of anaerobes is overemphasized in the etiology and treatment of aspiration pneumonia.10,29,31-38 Multiple studies on aspiration pneumonia bacteriology in hospitalized adults have demonstrated a predominance of Gram-negative organisms (ranging from 37%-71% of isolates identified on respiratory culture) and a relative scarcity of anaerobes (ranging from 0%-16% of isolates).31-37 A prospective study of 50 children hospitalized with clinical and radiographic evidence of pneumonia with known aspiration risk (eg, neuromuscular disease or dysphagia) found that ~80% of 163 bacterial isolates were Gram-negative.38 However, this study included repeat cultures from the same children, and thus, may overestimate the prevalence of Gram-negative organisms. In our study, children who received both anaerobic and Gram-negative therapy had no differences in ICU transfer or LOS but did experience higher odds of acute respiratory failure. As these results may be due to unmeasured confounding, future studies should further explore the necessity of Gram-negative coverage in addition to anaerobic coverage in this population.
While these recent studies may seem to suggest that anaerobic coverage is not necessary for aspiration pneumonia, there are important limitations worth noting. First, these studies used a variety of sampling techniques. While organisms grown from samples obtained via bronchoalveolar lavage31-34,36 are likely pathogenic, those grown from tracheal or oral samples obtained via percutaneous transtracheal aspiration,34 a protected specimen brush,34,36,37 or expectorated sputum35,38 may not represent lower airway organisms. Second, anaerobic cultures were not obtained in all studies.31,34,38 Anaerobic organisms are difficult to isolate using traditional clinical specimen collection techniques and aerobic culture media.18 Furthermore, anaerobes are not easily recovered from lung infections after the receipt of antibiotic therapy.39 Details regarding pretreatment, which are largely lacking from these studies, are necessary to interpret the relative scarcity of anaerobes on respiratory culture. Finally, caution should be taken when extrapolating the results of studies focused on the etiology and treatment of aspiration pneumonia in elderly adults to children. Our results, particularly in the context of the limitation of these more recent studies, suggest that the role of anaerobes has been underestimated.
Recent studies examining populations of children with cerebral palsy and/or tracheostomy have emphasized the high rates of carriage and infection rates with Gram-negative and drug-resistant bacteria; in particular, P. aeruginosa accounts for 50%-72% of pathogenic bacteria.11,12,38,40
Our multicenter observational study has several limitations. We used diagnosis codes to identify patients with aspiration pneumonia. As validated clinical criteria for the diagnosis of aspiration pneumonia do not exist, clinicians may assign a diagnosis of and treatment for aspiration pneumonia by subjective suspicion based on a child’s severe NI or illness severity on presentation leading to selection bias. Although administrative data are not able to verify pneumonia type with absolute certainty, we previously demonstrated that the differences in the outcomes of children with aspiration and nonaspiration pneumonia diagnosis codes persist after accounting for the complexity that might influence the diagnosis.3
Frthermore, we were unable to account for laboratory, microbiology, or radiology test results, and other management practices (eg, frequency of airway clearance, previous antimicrobial therapy) that may influence outcomes. Future studies should certainly include an examination of the concordance of the antibiotics prescribed with causative organisms, as this undoubtedly affects patient outcomes. Other outcomes are important to examine (eg, time to return to respiratory baseline), but we were unable to do so, given the lack of clinical detail in our database. We randomly selected a single hospitalization for children with multiple admissions; alternative methods could have different results. Although children with NI predominately use children’s hospitals,1 results may not be generalizable.
CONCLUSION
These findings support prior literature that has highlighted the important role anaerobic therapy plays in the treatment of aspiration pneumonia in children with NI. In light of the limitations of our study design, we believe that rigorous clinical trials comparing anaerobic with anaerobic and Gram-negative therapy are an important and necessary next step to determine the optimal treatment for aspiration pneumonia in this population.
Disclosures
The authors do not have any financial relationships relevant to this article to disclose.
Funding
Dr. Thomson was supported by the Agency for Healthcare Research and Quality (AHRQ) under award number K08HS025138. Dr. Ambroggio was supported by the National Institute for Allergy and Infectious Diseases (NIAID) under award number K01AI125413. The content is solely the responsibility of the authors and does not necessarily represent the official views of the AHRQ or NIAID.
1. Berry JG, Poduri A, Bonkowsky JL, et al. Trends in resource utilization by children with neurological impairment in the United States inpatient health care system: a repeat cross-sectional study. PLoS Med. 2012;9(1):e1001158. https://doi.org/10.1371/journal.pmed.1001158.
2. Seddon PC, Khan Y. Respiratory problems in children with neurological impairment. Arch Dis Child. 2003;88(1):75-78. https://doi.org/10.1136/adc.88.1.75.
3. Thomson J, Hall M, Ambroggio L, et al. Aspiration and non-aspiration pneumonia in hospitalized children with neurologic impairment. Pediatrics. 2016;137(2):e20151612. https://doi.org/10.1542/peds.2015-1612.
4. Brook I. Anaerobic pulmonary infections in children. Pediatr Emerg Care. 2004;20(9):636-640. https://doi.org/10.1097/01.pec.0000139751.63624.0b.
5. Bartlett JG, Gorbach SL. Treatment of aspiration pneumonia and primary lung abscess. Penicillin G vs clindamycin. JAMA. 1975;234(9):935-937. https://doi.org/10.1001/jamadermatol.2017.0297.
6. Bartlett JG, Gorbach SL, Finegold SM. The bacteriology of aspiration pneumonia. Am J Med. 1974;56(2):202-207. https://doi.org/10.1016/0002-9343(74)90598-1.
7. Lode H. Microbiological and clinical aspects of aspiration pneumonia. J Antimicrob Chemother. 1988;21:83-90. https://doi.org/10.1093/jac/21.suppl_c.83.
8. Brook I. Treatment of aspiration or tracheostomy-associated pneumonia in neurologically impaired children: effect of antimicrobials effective against anaerobic bacteria. Int J Pediatr Otorhinolaryngol. 1996;35(2):171-177. https://doi.org/10.1016/0165-5876(96)01332-8.
9. Jacobson SJ, Griffiths K, Diamond S, et al. A randomized controlled trial of penicillin vs clindamycin for the treatment of aspiration pneumonia in children. Arch Pediatr Adolesc Med. 1997;151(7):701-704. https://doi.org/10.1001/archpedi.1997.02170440063011.
10. DiBardino DM, Wunderink RG. Aspiration pneumonia: a review of modern trends. J Crit Care. 2015;30(1):40-48. https://doi.org/10.1016/j.jcrc.2014.07.011.
11. Gerdung CA, Tsang A, Yasseen AS, 3rd, Armstrong K, McMillan HJ, Kovesi T. Association between chronic aspiration and chronic airway infection with Pseudomonas aeruginosa and other Gram-negative bacteria in children with cerebral palsy. Lung. 2016;194(2):307-314. https://doi.org/10.1007/s00408-016-9856-5.
12. Thorburn K, Jardine M, Taylor N, Reilly N, Sarginson RE, van Saene HK. Antibiotic-resistant bacteria and infection in children with cerebral palsy requiring mechanical ventilation. Pedr Crit Care Med. 2009;10(2):222-226. https://doi.org/10.1097/PCC.0b013e31819368ac.
13. Lanspa MJ, Jones BE, Brown SM, Dean NC. Mortality, morbidity, and disease severity of patients with aspiration pneumonia. J Hosp Med. 2013;8(2):83-90. https://doi.org/10.1002/jhm.1996.
14. Lanspa MJ, Peyrani P, Wiemken T, Wilson EL, Ramirez JA, Dean NC. Characteristics associated with clinician diagnosis of aspiration pneumonia: a descriptive study of afflicted patients and their outcomes. J Hosp Med. 2015;10(2):90-96. https://doi.org/10.1002/jhm.2280.
15. Berry JG, Graham RJ, Roberson DW, et al. Patient characteristics associated with in-hospital mortality in children following tracheotomy. Arch Dis Child. 2010;95(9):703-710.
16. Berry JG, Graham DA, Graham RJ, et al. Predictors of clinical outcomes and hospital resource use of children after tracheotomy. Pediatrics. 2009;124(2):563-572. https://doi.org/10.1136/adc.2009.180836.
17. Balamuth F, Weiss SL, Hall M, et al. Identifying pediatric severe sepsis and septic shock: Accuracy of diagnosis codes. J Pediatr. 2015;167(6):1295-1300 e1294. https://doi.org/10.1016/j.jpeds.2015.09.027.
18. American Academy of Pediatrics., Pickering LK, American Academy of Pediatrics. Committee on Infectious Diseases. In: Red book : 2012 report of the Committee on Infectious Diseases. 29th ed. Elk Grove Village: American Academy of Pediatrics; 2012.
19. Gilbert DN. The Sanford Guide to Antimicrobial Therapy 2014. 44th ed. Sperryville: Antimicrobial Therapy, Inc; 2011.
20. Marik PE. Aspiration pneumonitis and aspiration pneumonia. N Engl J Med. 2001;344(9):665-671. https://doi.org/10.1056/NEJM200103013440908.
21. Feudtner C, Feinstein JA, Zhong W, Hall M, Dai D. Pediatric complex chronic conditions classification system version 2: updated for ICD-10 and complex medical technology dependence and transplantation. BMC Pediatrics. 2014;14:199. https://doi.org/10.1186/1471-2431-14-199.
22. Feudtner C, Hays RM, Haynes G, Geyer JR, Neff JM, Koepsell TD. Deaths attributed to pediatric complex chronic conditions: national trends and implications for supportive care services. Pediatrics. 2001;107(6):E99. https://doi.org/10.1542/peds.107.6.e99.
23. Feinstein JA, Russell S, DeWitt PE, Feudtner C, Dai D, Bennett TD. R package for pediatric complex chronic condition classification. JAMA Pediatr. 2018;172(6):596-598. https://doi.org/10.1001/jamapediatrics.2018.0256.
24. Berry JG, Hall DE, Kuo DZ, Cohen E, Agrawal R, Feudtner C, Hall M, Kueser J, Kaplan W, Neff J. Hospital utilization and characteristics of patients experiencing recurrent readmissions within children’s hospitals. JAMA. 2011;305(7):682-690. https://doi.org/10.1001/jama.2011.122.
25. Shah SS, Hall M, Newland JG, et al. Comparative effectiveness of pleural drainage procedures for the treatment of complicated pneumonia in childhood. J Hosp Med. 2011;6(5):256-263. https://doi.org/10.1002/jhm.872.
26. Child Health Corporation of America. CTC™ 2010 Code Structure: Module 5 Clinical Services. 2010 January 4; Available at https://sharepoint.chca.com/CHCAForums/PerformanceImprovement/PHIS/Reference Library/CTC Resources/Forms/AllItems.aspx Version: Modified.
27. Bradley JS, Byington CL, Shah SS, et al. The management of community-acquired pneumonia in infants and children older than 3 months of age: clinical practice guidelines by the Pediatric Infectious Diseases Society and the Infectious Diseases Society of America. Clin Infect Dis. 2011;53(7):e25-76. https://doi.org/10.1093/cid/cir531.
28. Brook I. Bacterial colonization, tracheobronchitis, and pneumonia following tracheostomy and long-term intubation in pediatric patients. Chest. 1979;76(4):420-424.
29. Waybright RA, Coolidge W, Johnson TJ. Treatment of clinical aspiration: a reappraisal. Am J Health Syst Pharm. 2013;70(15):1291-1300. https://doi.org/10.2146/ajhp120319.
30. Brook I, Finegold SM. Bacteriology of aspiration pneumonia in children. Pediatrics. 1980;65(6):1115-1120.
31. Wei C, Cheng Z, Zhang L, Yang J. Microbiology and prognostic factors of hospital- and community-acquired aspiration pneumonia in respiratory intensive care unit. Am J Infect Control. 2013;41(10):880-884. https://doi.org/10.1016/j.ajic.2013.01.007.
32. El-Solh AA, Pietrantoni C, Bhat A, et al. Microbiology of severe aspiration pneumonia in institutionalized elderly. Am J Respir Crit Care Med. 2003;167(12):1650-1654. https://doi.org/10.1164/rccm.200212-1543OC.
33. Tokuyasu H, Harada T, Watanabe E, et al. Effectiveness of meropenem for the treatment of aspiration pneumonia in elderly patients. Intern Med. 2009;48(3):129-135. https://doi.org/10.2169/internalmedicine.48.1308.
34. Ott SR, Allewelt M, Lorenz J, Reimnitz P, Lode H, German Lung Abscess Study Group. Moxifloxacin vs ampicillin/sulbactam in aspiration pneumonia and primary lung abscess. Infection. 2008;36(1):23-30. https://doi.org/10.1007/s15010-007-7043-6.
35. Kadowaki M, Demura Y, Mizuno S, et al. Reappraisal of clindamycin IV monotherapy for treatment of mild-to-moderate aspiration pneumonia in elderly patients. Chest. 2005;127(4):1276-1282. https://doi.org/10.1016/j.chest.2017.05.019.
36. Marik PE, Careau P. The role of anaerobes in patients with ventilator-associated pneumonia and aspiration pneumonia: a prospective study. Chest. 1999;115(1):178-183. https://doi.org/10.1378/chest.115.1.178.
37. Mier L, Dreyfuss D, Darchy B, et al. Is penicillin G an adequate initial treatment for aspiration pneumonia? A prospective evaluation using a protected specimen brush and quantitative cultures. Intensive Care Med. 1993;19(5):279-284. https://doi.org/10.1007/bf01690548.
38. Ashkenazi-Hoffnung L, Ari A, Bilavsky E, Scheuerman O, Amir J, Prais D. Pseudomonas aeruginosa identified as a key pathogen in hospitalised children with aspiration pneumonia and a high aspiration risk. Acta Paediatr. 2016;105(12):e588-e592. https://doi.org/10.1111/apa.13523.
39. Bartlett JG, Gorbach SL, Tally FP, Finegold SM. Bacteriology and treatment of primary lung abscess. Am Rev Respir Dis. 1974;109(5):510-518. https://doi.org/10.1164/arrd.1974.109.5.510.
40. Russell CJ, Simon TD, Mamey MR, Newth CJL, Neely MN. Pseudomonas aeruginosa and post-tracheotomy bacterial respiratory tract infection readmissions. Pediatr Pulmonol. 2017;52(9):1212-1218. https://doi.org/10.1002/ppul.23716.
41. Russell CJ, Mamey MR, Koh JY, Schrager SM, Neely MN, Wu S. Length of stay and hospital revisit after bacterial tracheostomy-associated respiratory tract infection hospitalizations. Hosp Pediatr. Hosp Pediatr. 2018;8(2):72-80. https://doi.org/10.1542/hpeds.2017-0106.
42. Russell CJ, Mack WJ, Schrager SM, Wu S. Care variations and outcomes for children hospitalized with bacterial tracheostomy-associated respiratory infections. Hosp Pediatr. 2017;7(1):16-23. https://doi.org/10.1542/hpeds.2016-0104.
Neurologic impairment (NI) encompasses static and progressive diseases of the central and/or peripheral nervous systems that result in functional and intellectual impairments.1 While a variety of neurologic diseases are responsible for NI (eg, hypoxic-ischemic encephalopathy, muscular dystrophy), consequences of these diseases extend beyond neurologic manifestations.1 These children are at an increased risk for aspiration of oral and gastric contents given their common comorbidities of dysphagia, gastroesophageal reflux, impaired cough, and respiratory muscle weakness.2 While aspiration may manifest as a self-resolving pneumonitis, the presence of oral or enteric bacteria in aspirated material may result in the development of bacterial pneumonia. Children with NI hospitalized with aspiration pneumonia have higher complication rates, longer and costlier hospitalizations, and higher readmission rates when compared with children with nonaspiration pneumonia.3
While pediatric aspiration pneumonia is commonly attributed to anaerobic bacteria, this is largely based on extrapolation from epidemiologic studies that were conducted in past decades.4-8 A single randomized controlled trial found that penicillin and clindamycin, antimicrobials with similar antimicrobial activity against anaerobes, to be equally effective.9 However, the recent literature emphasizes the polymicrobial nature of aspiration pneumonia in adults, with the common isolation of Gram-negative enteric bacteria.10 Further, while Pseudomonas aeruginosa is often identified in respiratory cultures from children with NI and chronic respiratory insufficiency,11,12 the significance of P. aeruginosa in lower airways remains unclear.
We designed this study to compare hospital outcomes associated with the most commonly prescribed empiric antimicrobial therapies for aspiration pneumonia in children with NI.
MATERIALS AND METHODS
Study Design and Data Source
This multicenter, retrospective cohort study used the Pediatric Health Information System (PHIS) database. PHIS, an administrative database of 50 not-for-profit tertiary care pediatric hospitals, contains data regarding patient demographics, diagnoses and procedures, and daily billed resource utilization, including laboratory and imaging studies. Data quality and reliability are assured through the Children’s Hospital Association (CHA; Lenexa, Kansas) and participating hospitals. Due to incomplete data through the study period and data quality issues, six hospitals were excluded.
STUDY POPULATION
Inclusion Criteria
Children 1-18 years of age who were discharged between July 1, 2007 and June 30, 2015 were included if they had a NI diagnosis,1 a principal diagnosis indicative of aspiration pneumonia (507.x),3,13,14 and received antibiotics in the first two calendar days of admission. NI was determined using previously defined International Classification of Diseases, Ninth Revision-Clinical Modification (ICD-9-CM) diagnosis codes.1 We only included children who received antibiotics in the first two calendar days of admission to minimize the likelihood of including children admitted for other reasons who acquired aspiration pneumonia after hospitalization. For children with multiple hospitalizations, one admission was randomly selected for inclusion to minimize weighting results toward repeat visits.
Exclusion Criteria
Children transferred from another hospital were excluded as records from their initial presentation, including treatment and outcomes, were not available. We also excluded children with tracheostomy15,16 or chronic ventilator dependence,17 those with a diagnosis of human immunodeficiency virus or tuberculosis, and children who received chemotherapy during hospitalization given expected differences in etiology, treatment, and outcomes.18
Exposure
The primary exposure was antibiotic therapy received in the first two days of admission. Antibiotics were classified by their antimicrobial spectra of activity as defined by The Sanford Guide to Antimicrobial Therapy19 against the most commonly recognized pathogens of aspiration pneumonia: anaerobes, Gram-negatives, and P. aeruginosa (Appendix Table 1).10,20 For example, penicillin G and clindamycin were among the antibiotics classified as providing anaerobic coverage alone, whereas ceftriaxone was classified as providing Gram-negative coverage alone and ampicillin-sulbactam or as combination therapy with clindamycin and ceftriaxone were classified as providing anaerobic and Gram-negative coverage. Piperacillin-tazobactam and meropenem were classified as providing anaerobic, Gram-negative, and P. aeruginosa coverage. We excluded antibiotics that do not provide coverage against anaerobes, Gram-negative, or P. aeruginosa (eg, ampicillin, azithromycin) or that provide coverage against Gram-negative and P. aeruginosa, but not anaerobes (eg, cefepime, tobramycin), as these therapies were prescribed for <5% of the cohort. We chose not to examine the coverage for Streptococcus pneumonia or Staphylococcus aureus as antibiotics included in this analysis covered these bacteria for 99.9% of our cohort.
OUTCOMES
Outcomes included acute respiratory failure during hospitalization, intensive care unit (ICU) transfer, and hospital length of stay (LOS). Acute respiratory failure during hospitalization was defined as the presence of Clinical Transaction Classification (CTC) or ICD-9 procedure code for noninvasive or invasive mechanical ventilation on day two or later of hospitalization, with or without the need for respiratory support on day 0 or day 1 (Appendix Table 2). Given the variability in hospital policies that may drive ICU admission criteria for complex patients, our outcome of ICU transfer was defined as the requirement for ICU level care on day two or later of hospitalization without ICU admission. Acute respiratory failure and ICU care occurring within the first two hospital days were not classified as outcomes because these early events likely reflect illness severity at presentation rather than outcomes attributable to treatment failure; these were included as markers of severity in the models.
Patient Demographics and Clinical Characteristics
Demographic and clinical characteristics that might influence antibiotic choice and/or hospital outcomes were assessed. Clinical characteristics included complex chronic conditions,21-23 medical technology assistance,24 performance of diagnostic testing, and markers of severe illness on presentation. Diagnostic testing included bacterial cultures (blood, respiratory, urine) and chest radiograph performance in the first two days of hospitalization. Results of diagnostic testing are not available in the PHIS. Illness severity on presentation included acute respiratory failure, pleural drainage, receipt of vasoactive agents, and transfusion of blood products in the first two days of hospitalization (Appendix Table 2).17,25,26
STASTICAL ANALYSIS
Continuous data were described with median and interquartile ranges (IQR) due to nonnormal distribution. Categorical data were described with frequencies and percentages. Patient demographics, clinical characteristics, and hospital outcomes were stratified by empiric antimicrobial coverage and compared using chi-square and Kruskal–Wallis tests as appropriate.
Generalized linear mixed-effects models with random hospital intercepts were derived to assess the independent effect of antimicrobial spectra of activity on outcomes of acute respiratory failure, ICU transfer, and LOS while adjusting for important differences in demographic and clinical characteristics. LOS had a nonnormal distribution. Thus, we used an exponential distribution. Covariates were chosen a priori given the clinical and biological relevance to exposure and outcomes—age, presence of complex chronic condition diagnoses, the number of complex chronic conditions, technology dependence, the performance of diagnostic tests on presentation, and illness severity on presentation. ICU admission was included as a covariate in acute respiratory failure and LOS outcome models. The results of the model for acute respiratory failure and ICU transfer are presented as adjusted odds ratios (OR) with a 95% CI. LOS results are presented as adjusted rate ratios (RR) with 95% CI.
All analyses were performed with SAS 9.3 (SAS Institute, Cary, North Carolina). P values <.05 were considered statistically significant. Cincinnati Children’s Hospital Medical Center Institutional Review Board considered this deidentified dataset study as not human subjects research.
RESULTS
Study Cohort
At the 44 hospitals included, 4,812 children with NI hospitalized with the diagnosis of aspiration pneumonia met the eligibility criteria. However, 79 received antibiotics with the spectra of activity not examined, leaving 4,733 children in our final analysis (Appendix Figure). Demographic and clinical characteristics of the study cohort are shown in Table 1. Median age was five years (interquartile range [IQR]: 2-11 years). Most subjects were male (53.9%), non-Hispanic white (47.9%), and publicly insured (63.6%). There was a slight variation in the distribution of admissions across seasons (spring 31.6%, summer 19.2%, fall 21.3%, and winter 27.9%). One-third of children had four or more comorbid CCCs (complex chronic conditions; 34.2%). The three most common nonneurologic CCC diagnosis categories were gastrointestinal (63.1%), congenital and/or genetic defects (36.9%), and respiratory (8.9%). Assistance with medical technologies was also common (82%)—particularly gastrointestinal (63.1%) and neurologic/neuromuscular (9.8%) technologies. The vast majority of children (92.5%) had either a chest radiograph (90.5%), respiratory viral study (33.7%), or respiratory culture (10.0%) obtained on presentation. A minority required noninvasive or invasive respiratory support (25.4%), vasoactive agents (8.9%), blood products (1.2%), or pleural drainage (0.3%) in the first two hospital days.
Spectrum of Antimicrobial Coverage
Most children (57.9%) received anaerobic and Gram-negative coverage; 16.2% received anaerobic, Gram-negative and P. aeruginosa coverage; 15.3% received anaerobic coverage alone; and 10.6% received Gram-negative coverage alone. Empiric antimicrobial coverage varied substantially across hospitals: anaerobic coverage was prescribed for 0%-44% of patients; Gram-negative coverage was prescribed for 3%-26% of patients; anaerobic and Gram-negative coverage was prescribed for 25%-90% of patients; and anaerobic, Gram-negative, and P. aeruginosa coverage was prescribed for 0%-65% of patients (Figure 1).
Outcomes
Acute Respiratory Failure
One-quarter (25.4%) of patients had acute respiratory failure on presentation; 22.5% required respiratory support (continued from presentation or were new) on day two or later of hospitalization (Table 2). In the adjusted analysis, children receiving Gram-negative coverage alone had two-fold greater odds (OR 2.15, 95% CI: 1.41-3.27) and children receiving anaerobic and Gram-negative coverage had 1.6-fold greater odds (OR 1.65, 95% CI: 1.19-2.28), of respiratory failure during hospitalization compared with those receiving anaerobic coverage alone (Figure 2). Odds of respiratory failure during hospitalization did not significantly differ for children receiving anaerobic, Gram-negative, and P. aeruginosa coverage compared with those receiving anaerobic coverage alone.
ICU Transfer
Nearly thirty percent (29.0%) of children required ICU admission, with an additional 3.8% requiring ICU transfer following admission (Table 2). In the multivariable analysis, the odds of an ICU transfer were greater for children receiving Gram-negative coverage alone (OR 1.80, 95% CI: 1.03-3.14) compared with those receiving anaerobic coverage alone. There was no statistical difference in ICU transfer for those receiving anaerobic and Gram-negative coverage (with or without P. aeruginosa coverage) compared with those receiving anaerobic coverage alone (Figure 2).
Length of Stay
Median hospital LOS for the total cohort was five days (IQR: 3-9 days; Table 2). In the multivariable analysis, children receiving Gram-negative coverage alone had a longer LOS (RR 1.28; 95% CI: 1.16-1.41) compared with those receiving anaerobic coverage alone, whereas children receiving anaerobic, Gram-negative, and P. aeruginosa coverage had a shorter LOS (RR 0.83; 95% CI: 0.76-0.90) than those receiving anaerobic coverage alone (Figure 2). There was no statistical difference in the LOS between children receiving anaerobic and Gram-negative coverage and those receiving anaerobic coverage alone.
DISCUSSION
In this multicenter study of children with NI hospitalized with aspiration pneumonia, we found substantial variation in empiric antimicrobial coverage for children with aspiration pneumonia. When comparing outcomes across groups, children who received anaerobic and Gram-negative coverage had outcomes similar to children who received anaerobic therapy alone. However, children who did not receive anaerobic coverage (ie, Gram-negative coverage alone) had worse outcomes, most notably a greater than two-fold increase in the odds of experiencing acute respiratory failure during hospitalization when compared with children receiving anaerobic therapy. These findings support prior literature that has highlighted the importance of anaerobic therapy in the treatment of aspiration pneumonia. The benefit of antibiotics targeting Gram-negative organisms, in addition to anaerobes, remains uncertain.
The variability in empiric antimicrobial coverage likely reflects the paucity of available information on oral and/or enteric bacteria required to identify them as causative organisms in aspiration pneumonia. In part, this problem is due to the difficulty in obtaining adequate sputum for culture from pediatric patients.27 While it may be more feasible to obtain tracheal aspirates for respiratory culture in children with a tracheostomy, interpretation of culture results remains challenging because the lower airways of children with tracheostomy are commonly colonized with bacterial pathogens.28 Thus, physicians are often left to choose empiric antimicrobial coverage with inadequate supporting evidence.29 Although the polymicrobial nature of aspiration pneumonia is well recognized in adult and pediatric literature,10,30 it is less clear which organisms are of pathological significance and require treatment.
The treatment standard for aspiration pneumonia has long included anaerobic therapy.29 The worse outcomes of children not receiving anaerobic therapy (ie, Gram-negative coverage alone) compared with children who received anaerobic therapy support the continued importance of anaerobic therapy in the treatment of aspiration pneumonia for hospitalized children with NI. The role of antibiotics covering Gram-negative organisms is less clear. Recent studies suggest the role of anaerobes is overemphasized in the etiology and treatment of aspiration pneumonia.10,29,31-38 Multiple studies on aspiration pneumonia bacteriology in hospitalized adults have demonstrated a predominance of Gram-negative organisms (ranging from 37%-71% of isolates identified on respiratory culture) and a relative scarcity of anaerobes (ranging from 0%-16% of isolates).31-37 A prospective study of 50 children hospitalized with clinical and radiographic evidence of pneumonia with known aspiration risk (eg, neuromuscular disease or dysphagia) found that ~80% of 163 bacterial isolates were Gram-negative.38 However, this study included repeat cultures from the same children, and thus, may overestimate the prevalence of Gram-negative organisms. In our study, children who received both anaerobic and Gram-negative therapy had no differences in ICU transfer or LOS but did experience higher odds of acute respiratory failure. As these results may be due to unmeasured confounding, future studies should further explore the necessity of Gram-negative coverage in addition to anaerobic coverage in this population.
While these recent studies may seem to suggest that anaerobic coverage is not necessary for aspiration pneumonia, there are important limitations worth noting. First, these studies used a variety of sampling techniques. While organisms grown from samples obtained via bronchoalveolar lavage31-34,36 are likely pathogenic, those grown from tracheal or oral samples obtained via percutaneous transtracheal aspiration,34 a protected specimen brush,34,36,37 or expectorated sputum35,38 may not represent lower airway organisms. Second, anaerobic cultures were not obtained in all studies.31,34,38 Anaerobic organisms are difficult to isolate using traditional clinical specimen collection techniques and aerobic culture media.18 Furthermore, anaerobes are not easily recovered from lung infections after the receipt of antibiotic therapy.39 Details regarding pretreatment, which are largely lacking from these studies, are necessary to interpret the relative scarcity of anaerobes on respiratory culture. Finally, caution should be taken when extrapolating the results of studies focused on the etiology and treatment of aspiration pneumonia in elderly adults to children. Our results, particularly in the context of the limitation of these more recent studies, suggest that the role of anaerobes has been underestimated.
Recent studies examining populations of children with cerebral palsy and/or tracheostomy have emphasized the high rates of carriage and infection rates with Gram-negative and drug-resistant bacteria; in particular, P. aeruginosa accounts for 50%-72% of pathogenic bacteria.11,12,38,40
Our multicenter observational study has several limitations. We used diagnosis codes to identify patients with aspiration pneumonia. As validated clinical criteria for the diagnosis of aspiration pneumonia do not exist, clinicians may assign a diagnosis of and treatment for aspiration pneumonia by subjective suspicion based on a child’s severe NI or illness severity on presentation leading to selection bias. Although administrative data are not able to verify pneumonia type with absolute certainty, we previously demonstrated that the differences in the outcomes of children with aspiration and nonaspiration pneumonia diagnosis codes persist after accounting for the complexity that might influence the diagnosis.3
Frthermore, we were unable to account for laboratory, microbiology, or radiology test results, and other management practices (eg, frequency of airway clearance, previous antimicrobial therapy) that may influence outcomes. Future studies should certainly include an examination of the concordance of the antibiotics prescribed with causative organisms, as this undoubtedly affects patient outcomes. Other outcomes are important to examine (eg, time to return to respiratory baseline), but we were unable to do so, given the lack of clinical detail in our database. We randomly selected a single hospitalization for children with multiple admissions; alternative methods could have different results. Although children with NI predominately use children’s hospitals,1 results may not be generalizable.
CONCLUSION
These findings support prior literature that has highlighted the important role anaerobic therapy plays in the treatment of aspiration pneumonia in children with NI. In light of the limitations of our study design, we believe that rigorous clinical trials comparing anaerobic with anaerobic and Gram-negative therapy are an important and necessary next step to determine the optimal treatment for aspiration pneumonia in this population.
Disclosures
The authors do not have any financial relationships relevant to this article to disclose.
Funding
Dr. Thomson was supported by the Agency for Healthcare Research and Quality (AHRQ) under award number K08HS025138. Dr. Ambroggio was supported by the National Institute for Allergy and Infectious Diseases (NIAID) under award number K01AI125413. The content is solely the responsibility of the authors and does not necessarily represent the official views of the AHRQ or NIAID.
1. Berry JG, Poduri A, Bonkowsky JL, et al. Trends in resource utilization by children with neurological impairment in the United States inpatient health care system: a repeat cross-sectional study. PLoS Med. 2012;9(1):e1001158. https://doi.org/10.1371/journal.pmed.1001158.
2. Seddon PC, Khan Y. Respiratory problems in children with neurological impairment. Arch Dis Child. 2003;88(1):75-78. https://doi.org/10.1136/adc.88.1.75.
3. Thomson J, Hall M, Ambroggio L, et al. Aspiration and non-aspiration pneumonia in hospitalized children with neurologic impairment. Pediatrics. 2016;137(2):e20151612. https://doi.org/10.1542/peds.2015-1612.
4. Brook I. Anaerobic pulmonary infections in children. Pediatr Emerg Care. 2004;20(9):636-640. https://doi.org/10.1097/01.pec.0000139751.63624.0b.
5. Bartlett JG, Gorbach SL. Treatment of aspiration pneumonia and primary lung abscess. Penicillin G vs clindamycin. JAMA. 1975;234(9):935-937. https://doi.org/10.1001/jamadermatol.2017.0297.
6. Bartlett JG, Gorbach SL, Finegold SM. The bacteriology of aspiration pneumonia. Am J Med. 1974;56(2):202-207. https://doi.org/10.1016/0002-9343(74)90598-1.
7. Lode H. Microbiological and clinical aspects of aspiration pneumonia. J Antimicrob Chemother. 1988;21:83-90. https://doi.org/10.1093/jac/21.suppl_c.83.
8. Brook I. Treatment of aspiration or tracheostomy-associated pneumonia in neurologically impaired children: effect of antimicrobials effective against anaerobic bacteria. Int J Pediatr Otorhinolaryngol. 1996;35(2):171-177. https://doi.org/10.1016/0165-5876(96)01332-8.
9. Jacobson SJ, Griffiths K, Diamond S, et al. A randomized controlled trial of penicillin vs clindamycin for the treatment of aspiration pneumonia in children. Arch Pediatr Adolesc Med. 1997;151(7):701-704. https://doi.org/10.1001/archpedi.1997.02170440063011.
10. DiBardino DM, Wunderink RG. Aspiration pneumonia: a review of modern trends. J Crit Care. 2015;30(1):40-48. https://doi.org/10.1016/j.jcrc.2014.07.011.
11. Gerdung CA, Tsang A, Yasseen AS, 3rd, Armstrong K, McMillan HJ, Kovesi T. Association between chronic aspiration and chronic airway infection with Pseudomonas aeruginosa and other Gram-negative bacteria in children with cerebral palsy. Lung. 2016;194(2):307-314. https://doi.org/10.1007/s00408-016-9856-5.
12. Thorburn K, Jardine M, Taylor N, Reilly N, Sarginson RE, van Saene HK. Antibiotic-resistant bacteria and infection in children with cerebral palsy requiring mechanical ventilation. Pedr Crit Care Med. 2009;10(2):222-226. https://doi.org/10.1097/PCC.0b013e31819368ac.
13. Lanspa MJ, Jones BE, Brown SM, Dean NC. Mortality, morbidity, and disease severity of patients with aspiration pneumonia. J Hosp Med. 2013;8(2):83-90. https://doi.org/10.1002/jhm.1996.
14. Lanspa MJ, Peyrani P, Wiemken T, Wilson EL, Ramirez JA, Dean NC. Characteristics associated with clinician diagnosis of aspiration pneumonia: a descriptive study of afflicted patients and their outcomes. J Hosp Med. 2015;10(2):90-96. https://doi.org/10.1002/jhm.2280.
15. Berry JG, Graham RJ, Roberson DW, et al. Patient characteristics associated with in-hospital mortality in children following tracheotomy. Arch Dis Child. 2010;95(9):703-710.
16. Berry JG, Graham DA, Graham RJ, et al. Predictors of clinical outcomes and hospital resource use of children after tracheotomy. Pediatrics. 2009;124(2):563-572. https://doi.org/10.1136/adc.2009.180836.
17. Balamuth F, Weiss SL, Hall M, et al. Identifying pediatric severe sepsis and septic shock: Accuracy of diagnosis codes. J Pediatr. 2015;167(6):1295-1300 e1294. https://doi.org/10.1016/j.jpeds.2015.09.027.
18. American Academy of Pediatrics., Pickering LK, American Academy of Pediatrics. Committee on Infectious Diseases. In: Red book : 2012 report of the Committee on Infectious Diseases. 29th ed. Elk Grove Village: American Academy of Pediatrics; 2012.
19. Gilbert DN. The Sanford Guide to Antimicrobial Therapy 2014. 44th ed. Sperryville: Antimicrobial Therapy, Inc; 2011.
20. Marik PE. Aspiration pneumonitis and aspiration pneumonia. N Engl J Med. 2001;344(9):665-671. https://doi.org/10.1056/NEJM200103013440908.
21. Feudtner C, Feinstein JA, Zhong W, Hall M, Dai D. Pediatric complex chronic conditions classification system version 2: updated for ICD-10 and complex medical technology dependence and transplantation. BMC Pediatrics. 2014;14:199. https://doi.org/10.1186/1471-2431-14-199.
22. Feudtner C, Hays RM, Haynes G, Geyer JR, Neff JM, Koepsell TD. Deaths attributed to pediatric complex chronic conditions: national trends and implications for supportive care services. Pediatrics. 2001;107(6):E99. https://doi.org/10.1542/peds.107.6.e99.
23. Feinstein JA, Russell S, DeWitt PE, Feudtner C, Dai D, Bennett TD. R package for pediatric complex chronic condition classification. JAMA Pediatr. 2018;172(6):596-598. https://doi.org/10.1001/jamapediatrics.2018.0256.
24. Berry JG, Hall DE, Kuo DZ, Cohen E, Agrawal R, Feudtner C, Hall M, Kueser J, Kaplan W, Neff J. Hospital utilization and characteristics of patients experiencing recurrent readmissions within children’s hospitals. JAMA. 2011;305(7):682-690. https://doi.org/10.1001/jama.2011.122.
25. Shah SS, Hall M, Newland JG, et al. Comparative effectiveness of pleural drainage procedures for the treatment of complicated pneumonia in childhood. J Hosp Med. 2011;6(5):256-263. https://doi.org/10.1002/jhm.872.
26. Child Health Corporation of America. CTC™ 2010 Code Structure: Module 5 Clinical Services. 2010 January 4; Available at https://sharepoint.chca.com/CHCAForums/PerformanceImprovement/PHIS/Reference Library/CTC Resources/Forms/AllItems.aspx Version: Modified.
27. Bradley JS, Byington CL, Shah SS, et al. The management of community-acquired pneumonia in infants and children older than 3 months of age: clinical practice guidelines by the Pediatric Infectious Diseases Society and the Infectious Diseases Society of America. Clin Infect Dis. 2011;53(7):e25-76. https://doi.org/10.1093/cid/cir531.
28. Brook I. Bacterial colonization, tracheobronchitis, and pneumonia following tracheostomy and long-term intubation in pediatric patients. Chest. 1979;76(4):420-424.
29. Waybright RA, Coolidge W, Johnson TJ. Treatment of clinical aspiration: a reappraisal. Am J Health Syst Pharm. 2013;70(15):1291-1300. https://doi.org/10.2146/ajhp120319.
30. Brook I, Finegold SM. Bacteriology of aspiration pneumonia in children. Pediatrics. 1980;65(6):1115-1120.
31. Wei C, Cheng Z, Zhang L, Yang J. Microbiology and prognostic factors of hospital- and community-acquired aspiration pneumonia in respiratory intensive care unit. Am J Infect Control. 2013;41(10):880-884. https://doi.org/10.1016/j.ajic.2013.01.007.
32. El-Solh AA, Pietrantoni C, Bhat A, et al. Microbiology of severe aspiration pneumonia in institutionalized elderly. Am J Respir Crit Care Med. 2003;167(12):1650-1654. https://doi.org/10.1164/rccm.200212-1543OC.
33. Tokuyasu H, Harada T, Watanabe E, et al. Effectiveness of meropenem for the treatment of aspiration pneumonia in elderly patients. Intern Med. 2009;48(3):129-135. https://doi.org/10.2169/internalmedicine.48.1308.
34. Ott SR, Allewelt M, Lorenz J, Reimnitz P, Lode H, German Lung Abscess Study Group. Moxifloxacin vs ampicillin/sulbactam in aspiration pneumonia and primary lung abscess. Infection. 2008;36(1):23-30. https://doi.org/10.1007/s15010-007-7043-6.
35. Kadowaki M, Demura Y, Mizuno S, et al. Reappraisal of clindamycin IV monotherapy for treatment of mild-to-moderate aspiration pneumonia in elderly patients. Chest. 2005;127(4):1276-1282. https://doi.org/10.1016/j.chest.2017.05.019.
36. Marik PE, Careau P. The role of anaerobes in patients with ventilator-associated pneumonia and aspiration pneumonia: a prospective study. Chest. 1999;115(1):178-183. https://doi.org/10.1378/chest.115.1.178.
37. Mier L, Dreyfuss D, Darchy B, et al. Is penicillin G an adequate initial treatment for aspiration pneumonia? A prospective evaluation using a protected specimen brush and quantitative cultures. Intensive Care Med. 1993;19(5):279-284. https://doi.org/10.1007/bf01690548.
38. Ashkenazi-Hoffnung L, Ari A, Bilavsky E, Scheuerman O, Amir J, Prais D. Pseudomonas aeruginosa identified as a key pathogen in hospitalised children with aspiration pneumonia and a high aspiration risk. Acta Paediatr. 2016;105(12):e588-e592. https://doi.org/10.1111/apa.13523.
39. Bartlett JG, Gorbach SL, Tally FP, Finegold SM. Bacteriology and treatment of primary lung abscess. Am Rev Respir Dis. 1974;109(5):510-518. https://doi.org/10.1164/arrd.1974.109.5.510.
40. Russell CJ, Simon TD, Mamey MR, Newth CJL, Neely MN. Pseudomonas aeruginosa and post-tracheotomy bacterial respiratory tract infection readmissions. Pediatr Pulmonol. 2017;52(9):1212-1218. https://doi.org/10.1002/ppul.23716.
41. Russell CJ, Mamey MR, Koh JY, Schrager SM, Neely MN, Wu S. Length of stay and hospital revisit after bacterial tracheostomy-associated respiratory tract infection hospitalizations. Hosp Pediatr. Hosp Pediatr. 2018;8(2):72-80. https://doi.org/10.1542/hpeds.2017-0106.
42. Russell CJ, Mack WJ, Schrager SM, Wu S. Care variations and outcomes for children hospitalized with bacterial tracheostomy-associated respiratory infections. Hosp Pediatr. 2017;7(1):16-23. https://doi.org/10.1542/hpeds.2016-0104.
© 2019 Society of Hospital Medicine
Transfusion-related lung injury is on the rise in elderly patients
SAN ANTONIO – Although there has been a general decline in transfusion-related anaphylaxis and acute infections over time among hospitalized older adults in the United States, incidence rates for both transfusion-related acute lung injury and transfusion-associated circulatory overload have risen over the last decade, according to researchers from the Food and Drug Administration.

Mikhail Menis, PharmD, an epidemiologist at the FDA Center for Biologics Evaluation and Research (CBER) and colleagues queried large Medicare databases to assess trends in transfusion-related adverse events among adults aged 65 years and older.
The investigators saw “substantially higher risk of all outcomes among immunocompromised beneficiaries, which could be related to higher blood use of all blood components, especially platelets, underlying conditions such as malignancies, and treatments such as chemotherapy or radiation, which need further investigation,” Dr. Menis said at the annual meeting of AABB, the group formerly known as the American Association of Blood Banks.
He reported data from a series of studies on four categories of transfusion-related events that may be life-threatening or fatal: transfusion-related anaphylaxis (TRA), transfusion-related acute lung injury (TRALI), transfusion-associated circulatory overload (TACO), and acute infection following transfusion (AIFT).
For each type of event, the researchers looked at overall incidence and the incidence by immune status, calendar year, blood components transfused, number of units transfused, age, sex, and race.
Anaphylaxis (TRA)
TRA may be caused by preformed immunoglobin E (IgE) antibodies to proteins in the plasma in transfused blood products or by preformed IgA antibodies in patients who are likely IgA deficient, Dr. Menis said.
The overall incidence of TRA among 8,833,817 inpatient transfusions stays for elderly beneficiaries from 2012 through 2018 was 7.1 per 100,000 stays. The rate was higher for immunocompromised patients, at 9.6, than it was among nonimmunocompromised patients, at 6.5.
The rates varied by every subgroup measured except immune status. Annual rates showed a downward trend, from 8.7 per 100,000 in 2012, to 5.1 in 2017 and 6.4 in 2018. The decline in occurrence may be caused by a decline in inpatient blood utilization during the study period, particularly among immunocompromised patients.
TRA rates increased with five or more units transfused. The risk was significantly reduced in the oldest group of patients versus the youngest (P less than .001), which supports the immune-based mechanism of action of anaphylaxis, Dr. Menis said.
They also found that TRA rates were substantially higher among patients who had received platelet and/or plasma transfusions, compared with patients who received only red blood cells (RBCs).
Additionally, risk for TRA was significantly higher among men than it was among women (9.3 vs. 5.4) and among white versus nonwhite patients (7.8 vs. 3.8).
The evidence suggested TRA cases are likely to be severe in this population, with inpatient mortality of 7.1%, and hospital stays of 7 days or longer in about 58% of cases, indicating the importance of TRA prevention, Dr. Menis said.
The investigators plan to perform multivariate regression analyses to assess potential risk factors, including underlying comorbidities and health histories for TRA occurrence for both the overall population and by immune status.
Acute lung injury (TRALI)
TRALI is a rare but serious adverse event, a clinical syndrome with onset within 6 hours of transfusion that presents as acute hypoxemia, respiratory distress, and noncardiogenic pulmonary edema.
Among 17,771,193 total inpatient transfusion stays, the overall incidence of TRALI was 33.2 per 100,000. The rate was 55.9 for immunocompromised patients versus 28.4 for nonimmunocompromised patients. The rate ratio was 2.0 (P less than .001).
The difference by immune status may be caused by higher blood utilizations with more units transfused per stay among immunocompromised patients, a higher incidence of prior transfusions among these patients, higher use of irradiated blood components that may lead to accumulation of proinflammatory mediators in blood products during storage, or underlying comorbidities.
The overall rate increased from 14.3 in 2007 to 56.4 in 2018. The rates increased proportionally among both immunocompromised and nonimmunocompromised patients.
As with TRA, the incidence of TRALI was higher in patients with five or more units transfused, while the incidence declined with age, likely caused by declining blood use and age-related changes in neutrophil function, Dr. Menis said.
TRALI rates were slightly higher among men than among women, as well as higher among white patients than among nonwhite patients.
Overall, TRALI rates were higher for patients who received platelets either alone or in combination with RBCs and/or plasma. The highest rates were among patients who received RBCs, plasma and platelets.
Dr. Menis called for studies to determine what effects the processing and storage of blood components may have on TRALI occurrence; he and his colleagues also are planning regression analyses to assess potential risk factors for this complication.
Circulatory overload (TACO)
TACO is one of the leading reported causes of transfusion-related fatalities in the U.S., with onset usually occurring within 6 hours of transfusion, presenting as acute respiratory distress with dyspnea, orthopnea, increased blood pressure, and cardiogenic pulmonary edema.
The overall incidence of TACO among hospitalized patients aged 65 years and older from 2011 through 2018 was 86.3 per 100,000 stays. The incidences were 128.3 in immunocompromised and 76.0 in nonimmunocompromised patients. The rate ratio for TACO in immunocompromised versus nonimmunocompromised patients was 1.70 (P less than .001).
Overall incidence rates of TACO rose from 62 per 100,000 stays in 2011 to 119.8 in 2018. As with other adverse events, incident rates rose with the number of units transfused.
Rates of TACO were significantly higher among women than they were among men (94.6 vs. 75.9 per 100,000; P less than .001), which could be caused by the higher mean age of women and/or a lower tolerance for increased blood volume from transfusion.
The study results also suggested that TACO and TRALI may coexist, based on evidence that 3.5% of all TACO stays also had diagnostic codes for TRALI. The frequency of co-occurrence of these two adverse events also increased over time, which may be caused by improved awareness, Dr. Menis said.
Infections (AIFT)
Acute infections following transfusion can lead to prolonged hospitalizations, sepsis, septic shock, and death. Those most at risk include elderly and immunocompromised patients because of high utilization of blood products, comorbidities, and decreased immune function.
Among 8,833,817 stays, the overall rate per 100,000 stays was 2.1. The rate for immunocompromised patients was 5.4, compared with 1.2 for nonimmunocompromised patients, for a rate ratio of 4.4 (P less than .001).
The incidence rate declined significantly (P = .03) over the study period, with the 3 latest years having the lowest rates.
Rates increased substantially among immunocompromised patients by the number of units transfused, but remained relatively stable among nonimmunocompromised patients.
Infection rates declined with age, from 2.7 per 100,000 stays for patients aged 65-68 years to 1.2 per 100,000 for those aged 85 years and older.
As with other adverse events, AIFT rates were likely related to the blood components transfused, with substantially higher rates for stays during which platelets were transfused either alone or with RBCs, compared with RBCs alone. This could be caused by the room-temperature storage of platelets and higher number of platelets units transfused, compared with RBCs alone, especially among immunocompromised patients.
In all, 51.9% of AIFT cases also had sepsis noted in the medical record, indicating high severity and emphasizing the importance of AIFT prevention, Dr. Menis said.
The studies were funded by the FDA, and Dr. Menis is an FDA employee. He reported having no conflicts of interest.
SAN ANTONIO – Although there has been a general decline in transfusion-related anaphylaxis and acute infections over time among hospitalized older adults in the United States, incidence rates for both transfusion-related acute lung injury and transfusion-associated circulatory overload have risen over the last decade, according to researchers from the Food and Drug Administration.
Mikhail Menis, PharmD, an epidemiologist at the FDA Center for Biologics Evaluation and Research (CBER) and colleagues queried large Medicare databases to assess trends in transfusion-related adverse events among adults aged 65 years and older.
The investigators saw “substantially higher risk of all outcomes among immunocompromised beneficiaries, which could be related to higher blood use of all blood components, especially platelets, underlying conditions such as malignancies, and treatments such as chemotherapy or radiation, which need further investigation,” Dr. Menis said at the annual meeting of AABB, the group formerly known as the American Association of Blood Banks.
He reported data from a series of studies on four categories of transfusion-related events that may be life-threatening or fatal: transfusion-related anaphylaxis (TRA), transfusion-related acute lung injury (TRALI), transfusion-associated circulatory overload (TACO), and acute infection following transfusion (AIFT).
For each type of event, the researchers looked at overall incidence and the incidence by immune status, calendar year, blood components transfused, number of units transfused, age, sex, and race.
Anaphylaxis (TRA)
TRA may be caused by preformed immunoglobin E (IgE) antibodies to proteins in the plasma in transfused blood products or by preformed IgA antibodies in patients who are likely IgA deficient, Dr. Menis said.
The overall incidence of TRA among 8,833,817 inpatient transfusions stays for elderly beneficiaries from 2012 through 2018 was 7.1 per 100,000 stays. The rate was higher for immunocompromised patients, at 9.6, than it was among nonimmunocompromised patients, at 6.5.
The rates varied by every subgroup measured except immune status. Annual rates showed a downward trend, from 8.7 per 100,000 in 2012, to 5.1 in 2017 and 6.4 in 2018. The decline in occurrence may be caused by a decline in inpatient blood utilization during the study period, particularly among immunocompromised patients.
TRA rates increased with five or more units transfused. The risk was significantly reduced in the oldest group of patients versus the youngest (P less than .001), which supports the immune-based mechanism of action of anaphylaxis, Dr. Menis said.
They also found that TRA rates were substantially higher among patients who had received platelet and/or plasma transfusions, compared with patients who received only red blood cells (RBCs).
Additionally, risk for TRA was significantly higher among men than it was among women (9.3 vs. 5.4) and among white versus nonwhite patients (7.8 vs. 3.8).
The evidence suggested TRA cases are likely to be severe in this population, with inpatient mortality of 7.1%, and hospital stays of 7 days or longer in about 58% of cases, indicating the importance of TRA prevention, Dr. Menis said.
The investigators plan to perform multivariate regression analyses to assess potential risk factors, including underlying comorbidities and health histories for TRA occurrence for both the overall population and by immune status.
Acute lung injury (TRALI)
TRALI is a rare but serious adverse event, a clinical syndrome with onset within 6 hours of transfusion that presents as acute hypoxemia, respiratory distress, and noncardiogenic pulmonary edema.
Among 17,771,193 total inpatient transfusion stays, the overall incidence of TRALI was 33.2 per 100,000. The rate was 55.9 for immunocompromised patients versus 28.4 for nonimmunocompromised patients. The rate ratio was 2.0 (P less than .001).
The difference by immune status may be caused by higher blood utilizations with more units transfused per stay among immunocompromised patients, a higher incidence of prior transfusions among these patients, higher use of irradiated blood components that may lead to accumulation of proinflammatory mediators in blood products during storage, or underlying comorbidities.
The overall rate increased from 14.3 in 2007 to 56.4 in 2018. The rates increased proportionally among both immunocompromised and nonimmunocompromised patients.
As with TRA, the incidence of TRALI was higher in patients with five or more units transfused, while the incidence declined with age, likely caused by declining blood use and age-related changes in neutrophil function, Dr. Menis said.
TRALI rates were slightly higher among men than among women, as well as higher among white patients than among nonwhite patients.
Overall, TRALI rates were higher for patients who received platelets either alone or in combination with RBCs and/or plasma. The highest rates were among patients who received RBCs, plasma and platelets.
Dr. Menis called for studies to determine what effects the processing and storage of blood components may have on TRALI occurrence; he and his colleagues also are planning regression analyses to assess potential risk factors for this complication.
Circulatory overload (TACO)
TACO is one of the leading reported causes of transfusion-related fatalities in the U.S., with onset usually occurring within 6 hours of transfusion, presenting as acute respiratory distress with dyspnea, orthopnea, increased blood pressure, and cardiogenic pulmonary edema.
The overall incidence of TACO among hospitalized patients aged 65 years and older from 2011 through 2018 was 86.3 per 100,000 stays. The incidences were 128.3 in immunocompromised and 76.0 in nonimmunocompromised patients. The rate ratio for TACO in immunocompromised versus nonimmunocompromised patients was 1.70 (P less than .001).
Overall incidence rates of TACO rose from 62 per 100,000 stays in 2011 to 119.8 in 2018. As with other adverse events, incident rates rose with the number of units transfused.
Rates of TACO were significantly higher among women than they were among men (94.6 vs. 75.9 per 100,000; P less than .001), which could be caused by the higher mean age of women and/or a lower tolerance for increased blood volume from transfusion.
The study results also suggested that TACO and TRALI may coexist, based on evidence that 3.5% of all TACO stays also had diagnostic codes for TRALI. The frequency of co-occurrence of these two adverse events also increased over time, which may be caused by improved awareness, Dr. Menis said.
Infections (AIFT)
Acute infections following transfusion can lead to prolonged hospitalizations, sepsis, septic shock, and death. Those most at risk include elderly and immunocompromised patients because of high utilization of blood products, comorbidities, and decreased immune function.
Among 8,833,817 stays, the overall rate per 100,000 stays was 2.1. The rate for immunocompromised patients was 5.4, compared with 1.2 for nonimmunocompromised patients, for a rate ratio of 4.4 (P less than .001).
The incidence rate declined significantly (P = .03) over the study period, with the 3 latest years having the lowest rates.
Rates increased substantially among immunocompromised patients by the number of units transfused, but remained relatively stable among nonimmunocompromised patients.
Infection rates declined with age, from 2.7 per 100,000 stays for patients aged 65-68 years to 1.2 per 100,000 for those aged 85 years and older.
As with other adverse events, AIFT rates were likely related to the blood components transfused, with substantially higher rates for stays during which platelets were transfused either alone or with RBCs, compared with RBCs alone. This could be caused by the room-temperature storage of platelets and higher number of platelets units transfused, compared with RBCs alone, especially among immunocompromised patients.
In all, 51.9% of AIFT cases also had sepsis noted in the medical record, indicating high severity and emphasizing the importance of AIFT prevention, Dr. Menis said.
The studies were funded by the FDA, and Dr. Menis is an FDA employee. He reported having no conflicts of interest.
REPORTING FROM AABB 2019
Storytelling tool can assist elderly in the ICU
SAN FRANCISCO – A “Best Case/Worst Case” (BCWC) framework tool has been adapted for use with geriatric trauma patients in the ICU, where it can help track a patient’s progress and enable better communication with patients and loved ones. The tool relies on a combination of graphics and text that surgeons update daily during rounds, and creates a longitudinal view of a patient’s trajectory during their stay in the ICU.
– for example, after a complication has arisen.
“Each day during rounds, the ICU team records important events on the graphic aid that change the patient’s course. The team draws a star to represent the best case, and a line to represent prognostic uncertainty. The attending trauma surgeon then uses the geriatric trauma outcome score, their knowledge of the health state of the patient, and their own clinical experience to tell a story about treatments, recovery, and outcomes if everything goes as well as we might hope. This story is written down in the best-case scenario box,” Christopher Zimmerman, MD, a general surgery resident at the University of Wisconsin–Madison, said during a presentation about the BCWC tool at the annual clinical congress of the American College of Surgeons
“We often like to talk to patients and their families [about best- and worst-case scenarios] anyway, but [the research team] have tried to formalize it,” said Tam Pham, MD, professor of surgery at the University of Washington, in an interview. Dr. Pham comoderated the session where the research was presented.
“When we’re able to communicate where the uncertainty is and where the boundaries are around the course of care and possible outcomes, we can build an alliance with patients and families that will be helpful when there is a big decision to make, say about a laparotomy for a perforated viscus,” said Dr. Zimmerman.
Dr. Zimmerman gave an example of a patient who came into the ICU after suffering multiple fractures from falling down a set of stairs. The team created an initial BCWC with a hoped-for best-case scenario. Later, the patient developed hypoxemic respiratory failure and had to be intubated overnight. “This event is recorded on the graphic, and her star representing the best case has changed position, the line representing uncertainty has shortened, and the contents of her best-case scenario has changed. Each day in rounds, this process is repeated,” said Dr. Zimmerman.
Palliative care physicians, education experts, and surgeons at the University of Wisconsin–Madison developed the tool in an effort to reduce unwanted care at the end of life, in the context of high-risk surgeries. The researchers adapted the tool to the trauma setting by gathering six focus groups of trauma practitioners at the University of Wisconsin; University of Texas, Dallas; and Oregon Health & Science University, Portland. They modified the tool after incorporating comments, and then iteratively modified it through tasks carried out in the ICU as part of a qualitative improvement initiative at the University of Wisconsin–Madison. They generated a change to the tool, implemented it in the ICU during subsequent rounds, then collected observations and field notes, then revised and repeated the process, streamlining it to fit into the ICU environment, according to Dr. Zimmerman.
The back side of the tool is available for family members to write important details about their loved ones, leading insight into the patient’s personality and desires, such as favorite music or affection for a family pet.
The work was supported by the National Institutes of Health. Dr. Zimmerman and Dr. Pham have no relevant financial disclosures.
SOURCE: Zimmerman C et al. Clinical Congress 2019, Abstract.
REPORTING FROM CLINICAL CONGRESS 2019
Short-course DAA therapy may prevent hepatitis transmission in transplant patients
BOSTON – A short course of results of a recent study show.
The regimen, given right before transplantation and for 7 days afterward, reduced the cost of direct-acting antiviral (DAA) therapy and allowed patients to complete hepatitis C virus (HCV) therapy before hospital discharge, according to authors of the study, which was presented at the annual meeting of the American Association for the Study of Liver Diseases.
If confirmed in subsequent studies, this regimen could become the standard of care for donor-positive, recipient-negative transplantation, said lead study author Jordan J. Feld, MD, R. Phelan Chair in translational liver disease research at the University of Toronto and research director at the Toronto Centre for Liver Disease.
“Transplant recipients are understandably nervous about accepting organs from people with HCV infection,” said Dr. Feld in a press release. “This very short therapy allows them to leave hospital free of HCV, which is a huge benefit. Not only is it cheaper and likely safer, but the patients really prefer not having to worry about HCV with all of the other challenges after a transplant.”
Results of this study come at a time when the proportion of overdose death organ donors is on the rise, from just 1% in 2000 to 15% in 2016, according to Dr. Feld. Overdose deaths account for the largest percentage of HCV-infected donors, most of whom are young and often otherwise healthy, he added.
Recipients of HCV-infected organs can be cured after transplant as a number of studies have previously shown. However, preventing transmission would be better than cure, Dr. Feld said, in part because of issues with drug-drug interactions, potential for relapse, and issues with procuring the drugs after transplant.
Accordingly, Dr. Feld and colleagues sought to evaluate “preemptive” treatment with DAA therapy combined with ezetimibe, which they said has been shown to inhibit HCV entry blockers. The recipients, who were listed for heart, lung, kidney, or kidney-pancreas transplant, were given glecaprevir/pibrentasvir plus ezetimibe starting 6-12 hours prior to transplantation, and then daily for 7 days.
The median age was 36 years for the 16 donors reported, and 61 years for the 25 recipients. Most recipients (12 patients) had a lung transplant, while 8 had a heart transplant, 4 had a kidney transplant, and 1 had a kidney-pancreas transplant.
There were no virologic failures, according to the investigators, with sustained virologic response (SVR) after 6 weeks in 7 patients, and SVR after 12 weeks in the remaining 18. Three recipients did have detectable HCV RNA, though all cleared and had SVR at 6 weeks in one case, and SVR at 12 weeks in the other two, according to the investigators’ report.
Of 22 serious adverse events noted in the study, 1 was considered treatment related, according to the report, and there were 2 deaths among lung transplant patients, caused by sepsis in 1 case to sepsis and subarachnoid hemorrhage in another.
It’s not clear whether ezetimibe is needed in this short-duration regimen, but in any case, it is well tolerated and inexpensive, and so there is “minimal downside” to include it, Dr. Feld and coinvestigators wrote in their report.
Dr. Feld reported disclosures related to Abbvie, Abbott, Enanta Pharmaceuticals, Gilead, Janssen, Merck, and Roche.
SOURCE: Feld JJ et al. The Liver Meeting 2019, Abstract 38.
REPORTING FROM THE LIVER MEETING 2019
Strategy critical to surviving drug shortages
NATIONAL HARBOR, MD. –
“Statistically speaking, there is no proof that patients are worse off from drug shortages,” Matt Grissinger, RPh, director of error-reporting programs at the Institute for Safe Medication Practices, told the audience at the annual conference of the Academy of Managed Care Pharmacy. The data and anecdotes he presented suggest the contrary.
As Mr. Grissinger pointed out, drug shortages can create a sequela of events that stress health care workers seeking to find the next-best available and most appropriate therapy for their patients. In the process, numerous medication-related errors can occur, resulting in patient harm, including adverse drug events and even death.
One potential problems is erroneous or inappropriate drug substitution stemming from mis- or uncalculated doses because of factors such as incorrect labeling and lack of knowledge regarding acceptable therapeutic interchanges. Other potential errors include non–therapeutically equivalent drug substitutions, resulting in supraoptimal therapy or overdoses, and unfamiliarity with drug labeling from outsourced facilities.
As a result, patients may experience worse outcomes as a consequence of the drug shortage: Worsening of the disease, disease prolongation, side effects stemming from alternative drug selections, untreated pain, psychological effects, severe electrolyte imbalances, severe acid/base imbalances, and death.
While a paper trail can help piece together clues regarding how a medication error occurred, documentation or lack thereof can also introduce errors when drug shortages occur.
Any changes to a drug order or prescription that deviate from the prescriber’s original request require prescriber approval but can still create opportunities for error. While documenting these changes and updating labeling is essential, appropriate documentation does not always occur and raises the question of who is responsible for making such changes.
Drug shortages also challenge a clinician’s professional judgment. Mr. Grissinger cited an example in which a nurse used half of a 0.5-mg single-use vial of promethazine for a patient requiring a 0.25 mg dose. The nurse wrote on the label that the remainder should be saved. While the vial was manufactured for one-time use, whether to discard the unused contents in a situation of drug shortages required the nurse to make a judgment call. In this case, the nurse chose to save the balance of the drug – a choice Mr. Grissinger stated he might have made had he been in a similar situation.
Additionally, drug shortages can create a climate in which more ethical questions arise – especially with regard to disease states such as cancer.
“If you only have 10 vials of vincristine, who gets it?” Mr. Grissinger asked the audience.
To help answer these difficult life-or-death questions, hospital settings need to engage the ethics committees and social workers.
While education plays a vital role in bringing attention to and addressing errors stemming from drug shortages, Mr. Grissinger cautioned the audience not to rely on education as the solution.
“Education is a poor strategy for addressing drug shortages,” he said. While education can draw awareness to drug shortages and subsequent medication-related errors, Mr. Grissinger recommends that organizations implement strategies to help ameliorate the havoc created by drug shortages.
Drug shortage assessment checklists can help organizations evaluate the impact of shortages by verifying inventory, and proactively searching for alternatives. From there, they can enact strategies such as assigning priority to patients who have the greatest need, altering packaging and concentrations, and finding suitable therapeutic substitutions.
REPORTING FROM AMCP NEXUS 2019
VA Boston Healthcare System First Friday Faculty Development Presentation Series
The US Department of Veterans Affairs (VA) trains a large number of learners from across multiple health care professions— more than 122,000 in 2017.1 The VA has affiliation agreements with almost all American medical schools (97%), and annually about one-third of all medical residents in the US train at VA academic medical centers (AMCs).1,2 The VA also trains learners in more than 40 health care professions from >1,800 training programs.1,3 This large commitment to training aides the recruitment of these learners as VA clinicians. In fact, a high percentage of current VA clinicians previously trained at the VA. For example, 60% of VA physicians and about 70% of both VA optometrists and psychologists trained at the VA.1
Given the large scope of training experiences and the impact on future employment, it is critical that VA educators provide a highquality learning experience for trainees. To do this, VA educators need both initial and ongoing education and support to grow and develop as teachers and as supervisors.4 Few educators currently report receiving this type of training, which includes effectively providing feedback to trainees, assessing trainee learning, and teaching on interprofessional teams.5
Numerous benefits to the AMC may be realized when a structured approach to faculty development is implemented. Systematic literature reviews of such approaches found that faculty members were satisfied with programming and that the content of programing was useful and relevant to their teaching.6,7 Faculty reported increased positive attitudes toward faculty development and toward teaching, increased knowledge of educational principles, greater establishment of faculty networks, and positive changes in teaching behavior (as identified by faculty and students).6,7 Further, participating in faculty development programming increased teaching effectiveness.6-8 Faculty development programs also provided direct and indirect financial benefits to the AMC and may lead to increased patient safety, increased patient satisfaction with care, and higher quality of care.9,10 Faculty development programming can be delivered via an online system that is as effective as face-to-face trainings and is more cost-efficient than are face-to-face trainings, particularly for educators at rural sites.11
Methods
The VA Boston Healthcare System (VABHS) is a large AMC with more than 350 academic affiliations, 500 faculty members, and 3200 trainees from a wide range of health care professions. Despite this robust presence of trainees, like many other AMCs, in 2014 VABHS lacked a structured approach to faculty development programming.12,13
To realize the potential benefits of this programming, VABHS developed a framework to conceptualize multiple components of faculty development programming. The framework focused on faculty development activities in 5 areas: teaching, research, awards, interprofessional, networking (TRAIN).14 The TRAIN framework allowed VABHS to develop specific faculty development programs in a strategic and organized manner.
In this article, we describe the VABHS First Friday Faculty Development Presentation series, a faculty development program that was created to improve teaching and supervising skill. The presentation series began in 2014. Faculty members at all 3 VABHS campuses participated in the presentations either in-person or via videoconference. Over time, faculty members at other New England VA AMCs began to express interest in participating, and audio and videoconferences were used to allow participation from those sites.
The program soon developed a national audience. In January 2017, this program provided the opportunity for faculty members to earn continuing education (CE) credits for participation. This allowed faculty members a unique opportunity to earn CE for presentations specifically geared toward improving skills as an educator, which is not widely available—particularly at rural and remote VA sites.
Presentations were 1 hour and held on the first Friday of the month at 12 pm Eastern Standard time. Topics for the presentations were identified through formal and informal needs assessments of faculty and through faculty development needs identified in the literature. Presentation topics consistent with the components of the TRAIN framework were selected. The cost to develop the program was largely related to time spent by presentation organizers to arrange speakers, advertise the presentations, develop a protocol for the use of the technology, and apply for accreditation for participants to receive CE credits.
Presenters were educators from a range of health care professions, including physicians, psychologists, nurses, and other professions from VABHS and neighboring Boston-area AMCs. Topics included providing feedback to learners, using active learning strategies, teaching clinical thinking, reducing burnout among educators, managing work-life balance, and developing interprofessional learning curricula. Presentations are archived online.
Results
From January 2017 to June 2018, 869 CE credits were earned by faculty members at VA AMCs nationwide for participating in this faculty development program, including 359 credits for nurses (41.3%), 164 credits for pharmacists (18.9%), 128 credits for physicians (14.7%), 67 credits for social workers (7.7%), and 54 credits for psychologists (6.2%). Other CE credits were earned by dieticians (14), dentists (13), speech pathologists (3), and occupational therapists (2), and other health care professionals (65).
Participants completed satisfaction surveys, responding to 9 questions using a 5-point Likert scale (1 = strongly disagree to 5 = strongly agree) (Table). Data collection practices were reviewed by the VABHS Internal Review Board, which determined that the data did not meet the definition of human subject research and did not require further review.
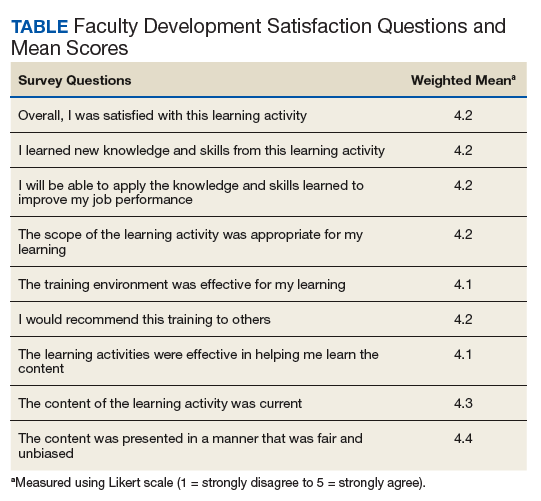
Participants were asked 2 additional questions to further assess the programming. Seven hundred forty-eight participants responded to the question “How much did you learn as a result of this CE program?” using Likert-scale responses (1 = very little to 5 = great deal): 56.6% responded with a 4, (fair amount), and 21.5% responded with a 5 (great deal). Participants also were asked whether the content of this CE program was useful for their practice or other professional development (1 = not useful to 5 = extremely useful). Seven hundred forty-nine participants responded with a 4 (useful), and 25.4% of participants responded with a 5 (extremely useful).
Discussion
Overall, participants reported that the presentations were effective in teaching content, they acquired new knowledge, and they can apply this knowledge in future teaching. Participants reported satisfaction with the training activities and that the content was presented in a fair and unbiased manner. Further, they reported the training environment was effective, and they would recommend the training to others.
Conclusion
VABHS will continue to identify mechanisms to further disseminate and enhance this programming, particularly in rural areas, where there is a shortage of faculty development programming.2 We will continue to assess the impact of these presentations on many factors, including patient safety and veteran satisfaction with their health care. We will also seek to understand how many total participants attend each presentation, as we currently have data only from participants who completed the satisfaction survey.
We invite faculty members from all VA AMCs and training sites to attend future presentations. Information about upcoming presentations is disseminated across multiple VA listservs; you can also e-mail the authors to receive notification of future presentations.
1. US Department of Veterans Affairs, Office of Academic Affiliations. 2017 statistics: health professions trainees. https://www.va.gov/OAA/docs/OAA_Statistics.pdf. Accessed September 6, 2019.
2. Chang BK, Brannen JL. The Veterans Access, Choice, and Accountability Act of 2014: examining graduate medical education enhancement in the Department of Veterans Affairs. Acad Med. 2015;90(9):1196-1198.
3. Lee J, Sanders K, Cox M. Honoring those who have served: how can health professionals provide optimal care for members of the military, veterans, and their families? Acad Med. 2014;89(9):1198-1200.
4. Houston TK, Ferenchick GS, Clark JM, et al. Faculty development needs. J Gen Intern Med. 2004;19(4):375-379.
5. Holmboe ES, Ward DS, Reznick RK, et al. Faculty development in assessment: the missing link in competency based medical education. Acad Med. 2011;86(4):460-467.
6. Steinert Y, Mann K, Centeno A, et al. A systematic review of faculty development initiatives designed to improve teaching effectiveness in medical education: BEME Guide No. 8. Med Teach. 2006;28(6):497-526.
7. Steinert Y, Mann K, Anderson B, et al. A systematic review of faculty development initiatives designed to enhance teaching effectiveness: A 10-year update: BEME Guide No. 40. Med Teach. 2016;38(8):769-786.
8. Lee SM, Lee MC, Reed DA, et al. Success of a faculty development program for teachers at the Mayo Clinic. J Grad Med Educ. 2014;6(4):704-708.
9. Topor DR, Roberts DH. Faculty development programming at academic medical centers: identifying financial benefits and value. Med Sci Educ. 2016;26(3):417-419.
10. Starmer AJ, Spector ND, Srivastava R, et al; I-PASS Study Group. Changes in medical errors after implementation of a handoff program. N Engl J Med. 2014;371(19):1803-1812.
11. Maloney S, Haas R, Keating JL, et al. Breakeven, cost benefit, cost effectiveness, and willingness to pay for web-based versus face-to-face education delivery for health professionals. J Med Internet Res. 2012;14(2):e47.
12. Clark JM, Houston TK, Kolodner K, Branch WT, Levine RB, Kern DE. Teaching the teachers: national survey of faculty development in departments of medicine of U.S. teaching hospitals. J Gen Intern Med. 2004;19(3):205-214.
13. Hatem CJ, Lown BA, Newman LR. The academic health center coming of age: helping faculty become better teachers and agents of educational change. Acad Med. 2006;81(11):941-944.
14. Topor DR, Budson AE. A framework for faculty development programming at VA and non-VA Academic Medical.
The US Department of Veterans Affairs (VA) trains a large number of learners from across multiple health care professions— more than 122,000 in 2017.1 The VA has affiliation agreements with almost all American medical schools (97%), and annually about one-third of all medical residents in the US train at VA academic medical centers (AMCs).1,2 The VA also trains learners in more than 40 health care professions from >1,800 training programs.1,3 This large commitment to training aides the recruitment of these learners as VA clinicians. In fact, a high percentage of current VA clinicians previously trained at the VA. For example, 60% of VA physicians and about 70% of both VA optometrists and psychologists trained at the VA.1
Given the large scope of training experiences and the impact on future employment, it is critical that VA educators provide a highquality learning experience for trainees. To do this, VA educators need both initial and ongoing education and support to grow and develop as teachers and as supervisors.4 Few educators currently report receiving this type of training, which includes effectively providing feedback to trainees, assessing trainee learning, and teaching on interprofessional teams.5
Numerous benefits to the AMC may be realized when a structured approach to faculty development is implemented. Systematic literature reviews of such approaches found that faculty members were satisfied with programming and that the content of programing was useful and relevant to their teaching.6,7 Faculty reported increased positive attitudes toward faculty development and toward teaching, increased knowledge of educational principles, greater establishment of faculty networks, and positive changes in teaching behavior (as identified by faculty and students).6,7 Further, participating in faculty development programming increased teaching effectiveness.6-8 Faculty development programs also provided direct and indirect financial benefits to the AMC and may lead to increased patient safety, increased patient satisfaction with care, and higher quality of care.9,10 Faculty development programming can be delivered via an online system that is as effective as face-to-face trainings and is more cost-efficient than are face-to-face trainings, particularly for educators at rural sites.11
Methods
The VA Boston Healthcare System (VABHS) is a large AMC with more than 350 academic affiliations, 500 faculty members, and 3200 trainees from a wide range of health care professions. Despite this robust presence of trainees, like many other AMCs, in 2014 VABHS lacked a structured approach to faculty development programming.12,13
To realize the potential benefits of this programming, VABHS developed a framework to conceptualize multiple components of faculty development programming. The framework focused on faculty development activities in 5 areas: teaching, research, awards, interprofessional, networking (TRAIN).14 The TRAIN framework allowed VABHS to develop specific faculty development programs in a strategic and organized manner.
In this article, we describe the VABHS First Friday Faculty Development Presentation series, a faculty development program that was created to improve teaching and supervising skill. The presentation series began in 2014. Faculty members at all 3 VABHS campuses participated in the presentations either in-person or via videoconference. Over time, faculty members at other New England VA AMCs began to express interest in participating, and audio and videoconferences were used to allow participation from those sites.
The program soon developed a national audience. In January 2017, this program provided the opportunity for faculty members to earn continuing education (CE) credits for participation. This allowed faculty members a unique opportunity to earn CE for presentations specifically geared toward improving skills as an educator, which is not widely available—particularly at rural and remote VA sites.
Presentations were 1 hour and held on the first Friday of the month at 12 pm Eastern Standard time. Topics for the presentations were identified through formal and informal needs assessments of faculty and through faculty development needs identified in the literature. Presentation topics consistent with the components of the TRAIN framework were selected. The cost to develop the program was largely related to time spent by presentation organizers to arrange speakers, advertise the presentations, develop a protocol for the use of the technology, and apply for accreditation for participants to receive CE credits.
Presenters were educators from a range of health care professions, including physicians, psychologists, nurses, and other professions from VABHS and neighboring Boston-area AMCs. Topics included providing feedback to learners, using active learning strategies, teaching clinical thinking, reducing burnout among educators, managing work-life balance, and developing interprofessional learning curricula. Presentations are archived online.
Results
From January 2017 to June 2018, 869 CE credits were earned by faculty members at VA AMCs nationwide for participating in this faculty development program, including 359 credits for nurses (41.3%), 164 credits for pharmacists (18.9%), 128 credits for physicians (14.7%), 67 credits for social workers (7.7%), and 54 credits for psychologists (6.2%). Other CE credits were earned by dieticians (14), dentists (13), speech pathologists (3), and occupational therapists (2), and other health care professionals (65).
Participants completed satisfaction surveys, responding to 9 questions using a 5-point Likert scale (1 = strongly disagree to 5 = strongly agree) (Table). Data collection practices were reviewed by the VABHS Internal Review Board, which determined that the data did not meet the definition of human subject research and did not require further review.
Participants were asked 2 additional questions to further assess the programming. Seven hundred forty-eight participants responded to the question “How much did you learn as a result of this CE program?” using Likert-scale responses (1 = very little to 5 = great deal): 56.6% responded with a 4, (fair amount), and 21.5% responded with a 5 (great deal). Participants also were asked whether the content of this CE program was useful for their practice or other professional development (1 = not useful to 5 = extremely useful). Seven hundred forty-nine participants responded with a 4 (useful), and 25.4% of participants responded with a 5 (extremely useful).
Discussion
Overall, participants reported that the presentations were effective in teaching content, they acquired new knowledge, and they can apply this knowledge in future teaching. Participants reported satisfaction with the training activities and that the content was presented in a fair and unbiased manner. Further, they reported the training environment was effective, and they would recommend the training to others.
Conclusion
VABHS will continue to identify mechanisms to further disseminate and enhance this programming, particularly in rural areas, where there is a shortage of faculty development programming.2 We will continue to assess the impact of these presentations on many factors, including patient safety and veteran satisfaction with their health care. We will also seek to understand how many total participants attend each presentation, as we currently have data only from participants who completed the satisfaction survey.
We invite faculty members from all VA AMCs and training sites to attend future presentations. Information about upcoming presentations is disseminated across multiple VA listservs; you can also e-mail the authors to receive notification of future presentations.
1. US Department of Veterans Affairs, Office of Academic Affiliations. 2017 statistics: health professions trainees. https://www.va.gov/OAA/docs/OAA_Statistics.pdf. Accessed September 6, 2019.
2. Chang BK, Brannen JL. The Veterans Access, Choice, and Accountability Act of 2014: examining graduate medical education enhancement in the Department of Veterans Affairs. Acad Med. 2015;90(9):1196-1198.
3. Lee J, Sanders K, Cox M. Honoring those who have served: how can health professionals provide optimal care for members of the military, veterans, and their families? Acad Med. 2014;89(9):1198-1200.
4. Houston TK, Ferenchick GS, Clark JM, et al. Faculty development needs. J Gen Intern Med. 2004;19(4):375-379.
5. Holmboe ES, Ward DS, Reznick RK, et al. Faculty development in assessment: the missing link in competency based medical education. Acad Med. 2011;86(4):460-467.
6. Steinert Y, Mann K, Centeno A, et al. A systematic review of faculty development initiatives designed to improve teaching effectiveness in medical education: BEME Guide No. 8. Med Teach. 2006;28(6):497-526.
7. Steinert Y, Mann K, Anderson B, et al. A systematic review of faculty development initiatives designed to enhance teaching effectiveness: A 10-year update: BEME Guide No. 40. Med Teach. 2016;38(8):769-786.
8. Lee SM, Lee MC, Reed DA, et al. Success of a faculty development program for teachers at the Mayo Clinic. J Grad Med Educ. 2014;6(4):704-708.
9. Topor DR, Roberts DH. Faculty development programming at academic medical centers: identifying financial benefits and value. Med Sci Educ. 2016;26(3):417-419.
10. Starmer AJ, Spector ND, Srivastava R, et al; I-PASS Study Group. Changes in medical errors after implementation of a handoff program. N Engl J Med. 2014;371(19):1803-1812.
11. Maloney S, Haas R, Keating JL, et al. Breakeven, cost benefit, cost effectiveness, and willingness to pay for web-based versus face-to-face education delivery for health professionals. J Med Internet Res. 2012;14(2):e47.
12. Clark JM, Houston TK, Kolodner K, Branch WT, Levine RB, Kern DE. Teaching the teachers: national survey of faculty development in departments of medicine of U.S. teaching hospitals. J Gen Intern Med. 2004;19(3):205-214.
13. Hatem CJ, Lown BA, Newman LR. The academic health center coming of age: helping faculty become better teachers and agents of educational change. Acad Med. 2006;81(11):941-944.
14. Topor DR, Budson AE. A framework for faculty development programming at VA and non-VA Academic Medical.
Previously healthy patients hospitalized for sepsis show increased mortality
WASHINGTON – Although severe, community-acquired sepsis in previously healthy U.S. adults is relatively uncommon, it occurs often enough to strike about 40,000 people annually, and when previously healthy people are hospitalized for severe sepsis, their rate of in-hospital mortality was double the rate in people with one or more comorbidities who have severe, community-acquired sepsis, based on a review of almost 7 million Americans hospitalized for sepsis.
The findings “underscore the importance of improving public awareness of sepsis and emphasizing early sepsis recognition and treatment in all patients,” including those without comorbidities, Chanu Rhee, MD, said at an annual scientific meeting on infectious diseases. He hypothesized that the increased sepsis mortality among previously healthy patients may have stemmed from factors such as delayed sepsis recognition resulting in hospitalization at a more advanced stage and less aggressive management.
In addition, “the findings provide context for high-profile reports about sepsis death in previously healthy people,” said Dr. Rhee, an infectious diseases and critical care physician at Brigham and Women’s Hospital in Boston. Dr. Rhee and associates found that, among patients hospitalized with what the researchers defined as “community-acquired” sepsis, 3% were judged previously healthy by having no identified major or minor comorbidity or pregnancy at the time of hospitalization, a percentage that – while small – still translates into roughly 40,000 such cases annually in the United States. That helps explain why every so often a headline appears about a famous person who died suddenly and unexpectedly from sepsis, he noted.
The study used data collected on hospitalized U.S. patients in the Cerner Health Facts, HCA Healthcare, and Institute for Health Metrics and Evaluation databases, which included about 6.7 million people total including 337,983 identified as having community-acquired sepsis, defined as patients who met the criteria for adult sepsis advanced by the Centers for Disease Control and Prevention within 2 days of their hospital admission. The researchers looked further into the hospital records of these patients and divided them into patients with one or more major comorbidities (96% of the cohort), patients who were pregnant or had a “minor” comorbidity such as a lipid disorder, benign neoplasm, or obesity (1% of the study group), or those with no chronic comorbidity (3%; the subgroup the researchers deemed previously healthy).
In a multivariate analysis that adjusted for patients’ age, sex, race, infection site, and illness severity at the time of hospital admission the researchers found that the rate of in-hospital death among the previously healthy patients was exactly twice the rate of those who had at least one major chronic comorbidity, Dr. Rhee reported. Differences in the treatment received by the previously-healthy patients or in their medical status compared with patients with a major comorbidity suggested that the previously health patients were sicker. They had a higher rate of mechanical ventilation, 30%, compared with about 18% for those with a comorbidity; a higher rate of acute kidney injury, about 43% in those previously healthy and 28% in those with a comorbidity; and a higher percentage had an elevated lactate level, about 41% among the previously healthy patients and about 22% among those with a comorbidity.
SOURCE: Alrawashdeh M et al. Open Forum Infect Dis. 2019 Oct 23;6. Abstract 891.
REPORTING FROM ID WEEK 2019