User login
Filtering pulmonary function tests through race/ethnicity may add to biased care
The use of race/ethnicity in medicine to explain and interpret pulmonary function test (PFT) differences between individuals may contribute to biased medical care and research. Furthermore, it may perpetuate health disparities and structural racism, according to a study published in the journal CHEST®.
Current practices of PFT measurement and interpretation, are imperfect in their ability to accurately describe the relationship between function and health outcomes, according to Nirav R. Bhakta, MD, University of California,San Francisco, and colleagues.
The authors summarized arguments against using race-specific equations, while voicing genuine concerns about removing race from PFT interpretations, and described knowledge gaps and critical questions needing to be addressed for remediation of health disparities.
“Leaving out the perspectives of practicing pulmonologists and physiologists has global relevance for increasingly multicultural communities in which the range of values that represent normal lung function is uncertain,” Dr. Bhakta said in an interview.
A lesson in history
Tracing the history of spirometry, the authors stated that observations about vital lung capacity showing differences attributable to height, age, sex, and occupation (e.g., typesetter vs. firefighter) were then extended to include social classes and ultimately race. Whites showed greater average vital capacity for the same sex, height, and age than non-Whites.
While some investigators pointed to environmental sources (such as early life nutrition, respiratory illness, air pollution, exercise, and altitude), research into their mechanisms and magnitudes of effect was not pursued, but rather “a narrative of innate differences took hold,” Dr. Bhakta and colleagues reported.
That sort of narrative risks comparison with those used to uphold slavery and structural racism in the past. More recently, such a narrative was used to deny disability claims of Welsh versus English White miners, and was expanded to interpret algorithms designed to predict expected lung function.
Use of standing height questioned
The current practice of using normalized standard height for lung function comparisons misses racial and ethnic differences in the proportion of sitting height to standing height shown in multiple studies, the authors stated. These comparisons may ignore effects on standing height of early-life nutrition, genetics, lung-specific factors such as respiratory infections and exposures to indoor and outdoor pollution, physical activity, and high altitude. Using sitting height instead of standing height reduces lung volume differences up to 50% between White and Black populations, they noted, and socioeconomic variables, such as poverty and immigration status, accounted further for the differences seen. Population differences disappeared by as much as 90% when chest measurements used to estimate surface area or volume were more finely detailed.
The researchers warned, however, that, “because current clinical and policy algorithms rely so heavily on the comparison of an individual’s observed lung function to that which is expected for similar people without typical respiratory disease, an abrupt change to not using race/ethnicity, if not paired with education and a reform of existing algorithms and policies, is also expected to have risks on average to groups of non-White individuals.”
That could lead to potential challenges for some groups ranging from the ability to obtain employment in certain occupations, to being considered for potentially curative lung resections, or having access to home assisted ventilation and rehabilitation programs. “An abrupt change to not using race/ethnicity and taking a society’s overall average as the reference range also has the potential to lead to delayed care, denial of disability benefits, and higher life insurance premiums to White individuals.”
Evidence base is limited
“Although evidence demonstrates differences in lung function between racial/ethnic groups, the premise that dividing lung function interpretation up by racial/ethnic background is helpful in the clinical setting is not a proven one.” The authors cited some evidence that lung function interpretation without consideration of race/ethnicity has superior prognostic ability. In addition, research has shown only a weak relationship between lung function and work ability, according to the authors. More appropriate ways of assessing expected lung function for an individual in the absence of a diagnoses are under study.
Offering an alternative
As an alternative to race, Dr. Bhakta and colleagues proposed using a range of values that include individuals across many global populations while still adjusting for sex, age, and height. The resultant value would represent a diverse population average and widen the limits of normal that can be expected in otherwise-healthy people.
The approach would include PFTs with other factors for clinical decision-making, but would allow clinicians and patients to appreciate the limitations of interpretation based on comparison to reference values. However, such an approach may miss pathophysiologically reduced lung function in some individuals, in which case lifesaving therapies, such as chemotherapy, lung cancer resection, and bone marrow transplantation could be withheld. In other instances the consequence would be overtesting and diagnosis, they acknowledged.
The authors further discussed general concerns about the use of race in interpretation of PFTs, addressing limits/considerations as well as knowledge and practice gaps.
For example, one particular concern involves the fact that race does not capture acculturation and mixed ancestry. The limit/consideration is the need to discover mechanisms for differences and to suggest societal interventions, and the knowledge gap pertains to ignorance regarding mechanisms leading to differences in lung function.
For the concern that race is not a proxy for an individual’s genetics, the limit/consideration is that race captures only some genetics and the gap is the need for better genetic information. As an antidote to over reliance on lung function thresholds (without supporting data), they urged outcomes-based standards rather than comparisons with reference populations.
New thinking needed
Dr. Bhakta and colleagues pointed out that the forced expiratory volume in 1 second/forced vital capacity ratios important for diagnosis of obstructive lung disease are similar between racial/ethnic categories, underscoring the need for education about limitations of thresholds and reference values with regard to race, particularly as they are used to detect mild disease.
Ignoring race, on the other hand, can lead to unnecessary testing and treatment (with concomitant side effects), and anxiety.
“Reporting through race-based algorithms in the PFT laboratory risks portraying racial disparities as innate and immutable. By anchoring on the improved prediction of lung function from racial/ethnic-specific reference equations, we miss how the significant residual variation still leaves much uncertainty about the expected value for an individual,” the authors concluded. “Given their origin and historical and current use in society, these racial/ethnic labels are better used to identify the effects of structural racism on respiratory health in research and ensure adequate representation in research, rather than in clinical algorithms.”
One of the authors is a speaker for MGC Diagnostics. The others indicated that they had no relevant disclosures.
FROM THE JOURNAL CHEST®
Time to retire race- and ethnicity-based carrier screening
The social reckoning of 2020 has led to many discussions and conversations around equity and disparities. With the COVID-19 pandemic, there has been a particular spotlight on health care disparities and race-based medicine. Racism in medicine is pervasive; little has been done over the years to dismantle and unlearn practices that continue to contribute to existing gaps and disparities. Race and ethnicity are both social constructs that have long been used within medical practice and in dictating the type of care an individual receives. Without a universal definition, race, ethnicity, and ancestry have long been used interchangeably within medicine and society. Appreciating that race and ethnicity-based constructs can have other social implications in health care, with their impact on structural racism beyond health care settings, these constructs may still be part of assessments and key modifiers to understanding health differences. It is imperative that medical providers examine the use of race and ethnicity within the care that they provide.
While racial determinants of health cannot be removed from historical access, utilization, and barriers related to reproductive care, guidelines structured around historical ethnicity and race further restrict universal access to carrier screening and informed reproductive testing decisions.
Carrier screening
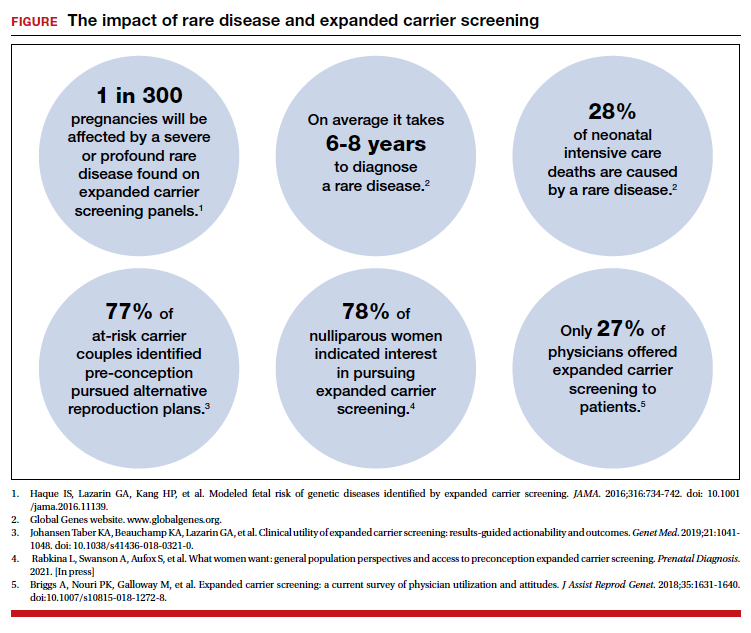
The goal of preconception and prenatal carrier screening is to provide individuals and reproductive partners with information to optimize pregnancy outcomes based on personal values and preferences.1 The practice of carrier screening began almost half a century ago with screening for individual conditions seen more frequently in certain populations, such as Tay-Sachs disease in those of Ashkenazi Jewish descent and sickle cell disease in those of African descent. Cystic fibrosis carrier screening was first recommended for individuals of Northern European descent in 2001 before being recommended for pan ethnic screening a decade later. Other individual conditions are also recommended for screening based on race/ethnicity (eg, Canavan disease in the Ashkenazi Jewish population, Tay-Sachs disease in individuals of Cajun or French-Canadian descent).2-4 Practice guidelines from professional societies recommend offering carrier screening for individual conditions based on condition severity, race or ethnicity, prevalence, carrier frequency, detection rates, and residual risk.1 However, this process can be problematic, as the data frequently used in updating guidelines and recommendations come primarily from studies and databases where much of the cohort is White.5,6 Failing to identify genetic associations in diverse populations limits the ability to illuminate new discoveries that inform risk management and treatment, especially for populations that are disproportionately underserved in medicine.7
Need for expanded carrier screening
The evolution of genomics and technology within the realm of carrier screening has enabled the simultaneous screening for many serious Mendelian diseases, known as expanded carrier screening (ECS). A 2016 study illustrated that, in most racial/ethnic categories, the cumulative risk of severe and profound conditions found on ECS panels outside the guideline recommendations are greater than the risk identified by guideline-based panels.8 Additionally, a 2020 study showed that self-reported ethnicity was an imperfect indicator of genetic ancestry, with 9% of those in the cohort having a >50% genetic ancestry from a lineage inconsistent with their self-reported ethnicity.9 Data over the past decade have established the clinical utility,10 clinical validity,11 analytical validity,12 and cost-effectiveness13 of pan-ethnic ECS. In 2021, American College of Medical Genetics and Genomics (ACMG) recommended a panel of pan-ethnic conditions that should be offered to all patients due to smaller ethnicity-based panels failing to provide equitable evaluation of all racial and ethnic groups.14 The guidelines from the American College of Obstetricians and Gynecologists (ACOG) fall short of recommending that ECS be offered to all individuals in lieu of screening based on self-reported ethnicity.3,4
Phasing out ethnicity-based carrier screening
This begs the question: Do race, ethnicity, or ancestry have a role in carrier screening? While each may have had a role at the inception of offering carrier screening due to high costs of technology, recent studies have shown the limitations of using self-reported ethnicity in screening. Guideline-based carrier screenings miss a significant percentage of pregnancies (13% to 94%) affected by serious conditions on expanded carrier screening panels.8 Additionally, 40% of Americans cannot identify the ethnicity of all 4 grandparents.15
Founder mutations due to ancestry patterns are still present; however, stratification of care should only be pursued when the presence or absence of these markers would alter clinical management. While the reproductive risk an individual may receive varies based on their self-reported ethnicity, the clinically indicated follow-up testing is the same: offering carrier screening for the reproductive partner or gamete donor. With increased detection rates via sequencing for most autosomal recessive conditions, if the reproductive partner or gamete donor is not identified as a carrier, no further testing is generally indicated regardless of ancestry. Genotyping platforms should not be used for partner carrier screening as they primarily target common pathogenic variants based on dominant ancestry groups and do not provide the same risk reduction.
Continue to: Variant reporting...
Variant reporting
We have long known that databases and registries in the United States have an increased representation of individuals from European ancestries.5,6 However, there have been limited conversations about how the lack of representation within our databases and registries leads to inequities in guidelines and the care that we provide to patients. As a result, studies have shown higher rates of variants of uncertain significance (VUS) identified during genetic testing in non-White individuals than in Whites.16 When it comes to reporting of variants, carrier screening laboratories follow guidelines set forth by the ACMG, and most laboratories only report likely pathogenic or pathogenic variants.17 It is unknown how the higher rate of VUSs in the non-White population, and lack of data and representation in databases and software used to calculate predicted phenotype, impacts identification of at-risk carrier couples in these underrepresented populations. It is imperative that we increase knowledge and representation of variants across ethnicities to improve sensitivity and specificity across the population and not just for those of European descent.
Moving forward
Being aware of social- and race-based biases in carrier screening is important, but modifying structural systems to increase representation, access, and utility of carrier screening is a critical next step. Organizations like ACOG and ACMG have committed not only to understanding but also to addressing factors that have led to disparities and inequities in health care delivery and access.18,19 Actionable steps include offering a universal carrier screening program to all preconception and prenatal patients that addresses conditions with increased carrier frequency, in any population, defined as severe and moderate phenotype with established natural history.3,4 Educational materials should be provided to detail risks, benefits, and limitations of carrier screening, as well as shared decision making between patient and provider to align the patient’s wishes for the information provided by carrier screening.
A broader number of conditions offered through carrier screening will increase the likelihood of positive carrier results. The increase in carriers identified should be viewed as more accurate reproductive risk assessment in the context of equitable care, rather than justification for panels to be limited to specific ancestries. Simultaneous or tandem reproductive partner or donor testing can be considered to reduce clinical workload and time for results return.
In addition, increased representation of individuals who are from diverse ancestries in promotional and educational resources can reinforce that risk for Mendelian conditions is not specific to single ancestries or for targeted conditions. Future research should be conducted to examine the role of racial disparities related to carrier screening and greater inclusion and recruitment of diverse populations in data sets and research studies.
Learned biases toward race, religion, gender identity, sexual orientation, and economic status in the context of carrier screening should be examined and challenged to increase access for all patients who may benefit from this testing. For example, the use of gendered language within carrier screening guidelines and policies and how such screening is offered to patients should be examined. Guidelines do not specify what to do when someone is adopted, for instance, or does not know their ethnicity. It is important that, as genomic testing becomes more available, individuals and groups are not left behind and existing gaps are not further widened. Assessing for genetic variation that modifies for disease or treatment will be more powerful than stratifying based on race. Carrier screening panels should be comprehensive regardless of ancestry to ensure coverage for global genetic variation and to increase access for all patients to risk assessments that promote informed reproductive decision making.
Health equity requires unlearning certain behaviors
As clinicians we all have a commitment to educate and empower one another to offer care that helps promote health equity. Equitable care requires us to look at the current gaps and figure out what programs and initiatives need to be designed to address those gaps. Carrier screening is one such area in which we can work together to improve the overall care that our patients receive, but it is imperative that we examine our practices and unlearn behaviors that contribute to existing disparities. ●
- Edwards JG, Feldman G, Goldberg J, et al. Expanded carrier screening in reproductive medicine—points to consider: a joint statement of the American College of Medical Genetics and Genomics, American College of Obstetricians and Gynecologists, National Society of Genetic Counselors, Perinatal Quality Foundation, and Society for Maternal-Fetal Medicine. Obstet Gynecol. 2015;125:653-662. doi: 10.1097 /AOG.0000000000000666.
- Grody WW, Thompson BH, Gregg AR, et al. ACMG position statement on prenatal/preconception expanded carrier screening. Genet Med. 2013;15:482-483. doi: 10.1038/gim.2013.47.
- Committee Opinion No. 690. Summary: carrier screening in the age of genomic medicine. Obstet Gynecol. 2017;129: 595-596. doi: 10.1097/AOG.0000000000001947.
- Committee Opinion No. 691. Carrier screening for genetic conditions. Obstet Gynecol. 2017;129:e41-e55. doi: 10.1097 /AOG.0000000000001952.
- Need AC, Goldstein DB. Next generation disparities in human genomics: concerns and remedies. Trends Genet. 2009;25:489-494. doi: 10.1016/j.tig.2009.09.012.
- Popejoy A, Fullerton S. Genomics is failing on diversity. Nature. 2016;538;161-164. doi: 10.1038/538161a.
- Ewing A. Reimagining health equity in genetic testing. Medpage Today. June 17, 2021. https://www.medpagetoday.com /opinion/second-opinions/93173. Accessed October 27, 2021.
- Haque IS, Lazarin GA, Kang HP, et al. Modeled fetal risk of genetic diseases identified by expanded carrier screening. JAMA. 2016;316:734-742. doi: 10.1001/jama.2016.11139.
- Kaseniit KE, Haque IS, Goldberg JD, et al. Genetic ancestry analysis on >93,000 individuals undergoing expanded carrier screening reveals limitations of ethnicity-based medical guidelines. Genet Med. 2020;22:1694-1702. doi: 10 .1038/s41436-020-0869-3.
- Johansen Taber KA, Beauchamp KA, Lazarin GA, et al. Clinical utility of expanded carrier screening: results-guided actionability and outcomes. Genet Med. 2019;21:1041-1048. doi: 10.1038/s41436-018-0321-0.
- Balzotti M, Meng L, Muzzey D, et al. Clinical validity of expanded carrier screening: Evaluating the gene-disease relationship in more than 200 conditions. Hum Mutat. 2020;41:1365-1371. doi: 10.1002/humu.24033.
- Hogan GJ, Vysotskaia VS, Beauchamp KA, et al. Validation of an expanded carrier screen that optimizes sensitivity via full-exon sequencing and panel-wide copy number variant identification. Clin Chem. 2018;64:1063-1073. doi: 10.1373 /clinchem.2018.286823.
- Beauchamp KA, Johansen Taber KA, Muzzey D. Clinical impact and cost-effectiveness of a 176-condition expanded carrier screen. Genet Med. 2019;21:1948-1957. doi: 10.1038/s41436-019-0455-8.
- Gregg AR, Aarabi M, Klugman S, et al. Screening for autosomal recessive and X-linked conditions during pregnancy and preconception: a practice resource of the American College of Medical Genetics and Genomics (ACMG). Genet Med. 2021;23:1793-1806. doi: 10.1038/s41436-021-01203-z.
- Condit C, Templeton A, Bates BR, et al. Attitudinal barriers to delivery of race-targeted pharmacogenomics among informed lay persons. Genet Med. 2003;5:385-392. doi: 10 .1097/01.gim.0000087990.30961.72.
- Caswell-Jin J, Gupta T, Hall E, et al. Racial/ethnic differences in multiple-gene sequencing results for hereditary cancer risk. Genet Med. 2018;20:234-239.
- Richards S, Aziz N, Bale S, et al. Standards and guidelines for the interpretation of sequence variants: a joint consensus recommendation of the American College of Medical Genetics and Genomics and the Association for Molecular Pathology. Genet Med. 2015;17:405-424. doi:10.1038/gim.2015.30.
- Gregg AR. Message from ACMG President: overcoming disparities. Genet Med. 2020;22:1758.

Ms. Dobson is Director of Genetic Counseling and Reproductive Genetic Counselor, Center for Fetal Medicine and Reproductive Genetics, Brigham and Women’s Hospital, Boston, Massachusetts.

Ms. Arjunan is Senior Medical Science Liaison at GRAIL, Menlo Park, California.
Ms. Arjunan reports being a former employee and current shareholder for Myriad Genetics.
Ms. Dobson reports no financial relationships relevant to this article.
Ms. Dobson is Director of Genetic Counseling and Reproductive Genetic Counselor, Center for Fetal Medicine and Reproductive Genetics, Brigham and Women’s Hospital, Boston, Massachusetts.
Ms. Arjunan is Senior Medical Science Liaison at GRAIL, Menlo Park, California.
Ms. Arjunan reports being a former employee and current shareholder for Myriad Genetics.
Ms. Dobson reports no financial relationships relevant to this article.
The social reckoning of 2020 has led to many discussions and conversations around equity and disparities. With the COVID-19 pandemic, there has been a particular spotlight on health care disparities and race-based medicine. Racism in medicine is pervasive; little has been done over the years to dismantle and unlearn practices that continue to contribute to existing gaps and disparities. Race and ethnicity are both social constructs that have long been used within medical practice and in dictating the type of care an individual receives. Without a universal definition, race, ethnicity, and ancestry have long been used interchangeably within medicine and society. Appreciating that race and ethnicity-based constructs can have other social implications in health care, with their impact on structural racism beyond health care settings, these constructs may still be part of assessments and key modifiers to understanding health differences. It is imperative that medical providers examine the use of race and ethnicity within the care that they provide.
While racial determinants of health cannot be removed from historical access, utilization, and barriers related to reproductive care, guidelines structured around historical ethnicity and race further restrict universal access to carrier screening and informed reproductive testing decisions.
Carrier screening
The goal of preconception and prenatal carrier screening is to provide individuals and reproductive partners with information to optimize pregnancy outcomes based on personal values and preferences.1 The practice of carrier screening began almost half a century ago with screening for individual conditions seen more frequently in certain populations, such as Tay-Sachs disease in those of Ashkenazi Jewish descent and sickle cell disease in those of African descent. Cystic fibrosis carrier screening was first recommended for individuals of Northern European descent in 2001 before being recommended for pan ethnic screening a decade later. Other individual conditions are also recommended for screening based on race/ethnicity (eg, Canavan disease in the Ashkenazi Jewish population, Tay-Sachs disease in individuals of Cajun or French-Canadian descent).2-4 Practice guidelines from professional societies recommend offering carrier screening for individual conditions based on condition severity, race or ethnicity, prevalence, carrier frequency, detection rates, and residual risk.1 However, this process can be problematic, as the data frequently used in updating guidelines and recommendations come primarily from studies and databases where much of the cohort is White.5,6 Failing to identify genetic associations in diverse populations limits the ability to illuminate new discoveries that inform risk management and treatment, especially for populations that are disproportionately underserved in medicine.7
Need for expanded carrier screening
The evolution of genomics and technology within the realm of carrier screening has enabled the simultaneous screening for many serious Mendelian diseases, known as expanded carrier screening (ECS). A 2016 study illustrated that, in most racial/ethnic categories, the cumulative risk of severe and profound conditions found on ECS panels outside the guideline recommendations are greater than the risk identified by guideline-based panels.8 Additionally, a 2020 study showed that self-reported ethnicity was an imperfect indicator of genetic ancestry, with 9% of those in the cohort having a >50% genetic ancestry from a lineage inconsistent with their self-reported ethnicity.9 Data over the past decade have established the clinical utility,10 clinical validity,11 analytical validity,12 and cost-effectiveness13 of pan-ethnic ECS. In 2021, American College of Medical Genetics and Genomics (ACMG) recommended a panel of pan-ethnic conditions that should be offered to all patients due to smaller ethnicity-based panels failing to provide equitable evaluation of all racial and ethnic groups.14 The guidelines from the American College of Obstetricians and Gynecologists (ACOG) fall short of recommending that ECS be offered to all individuals in lieu of screening based on self-reported ethnicity.3,4
Phasing out ethnicity-based carrier screening
This begs the question: Do race, ethnicity, or ancestry have a role in carrier screening? While each may have had a role at the inception of offering carrier screening due to high costs of technology, recent studies have shown the limitations of using self-reported ethnicity in screening. Guideline-based carrier screenings miss a significant percentage of pregnancies (13% to 94%) affected by serious conditions on expanded carrier screening panels.8 Additionally, 40% of Americans cannot identify the ethnicity of all 4 grandparents.15
Founder mutations due to ancestry patterns are still present; however, stratification of care should only be pursued when the presence or absence of these markers would alter clinical management. While the reproductive risk an individual may receive varies based on their self-reported ethnicity, the clinically indicated follow-up testing is the same: offering carrier screening for the reproductive partner or gamete donor. With increased detection rates via sequencing for most autosomal recessive conditions, if the reproductive partner or gamete donor is not identified as a carrier, no further testing is generally indicated regardless of ancestry. Genotyping platforms should not be used for partner carrier screening as they primarily target common pathogenic variants based on dominant ancestry groups and do not provide the same risk reduction.
Continue to: Variant reporting...
Variant reporting
We have long known that databases and registries in the United States have an increased representation of individuals from European ancestries.5,6 However, there have been limited conversations about how the lack of representation within our databases and registries leads to inequities in guidelines and the care that we provide to patients. As a result, studies have shown higher rates of variants of uncertain significance (VUS) identified during genetic testing in non-White individuals than in Whites.16 When it comes to reporting of variants, carrier screening laboratories follow guidelines set forth by the ACMG, and most laboratories only report likely pathogenic or pathogenic variants.17 It is unknown how the higher rate of VUSs in the non-White population, and lack of data and representation in databases and software used to calculate predicted phenotype, impacts identification of at-risk carrier couples in these underrepresented populations. It is imperative that we increase knowledge and representation of variants across ethnicities to improve sensitivity and specificity across the population and not just for those of European descent.
Moving forward
Being aware of social- and race-based biases in carrier screening is important, but modifying structural systems to increase representation, access, and utility of carrier screening is a critical next step. Organizations like ACOG and ACMG have committed not only to understanding but also to addressing factors that have led to disparities and inequities in health care delivery and access.18,19 Actionable steps include offering a universal carrier screening program to all preconception and prenatal patients that addresses conditions with increased carrier frequency, in any population, defined as severe and moderate phenotype with established natural history.3,4 Educational materials should be provided to detail risks, benefits, and limitations of carrier screening, as well as shared decision making between patient and provider to align the patient’s wishes for the information provided by carrier screening.
A broader number of conditions offered through carrier screening will increase the likelihood of positive carrier results. The increase in carriers identified should be viewed as more accurate reproductive risk assessment in the context of equitable care, rather than justification for panels to be limited to specific ancestries. Simultaneous or tandem reproductive partner or donor testing can be considered to reduce clinical workload and time for results return.
In addition, increased representation of individuals who are from diverse ancestries in promotional and educational resources can reinforce that risk for Mendelian conditions is not specific to single ancestries or for targeted conditions. Future research should be conducted to examine the role of racial disparities related to carrier screening and greater inclusion and recruitment of diverse populations in data sets and research studies.
Learned biases toward race, religion, gender identity, sexual orientation, and economic status in the context of carrier screening should be examined and challenged to increase access for all patients who may benefit from this testing. For example, the use of gendered language within carrier screening guidelines and policies and how such screening is offered to patients should be examined. Guidelines do not specify what to do when someone is adopted, for instance, or does not know their ethnicity. It is important that, as genomic testing becomes more available, individuals and groups are not left behind and existing gaps are not further widened. Assessing for genetic variation that modifies for disease or treatment will be more powerful than stratifying based on race. Carrier screening panels should be comprehensive regardless of ancestry to ensure coverage for global genetic variation and to increase access for all patients to risk assessments that promote informed reproductive decision making.
Health equity requires unlearning certain behaviors
As clinicians we all have a commitment to educate and empower one another to offer care that helps promote health equity. Equitable care requires us to look at the current gaps and figure out what programs and initiatives need to be designed to address those gaps. Carrier screening is one such area in which we can work together to improve the overall care that our patients receive, but it is imperative that we examine our practices and unlearn behaviors that contribute to existing disparities. ●
- Edwards JG, Feldman G, Goldberg J, et al. Expanded carrier screening in reproductive medicine—points to consider: a joint statement of the American College of Medical Genetics and Genomics, American College of Obstetricians and Gynecologists, National Society of Genetic Counselors, Perinatal Quality Foundation, and Society for Maternal-Fetal Medicine. Obstet Gynecol. 2015;125:653-662. doi: 10.1097 /AOG.0000000000000666.
- Grody WW, Thompson BH, Gregg AR, et al. ACMG position statement on prenatal/preconception expanded carrier screening. Genet Med. 2013;15:482-483. doi: 10.1038/gim.2013.47.
- Committee Opinion No. 690. Summary: carrier screening in the age of genomic medicine. Obstet Gynecol. 2017;129: 595-596. doi: 10.1097/AOG.0000000000001947.
- Committee Opinion No. 691. Carrier screening for genetic conditions. Obstet Gynecol. 2017;129:e41-e55. doi: 10.1097 /AOG.0000000000001952.
- Need AC, Goldstein DB. Next generation disparities in human genomics: concerns and remedies. Trends Genet. 2009;25:489-494. doi: 10.1016/j.tig.2009.09.012.
- Popejoy A, Fullerton S. Genomics is failing on diversity. Nature. 2016;538;161-164. doi: 10.1038/538161a.
- Ewing A. Reimagining health equity in genetic testing. Medpage Today. June 17, 2021. https://www.medpagetoday.com /opinion/second-opinions/93173. Accessed October 27, 2021.
- Haque IS, Lazarin GA, Kang HP, et al. Modeled fetal risk of genetic diseases identified by expanded carrier screening. JAMA. 2016;316:734-742. doi: 10.1001/jama.2016.11139.
- Kaseniit KE, Haque IS, Goldberg JD, et al. Genetic ancestry analysis on >93,000 individuals undergoing expanded carrier screening reveals limitations of ethnicity-based medical guidelines. Genet Med. 2020;22:1694-1702. doi: 10 .1038/s41436-020-0869-3.
- Johansen Taber KA, Beauchamp KA, Lazarin GA, et al. Clinical utility of expanded carrier screening: results-guided actionability and outcomes. Genet Med. 2019;21:1041-1048. doi: 10.1038/s41436-018-0321-0.
- Balzotti M, Meng L, Muzzey D, et al. Clinical validity of expanded carrier screening: Evaluating the gene-disease relationship in more than 200 conditions. Hum Mutat. 2020;41:1365-1371. doi: 10.1002/humu.24033.
- Hogan GJ, Vysotskaia VS, Beauchamp KA, et al. Validation of an expanded carrier screen that optimizes sensitivity via full-exon sequencing and panel-wide copy number variant identification. Clin Chem. 2018;64:1063-1073. doi: 10.1373 /clinchem.2018.286823.
- Beauchamp KA, Johansen Taber KA, Muzzey D. Clinical impact and cost-effectiveness of a 176-condition expanded carrier screen. Genet Med. 2019;21:1948-1957. doi: 10.1038/s41436-019-0455-8.
- Gregg AR, Aarabi M, Klugman S, et al. Screening for autosomal recessive and X-linked conditions during pregnancy and preconception: a practice resource of the American College of Medical Genetics and Genomics (ACMG). Genet Med. 2021;23:1793-1806. doi: 10.1038/s41436-021-01203-z.
- Condit C, Templeton A, Bates BR, et al. Attitudinal barriers to delivery of race-targeted pharmacogenomics among informed lay persons. Genet Med. 2003;5:385-392. doi: 10 .1097/01.gim.0000087990.30961.72.
- Caswell-Jin J, Gupta T, Hall E, et al. Racial/ethnic differences in multiple-gene sequencing results for hereditary cancer risk. Genet Med. 2018;20:234-239.
- Richards S, Aziz N, Bale S, et al. Standards and guidelines for the interpretation of sequence variants: a joint consensus recommendation of the American College of Medical Genetics and Genomics and the Association for Molecular Pathology. Genet Med. 2015;17:405-424. doi:10.1038/gim.2015.30.
- Gregg AR. Message from ACMG President: overcoming disparities. Genet Med. 2020;22:1758.
Lesbian, gay, bisexual youth miss out on health care
Youth identifying as lesbian, gay, or bisexual were significantly less likely than were their peers to communicate with a physician or utilize health care in the past 12 months, according to data from a cohort study of approximately 4,000 adolescents.
Disparities in physical and mental health outcomes for individuals who identify as lesbian, gay, or bisexual (LGB) persist in the United States, and emerge in adolescents and young adults, wrote Sari L. Reisner, ScD, of Boston Children’s Hospital, and colleagues.
“LGB adult research indicates substantial unmet medical needs, including needed care and preventive care,” for reasons including “reluctance to disclose sexual identity to clinicians, lower health insurance rates, lack of culturally appropriate preventive services, and lack of clinician LGB care competence,” they said.
However, health use trends by adolescents who identify as LGB have not been well studied, they noted.
In a study published in JAMA Network Open, the researchers analyzed data from 4,256 participants in the third wave (10th grade) of adolescents in Healthy Passages, a longitudinal, observational cohort study of diverse public school students in Birmingham, Ala.; Houston; and Los Angeles County. Data were collected in grades 5, 7, and 10.
The study population included 640 youth who identified as LGB, and 3,616 non-LGB youth. Sexual status was based on responses to questions in the grade 10 youth survey. Health care use was based on the responses to questions about routine care, such as a regular checkup, and other care, such as a sick visit. Data on delayed care were collected from parents and youth. At baseline, the average age of the study participants in fifth grade was 11 years, 48.9% were female, 44.5% were Hispanic or Latino, and 28.9% were Black.
Overall, more LGB youth reported not receiving needed medical care when they thought they needed it within the past 12 months compared with non-LGB youth (42.4% of LGB vs. 30.2% of non-LGB youth; adjusted odds ratio 1.68). The most common conditions for which LGB youth did not seek care were sexually transmitted infections, contraception, and substance use.
Overall, the main reason given for not seeking medical care was that they thought the problem would go away (approximately 26% for LGB and non-LGB). Approximately twice as many LGB youth as non-LGB youth said they avoided medical care because they did not want their parents to know (14.5% vs. 9.4%).
Significantly more LGB youth than non-LGB youth reported difficulty communicating with their physicians in the past 12 months (15.3% vs. 9.4%; aOR 1.71). The main reasons for not communicating with a clinician about a topic of concern were that the adolescent did not want parents to know (40.7% of LGB and 30.2% of non-LGB) and that they were too embarrassed to talk about the topic (37.5% of LGB and 25.9% of non-LGB).
The researchers were not surprised that “LGB youth self-reported greater difficulty communicating with a clinician about topics they wanted to discuss,” but they found no significant differences in reasons for communication difficulty based on sexual orientation.
Approximately two-thirds (65.8%) of LGB youth reported feeling “a little or not at all comfortable” talking to a health care clinician about their sexual attractions, compared with approximately one-third (37.8%) of non-LGB youth.
Only 12.5% of the LGB youth said that their clinicians knew their sexual orientation, the researchers noted. However, clinicians need to know youths’ sexual orientation to provide appropriate and comprehensive care, they said, especially in light of the known negative health consequences of LGB internalized stigma, as well as the pertinence of certain sexual behaviors to preventive care and screening.
The study findings were limited by several factors including the cross-sectional design and inability to show causality, and by the incongruence of different dimensions of sexual orientation, the researchers noted. Other limitations included the use only of English and Spanish language, and a lack of complete information on disclosure of sexual orientation to parents, the researchers noted.
The results were strengthened by the diverse demographics, although they may not be generalizable to a wider population, they added.
However, the data show that responsive health care is needed to reduce disparities for LGB youth, they emphasized. “Care should be sensitive and respectful to sexual orientation for all youth, with clinicians taking time to ask adolescents about their sexual identity, attractions, and behaviors, particularly in sexual and reproductive health,” they concluded.
Adolescents suffer barriers similar to those of adults
“We know that significant health disparities exist for LGBTQ adults and adolescents,” Kelly Curran, MD, of the University of Oklahoma Health Sciences Center, Oklahoma City, said in an interview. “LGBTQ adults often have had poor experiences during health care encounters – ranging from poor interactions with inadequately trained clinicians to frank discrimination,” she said. “These experiences can prevent individuals from seeking health care in the future or disclosing important information during a medical visit, both of which can contribute to worsened health outcomes,” she emphasized.
Prior to this study, data to confirm similar patterns of decreased health care utilization in LGB youth were limited, Dr. Curran said. “Identifying and understanding barriers to health care for LGBTQ youth are essential to help address the disparities in this population,” she said.
Dr. Curran said she was not surprised by the study findings for adolescents, which reflect patterns seen in LGBTQ adults.
Overcoming barriers to encourage LGB youth to seek regular medical care involves “training health care professionals about LGBTQ health, teaching the skill of taking a nonjudgmental, inclusive history, and making health care facilities welcoming and inclusive, such as displaying a pride flag in clinic, and using forms asking for pronouns,” Dr. Curran said.
Dr. Curran said she thinks the trends in decreased health care use are similar for transgender youth. “I suspect, if anything, that transgender youth will have even further decreased health care utilization when compared to cisgender heterosexual peers and LGB peers,” she noted.
Going forward, it will be important to understand the reasons behind decreased health care use among LGB youth, such as poor experiences, discrimination, or fears about confidentiality, said Dr. Curran. “Additionally, it would be important to understand if this decreased health utilization also occurs with transgender youth,” she said.
The Healthy Passages Study was funded by the Centers for Disease Control and Prevention. One of the study coauthors disclosed funding from the Agency for Healthcare Research and Quality as part of the Harvard-wide Pediatric Health Services Research Fellowship Program. The researchers had no financial conflicts to disclose. Dr. Curran had no financial conflicts to disclose, but serves on the editorial advisory board of Pediatric News.
FROM JAMA NETWORK OPEN
Chatbots can improve mental health in vulnerable populations
In this modern age of health care where telemedicine rules, conversational agents (CAs) that use text messaging systems are becoming a major mode of communication.

Many people are familiar with voice-enabled agents, such as Apple’s Siri, Google Now, and Microsoft’s Cortana. However, CAs come in different forms of complexity, ranging from a short message service–based texting platform to an embodied conversational agent (ECA).
ECAs allow participants to interact with a physical or graphical figure that simulates a person in appearance, behavior, and dialect. These are essentially virtual humans, or avatars, who talk with participants. By taking greater advantage of these automated agents, some have projected there may be $11 billion in combined cost savings across a variety of business sectors by 2023.1 The health care field is one sector in which CAs can play an important role. Because of their accessibility, CAs have the potential to improve mental health by combating health care inequities and stigma, encouraging disclosure from participants, and serving as companions during the COVID-19 pandemic.
CAs provide accessible health care for rural, low socioeconomic status (SES), and minority communities in a variety of advantageous ways. For example, one study found that long-term use of a text-based agent that combines motivational interviewing and cognitive-behavioral therapy (CBT) can support smoking cessation in adolescents of low SES.2
CAs can help vulnerable participants advocate for themselves and proactively maintain their mental health through access to health care resources. In specific cases, these agents equalize health care treatment for different populations. Even though some participants live in secluded areas or are blocked by barriers, these text-based agents can still provide self-help intervention for them at any time on an individual basis, regardless of their location or socioeconomic status. Furthermore, they serve as highly cost-effective mental health promotion tools for large populations, some of which might not otherwise be reached by mental health care.
In combating mental illnesses such as depression and anxiety, studies have found that CAs are great treatment tools. For example, participants in an experimental group who received a self-help program based on CBT from a text-based CA named Woebot experienced significantly reduced depression symptoms when compared to the control group of participants, who received only information from a self-help electronic book.3 As a result, CAs might prove successful in treating younger populations who find online tools more feasible and accessible. Often, this population self-identifies depressive and anxiety symptoms without consulting a health care professional. Thus, this tool would prove useful to those who are bothered by the stigma of seeing a mental health professional.
Virtual human–based CAs also encourage participants to disclose more information in a nonjudgmental manner, especially among people with diseases with stigma. CAs use neutral languages, which may be helpful when dealing with stigmatized issues such as HIV, family planning, and abortion care because this heightens confidentiality and privacy. When participants believe that the agent does not “judge” or evaluate their capabilities, this elicits more sensitive information from them. For example, one study found that military service members who believed that they were interacting with a computer rather than a human operator reported lower fear of self-disclosure, displayed more sadness, and were rated by observers as more willing to disclose posttraumatic stress disorder symptoms.4 Additional findings show that participants prefer CAs when topics are highly sensitive and more likely to evoke negative self-admissions.
In what we hope will soon be a post–COVID-19 landscape of medicine, CAs are fast being used on the front lines of health care technology. Empathetic CAs can combat adverse effects of social exclusion during these pressing times. Etsuko Ishii, a researcher affiliated with the Hong Kong University of Science and Technology, and associates demonstrated that a virtual CA was as effective as a COVID-19 companion because it uses natural language processing (NLP) and nonverbal facial expressions to give users the feeling that they are being treated with empathy.5 While minimizing the number of in-person interactions that could potentially spread COVID-19, these agents promote virtual companionship that mirrors natural conversations and provide emotional support with psychological safety as participants express their pent-up thoughts. Not only do these agents help recover mood quickly, but they also have the power to overcome geographic barriers, be constantly available, and alleviate the high demand for mental health care. As a result, CAs have the potential to facilitate better communication and sustain social interactions within the isolated environment the pandemic has created.
CAs can predict, detect, and determine treatment solutions for mental health conditions based on behavioral insights. These agents’ natural language processing also allows them to be powerful therapeutic agents that can serve different communities, particularly for populations with limited access to medical resources. As the use of CAs becomes more integrated into telemedicine, their utility will continue to grow as their proven versatility in many situations expands the boundaries of health care technology.
Ms. Wong, a medical student at New York Institute of Technology College of Osteopathic Medicine in Old Westbury, conducts research related to mental health care services. She disclosed writing a telemental health software platform called Orchid. Dr. Vo, a board-certified psychiatrist, is the medical director of telehealth for the department of child and adolescent psychiatry and behavioral sciences at Children’s Hospital of Philadelphia. She is a faculty member of the University of Pennsylvania, also in Philadelphia. Dr. Vo conducts digital health research focused on using automation and artificial intelligence for suicide risk screening and connecting patients to mental health care services. She disclosed serving as cofounder of Orchid.
References
1. Chatbots: Vendor opportunities & market forecasts 2020-2024. Juniper Research, 2020.
2. Simon P et al. On using chatbots to promote smoking cessation among adolescents of low socioeconomic status, Artificial Intelligence and Work: Association for the Advancement of Artificial Intelligence (AAAI) 2019 Fall Symposium, 2019.
3. Fitzpatrick KK et al. JMIR Mental Health. 2017;4(2):e19.
4. Lucas GM et al. Front Robot AI. 2017 Oct 12. doi: 10.3389/frobt.2017.00051.
5. Ishii E et al. ERICA: An empathetic android companion for COVID-19 quarantine. arXiv preprint arXiv:2106.02325.
In this modern age of health care where telemedicine rules, conversational agents (CAs) that use text messaging systems are becoming a major mode of communication.
Many people are familiar with voice-enabled agents, such as Apple’s Siri, Google Now, and Microsoft’s Cortana. However, CAs come in different forms of complexity, ranging from a short message service–based texting platform to an embodied conversational agent (ECA).
ECAs allow participants to interact with a physical or graphical figure that simulates a person in appearance, behavior, and dialect. These are essentially virtual humans, or avatars, who talk with participants. By taking greater advantage of these automated agents, some have projected there may be $11 billion in combined cost savings across a variety of business sectors by 2023.1 The health care field is one sector in which CAs can play an important role. Because of their accessibility, CAs have the potential to improve mental health by combating health care inequities and stigma, encouraging disclosure from participants, and serving as companions during the COVID-19 pandemic.
CAs provide accessible health care for rural, low socioeconomic status (SES), and minority communities in a variety of advantageous ways. For example, one study found that long-term use of a text-based agent that combines motivational interviewing and cognitive-behavioral therapy (CBT) can support smoking cessation in adolescents of low SES.2
CAs can help vulnerable participants advocate for themselves and proactively maintain their mental health through access to health care resources. In specific cases, these agents equalize health care treatment for different populations. Even though some participants live in secluded areas or are blocked by barriers, these text-based agents can still provide self-help intervention for them at any time on an individual basis, regardless of their location or socioeconomic status. Furthermore, they serve as highly cost-effective mental health promotion tools for large populations, some of which might not otherwise be reached by mental health care.
In combating mental illnesses such as depression and anxiety, studies have found that CAs are great treatment tools. For example, participants in an experimental group who received a self-help program based on CBT from a text-based CA named Woebot experienced significantly reduced depression symptoms when compared to the control group of participants, who received only information from a self-help electronic book.3 As a result, CAs might prove successful in treating younger populations who find online tools more feasible and accessible. Often, this population self-identifies depressive and anxiety symptoms without consulting a health care professional. Thus, this tool would prove useful to those who are bothered by the stigma of seeing a mental health professional.
Virtual human–based CAs also encourage participants to disclose more information in a nonjudgmental manner, especially among people with diseases with stigma. CAs use neutral languages, which may be helpful when dealing with stigmatized issues such as HIV, family planning, and abortion care because this heightens confidentiality and privacy. When participants believe that the agent does not “judge” or evaluate their capabilities, this elicits more sensitive information from them. For example, one study found that military service members who believed that they were interacting with a computer rather than a human operator reported lower fear of self-disclosure, displayed more sadness, and were rated by observers as more willing to disclose posttraumatic stress disorder symptoms.4 Additional findings show that participants prefer CAs when topics are highly sensitive and more likely to evoke negative self-admissions.
In what we hope will soon be a post–COVID-19 landscape of medicine, CAs are fast being used on the front lines of health care technology. Empathetic CAs can combat adverse effects of social exclusion during these pressing times. Etsuko Ishii, a researcher affiliated with the Hong Kong University of Science and Technology, and associates demonstrated that a virtual CA was as effective as a COVID-19 companion because it uses natural language processing (NLP) and nonverbal facial expressions to give users the feeling that they are being treated with empathy.5 While minimizing the number of in-person interactions that could potentially spread COVID-19, these agents promote virtual companionship that mirrors natural conversations and provide emotional support with psychological safety as participants express their pent-up thoughts. Not only do these agents help recover mood quickly, but they also have the power to overcome geographic barriers, be constantly available, and alleviate the high demand for mental health care. As a result, CAs have the potential to facilitate better communication and sustain social interactions within the isolated environment the pandemic has created.
CAs can predict, detect, and determine treatment solutions for mental health conditions based on behavioral insights. These agents’ natural language processing also allows them to be powerful therapeutic agents that can serve different communities, particularly for populations with limited access to medical resources. As the use of CAs becomes more integrated into telemedicine, their utility will continue to grow as their proven versatility in many situations expands the boundaries of health care technology.
Ms. Wong, a medical student at New York Institute of Technology College of Osteopathic Medicine in Old Westbury, conducts research related to mental health care services. She disclosed writing a telemental health software platform called Orchid. Dr. Vo, a board-certified psychiatrist, is the medical director of telehealth for the department of child and adolescent psychiatry and behavioral sciences at Children’s Hospital of Philadelphia. She is a faculty member of the University of Pennsylvania, also in Philadelphia. Dr. Vo conducts digital health research focused on using automation and artificial intelligence for suicide risk screening and connecting patients to mental health care services. She disclosed serving as cofounder of Orchid.
References
1. Chatbots: Vendor opportunities & market forecasts 2020-2024. Juniper Research, 2020.
2. Simon P et al. On using chatbots to promote smoking cessation among adolescents of low socioeconomic status, Artificial Intelligence and Work: Association for the Advancement of Artificial Intelligence (AAAI) 2019 Fall Symposium, 2019.
3. Fitzpatrick KK et al. JMIR Mental Health. 2017;4(2):e19.
4. Lucas GM et al. Front Robot AI. 2017 Oct 12. doi: 10.3389/frobt.2017.00051.
5. Ishii E et al. ERICA: An empathetic android companion for COVID-19 quarantine. arXiv preprint arXiv:2106.02325.
‘Down to my last diaper’: The anxiety of parenting in poverty
For parents living in poverty, “diaper math” is a familiar and distressingly pressing daily calculation. Babies in the U.S. go through 6-10 disposable diapers a day, at an average cost of $70-$80 a month. Name-brand diapers with high-end absorption sell for as much as a half a dollar each, and can result in upwards of $120 a month in expenses.
One in every three American families cannot afford enough diapers to keep their infants and toddlers clean, dry, and healthy, according to the National Diaper Bank Network. For many parents, that leads to wrenching choices: diapers, food, or rent?
The COVID-19 pandemic has exacerbated the situation, both by expanding unemployment rolls and by causing supply chain disruptions that have triggered higher prices for a multitude of products, including diapers. Diaper banks – community-funded programs that offer free diapers to low-income families – distributed 86% more diapers on average in 2020 than in 2019, according to the National Diaper Bank Network. In some locations, distribution increased by as much as 800%.
Yet no federal program helps parents pay for this childhood essential. The government’s food assistance program does not cover diapers, nor do most state-level public aid programs.
California is the only state to directly fund diapers for families, but support is limited. CalWORKS, a financial assistance program for families with children, provides $30 per month to help families pay for diapers for children under age 3. Federal policy shifts also may be in the works: Democratic lawmakers are pushing to include $200 million for diaper distribution in the massive budget reconciliation package.
Without adequate resources, low-income parents are left scrambling for ways to get the most use out of each diaper. This stressful undertaking is the subject of a recent article in American Sociological Review by Jennifer Randles, PhD, professor of sociology at California State University–Fresno. In 2018, Randles conducted phone interviews with 70 mothers in California over nine months. She tried to recruit fathers as well, but only two men responded.
Dr. Randles spoke with KHN’s Jenny Gold about how the cost of diapers weighs on low-income moms, and the “inventive mothering” many low-income women adopt to shield their children from the harms of poverty. The conversation has been edited for length and clarity.
Q: How do diapers play into day-to-day anxieties for low-income mothers?
In my sample, half of the mothers told me that they worried more about diapers than they worried about food or housing.
I started to ask mothers, “Can you tell me how many diapers you have on hand right now?” Almost every one told me with exact specificity how many they had – 5 or 7 or 12. And they knew exactly how long that number of diapers would last, based on how often their children defecated and urinated, if their kid was sick, if they had a diaper rash at the time. So just all the emotional and cognitive labor that goes into keeping such careful track of diaper supplies.
They were worrying and figuring out, “OK, I’m down to almost my last diaper. What do I do now? Do I go find some cans [to sell]? Do I go sell some things in my house? Who in my social network might have some extra cash right now?” I talked to moms who sell blood plasma just to get their infants diapers.
Q: What coping strategies stood out to you?
Those of us who study diapers often call them diaper-stretching strategies. One was leaving on a diaper a little bit longer than someone might otherwise leave it on and letting it get completely full. Some mothers figured out if they bought a [more expensive] diaper that held more and leaked less, they could leave the diaper on longer.
They would also do things like letting the baby go diaperless, especially when they were at home and felt like they wouldn’t be judged for letting their baby go without a diaper. And they used every household good you can imagine to make makeshift diapers. Mothers are using cloth, sheets, and pillowcases. They’re using things that are disposable like paper towels with duct tape. They’re making diapers out their own period supplies or adult incontinence supplies when they can get a sample.
One of the questions I often get is, “Why don’t they just use cloth?” A lot of the mothers that I spoke with had tried cloth diapers and they found that they were very cost- and labor-prohibitive. If you pay for a full startup set of cloth diapers, you’re looking at anywhere from $500 to $1,000. And these moms never had that much money. Most of them didn’t have in-home washers and dryers. Some of them didn’t even have homes or consistent access to water, and it’s illegal in a lot of laundromats and public laundry facilities to wash your old diapers. So the same conditions that would prevent moms from being able to readily afford disposable diapers are the same conditions that keep them from being able to use cloth.
Q: You found that, for many women, the concept of being a good mother is wrapped up in diapering. Why is that?
Diapers and managing diapers was so fundamental to their identity as good moms. Most of the mothers in my sample went without their own food. They weren’t paying a cellphone bill or buying their own medicine or their own menstrual supplies, as a way of saving diaper money.
I talked to a lot of moms who said, when your baby is hungry, that’s horrible. Obviously, you do everything to prevent that. But there’s something about a diaper that covers this vulnerable part of a very young baby’s body, this very delicate skin. And being able to do something to meet this human need that we all have, and to maintain dignity and cleanliness.
A lot of the moms had been through the welfare system, and so they’re living in this constant fear [of losing their children]. This is especially true among mothers of color, who are much more likely to get wrapped up in the child welfare system. People can’t necessarily see when your baby’s hungry. But people can see a saggy diaper. That’s going to be one of the things that tags you as a bad mom.
Q: Was your work on diapers influenced by your experience as a parent?
When I was doing these interviews, my daughter was about 2 or 3. So still in diapers. When my daughter peed during a diaper change, I thought, “Oh, I can just toss that one. Here, let me get another clean one.” That’s a really easy choice. For me. That’s a crisis for the mothers I interviewed. Many of them told me they have an anxiety attack with every diaper change.
Q: Do you see a clear policy solution to diaper stress?
What’s kind of ironic is how much physical, emotional, and cognitive labor goes into managing something that society and lawmakers don’t even recognize. Diapers are still not really recognized as a basic need, as evidenced by the fact that they’re still taxed in 35 states.
I think what California is doing is an excellent start. And I think diaper banks are a fabulous type of community-based organization that are filling a huge need that is not being filled by safety net policies. So, public support for diaper banks.
The direct cash aid part of the social safety net has been all but dismantled in the last 25 years. California is pretty generous. But there are some states where just the cost of diapers alone would use almost half of the average state TANF [Temporary Assistance for Needy Families] benefit for a family of three. I think we really do have to address the fact that the value of cash aid buys so much less than it used to.
Q: Your body of work on marriage and families is fascinating and unusual. Is there a single animating question behind your research?
The common thread is: How do our safety net policies support low-income families’ parenting goals? And do they equalize the conditions of parenting? I think of it as a reproductive justice issue. The ability to have a child or to not have a child, and then to parent that child in conditions where the child’s basic needs are met.
We like to say that we’re child and family friendly. The diaper issue is just one of many, many issues where we don’t really put our money or our policies where our mouth is, in terms of supporting families and supporting children. I think my work is trying to get people to think more collectively about having a social responsibility to all families and to each other. No country, but especially the richest country on the planet, should have one in three very young children not having one of their basic needs met.
I interviewed one dad who was incarcerated because he wrote a bad check. And as he described it to me, he had a certain amount of money, and they needed both diapers and milk for the baby. And I’ll never forget, he said, “I didn’t make a good choice, but I made the right one.”
These are not fancy shoes. These are not name-brand clothes. This was a dad needing both milk and diapers. I don’t think it gets much more basic than that.
KHN (Kaiser Health News) is a national newsroom that produces in-depth journalism about health issues. Together with Policy Analysis and Polling, KHN is one of the three major operating programs at KFF (Kaiser Family Foundation). KFF is an endowed nonprofit organization providing information on health issues to the nation.
Major increase seen in cosmeceutical alternatives to topical hydroquinone
along with new strategies to improve their efficacy, according to a report at the Skin of Color Update 2021.

“Ten or 15 years ago, I was showing a slide with five [alternatives to hydroquinone]. Now there are dozens,” reported Heather Woolery-Lloyd, MD, director of the skin of color division in the department of dermatology at the University of Miami.
The growth in alternatives to hydroquinone is timely. After threats to do so for more than a decade, the Food and Drug Administration finally banned hydroquinone from OTC products in 2020. The ban was folded into the Coronavirus Aid, Relief, and Economic Security (CARES) Act passed in March of 2020 and then implemented the following September.
Until the ban of hydroquinone, OTC products with this compound were widely sought by many individuals with darker skin tones to self-treat melasma and other forms of hyperpigmentation, according to Dr. Woolery-Lloyd. Hydroquinone is still available in prescription products, but she is often asked for OTC alternatives, and she says the list is long and getting longer.
Niacinamide
Detailing the products she has been recommending most frequently as substitutes, Dr. Woolery-Lloyd reported that several are supported by high quality studies. One example is niacinamide.
Of the several controlled studies she cited, one double-blind randomized trial found niacinamide to be equivalent to hydroquinone for melasma on the basis of colorimetric measures. The study compared 4% niacinamide cream applied on one side of the face with 4% hydroquinone cream applied on the other side in 27 patients with melasma. Although the proportion of responses rated good or excellent on a subjective basis was lower with niacinamide (44% vs. 55%), the difference was not statistically significant and niacinamide cream was clearly active, producing objective improvements in mast cell infiltrate and solar elastosis in melasma skin as well. Both were well tolerated.
In other studies, niacinamide has been shown to be effective in the treatment of melasma when combined with other active agents such as tranexamic acid, said Dr. Woolery-Lloyd, who added that OTC products containing niacinamide are now “among my favorites” when directing patients to cosmeceuticals for hyperpigmentation.
Topical vitamin C
Topical vitamin C or ascorbic acid is another. Like niacinamide, topical vitamin C has also been compared with hydroquinone in a double-blind, randomized trial. Although the niacinamide trial and this study were performed 10 or more years ago, these data have new relevance with the ban of OTC hydroquinone.
In the study, 5% ascorbic acid cream on one side of the face was compared with 4% hydroquinone cream, applied on the other side, in 16 women with melasma. Again, there were no statistical differences in colorimetric measures, but good to excellent results were reported for 93% of the sides of the face treated with hydroquinone versus 62.5% of the sides treated with vitamin C (P < .05). “Hydroquinone performed better, but the vitamin C was active and very well tolerated,” Dr. Woolery-Lloyd said.
However, the ascorbic acid cream was better tolerated, with a far lower rate of adverse events (6.2% vs. 68.7%), an advantage that makes it easy to recommend to patients, said Dr. Woolery-Lloyd, who now uses it frequently in her own practice.
Liquiritin, a licorice extract, is another lightening agent increasingly included in OTC products that she also recommends. In two older studies in medical journals published in Pakistan, both the 2% and 4% strengths of liquiritin cream outperformed hydroquinone on the basis of a Melasma Area and Severity Index (MASI) rating. The liquiritin cream was well tolerated in both studies.
Azelaic acid, tranexamic acid
OTC products containing azelaic acid are also effective for hyperpigmentation based on published trials in which they were compared with hydroquinone for treating melasma. In one study of 29 women with melasma cited by Dr. Woolery-Lloyd, 20% azelaic acid cream was more effective than hydroquinone 4% cream after 2 months of treatment on the basis of the mean MASI score (6.2 vs. 3.8).
The list also includes cysteamine, silymarin, and tranexamic acid.
In the case of tranexamic acid, Dr. Woolery-Lloyd cited a relatively recent study of 60 patients with melasma, comparing two strategies for applying tranexamic acid to treatment with hydroquinone over 12 weeks. Compared with 2% hydroquinone (applied nightly) or 1.8% liposomal tranexamic acid (applied twice a day), 5% tranexamic acid solution with microneedling (weekly) had a slightly greater rate of success defined as more than a 50% improvement in hyperpigmentation in an Asian population (30%, 27.8%, and 33.3%, respectively).
“Microneedling is a newer technology that appears to be effective at improving absorption,” said Dr. Woolery-Lloyd. She predicts that microneedling will be used with increasing frequency in combination with topical cosmeceuticals.
She also predicted that these topical agents will be increasingly employed in combinations as the field of cosmeceuticals becomes increasingly more sophisticated. “When it comes to skin quality, cosmeceuticals remain our first-line therapy, especially in skin of color,” she said.
The rapid growth and utility of OTC cosmeceuticals is an area that dermatologists need to be following, according to Darius Mehregan, MD, chair of the department of dermatology, Wayne State University, Detroit, who was senior author of an article published last year that reviewed the ingredients of popular OTC cosmeceuticals.
“Our patients have a great interest in cosmeceuticals and are looking to us for guidance. I think we have a responsibility to help them identify products supported by evidence and to warn them about potential side effects,” Dr. Mehregan, who was not at the meeting, said in an interview.
He agreed that the removal of hydroquinone from OTC products will create a specific need in the area of cosmeceuticals.
“Hydroquinone has for a long time been one of the most effective agents in OTC products for melasma, so patients are going to be looking for alternatives. Identifying which drugs have shown efficacy in controlled studies will be very helpful,” he said.
Dr. Woolery-Lloyd reports financial relationships with Ortho Dermatologics, L’Oréal, Galderma, Allergan, and Somabella Laboratories. Dr. Mehregan reports no potential conflicts of interest.
along with new strategies to improve their efficacy, according to a report at the Skin of Color Update 2021.
“Ten or 15 years ago, I was showing a slide with five [alternatives to hydroquinone]. Now there are dozens,” reported Heather Woolery-Lloyd, MD, director of the skin of color division in the department of dermatology at the University of Miami.
The growth in alternatives to hydroquinone is timely. After threats to do so for more than a decade, the Food and Drug Administration finally banned hydroquinone from OTC products in 2020. The ban was folded into the Coronavirus Aid, Relief, and Economic Security (CARES) Act passed in March of 2020 and then implemented the following September.
Until the ban of hydroquinone, OTC products with this compound were widely sought by many individuals with darker skin tones to self-treat melasma and other forms of hyperpigmentation, according to Dr. Woolery-Lloyd. Hydroquinone is still available in prescription products, but she is often asked for OTC alternatives, and she says the list is long and getting longer.
Niacinamide
Detailing the products she has been recommending most frequently as substitutes, Dr. Woolery-Lloyd reported that several are supported by high quality studies. One example is niacinamide.
Of the several controlled studies she cited, one double-blind randomized trial found niacinamide to be equivalent to hydroquinone for melasma on the basis of colorimetric measures. The study compared 4% niacinamide cream applied on one side of the face with 4% hydroquinone cream applied on the other side in 27 patients with melasma. Although the proportion of responses rated good or excellent on a subjective basis was lower with niacinamide (44% vs. 55%), the difference was not statistically significant and niacinamide cream was clearly active, producing objective improvements in mast cell infiltrate and solar elastosis in melasma skin as well. Both were well tolerated.
In other studies, niacinamide has been shown to be effective in the treatment of melasma when combined with other active agents such as tranexamic acid, said Dr. Woolery-Lloyd, who added that OTC products containing niacinamide are now “among my favorites” when directing patients to cosmeceuticals for hyperpigmentation.
Topical vitamin C
Topical vitamin C or ascorbic acid is another. Like niacinamide, topical vitamin C has also been compared with hydroquinone in a double-blind, randomized trial. Although the niacinamide trial and this study were performed 10 or more years ago, these data have new relevance with the ban of OTC hydroquinone.
In the study, 5% ascorbic acid cream on one side of the face was compared with 4% hydroquinone cream, applied on the other side, in 16 women with melasma. Again, there were no statistical differences in colorimetric measures, but good to excellent results were reported for 93% of the sides of the face treated with hydroquinone versus 62.5% of the sides treated with vitamin C (P < .05). “Hydroquinone performed better, but the vitamin C was active and very well tolerated,” Dr. Woolery-Lloyd said.
However, the ascorbic acid cream was better tolerated, with a far lower rate of adverse events (6.2% vs. 68.7%), an advantage that makes it easy to recommend to patients, said Dr. Woolery-Lloyd, who now uses it frequently in her own practice.
Liquiritin, a licorice extract, is another lightening agent increasingly included in OTC products that she also recommends. In two older studies in medical journals published in Pakistan, both the 2% and 4% strengths of liquiritin cream outperformed hydroquinone on the basis of a Melasma Area and Severity Index (MASI) rating. The liquiritin cream was well tolerated in both studies.
Azelaic acid, tranexamic acid
OTC products containing azelaic acid are also effective for hyperpigmentation based on published trials in which they were compared with hydroquinone for treating melasma. In one study of 29 women with melasma cited by Dr. Woolery-Lloyd, 20% azelaic acid cream was more effective than hydroquinone 4% cream after 2 months of treatment on the basis of the mean MASI score (6.2 vs. 3.8).
The list also includes cysteamine, silymarin, and tranexamic acid.
In the case of tranexamic acid, Dr. Woolery-Lloyd cited a relatively recent study of 60 patients with melasma, comparing two strategies for applying tranexamic acid to treatment with hydroquinone over 12 weeks. Compared with 2% hydroquinone (applied nightly) or 1.8% liposomal tranexamic acid (applied twice a day), 5% tranexamic acid solution with microneedling (weekly) had a slightly greater rate of success defined as more than a 50% improvement in hyperpigmentation in an Asian population (30%, 27.8%, and 33.3%, respectively).
“Microneedling is a newer technology that appears to be effective at improving absorption,” said Dr. Woolery-Lloyd. She predicts that microneedling will be used with increasing frequency in combination with topical cosmeceuticals.
She also predicted that these topical agents will be increasingly employed in combinations as the field of cosmeceuticals becomes increasingly more sophisticated. “When it comes to skin quality, cosmeceuticals remain our first-line therapy, especially in skin of color,” she said.
The rapid growth and utility of OTC cosmeceuticals is an area that dermatologists need to be following, according to Darius Mehregan, MD, chair of the department of dermatology, Wayne State University, Detroit, who was senior author of an article published last year that reviewed the ingredients of popular OTC cosmeceuticals.
“Our patients have a great interest in cosmeceuticals and are looking to us for guidance. I think we have a responsibility to help them identify products supported by evidence and to warn them about potential side effects,” Dr. Mehregan, who was not at the meeting, said in an interview.
He agreed that the removal of hydroquinone from OTC products will create a specific need in the area of cosmeceuticals.
“Hydroquinone has for a long time been one of the most effective agents in OTC products for melasma, so patients are going to be looking for alternatives. Identifying which drugs have shown efficacy in controlled studies will be very helpful,” he said.
Dr. Woolery-Lloyd reports financial relationships with Ortho Dermatologics, L’Oréal, Galderma, Allergan, and Somabella Laboratories. Dr. Mehregan reports no potential conflicts of interest.
FROM SOC 2021
Identify patient and hospital factors to reduce maternal mortality
Maternal mortality is a public health crisis for all women, said Elizabeth A. Howell, MD, of the University of Pennsylvania, Philadelphia, in a presentation at the virtual Advancing NIH Research on the Health of Women conference sponsored by the National Institutes of Health.
The maternal mortality rate in the United States in 2018 was 17.4 maternal deaths per 100,000 live births, according to data from the Centers for Disease Control and Prevention, Dr. Howell said. Maternal mortality is defined as death during pregnancy or within 42 days of delivery; pregnancy-related mortality includes death during pregnancy or within 1 year of pregnancy, from pregnancy or as a result of any cause related to, or aggravated by, pregnancy, according to the CDC.
However, “Black women are two to three times more likely than White women to die from a pregnancy-related cause,” Dr. Howell said. These disparities are even more marked in some cities; data show that Black women in New York City are eight times more likely than White women to die from a pregnancy-related cause, she noted.
Pregnancy-related mortality persists regardless of education level, and remains significantly higher in Black women, compared with White women with at least a college degree, Dr. Howell added.
In her presentation, Dr. Howell reviewed some top causes of maternal mortality overall, and potential factors driving disparities. Data from the CDC show cardiomyopathy, cardiovascular conditions, and preeclampsia/eclampsia as the top three underlying causes of pregnancy-related deaths among non-Hispanic Black women, compared with mental health conditions, cardiovascular conditions, and hemorrhage in non-Hispanic White women, Dr. Howell said.
To help prevent maternal mortality across all populations, “It is important for us to think about the timing of deaths so we can better understand the causes,” said Dr. Howell.
CDC Vital Signs data show that approximately one-third of pregnancy-related deaths occur during pregnancy, but approximately 20% occur between 43 and 365 days postpartum, she said.
Although cardiovascular conditions top the list of clinical causes of pregnancy-related maternal mortality, maternal self-harm should not be discounted, and is likely underreported, Dr. Howell said. Data show that the peak incidence of maternal suicide occurs between 9 and 12 months’ postpartum, and risk factors include major depression, substance use disorder, and intimate partner violence, she noted.
Dr. Howell then shared the results of studies she conducted in 2020 and 2016 on racial disparities, hospital quality, and maternal mortality. One of her key findings in the 2020 study, presented at this year’s virtual meeting of the American College of Obstetricians and Gynecologists, showed that women delivering in the lowest-ranked hospitals had six times the rate of severe maternal morbidity, and an accompanying simulation/thought exercise showed that the hospital of delivery accounted for approximately half of the disparity in severe maternal morbidity between Black and White women. An earlier study she published in 2016 of between-hospital differences in New York City showed that Black and Latina women were significantly more likely than White women to deliver in hospitals with higher rates of severe maternal mortality.
These findings illustrate that “racial segregation in neighborhoods is also part of the story,” of maternal mortality, Dr. Howell said.
Dr. Howell outlined ways the health care community can reduce severe maternal morbidity and mortality for all women, including promoting contraception and preconception health, improving postpartum management, eliminating bias, and using patient navigators as needed to enhance communication among the care team,
“Think about ways to engage the community,” in support of women’s pregnancy health, Dr. Howell said. She also emphasized the need to enroll more pregnant women in clinical trials.
Don’t exclude pregnant women from trials
In a follow-up session, Cynthia Gyamfi-Bannerman, MD, of the University of California, San Diego, expanded on opportunities to include pregnant women in clinical research.
Clinical trials for pregnant people fall into two categories, she noted; those studying interventions to improve pregnancy outcomes and those studying interventions for common medical conditions that coexist with pregnancy. These trials are either initiated by the investigators, conducted under contract, or federally funded, Dr. Gyamfi-Bannerman said. Currently, the only obstetric clinical trials research network is the Maternal-Fetal Medicine Units Network, established in 1986 by the Eunice Kennedy Shriver National Institute of Child Health and Human Development. The MFMU has conducted significant and life-saving research, but “we need more networks to focus on researching pregnancy complications,” Dr. Gyamfi-Bannerman said. Once the infrastructure exists in multiple settings, the ability to conduct trials will improve, she said.
Dr. Gyamfi-Bannerman stressed the need to engage and involve community-based physicians in clinical trials; using those relationships to enroll a more diverse population for whom working with their local physician would be more feasible than traveling to a larger clinical trial center.
She also commented on the need to include pregnant women in nonobstetric clinical trials. The exclusion of pregnant women from COVID-19 vaccine trials left clinicians with no information for guiding pregnant patients, she said. “It is important to think about why we are excluding pregnant women,” she said.
Finally, Dr. Gyamfi-Bannerman recommended a national effort to coordinate and leverage EHR data, which could have an effect on reducing maternal morbidity by facilitating the study of nonobstetric interventions in pregnancy, such as behavior interventions and mental health care.
Dr. Howell and Dr. Gyamfi-Bannerman had no financial conflicts to disclose.
FROM ADVANCING NIH RESEARCH ON THE HEALTH OF WOMEN
Transgender use of dermatologic procedures has strong gender tilt
, according to the results of a recent survey.
Transfeminine persons – those assigned male at birth – were much more likely to report a previous dermatologic procedure, compared with transmasculine respondents, by a margin of 64.9%-7.5%, Laura Ragmanauskaite, MD, and associates reported.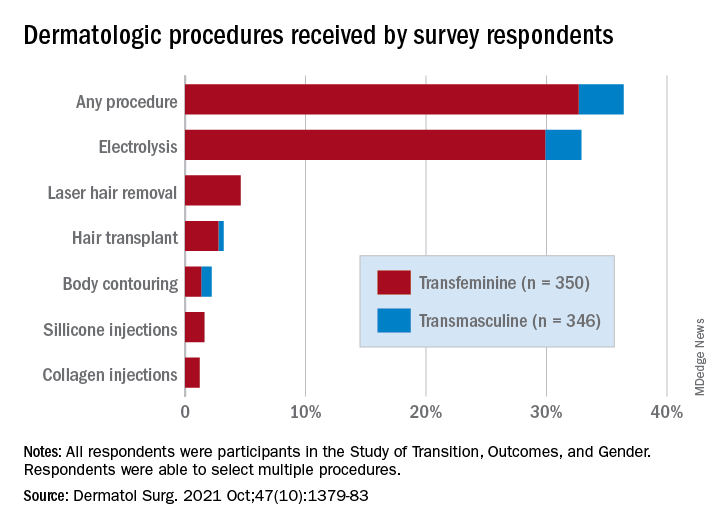
“Hair removal was the most frequently reported procedure type, with electrolysis being more common than laser hair removal,” they said, noting that “previous research on hair removal treatments among gender minority persons did not detect differences in the use of electrolysis and laser hair removal.”
Just under one-third of all respondents (32.9%) said that they had undergone electrolysis and 4.6% reported previous laser hair removal. For electrolysis, that works out to 59.4% of transfeminine and 6.1% of transmasculine respondents, while 9.1% of all transfeminine and no transmasculine persons had received laser hair removal, Dr. Ragmanauskaite of the department of dermatology, Emory University, Atlanta, and her coauthors said.
Those who had undergone gender-affirming surgery were significantly more likely to report electrolysis (78.6%) than were persons who had received no gender-affirming surgery or hormone therapy alone (47.4%), a statistically significant difference (P < .01). All of the other, less common procedures included in the online survey – 696 responses were received from 350 transfeminine and 346 transmasculine persons participating in the Study of Transition, Outcomes, and Gender – were reported more often by the transfeminine respondents. The procedure with the closest gender distribution was body contouring, reported by nine transfeminine and six transmasculine persons, the researchers said.
Use of dermal fillers was even less common (2.8% among all respondents, all transfeminine persons), with just 11 reporting having received silicone and 8 reporting having received collagen, although the survey did not ask about how the injections were obtained. In a previous study, the prevalence of illicit filler injection in transgender women was 16.9%, they pointed out.
These types of noninvasive, gender-affirming procedures “may contribute to higher levels of self-confidence and [reduce] gender dysphoria. Future studies should examine motivations, barriers, and optimal timing” for such procedures in transgender persons, Dr. Ragmanauskaite and associates wrote.
The authors reported that they had no relevant disclosures.
FROM DERMATOLOGIC SURGERY
Social determinants of health may drive CVD risk in Black Americans
Investigators analyzed 20 years of data on over 50,500 U.S. adults drawn from the National Health and Nutrition Examination Surveys (NHANES) and found that, in the overall population, body mass index and hemoglobin A1c were significantly increased between 1999 and 2018, while serum total cholesterol and cigarette smoking were significantly decreased. Mean systolic blood pressure decreased between 1999 and 2010, but then increased after 2010.
The mean age- and sex-adjusted estimated 10-year risk for atherosclerotic cardiovascular disease (ASCVD) was consistently higher in Black participants vs. White participants, but the difference was attenuated after further adjusting for education, income, home ownership, employment, health insurance, and access to health care.
“These findings are helpful to guide the development of national public health policies for targeted interventions aimed at eliminating health disparities,” Jiang He, MD, PhD, Joseph S. Copes Chair and professor of epidemiology, Tulane University School of Public Health and Tropical Medicine, New Orleans, said in an interview.
“Interventions on social determinants of cardiovascular health should be tested in rigorous designed intervention trials,” said Dr. He, director of the Tulane University Translational Science Institute.
The study was published online Oct. 5 in JAMA.
‘Flattened’ CVD mortality?
Recent data show that the CVD mortality rate flattened, while the total number of cardiovascular deaths increased in the U.S. general population from 2010 to 2018, “but the reasons for this deceleration in the decline of CVD mortality are not entirely understood,” Dr. He said.
Moreover, “racial and ethnic differences in CVD mortality persist in the U.S. general population [but] the secular trends of cardiovascular risk factors among U.S. subpopulations with various racial and ethnic backgrounds and socioeconomic status are [also] not well understood,” he added. The effects of social determinants of health, such as education, income, home ownership, employment, health insurance, and access to health care on racial/ethnic differences in CVD risk, “are not well documented.”
To investigate these questions, the researchers drew on data from NHANES, a series of cross-sectional surveys in nationally representative samples of the U.S. population aged 20 years and older. The surveys are conducted in 2-year cycles and include data from 10 cycles conducted from 1999-2000 to 2017-2018 (n = 50,571, mean age 49.0-51.8 years; 48.2%-51.3% female).
Every 2 years, participants provided sociodemographic information, including age, race/ethnicity, sex, education, income, employment, housing, health insurance, and access to health care, as well as medical history and medication use. They underwent a physical examination that included weight and height, blood pressure, lipid levels, plasma glucose, and hemoglobin A1c.
Social determinants of health
Between 1999-2000 and 2017-2018, age- and sex-adjusted mean BMI and hemoglobin A1c increased, while mean serum total cholesterol and prevalence of smoking decreased (all P < .001).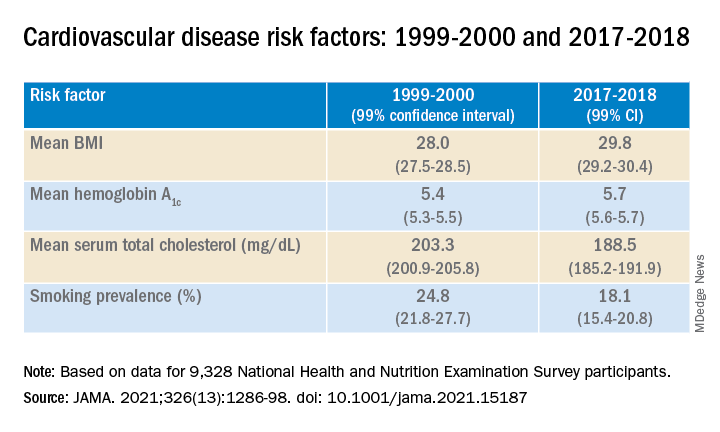
Age- and sex-adjusted 10-year atherosclerotic cardiovascular disease (ASCVD) risk decreased from 7.6% (6.9%-8.2%) in 1999-2000 to 6.5% (6.1%-6.8%) in 2011-2012, with no significant changes thereafter.
When the researchers looked at specific racial and ethnic groups, they found that age- and sex-adjusted BMI, systolic BP, and hemoglobin A1c were “consistently higher” in non-Hispanic Black participants compared with non-Hispanic White participants, but total cholesterol was lower (all P < .001).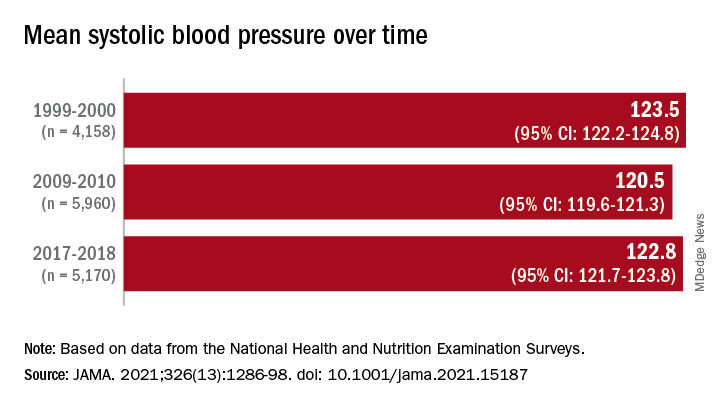
Participants with at least a college education or high family income had “consistently lower levels” of cardiovascular risk factors. And although the mean age- and sex-adjusted 10-year risk for ASCVD was significantly higher in non-Hispanic Black vs. non-Hispanic White participants (difference, 1.4% [1.0%-1.7%] in 1999-2008 and 2.0% [1.7%-2.4%] in 2009-2018), the difference was attenuated (by –0.3% in 1999-2008 and 0.7% in 2009-2018) after the researchers further adjusted for education, income, home ownership, employment, health insurance, and access to health care.
The differences in cardiovascular risk factors between Black and White participants “may have been moderated by social determinants of health,” the authors noted.
Provide appropriate education
Commenting on the study in an interview, Mary Ann McLaughlin, MD, MPH, associate professor of medicine, cardiology, Icahn School of Medicine at Mount Sinai, New York, pointed out that two important cardiovascular risk factors associated with being overweight – hypertension and diabetes – remained higher in the Black population compared with the White population in this analysis.
“Physicians and health care systems should provide appropriate education and resources regarding risk factor modification regarding diet, exercise, and blood pressure control,” advised Dr. McLaughlin, who was not involved with the study.
“Importantly, smoking rates and cholesterol levels are lower in the Black population, compared to the White population, when adjusted for many important socioeconomic factors,” she pointed out.
Dr. McLaughlin added that other “important social determinants of health, such as neighborhood and access to healthy food, were not measured and should be addressed by physicians when optimizing cardiovascular risk.”
The research reported in this publication was supported by the National Heart, Lung, and Blood Institute and by the National Institute of General Medical Sciences. One of the researchers, Joshua D. Bundy, PhD, was supported by a grant from the National Institutes of Health/Eunice Kennedy Shriver National Institute of Child Health and Human Development. Dr. He and the other coauthors and Dr. McLaughlin reported no relevant financial relationships.
A version of this article first appeared on Medscape.com.
Comorbidities larger factor than race in COVID ICU deaths?
Racial/ethnic disparities in COVID-19 mortality rates may be related more to comorbidities than to demographics, suggest authors of a new study.
Researchers compared the length of stay in intensive care units in two suburban hospitals for patients with severe SARS-CoV-2 infections. Their study shows that although the incidence of comorbidities and rates of use of mechanical ventilation and death were higher among Black patients than among patients of other races, length of stay in the ICU was generally similar for patients of all races. The study was conducted by Tripti Kumar, DO, from Lankenau Medical Center, Wynnewood, Pennsylvania, and colleagues.
“Racial disparities are observed in the United States concerning COVID-19, and studies have discovered that minority populations are at ongoing risk for health inequity,” Dr. Kumar said in a narrated e-poster presented during the American College of Chest Physicians (CHEST) 2021 Annual Meeting.
“Primary prevention initiatives should take precedence in mitigating the effect that comorbidities have on these vulnerable populations to help reduce necessity for mechanical ventilation, hospital length of stay, and overall mortality,” she said.
Higher death rates for Black patients
At the time the study was conducted, the COVID-19 death rate in the United States had topped 500,000 (as of this writing, it stands at 726,000). Of those who died, 22.4% were Black, 18.1% were Hispanic, and 3.6% were of Asian descent. The numbers of COVID-19 diagnoses and deaths were significantly higher in U.S. counties where the proportions of Black residents were higher, the authors note.
To see whether differences in COVID-19 outcomes were reflected in ICU length of stay, the researchers conducted a retrospective chart review of data on 162 patients admitted to ICUs at Paoli Hospital and Lankenau Medical Center, both in the suburban Philadelphia town of Wynnewood.
All patients were diagnosed with COVID-19 from March through June 2020.
In all, 60% of the study population were Black, 35% were White, 3% were Asian, and 2% were Hispanic. Women composed 46% of the sample.
The average length of ICU stay, which was the primary endpoint, was similar among Black patients (15.4 days), White patients (15.5 days), and Asians (16 days). The shortest average hospital stay was among Hispanic patients, at 11.3 days.
The investigators determined that among all races, the prevalence of type 2 diabetes, obesity, hypertension, and smoking was highest among Black patients.
Overall, nearly 85% of patients required mechanical ventilation. Among the patients who required it, 86% were Black, 84% were White, 66% were Hispanic, and 75% were Asian.
Overall mortality was 62%. It was higher among Black patients, at 60%, than among White patients, at 33%. The investigators did not report mortality rates for Hispanic or Asian patients.
Missing data
Demondes Haynes, MD, FCCP, professor of medicine in the Division of Pulmonary and Critical Care and associate dean for admissions at the University of Mississippi Medical Center and School of Medicine, Jackson, who was not involved in the study, told this news organization that there are some gaps in the study that make it difficult to draw strong conclusions about the findings.
“For sure, comorbidities contribute a great deal to mortality, but is there something else going on? I think this poster is incomplete in that it cannot answer that question,” he said in an interview.
He noted that the use of retrospective rather than prospective data makes it hard to account for potential confounders.
“I agree that these findings show the potential contribution of comorbidities, but to me, this is a little incomplete to make that a definitive statement,” he said.
“I can’t argue with their recommendation for primary prevention – we definitely want to do primary prevention to decrease comorbidities. Would it decrease overall mortality? It might, it sure might, for just COVID-19 I’d say no, we need more information.”
No funding source for the study was reported. Dr. Kumar and colleagues and Dr. Haynes reported no relevant financial relationships.
A version of this article first appeared on Medscape.com.