User login
Can Fish Skin Grafts Heal Diabetic Foot Ulcers?
TOPLINE:
METHODOLOGY:
- Standard wound care for diabetic foot ulcers involves vascular assessment, surgical debridement, use of appropriate dressings, infection management, and glycemic control; however, standard care is typically associated with poor outcomes.
- Researchers conducted a multicenter clinical trial in 15 tertiary care centers with diabetic foot units across France, Italy, Germany, and Sweden to evaluate the efficacy and safety of intact fish skin grafts over standard-of-care practices in treating complex diabetic foot ulcers.
- A total of 255 patients aged 18 years or older with diabetes and lower limb wounds penetrating to the tendon, capsule, bone, or joint were randomly assigned to receive either an intact fish skin graft or standard wound care for 14 weeks.
- The primary endpoint was the percentage of wounds achieving complete closure by 16 weeks.
- Wound healing was also assessed at 20 and 24 weeks.
TAKEAWAY:
- The proportion of wounds healed at 16 weeks was higher with intact fish skin grafts than with standard-of-care (44.0% vs 26.4% adjusted odds ratio [aOR], 2.58; 95% CI, 1.48-4.56).
- The fish skin grafts continued to be more effective than standard wound care practices at weeks 20 (aOR, 2.15; 95% CI, 1.27–3.70) and 24 (aOR, 2.19; 95% CI, 1.31–3.70).
- The mean time to healing was 17.31 weeks for the intact fish skin graft group and 19.37 weeks for the standard-of-care group; intact fish skin grafts were also associated with faster healing times than standard wound care (hazard ratio, 1.59; 95% CI, 1.07-2.36).
- Target wound infections were the most common adverse events, occurring in a similar number of patients in both the groups.
IN PRACTICE:
“Our trial demonstrated treatment of complex diabetic foot ulcers with intact fish skin grafts achieved a significantly greater proportion of diabetic foot ulcers healed at 16 weeks than standard of care, and was associated with increased healing at 20 and 24 weeks. That these results were achieved in non-superficial UT [University of Texas diabetic wound classification system] grade 2 and 3 diabetic foot ulcers and included ischemic and/or infected diabetic foot ulcers is of importance,” the authors wrote.
SOURCE:
The study was led by Dured Dardari, MD, PhD, Center Hospitalier Sud Francilien, Corbeil-Essonnes, France, and was published online in NEJM Evidence.
LIMITATIONS:
No limitations were discussed for this study.
DISCLOSURES:
The study was funded by European Commission Fast Track to Innovation Horizon 2020 and Kerecis. Two authors reported being employees with or without stock options at Kerecis, and other authors reported having ties with many sources including Kerecis.
This article was created using several editorial tools, including AI, as part of the process. Human editors reviewed this content before publication. A version of this article first appeared on Medscape.com.
Open Clinical Trials for Patients With Diabetes
Actively Recruiting
→Continuous Glucose Monitoring Devices in Hospitalized Veterans With Diabetes
More than 25% of the patients admitted in the general wards have a history of diabetes mellitus. Up to 30% of the hospitalized diabetics develop hypoglycemia (low glucose values); a condition that is associated with seizures, cardiac arrhythmias, and even death. In veterans, the prevalence is disproportionally higher. It is estimated that 40% to 50% of hospitalized veterans are diabetics. In this clinical trial the investigators describe the development of a novel system, the Glucose Telemetry System, with which glucose values can be wirelessly transmitted from the patient’s bedside to a monitor device at the nursing station. The goal of this work is to develop a more effective glucose surveillance system at the general wards, which can decrease hypoglycemia in the hospital and improve clinical outcomes.
ID: NCT03508934
Sponsor; Investigator: VA Office of Research and Development; Ilias Spanakis, MD
Locations: Baltimore VA Medical Center, Maryland
→Optimizing Gait Rehabilitation for Veterans With Non-Traumatic Lower Limb Amputation (GEM)
The population of older veterans with nontraumatic lower limb amputation is growing. Following lower limb amputation, asymmetrical movements persist during walking and likely contribute to disabling sequelae including secondary pain conditions, poor gait efficiency, impaired physical function, and compromised skin integrity of the residual limb. This study seeks to address chronic gait asymmetry by evaluating the efficacy of two error-manipulation gait training programs to improve gait symmetry for veterans with nontraumatic lower limb amputation. Additionally, this study will evaluate the potential of error-manipulation training programs to improve secondary measures of disability and residual limb skin health. Ultimately, this study aims to improve conventional prosthetic rehabilitation for veterans with nontraumatic amputation through gait training programs based in motor learning principles, resulting in improved.
ID: NCT003995238
Sponsor; Investigator: VA Office of Research and Development; Cory L. Christiansen, PhD
Locations: Rocky Mountain Regional VA Medical Center, Aurora, Colorado; Hunter Holmes McGuire VA Medical Center, Richmond, Virginia
→Empowering Veterans to Actively Communicate and Engage in Shared Decision Making in Medical Visits, A Randomized Controlled Trial (ACTIVet-2)
Type 2 diabetes is a significant condition in VA affecting 20% of VA patients. Adherence to medication regimens and lifestyle factors is important to achieve care goals for these patients. Patients who use active participatory communication behaviors with their providers have better adherence to treatment and better biomedical outcomes, yet many patients are not prepared to engage in active communication with their providers. Existing coaching interventions have not been adopted in practice because of the cost of trained personnel. The investigators haveshown the efficacy of a low-cost video that did not require trained personnel. This proposal proposes to test implementation strategies to deliver that video in VA primary care clinics and to test the effectiveness of the video to improve outcomes in a hybrid type 2 effectiveness implementation trial using a cluster randomized stepped wedgedesign at eight sites. This proposal will test feasibility of implementing the video and if successful will generate the evidence to justify widespread dissemination of the video.
ID: NCT05169359
Sponsor; Investigator: VA Office of Research and Development; Howard S. Gordon, MD
Location: 8 locations, including Jesse Brown VA Medical Center, Chicago; Edward Hines Jr. VA Hopsital, Hines, Illinois
→The Diabetes Staging System in Patient Aligned Care Teams
The purpose of this study is to examine the feasibility/acceptability of the Diabetes Staging System in patient aligned care teams and its ability to increase sodium-glucosecotransporter-2 inhibitor and glucagon-like-1 peptide use in veteran patients with type 2 diabetes and cardiovascular disease and/or chronic kidney disease. A novel type 2 diabetes staging system patterned after Tumor Node Metastasis cancer staging that uses the number of macrovascular and microvascular complications and most recent hemoglobin A1c and glomerular filtration rate to determine Diabetes Staging System stage which reflects disease severity.
ID: NCT06142006
Sponsor; Collaborator: Durham VA Medical Center; Moahad Dar, MD
Location: Greenville VA Health Care Center, North Carolina
→Enhancing Mental and Physical Health of Women Veterans (EMPOWER)
Women veterans are the fastest growing segment of VA users. This dramatic growth has created challenges for VA to ensure that appropriate services are available to meet women veterans’ needs, and that they will want and be able to use those services. The EMPOWER QUERI 2.0 Program is a cluster randomized type 3 hybrid implementation effectiveness trial testing 2 strategies designed to support implementation and sustainment of evidence-based practices for women veterans in at least 20 VA facilities from 4 regions.
ID: NCT05050266
Sponsor; Investigator: VA Office of Research and Development; Alison B. Hamilton, PhD, MPH
Location: VA Greater Los Angeles Healthcare System
→Investigation of Rifampin to Reduce Pedal Amputations for Osteomyelitis in Diabetics (VA INTREPID)
The purpose of this research study is to determine if rifampin, an antibiotic (a medicine that treats infections), is effective in treating osteomyelitis (infection of the bone) of the foot in patients with diabetes. Despite use of powerful antibiotics prescribed over a long period of time, many diabetic patients remain at a high risk for needing an amputation of part of the foot or lower leg because the osteomyelitis is not cured. Some small research studies have shown that addition of rifampin to other antibiotics is effective in treating osteomyelitis. However, because few diabetics with osteomyelitis have been studied, there is no definite proof that it is better than the usual treatments for diabetic patients. If this study finds that adding rifampin to the usual antibiotics prescribed for osteomyelitis reduces the risk for amputations, doctors will be able to more effectively treat many veteran patients with this serious infection. Improving treatment outcomes is an important healthcare goal of the VA.
ID: NCT03012529
Sponsor; Investigator: VA Office of Research and Development; Paul A. Monach, MD, PhD
Location: 30 VA locations, including South Texas Health Care System, San Antonio; Cincinnati VA Medical Center, Ohio; VA Northern California Health Care System, Mather; Washington DC VA Medical Center; William S. Middleton Memorial Veterans Hospital, Madison, Wisconsin
→Effectiveness of Remote Foot Temperature Monitoring (STOP)
Diabetic foot ulcers are common, debilitating, and costly complications of diabetes, disproportionately impacting Black and rural veterans. Forty percent of individuals have an ulcer recurrence within a year of ulcer healing and 65% within 5 years. Monitoring plantar foot temperatures is one of the few interventions that reduces the risk of ulcer recurrence. Despite the evidence, adoption has been poorbecause the original procedures, including the use of handheld thermometers, were burdensome and time-consuming. Podimetrics, a private company, has developed a temperature monitoring system involving a “smart” mat that can wirelessly transmit data and a remote monitoring team that works with VA providers to assist with triage and monitoring. This care model has incredible promise, but has been untested in VA. The investigators propose to conduct a randomized trial to evaluate effectiveness of remote temperature monitoring as well as costs. Additionally, the investigators will evaluate the implementation process, including barriers and facilitators to use among key stakeholders.
ID: NCT05728411
Sponsor; Investigator: VA Office of Research and Development; Rachel M. Thomas
Location: Edward Hines Jr. VA Hospital, Hines, Illinois; Hunter Holmes McGuire VA Medical Center, Richmond, Virginia; VA Puget Sound Health Care System, Seattle, Washington
→Continuous Glucose Monitoring for Hyperglycemia in Critically Ill Patients
The investigators intend to conduct a single-center, prospective, randomized comparative trial of patients admitted to the intensive care unit who received continuous glucose monitoring vs point of care glucose monitoring. The study will examine relevant outcomes for patients in the intensive care unit with diabetes mellitus and/or hyperglycemia. The primary outcome of the study will be the proportion of time in target range (blood glucose 70-180 mg/dL).
ID: NCT05442853
Sponsor; Investigator: Malcom Randall VA Medical Center; Andrew J. Franck, PharmD
Location: Malcolm Randall VA Medical Center, Gainesville, Florida
→Investigation of Metformin in Pre-Diabetes on Atherosclerotic Cardiovascular OuTcomes (VA-IMPACT)
CSP #2002 is a multicenter, prospective, randomized, double blind, secondary prevention trial to test the hypothesis that treatment with metformin, compared with placebo, reduces mortality and cardiovascular morbidity in veterans with pre-diabetes and established atherosclerotic cardiovascular disease. Qualifying patients have pre-diabetes defined by HbA 1c , fasting blood glucose, or oral glucose tolerance test criteria; clinically evident coronary, cerebrovascular, or peripheral arterial atherosclerotic cardiovascular disease; and estimated glomerular filtration rate of at least 45 mL/min/1.73 m 2 ; and do not fulfill any exclusion criteria.
ID: NCT04838392
Sponsor; Investigator: VA Office of Research and Development; Gregory G. Schwartz, PhD, MD
Locations: 40 locations
GLP-1 RAs Reduce Early-Onset CRC Risk in Patients With Type 2 Diabetes
PHILADELPHIA — according to the results of a retrospective study.
“This is the first large study to investigate the impact of GLP-1 RA use on EO-CRC risk,” principal investigator Temitope Olasehinde, MD, resident physician at the University Hospitals Cleveland Medical Center, Case Western Reserve University in Cleveland, Ohio, said in an interview.
The results indicate the GLP-1 RAs have a potentially protective role to play in combating EO-CRC, the incidence of which is notably rising in younger adults, with a corresponding increase in associated mortality.
Previous studies investigating the link between GLP-1 RAs and CRC did not capture patients aged younger than 50 years; thus, it was unknown if these results could be extrapolated to a younger age group, said Olasehinde.
The researcher presented the findings at the annual meeting of the American College of Gastroenterology.
Retrospective Database Analysis
Olasehinde and colleagues analyzed data from TriNetX, a large federated deidentified health research network, to identify patients (age ≤ 49 years) with diagnosed T2D subsequently prescribed antidiabetic medications who had not received a prior diagnosis of CRC. Additionally, patients were stratified on the basis of first-time GLP-1 RA use.
They identified 2,025,034 drug-naive patients with T2D; of these, 284,685 were subsequently prescribed GLP-1 RAs, and 1,740,349 remained in the non–GLP-1 RA cohort. Following propensity score matching, there were 86,186 patients in each cohort.
Patients who received GLP-1 RAs had significantly lower odds of developing EO-CRC than those who received non–GLP-1 RAs (0.6% vs 0.9%; P < .001; odds ratio [OR], 0.61; 95% CI, 0.54-068).
Furthermore, a sub-analysis revealed that patients who were obese and taking GLP-1 RAs had significantly lower odds of developing EO-CRC than patients who were obese but not taking GLP-1 RAs (0.7% vs 1.1%; P < .001; OR, 0.58; 95% CI, 0.50-067).
A Proposed Protective Effect
Although GLP-1 RAs are indicated for the treatment of T2D and obesity, recent evidence suggests that they may play a role in reducing the risk for CRC as well. This protective effect may be produced not only by addressing T2D and obesity — both important risk factors for CRC — but also via cellular mechanisms, Olasehinde noted.
“GLP-1 receptors are widely expressed throughout the gastrointestinal tract, with various effects on tissues in the stomach, small intestine, and colon,” she explained. Specifically, activation of these receptors in the proximal and distal colon promotes the release of “important factors that protect and facilitate healing of the intestinal epithelium” and “regulate the gut microbiome.”
This is particularly relevant in EO-CRC, she added, given its greater association with T2D and obesity, both factors that “have been shown to create dysbiosis in the gut microbiome and low-grade inflammation via release of free radicals/inflammatory cytokines.”
These results provide more evidence that EO-CRC “is clinically and molecularly distinct from late-onset colorectal cancer,” which is important for both clinicians and patients to understand, said Olasehinde.
“It is imperative that we are all aware of the specific signs and symptoms this population presents with and the implications of this diagnosis in younger age groups,” she added. “Patients should continue making informed dietary and lifestyle modifications/choices to help reduce the burden of EO-CRC.”
Hypothesis-Generating Results
Aasma Shaukat, MD, MPH, who was not affiliated with the research, called the results promising but — at this stage — primarily useful for stimulating future research.
"We do need more studies such as this to generate hypotheses that can be studied prospectively," Shaukat, professor of medicine and population health, and director of GI Outcomes Research at NYU Langone Health in New York City, told Medscape Medical News.
She referred to another study, published in JAMA Oncology, that also used the TriNetX research network, which showed that GLP-1 RAs were associated with reduced CRC risk in drug-naive patients with T2D.
Shaukat also noted that the current analysis has limitations that should be considered. "The study is retrospective, and confounding is a possibility,” she said.
“How the groups that did and did not receive GLP-1 RAs differ in other risk factors that could be the drivers of the cancers is not known. Whether cancers were detected through screening or symptoms, stage, and other features that may differ are not known. Finally, since we don’t know who did or did not have colonoscopy, undiagnosed cancers are not known," she explained.
Shaukat, who was the lead author of the ACG 2021 Colorectal Cancer Screening Guidelines, added that the field would benefit from studies providing "biological plausibility information, such as animal studies to understand how GLP-1 RAs may modulate risk of colon cancer; other population-based cohort studies on the incidence of colon cancer among GLP-1 RA users and non-users; and prospective trials on chemoprevention."
The study had no specific funding. Olasehinde reported no relevant financial relationships. Shaukat reported serving as a consultant for Freenome, Medtronic, and Motus GI, as well as an advisory board member for Iterative Scopes Inc.
A version of this article appeared on Medscape.com.
FROM ACG 2024
Should the Body Roundness Index Replace BMI?
In daily practice, physicians need a quick and simple way to assess whether a patient’s weight presents a health risk. For decades, the body mass index (BMI) has been used for this purpose, with calculations based on height and weight. Despite its convenience, BMI has faced increasing criticism.
According to experts, BRI may more accurately identify people with high levels of visceral fat than BMI. It’s well documented that abdominal fat is strongly linked to higher risks for obesity-related diseases.
Studies Support BRI
Several studies have suggested that BRI could be a valuable tool for assessing health risks. In June of this year, researchers from China reported a significant U-shaped association between BRI and overall mortality in a paper published in JAMA Network Open. People with very low or very high BRI had an increased risk for death, noted Xiaoqian Zhang, MD, from Beijing University of Chinese Medicine, Beijing, China, and his colleagues.
A study published in September in the Journal of the American Heart Association showed that elevated BRI over several years was associated with an increased risk for cardiovascular diseases. “The BRI can be included as a predictive factor for cardiovascular disease incidence,” stated the authors, led by Man Yang, MD, from Nanjing Medical University in Nanjing, China.
Why Replace BMI?
Why is a replacement for BMI necessary? When asked by this news organization, Manfred Müller, MD, senior professor at the Institute of Human Nutrition and Food Science at the University of Kiel, in Germany, explained: “BMI was designed to provide a simple value that was as independent of body size as possible, that could detect obesity and estimate related disease risks. But scientifically, BMI has always been a very crude measure to characterize disease risks.”
Müller was part of a research group led by US mathematician Diana Thomas, PhD, who, at the time, worked at Montclair State University, Montclair, New Jersey, and now holds a position at the US Military Academy at West Point, in New York. The group developed and published the BRI in 2013.
BMI Classifies Bodybuilders as Obese
The researchers justified their search for a “better” anthropometric measure with two aspects of BMI that still constitute the main points of criticism of the widely used index today:
BMI incorrectly classifies individuals with significant muscle mass, like bodybuilders, as obese, as it doesn’t distinguish between fat and muscle mass.
BMI provides no information about fat distribution in the body — whether it’s concentrated in the hips or the abdomen, for example.
In practice, this means that a person with a normal BMI could already have prediabetes, high blood pressure, and high cholesterol, which might go undetected if no further investigations are conducted based solely on their BMI.
The BRI aims to solve this problem. As the name suggests, this index seeks to capture a person’s “roundness.” The formula for calculating BRI includes waist circumference and height but excludes body weight:
BRI = 364.2 − 365.5 × √(1 − [Waist circumference in cm/2π]²/[0.5 × Height in cm]²)
In their 2013 article, Thomas, Müller, and colleagues wrote that it still needed to be proven whether their newly developed index correlated with mortality and the risk for cardiovascular and metabolic diseases — and whether it was sufficiently better than BMI to justify the more complex calculation.
Could BRI Replace BMI?
Opinions differ on whether the BRI should replace the BMI. Zhang’s team concluded that the BRI needs to be validated in additional independent cohorts. If it does, it could become a practical screening tool in patient care.
Yang’s research group is optimistic about the BRI’s future: “The longitudinal trajectory of the BRI could be used as a novel indicator of cardiovascular disease risk, which provides a new possibility for cardiovascular disease prevention,” they wrote.
However, even BRI Co-creator Thomas has concerns. “Our entire medical system has been built around the BMI,” she told JAMA, referring to factors such as children’s growth charts and dosage recommendations for medications. That cannot be changed overnight.
Any anthropometric measure intended to replace BMI would need to be rigorously validated across all age groups, genders, and ethnicities. The impact of interventions such as bariatric surgery, diet, and exercise on the new measure would also need to be demonstrated.
Anthropometric Measures Only for Clinical Use
Even if BRI proves to be a “better” metric than BMI for patient care, Müller believes it would be no more suitable for research than BMI. “Regardless of the anthropometric measure, these are practical tools for everyday use,” he stressed.
“A high BRI, like a high BMI, is a risk factor — similar to high blood pressure, high cholesterol levels, or smoking — but it is not a disease,” he added. “In practice, as a physician, I know that a patient with a high BMI or BRI has an increased risk. I need to pay attention to that patient.”
Problems arise when indices like BMI or BRI are used in research. “These ‘invented’ anthropometric measures have no biological basis, which can harm obesity research,” Müller emphasized.
He cited the example of genetic research into obesity, which seeks to identify associations between specific genetic patterns and BMI values. “Why should weight in kilograms divided by height in meters squared be genetically determined?” he asked. “These measures are human-made constructs that have nothing to do with biology.”
Müller believes that the use of BMI has created a “gray area in obesity research” that may account for many of the “unexplained” phenomena in this field.
The BMI Might Be Responsible for the ‘Healthy Obese’
One such phenomenon is the much-discussed “healthy obese,” referring to individuals with a BMI over 30 who do not have high blood sugar, high blood pressure, metabolic disorders, or elevated uric acid levels. “It’s speculated that it must be due to genetic factors, but in reality, the classification is simply wrong,” Müller said.
According to Müller, research should rely on other methods to determine obesity or relevant fat. For example, to assess diabetes risk, liver fat needs to be measured through enzyme tests, ultrasonography, CT, or MRI.
Visceral fat is also important in assessing cardiometabolic risk. “In the doctor’s office, it’s acceptable to estimate this by looking at waist circumference or even BRI. But for research, that’s inadequate,” noted Müller. Direct measurement of trunk fat with dual-energy x-ray absorptiometry or visceral fat with CT or MRI is needed.
“You always have to distinguish between research and patient care. In daily practice, measures like BRI or BMI are sufficient for assessing cardiometabolic risk. But in research, they are not,” Müller explained. To accurately study the disease risks associated with obesity, one must be aware that “with BMI, you cannot create scientifically valid patient or population groups because this value is far too imprecise.”
This story was translated from Medscape’s German edition using several editorial tools, including AI, as part of the process. Human editors reviewed this content before publication. A version of this article appeared on Medscape.com.
The Impact of a Metformin Recall on Patient Hemoglobin A1c Levels at a VA Network
About 1 in 10 Americans have diabetes mellitus (DM), of which about 90% to 95% are diagnosed with type 2 DM (T2DM) and veterans are disproportionately affected.1,2 About 25% enrolled in the Veterans Health Administration (VHA) have T2DM, which has been attributed to exposure to herbicides (eg, Agent Orange), decreased physical activity resulting from past physical strain, chronic pain, and other physical limitations resulting from military service.3-5
Pharmacologic management of DM is guided by the effectiveness of lifestyle interventions and comorbid diagnoses. Current DM management guidelines recommend patients with comorbid atherosclerotic cardiovascular disease, chronic kidney disease, or congestive heart failure receive first-line diabetes therapy with a sodium-glucose cotransporter-2 (SGLT-2) inhibitor or glucagon-like peptide-1 receptor (GLP-1) agonist.
Metformin remains a first-line pharmacologic option for the treatment of T2DM with the goal of achieving glycemic management when lifestyle interventions are insufficient.6,7 Newer antihyperglycemic therapies have been studied as adjunct therapy to metformin. However, there is limited literature comparing metformin directly to other medication classes for the treatment of T2DM.8-13 A systematic review of treatment-naive patients found HbA1c reductions were similar whether patients received metformin vs an SGLT-2 inhibitor, GLP-1 agonist, sulfonylurea, or thiazolidinedione monotherapy.10 The analysis found dipeptidyl-peptidase-4 (DPP-4) inhibitors had inferior HbA1c reduction compared to metformin.10 A Japanese systematic review compared metformin to thiazolidinediones, sulfonylureas, glinides, DPP-4 inhibitors, α-glucosidase inhibitors, or SGLT-2 inhibitors for ≥ 12 weeks but found no statistically significant differences in
On May 28, 2020, the US Food and Drug Administration (FDA) asked 5 pharmaceutical companies to voluntarily recall certain formulations of metformin. This action was taken when FDA testing revealed unacceptably high levels of N-Nitrosodimethylamine, a probable carcinogen.14 This FDA recall of metformin extended-release, referred to as metformin sustained-action (SA) within the VHA electronic medication file but the same type of formulation, prompted clinicians to revisit and revise the pharmacologic regimens of patients taking the drug. Because of the paucity of head-to-head trials comparing metformin with newer alternative antihyperglycemic therapies, the effect of treatment change was unknown. In response, we aimed to establish a data registry within Veterans Integrated Service Network (VISN) 6.
Registry Development
The VISN 6 registry was established to gather long-term, observational, head-to-head data that would allow review of HbA1c levels before and after the recall, as well as HbA1c levels broken down by the agent that patients were switched to after the recall. Another goal was to explore prescribing trends following the recall.
Data Access Request Tracker approval was obtained and a US Department of Veterans Affairs (VA) Information and Computing Infrastructure workspace was developed to host the registry data. The research cohort was established from this data, and the registry framework was finalized using Structured Query Language (SQL). The SQL coding allows for recurring data updates for all individuals within the cohort including date of birth, race, sex, ethnicity, VHA facility visited, weight, body mass index, HbA1c level, creatinine clearance, serum creatinine, antihyperglycemic medication prescriptions, adverse drug reactions, medication adherence (as defined by ≥ 80% refill history), and hospitalizations related to diabetes. For the purposes of this initial analysis, registry data included demographics, diabetes medications, and HbA1c results.
METHODS
This study was a concurrent, observational, multicenter, registry-based study conducted at the Western North Carolina VA Health Care System (WNCVAHCS). The study was approved by the WNCVAHCS institutional review board and research and development committees.
All patients aged ≥ 18 years with T2DM and receiving health care from VISN 6 facilities who had an active metformin SA prescription on, and 1 year prior to, June 1, 2020 (the initial date VHA began implementing the FDA metformin recall) were entered into the registry. Data from 1 year prior were collected to provide a baseline. Veterans were excluded if they received metformin SA for any indication other than T2DM, there was no pre- or postrecall HbA1c measurement, or death. We included 15,594 VISN 6 veterans.
Registry data were analyzed to determine whether a significant change in HbA1c level occurred after the metformin recall and in response to alternative agents being prescribed. Data from veterans who met all inclusion criteria were assessed during the year before and after June 1, 2020. Demographic data were analyzed using frequency and descriptive statistics. The Shapiro Wilkes test was performed, and data were found to be nonparametric; therefore the Wilcoxon signed-rank test was used to evaluate the hypothesis that HbA1c levels were not impacted by the recall.
Our sample size allowed us to create exact matched pairs of 9130 individuals and utilize rank-biserial correlation to establish effect size. Following this initial population-level test, we constructed 2 models. The first, a linear mixed-effects model, focused solely on the interaction effects between the pre- and postrecall periods and various medication classes on HbA1c levels. Second, we constructed a random-effects within-between model (REWB) to evaluate the impact ofmedication classes and demographic variables. Statistical significance was measured at P < .05 with conservative power at .90. The effect size was set to 1.0, reflecting a minimum clinically important difference. Literature establishes 0.5 as a modest level of HbA1c improvement and 1.0 as a clinically significant improvement.
RESULTS
Preliminary results included 15,594 veterans who received a metformin SA prescription as of June 1, 2020 from VISN 6 facilities; 15,392 veterans had a drug exposure end on June 1, 2020, indicating their standard therapy of metformin SA was discontinued following the FDA recall. Two hundred and two veterans were excluded from the registry because they continued to receive metformin SA from existing stock at a VISN6 facility.

Wilcoxon Signed-Rank Test
We created exact pairs by iterating the data and finding the closest measurements for each patient before and after the recall. This has the advantage over averaging a patient’s pre- and post-HbA1c levels, as it allows for a rank-biserial correlation. Using the nonparametric Wilcoxon signed-rank test, V was 20,100,707 (P < .001), indicating a significant effect. The –0.29 rank-biserial correlation, which was computed to assess the effect size of the recall, suggests that the median HbA1c level was lower postrecall vs prerecall. The magnitude of the correlation suggests a moderate effect size, and while the recall had a noticeable impact at a population level, it was not extreme (Table 2).
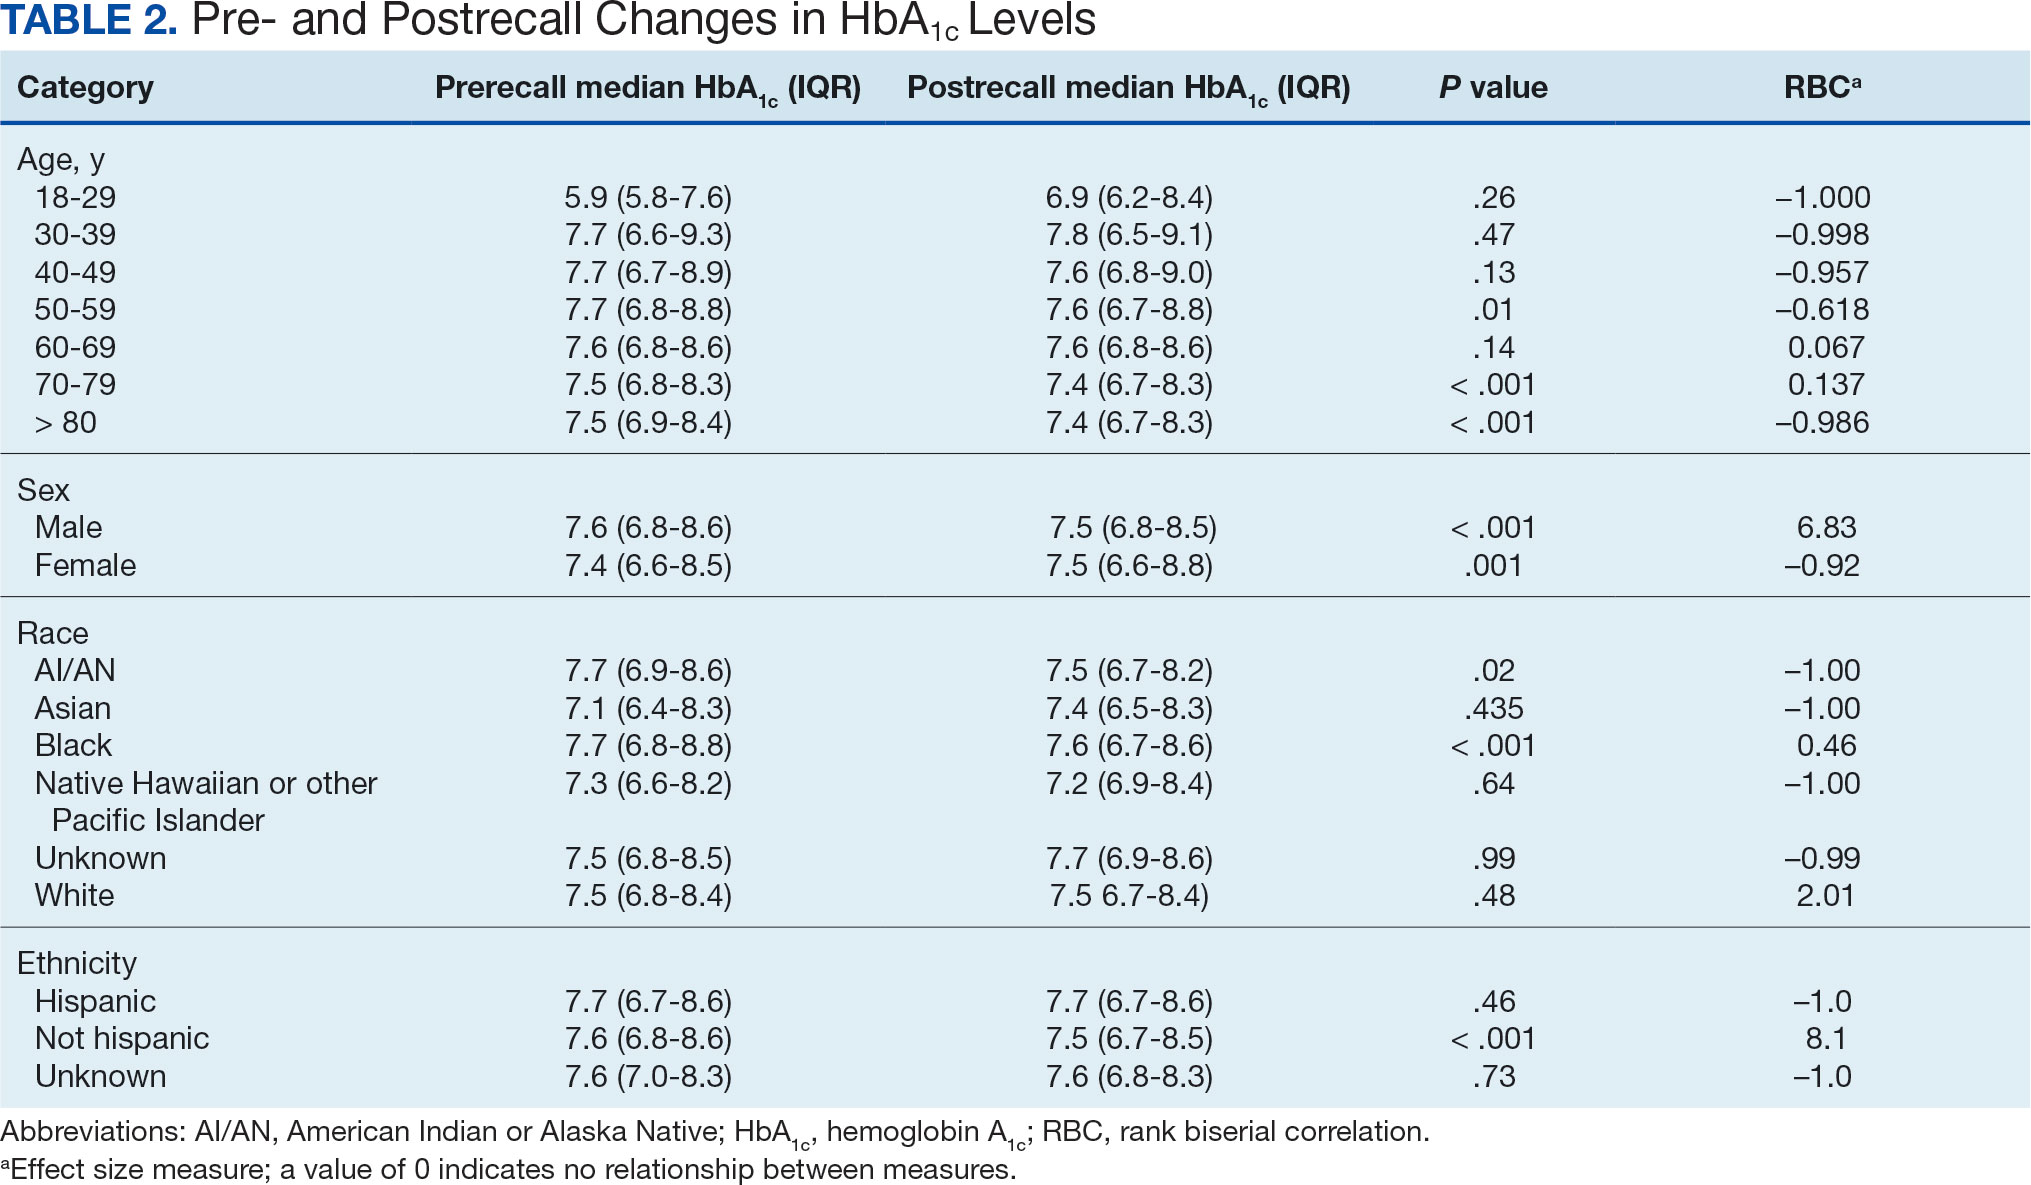
Linear Mixed-Effects Model
The binary variable for medication class exposure suggests the use of a logit link function for binary outcomes within the multilevel modeling framework.15 We employed a linear mixed-effects model to investigate the impact that switching from metformin SA to other T2DM medications had on HbA1c levels. The model was adjusted for patient-specific random effects and included interaction terms between the recall period (before and after) and the usage of different T2DM medications.
Model Fit and Random Effects
The model demonstrated a residual maximum likelihood criterion of 100,219.7, indicating its fit to the data. Notably, the random effects analysis revealed a substantial variability in baseline HbA1c levels across patients (SD, 0.94), highlighting the importance of individual differences in DM management. Medication classes with zero or near-zero exposure rate were removed. Due to demographic homogeneity, the model did not converge on demographic variables. Veterans were taking a mean of 1.8 T2DM medications and metformin SA was most common (Table 3).
During the postrecall period, metformin SA remained the most frequently prescribed medication class. This may be attributed to the existence of multiple manufacturers of metformin SA, some of which may not have been impacted by the recall. VISN 6 medical centers could have sought metformin SA outside of the usual procurement path following the recall.
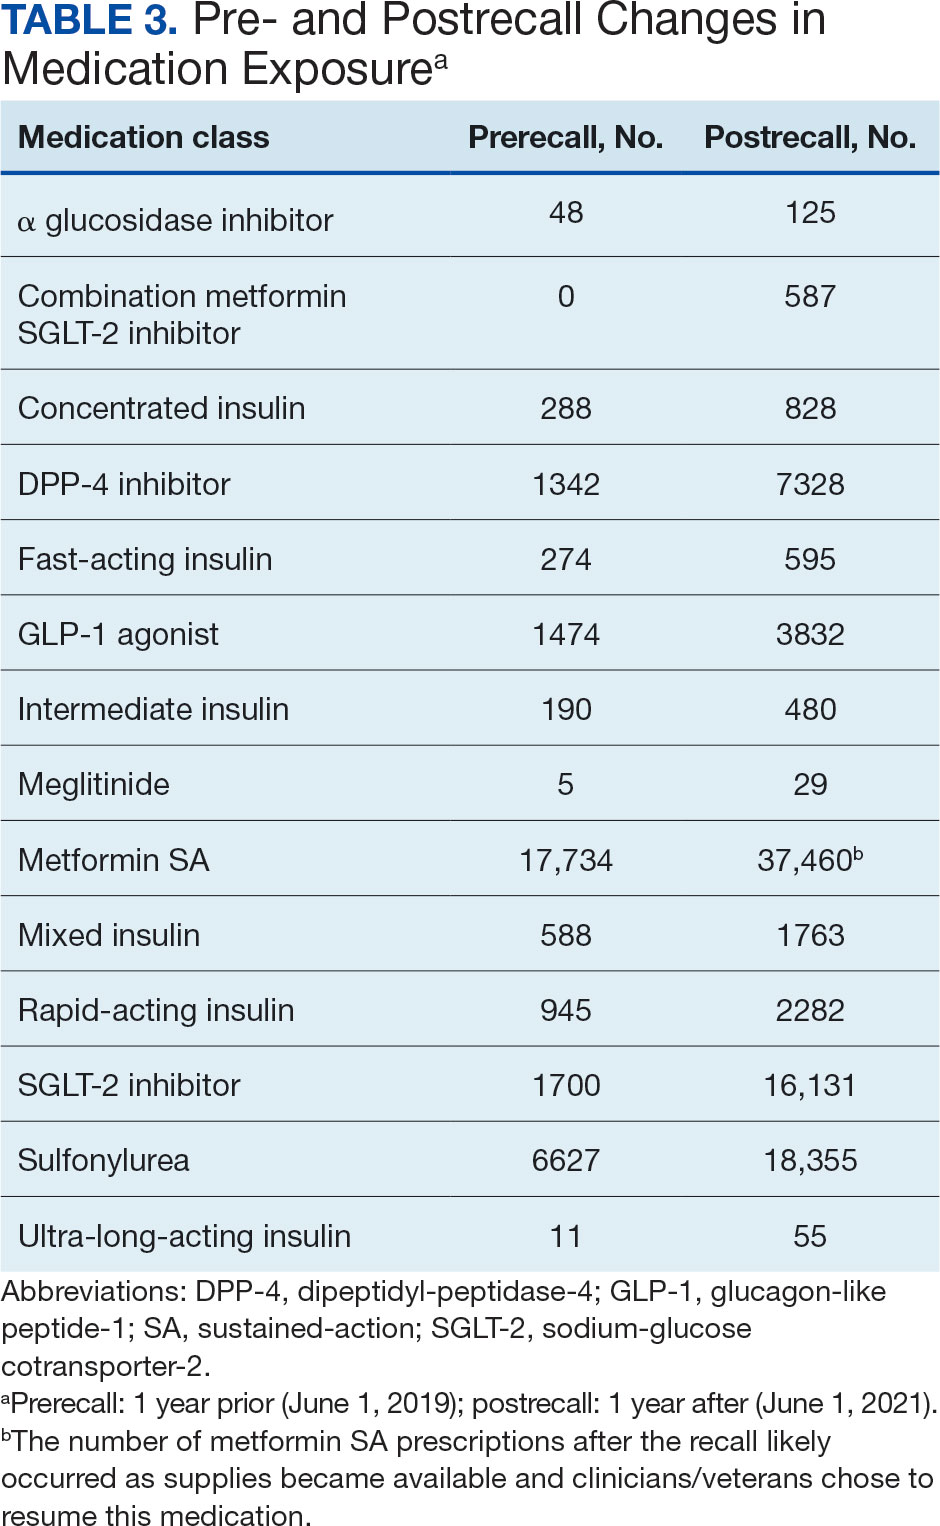
Complex Random Effects Model
We employed a complex REWB model that evaluated the impact of medication classes on HbA1c levels, accounting for both within and between subject effects of these medications, along with demographic variables (sex, race, and ethnicity) (eAppendix). This model accounts for individual-level changes over time (within-patient effects) and between groups of patients (between-patient effects). This is a more comprehensive model aimed at understanding the broader impact of medications on HbA1c levels across diverse patient groups.
Most demographic categories did not demonstrate significant effects in this model. Black individuals experienced a slight increase in HbA1c levels compared with other racial categories that was not statistically significant. However, this model confirms the findings from the linear mixed-effects model that GLP-1 agonists showed a substantial decrease in HbA1c levels within patients (coefficient –0.5; 95% CI, –0.56 to –0.44; P < .001) and a moderate increase between patients (coefficient, 0.21; 95% CI, 0.12-0.31; P < .001). Additionally, SGLT-2 inhibitors had a notable decrease within patients (coefficient, –0.27; 95% CI, –0.32 to –0.22; P < .001).Another notable finding with our REWB model is insulin usage was associated with high HbA1c levels, but only between subjects. Long-acting insulin (coefficient, 0.96; 95% CI, 0.90-1.01; P <. 001) and mixed insulin (coefficient, 1.09; 95% CI, 0.94-1.24; P < .001) both displayed marked increases between patients, suggesting future analysis may benefit from stratifying across insulin users and nonusers.
Fixed Effect Analysis
The fixed effects analysis yielded several notable findings. The intercept, representing the mean baseline HbA1c level, was estimated at 7.8% (58 mmol/mol). The coefficient for the period (postrecall) was not statistically significant, indicating no overall change in HbA1c levels from before to after the recall when specific medication classes were not considered (Table 4). Among medication classes examined, several showed significant associations with HbA1c levels. DPP-4 inhibitors and GLP-1 agonists were associated with a decrease in HbA1c levels, with coefficients of −0.08 and −0.24, respectively. Long-acting insulin and metformin immediate-release (IR) were associated with an increase in HbA1c levels, as indicated by their positive coefficients of 0.38 and 0.16, respectively. Mixed insulin formulations and sulfonylureas showed an association with decreased HbA1c levels.
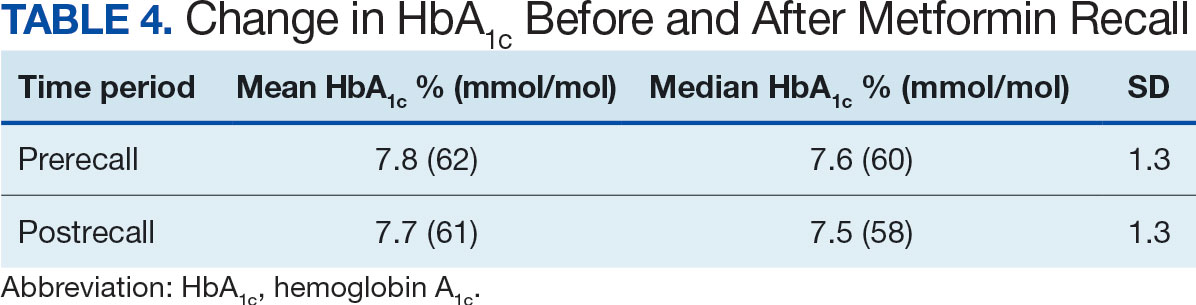
Interaction Effects
The interaction terms between the recall period and the medication classes provided insights into the differential impact of the medication switch postrecall. Notably, the interaction term for long-acting insulin (coefficient, −0.10) was significant, suggesting a differential effect on HbA1c levels postrecall. Other medications, like metformin IR, also exhibited significant interaction effects, indicating changes in the impact on HbA1c levels in the postrecall period. The binary variable for medication class exposure suggests the use of a logit link function for binary outcomes within the multilevel modeling framework.15 We did not address the potential for cross cluster heterogeneity due to different medication classes.
DISCUSSION
This study is an ongoing, concurrent, observational, multicenter, registry-based study consisting of VISN 6 veterans who have T2DM and were prescribed metformin SA on June 1, 2020. This initial aim was to evaluate change in HbA1c levels following the FDA metformin recall. While there was substantial variability in baseline HbA1c levels across the patients, the mean baseline HbA1c level at 7.5% (58 mmol/mol). Patients taking GLP-1 agonists showed substantial decrease in HbA1c levels (coefficient; –0.5; 95% CI, –0.56 to –0.44; P <. 001). Patients taking SGLT-2 inhibitors had a notable decrease in HbA1c (coefficient, –0.27; 95% CI, –0.32 to –0.22; P < .001). Despite this, the coefficient for the postrecall period was not statistically significant, indicating no overall change in HbA1c levels from pre- to postrecall when specific medication classes were not considered.
Further analysis included assessment of prescribing trends postrecall. There was an increase in SGLT-2 inhibitor, GLP-1 agonist, and DPP-4 inhibitor prescribing. Considering the growing evidence of the cardiovascular and renal benefits of these medication classes, specifically the GLP-1 agonists and SGLT-2 inhibitors, this trend would be expected.
Limitations
This study cohort did not capture veterans with T2DM who transferred their health care to VISN 6 after June 1, 2020, and continued to receive metformin SA from the prior facility. Inclusion of these veterans would have increased the registry population. Additionally, the cohort did not identify veterans who continued to receive metformin SA through a source other than the VA. Without that information, the registry cohort may include veterans thought to have either transitioned to a different therapy or to no other T2DM therapy after the recall.
Given that DM can progress over time, it is possible the transition to a new medication after the recall was the result of suboptimal management, or in response to an adverse effect from a previous medication, and not solely due to the metformin SA recall. In addition, there are several factors that could impact HbA1c level over time that were not accounted for in this study, such as medication adherence and lifestyle modifications.
The notable level of metformin SA prescriptions, despite the recall, may be attributed to several factors. First, not all patients stopped metformin completely. Review of the prescription data indicated that some veterans were provided with limited refills at select VA medical centers that had supplies (medication lots not recalled). Access to a safe supply of metformin SA after the recall may have varied among VISN 6 facilities. It is also possible that as new supplies of metformin SA became available, veterans restarted metformin SA. This may have been resumed while continuing a new medication prescribed at the beginning of the recall. As the year progressed after the recall, an increase in metformin SA prescriptions likely occurred as supplies became available and clinicians/veterans chose to resume this medication therapy.
Conclusions
Results of this initial registry study found no difference in HbA1c levels across the study population after the metformin SA recall. However, there was clinical difference in the HbA1c within veterans prescribed SGLT-2 inhibitors and GLP-1 agonists. As expected, prescribing trends showed an increase in these agents after the recall. With the known benefits of these medications beyond glucose lowering, it is anticipated the cohort of veterans prescribed these medications will continue to grow.
The VISN 6 research registry allowed this study to gain an important snapshot in time following the metformin SA recall, and will serve as an important resource for future DM research endeavors. It will allow for ongoing evaluation of the impact of the transition to alternative T2DM medications after the metformin SA recall. Future exploration will include evaluation of adverse drug reactions, DM-related hospitalizations, emergency department visits related to T2DM, changes in renal function, and cardiovascular events among all diabetes medication classes.
Acknowledgments
The study team thanks the Veterans Affairs Informatics and Computing Infrastructure for their help and expertise throughout this project. The authors acknowledge the contributions of Philip Nelson, PharmD, and Brian Peek, PharmD.
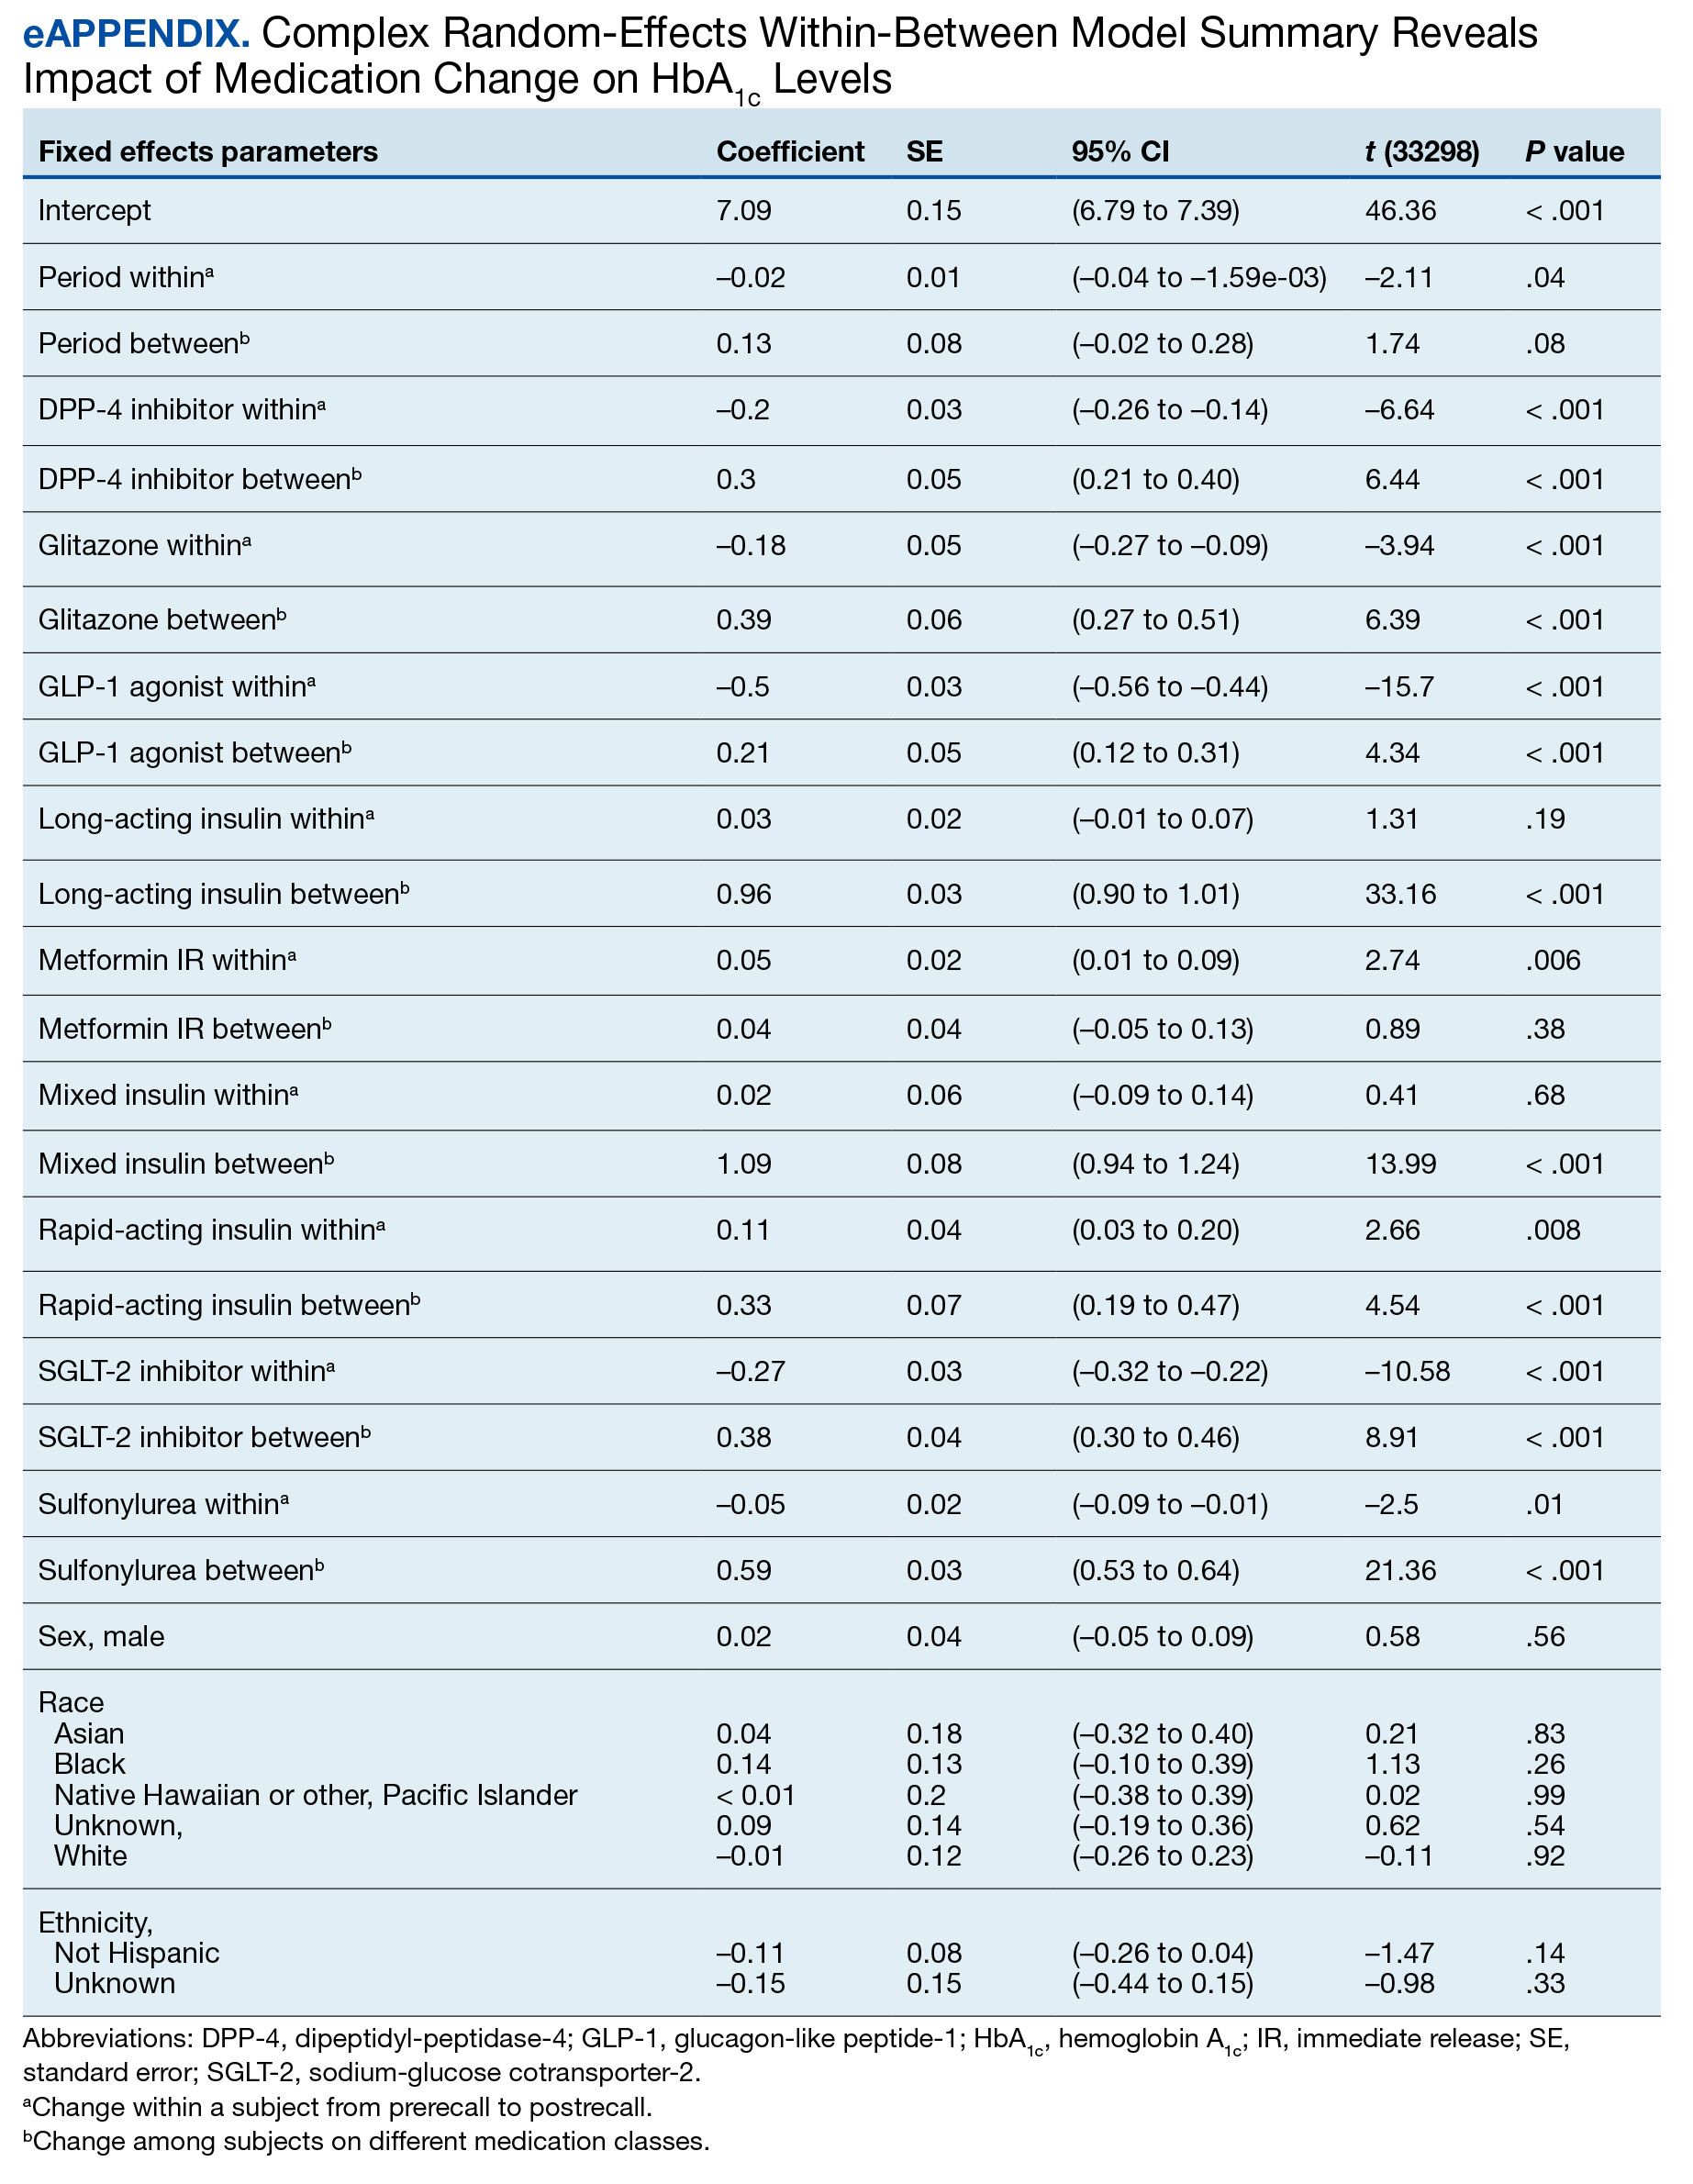
- Centers for Disease Control and Prevention. Type 2 diabetes. Updated April 18, 2023. Accessed September 18, 2023. https://www.cdc.gov/diabetes/basics/type2.html
- ElSayed NA, Aleppo G, Aroda VR, et al. 2. Classification and diagnosis of diabetes: standards of care in diabetes—2023. Diabetes Care. 2023;46(Supplement_1):S19-S40. doi:10.2337/dc23-S002
- Liu Y, Sayam S, Shao X, et al. Prevalence of and trends in diabetes among veterans, United States, 2005–2014. Prev Chronic Dis. 2017;14:E135. doi:10.5888/pcd14.170230
- Yi SW, Hong JS, Ohrr H, Yi JJ. Agent Orange exposure and disease prevalence in Korean Vietnam veterans: the Korean veterans health study. Environ Res. 2014;133:56-65. doi:10.1016/j.envres.2014.04.027
- Price LE, Gephart S, Shea K. The VA’s Corporate Data Warehouse: Uses and Implications for Nursing Research and Practice. Nurs Adm Q. 2015;39(4):311-318. doi:10.1097/NAQ.0000000000000118
- ElSayed NA, Aleppo G, Aroda VR, et al. 9. Pharmacologic approaches to glycemic treatment: standards of care in diabetes-2023. Diabetes Care. 2023;46(suppl 1):S140-S157. doi:10.2337/dc23-S009
- Samson SL, Vellanki P, Blonde L, et al. American Association of Clinical Endocrinology Consensus Statement: Comprehensive Type 2 Diabetes Management Algorithm - 2023 Update. Endocr Pract. 2023;29(5):305-340. doi:10.1016/j.eprac.2023.02.001
- Bennett WL, Maruthur NM, Singh S, et al. Comparative effectiveness and safety of medications for type 2 diabetes: an update including new drugs and 2-drug combinations. Ann Intern Med. 2011;154(9):602-613. doi:10.7326/0003-4819-154-9-201105030-00336
- Bolen S, Feldman L, Vassy J, et al. Systematic review: comparative effectiveness and safety of oral medications for type 2 diabetes mellitus. Ann Intern Med. 2007;147(6):386-399. doi:10.7326/0003-4819-147-6-200709180-00178
- Tsapas A, Avgerinos I, Karagiannis T, et al. Comparative effectiveness of glucose-lowering drugs for type 2 diabetes: a systematic review and network meta-analysis. Ann Intern Med. 2020;173(4):278-286. doi:10.7326/M20-0864
- Nishimura R, Taniguchi M, Takeshima T, Iwasaki K. Efficacy and safety of metformin versus the other oral antidiabetic drugs in Japanese type 2 diabetes patients: a network meta-analysis. Adv Ther. 2022;39(1):632-654. doi:10.1007/s12325-021-01979-1
- Russell-Jones D, Cuddihy RM, Hanefeld M, et al. Efficacy and safety of exenatide once weekly versus metformin, pioglitazone, and sitagliptin used as monotherapy in drug-naive patients with type 2 diabetes (DURATION-4): a 26-week double-blind study. Diabetes Care. 2012;35(2):252-258. doi:10.2337/dc11-1107
- Umpierrez G, Tofé Povedano S, Pérez Manghi F, Shurzinske L, Pechtner V. Efficacy and safety of dulaglutide monotherapy versus metformin in type 2 diabetes in a randomized controlled trial (AWARD-3). Diabetes Care. 2014;37(8):2168-2176. doi:10.2337/dc13-2759
- US Food and Drug Administration. FDA alerts patients and health care professionals to nitrosamine impurity findings in certain metformin extended-release products [press release]. May 28, 2020. Accessed October 16, 2024. https://www.fda.gov/news-events/press-announcements/fda-alerts-patients-and-health-care-professionals-nitrosamine-impurity-findings-certain-metformin
- Bell A, Jones K. Explaining fixed effects: random effects modeling of time-series cross-sectional and panel data. PSRM. 2015;3(1):133-153. doi:10.1017/psrm.2014.7
About 1 in 10 Americans have diabetes mellitus (DM), of which about 90% to 95% are diagnosed with type 2 DM (T2DM) and veterans are disproportionately affected.1,2 About 25% enrolled in the Veterans Health Administration (VHA) have T2DM, which has been attributed to exposure to herbicides (eg, Agent Orange), decreased physical activity resulting from past physical strain, chronic pain, and other physical limitations resulting from military service.3-5
Pharmacologic management of DM is guided by the effectiveness of lifestyle interventions and comorbid diagnoses. Current DM management guidelines recommend patients with comorbid atherosclerotic cardiovascular disease, chronic kidney disease, or congestive heart failure receive first-line diabetes therapy with a sodium-glucose cotransporter-2 (SGLT-2) inhibitor or glucagon-like peptide-1 receptor (GLP-1) agonist.
Metformin remains a first-line pharmacologic option for the treatment of T2DM with the goal of achieving glycemic management when lifestyle interventions are insufficient.6,7 Newer antihyperglycemic therapies have been studied as adjunct therapy to metformin. However, there is limited literature comparing metformin directly to other medication classes for the treatment of T2DM.8-13 A systematic review of treatment-naive patients found HbA1c reductions were similar whether patients received metformin vs an SGLT-2 inhibitor, GLP-1 agonist, sulfonylurea, or thiazolidinedione monotherapy.10 The analysis found dipeptidyl-peptidase-4 (DPP-4) inhibitors had inferior HbA1c reduction compared to metformin.10 A Japanese systematic review compared metformin to thiazolidinediones, sulfonylureas, glinides, DPP-4 inhibitors, α-glucosidase inhibitors, or SGLT-2 inhibitors for ≥ 12 weeks but found no statistically significant differences in
On May 28, 2020, the US Food and Drug Administration (FDA) asked 5 pharmaceutical companies to voluntarily recall certain formulations of metformin. This action was taken when FDA testing revealed unacceptably high levels of N-Nitrosodimethylamine, a probable carcinogen.14 This FDA recall of metformin extended-release, referred to as metformin sustained-action (SA) within the VHA electronic medication file but the same type of formulation, prompted clinicians to revisit and revise the pharmacologic regimens of patients taking the drug. Because of the paucity of head-to-head trials comparing metformin with newer alternative antihyperglycemic therapies, the effect of treatment change was unknown. In response, we aimed to establish a data registry within Veterans Integrated Service Network (VISN) 6.
Registry Development
The VISN 6 registry was established to gather long-term, observational, head-to-head data that would allow review of HbA1c levels before and after the recall, as well as HbA1c levels broken down by the agent that patients were switched to after the recall. Another goal was to explore prescribing trends following the recall.
Data Access Request Tracker approval was obtained and a US Department of Veterans Affairs (VA) Information and Computing Infrastructure workspace was developed to host the registry data. The research cohort was established from this data, and the registry framework was finalized using Structured Query Language (SQL). The SQL coding allows for recurring data updates for all individuals within the cohort including date of birth, race, sex, ethnicity, VHA facility visited, weight, body mass index, HbA1c level, creatinine clearance, serum creatinine, antihyperglycemic medication prescriptions, adverse drug reactions, medication adherence (as defined by ≥ 80% refill history), and hospitalizations related to diabetes. For the purposes of this initial analysis, registry data included demographics, diabetes medications, and HbA1c results.
METHODS
This study was a concurrent, observational, multicenter, registry-based study conducted at the Western North Carolina VA Health Care System (WNCVAHCS). The study was approved by the WNCVAHCS institutional review board and research and development committees.
All patients aged ≥ 18 years with T2DM and receiving health care from VISN 6 facilities who had an active metformin SA prescription on, and 1 year prior to, June 1, 2020 (the initial date VHA began implementing the FDA metformin recall) were entered into the registry. Data from 1 year prior were collected to provide a baseline. Veterans were excluded if they received metformin SA for any indication other than T2DM, there was no pre- or postrecall HbA1c measurement, or death. We included 15,594 VISN 6 veterans.
Registry data were analyzed to determine whether a significant change in HbA1c level occurred after the metformin recall and in response to alternative agents being prescribed. Data from veterans who met all inclusion criteria were assessed during the year before and after June 1, 2020. Demographic data were analyzed using frequency and descriptive statistics. The Shapiro Wilkes test was performed, and data were found to be nonparametric; therefore the Wilcoxon signed-rank test was used to evaluate the hypothesis that HbA1c levels were not impacted by the recall.
Our sample size allowed us to create exact matched pairs of 9130 individuals and utilize rank-biserial correlation to establish effect size. Following this initial population-level test, we constructed 2 models. The first, a linear mixed-effects model, focused solely on the interaction effects between the pre- and postrecall periods and various medication classes on HbA1c levels. Second, we constructed a random-effects within-between model (REWB) to evaluate the impact ofmedication classes and demographic variables. Statistical significance was measured at P < .05 with conservative power at .90. The effect size was set to 1.0, reflecting a minimum clinically important difference. Literature establishes 0.5 as a modest level of HbA1c improvement and 1.0 as a clinically significant improvement.
RESULTS
Preliminary results included 15,594 veterans who received a metformin SA prescription as of June 1, 2020 from VISN 6 facilities; 15,392 veterans had a drug exposure end on June 1, 2020, indicating their standard therapy of metformin SA was discontinued following the FDA recall. Two hundred and two veterans were excluded from the registry because they continued to receive metformin SA from existing stock at a VISN6 facility.
Wilcoxon Signed-Rank Test
We created exact pairs by iterating the data and finding the closest measurements for each patient before and after the recall. This has the advantage over averaging a patient’s pre- and post-HbA1c levels, as it allows for a rank-biserial correlation. Using the nonparametric Wilcoxon signed-rank test, V was 20,100,707 (P < .001), indicating a significant effect. The –0.29 rank-biserial correlation, which was computed to assess the effect size of the recall, suggests that the median HbA1c level was lower postrecall vs prerecall. The magnitude of the correlation suggests a moderate effect size, and while the recall had a noticeable impact at a population level, it was not extreme (Table 2).
Linear Mixed-Effects Model
The binary variable for medication class exposure suggests the use of a logit link function for binary outcomes within the multilevel modeling framework.15 We employed a linear mixed-effects model to investigate the impact that switching from metformin SA to other T2DM medications had on HbA1c levels. The model was adjusted for patient-specific random effects and included interaction terms between the recall period (before and after) and the usage of different T2DM medications.
Model Fit and Random Effects
The model demonstrated a residual maximum likelihood criterion of 100,219.7, indicating its fit to the data. Notably, the random effects analysis revealed a substantial variability in baseline HbA1c levels across patients (SD, 0.94), highlighting the importance of individual differences in DM management. Medication classes with zero or near-zero exposure rate were removed. Due to demographic homogeneity, the model did not converge on demographic variables. Veterans were taking a mean of 1.8 T2DM medications and metformin SA was most common (Table 3).
During the postrecall period, metformin SA remained the most frequently prescribed medication class. This may be attributed to the existence of multiple manufacturers of metformin SA, some of which may not have been impacted by the recall. VISN 6 medical centers could have sought metformin SA outside of the usual procurement path following the recall.
Complex Random Effects Model
We employed a complex REWB model that evaluated the impact of medication classes on HbA1c levels, accounting for both within and between subject effects of these medications, along with demographic variables (sex, race, and ethnicity) (eAppendix). This model accounts for individual-level changes over time (within-patient effects) and between groups of patients (between-patient effects). This is a more comprehensive model aimed at understanding the broader impact of medications on HbA1c levels across diverse patient groups.
Most demographic categories did not demonstrate significant effects in this model. Black individuals experienced a slight increase in HbA1c levels compared with other racial categories that was not statistically significant. However, this model confirms the findings from the linear mixed-effects model that GLP-1 agonists showed a substantial decrease in HbA1c levels within patients (coefficient –0.5; 95% CI, –0.56 to –0.44; P < .001) and a moderate increase between patients (coefficient, 0.21; 95% CI, 0.12-0.31; P < .001). Additionally, SGLT-2 inhibitors had a notable decrease within patients (coefficient, –0.27; 95% CI, –0.32 to –0.22; P < .001).Another notable finding with our REWB model is insulin usage was associated with high HbA1c levels, but only between subjects. Long-acting insulin (coefficient, 0.96; 95% CI, 0.90-1.01; P <. 001) and mixed insulin (coefficient, 1.09; 95% CI, 0.94-1.24; P < .001) both displayed marked increases between patients, suggesting future analysis may benefit from stratifying across insulin users and nonusers.
Fixed Effect Analysis
The fixed effects analysis yielded several notable findings. The intercept, representing the mean baseline HbA1c level, was estimated at 7.8% (58 mmol/mol). The coefficient for the period (postrecall) was not statistically significant, indicating no overall change in HbA1c levels from before to after the recall when specific medication classes were not considered (Table 4). Among medication classes examined, several showed significant associations with HbA1c levels. DPP-4 inhibitors and GLP-1 agonists were associated with a decrease in HbA1c levels, with coefficients of −0.08 and −0.24, respectively. Long-acting insulin and metformin immediate-release (IR) were associated with an increase in HbA1c levels, as indicated by their positive coefficients of 0.38 and 0.16, respectively. Mixed insulin formulations and sulfonylureas showed an association with decreased HbA1c levels.
Interaction Effects
The interaction terms between the recall period and the medication classes provided insights into the differential impact of the medication switch postrecall. Notably, the interaction term for long-acting insulin (coefficient, −0.10) was significant, suggesting a differential effect on HbA1c levels postrecall. Other medications, like metformin IR, also exhibited significant interaction effects, indicating changes in the impact on HbA1c levels in the postrecall period. The binary variable for medication class exposure suggests the use of a logit link function for binary outcomes within the multilevel modeling framework.15 We did not address the potential for cross cluster heterogeneity due to different medication classes.
DISCUSSION
This study is an ongoing, concurrent, observational, multicenter, registry-based study consisting of VISN 6 veterans who have T2DM and were prescribed metformin SA on June 1, 2020. This initial aim was to evaluate change in HbA1c levels following the FDA metformin recall. While there was substantial variability in baseline HbA1c levels across the patients, the mean baseline HbA1c level at 7.5% (58 mmol/mol). Patients taking GLP-1 agonists showed substantial decrease in HbA1c levels (coefficient; –0.5; 95% CI, –0.56 to –0.44; P <. 001). Patients taking SGLT-2 inhibitors had a notable decrease in HbA1c (coefficient, –0.27; 95% CI, –0.32 to –0.22; P < .001). Despite this, the coefficient for the postrecall period was not statistically significant, indicating no overall change in HbA1c levels from pre- to postrecall when specific medication classes were not considered.
Further analysis included assessment of prescribing trends postrecall. There was an increase in SGLT-2 inhibitor, GLP-1 agonist, and DPP-4 inhibitor prescribing. Considering the growing evidence of the cardiovascular and renal benefits of these medication classes, specifically the GLP-1 agonists and SGLT-2 inhibitors, this trend would be expected.
Limitations
This study cohort did not capture veterans with T2DM who transferred their health care to VISN 6 after June 1, 2020, and continued to receive metformin SA from the prior facility. Inclusion of these veterans would have increased the registry population. Additionally, the cohort did not identify veterans who continued to receive metformin SA through a source other than the VA. Without that information, the registry cohort may include veterans thought to have either transitioned to a different therapy or to no other T2DM therapy after the recall.
Given that DM can progress over time, it is possible the transition to a new medication after the recall was the result of suboptimal management, or in response to an adverse effect from a previous medication, and not solely due to the metformin SA recall. In addition, there are several factors that could impact HbA1c level over time that were not accounted for in this study, such as medication adherence and lifestyle modifications.
The notable level of metformin SA prescriptions, despite the recall, may be attributed to several factors. First, not all patients stopped metformin completely. Review of the prescription data indicated that some veterans were provided with limited refills at select VA medical centers that had supplies (medication lots not recalled). Access to a safe supply of metformin SA after the recall may have varied among VISN 6 facilities. It is also possible that as new supplies of metformin SA became available, veterans restarted metformin SA. This may have been resumed while continuing a new medication prescribed at the beginning of the recall. As the year progressed after the recall, an increase in metformin SA prescriptions likely occurred as supplies became available and clinicians/veterans chose to resume this medication therapy.
Conclusions
Results of this initial registry study found no difference in HbA1c levels across the study population after the metformin SA recall. However, there was clinical difference in the HbA1c within veterans prescribed SGLT-2 inhibitors and GLP-1 agonists. As expected, prescribing trends showed an increase in these agents after the recall. With the known benefits of these medications beyond glucose lowering, it is anticipated the cohort of veterans prescribed these medications will continue to grow.
The VISN 6 research registry allowed this study to gain an important snapshot in time following the metformin SA recall, and will serve as an important resource for future DM research endeavors. It will allow for ongoing evaluation of the impact of the transition to alternative T2DM medications after the metformin SA recall. Future exploration will include evaluation of adverse drug reactions, DM-related hospitalizations, emergency department visits related to T2DM, changes in renal function, and cardiovascular events among all diabetes medication classes.
Acknowledgments
The study team thanks the Veterans Affairs Informatics and Computing Infrastructure for their help and expertise throughout this project. The authors acknowledge the contributions of Philip Nelson, PharmD, and Brian Peek, PharmD.
- Centers for Disease Control and Prevention. Type 2 diabetes. Updated April 18, 2023. Accessed September 18, 2023. https://www.cdc.gov/diabetes/basics/type2.html
- ElSayed NA, Aleppo G, Aroda VR, et al. 2. Classification and diagnosis of diabetes: standards of care in diabetes—2023. Diabetes Care. 2023;46(Supplement_1):S19-S40. doi:10.2337/dc23-S002
- Liu Y, Sayam S, Shao X, et al. Prevalence of and trends in diabetes among veterans, United States, 2005–2014. Prev Chronic Dis. 2017;14:E135. doi:10.5888/pcd14.170230
- Yi SW, Hong JS, Ohrr H, Yi JJ. Agent Orange exposure and disease prevalence in Korean Vietnam veterans: the Korean veterans health study. Environ Res. 2014;133:56-65. doi:10.1016/j.envres.2014.04.027
- Price LE, Gephart S, Shea K. The VA’s Corporate Data Warehouse: Uses and Implications for Nursing Research and Practice. Nurs Adm Q. 2015;39(4):311-318. doi:10.1097/NAQ.0000000000000118
- ElSayed NA, Aleppo G, Aroda VR, et al. 9. Pharmacologic approaches to glycemic treatment: standards of care in diabetes-2023. Diabetes Care. 2023;46(suppl 1):S140-S157. doi:10.2337/dc23-S009
- Samson SL, Vellanki P, Blonde L, et al. American Association of Clinical Endocrinology Consensus Statement: Comprehensive Type 2 Diabetes Management Algorithm - 2023 Update. Endocr Pract. 2023;29(5):305-340. doi:10.1016/j.eprac.2023.02.001
- Bennett WL, Maruthur NM, Singh S, et al. Comparative effectiveness and safety of medications for type 2 diabetes: an update including new drugs and 2-drug combinations. Ann Intern Med. 2011;154(9):602-613. doi:10.7326/0003-4819-154-9-201105030-00336
- Bolen S, Feldman L, Vassy J, et al. Systematic review: comparative effectiveness and safety of oral medications for type 2 diabetes mellitus. Ann Intern Med. 2007;147(6):386-399. doi:10.7326/0003-4819-147-6-200709180-00178
- Tsapas A, Avgerinos I, Karagiannis T, et al. Comparative effectiveness of glucose-lowering drugs for type 2 diabetes: a systematic review and network meta-analysis. Ann Intern Med. 2020;173(4):278-286. doi:10.7326/M20-0864
- Nishimura R, Taniguchi M, Takeshima T, Iwasaki K. Efficacy and safety of metformin versus the other oral antidiabetic drugs in Japanese type 2 diabetes patients: a network meta-analysis. Adv Ther. 2022;39(1):632-654. doi:10.1007/s12325-021-01979-1
- Russell-Jones D, Cuddihy RM, Hanefeld M, et al. Efficacy and safety of exenatide once weekly versus metformin, pioglitazone, and sitagliptin used as monotherapy in drug-naive patients with type 2 diabetes (DURATION-4): a 26-week double-blind study. Diabetes Care. 2012;35(2):252-258. doi:10.2337/dc11-1107
- Umpierrez G, Tofé Povedano S, Pérez Manghi F, Shurzinske L, Pechtner V. Efficacy and safety of dulaglutide monotherapy versus metformin in type 2 diabetes in a randomized controlled trial (AWARD-3). Diabetes Care. 2014;37(8):2168-2176. doi:10.2337/dc13-2759
- US Food and Drug Administration. FDA alerts patients and health care professionals to nitrosamine impurity findings in certain metformin extended-release products [press release]. May 28, 2020. Accessed October 16, 2024. https://www.fda.gov/news-events/press-announcements/fda-alerts-patients-and-health-care-professionals-nitrosamine-impurity-findings-certain-metformin
- Bell A, Jones K. Explaining fixed effects: random effects modeling of time-series cross-sectional and panel data. PSRM. 2015;3(1):133-153. doi:10.1017/psrm.2014.7
American Diabetes Association Advises on Hospital CGM Use
, based in part on data collected during the COVID-19 pandemic.
The statement, Consensus Considerations and Good Practice Points for Use of Continuous Glucose Monitoring Systems in Hospital Settings, was published on October 25, 2024, in Diabetes Care.
“This is something that requires close collaboration with many groups in the hospital ... There needs to be really good guidance within the hospital as to when it can be used, in which patients, and what checks and balances need to be in place,” statement lead author Julie L.V. Shaw, PhD, Laboratory Director at Renfrew Victoria Hospital and St. Francis Memorial Hospital, Ottawa, Ontario, Canada, told this news organization.
CGM use in the outpatient setting continues to grow, among people with type 2 as well as type 1 diabetes. The devices are worn on the body for up to 15 days via a subcutaneously-inserted sensor that detects glucose in interstitial fluid every 1-15 minutes. The readings generally track with blood glucose levels, although discrepancies can occur and may be even more relevant in hospital settings.
About 1 in 4 hospitalized patients have diabetes and/or hyperglycemia. During the COVID-19 pandemic, the US Food and Drug Administration (FDA) and Health Canada temporarily authorized the use of CGM systems in hospitals to supplement point-of-care glucose testing, as an emergency measure to reduce healthcare worker exposure and preserve personal protective equipment. That FDA authorization expired on November 7, 2023, and currently hospital CGM use in the United States is technically off-label, although it is often allowed for patients who already use CGM systems.
The new statement summarizes clinical study data and also addresses the potential benefits of CGM systems for inpatients, existing guidance, analytical and clinical evaluation of CGM performance, safety factors, staff training, clinical workflow, and hospital policies. Also covered are issues around quality assurance, integration of CGM data into electronic health records, cost considerations, and barriers to implementation.
The “good practice points for consideration” in the document are as follows:
- If healthcare professionals want to use CGM systems beyond their intended use, eg, to replace or reduce point-of-care glucose measurements, analytical and clinical performance should be assessed.
- The Clinical and Laboratory Standards Institute (CLSI) 2nd Edition of POCT05 — Performance Metrics for Continuous Interstitial Glucose Monitoring provides helpful guidance.
- Potential interferences that preclude patients from being eligible for CGM should be noted, and staff must be aware that CGM can’t be used for clinical decision-making in these patients.
- A CGM system and/or inpatient glycemia management committee should oversee the development and implementation of hospital-approved policies and procedures for CGM use in the hospital. This committee should have representatives from nursing leadership, physician leadership (e.g., endocrinologists, internal medicine specialists, hospitalists), laboratory, information services, hospital administration, pharmacy, and risk management/legal.
- Policies for patient-owned and hospital-owned CGM devices should be developed, and staff should be trained in their use.
“During the pandemic, there was a lot of research on CGM use in the hospital setting, so we could look at how it works and was it safe. I think we have some good data to show where it can be used,” said Shaw, who also heads the Division of Biochemistry at the Ottawa Hospital. She added, “There’s quite a bit we still don’t know, but I think with some guidance in place about when not to use it, there are certainly patient populations who could benefit from it in the hospital setting.”
Shaw had no disclosures. Another author is general manager and medical director of the Institute for Diabetes Technology (IfDT), which carries out clinical studies, eg, with medical devices for diabetes therapy, on its own initiative and on behalf of various companies. Another author is an IfDT employee. Other authors have received speakers’ honoraria or consulting fees in the last 3 years from Abbott, Berlin-Chemie, BOYDSense, Dexcom, Lilly Deutschland, Novo Nordisk, Perfood, PharmaSens, Roche, Sinocare, Terumo, and Ypsomed.
A version of this article appeared on Medscape.com.
Cardiovascular Disease 2050: No, GLP-1s Won’t Save the Day
This transcript has been edited for clarity .
Robert A. Harrington, MD: I’m here in London at the European Society of Cardiology meetings, at theheart.org | Medscape Cardiology booth, using the meetings as an opportunity to meet with colleagues to talk about recent things that they’ve been writing about.
Today I’m joined by a good friend and colleague, Dr. Dhruv Kazi from Beth Israel Deaconess in Boston. Thanks for joining us.
Dhruv S. Kazi, MD, MS: Thank you for having me.
Harrington: Dr. Kazi is an associate professor of medicine at Harvard Medical School. He’s also the associate director of the Smith Center, which is an outcomes research center at the Beth Israel Deaconess. Thanks for joining us.
Kazi: Excited to be here.
Harrington: The topic I think you know that I want to discuss is a really important paper. There are two papers. They’re part of the American Heart Association’s 100th anniversary celebration, if you will. Many of the papers looked back at where science taken us.
With your coauthor, Karen Joynt Maddox, your papers are looking forward. They’re about the burden of cardiovascular disease in 2050. One paper really focused on what I would call the clinical and public health issues. Yours is focused on the economics. Is that a good description?
Kazi: Perfect.
Harrington: Tell us what you, Karen, and the other writers set out to do. What were you asked to do?
Kazi: As you know, the American Heart Association is entering its second century. Part of this was an exercise to say, where will the country be in 2050, which is a long enough time horizon for us to start planning for the future.
We looked back and said, if prior trends remain the same, where will we be in 2050, accounting for changes in demographics, changes in the composition of the population, and knowing that some of the cardiovascular risk factors are getting worse?
Harrington: For me, what was really striking is that, when I first saw the title and read “2050,” I thought, Oh, that’s a long way away. Then as I started reading it, I realized that this is not so far away.
Kazi: Absolutely.
Harrington: If we’re going to make a difference, it might take us 25 years.
Kazi: Especially if we set ourselves ambitious goals, we›re going to have to dig deep. Business-as-usual is not going to get us there.
Harrington: No. What I think has happened is we›ve spent so much time taking care of acute illness. Case fatality rates are fantastic. I was actually making the comment yesterday to a colleague that when I was an intern, the 30-day death rate from acute myocardial infarction was about 20%.
Kazi: Oh, wow.
Harrington: Now it’s 5%. That’s a big difference in a career.
Trends in the Wrong Direction
Kazi: There are fundamental trends. The decline in case fatalities is a really positive development, and I would hope that, going forward, that would continue. Those are risk-adjusted death rates and what is happening is that risk is going up. This is a function of the fact that the US population is aging; 2030 will be the first year that all the baby boomers will be over the age of 65.
By the mid-2030s, we’ll have more adults over the age of 65 than kids. That aging of the population is going to increase risk. The second is — and this is a positive development — we are a more diverse population, but the populations that are minoritized have higher cardiovascular risk, for a variety of reasons.
As the population of Asian Americans increases and doubles, in fact, as the population of Hispanic Americans doubles, we’re going to see an increase in risk related to cardiovascular disease. The third is that, over the past decade, there are some risk factors that are going in the wrong direction.
Harrington: Let’s talk about that because that’s humbling. I’m involved, as you know, with the American Heart Association, as are you. Despite all the work on Life’s Simple 7 and now Life’s Essential 8, we still have some issues.
Kazi: The big ones that come to mind are hypertension, diabetes, and obesity, all of which are trending in the wrong direction. Hypertension, we were gaining traction; and then over the past decade, we’ve slipped again. As you know, national blood pressure control rates have declined in many populations.
Harrington: Rather substantially.
Kazi: Substantially so, which has implications, in particular, for stroke rates in the future and stroke rates in young adults in the future. Obesity is a problem that we have very little control over. We’re already at 40% on average, which means that some populations are already in the 60% range.
Harrington: We also have obesity in kids — the burden, I’ll call it, of obesity. It’s not that you become obese in your thirties or your forties; you›re becoming obese as a teenager or even younger.
Kazi: Exactly. Since the 1990s, obesity in US adults has doubled, but obesity in US children has quadrupled. It’s starting from a lower base, but it’s very much an escalating problem.
Harrington: Diabetes is tightly linked to it but not totally explained.
Kazi: Exactly. The increase in diabetes is largely driven by obesity, but it›s probably also driven by changes in diet and lifestyle that don›t go through obesity.
Harrington: Yeah, it’s interesting. I think I have this figure correctly. It used to be rare that you saw a child with type 2 diabetes or what we call type 2 diabetes.
Kazi: Yeah.
Harrington: Now, the vast majority of kids with diabetes have type 2 diabetes.
Kazi: In the adolescents/young adults age group, most of it is type 2.
Harrington: Diabetes going up, obesity up, hypertension not well controlled, smoking combustible cigarettes way down.
Kazi: Yeah.
Harrington: Cholesterol levels. I was surprised. Cholesterol looked better. You said — because I was at a meeting where somebody asked you — that’s not explained by treatment.
Kazi: No, it’s not, at least going back to the ‘70s, but likely even sooner. I think that can only be attributed to substantial dietary changes. We are consuming less fat and less trans-fat. It’s possible that those collectively are improving our cholesterol levels, possibly at the expense of our glucose levels, because we basically substituted fats in our diet with more carbs at a population level.
Cigarettes and Vaping
Harrington: Some things certainly trend in the right direction but others in a really difficult direction. It’s going to lead to pretty large changes in risk for coronary disease, atrial fibrillation, and heart failure.
Kazi: I want to go back to the tobacco point. There are definitely marked declines in tobacco, still tightly related to income in the country. You see much higher prevalence of tobacco use in lower-income populations, but it’s unclear to me where it’s going in kids. We know that combustible tobacco use is going down but e-cigarettes went up. What that leads to over the next 30 years is unclear to me.
Harrington: That is a really important comment that’s worth sidebarring. The vaping use has been a terrible epidemic among our high schoolers. What is that going to lead to? Is it going to lead to the use of combustible cigarettes and we’re going to see that go back up? It remains to be seen.
Kazi: Yes, it remains to be seen. Going back to your point about this change in risk factors and this change in demographics, both aging and becoming a more diverse population means that we have large increases in some healthcare conditions.
Coronary heart disease goes up some, there›s a big jump in stroke — nearly a doubling in stroke — which is related to hypertension, obesity, an aging population, and a more diverse population. There are changes in stroke in the young, and atrial fibrillation related to, again, hypertension. We’re seeing these projections, and with them come these pretty large projections in changes in healthcare spending.
Healthcare Spending Not Sustainable
Harrington: Big. I mean, it’s not sustainable. Give the audience the number — it’s pretty frightening.
Kazi: We’re talking about a quadrupling of healthcare costs related to cardiovascular disease over 25 years. We’ve gotten used to the narrative that healthcare in the US is expensive and drugs are expensive, but this is an enormous problem — an unsustainable problem, like you called it.
It’s a doubling as a proportion of the economy. I was looking this up this morning. If the US healthcare economy were its own economy, it would be the fourth largest economy in the world.
Harrington: Healthcare as it is today, is it 21% of our economy?
Kazi: It’s 17% now. If it were its own economy, it would be the fourth largest in the world. We are spending more on healthcare than all but two other countries’ total economies. It’s kind of crazy.
Harrington: We’re talking about a quadrupling.
Kazi: Within that, the cardiovascular piece is a big piece, and we›re talking about a quadrupling.
Harrington: That’s both direct and indirect costs.
Kazi: The quadrupling of costs is just the direct costs. Indirect costs, for the listeners, refer to costs unrelated to healthcare but changes in productivity, either because people are disabled and unable to participate fully in the workforce or they die early.
The productivity costs are also increased substantially as a result. If you look at both healthcare and productivity, that goes up threefold. These are very large changes.
Harrington: Let’s now get to what we can do about it. I made the comment to you when I first read the papers that I was very depressed. Then, after I went through my Kübler-Ross stages of depression, death, and dying, I came to acceptance.
What are we going to do about it? This is a focus on policy, but also a focus on how we deliver healthcare, how we think about healthcare, and how we develop drugs and devices.
The drug question is going to be the one the audience is thinking about. They say, well, what about GLP-1 agonists? Aren’t those going to save the day?
Kazi: Yes and no. I’ll say that, early in my career, I used to be very attracted to simple solutions to complex problems. I’ve come to realize that simple solutions are elegant, attractive, and wrong. We›re dealing with a very complex issue and I think we’re going to need a multipronged approach.
The way I think about it is that there was a group of people who are at very high risk today. How do we help those individuals? Then how do we help the future generation so that they’re not dealing with the projections that we’re talking about.
My colleague, Karen Joynt Maddox, who led one of the papers, as you mentioned, has an elegant line in the paper where she says projections are not destiny. These are things we can change.
Harrington: If nothing changes, this is what it’s going to look like.
Kazi: This is where we’re headed.
Harrington: We can change. We’ve got some time to change, but we don’t have forever.
Kazi: Yes, exactly. We picked the 25-year timeline instead of a “let’s plan for the next century” timeline because we want something concrete and actionable. It’s close enough to be meaningful but far enough to give us the runway we need to act.
Harrington: Give me two things from the policy perspective, because it’s mostly policy.
Kazi: There are policy and clinical interventions. From the policy perspective, if I had to list two things, one is expansion of access to care. As we talk about this big increase in the burden of disease and risk factors, if you have a large proportion of your population that has hypertension or diabetes, you’re going to have to expand access to care to ensure that people get treated so they can get access to this care before they develop the complications that we worry about, like stroke and heart disease, that are very expensive to treat downstream.
The second, more broadly related to access to care, is the access to medications that are effective. You bring up GLP-1s. I think we need a real strategy for how we can give people access to GLP-1s at a price that is affordable to individuals but also affordable to the health system, and to help them stay on the drugs.
GLP-1s are transformative in what they do for weight loss and for diabetes, but more than 50% of people who start one are off it at 12 months. There’s something fundamentally wrong about how we’re delivering GLP-1s today. It’s not just about the cost of the drugs but the support system people need to stay on.
Harrington: I’ve made the comment, in many forms now, that we know the drugs work. We have to figure out how to use them.
Kazi: Exactly, yes.
Harrington: Using them includes chronicity. This is a chronic condition. Some people can come off the drugs, but many can’t. We’re going to have to figure this out, and maybe the newer generations of drugs will help us address what people call the off-ramping. How are we going to do that? I think you’re spot-on. Those are critically important questions.
Kazi: As we looked at this modeling, I’ll tell you — I had a come-to-Jesus moment where I was like, there is no way to fix cardiovascular disease in the US without going through obesity and diabetes. We have to address obesity in the US. We can’t just treat our way out of it. Obesity is fundamentally a food problem and we’ve got to engage again with food policy in a meaningful way.
Harrington: As you know, with the American Heart Association, we›re doing a large amount of work now on food as medicine and food is medicine. We are trying to figure out what the levers are that we can pull to actually help people eat healthier diets.
Kazi: Yes. Rather than framing it as an individual choice that people are eating poorly, it’s, how do we make healthy diets the default in the environment?
Harrington: This is where you get to the children as well.
Kazi: Exactly.
Harrington: I could talk about this all day. I’ve had the benefit of reading the papers now a few times and talking to you on several occasions. Thank you for joining us.
Kazi: Thank you.
Dr. Harrington, Stephen and Suzanne Weiss Dean, Weill Cornell Medicine; Provost for Medical Affairs, Cornell University, New York, NY, disclosed ties with Baim Institute (DSMB); CSL (RCT Executive Committee); Janssen (RCT Char), NHLBI (RCT Executive Committee, DSMB Chair); PCORI (RCT Co-Chair); DCRI, Atropos Health; Bitterroot Bio; Bristol Myers Squibb; BridgeBio; Element Science; Edwards Lifesciences; Foresite Labs; Medscape/WebMD Board of Directors for: American Heart Association; College of the Holy Cross; and Cytokinetics. Dr. Kazi, Associate Director, Smith Center for Outcomes Research, Associate Professor, Department of Medicine (Cardiology), Harvard Medical School, Director, Department of Cardiac Critical Care Unit, Beth Israel Deaconess Medical Center, Boston, Massachusetts, has disclosed receiving a research grant from Boston Scientific (grant to examine the economics of stroke prevention).
A version of this article appeared on Medscape.com.
Humans and Carbs: A Complicated 800,000-Year Relationship
Trying to reduce your carbohydrate intake means going against nearly a million years of evolution.
Humans are among a few species with multiple copies of certain genes that help us break down starch — carbs like potatoes, beans, corn, and grains — so that we can turn it into energy our bodies can use.
However, it’s been difficult for researchers to pinpoint when in human history we acquired multiple copies of these genes because they’re in a region of the genome that’s hard to sequence.
A recent study published in Science suggests that humans may have developed multiple copies of the gene for amylase — an enzyme that’s the first step in starch digestion — over 800,000 years ago, long before the agricultural revolution. This genetic change could have helped us adapt to eating starchy foods.
The study shows how “what your ancestors ate thousands of years ago could be affecting our genetics today,” said Kelsey Jorgensen, PhD, a biological anthropologist at The University of Kansas, Lawrence, who was not involved in the study.
The double-edged sword has sharpened over all those centuries. On one hand, the human body needs and craves carbs to function. On the other hand, our modern-day consumption of carbs, especially calorie-dense/nutritionally-barren processed carbs, has long since passed “healthy.”
How Researchers Found Our Carb-Lover Gene
The enzyme amylase turns complex carbs into maltose, a sweet-tasting sugar that is made of two glucose molecules linked together. We make two kinds of amylases: Salivary amylase that breaks down carbs in our mouths and pancreatic amylase that is secreted into our small intestines.
Modern humans have multiple copies of both amylases. Past research showed that human populations with diets high in starch can have up to nine copies of the gene for salivary amylase, called AMY1.
To pinpoint when in human history we acquired multiple copies of AMY1, the new study utilized novel techniques, called optical genome mapping and long-read sequencing, to sequence and analyze the genes. They sequenced 98 modern-day samples and 68 ancient DNA samples, including one from a Siberian person who lived 45,000 years ago.
The ancient DNA data in the study allowed the researchers to track how the number of amylase genes changed over time, said George Perry, PhD, an anthropological geneticist at The Pennsylvania State University-University Park (he was not involved in the study).
Based on the sequencing, the team analyzed changes in the genes in their samples to gauge evolutionary timelines. Perry noted that this was a “very clever approach to estimating the amylase copy number mutation rate, which in turn can really help in testing evolutionary hypotheses.”
The researchers found that even before farming, hunter-gatherers had between four and eight AMY1 genes in their cells. This suggests that people across Eurasia already had a number of these genes long before they started growing crops. (Recent research indicates that Neanderthals also ate starchy foods.)
“Even archaic hominins had these [genetic] variations and that indicates that they were consuming starch,” said Feyza Yilmaz, PhD, an associate computational scientist at The Jackson Laboratory in Bar Harbor, Maine, and a lead author of the study.
However, 4000 years ago, after the agricultural revolution, the research indicates that there were even more AMY1 copies acquired. Yilmaz noted, “with the advance of agriculture, we see an increase in high amylase copy number haplotypes. So genetic variation goes hand in hand with adaptation to the environment.”
A previous study showed that species that share an environment with humans, such as dogs and pigs, also have copy number variation of amylase genes, said Yilmaz, indicating a link between genome changes and an increase in starch consumption.
Potential Health Impacts on Modern Humans
The duplications in the AMY1 gene could have allowed humans to better digest starches. And it’s conceivable that having more copies of the gene means being able to break down starches even more efficiently, and those with more copies “may be more prone to having high blood sugar, prediabetes, that sort of thing,” Jorgensen said.
Whether those with more AMY1 genes have more health risks is an active area of research. “Researchers tested whether there’s a correlation between AMY1 gene copies and diabetes or BMI [body mass index]. And so far, some studies show that there is indeed correlation, but other studies show that there is no correlation at all,” said Yilmaz.
Yilmaz pointed out that only 5 or 10% of carb digestion happens in our mouths, the rest occurs in our small intestine, plus there are many other factors involved in eating and metabolism.
“I am really looking forward to seeing studies which truly figure out the connection between AMY1 copy number and metabolic health and also what type of factors play a role in metabolic health,” said Yilmaz.
It’s also possible that having more AMY1 copies could lead to more carb cravings as the enzyme creates a type of sugar in our mouths. “Previous studies show that there’s a correlation between AMY1 copy number and also the amylase enzyme levels, so the faster we process the starch, the taste [of starches] will be sweeter,” said Yilmaz.
However, the link between cravings and copy numbers isn’t clear. And we don’t exactly know what came first — did the starch in humans’ diet lead to more copies of amylase genes, or did the copies of the amylase genes drive cravings that lead us to cultivate more carbs? We’ll need more research to find out.
How Will Today’s Processed Carbs Affect Our Genes Tomorrow?
As our diet changes to increasingly include processed carbs, what will happen to our AMY1 genes is fuzzy. “I don’t know what this could do to our genomes in the next 1000 years or more than 1000 years,” Yilmaz noted, but she said from the evidence it seems as though we may have peaked in AMY1 copies.
Jorgensen noted that this research is focused on a European population. She wonders whether the pattern of AMY1 duplication will be repeated in other populations “because the rise of starch happened first in the Middle East and then Europe and then later in the Americas,” she said.
“There’s individual variation and then there’s population-wide variation,” Jorgensen pointed out. She speculates that the historical diet of different cultures could explain population-based variations in AMY1 genes — it’s something future research could investigate. Other populations may also experience genetic changes as much of the world shifts to a more carb-heavy Western diet.
Overall, this research adds to the growing evidence that humans have a long history of loving carbs — for better and, at least over our most recent history and immediate future, for worse.
A version of this article appeared on Medscape.com.
Duloxetine Bottles Recalled by FDA Because of Potential Carcinogen
The US Food and Drug Administration (FDA) has announced a voluntary manufacturer-initiated recall of more than 7000 bottles of duloxetine delayed-release capsules due to unacceptable levels of a potential carcinogen.
Duloxetine (Cymbalta) is a serotonin-norepinephrine reuptake inhibitor used to treat major depressive disorder, generalized anxiety disorder, fibromyalgia, chronic musculoskeletal pain, and neuropathic pain associated with diabetic peripheral neuropathy.
The recall is due to the detection of the nitrosamine impurity, N-nitroso duloxetine, above the proposed interim limit.
Nitrosamines are common in water and foods, and exposure to some levels of the chemical is common. Exposure to nitrosamine impurities above acceptable levels and over long periods may increase cancer risk, the FDA reported.
“If drugs contain levels of nitrosamines above the acceptable daily intake limits, FDA recommends these drugs be recalled by the manufacturer as appropriate,” the agency noted on its website.
The recall was initiated by Breckenridge Pharmaceutical and covers 7107 bottles of 500-count, 20 mg duloxetine delayed-release capsules. The drug is manufactured by Towa Pharmaceutical Europe and distributed nationwide by BPI.
The affected bottles are from lot number 220128 with an expiration date of 12/2024 and NDC of 51991-746-05.
The recall was initiated on October 10 and is ongoing.
“Healthcare professionals can educate patients about alternative treatment options to medications with potential nitrosamine impurities if available and clinically appropriate,” the FDA advises. “If a medication has been recalled, pharmacists may be able to dispense the same medication from a manufacturing lot that has not been recalled. Prescribers may also determine whether there is an alternative treatment option for patients.”
The FDA has labeled this a “class II” recall, which the agency defines as “a situation in which use of or exposure to a violative product may cause temporary or medically reversible adverse health consequences or where the probability of serious adverse health consequences is remote.”
Nitrosamine impurities have prompted a number of drug recalls in recent years, including oral anticoagulants, metformin, and skeletal muscle relaxants.
The impurities may be found in drugs for a number of reasons, the agency reported. The source may be from a drug’s manufacturing process, chemical structure, or the conditions under which it is stored or packaged.
A version of this article appeared on Medscape.com.
Help Your Patients Reap the Benefits of Plant-Based Diets
Research pooled from nearly 100 studies has indicated that people who adhere to a vegan diet (ie, completely devoid of animal products) or a vegetarian diet (ie, devoid of meat, but may include dairy and eggs) are able to ward off some chronic diseases, such as cardiovascular disease, optimize glycemic control, and decrease their risk for cancer compared with those who consume omnivorous diets.
Vegan and vegetarian diets, or flexitarian diets — which are less reliant on animal protein than the standard US diet but do not completely exclude meat, fish, eggs, or dairy — may promote homeostasis and decrease inflammation by providing more fiber, antioxidants, and unsaturated fatty acids than the typical Western diet.
Inflammation and Obesity
Adipose tissue is a major producer of pro-inflammatory cytokines like interleukin (IL)-6, whose presence then triggers a rush of acute-phase reactants such as C-reactive protein (CRP) by the liver. This process develops into chronic low-grade inflammation that can increase a person’s chances of developing diabetes, cardiovascular disease, kidney disease, metabolic syndrome, and related complications.
Adopting a plant-based diet can improve markers of chronic low-grade inflammation that can lead to chronic disease and worsen existent chronic disease. A meta-analysis of 29 studies encompassing nearly 2700 participants found that initiation of a plant-based diet showed significant improvement in CRP, IL-6, and soluble intercellular adhesion molecule 1.
If we want to prevent these inflammatory disease states and their complications, the obvious response is to counsel patients to avoid excessive weight gain or to lose weight if obesity is their baseline. This can be tough for some patients, but it is nonetheless an important step in chronic disease prevention and management.
Plant-Based Diet for Type 2 Diabetes
According to a review of nine studies of patients living with type 2 diabetes who adhered to a plant-based diet, all but one found that this approach led to significantly lower A1c values than those seen in control groups. Six of the included studies reported that participants were able to decrease or discontinue medications for the management of diabetes. Researchers across all included studies also noted a decrease in total cholesterol, low-density lipoprotein cholesterol, and triglycerides, as well as increased weight loss in participants in each intervention group.
Such improvements are probably the result of the increase in fiber intake that occurs with a plant-based diet. A high-fiber diet is known to promote improved glucose and lipid metabolism as well as weight loss.
It is also worth noting that participants in the intervention groups also experienced improvements in depression and less chronic pain than did those in the control groups.
Plant-Based Diet for Chronic Kidney Disease (CKD)
Although the use of a plant-based diet in the prevention of CKD is well documented, adopting such diets for the treatment of CKD may intimidate both patients and practitioners owing to the high potassium and phosphorus content of many fruits and vegetables.
However, research indicates that the bioavailability of both potassium and phosphorus is lower in plant-based, whole foods than in preservatives and the highly processed food items that incorporate them. This makes a plant-based diet more viable than previously thought.
Diets rich in vegetables, whole grains, nuts, and legumes have been shown to decrease dietary acid load, both preventing and treating metabolic acidosis. Such diets have also been shown to decrease blood pressure and the risk for a decline in estimated glomerular filtration rate. This type of diet would also prioritize the unsaturated fatty acids and fiber-rich proteins such as avocados, beans, and nuts shown to improve dyslipidemia, which may occur alongside CKD.
Realistic Options for Patients on Medical Diets
There is one question that I always seem to get from when recommending a plant-based diet: “These patients already have so many restrictions. Why would you add more?” And my answer is also always the same: I don’t.
I rarely, if ever, recommend completely cutting out any food item or food group. Instead, I ask the patient to increase their intake of plant-based foods and only limit highly processed foods and fatty meats. By shifting a patient’s focus to beans; nuts; and low-carbohydrate, high-fiber fruits and vegetables, I am often opening up a whole new world of possibilities.
Instead of a sandwich with low-sodium turkey and cheese on white bread with a side of unsalted pretzels, I recommend a caprese salad with blueberries and almonds or a Southwest salad with black beans, corn, and avocado. I don’t encourage my patients to skip the foods that they love, but instead to only think about all the delicious plant-based options that will provide them with more than just calories.
Meat, dairy, seafood, and eggs can certainly be a part of a healthy diet, but what if our chronically ill patients, especially those with diabetes, had more options than just grilled chicken and green beans for every meal? What if we focus on decreasing dietary restrictions, incorporating a variety of nourishing foods, and educating our patients, instead of on portion control and moderation?
This is how I choose to incorporate plant-based diets into my practice to treat and prevent these chronic inflammatory conditions and promote sustainable, realistic change in my clients’ health.
Brandy Winfree Root, a renal dietitian in private practice in Mary Esther, Florida, has disclosed no relevant financial relationships.
A version of this article appeared on Medscape.com.