User login
Understanding your LGBTQ patients’ needs
NEW ORLEANS – One of the most important things pediatricians can do to support their lesbian, gay, bisexual, transgender (LGBT) and other gender-nonconforming patients is to ask all their patients about their feelings, preferences and experiences when it comes to gender and sexuality, according to Julie Finger, MD, MPH.

It’s equally important not to make assumptions, she told attendees at the annual meeting of the American Academy of Pediatrics. Biology and sexual and gender identity and expression can be very diverse, she said. Specifically, doctors should not assume patients are heterosexual, that bisexuality is a phase, that orientation or attraction translates directly to behavior or vice versa, or that LGBTQ patients have unsupportive families or are engaging in risky behavior. Research suggests LGB youth have slightly higher rates of early sexual debut, sexual activity or multiple partners than straight or uncertain youth, but only marginally so.
Pediatricians also cannot assume a patient’s sexual orientation based on their partner’s gender or determine a patient’s sexual orientation or gender identity based on appearance – or even that either is the same as it was on the previous visit.
What doctors can be sure of is that they do have LGBTQ patients, said Dr. Finger, and assistant professor of clinical pediatrics at Tulane University in New Orleans. According to a 2016 Morbidity and Mortality Weekly Report (2016 Aug 12; 65[9]), about 1 in 10 students in grades 9-12 are a sexual minority. About 2% of respondents identify as gay or lesbian, 6% identify as bisexual and 3% say they aren’t sure.
Knowing the terminology
Dr. Finger defined key terminology regarding gender and sexuality. She first clarified that LGBT is not the full spectrum for sexual orientation. Pansexual (fluid attraction to any sex or gender) and asexual (lack of feeling sexual attraction) can also describe sexuality, and the Q on the end of LGBTQ is often an umbrella term for “queer” or “questioning” that encompasses anyone who fits outside conventional social norms of sexual identity and gender expression.
Sexual behaviors – which include “young men who have sex with men” and “young women who have sex with women” – do not necessarily correspond as one might expect with sexual orientation or identity, which is one’s concept of their romantic or sexual feelings, attractions and desires, again reinforcing the importance of asking patients their identity and preferences.
In terms of gender, a person’s natal or biologic gender is the one assigned people at birth based on their body parts and hormones. Gender identity is a person’s understanding of their own gender, and gender expression refers to how someone acts or presents themselves and communicates their gender within their culture.
Those who identify as “gender nonconforming, genderqueer, gender fluid, or nonbinary” see their gender on a spectrum, not within the binary “male” or “female.” A cisgender person’s gender identity matches both their biological sex assigned at birth and conventional cultural norms, while a transgender person’s gender differs from the sex they were assigned at birth. Transgender women (male to female, MTF) and men (female to men, FTM) go through the process of transition, a time that can occur in weeks or years when they shift from living as one gender to another.
While it’s unclear what leads to a person’s sexual orientation – likely a combination of genetic, hormonal and environmental factors—there is no question that sexual orientation is not a “choice,” Dr Finger said. Research has also clarified that one’s sexual orientation does not result from parenting behaviors or a history of sexual abuse.
“But I would urge all of you, instead of focusing on why someone is LGBTQ, to focus on what that means for them in their life,” Dr Finger said. “How is this bearing out in terms of their relationships and their behaviors, and how do they feel about it? How are they being supported by their family or their community, and how is it impacting their lives?”
She cited findings from a Human Rights Campaign survey in 2012 of 10,000 youth aged 13-17, which found that most LGBTQ respondents became aware of their same-sex attraction at 9 years of age, though the average age of disclosures is 16, an improvement from age 21 in the 1980s.
How and what to ask
Although children start becoming conscious of gender at ages 1-2, their sense of gender usually stabilizes by age 4.
“Who should we be screening for gender nonconformity? Quite frankly, all children, because all of them have some gender identity, so we should be asking them about that,” Dr Finger said.
When children are younger, doctors can ask parents about their child’s social interactions, forms of play, dress preferences, and mood. Questions for patients themselves, adapted for their age, might include, “Do you feel more like a girl, boy, neither or both?”, “How would you like to play, cut your hair and dress?” And “What name or pronoun (he or she) fits you?”
While such conversations do not necessarily need to happen annually, doctors should especially ask youth who dress or behave in non–gender-conforming ways or who appear to have mood, behavior or social difficulties.
To understand a patient’s sexuality, ask whether they are attracted to people of their own gender or sex, a different gender or sex, both or all genders or no one, or if they’re not sure yet. Doctors can then ask how comfortable they are with their attraction and whether they have told family members or friends about them.
Sexual behavior questions should be developmentally appropriate and lead to counsel but not judgment, Dr Finger said. Her method, with adjustments for age and development, starts, “There are many way of being sexual or intimate with someone: kissing, hugging and touching, and oral sex, anal sex and vaginal sex. Have you ever had any of these experiences? Which ones? With males or females or both, or other genders?”
Then she gets more specific while remaining sensitive. Doctors can ask younger children if they have held hands or cuddled with someone, if they have kissed someone, or if they have touched another person’s private parts. They can ask teens about oral sex, vaginal sex and anal sex and then gather more details about what parts went where, which helps determine what screenings or treatment options a patient may need or desire.
Doctors can use their judgment about whether to ask questions with parents in the room or not, but as kids grow older, it’s good practice to speak to patients without their caregivers present. Doctors should also explain the rules of confidentiality to their patients and be aware of the risks of “coming out,” including family discord or rejection, problems at school or work, social stigma, bullying and harassment, physical violence and risk-taking behaviors, such as substance use, self-injury and risky sexual behaviors. A HEADSSS screen can help doctors learn if any of these are present.
Making your practice inclusive and welcoming
Fewer than one in five teens who are “out” as LGBTQ have come out to their doctor, Dr Finger cited. Most are out to their friends and classmates, and more than half are out to their family, but teens are less likely to tell their doctors.
Research suggests one reason for this is the fact that pediatricians often don’t ask. One study found that only 20% of pediatricians discussed sexual orientation with their patients (Pediatrics 2010 Apr;125:e741-7). Similarly, only 30% of family physicians brought up sexual orientation, found another study (Fam. Med. 2001 May;33[5]:376-81). The studies found physicians more often discussed condoms, HIV, sexually transmitted infections, abstinence, violence, contraception or, in the case of family physicians, sexual behaviors, and relationships.
But another reason for not being out to doctors is a history of poor experiences. A Lambda Legal Survey in 2009 of 4,916 LGBT respondents found that 8% of LGB and 27% of transgender and gender nonconforming patients had been denied care because of their identity of orientation. Eleven percent said “providers refused to touch them or used excessive precautions,” Dr Finger reported. LGBTQ patients may fear the doctor’s reaction or not keeping their identity confidential. Patients may also have internalized shame or guilt due to societal norms or homophobia, and all these barriers can reduce LGBTQ people’s willingness to seek and access to competent care.
The first step to making LGBTQ patients comfortable in your practice is to confront your own personal biases, Dr Finger said. Understand what they are and that a provider’s discomfort, even unconscious, can be damaging to the patient-provider relationship.
“If you find that this is just not something that you’re going to be comfortable doing, at the very least, I would suggest that you find providers in your area who are comfortable working with this patient population and you refer your patients to them so that they can have a good, trusting patient-provider relationship with somebody who can provide the care that they need,” Dr Finger said.
The next step is creating a safe place with zero tolerance for insensitivity by training staff to be welcoming and inclusive, assuring patients confidentiality, providing support and resources and displaying LGBTQ-affirming materials. These youth need active, visible evidence that the office will be a safe place for them.
Ways pediatricians can communicate an inclusive environment include having gender-neutral restrooms, using “parent” instead of “mother/father” and using forms and EMR prompts with gender-neutral language or multiple options for gender selection.
Screening and LGBTQ patients’ health needs
LGB youth and those who aren’t sure of their sexual orientation tend to have higher rates of substance use, including tobacco, alcohol and illicit drugs, and are more often victims of rape and other sexual violence. Their rates of depressive symptoms, bullying victimization, and suicidality are also significantly higher than in their heterosexual cisgender peers. Homelessness rates are also considerably higher in LGBTQ youth than in heterosexual cisgender youth.
One thing pediatricians can do is work with parents to ensure a patient’s school is meeting their needs. The greater risks LGBTQ youth typically face are mediated by social support, resiliency, supportive friends and family and a supportive school environment, including inclusive curricula and supportive staff.
Lesbian and bisexual women are considerably more at risk for poor sexual or reproductive outcomes, Dr Finger said. Their rates of unplanned pregnancy are double that of straight women, contributing to their higher rates of emergency contraception and abortion. They are also more likely to have more partners (male and females), to have a younger sexual debut and to be forced into sex by a male partner—yet they are far less likely to perceive themselves as at risk for a sexually transmitted infection than their peers.
This patient population therefore may need contraception counseling, including discussing their current methods and reviewing their options, including emergency contraception and possibly an advance prescription. Dr Finger also suggests having male and female condoms available in the office.
Doctors should screen all their female patients, regardless of sexuality, for chlamydia and gonorrhea, and offer routine cervical cancer screening and the HPV vaccine, as recommended by the CDC. They might consider screening for trichomoniasis, bacterial vaginosis, herpes simplex, human papillomavirus and HIV.
For men who have sex with men, the CDC recommends HIV and syphilis serology, urine/pharyngeal/rectal gonorrhea nucleic acid amplification test (NAAT), urine/rectal chlamydia NAAT, and hepatitis C screening for those who are HIV-positive—all at least once a year.
For transgender patients, doctors need to assess their STI- and HIV-related risks based on their current anatomy and sexual behaviors.
Doctors should also consider discussing pre-exposure prophylaxis (PrEP) for any youth at high risk for HIV infection if they are at least 77 pounds (35 kg). Emtricitabine/tenofovir (Truvada, Descovy) reduces the chance of sexually acquired infection by 99%, and infection acquired via drug injection by 74% when taken as prescribed.
Resources
Dr Finger noted a range of resources for LGBTQ youth and their families and providers, including the Family Acceptance Project, Gay and Lesbian Medical Association, Gay, Lesbian and Straight Education Network, GLBTQ Legal Advocates and Defenders (GLAD), Human Rights Campaign, It Gets Better Project, LGBTQ Student Resources and Support, National Center for Lesbian Rights, Parents and Friends of Lesbians and Gays (PFLAG), Safe Schools Coalition and The Trevor Project (concerning suicide risk).
NEW ORLEANS – One of the most important things pediatricians can do to support their lesbian, gay, bisexual, transgender (LGBT) and other gender-nonconforming patients is to ask all their patients about their feelings, preferences and experiences when it comes to gender and sexuality, according to Julie Finger, MD, MPH.
It’s equally important not to make assumptions, she told attendees at the annual meeting of the American Academy of Pediatrics. Biology and sexual and gender identity and expression can be very diverse, she said. Specifically, doctors should not assume patients are heterosexual, that bisexuality is a phase, that orientation or attraction translates directly to behavior or vice versa, or that LGBTQ patients have unsupportive families or are engaging in risky behavior. Research suggests LGB youth have slightly higher rates of early sexual debut, sexual activity or multiple partners than straight or uncertain youth, but only marginally so.
Pediatricians also cannot assume a patient’s sexual orientation based on their partner’s gender or determine a patient’s sexual orientation or gender identity based on appearance – or even that either is the same as it was on the previous visit.
What doctors can be sure of is that they do have LGBTQ patients, said Dr. Finger, and assistant professor of clinical pediatrics at Tulane University in New Orleans. According to a 2016 Morbidity and Mortality Weekly Report (2016 Aug 12; 65[9]), about 1 in 10 students in grades 9-12 are a sexual minority. About 2% of respondents identify as gay or lesbian, 6% identify as bisexual and 3% say they aren’t sure.
Knowing the terminology
Dr. Finger defined key terminology regarding gender and sexuality. She first clarified that LGBT is not the full spectrum for sexual orientation. Pansexual (fluid attraction to any sex or gender) and asexual (lack of feeling sexual attraction) can also describe sexuality, and the Q on the end of LGBTQ is often an umbrella term for “queer” or “questioning” that encompasses anyone who fits outside conventional social norms of sexual identity and gender expression.
Sexual behaviors – which include “young men who have sex with men” and “young women who have sex with women” – do not necessarily correspond as one might expect with sexual orientation or identity, which is one’s concept of their romantic or sexual feelings, attractions and desires, again reinforcing the importance of asking patients their identity and preferences.
In terms of gender, a person’s natal or biologic gender is the one assigned people at birth based on their body parts and hormones. Gender identity is a person’s understanding of their own gender, and gender expression refers to how someone acts or presents themselves and communicates their gender within their culture.
Those who identify as “gender nonconforming, genderqueer, gender fluid, or nonbinary” see their gender on a spectrum, not within the binary “male” or “female.” A cisgender person’s gender identity matches both their biological sex assigned at birth and conventional cultural norms, while a transgender person’s gender differs from the sex they were assigned at birth. Transgender women (male to female, MTF) and men (female to men, FTM) go through the process of transition, a time that can occur in weeks or years when they shift from living as one gender to another.
While it’s unclear what leads to a person’s sexual orientation – likely a combination of genetic, hormonal and environmental factors—there is no question that sexual orientation is not a “choice,” Dr Finger said. Research has also clarified that one’s sexual orientation does not result from parenting behaviors or a history of sexual abuse.
“But I would urge all of you, instead of focusing on why someone is LGBTQ, to focus on what that means for them in their life,” Dr Finger said. “How is this bearing out in terms of their relationships and their behaviors, and how do they feel about it? How are they being supported by their family or their community, and how is it impacting their lives?”
She cited findings from a Human Rights Campaign survey in 2012 of 10,000 youth aged 13-17, which found that most LGBTQ respondents became aware of their same-sex attraction at 9 years of age, though the average age of disclosures is 16, an improvement from age 21 in the 1980s.
How and what to ask
Although children start becoming conscious of gender at ages 1-2, their sense of gender usually stabilizes by age 4.
“Who should we be screening for gender nonconformity? Quite frankly, all children, because all of them have some gender identity, so we should be asking them about that,” Dr Finger said.
When children are younger, doctors can ask parents about their child’s social interactions, forms of play, dress preferences, and mood. Questions for patients themselves, adapted for their age, might include, “Do you feel more like a girl, boy, neither or both?”, “How would you like to play, cut your hair and dress?” And “What name or pronoun (he or she) fits you?”
While such conversations do not necessarily need to happen annually, doctors should especially ask youth who dress or behave in non–gender-conforming ways or who appear to have mood, behavior or social difficulties.
To understand a patient’s sexuality, ask whether they are attracted to people of their own gender or sex, a different gender or sex, both or all genders or no one, or if they’re not sure yet. Doctors can then ask how comfortable they are with their attraction and whether they have told family members or friends about them.
Sexual behavior questions should be developmentally appropriate and lead to counsel but not judgment, Dr Finger said. Her method, with adjustments for age and development, starts, “There are many way of being sexual or intimate with someone: kissing, hugging and touching, and oral sex, anal sex and vaginal sex. Have you ever had any of these experiences? Which ones? With males or females or both, or other genders?”
Then she gets more specific while remaining sensitive. Doctors can ask younger children if they have held hands or cuddled with someone, if they have kissed someone, or if they have touched another person’s private parts. They can ask teens about oral sex, vaginal sex and anal sex and then gather more details about what parts went where, which helps determine what screenings or treatment options a patient may need or desire.
Doctors can use their judgment about whether to ask questions with parents in the room or not, but as kids grow older, it’s good practice to speak to patients without their caregivers present. Doctors should also explain the rules of confidentiality to their patients and be aware of the risks of “coming out,” including family discord or rejection, problems at school or work, social stigma, bullying and harassment, physical violence and risk-taking behaviors, such as substance use, self-injury and risky sexual behaviors. A HEADSSS screen can help doctors learn if any of these are present.
Making your practice inclusive and welcoming
Fewer than one in five teens who are “out” as LGBTQ have come out to their doctor, Dr Finger cited. Most are out to their friends and classmates, and more than half are out to their family, but teens are less likely to tell their doctors.
Research suggests one reason for this is the fact that pediatricians often don’t ask. One study found that only 20% of pediatricians discussed sexual orientation with their patients (Pediatrics 2010 Apr;125:e741-7). Similarly, only 30% of family physicians brought up sexual orientation, found another study (Fam. Med. 2001 May;33[5]:376-81). The studies found physicians more often discussed condoms, HIV, sexually transmitted infections, abstinence, violence, contraception or, in the case of family physicians, sexual behaviors, and relationships.
But another reason for not being out to doctors is a history of poor experiences. A Lambda Legal Survey in 2009 of 4,916 LGBT respondents found that 8% of LGB and 27% of transgender and gender nonconforming patients had been denied care because of their identity of orientation. Eleven percent said “providers refused to touch them or used excessive precautions,” Dr Finger reported. LGBTQ patients may fear the doctor’s reaction or not keeping their identity confidential. Patients may also have internalized shame or guilt due to societal norms or homophobia, and all these barriers can reduce LGBTQ people’s willingness to seek and access to competent care.
The first step to making LGBTQ patients comfortable in your practice is to confront your own personal biases, Dr Finger said. Understand what they are and that a provider’s discomfort, even unconscious, can be damaging to the patient-provider relationship.
“If you find that this is just not something that you’re going to be comfortable doing, at the very least, I would suggest that you find providers in your area who are comfortable working with this patient population and you refer your patients to them so that they can have a good, trusting patient-provider relationship with somebody who can provide the care that they need,” Dr Finger said.
The next step is creating a safe place with zero tolerance for insensitivity by training staff to be welcoming and inclusive, assuring patients confidentiality, providing support and resources and displaying LGBTQ-affirming materials. These youth need active, visible evidence that the office will be a safe place for them.
Ways pediatricians can communicate an inclusive environment include having gender-neutral restrooms, using “parent” instead of “mother/father” and using forms and EMR prompts with gender-neutral language or multiple options for gender selection.
Screening and LGBTQ patients’ health needs
LGB youth and those who aren’t sure of their sexual orientation tend to have higher rates of substance use, including tobacco, alcohol and illicit drugs, and are more often victims of rape and other sexual violence. Their rates of depressive symptoms, bullying victimization, and suicidality are also significantly higher than in their heterosexual cisgender peers. Homelessness rates are also considerably higher in LGBTQ youth than in heterosexual cisgender youth.
One thing pediatricians can do is work with parents to ensure a patient’s school is meeting their needs. The greater risks LGBTQ youth typically face are mediated by social support, resiliency, supportive friends and family and a supportive school environment, including inclusive curricula and supportive staff.
Lesbian and bisexual women are considerably more at risk for poor sexual or reproductive outcomes, Dr Finger said. Their rates of unplanned pregnancy are double that of straight women, contributing to their higher rates of emergency contraception and abortion. They are also more likely to have more partners (male and females), to have a younger sexual debut and to be forced into sex by a male partner—yet they are far less likely to perceive themselves as at risk for a sexually transmitted infection than their peers.
This patient population therefore may need contraception counseling, including discussing their current methods and reviewing their options, including emergency contraception and possibly an advance prescription. Dr Finger also suggests having male and female condoms available in the office.
Doctors should screen all their female patients, regardless of sexuality, for chlamydia and gonorrhea, and offer routine cervical cancer screening and the HPV vaccine, as recommended by the CDC. They might consider screening for trichomoniasis, bacterial vaginosis, herpes simplex, human papillomavirus and HIV.
For men who have sex with men, the CDC recommends HIV and syphilis serology, urine/pharyngeal/rectal gonorrhea nucleic acid amplification test (NAAT), urine/rectal chlamydia NAAT, and hepatitis C screening for those who are HIV-positive—all at least once a year.
For transgender patients, doctors need to assess their STI- and HIV-related risks based on their current anatomy and sexual behaviors.
Doctors should also consider discussing pre-exposure prophylaxis (PrEP) for any youth at high risk for HIV infection if they are at least 77 pounds (35 kg). Emtricitabine/tenofovir (Truvada, Descovy) reduces the chance of sexually acquired infection by 99%, and infection acquired via drug injection by 74% when taken as prescribed.
Resources
Dr Finger noted a range of resources for LGBTQ youth and their families and providers, including the Family Acceptance Project, Gay and Lesbian Medical Association, Gay, Lesbian and Straight Education Network, GLBTQ Legal Advocates and Defenders (GLAD), Human Rights Campaign, It Gets Better Project, LGBTQ Student Resources and Support, National Center for Lesbian Rights, Parents and Friends of Lesbians and Gays (PFLAG), Safe Schools Coalition and The Trevor Project (concerning suicide risk).
EXPERT ANALYSIS FROM AAP 2019

Suicide deaths rising in children aged 10-19 years
according to the National Center for Health Statistics.
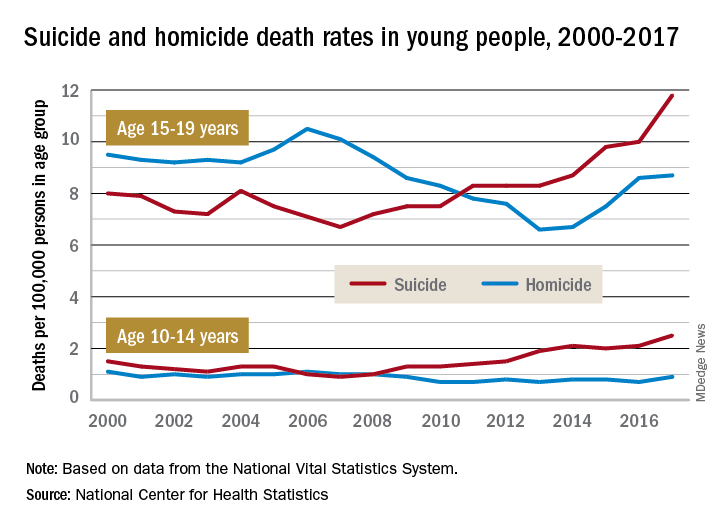
Death rates from suicide for children aged 10-14 years jumped by 178% from 2007 to 2017, while teenagers aged 15-19 years experienced a 76% increase over that period, with both changes reaching significance, the NCHS said in a recent data brief based on data from the National Vital Statistics System.
The actual rate for teens was higher to begin with, however, so in absolute terms the increase is larger for the older group. In 2007, deaths from suicide occurred at a rate of 6.7 per 100,000 persons for persons aged 15-19 years, and by 2017 that rate was up significantly to 11.8 per 100,000. Among children aged 10-14 years, the suicide-related death rate climbed from 0.9 per 100,000 in 2007 to 2.5 in 2014, the NCHS investigators reported.
The news was somewhat better on the other side of the violent death coin. Homicides are down by a significant 18% since 2000 among children aged 10-14 years, as the rate dropped from 1.1 per 100,000 in 2000 to 0.9 in 2017. The homicide rate since 2000 is down slightly for teens aged 15-19 years, but it has risen 32% in recent years, going from 6.6 deaths per 100,000 in 2013 to 8.7 in 2017, they said.
Suicide was the second-leading cause of death in both age groups in 2017, and homicide was third for those aged 15-19 and fifth among 10- to 14-year-olds, the investigators noted.
according to the National Center for Health Statistics.
Death rates from suicide for children aged 10-14 years jumped by 178% from 2007 to 2017, while teenagers aged 15-19 years experienced a 76% increase over that period, with both changes reaching significance, the NCHS said in a recent data brief based on data from the National Vital Statistics System.
The actual rate for teens was higher to begin with, however, so in absolute terms the increase is larger for the older group. In 2007, deaths from suicide occurred at a rate of 6.7 per 100,000 persons for persons aged 15-19 years, and by 2017 that rate was up significantly to 11.8 per 100,000. Among children aged 10-14 years, the suicide-related death rate climbed from 0.9 per 100,000 in 2007 to 2.5 in 2014, the NCHS investigators reported.
The news was somewhat better on the other side of the violent death coin. Homicides are down by a significant 18% since 2000 among children aged 10-14 years, as the rate dropped from 1.1 per 100,000 in 2000 to 0.9 in 2017. The homicide rate since 2000 is down slightly for teens aged 15-19 years, but it has risen 32% in recent years, going from 6.6 deaths per 100,000 in 2013 to 8.7 in 2017, they said.
Suicide was the second-leading cause of death in both age groups in 2017, and homicide was third for those aged 15-19 and fifth among 10- to 14-year-olds, the investigators noted.
ACIP approves child and adolescent vaccination schedule for 2020
The Centers for Disease Control and Prevention’s Advisory Committee on Immunization Practices voted unanimously to approve the child and adolescent immunization schedule for 2020.
by busy providers,” Candice Robinson, MD, MPH, of the CDC’s National Center for Immunization and Respiratory Diseases, said at the CDC’s October meeting of ACIP. Updates reflect changes in language in the adult vaccination schedule, notably the change in the definition of “contraindication.” The updated wording in the Notes substitutes “not recommended or contraindicated” instead of the word “contraindicated” only.
Another notable change was the addition of information on adolescent vaccination of children who received the meningococcal ACWY vaccine before 10 years of age. For “children in whom boosters are not recommended due to an ongoing or increased risk of meningococcal disease” (such as a healthy child traveling to an endemic area), they should receive MenACWY according to the recommended adolescent schedule. But those children for whom boosters are recommended because of increased disease risk from conditions including complement deficiency, HIV, or asplenia should “follow the booster schedule for persons at increased risk.”
Other changes include restructuring of the notes for the live attenuated influenza vaccine (LAIV) in special situations. The schedule now uses a bulleted list to show that LAIV should not be used in the following circumstances:
- Having history of severe allergic reaction to a previous vaccine or vaccine component.
- Using aspirin or a salicylate-containing medication.
- Being aged 2-4 years with a history of asthma or wheezing.
- Having immunocompromised conditions.
- Having anatomic or functional asplenia.
- Having cochlear implants.
- Experiencing cerebrospinal fluid–oropharyngeal communication.
- Having immunocompromised close contacts or caregivers.
- Being pregnant.
- Having received flu antivirals within the previous 48 hours.
In addition, language on shared clinical decision-making was added to the notes on the meningococcal B vaccine for adolescents and young adults aged 18-23 years not at increased risk. Based on shared clinical decision making, the recommendation is a “two-dose series of Bexsero at least 1 month apart” or “two-dose series of Trumenba at least 6 months apart; if dose two is administered earlier than 6 months, administer a third dose at least 4 months after dose two.”
Several vaccines’ Notes sections, including hepatitis B and meningococcal disease, added links to detailed recommendations in the corresponding issues of the CDC’s Morbidity and Mortality Weekly Report, to allow clinicians easy access to additional information.
View the current Child & Adolescent Vaccination Schedule here.
The ACIP members had no financial conflicts to disclose.
FROM AN ACIP MEETING
Flu vaccine: Larger impact on influenza burden than you thought?
ID Week, the annual meeting of the Infectious Disease Society of America, provided valuable insights into past season’s endemic influenza burden and the effectiveness of prevention strategies. Each year, there are from 9million to 49 million influenza cases in the United States, 140,000-960,000 hospitalized cases, and 12,000-70,000 deaths directly attributable to influenza infection. The burden disproportionately falls on infants and adults 65 years of age and older; 11,000-48,000 children are hospitalized, and as many as several hundred children may die from influenza and related complications. School age children (aged 5-19 years) and adults (aged 30-39 years) are a major part of the transmission cycle. Influenza vaccine underlies the prevention strategy for limiting the burden of disease in U.S. populations. ID Week provided new insights into critical questions about influenza vaccines.
1. What is the effectiveness of influenza vaccine against severe disease (hospitalization) in children? Does it vary by age? By type or subtype?
Angela P. Campbell, MD, MPH, of the Centers for Disease Control and Prevention, and associates presented data on influenza vaccine effectiveness from the New Vaccine Surveillance Network in children for the 2016-2017 and 2017-2018 season (ID Week session 99; Abstract 899). During both 2016-2017 and 2017-2018, H3N2 was the dominant virus and influenza B represented about one-third of cases, and H1N1 was a greater percentage of cases in 2017-2018. Influenza positivity among children younger than 18 years of age admitted to hospital with respiratory disease was 14% among unvaccinated and 8% among vaccinated children; effectiveness again hospitalization was 50%. Vaccine effectiveness (VE) was not statistically different between children younger than 8 years of age and those older that 8 years but did differ by vaccine type. VE was 76% against H1N1 disease, 59% again B disease, and only 33% against H3N2 disease.
Clearly, vaccination with influenza vaccine prevents serious respiratory disease. However, the impact of vaccine will vary by season and by which influenza stains are circulating in the community. The authors concluded that further understanding of the lower VE against H3N2 disease is needed.
2. Does the priming dose of influenza vaccine improve vaccine effectiveness?
Current recommendations call for a two-dose series for influenza vaccine in children aged 6 months through 8 years who have not had prior influenza vaccine. The recommendation is based on evidence demonstrating higher antibody responses in children receiving two doses, compared with a single dose. Using data from the U.S. Influenza Vaccine Effectiveness Network, Jessie R. Chung, MPH, of the CDC, and associates compared VE in children younger than 2 years receiving two doses in the first year of flu immunization (fully immunized), compared with those who received only one dose (partially immunized) (ID Week session 99; Abstract 900). VE was 53% for fully immunized and 23% for partially immunized children. Receipt of a single dose did not provide statistically significant protection against influenza. Surprisingly (to me), of 5,355 children aged 6 months to less than 2 years with no prior influenza vaccine, 1,870 (35%) received only one dose in the season.
The data strongly support the current recommendations for a priming dose, especially in young children, in the first season of influenza vaccine and warrants increased efforts to increase the update of second doses during the season. Hopefully we can do better in 2019!
3. Should we wait to vaccinate with influenza vaccine?
Some evidence suggests that waning immunity to influenza vaccine, primarily in those aged 65 years and older, may explain increased disease activity toward the end of influenza season. Other explanations include increasing viral diversity throughout the season, resulting in reduced effectiveness. Do such concerns warrant delaying immunization? The onset and peak of influenza season varies by year; in October 2019, 3% of tests performed on patients with respiratory illness were influenza positive. The trade-offs for delaying immunization until October are the unpredictability of onset of influenza season, the requirement for two doses in infants, the need for 2 weeks to achieve peak antibody concentrations, and the potential that fewer individuals will be vaccinated. Kathy Neuzil, MD, MPH, from the Center for Vaccine Development and Global Health, University of Maryland School of Medicine, reviewed recent modeling (for adults aged 65 years and older) and reported that delaying vaccine programs until October is associated with greater burden of hospitalization if 14% fewer individuals (who would be vaccinated in August/September) are vaccinated (ID Week; Session 940).
In response to these concerns, the CDC recommendations for 2019 are that, in children aged 6 months through 8 years who need two doses, start early so that you can achieve both doses before influenza season (MMWR 2019 Aug 23;68[3]:1-21).In older children and adults, who need only a single dose, early vaccination (August and early September) may lead to reduced protection late in the influenza season?
4. How can we optimize vaccine impact?
Vaccine impact refers to the affect on a population level and not at an individual level. Meagan C. Fitzpatrick, PhD, from the Center for Vaccine Development and Global Health, University of Maryland School of Medicine, evaluated the benefits of our moderately effective influenza vaccines (VE 40%-60%) to the population beyond those who are vaccinated. Her conclusions were that even a modestly effective vaccine prevents 21 million cases of influenza, 129,000 hospitalizations, and 62,000 deaths. And that two-thirds of the deaths prevented are from herd benefit (or indirect effects). Although both coverage and vaccine effectiveness are important, she reported that population impact was most sensitive to coverage, compared with vaccine effectiveness. Dr. Fitzpatrick found that targeting school-age children 6-19 years of age and adults 30-39 years of age maximizes the public health benefits (herd effects) of influenza vaccine. In 2018 season, influenza coverage was 63% for at least one dose in children aged 6 months through 17 years and 45% in adults aged 18 years and older; in the two target age groups 5-17 and 30-39 years, coverage was 59% and approximately 35%, respectively (ID Week; Session 939).

Clearly, even our modestly effective influenza vaccines have significant public health benefit in protecting the U.S. populations from serious disease and death. Efforts to increase vaccine uptake in school-age children, both those with and without comorbidity, and the 30- to 39-year-old adult cohort would likely further reduce the burden of serious disease from influenza.
In summary, despite a vaccine that is only moderately effective, there is clear evidence to support current recommendations of universal immunization beginning at 6 months of age. Delaying until October 1 is a good idea only if the same number of individuals will receive influenza vaccine, otherwise the hypothetical benefit is lost.
Dr. Pelton is professor of pediatrics and epidemiology at Boston University schools of medicine and public health and is senior attending physician, Boston Medical Center. Dr. Pelton has investigator-initiated research awards to Boston Medical Center from Pfizer and Merck Vaccines. He also received honorarium as an advisory board member, participation in symposium and consultation from Seqirus and Merck Vaccine, Pfizer, and Sanofi Pasteur. Email him at [email protected].
ID Week, the annual meeting of the Infectious Disease Society of America, provided valuable insights into past season’s endemic influenza burden and the effectiveness of prevention strategies. Each year, there are from 9million to 49 million influenza cases in the United States, 140,000-960,000 hospitalized cases, and 12,000-70,000 deaths directly attributable to influenza infection. The burden disproportionately falls on infants and adults 65 years of age and older; 11,000-48,000 children are hospitalized, and as many as several hundred children may die from influenza and related complications. School age children (aged 5-19 years) and adults (aged 30-39 years) are a major part of the transmission cycle. Influenza vaccine underlies the prevention strategy for limiting the burden of disease in U.S. populations. ID Week provided new insights into critical questions about influenza vaccines.
1. What is the effectiveness of influenza vaccine against severe disease (hospitalization) in children? Does it vary by age? By type or subtype?
Angela P. Campbell, MD, MPH, of the Centers for Disease Control and Prevention, and associates presented data on influenza vaccine effectiveness from the New Vaccine Surveillance Network in children for the 2016-2017 and 2017-2018 season (ID Week session 99; Abstract 899). During both 2016-2017 and 2017-2018, H3N2 was the dominant virus and influenza B represented about one-third of cases, and H1N1 was a greater percentage of cases in 2017-2018. Influenza positivity among children younger than 18 years of age admitted to hospital with respiratory disease was 14% among unvaccinated and 8% among vaccinated children; effectiveness again hospitalization was 50%. Vaccine effectiveness (VE) was not statistically different between children younger than 8 years of age and those older that 8 years but did differ by vaccine type. VE was 76% against H1N1 disease, 59% again B disease, and only 33% against H3N2 disease.
Clearly, vaccination with influenza vaccine prevents serious respiratory disease. However, the impact of vaccine will vary by season and by which influenza stains are circulating in the community. The authors concluded that further understanding of the lower VE against H3N2 disease is needed.
2. Does the priming dose of influenza vaccine improve vaccine effectiveness?
Current recommendations call for a two-dose series for influenza vaccine in children aged 6 months through 8 years who have not had prior influenza vaccine. The recommendation is based on evidence demonstrating higher antibody responses in children receiving two doses, compared with a single dose. Using data from the U.S. Influenza Vaccine Effectiveness Network, Jessie R. Chung, MPH, of the CDC, and associates compared VE in children younger than 2 years receiving two doses in the first year of flu immunization (fully immunized), compared with those who received only one dose (partially immunized) (ID Week session 99; Abstract 900). VE was 53% for fully immunized and 23% for partially immunized children. Receipt of a single dose did not provide statistically significant protection against influenza. Surprisingly (to me), of 5,355 children aged 6 months to less than 2 years with no prior influenza vaccine, 1,870 (35%) received only one dose in the season.
The data strongly support the current recommendations for a priming dose, especially in young children, in the first season of influenza vaccine and warrants increased efforts to increase the update of second doses during the season. Hopefully we can do better in 2019!
3. Should we wait to vaccinate with influenza vaccine?
Some evidence suggests that waning immunity to influenza vaccine, primarily in those aged 65 years and older, may explain increased disease activity toward the end of influenza season. Other explanations include increasing viral diversity throughout the season, resulting in reduced effectiveness. Do such concerns warrant delaying immunization? The onset and peak of influenza season varies by year; in October 2019, 3% of tests performed on patients with respiratory illness were influenza positive. The trade-offs for delaying immunization until October are the unpredictability of onset of influenza season, the requirement for two doses in infants, the need for 2 weeks to achieve peak antibody concentrations, and the potential that fewer individuals will be vaccinated. Kathy Neuzil, MD, MPH, from the Center for Vaccine Development and Global Health, University of Maryland School of Medicine, reviewed recent modeling (for adults aged 65 years and older) and reported that delaying vaccine programs until October is associated with greater burden of hospitalization if 14% fewer individuals (who would be vaccinated in August/September) are vaccinated (ID Week; Session 940).
In response to these concerns, the CDC recommendations for 2019 are that, in children aged 6 months through 8 years who need two doses, start early so that you can achieve both doses before influenza season (MMWR 2019 Aug 23;68[3]:1-21).In older children and adults, who need only a single dose, early vaccination (August and early September) may lead to reduced protection late in the influenza season?
4. How can we optimize vaccine impact?
Vaccine impact refers to the affect on a population level and not at an individual level. Meagan C. Fitzpatrick, PhD, from the Center for Vaccine Development and Global Health, University of Maryland School of Medicine, evaluated the benefits of our moderately effective influenza vaccines (VE 40%-60%) to the population beyond those who are vaccinated. Her conclusions were that even a modestly effective vaccine prevents 21 million cases of influenza, 129,000 hospitalizations, and 62,000 deaths. And that two-thirds of the deaths prevented are from herd benefit (or indirect effects). Although both coverage and vaccine effectiveness are important, she reported that population impact was most sensitive to coverage, compared with vaccine effectiveness. Dr. Fitzpatrick found that targeting school-age children 6-19 years of age and adults 30-39 years of age maximizes the public health benefits (herd effects) of influenza vaccine. In 2018 season, influenza coverage was 63% for at least one dose in children aged 6 months through 17 years and 45% in adults aged 18 years and older; in the two target age groups 5-17 and 30-39 years, coverage was 59% and approximately 35%, respectively (ID Week; Session 939).
Clearly, even our modestly effective influenza vaccines have significant public health benefit in protecting the U.S. populations from serious disease and death. Efforts to increase vaccine uptake in school-age children, both those with and without comorbidity, and the 30- to 39-year-old adult cohort would likely further reduce the burden of serious disease from influenza.
In summary, despite a vaccine that is only moderately effective, there is clear evidence to support current recommendations of universal immunization beginning at 6 months of age. Delaying until October 1 is a good idea only if the same number of individuals will receive influenza vaccine, otherwise the hypothetical benefit is lost.
Dr. Pelton is professor of pediatrics and epidemiology at Boston University schools of medicine and public health and is senior attending physician, Boston Medical Center. Dr. Pelton has investigator-initiated research awards to Boston Medical Center from Pfizer and Merck Vaccines. He also received honorarium as an advisory board member, participation in symposium and consultation from Seqirus and Merck Vaccine, Pfizer, and Sanofi Pasteur. Email him at [email protected].
Research on pediatric firearms deaths is underfunded
new research has found.

For the period 2008-2017, an average of $88 million per year was granted to study motor vehicle crashes, the leading cause of death in this age group. Cancer, the third leading cause of mortality, received on average $335 million per year. However, research into mortality from firearms, the second leading cause of death in this age group, received $12 million total during the entire research period across a total of 32 research grants.
This translates to $26,136 in research funding per death for the 33,577 deaths of children and adolescents in motor vehicle crashes from 2008-2017, $195,508 per death from cancer (17,111 deaths recorded), and just $597 per death from firearm injury (20,719 deaths recorded).
Pediatric firearm injury prevention “is substantially underfunded in relation to the magnitude of the public health problem,” Rebecca Cunningham, MD, from the University of Michigan, Ann Arbor, and colleagues wrote in the October 2019 issue of Health Affairs.
“According to our analysis, federal funding for this leading cause of pediatric mortality is 3.3 percent of what would be needed for it to be commensurate with the funding for other common causes of pediatric death,” the authors continued.
Dr. Cunningham and colleagues said that the “lack of an evidence base for firearm safety prevention has likely contributed to the lack of progress on, and recent increase in, firearm deaths among children and adolescents since 2013.”
They did note that there was an increase in federal research funding following the shooting in Newtown, Conn., with an increase from $136,224 in 2012 to $4.5 million in 2017, but it clearly is not enough.
“Our analysis, using other major diseases and the country’s history of federal funding as a guide, demonstrates that approximately $37 million per year over the next decade is needed to realize a reduction in pediatric firearm mortality that is comparable to that observed for other pediatric causes of death,” the authors state.
The group also suggests the development of a group similar to the National Highway Traffic Safety Administration that is focused specifically on firearm safety that could “begin to address the large gaps in foundational epidemiological and multidisciplinary behavioral research that the nation needs. It could have a transformational impact on the reduction of firearm injuries among children and adolescents parallel to what has been seen for other major causes of pediatric death in the U.S.”
SOURCE: Cunningham R et al. Health Affairs. 2019. doi: 10.1377/hlthaff.2019.00476.
new research has found.
For the period 2008-2017, an average of $88 million per year was granted to study motor vehicle crashes, the leading cause of death in this age group. Cancer, the third leading cause of mortality, received on average $335 million per year. However, research into mortality from firearms, the second leading cause of death in this age group, received $12 million total during the entire research period across a total of 32 research grants.
This translates to $26,136 in research funding per death for the 33,577 deaths of children and adolescents in motor vehicle crashes from 2008-2017, $195,508 per death from cancer (17,111 deaths recorded), and just $597 per death from firearm injury (20,719 deaths recorded).
Pediatric firearm injury prevention “is substantially underfunded in relation to the magnitude of the public health problem,” Rebecca Cunningham, MD, from the University of Michigan, Ann Arbor, and colleagues wrote in the October 2019 issue of Health Affairs.
“According to our analysis, federal funding for this leading cause of pediatric mortality is 3.3 percent of what would be needed for it to be commensurate with the funding for other common causes of pediatric death,” the authors continued.
Dr. Cunningham and colleagues said that the “lack of an evidence base for firearm safety prevention has likely contributed to the lack of progress on, and recent increase in, firearm deaths among children and adolescents since 2013.”
They did note that there was an increase in federal research funding following the shooting in Newtown, Conn., with an increase from $136,224 in 2012 to $4.5 million in 2017, but it clearly is not enough.
“Our analysis, using other major diseases and the country’s history of federal funding as a guide, demonstrates that approximately $37 million per year over the next decade is needed to realize a reduction in pediatric firearm mortality that is comparable to that observed for other pediatric causes of death,” the authors state.
The group also suggests the development of a group similar to the National Highway Traffic Safety Administration that is focused specifically on firearm safety that could “begin to address the large gaps in foundational epidemiological and multidisciplinary behavioral research that the nation needs. It could have a transformational impact on the reduction of firearm injuries among children and adolescents parallel to what has been seen for other major causes of pediatric death in the U.S.”
SOURCE: Cunningham R et al. Health Affairs. 2019. doi: 10.1377/hlthaff.2019.00476.
FROM HEALTH AFFAIRS
Poor neonatal outcomes tied to excessive, insufficient weight gain during twin pregnancies
Lisa M. Bodnar, PhD, and colleagues determined.

The risks of cesarean section and neonatal death were elevated for those mothers who were overweight before pregnancy and then gained too much. But infants of underweight women who didn’t gain enough faced risks as well, wrote Dr. Bodnar of the University of Pittsburgh and associates in Obstetrics & Gynecology.
Among the most severely overweight women (obesity grade 2 or 3) who gained the most weight (43 kg) at 37 weeks’ gestation, there were 6 fewer small-for-gestational-age (SGA) infants per 100 births, but 14 more large-for-gestational-age (LGA) infants, 4 more cesarean deliveries, and 2 more neonatal deaths per 100 births. By contrast, among the most severely underweight women who gained the least amount of weight (9 kg), there were 18 more SGA infants, 3 fewer LGA infants, and 11 fewer cesareans, but 6 more preterm births before 32 weeks’ gestation.
The same U-shaped pattern also occurred within the individual weight categories. For example, compared with the outcomes among the most underweight women who gained least, among underweight women who gained the most (37 kg), there were eight fewer SGA infants, but four more LGA infants, 16 excess preterm births, and 9 excess infant deaths.
“If the associations we observed are even partially reflective of causality, targeted modification of pregnancy weight gain in women carrying twins might improve pregnancy outcomes,” wrote Dr. Bodnar and her team. “Data on a wide range of short- and long-term outcomes and information on the relative seriousness of these outcomes are needed to determine optimal gestational weight gain ranges for twin pregnancies.”
The cohort comprised 54,836 live-born twins from 27,723 twin pregnancies who were included in the MOMs database maintained by the University of Pennsylvania, Philadelphia. The population-based study tracks maternal obesity, gestational weight gain, and adverse birth outcomes. The information came from infant birth and death vital statistics records from 2003 to 2013.
However, this very source puts the findings in some degree of uncertainty, Ozhan Turan, MD, said in an interview.

“It’s a very nice study, and the statistics are very well done,” said Dr. Turan, who is the director of fetal therapy and complex obstetric surgery at the University of Maryland School of Medicine. “But that kind of data has pitfalls that are unavoidable. For example, they don’t have access to maternal medical comorbidities which are mostly related to the outcome, particularly gestational diabetes and preeclampsia. They also don’t have the information on chorionicity – and we know that monochorionic twins face much greater risk for these outcomes than dichorionic twins.”
The investigators calculated total gestational weight gain by subtracting prepregnancy weight from maternal weight at delivery. The analysis controlled for race and ethnicity, education, neonatal care, level of birth facility, parity, payment at delivery, smoking during pregnancy, marital status, year of birth, height, maternal age, preexisting diabetes or hypertension, infertility treatment, neonatal sex, and racial composition of neighborhood, as a proxy of neighborhood-level socioeconomic status. Approximately 16% of mothers received infertility treatment.
Of the cohort, 3% were underweight, 48% were normal weight, 24% were overweight, 13% were grade 1 obese, 7% grade 2 obese, and 5% grade 3 obese.
“Pregnancy weight gain was negatively associated with SGA and positively associated with LGA and cesarean delivery in all [body mass index] groups. For example, among normal-weight women, compared with a pregnancy weight gain equivalent to 20 kg at 37 weeks’ of gestation, a weight gain of 27 kg at 37 weeks’ of gestation was associated with 2.2 fewer cases of SGA but 2.9 more cases of LGA and 3.7 more cases of cesarean delivery,” Dr. Bodnar and associates wrote.
The investigators found that “weight gains well above or well below the [Institute of Medicine] provisional guidelines (less than 14 kg or more than 27 kg in underweight or normal-weight women, less than 11 kg or more than 28 kg in overweight women, and less than 6.4 kg or more than 26 kg in women with obesity) were associated with the highest risk of adverse outcomes.”
“I would not say this is practice-changing information,” said Dr. Turan. “We already know all this. What would be very helpful is an algorithm to tell us, if a patient is pregnant with twins, this is the amount of weight you have to gain.”
For overweight patients, Dr. Turan tries to impart the key message of moderate or slight weight gain, according to prepregnancy body mass index. For underweight patients, the picture is a bit more complex.
“There are not that many who are underweight before pregnancy, so first thing I look for is the reason a woman is underweight. Is she just not eating properly? Is there a drug dependence issue, alcohol dependence, HIV? Is there smoking? A gut problem that causes malnutrition. You can’t just say ‘eat more.’ That does not solve the problem. We need to find out why she is underweight and fix that first,” said Dr. Turan.
Neither Dr. Bodnar nor Dr. Turan had any relevant financial disclosures. One coauthor disclosed her institution received funds from the University of Pittsburgh. The study was funded by National Institutes of Health grants.
SOURCE: Bodnar LM et al. Obstet Gynecol. 2019;134:1075-86.
Lisa M. Bodnar, PhD, and colleagues determined.
The risks of cesarean section and neonatal death were elevated for those mothers who were overweight before pregnancy and then gained too much. But infants of underweight women who didn’t gain enough faced risks as well, wrote Dr. Bodnar of the University of Pittsburgh and associates in Obstetrics & Gynecology.
Among the most severely overweight women (obesity grade 2 or 3) who gained the most weight (43 kg) at 37 weeks’ gestation, there were 6 fewer small-for-gestational-age (SGA) infants per 100 births, but 14 more large-for-gestational-age (LGA) infants, 4 more cesarean deliveries, and 2 more neonatal deaths per 100 births. By contrast, among the most severely underweight women who gained the least amount of weight (9 kg), there were 18 more SGA infants, 3 fewer LGA infants, and 11 fewer cesareans, but 6 more preterm births before 32 weeks’ gestation.
The same U-shaped pattern also occurred within the individual weight categories. For example, compared with the outcomes among the most underweight women who gained least, among underweight women who gained the most (37 kg), there were eight fewer SGA infants, but four more LGA infants, 16 excess preterm births, and 9 excess infant deaths.
“If the associations we observed are even partially reflective of causality, targeted modification of pregnancy weight gain in women carrying twins might improve pregnancy outcomes,” wrote Dr. Bodnar and her team. “Data on a wide range of short- and long-term outcomes and information on the relative seriousness of these outcomes are needed to determine optimal gestational weight gain ranges for twin pregnancies.”
The cohort comprised 54,836 live-born twins from 27,723 twin pregnancies who were included in the MOMs database maintained by the University of Pennsylvania, Philadelphia. The population-based study tracks maternal obesity, gestational weight gain, and adverse birth outcomes. The information came from infant birth and death vital statistics records from 2003 to 2013.
However, this very source puts the findings in some degree of uncertainty, Ozhan Turan, MD, said in an interview.
“It’s a very nice study, and the statistics are very well done,” said Dr. Turan, who is the director of fetal therapy and complex obstetric surgery at the University of Maryland School of Medicine. “But that kind of data has pitfalls that are unavoidable. For example, they don’t have access to maternal medical comorbidities which are mostly related to the outcome, particularly gestational diabetes and preeclampsia. They also don’t have the information on chorionicity – and we know that monochorionic twins face much greater risk for these outcomes than dichorionic twins.”
The investigators calculated total gestational weight gain by subtracting prepregnancy weight from maternal weight at delivery. The analysis controlled for race and ethnicity, education, neonatal care, level of birth facility, parity, payment at delivery, smoking during pregnancy, marital status, year of birth, height, maternal age, preexisting diabetes or hypertension, infertility treatment, neonatal sex, and racial composition of neighborhood, as a proxy of neighborhood-level socioeconomic status. Approximately 16% of mothers received infertility treatment.
Of the cohort, 3% were underweight, 48% were normal weight, 24% were overweight, 13% were grade 1 obese, 7% grade 2 obese, and 5% grade 3 obese.
“Pregnancy weight gain was negatively associated with SGA and positively associated with LGA and cesarean delivery in all [body mass index] groups. For example, among normal-weight women, compared with a pregnancy weight gain equivalent to 20 kg at 37 weeks’ of gestation, a weight gain of 27 kg at 37 weeks’ of gestation was associated with 2.2 fewer cases of SGA but 2.9 more cases of LGA and 3.7 more cases of cesarean delivery,” Dr. Bodnar and associates wrote.
The investigators found that “weight gains well above or well below the [Institute of Medicine] provisional guidelines (less than 14 kg or more than 27 kg in underweight or normal-weight women, less than 11 kg or more than 28 kg in overweight women, and less than 6.4 kg or more than 26 kg in women with obesity) were associated with the highest risk of adverse outcomes.”
“I would not say this is practice-changing information,” said Dr. Turan. “We already know all this. What would be very helpful is an algorithm to tell us, if a patient is pregnant with twins, this is the amount of weight you have to gain.”
For overweight patients, Dr. Turan tries to impart the key message of moderate or slight weight gain, according to prepregnancy body mass index. For underweight patients, the picture is a bit more complex.
“There are not that many who are underweight before pregnancy, so first thing I look for is the reason a woman is underweight. Is she just not eating properly? Is there a drug dependence issue, alcohol dependence, HIV? Is there smoking? A gut problem that causes malnutrition. You can’t just say ‘eat more.’ That does not solve the problem. We need to find out why she is underweight and fix that first,” said Dr. Turan.
Neither Dr. Bodnar nor Dr. Turan had any relevant financial disclosures. One coauthor disclosed her institution received funds from the University of Pittsburgh. The study was funded by National Institutes of Health grants.
SOURCE: Bodnar LM et al. Obstet Gynecol. 2019;134:1075-86.
FROM OBSTETRICS & GYNECOLOGY
Suicidality risk high in transgender youth, varies by gender identity subtype
, new research suggests.
The study, which included more than 2,000 adolescents and was published in the October 14 issue of Pediatrics, provides new insights into suicide risk in gender identity subgroups, according to the investigators.
“Limited measures of gender identity may have led to inaccurate estimates of suicidality among transgender females in previous studies,” wrote Brian C. Thoma, PhD, and his colleagues at the University of Pittsburgh. The researchers noted that transgender females and nonbinary adolescents assigned male at birth are frequently combined in studies.
“However, our results indicate transgender females have higher risk for suicidal ideation and attempt compared with cisgender adolescents, whereas nonbinary adolescents assigned male at birth do not,” they wrote. “It is possible that estimates of suicidality that aggregate all transgender adolescents assigned male at birth into one group underestimate rates of suicidality among transgender females.”
The study, which analyzed results from a cross-sectional online survey from July to October 2018, was comprised of 2,020 adolescents, including 1,134 transgender adolescents.
The researchers divided respondents into seven categories: Cisgender males, cisgender females, transgender males, transgender females, nonbinary adolescents assigned female at birth, nonbinary adolescents assigned male at birth, and questioning gender identity. They then assessed non-suicidal self-injury (NSSI) and lifetime suicidality.
Compared to cisgender youth, transgender adolescents overall were more likely to report all outcomes: passive death wish (odds ratio [OR]=2.60), suicidal ideation (OR=2.20), suicide plan (OR=1.82), suicide attempt (OR=1.65), attempt requiring medical care (OR=2.01), and NSSI (OR=2.88).
Using cisgender males as reference after adjustment for all demographics, “cisgender females, transgender males, and nonbinary adolescents assigned female at birth had higher odds of each suicidality outcome” (OR= 1.49-5.85; OR=2.72-12.12; OR=1.84-8.59, respectively), the authors reported. “Transgender females had higher odds of each outcome [OR=2.73-6.30] except for suicide attempt requiring medical care. Nonbinary adolescents assigned male at birth had higher odds of suicide attempt requiring medical care [OR=10.13] and NSSI [OR=3.79]. Adolescents questioning their gender identity had higher odds of all outcomes [OR=3.23-7.59] except for suicide attempt.”
When compared to cisgender females as reference, however, only transgender males and transgender females had higher odds of suicidal ideation and attempts.
The overall findings were unsurprising since the higher rates of suicidality among transgender youth have already been documented, but the classification of participants was interesting, Gerald Montano, DO, an assistant professor of pediatrics at the University of Pittsburgh School of Medicine, said in an interview. Dr Montano was not involved in the study.
“It’s always been a challenge because, in the past, they always lumped transgender youth along with lesbian, gay, and bisexual youth,” Dr Montano said. This study is one of the few to go into more detail in considering participants’ gender identity, which was wise given that suicidal risk may differ accordingly.
The biggest take-home message of this study is the importance of screening for suicidality after informing adolescent patients of the limits of confidentiality, Dr Montano said.
“I think it’s very important for the physician to be aware of the reasons for those thoughts of suicide,” he continued. “A lot of it has to do with their gender identity and from discrimination and stigma from the general population.”
The research was funded by the University of Pittsburgh Central Research Development Fund and the National Institutes of Health. The authors reported no conflicts of interest.
SOURCE: Thoma BC et al, Pediatrics, October 14, 2019. DOI: 10.1542/peds.2019-1183
FROM PEDIATRICS
Key clinical point: Transgender adolescents should be screened for suicidality.
Major finding: Transgender youth as well as nonbinary adolescents assigned female at birth are at markedly high risk for suicidal ideation and attempt.
Study details: The findings are based on a cross-sectional survey of 2,020 U.S. adolescents, including 1,134 transgender or gender-diverse adolescents.
Disclosures: The research was funded by the University of Pittsburgh Central Research Development Fund and the National Institutes of Health. The authors reported no conflicts of interest.
Source: Thoma BC et al. Pediatrics. October 14, 2019. DOI: 10.1542/peds.2019-1183
Suicide attempts up in black U.S. teens
New research presents a complex picture of self-reported suicidal behavior in U.S. teenagers over the last few decades. Rates of suicidal ideation and plans dipped overall from 1991 to 2017, but the rate of suicide attempts grew slightly in black adolescents.
White young people “have historically had higher rates of suicide attempts...compared with their black counterparts; however, this study provides some evidence to the contrary,” wrote the authors of the report, which appears in the November issue of Pediatrics.
The investigators, led by Michael A. Lindsey, PhD, executive director of the McSilver Institute for Poverty Policy and Research at New York University, New York, note that suicide is the second leading cause of death in the United States in those aged 12-17. (Accidents rank first.) According to recent research, black children younger than 12 are at higher risk for death by suicide, compared with whites.
For the new study, researchers analyzed data from the Youth Risk Behavior Survey, which is conducted every 2 years among high school students in all 50 states and the District of Columbia. They examined data from 198,540 teens (mean age=16, 51% male; 49% female).
During the study period, the weighted overall prevalences rates of suicidal ideation, planning, attempt, and injury due to attempt were 19%, 15%, 8%, and 3%, respectively. “Our findings reveal that over that span of time, almost 1 in 5 adolescents are thinking about suicide... and > 1 in 10 has a suicide plan,” the researchers wrote.
Rates of suicidal ideation and planning fell overall, and among females, the rate of suicide attempts fell significantly (odds ratio [OR]=0.98). But self-reported suicide attempts grew significantly among black teens (OR=1.02), and injuries due to suicide attempts grew among black males (OR=1.04).
The findings are “troubling because attempts are the most prominent risk factor associated with suicide death,” the study authors wrote. “Findings regarding the rising rates of suicide attempts in black youth may be related to the documented disparities in mental health treatment and common social etiologic factors disproportionately experienced by black youth.”
In an accompanying commentary, psychiatrist Benjamin N. Shain, MD, PhD, of the University of Chicago, noted a seemingly “counterintuitive” fact: Black teens still have lower rates of suicide than whites teens “despite the greater, long-standing difficulties encountered by black adolescents, including disparities in mental health treatment and disproportionately higher stressors, racial discrimination, and childhood abuse and neglect, as well as other adverse experiences, such as poverty.”
It’s not clear why the reported suicide rate is lower in black adolescents than their white counterparts, Dr. Shain wrote, but misclassification and “undercount as a result of violence with suicidal intent, for example, ‘suicide by cop’” may play a role. Additionally, protective factors may have kept suicide rates down. “External attributional orientation (eg, blaming others or ‘the system’ for difficulties) among blacks may have buffered this group from internalizing blame related to psychological stressors,” he wrote.
Among black adolescents, the growing rate of suicidal behavior is concerning and may be due to a weakening of the hypothesized protective mechanism. Perhaps, Dr. Shain wrote, they now are blaming themselves more for difficulties encountered, “thus leading to an increase in suicide risk factors, particularly depression.” He stressed that, regardless of the reasons for the increase in suicide and suicide attempts, prevention and intervention efforts remain critical.
No study funding is reported, and authors report no relevant disclosures. Dr. Shain reports no relevant disclosures.
SOURCE: Lindsey MA et al, Pediatrics. 2019;144(5): e20191187, DOI:10.1542/peds.2019-1187.
FROM PEDIATRICS
Key clinical point: Overall self-reported suicidal behavior is down in U.S. teens, but attempts are up in black adolescents.
Major finding: Self-reported suicide attempts grew significantly among black teens (OR=1.02).
Study details: Retrospective analysis of 1991-2017 surveys of 198,540 U.S. teens (mean age=16, 51% male; 49% female).
Disclosures: No study funding is reported, and the study authors report no relevant disclosures.
Source: Lindsey MA et al, Pediatrics. 2019;144(5): e20191187,https://doi.org/10.1542/peds.2019-1187.
Higher teen pregnancy risk in girls with ADHD
Teenage girls with ADHD may be at greater risk of pregnancy than their unaffected peers, which suggests they may benefit from targeted interventions to prevent teen pregnancy.

A Swedish nationwide cohort study published in JAMA Network Open examined data from 384,103 nulliparous women and girls who gave birth between 2007-2014, of whom, 6,410 (1.7%) had received treatment for ADHD.
While the overall rate of teenage births was 3%, the rate among women and girls with ADHD was 15.3%, which represents a greater than sixfold higher odds of giving birth below the age of 20 years (odds ratio, 6.23; 95% confidence interval, 5.80-6.68).
“Becoming a mother at such early age is associated with long-term adverse outcomes for both women and their children,” wrote Charlotte Skoglund, PhD, of the department of clinical neuroscience at the Karolinska Institute in Stockholm and coauthors. “Consequently, our findings argue for an improvement in the standard of care for women and girls with ADHD, including active efforts to prevent teenage pregnancies and address comorbid medical and psychiatric conditions.”
The study also found women and girls with ADHD were significantly more likely to be underweight (OR, 1.29; 95% CI, 1.12-1.49) or have a body mass index greater than 40 kg/m2 (OR, 2.01; 95% CI, 1.60-2.52) when compared with those without ADHD.
They were also six times more likely to smoke, were nearly seven times more likely to continue smoking into their third trimester of pregnancy, and had a 20-fold higher odds of alcohol and substance use disorder. Among individuals who had been diagnosed with ADHD, 7.6% continued to use stimulant and nonstimulant ADHD medication during pregnancy, and 16.4% used antidepressants during pregnancy.
Psychiatric comorbidities were also significantly more common among individuals with ADHD in the year preceding pregnancy, compared with those without ADHD. The authors saw a 17-fold higher odds of receiving a diagnosis of bipolar disorder, nearly 8-fold higher odds of a diagnosis of schizophrenia or other psychotic disorder, and 22-fold higher odds of being diagnosed with emotionally unstable personality disorder among women and girls with ADHD versus those without.
The authors commented that antenatal care should focus on trying to reduce such obstetric risk factors in these women, but also pointed out that ADHD in women and girls was still underdiagnosed and undertreated.
Commenting on the association between ADHD and teenage pregnancy, the authors noted that women and girls with ADHD may be less likely to receive adequate contraceptive counseling and less likely to access, respond to, and act on counseling. They may also experience more adverse effects from hormonal contraceptives.
While Swedish youth clinics enable easier and low-cost access to counseling and contraception, the authors called for greater collaboration between psychiatric care clinics and specialized youth clinics to provide adequate care for women and girls with ADHD.
Three authors declared advisory board positions, grants, personal fees, and speakers’ fees from the pharmaceutical sector. No other conflicts of interest were declared.
SOURCE: Skoglund C et al. JAMA Netw Open. 2019 Oct 2. doi: 10.1001/jamanetworkopen.2019.12463
Teenage girls with ADHD may be at greater risk of pregnancy than their unaffected peers, which suggests they may benefit from targeted interventions to prevent teen pregnancy.
A Swedish nationwide cohort study published in JAMA Network Open examined data from 384,103 nulliparous women and girls who gave birth between 2007-2014, of whom, 6,410 (1.7%) had received treatment for ADHD.
While the overall rate of teenage births was 3%, the rate among women and girls with ADHD was 15.3%, which represents a greater than sixfold higher odds of giving birth below the age of 20 years (odds ratio, 6.23; 95% confidence interval, 5.80-6.68).
“Becoming a mother at such early age is associated with long-term adverse outcomes for both women and their children,” wrote Charlotte Skoglund, PhD, of the department of clinical neuroscience at the Karolinska Institute in Stockholm and coauthors. “Consequently, our findings argue for an improvement in the standard of care for women and girls with ADHD, including active efforts to prevent teenage pregnancies and address comorbid medical and psychiatric conditions.”
The study also found women and girls with ADHD were significantly more likely to be underweight (OR, 1.29; 95% CI, 1.12-1.49) or have a body mass index greater than 40 kg/m2 (OR, 2.01; 95% CI, 1.60-2.52) when compared with those without ADHD.
They were also six times more likely to smoke, were nearly seven times more likely to continue smoking into their third trimester of pregnancy, and had a 20-fold higher odds of alcohol and substance use disorder. Among individuals who had been diagnosed with ADHD, 7.6% continued to use stimulant and nonstimulant ADHD medication during pregnancy, and 16.4% used antidepressants during pregnancy.
Psychiatric comorbidities were also significantly more common among individuals with ADHD in the year preceding pregnancy, compared with those without ADHD. The authors saw a 17-fold higher odds of receiving a diagnosis of bipolar disorder, nearly 8-fold higher odds of a diagnosis of schizophrenia or other psychotic disorder, and 22-fold higher odds of being diagnosed with emotionally unstable personality disorder among women and girls with ADHD versus those without.
The authors commented that antenatal care should focus on trying to reduce such obstetric risk factors in these women, but also pointed out that ADHD in women and girls was still underdiagnosed and undertreated.
Commenting on the association between ADHD and teenage pregnancy, the authors noted that women and girls with ADHD may be less likely to receive adequate contraceptive counseling and less likely to access, respond to, and act on counseling. They may also experience more adverse effects from hormonal contraceptives.
While Swedish youth clinics enable easier and low-cost access to counseling and contraception, the authors called for greater collaboration between psychiatric care clinics and specialized youth clinics to provide adequate care for women and girls with ADHD.
Three authors declared advisory board positions, grants, personal fees, and speakers’ fees from the pharmaceutical sector. No other conflicts of interest were declared.
SOURCE: Skoglund C et al. JAMA Netw Open. 2019 Oct 2. doi: 10.1001/jamanetworkopen.2019.12463
FROM JAMA NETWORK OPEN

Does this patient have bacterial conjunctivitis?
A 54-year-old pharmacist with a history of gout, hypertension, and conjunctivitis presents for evaluation of pink eye in the summer. The morning before coming into the office, he noticed that his right eye was red and inflamed. He self-treated with saline washes and eye drops, but upon awakening the next day, he found his right eye to be crusted shut with surrounding yellow discharge. He has not had any changes to his vision but endorses a somewhat uncomfortable, “gritty” sensation. He reports no recent cough, nasal congestion, or allergies, and he has not been around any sick contacts. His blood pressure is 102/58 mm Hg, pulse is 76 bpm, and body mass index is 27.3 kg/m2. His eye exam reveals unilateral conjunctival injections but no hyperemia of the conjunctiva adjacent to the cornea. Mucopurulent discharge was neither found on the undersurface of the eyelid nor emerging from the eye. Which of the following is the best treatment for this patient’s condition?
A) Erythromycin 5 mg/gram ophthalmic ointment.
B) Ofloxacin 0.3% ophthalmic drops.
C) Antihistamine drops.
D) Eye lubricant drops.
E) No treatment necessary.
This patient is an adult presenting with presumed conjunctivitis. Because he is presenting in the summer without observed purulent discharge, his condition is unlikely to be bacterial. This patient does not need treatment, although eye lubricant drops could reduce his discomfort.
After ruling out serious eye disease, clinicians need to determine which cases of suspected conjunctivitis are most likely to be bacterial to allow for judicious use of antibiotic eye drops. This is an important undertaking as most patients assume that antibiotics are needed.

How do we know which history and clinical exam findings to lean on when attempting to categorize conjunctivitis as bacterial or not? If a patient reports purulent discharge, doesn’t that mean it is bacterial? Surprisingly, a systematic review published in 2016 by Narayana and McGee found that a patient’s self-report of “purulent drainage” is diagnostically unhelpful, but if a clinician finds it on exam, the likelihood of a bacterial etiology increases.3
Narayana and McGee analyzed three studies that enrolled a total of 281 patients with presumed conjunctivitis who underwent bacterial cultures. They then determined which findings increased the probability of positive bacterial culture. From strongest to weakest, the best indicators of a bacterial cause were found to be: complete redness of the conjunctival membrane obscuring tarsal vessels (the vessels visible on the inside of everted upper or lower eyelids) (likelihood ratio, 4.6), observed purulent discharge (LR, 3.9), matting of both eyes in the morning (LR, 3.6), and presence during winter/spring months (LR, 1.9). On the other hand, failure to observe a red eye at 20 feet (LR, 0.2), absence of morning gluing of either eye (LR, 0.3), and presentation during summer months (LR, 0.4) all decreased the probability of a bacterial cause. This review and different study by Stenson et al. unfortunately have conflicting evidence regarding whether the following findings are diagnostically helpful: qualities of eye discomfort (such as burning or itching), preauricular adenopathy, conjunctival follicles, and conjunctival papillae.3,4 Rietveld and colleagues found that a history of conjunctivitis decreased the likelihood of bacterial conjunctivitis.5

Ultimately, if the former indicators are kept in mind, primary care clinicians should be able to decrease the prescribing of topical antimicrobials to patients with non-bacterial conjunctivitis.
Pearl: The best indicators of a bacterial cause in patients with presumed conjunctivitis are complete redness of the conjunctival membrane obscuring tarsal vessels, observed purulent discharge, and matting of both eyes in the morning. Presentation during the summer months and having a history of conjunctivitis decreases the likelihood of bacterial conjunctivitis.
Ms. Momany is a fourth-year medical student at University of Washington, Seattle. Dr. Paauw is professor of medicine in the division of general internal medicine at the University of Washington and serves as third-year medical student clerkship director at that university. Contact Dr. Paauw at [email protected].
References
1. Azari AA and Barney NP. JAMA. 2013 Oct 23; 310(16):1721-9.
2. Smith AF and Waycaster C. BMC Ophthalmol. 2009 Nov 25. doi: 10.1186/1471-2415-9-13.
3) Narayana S and McGee S. Am J Med. 2015;128(11):1220-4.e1.
4) Stenson S et al. Arch Ophthalmol. 1982;100(8):1275-7.
5) Rietveld RP et al. BMJ. 2004 Jul 24;329(7459):206-10.
A 54-year-old pharmacist with a history of gout, hypertension, and conjunctivitis presents for evaluation of pink eye in the summer. The morning before coming into the office, he noticed that his right eye was red and inflamed. He self-treated with saline washes and eye drops, but upon awakening the next day, he found his right eye to be crusted shut with surrounding yellow discharge. He has not had any changes to his vision but endorses a somewhat uncomfortable, “gritty” sensation. He reports no recent cough, nasal congestion, or allergies, and he has not been around any sick contacts. His blood pressure is 102/58 mm Hg, pulse is 76 bpm, and body mass index is 27.3 kg/m2. His eye exam reveals unilateral conjunctival injections but no hyperemia of the conjunctiva adjacent to the cornea. Mucopurulent discharge was neither found on the undersurface of the eyelid nor emerging from the eye. Which of the following is the best treatment for this patient’s condition?
A) Erythromycin 5 mg/gram ophthalmic ointment.
B) Ofloxacin 0.3% ophthalmic drops.
C) Antihistamine drops.
D) Eye lubricant drops.
E) No treatment necessary.
This patient is an adult presenting with presumed conjunctivitis. Because he is presenting in the summer without observed purulent discharge, his condition is unlikely to be bacterial. This patient does not need treatment, although eye lubricant drops could reduce his discomfort.
After ruling out serious eye disease, clinicians need to determine which cases of suspected conjunctivitis are most likely to be bacterial to allow for judicious use of antibiotic eye drops. This is an important undertaking as most patients assume that antibiotics are needed.
How do we know which history and clinical exam findings to lean on when attempting to categorize conjunctivitis as bacterial or not? If a patient reports purulent discharge, doesn’t that mean it is bacterial? Surprisingly, a systematic review published in 2016 by Narayana and McGee found that a patient’s self-report of “purulent drainage” is diagnostically unhelpful, but if a clinician finds it on exam, the likelihood of a bacterial etiology increases.3
Narayana and McGee analyzed three studies that enrolled a total of 281 patients with presumed conjunctivitis who underwent bacterial cultures. They then determined which findings increased the probability of positive bacterial culture. From strongest to weakest, the best indicators of a bacterial cause were found to be: complete redness of the conjunctival membrane obscuring tarsal vessels (the vessels visible on the inside of everted upper or lower eyelids) (likelihood ratio, 4.6), observed purulent discharge (LR, 3.9), matting of both eyes in the morning (LR, 3.6), and presence during winter/spring months (LR, 1.9). On the other hand, failure to observe a red eye at 20 feet (LR, 0.2), absence of morning gluing of either eye (LR, 0.3), and presentation during summer months (LR, 0.4) all decreased the probability of a bacterial cause. This review and different study by Stenson et al. unfortunately have conflicting evidence regarding whether the following findings are diagnostically helpful: qualities of eye discomfort (such as burning or itching), preauricular adenopathy, conjunctival follicles, and conjunctival papillae.3,4 Rietveld and colleagues found that a history of conjunctivitis decreased the likelihood of bacterial conjunctivitis.5
Ultimately, if the former indicators are kept in mind, primary care clinicians should be able to decrease the prescribing of topical antimicrobials to patients with non-bacterial conjunctivitis.
Pearl: The best indicators of a bacterial cause in patients with presumed conjunctivitis are complete redness of the conjunctival membrane obscuring tarsal vessels, observed purulent discharge, and matting of both eyes in the morning. Presentation during the summer months and having a history of conjunctivitis decreases the likelihood of bacterial conjunctivitis.
Ms. Momany is a fourth-year medical student at University of Washington, Seattle. Dr. Paauw is professor of medicine in the division of general internal medicine at the University of Washington and serves as third-year medical student clerkship director at that university. Contact Dr. Paauw at [email protected].
References
1. Azari AA and Barney NP. JAMA. 2013 Oct 23; 310(16):1721-9.
2. Smith AF and Waycaster C. BMC Ophthalmol. 2009 Nov 25. doi: 10.1186/1471-2415-9-13.
3) Narayana S and McGee S. Am J Med. 2015;128(11):1220-4.e1.
4) Stenson S et al. Arch Ophthalmol. 1982;100(8):1275-7.
5) Rietveld RP et al. BMJ. 2004 Jul 24;329(7459):206-10.