User login
Human papillomavirus in 2019: An update on cervical cancer prevention and screening guidelines
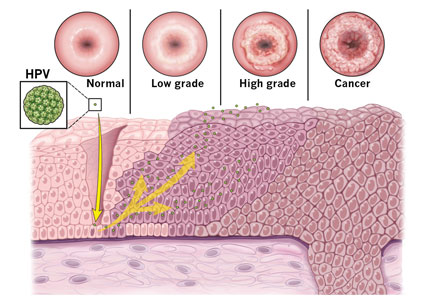
About 12% of women worldwide are infected with human papillomavirus (HPV).1 Persistent HPV infection with high-risk strains such as HPV 6, 11, 16, and 18 cause nearly all cases of cervical cancer and some anal, vaginal, penile, and oropharyngeal cancers.2 An estimated 13,000 cases of invasive cervical cancer will be diagnosed this year in the United States alone.3
Up to 70% of HPV-related cervical cancer cases can be prevented with vaccination. A number of changes have been made to the vaccination schedule within the past few years—patients younger than 15 need only 2 rather than 3 doses, and the vaccine itself can be used in adults up to age 45.
Vaccination and routine cervical cancer screening are both necessary to prevent this disease3 along with effective family and patient counseling. Here, we discuss the most up-to-date HPV vaccination recommendations, current cervical cancer screening guidelines, counseling techniques that increase vaccination acceptance rates, and follow-up protocols for abnormal cervical cancer screening results.
TYPES OF HPV VACCINES
HPV immunization can prevent up to 70% of cases of cervical cancer due to HPV as well as 90% of genital warts.4 The US Food and Drug Administration (FDA) has approved 3 HPV vaccines:
- Gardasil 9 targets HPV types 6, 11, 16, and 18 along with 31, 33, 45, 52, 58—these cause 90% of cervical cancer cases and most cases of genital warts5—making it the most effective vaccine available; Gardasil 9 is the only HPV vaccine currently available in the United States
- The bivalent vaccine (Cervarix) targeted HPV 16 and 18 only, and was discontinued in the United States in 2016
- The quadrivalent HPV vaccine (Gardasil) targeted HPV 16 and 18 as well as 6 and 11, which cause most cases of genital warts; the last available doses in the United States expired in May 2017; it has been replaced by Gardasil 9.
The incidence of cervical cancer in the United States dropped 29% among 15- to 24-year-olds from 2003–2006 when HPV vaccination first started to 2011–2014.6
VACCINE DOSING RECOMMENDATIONS FOR PRIMARY PREVENTION

The Advisory Committee on Immunization Practices (ACIP) revised its HPV vaccine schedule in 2016, when it decreased the necessary doses from 3 to 2 for patients under age 15 and addressed the needs of special patient populations.7 In late 2018, the FDA approved the use of the vaccine in men and women up to age 45. However, no change in guidelines have yet been made (Table 1).
In females, the ACIP recommends starting HPV vaccination at age 11 or 12, but it can be given as early as age 9. A 2-dose schedule is recommended for the 9-valent vaccine before the patient’s 15th birthday (the second dose 6 to 12 months after the first).7 For females who initiate HPV vaccination between ages 15 and 45, a 3-dose schedule is necessary (at 0, 1 to 2, and 6 months).7,8
The change to a 2-dose schedule was prompted by an evaluation of girls ages 9 to 13 randomized to receive either a 2- or 3-dose schedule. Antibody responses with a 2-dose schedule were not inferior to those of young women (ages 16 to 26) who received all 3 doses.9 The geometric mean titer ratios remained noninferior throughout the study period of 36 months.
However, a loss of noninferiority was noted for HPV-18 by 24 months and for HPV-6 by 36 months.9 Thus, further studies are needed to understand the duration of protection with a 2-dose schedule. Nevertheless, decreasing the number of doses makes it a more convenient and cost-effective option for many families.
The recommendations are the same for males except for one notable difference: in males ages 21 to 26, vaccination is not routinely recommended by the ACIP, but rather it is considered a “permissive use” recommendation: ie, the vaccine should be offered and final decisions on administration be made after individualized discussion with the patient.10 Permissive-use status also means the vaccine may not be covered by health insurance. Even though the vaccine is now available to men and women until age 45, many insurance plans do not cover it after age 26.
Children of either sex with a history of sexual abuse should receive their first vaccine dose beginning at age 9.7
Immunocompromised patients should follow the 3-dose schedule regardless of their sex or the age when vaccination was initiated.10
For transgender patients and for men not previously vaccinated who have sex with men, the 3-dose schedule vaccine should be given by the age of 26 (this is a routine recommendation, not a permissive one).8
CHALLENGES OF VACCINATION
Effective patient and family counseling is important. Even though the first HPV vaccine was approved in 2006, only 34.9% of US adolescents were fully vaccinated by 2015. This was in part because providers did not recommend it, were unfamiliar with it, or had concerns about its safety,11,12 and in part because some parents refused it.
The physician must address any myths regarding HPV vaccination and ensure that parents and patients understand that HPV vaccine is safe and effective. Studies have shown that with high-quality recommendations (ie, the care provider strongly endorses the HPV vaccine, encourages same-day vaccination, and discusses cancer prevention), patients are 9 times more likely to start the HPV vaccination schedule and 3 times more likely to follow through with subsequent doses.13
Providing good family and patient education does not necessarily require spending more counseling time. A recent study showed that spending less time discussing the HPV vaccine can lead to better vaccine coverage.14 The study compared parent HPV vaccine counseling techniques and found that simply informing patients and their families that the HPV vaccine was due was associated with a higher vaccine acceptance rate than inviting conversations about it.14 When providers announced that the vaccine was due, assuming the parents were ready to vaccinate, there was a 5.4% increase in HPV vaccination coverage.14
 vaccine")
Conversely, physicians who engaged parents in open-ended discussions about the HPV vaccine did not improve HPV vaccination coverage.14 The authors suggested that providers approach HPV vaccination as if they were counseling patients and families about the need to avoid second-hand smoke or the need to use car seats. If parents or patients resist the presumptive announcement approach, expanded counseling and shared decision-making are appropriate. This includes addressing misconceptions that parents and patients may have about the HPV vaccine. The American Cancer Society lists 8 facts to reference (Table 2).15
SECONDARY PREVENTION: CERVICAL CANCER SCREENING
Since the introduction of the Papanicolaou (Pap) test, US cervical cancer incidence rates have decreased by more than 60%.16 Because almost all cervical cancer is preventable with proper screening, all women ages 21 to 65 should be screened.

Currently, there are 3 options available for cervical cancer screening: the Pap-only test, the Pap-HPV cotest, and the high-risk HPV-only test (Table 3). The latter 2 options detect high-risk HPV genotypes.
Several organizations have screening algorithms that recommend when to use these tests, but the 3 that shape today’s standard of care in cervical cancer screening come from the American College of Obstetricians and Gynecologists (ACOG), the American Society for Colposcopy and Cervical Pathology (ASCCP), and US Preventive Services Task Force (USPSTF).17–19
Pap-only testing is performed every 3 years to screen for cervical neoplasia that might indicate premalignancy.
Pap-HPV cotesting is performed every 5 years in women older than 30 with past normal screening. Until 2018, all 3 organizations recommended cotesting as the preferred screening algorithm for women ages 30 to 65.17–19 Patients with a history of abnormal test results require more frequent testing as recommended by the ASCCP.18
The high-risk HPV-only test utilizes real-time polymerase chain reaction to detect HPV 16, HPV 18, and 12 other HPV genotypes. Only 2 tests are approved by the FDA as stand-alone cervical cancer screening tests—the Roche Cobas HPV test approved in 2014 and the Becton Dickinson Onclarity HPV assay approved in 2018. Other HPV tests that are used in a cotesting strategy should not be used for high-risk HPV-only testing because their performance characteristics may differ.
In 2015, the Addressing the Need for Advanced HPV Diagnostics (ATHENA) study showed that 1 round of high-risk HPV-only screening for women older than 25 was more sensitive than Pap-only or cotesting for stage 3 cervical intraepithelial neoplasia or more severe disease (after 3 years of follow-up).20 Current guidelines from ASCCP18 and ACOG17 state that the high-risk HPV test can be repeated every 3 years (when used to screen by itself) if the woman is older than 25 and has had a normal test result.
 genotypes")
If the HPV test result is positive for high-risk HPV 16 or 18 genotypes, then immediate colposcopy is indicated; women who test positive for one of the other 12 high-risk subtypes will need to undergo a Pap test to determine the appropriate follow-up (Figure 1).18,21
In 2018, the USPSTF updated its recommendations, noting that for women age 30 to 65, Pap-only testing every 3 years, cotesting every 5 years, or high-risk HPV-only testing every 5 years are all appropriate screening strategies, with the Pap-only or high-risk HPV-only screenings being preferred.19 This is in contrast to ACOG and ASCCP recommendations for cotesting every 5 years, with alternative options of Pap-only or HPV-only testing being done every 3 years.17,18
Is there a best screening protocol?
The USPSTF reviewed large randomized and observational studies to summarize the effectiveness of the 3 screening strategies and commissioned a decision analysis model to compare the risks, benefits, and costs of the 3 screening algorithms. The guideline statement notes both cotesting and high-risk HPV testing offer similar cancer detection rates: each prevents 1 additional cancer per 1,000 women screened as opposed to Pap-only testing.19
Also, tests that incorporate high-risk HPV screening may offer better detection of cervical adenocarcinoma (which has a worse prognosis than the more common squamous cell carcinoma type). However, both HPV-based screening strategies are more likely to require additional colposcopies for follow-up than Pap-only screening (1,630 colposcopies required for each cancer prevented with high-risk HPV alone, 1,635 with cotesting). Colposcopy is a simple office procedure that causes minimal discomfort to the patient.
The USPSTF guideline also differs in the recommended frequency of high-risk HPV-only testing; a high-risk HPV result should be repeated every 5 years if normal (as opposed to every 3 years as recommended by ACOG and ASCCP).19 The 5-year recommendation is based on analysis modeling, which suggests that performing high-risk HPV-only testing more frequently is unlikely to improve detection rates but will increase the number of screening tests and colposcopies.19
No trial has directly compared cotesting with high-risk HPV testing for more than 2 rounds of screening. The updated USPSTF recommendations are based on modeling estimates and expert opinion, which assesses cost and benefit vs harm in the long term. Also, no high-risk HPV test is currently FDA-approved for every-5-year screening when used by itself.
All 3 cervical cancer screening methods provide highly effective cancer prevention, so it is important for providers to choose the strategy that best fits their practice. The most critical aspect of screening is getting all women screened, no matter which method is used.
It is critical to remember that the screening intervals are intended for patients without symptoms. Those who have new concerns such as bleeding should have a diagnostic Pap done to evaluate their symptoms.
Follow-up of abnormal results
Regardless of the pathway chosen, appropriate follow-up of any abnormal test result is critical to the early detection of cancer. Established follow-up guidelines exist,22,23 but accessing this information can be difficult for the busy clinician. The ASCCP has a mobile phone application that outlines the action steps corresponding to the patient’s age and results of any combination of Pap or HPV testing. The app also includes the best screening algorithms for a particular patient.24
All guidelines agree that cervical cancer screening should start at age 21, regardless of HPV vaccination status or age of sexual initiation.17,18,25 Screening can be discontinued at age 65 for women with normal screening results in the prior decade (3 consecutive negative Pap results or 2 consecutive negative cotest results).23
For women who have had a total hysterectomy and no history of cervical neoplasia, screening should be stopped immediately after the procedure. However, several high-risk groups of women will need continued screening past the age of 65, or after a hysterectomy.
For a woman with a history of stage 2 cervical intraepithelial neoplasia or higher grade lesions, routine screening is continued for an additional 20 years, even if she is over age 65. Pap-only testing every 3 years is acceptable, because the role of HPV testing is unclear after hysterectomy.23 Prior guidelines suggested annual screening in these patients, so the change to every 3 years is notable. Many gynecologic oncologists will recommend that women with a history of cervical cancer continue annual screening indefinitely.
Within the first 2 to 3 years after treatment for high-grade dysplastic changes, annual follow-up is done by the gynecologic oncology team. Providers who offer follow-up during this time frame should keep in communication with the oncology team to ensure appropriate, individualized care. These recommendations are based on expert opinion, so variations in clinical practice may be seen.
Women infected with the human immunodeficiency virus can have Pap-only testing every 3 years, after a series of 3 normal annual Pap results.26 But screening does not stop at age 65.23,26 For patients who are immunosuppressed or have a history of diethylstilbestrol exposure, screening should be done annually indefinitely.23
- Bruni L, Diaz M, Castellsagué X, Ferrer E, Bosch FX, de Sanjosé S. Cervical human papillomavirus prevalence in 5 continents: meta-analysis of 1 million women with normal cytological findings. J Infect Dis 2010; 202(12):1789–1799. doi:10.1086/657321
- de Martel C, Ferlay J, Franceschi S, et al. Global burden of cancer attributable to infections in 2008: a review and synthetic analysis. Lancet Oncol 2012; 13(6):607–615. doi:10.1016/S1470-2045(12)70137-7
- American Cancer Society. Key statistics for cervical cancer. www.cancer.org/cancer/cervical-cancer/about/key-statistics.html. Accessed February 14, 2019.
- Thaxton L, Waxman AG. Cervical cancer prevention: immunization and screening 2015. Med Clin North Am 2015; 99(3):469–477. doi:10.1016/j.mcna.2015.01.003
- McNamara M, Batur P, Walsh JME, Johnson KM. HPV update: vaccination, screening, and associated disease. J Gen Intern Med 2016; 31(11):1360–1366. doi:10.1007/s11606-016-3725-z
- Guo F, Cofie LE, Berenson AB. Cervical cancer incidence in young US females after human papillomavirus vaccine introduction. Am J Prev Med 2018; 55(2):197–204. doi:10.1016/j.amepre.2018.03.013
- Meites E, Kempe A, Markowitz LE. Use of a 2-dose schedule for human papillomavirus vaccination—updated recommendations of the Advisory Committee on Immunization Practices. MMWR Morb Mortal Wkly Rep 2016; 65(49):1405–1408. doi:10.15585/mmwr.mm6549a5
- Centers for Disease Control and Prevention (CDC). Supplemental information and guidance for vaccination providers regarding use of 9-valent HPV vaccine Information for persons who started an HPV vaccination series with quadrivalent or bivalent HPV vaccine. www.cdc.gov/hpv/downloads/9vhpv-guidance.pdf. Accessed February 14, 2019.
- Dobson SR, McNeil S, Dionne M, et al. Immunogenicity of 2 doses of HPV vaccine in younger adolescents vs 3 doses in young women: a randomized clinical trial. JAMA 2013; 309(17):1793–1802. doi:10.1001/jama.2013.1625
- Markowitz LE, Dunne EF, Saraiya M, et al; Centers for Disease Control and Prevention (CDC). Human papillomavirus vaccination: recommendations of the Advisory Committee on Immunization Practices (ACIP). MMWR Recomm Rep 2014; 63(RR-05):1–30. pmid:25167164
- Thompson EL, Rosen BL, Vamos CA, Kadono M, Daley EM. Human papillomavirus vaccination: what are the reasons for nonvaccination among US adolescents? J Adolesc Health 2017; 61(3):288–293. doi:10.1016/j.jadohealth.2017.05.015
- Reagan-Steiner S, Yankey D, Jeyarajah J, et al. National, regional, state, and selected local area vaccination coverage among adolescents aged 13-17 years—United States, 2015. MMWR Morb Mortal Wkly Rep 2016; 65(33):850–858. doi:10.15585/mmwr.mm6533a4
- Gilkey MB, Calo WA, Moss JL, Shah PD, Marciniak MW, Brewer NT. Provider communication and HPV vaccination: The impact of recommendation quality. Vaccine 2016; 34(9):1187–1192. doi:10.1016/j.vaccine.2016.01.023
- Brewer NT, Hall ME, Malo TL, Gilkey MB, Quinn B, Lathren C. Announcements versus conversations to improve HPV vaccination coverage: a randomized trial. Pediatrics 2017; 139(1):e20161764. doi:10.1542/peds.2016-1764
- American Cancer Society. HPV vaccine facts. www.cancer.org/cancer/cancer-causes/infectious-agents/hpv/hpv-vaccine-facts-and-fears.html. Accessed February 14, 2019.
- National Cancer Institute; Chasan R, Manrow R. Cervical cancer. https://report.nih.gov/nihfactsheets/viewfactsheet.aspx?csid=76. Accessed February 14, 2019.
- The American College of Obstetricians and Gynecologists (ACOG). Frequently asked questions. Cervical cancer screening. www.acog.org/Patients/FAQs/Cervical-Cancer-Screening. Accessed February 14, 2019.
- Saslow D, Solomon D, Lawson HW, et al; American Cancer Society; American Society for Colposcopy and Cervical Pathology; American Society for Clinical Pathology. American Cancer Society, American Society for Colposcopy and Cervical Pathology, and American Society for Clinical Pathology screening guidelines for the prevention and early detection of cervical cancer. Am J Clin Pathol 2012; 137(4):516–542. doi:10.1309/AJCPTGD94EVRSJCG
- US Preventive Services Task Force; Curry SJ, Krist AH, Owens DK, et al. Screening for cervical cancer: US Preventive Services Task Force Recommendation Statement. JAMA 2018; 320(7):674–686. doi:10.1001/jama.2018.10897
- Wright TC, Stoler MH, Behrens CM, Sharma A, Zhang G, Wright TL. Primary cervical cancer screening with human papillomavirus: end of study results from the ATHENA study using HPV as the first-line screening test. Gynecol Oncol 2015; 136(2):189–197. doi:10.1016/j.ygyno.2014.11.076
- Huh WK, Ault KA, Chelmow D, et al. Use of primary high-risk human papillomavirus testing for cervical cancer screening: interim clinical guidance. Obstet Gynecol 2015; 125(2):330–337. doi:10.1097/AOG.0000000000000669
- Massad LS, Einstein MH, Huh WK, et al; 2012 ASCCP Consensus Guidelines Conference. 2012 updated consensus guidelines for the management of abnormal cervical cancer screening tests and cancer precursors. Obstet Gynecol 2013; 121(4):829–846. doi:10.1097/AOG.0b013e3182883a34
- Committee on Practice Bulletins—Gynecology. Practice Bulletin No. 168: cervical cancer screening and prevention. Obstet Gynecol 2016; 128(4):e111–e130. doi:10.1097/AOG.0000000000001708
- ASCCP. Mobile app. http://www.asccp.org/store-detail2/asccp-mobile-app. Accessed February 14, 2019.
- USPSTF. Draft recommendation: cervical cancer: screening. www.uspreventiveservicestaskforce.org/Page/Document/draft-recommendation-statement/cervical-cancer-screening2. Accessed February 14, 2019.
- Masur H, Brooks JT, Benson CA, Holmes KK, Pau AK, Kaplan JE; National Institutes of Health; Centers for Disease Control and Prevention; HIV Medicine Association of the Infectious Diseases Society of America. Prevention and treatment of opportunistic infections in HIV-infected adults and adolescents: Updated guidelines from the Centers for Disease Control and Prevention, National Institutes of Health, and HIV Medicine Association of the Infectious Diseases Society of America. Clin Infect Dis 2014; 58(9):1308–1311. doi:10.1093/cid/ciu094
About 12% of women worldwide are infected with human papillomavirus (HPV).1 Persistent HPV infection with high-risk strains such as HPV 6, 11, 16, and 18 cause nearly all cases of cervical cancer and some anal, vaginal, penile, and oropharyngeal cancers.2 An estimated 13,000 cases of invasive cervical cancer will be diagnosed this year in the United States alone.3
Up to 70% of HPV-related cervical cancer cases can be prevented with vaccination. A number of changes have been made to the vaccination schedule within the past few years—patients younger than 15 need only 2 rather than 3 doses, and the vaccine itself can be used in adults up to age 45.
Vaccination and routine cervical cancer screening are both necessary to prevent this disease3 along with effective family and patient counseling. Here, we discuss the most up-to-date HPV vaccination recommendations, current cervical cancer screening guidelines, counseling techniques that increase vaccination acceptance rates, and follow-up protocols for abnormal cervical cancer screening results.
TYPES OF HPV VACCINES
HPV immunization can prevent up to 70% of cases of cervical cancer due to HPV as well as 90% of genital warts.4 The US Food and Drug Administration (FDA) has approved 3 HPV vaccines:
- Gardasil 9 targets HPV types 6, 11, 16, and 18 along with 31, 33, 45, 52, 58—these cause 90% of cervical cancer cases and most cases of genital warts5—making it the most effective vaccine available; Gardasil 9 is the only HPV vaccine currently available in the United States
- The bivalent vaccine (Cervarix) targeted HPV 16 and 18 only, and was discontinued in the United States in 2016
- The quadrivalent HPV vaccine (Gardasil) targeted HPV 16 and 18 as well as 6 and 11, which cause most cases of genital warts; the last available doses in the United States expired in May 2017; it has been replaced by Gardasil 9.
The incidence of cervical cancer in the United States dropped 29% among 15- to 24-year-olds from 2003–2006 when HPV vaccination first started to 2011–2014.6
VACCINE DOSING RECOMMENDATIONS FOR PRIMARY PREVENTION
The Advisory Committee on Immunization Practices (ACIP) revised its HPV vaccine schedule in 2016, when it decreased the necessary doses from 3 to 2 for patients under age 15 and addressed the needs of special patient populations.7 In late 2018, the FDA approved the use of the vaccine in men and women up to age 45. However, no change in guidelines have yet been made (Table 1).
In females, the ACIP recommends starting HPV vaccination at age 11 or 12, but it can be given as early as age 9. A 2-dose schedule is recommended for the 9-valent vaccine before the patient’s 15th birthday (the second dose 6 to 12 months after the first).7 For females who initiate HPV vaccination between ages 15 and 45, a 3-dose schedule is necessary (at 0, 1 to 2, and 6 months).7,8
The change to a 2-dose schedule was prompted by an evaluation of girls ages 9 to 13 randomized to receive either a 2- or 3-dose schedule. Antibody responses with a 2-dose schedule were not inferior to those of young women (ages 16 to 26) who received all 3 doses.9 The geometric mean titer ratios remained noninferior throughout the study period of 36 months.
However, a loss of noninferiority was noted for HPV-18 by 24 months and for HPV-6 by 36 months.9 Thus, further studies are needed to understand the duration of protection with a 2-dose schedule. Nevertheless, decreasing the number of doses makes it a more convenient and cost-effective option for many families.
The recommendations are the same for males except for one notable difference: in males ages 21 to 26, vaccination is not routinely recommended by the ACIP, but rather it is considered a “permissive use” recommendation: ie, the vaccine should be offered and final decisions on administration be made after individualized discussion with the patient.10 Permissive-use status also means the vaccine may not be covered by health insurance. Even though the vaccine is now available to men and women until age 45, many insurance plans do not cover it after age 26.
Children of either sex with a history of sexual abuse should receive their first vaccine dose beginning at age 9.7
Immunocompromised patients should follow the 3-dose schedule regardless of their sex or the age when vaccination was initiated.10
For transgender patients and for men not previously vaccinated who have sex with men, the 3-dose schedule vaccine should be given by the age of 26 (this is a routine recommendation, not a permissive one).8
CHALLENGES OF VACCINATION
Effective patient and family counseling is important. Even though the first HPV vaccine was approved in 2006, only 34.9% of US adolescents were fully vaccinated by 2015. This was in part because providers did not recommend it, were unfamiliar with it, or had concerns about its safety,11,12 and in part because some parents refused it.
The physician must address any myths regarding HPV vaccination and ensure that parents and patients understand that HPV vaccine is safe and effective. Studies have shown that with high-quality recommendations (ie, the care provider strongly endorses the HPV vaccine, encourages same-day vaccination, and discusses cancer prevention), patients are 9 times more likely to start the HPV vaccination schedule and 3 times more likely to follow through with subsequent doses.13
Providing good family and patient education does not necessarily require spending more counseling time. A recent study showed that spending less time discussing the HPV vaccine can lead to better vaccine coverage.14 The study compared parent HPV vaccine counseling techniques and found that simply informing patients and their families that the HPV vaccine was due was associated with a higher vaccine acceptance rate than inviting conversations about it.14 When providers announced that the vaccine was due, assuming the parents were ready to vaccinate, there was a 5.4% increase in HPV vaccination coverage.14
Conversely, physicians who engaged parents in open-ended discussions about the HPV vaccine did not improve HPV vaccination coverage.14 The authors suggested that providers approach HPV vaccination as if they were counseling patients and families about the need to avoid second-hand smoke or the need to use car seats. If parents or patients resist the presumptive announcement approach, expanded counseling and shared decision-making are appropriate. This includes addressing misconceptions that parents and patients may have about the HPV vaccine. The American Cancer Society lists 8 facts to reference (Table 2).15
SECONDARY PREVENTION: CERVICAL CANCER SCREENING
Since the introduction of the Papanicolaou (Pap) test, US cervical cancer incidence rates have decreased by more than 60%.16 Because almost all cervical cancer is preventable with proper screening, all women ages 21 to 65 should be screened.
Currently, there are 3 options available for cervical cancer screening: the Pap-only test, the Pap-HPV cotest, and the high-risk HPV-only test (Table 3). The latter 2 options detect high-risk HPV genotypes.
Several organizations have screening algorithms that recommend when to use these tests, but the 3 that shape today’s standard of care in cervical cancer screening come from the American College of Obstetricians and Gynecologists (ACOG), the American Society for Colposcopy and Cervical Pathology (ASCCP), and US Preventive Services Task Force (USPSTF).17–19
Pap-only testing is performed every 3 years to screen for cervical neoplasia that might indicate premalignancy.
Pap-HPV cotesting is performed every 5 years in women older than 30 with past normal screening. Until 2018, all 3 organizations recommended cotesting as the preferred screening algorithm for women ages 30 to 65.17–19 Patients with a history of abnormal test results require more frequent testing as recommended by the ASCCP.18
The high-risk HPV-only test utilizes real-time polymerase chain reaction to detect HPV 16, HPV 18, and 12 other HPV genotypes. Only 2 tests are approved by the FDA as stand-alone cervical cancer screening tests—the Roche Cobas HPV test approved in 2014 and the Becton Dickinson Onclarity HPV assay approved in 2018. Other HPV tests that are used in a cotesting strategy should not be used for high-risk HPV-only testing because their performance characteristics may differ.
In 2015, the Addressing the Need for Advanced HPV Diagnostics (ATHENA) study showed that 1 round of high-risk HPV-only screening for women older than 25 was more sensitive than Pap-only or cotesting for stage 3 cervical intraepithelial neoplasia or more severe disease (after 3 years of follow-up).20 Current guidelines from ASCCP18 and ACOG17 state that the high-risk HPV test can be repeated every 3 years (when used to screen by itself) if the woman is older than 25 and has had a normal test result.
If the HPV test result is positive for high-risk HPV 16 or 18 genotypes, then immediate colposcopy is indicated; women who test positive for one of the other 12 high-risk subtypes will need to undergo a Pap test to determine the appropriate follow-up (Figure 1).18,21
In 2018, the USPSTF updated its recommendations, noting that for women age 30 to 65, Pap-only testing every 3 years, cotesting every 5 years, or high-risk HPV-only testing every 5 years are all appropriate screening strategies, with the Pap-only or high-risk HPV-only screenings being preferred.19 This is in contrast to ACOG and ASCCP recommendations for cotesting every 5 years, with alternative options of Pap-only or HPV-only testing being done every 3 years.17,18
Is there a best screening protocol?
The USPSTF reviewed large randomized and observational studies to summarize the effectiveness of the 3 screening strategies and commissioned a decision analysis model to compare the risks, benefits, and costs of the 3 screening algorithms. The guideline statement notes both cotesting and high-risk HPV testing offer similar cancer detection rates: each prevents 1 additional cancer per 1,000 women screened as opposed to Pap-only testing.19
Also, tests that incorporate high-risk HPV screening may offer better detection of cervical adenocarcinoma (which has a worse prognosis than the more common squamous cell carcinoma type). However, both HPV-based screening strategies are more likely to require additional colposcopies for follow-up than Pap-only screening (1,630 colposcopies required for each cancer prevented with high-risk HPV alone, 1,635 with cotesting). Colposcopy is a simple office procedure that causes minimal discomfort to the patient.
The USPSTF guideline also differs in the recommended frequency of high-risk HPV-only testing; a high-risk HPV result should be repeated every 5 years if normal (as opposed to every 3 years as recommended by ACOG and ASCCP).19 The 5-year recommendation is based on analysis modeling, which suggests that performing high-risk HPV-only testing more frequently is unlikely to improve detection rates but will increase the number of screening tests and colposcopies.19
No trial has directly compared cotesting with high-risk HPV testing for more than 2 rounds of screening. The updated USPSTF recommendations are based on modeling estimates and expert opinion, which assesses cost and benefit vs harm in the long term. Also, no high-risk HPV test is currently FDA-approved for every-5-year screening when used by itself.
All 3 cervical cancer screening methods provide highly effective cancer prevention, so it is important for providers to choose the strategy that best fits their practice. The most critical aspect of screening is getting all women screened, no matter which method is used.
It is critical to remember that the screening intervals are intended for patients without symptoms. Those who have new concerns such as bleeding should have a diagnostic Pap done to evaluate their symptoms.
Follow-up of abnormal results
Regardless of the pathway chosen, appropriate follow-up of any abnormal test result is critical to the early detection of cancer. Established follow-up guidelines exist,22,23 but accessing this information can be difficult for the busy clinician. The ASCCP has a mobile phone application that outlines the action steps corresponding to the patient’s age and results of any combination of Pap or HPV testing. The app also includes the best screening algorithms for a particular patient.24
All guidelines agree that cervical cancer screening should start at age 21, regardless of HPV vaccination status or age of sexual initiation.17,18,25 Screening can be discontinued at age 65 for women with normal screening results in the prior decade (3 consecutive negative Pap results or 2 consecutive negative cotest results).23
For women who have had a total hysterectomy and no history of cervical neoplasia, screening should be stopped immediately after the procedure. However, several high-risk groups of women will need continued screening past the age of 65, or after a hysterectomy.
For a woman with a history of stage 2 cervical intraepithelial neoplasia or higher grade lesions, routine screening is continued for an additional 20 years, even if she is over age 65. Pap-only testing every 3 years is acceptable, because the role of HPV testing is unclear after hysterectomy.23 Prior guidelines suggested annual screening in these patients, so the change to every 3 years is notable. Many gynecologic oncologists will recommend that women with a history of cervical cancer continue annual screening indefinitely.
Within the first 2 to 3 years after treatment for high-grade dysplastic changes, annual follow-up is done by the gynecologic oncology team. Providers who offer follow-up during this time frame should keep in communication with the oncology team to ensure appropriate, individualized care. These recommendations are based on expert opinion, so variations in clinical practice may be seen.
Women infected with the human immunodeficiency virus can have Pap-only testing every 3 years, after a series of 3 normal annual Pap results.26 But screening does not stop at age 65.23,26 For patients who are immunosuppressed or have a history of diethylstilbestrol exposure, screening should be done annually indefinitely.23
- Bruni L, Diaz M, Castellsagué X, Ferrer E, Bosch FX, de Sanjosé S. Cervical human papillomavirus prevalence in 5 continents: meta-analysis of 1 million women with normal cytological findings. J Infect Dis 2010; 202(12):1789–1799. doi:10.1086/657321
- de Martel C, Ferlay J, Franceschi S, et al. Global burden of cancer attributable to infections in 2008: a review and synthetic analysis. Lancet Oncol 2012; 13(6):607–615. doi:10.1016/S1470-2045(12)70137-7
- American Cancer Society. Key statistics for cervical cancer. www.cancer.org/cancer/cervical-cancer/about/key-statistics.html. Accessed February 14, 2019.
- Thaxton L, Waxman AG. Cervical cancer prevention: immunization and screening 2015. Med Clin North Am 2015; 99(3):469–477. doi:10.1016/j.mcna.2015.01.003
- McNamara M, Batur P, Walsh JME, Johnson KM. HPV update: vaccination, screening, and associated disease. J Gen Intern Med 2016; 31(11):1360–1366. doi:10.1007/s11606-016-3725-z
- Guo F, Cofie LE, Berenson AB. Cervical cancer incidence in young US females after human papillomavirus vaccine introduction. Am J Prev Med 2018; 55(2):197–204. doi:10.1016/j.amepre.2018.03.013
- Meites E, Kempe A, Markowitz LE. Use of a 2-dose schedule for human papillomavirus vaccination—updated recommendations of the Advisory Committee on Immunization Practices. MMWR Morb Mortal Wkly Rep 2016; 65(49):1405–1408. doi:10.15585/mmwr.mm6549a5
- Centers for Disease Control and Prevention (CDC). Supplemental information and guidance for vaccination providers regarding use of 9-valent HPV vaccine Information for persons who started an HPV vaccination series with quadrivalent or bivalent HPV vaccine. www.cdc.gov/hpv/downloads/9vhpv-guidance.pdf. Accessed February 14, 2019.
- Dobson SR, McNeil S, Dionne M, et al. Immunogenicity of 2 doses of HPV vaccine in younger adolescents vs 3 doses in young women: a randomized clinical trial. JAMA 2013; 309(17):1793–1802. doi:10.1001/jama.2013.1625
- Markowitz LE, Dunne EF, Saraiya M, et al; Centers for Disease Control and Prevention (CDC). Human papillomavirus vaccination: recommendations of the Advisory Committee on Immunization Practices (ACIP). MMWR Recomm Rep 2014; 63(RR-05):1–30. pmid:25167164
- Thompson EL, Rosen BL, Vamos CA, Kadono M, Daley EM. Human papillomavirus vaccination: what are the reasons for nonvaccination among US adolescents? J Adolesc Health 2017; 61(3):288–293. doi:10.1016/j.jadohealth.2017.05.015
- Reagan-Steiner S, Yankey D, Jeyarajah J, et al. National, regional, state, and selected local area vaccination coverage among adolescents aged 13-17 years—United States, 2015. MMWR Morb Mortal Wkly Rep 2016; 65(33):850–858. doi:10.15585/mmwr.mm6533a4
- Gilkey MB, Calo WA, Moss JL, Shah PD, Marciniak MW, Brewer NT. Provider communication and HPV vaccination: The impact of recommendation quality. Vaccine 2016; 34(9):1187–1192. doi:10.1016/j.vaccine.2016.01.023
- Brewer NT, Hall ME, Malo TL, Gilkey MB, Quinn B, Lathren C. Announcements versus conversations to improve HPV vaccination coverage: a randomized trial. Pediatrics 2017; 139(1):e20161764. doi:10.1542/peds.2016-1764
- American Cancer Society. HPV vaccine facts. www.cancer.org/cancer/cancer-causes/infectious-agents/hpv/hpv-vaccine-facts-and-fears.html. Accessed February 14, 2019.
- National Cancer Institute; Chasan R, Manrow R. Cervical cancer. https://report.nih.gov/nihfactsheets/viewfactsheet.aspx?csid=76. Accessed February 14, 2019.
- The American College of Obstetricians and Gynecologists (ACOG). Frequently asked questions. Cervical cancer screening. www.acog.org/Patients/FAQs/Cervical-Cancer-Screening. Accessed February 14, 2019.
- Saslow D, Solomon D, Lawson HW, et al; American Cancer Society; American Society for Colposcopy and Cervical Pathology; American Society for Clinical Pathology. American Cancer Society, American Society for Colposcopy and Cervical Pathology, and American Society for Clinical Pathology screening guidelines for the prevention and early detection of cervical cancer. Am J Clin Pathol 2012; 137(4):516–542. doi:10.1309/AJCPTGD94EVRSJCG
- US Preventive Services Task Force; Curry SJ, Krist AH, Owens DK, et al. Screening for cervical cancer: US Preventive Services Task Force Recommendation Statement. JAMA 2018; 320(7):674–686. doi:10.1001/jama.2018.10897
- Wright TC, Stoler MH, Behrens CM, Sharma A, Zhang G, Wright TL. Primary cervical cancer screening with human papillomavirus: end of study results from the ATHENA study using HPV as the first-line screening test. Gynecol Oncol 2015; 136(2):189–197. doi:10.1016/j.ygyno.2014.11.076
- Huh WK, Ault KA, Chelmow D, et al. Use of primary high-risk human papillomavirus testing for cervical cancer screening: interim clinical guidance. Obstet Gynecol 2015; 125(2):330–337. doi:10.1097/AOG.0000000000000669
- Massad LS, Einstein MH, Huh WK, et al; 2012 ASCCP Consensus Guidelines Conference. 2012 updated consensus guidelines for the management of abnormal cervical cancer screening tests and cancer precursors. Obstet Gynecol 2013; 121(4):829–846. doi:10.1097/AOG.0b013e3182883a34
- Committee on Practice Bulletins—Gynecology. Practice Bulletin No. 168: cervical cancer screening and prevention. Obstet Gynecol 2016; 128(4):e111–e130. doi:10.1097/AOG.0000000000001708
- ASCCP. Mobile app. http://www.asccp.org/store-detail2/asccp-mobile-app. Accessed February 14, 2019.
- USPSTF. Draft recommendation: cervical cancer: screening. www.uspreventiveservicestaskforce.org/Page/Document/draft-recommendation-statement/cervical-cancer-screening2. Accessed February 14, 2019.
- Masur H, Brooks JT, Benson CA, Holmes KK, Pau AK, Kaplan JE; National Institutes of Health; Centers for Disease Control and Prevention; HIV Medicine Association of the Infectious Diseases Society of America. Prevention and treatment of opportunistic infections in HIV-infected adults and adolescents: Updated guidelines from the Centers for Disease Control and Prevention, National Institutes of Health, and HIV Medicine Association of the Infectious Diseases Society of America. Clin Infect Dis 2014; 58(9):1308–1311. doi:10.1093/cid/ciu094
KEY POINTS
- Immunization against HPV can prevent up to 70% of HPV-related cervical cancer cases.
- Gardasil 9 is the only HPV vaccine currently available in the United States and is now approved for use in males and females between the ages of 9 and 45.
- In girls and boys younger than 15, a 2-dose schedule is recommended; patients ages 15 through 45 require 3 doses.
- Vaccine acceptance rates are highest when primary care providers announce that the vaccine is due rather than invite open-ended discussions.
- Regular cervical cancer screening is an important preventive tool and should be performed using the Papanicolaou (Pap) test, the high-risk HPV-only test, or the Pap-HPV cotest.
Three neglected numbers in the CBC: The RDW, MPV, and NRBC count
The complete blood cell count (CBC) is one of the most frequently ordered laboratory tests in both the inpatient and outpatient settings. Not long ago, the CBC required peering through a microscope and counting the red blood cells, white blood cells, and platelets. These 3 numbers are still the primary purpose of the test.
Now, with automated counters, the CBC report also contains other numbers that delineate characteristics of each cell type. For example:
The mean corpuscular volume is the average volume of red blood cells. Providers use it to classify anemia as either microcytic, normocytic, or macrocytic, each with its own differential diagnosis.
The differential white blood cell count provides absolute counts and relative percentages of each type of leukocyte. For example, the absolute neutrophil count is an important measure of immunocompetence.
But other values in the CBC may be overlooked, even though they can provide important information. Here, we highlight 3 of them:
- The red blood cell distribution width (RDW)
- The mean platelet volume (MPV)
- The nucleated red blood cell (NRBC) count.
In addition to describing their diagnostic utility, we also discuss emerging evidence of their potential prognostic significance in hematologic and nonhematologic disorders. By incorporating an awareness of their value in clinical practice, providers can maximize the usefulness of the CBC.
RED BLOOD CELL DISTRIBUTION WIDTH
 of 13.5% (red line) in a patient with a normal complete blood cell count. B: Example of an increased RDW of 28.8% in a patient with iron deficiency shortly after initiation of iron supplementation.")
The RDW is a measure of variation (anisocytosis) in the size of the circulating red cells. The term “width” is misleading, as the value is not derived from the width of the red blood cell, but rather from the width of the distribution curve of the corpuscular volume (Figure 1). Therefore, a normal RDW means that the cells are all about the same size, while a high RDW means they vary widely in size.
The RDW can be calculated either as a coefficient of variation, with a reference range of 11% to 16% depending on the laboratory, or, less often, as a standard deviation, with a reference range of 39 to 46 fL.
The RDW can differentiate between causes of anemia
A high RDW is often found in nutritional deficiencies of iron, vitamin B12, and folate. This information is helpful in differentiating the cause of microcytic anemia, as a high RDW suggests iron-deficiency anemia while a normal RDW suggests thalassemia.1 In iron deficiency, the RDW often rises before the mean corpuscular volume falls, serving as an early diagnostic clue.
The RDW can also be high after recent hemorrhage or rapid hemolysis, as the acute drop in hemoglobin results in increased production of reticulocytes, which are larger than mature erythrocytes.
Because a range of disorders can elevate the RDW, reviewing the peripheral blood smear is an important next step in the diagnostic evaluation, specifically looking for reticulocytes, microspherocytes, and other abnormal red blood cells contributing to the RDW elevation.
A normal RDW is less diagnostically useful. It indicates the red blood cells are of uniform size, but they may be uniformly small or large depending on how long the anemia has persisted. Since red cells circulate for only about 120 days, patients who have severe iron-deficiency anemia for months to years are expected to have a normal rather than a high RDW, as their red cells of normal size have all been replaced by microcytes.
A low RDW is not consistently associated with any hematologic disorder.
RDW may have prognostic value
Emerging data suggest that the RDW may also have prognostic value in nonhematologic diseases. In a retrospective study of 15,852 adult participants in the Third National Health and Nutrition Examination Survey (1988–1994), a higher RDW was associated with a higher risk of death, with the all-cause mortality rate increasing by 23% for every 1% increment in RDW.2
This correlation is particularly prominent in cardiac disorders. In 2 large retrospective studies of patients with symptomatic heart failure, a higher RDW was a strong predictor of morbidity and death (hazard ratio 1.17 per 1-standard deviation increase, P < .001), even stronger than more commonly used variables such as ejection fraction, New York Heart Association functional class, and renal function.3
In a retrospective analysis of 4,111 patients with myocardial infarction, the degree of RDW elevation correlated with the risk of repeat nonfatal myocardial infarction, coronary death, new symptomatic heart failure, and stroke.4
It is hypothesized that high RDW may reflect poor cell membrane integrity from altered cholesterol content, which in turn has deleterious effects on multiple organ systems and is therefore associated with adverse outcomes.5
Currently, using the RDW to assess prognosis remains investigational, and how best to interpret it in daily practice requires further study.
MEAN PLATELET VOLUME
The MPV, ie, the average size of platelets, is reported in femtoliters (fL). Because the MPV varies depending on the instrument used, each laboratory has a unique reference range, usually about 8 to 12 fL. The MPV must be interpreted in conjunction with the platelet count; the product of the MPV and platelet count is called the total platelet mass.
Using the MPV to find the cause of thrombocytopenia
The MPV can be used to help narrow the differential diagnosis of thrombocytopenia. For example, it is high in thrombocytopenia resulting from peripheral destruction, as in immune thrombocytopenic purpura. This is because as platelets are lost, thrombopoietin production increases and new, larger platelets are released from healthy megakaryocytes in an attempt to increase the total platelet mass.
, normal sized platelets (dotted arrows), and a nucleated red blood cell (thick arrow) in a patient with myelofibrosis and extensive extramedullary hematopoiesis.")
In contrast, the MPV is low in patients with thrombocytopenia due to megakaryocyte hypoplasia, as malfunctioning megakaryocytes cannot maintain the total platelet mass, and any platelets produced remain small. This distinction can be obscured in the setting of splenomegaly, as larger platelets are more easily sequestered in the spleen and the MPV may therefore be low or normal.
The MPV can also be used to differentiate congenital thrombocytopenic disorders, which can be characterized by either a high MPV (eg, gray platelet syndrome, Bernard-Soulier syndrome) or a low MPV (eg, Wiskott-Aldrich syndrome) (Figure 2).
MPV may have prognostic value
Evidence suggests that the MPV also has potential prognostic value, particularly in vascular disease, as larger platelets are hypothesized to have increased hemostatic potential.
In a large meta-analysis of patients with coronary artery disease, a high MPV was associated with worse outcomes; the risk of death or myocardial infarction was 17% higher in those with a high MPV (the threshold ranged from 8.4 to 11.7 fL in the different studies) than in those with a low MPV.6
In a study of 213 patients with non-ST-segment elevation myocardial infarction, the risk of significant coronary artery disease was 4.18 times higher in patients with a high MPV and a high troponin level than in patients with a normal MPV and a high troponin.7 The authors suggested that a high MPV may help identify patients at highest risk of significant coronary artery disease who would benefit from invasive studies (ie, coronary angiography).
This correlation has also been observed in other forms of vascular disease. In 261 patients who underwent carotid angioplasty and stenting, an MPV higher than 10.1 fL was associated with a risk of in-stent restenosis more than 3 times higher.8
The MPV has also been found to be higher in patients with type 2 diabetes than in controls, particularly in those with microvascular complications such as retinopathy or microalbuminuria.9
Conversely, in patients with cancer, a low MPV appears to be associated with a poor prognosis. In a retrospective analysis of 236 patients with esophageal cancer, those who had an MPV of 7.4 fL or less had significantly shorter overall survival than patients with an MPV higher than 7.4 fL.10
A low MPV has also been associated with an increased risk of venous thromoboembolism in patients with cancer. In a prospective observational cohort study of 1,544 patients, the 2-year probability of venous thromboembolism was 9% in patients with an MPV less than 10.8 fL, compared with 5.5% in those with higher MPV values. The 2-year overall survival rate was also higher in patients with high MPV than in those with low MPV, at 64.7% vs 55.7%, respectively (P = .001).11
But the MPV is far from a perfect clinical metric. Since its measurement is subject to significant laboratory variation, an abnormal value should always be confirmed with evaluation of a peripheral blood smear. Furthermore, it is unclear why a high MPV portends poor prognosis in patients without cancer, whereas the opposite is true in patients with cancer. Therefore, its role in prognostication remains investigational, and further studies are essential to determine its appropriate usefulness in clinical practice.12
NUCLEATED RED BLOOD CELL COUNT
NRBCs are immature red blood cell precursors not present in the circulation of healthy adults. During erythropoiesis, the common myeloid progenitor cell first differentiates into a proerythroblast; subsequently, the chromatin in the nucleus of the proerythroblast gradually condenses until it becomes an orthochromatic erythroblast, also known as a nucleated red cell (Figure 2). Once the nucleus is expelled, the cell is known as a reticulocyte, which ultimately becomes a mature erythrocyte.
Healthy newborns have circulating NRBCs that rapidly disappear within a few weeks of birth. However, NRBCs can return to the circulation in a variety of disease states.
Causes of NRBCs
Brisk hemolysis or rapid blood loss can cause NRBCs to be released into the blood as erythropoiesis increases in an attempt to compensate for acute anemia.
Damage or stress to the bone marrow also causes NRBCs to be released into the peripheral blood, as is often the case in hematologic diseases. In a study of 478 patients with hematologic diseases, the frequency of NRBC positivity at diagnosis was highest in patients with chronic myeloid leukemia (100%), acute leukemia (62%), and myelodysplastic syndromes (45%).13 NRBCs also appeared at higher frequencies during chemotherapy in other hematologic conditions, such as hemophagocytic lymphohistiocytosis.
The mechanism by which NRBCs are expelled from the bone marrow is unclear, though studies have suggested that inflammation or hypoxia or both cause increased hematopoietic stress, resulting in the release of immature red cells. Increased concentrations of inflammatory cytokines (interleukin 6 and interleukin 3) and erythropoietin in the plasma and decreased arterial oxygen partial tension have been reported in patients with circulating NRBCs.14,15
Because they are associated with hematologic disorders, the finding of NRBCs should prompt evaluation of a peripheral smear to assess for abnormalities in other cell lines.
The NRBC count and prognosis
In critically ill patients, peripheral NRBCs can also indicate life-threatening conditions.
In a study of 421 adult intensive care patients, the in-hospital mortality rate was 42% in those with peripheral NRBCs vs 5.9% in those without them.16 Further, the higher the NRBC count and the more days that NRBCs were reported in the CBC, the higher the risk of death.
In adults with acute respiratory distress syndrome, the finding of any NRBCs in the peripheral blood was an independent risk factor for death, and an NRBC count higher than 220 cells/µL was associated with a more than 3-fold higher risk of death.17
Daily screening in patients in surgical intensive care units revealed that NRBCs appeared an average of 9 days before death, consistent with an early marker of impending decline.18
In another study,19 the risk of death within 90 days of hospital discharge was higher in NRBC-positive patients, reaching 21.9% in those who had a count higher than 200 cells/µL. The risk of unplanned hospital readmission within 30 days was also increased.
Leukoerythroblastosis
The combination of NRBCs and immature white blood cells (eg, myelocytes, metamyelocytes) is called leukoerythroblastosis.
Leukoerythroblastosis is classically seen in myelophthisic anemias in which hematopoietic cells in the marrow are displaced by fibrosis, tumor, or other space-occupying processes, but it can also occur in any situation of acute marrow stress, including critical illness.
In addition, leukoerythroblastosis appears in a rare complication of sickle cell hemoglobinopathies: bone marrow necrosis with fat embolism syndrome.20,21 As the marrow necroses, fat emboli are released in the systemic circulation causing micro- and macrovascular occlusions and multiorgan failure. The largest case series in the literature reports 58 patients with bone marrow necrosis with fat embolism syndrome.22
At our institution, we have seen 18 patients with this condition in the past 8 years, with the frequency of diagnosis increasing with heightened awareness of the disorder. We have found that leukoerythroblastosis is often an early marker of this unrecognized syndrome and can prompt emergency red cell exchange, which is considered to be lifesaving in this condition.22
These examples and many others show that the presence of NRBCs in the CBC can serve as an important clinical warning.
OLD TESTS CAN STILL BE USEFUL
The CBC provides much more than simple cell counts; it is a rich collection of information related to each blood cell. These days, with new diagnostic tests and prognostic tools based on molecular analysis, it is important to not overlook the value of the tests clinicians have been ordering for generations.
The RDW, MPV, and NRBC count will not likely provide definitive or flawless diagnostic or prognostic information, but when understood and used correctly, they provide readily available, cost-effective, and useful data that can supplement and guide clinical decision-making. By understanding the CBC more fully, providers can maximize the truly complete nature of this routine laboratory test.
- Lima CS, Reis AR, Grotto HZ, Saad ST, Costa FF. Comparison of red cell distribution width and a red cell discriminant function incorporating volume dispersion for distinguishing iron deficiency from beta thalassemia trait in patients with microcytosis. Sao Paulo Med J 1996; 114(5):1265–1269. pmid:9239926
- Perlstein TS, Weuve J, Pfeffer MA, Beckman JA. Red blood cell distribution width and mortality risk in a community-based prospective cohort. Arch Intern Med 2009; 169(6):588–594. doi:10.1001/archinternmed.2009.55
- Felker GM, Allen LA, Pocock SJ, et al; CHARM Investigators. Red cell distribution width as a novel prognostic marker in heart failure: data from the CHARM Program and the Duke Databank. J Am Coll Cardiol 2007; 50(1):40–47. doi:10.1016/j.jacc.2007.02.067
- Tonelli M, Sacks F, Arnold M, Moye L, Davis B, Pfeffer M; for the Cholesterol and Recurrent Events (CARE) Trial Investigators. Relation between red blood cell distribution width and cardiovascular event rate in people with coronary disease. Circulation 2008; 117(2):163–168. doi:10.1161/CIRCULATIONAHA.107.727545
- Goldstein MR, Mascitelli L, Pezzetta F. Is red cell distribution width a marker of overall membrane integrity? [Letter] Arch Intern Med 2009; 169(16):1539–1540. doi:10.1001/archinternmed.2009.275
- Sansanaydhu N, Numthavaj P, Muntham D, et al. Prognostic effect of mean platelet volume in patients with coronary artery disease. A systematic review and meta-analysis. Thromb Haemost 2015; 114(6):1299–1309. doi:10.1160/TH15-04-0280
- Taskesen T, Sekhon H, Wroblewski I, et al. Usefulness of mean platelet volume to predict significant coronary artery disease in patients with non-ST-elevation acute coronary syndromes. Am J Cardiol 2017; 119(2):192–196. doi:10.1016/j.amjcard.2016.09.042
- Dai Z, Gao J, Li S, et al. Mean platelet volume as a predictor for restenosis after carotid angioplasty and stenting. Stroke 2018; 49(4):872–876. doi:10.1161/STROKEAHA.117.019748
- Papanas N, Symeonidis G, Maltezos E, et al. Mean platelet volume in patients with type 2 diabetes mellitus. Platelets 2004; 15(8):475–478. doi:10.1080/0953710042000267707
- Shen W, Cui MM, Wang X, Wang RT. Reduced mean platelet volume is associated with poor prognosis in esophageal cancer. Cancer Biomark 2018; 22(3):559–563. doi:10.3233/CBM-181231
- Riedl J, Kaider A, Reitter EM, et al. Association of mean platelet volume with risk of venous thromboembolism and mortality in patients with cancer. Results from the Vienna Cancer and Thrombosis Study (CATS). Thromb Haemost 2014; 111(4):670–678. doi:10.1160/TH13-07-0603
- Tsiara S, Elisaf M, Jagroop IA, Mikhailidis DP. Platelets as predictors of vascular risk: is there a practical index of platelet activity? Clin Appl Thromb Hemost 2003; 9(3):177–190. pmid:14507105
- Danise P, Maconi M, Barrella F, et al. Evaluation of nucleated red blood cells in the peripheral blood of hematological diseases. Clin Chem Lab Med 2011; 50(2):357–360. doi:10.1515/CCLM.2011.766
- Stachon A, Bolulul O, Holland-Letz T, Krieg M. Association between nucleated red blood cells in blood and the levels of erythropoietin, interleukin 3, interleukin 6, and interleukin 12p70. Shock 2005; 24(1):34–39. pmid:15988318
- Kuert S, Holland-Letz T, Friese J, Stachon A. Association of nucleated red blood cells in blood and arterial oxygen partial tension. Clin Chem Lab Med 2011; 49(2):257–263. doi:10.1515/CCLM.2011.041
- Stachon A, Holland-Letz T, Krieg M. In-hospital mortality of intensive care patients with nucleated red blood cells in blood. Clin Chem Lab Med 2004; 42(8):933–938. doi:10.1515/CCLM.2004.151
- Menk M, Giebelhäuser L, Vorderwülbecke G, et al. Nucleated red blood cells as predictors of mortality in patients with acute respiratory distress syndrome (ARDS): an observational study. Ann Intensive Care 2018; 8(1):42. doi:10.1186/s13613-018-0387-5
- Stachon A, Kempf R, Holland-Letz T, Friese J, Becker A, Krieg M. Daily monitoring of nucleated red blood cells in the blood of surgical intensive care patients. Clin Chim Acta 2006; 366(1–2):329–335. doi:10.1016/j.cca.2005.11.022
- Purtle SW, Horkan CM, Moromizato T, Gibbons FK, Christopher KB. Nucleated red blood cells, critical illness survivors and postdischarge outcomes: a cohort study. Crit Care 2017; 21(1):154. doi:10.1186/s13054-017-1724-z
- May J, Sullivan JC, LaVie D, LaVie K, Marques MB. Inside out: bone marrow necrosis and fat embolism complicating sickle-beta+ thalassemia. Am J Med 2016; 129(12):e321–e324. doi:10.1016/j.amjmed.2016.05.027
- Gangaraju R, Reddy VV, Marques MB. Fat embolism syndrome secondary to bone marrow necrosis in patients with hemoglobinopathies. South Med J 2016; 109(9):549–553. doi:10.14423/SMJ.0000000000000520
- Tsitsikas DA, Gallinella G, Patel S, Seligman H, Greaves P, Amos RJ. Bone marrow necrosis and fat embolism syndrome in sickle cell disease: increased susceptibility of patients with non-SS genotypes and a possible association with human parvovirus B19 infection. Blood Rev 2014; 28(1):23–30. doi:10.1016/j.blre.2013.12.002
The complete blood cell count (CBC) is one of the most frequently ordered laboratory tests in both the inpatient and outpatient settings. Not long ago, the CBC required peering through a microscope and counting the red blood cells, white blood cells, and platelets. These 3 numbers are still the primary purpose of the test.
Now, with automated counters, the CBC report also contains other numbers that delineate characteristics of each cell type. For example:
The mean corpuscular volume is the average volume of red blood cells. Providers use it to classify anemia as either microcytic, normocytic, or macrocytic, each with its own differential diagnosis.
The differential white blood cell count provides absolute counts and relative percentages of each type of leukocyte. For example, the absolute neutrophil count is an important measure of immunocompetence.
But other values in the CBC may be overlooked, even though they can provide important information. Here, we highlight 3 of them:
- The red blood cell distribution width (RDW)
- The mean platelet volume (MPV)
- The nucleated red blood cell (NRBC) count.
In addition to describing their diagnostic utility, we also discuss emerging evidence of their potential prognostic significance in hematologic and nonhematologic disorders. By incorporating an awareness of their value in clinical practice, providers can maximize the usefulness of the CBC.
RED BLOOD CELL DISTRIBUTION WIDTH
The RDW is a measure of variation (anisocytosis) in the size of the circulating red cells. The term “width” is misleading, as the value is not derived from the width of the red blood cell, but rather from the width of the distribution curve of the corpuscular volume (Figure 1). Therefore, a normal RDW means that the cells are all about the same size, while a high RDW means they vary widely in size.
The RDW can be calculated either as a coefficient of variation, with a reference range of 11% to 16% depending on the laboratory, or, less often, as a standard deviation, with a reference range of 39 to 46 fL.
The RDW can differentiate between causes of anemia
A high RDW is often found in nutritional deficiencies of iron, vitamin B12, and folate. This information is helpful in differentiating the cause of microcytic anemia, as a high RDW suggests iron-deficiency anemia while a normal RDW suggests thalassemia.1 In iron deficiency, the RDW often rises before the mean corpuscular volume falls, serving as an early diagnostic clue.
The RDW can also be high after recent hemorrhage or rapid hemolysis, as the acute drop in hemoglobin results in increased production of reticulocytes, which are larger than mature erythrocytes.
Because a range of disorders can elevate the RDW, reviewing the peripheral blood smear is an important next step in the diagnostic evaluation, specifically looking for reticulocytes, microspherocytes, and other abnormal red blood cells contributing to the RDW elevation.
A normal RDW is less diagnostically useful. It indicates the red blood cells are of uniform size, but they may be uniformly small or large depending on how long the anemia has persisted. Since red cells circulate for only about 120 days, patients who have severe iron-deficiency anemia for months to years are expected to have a normal rather than a high RDW, as their red cells of normal size have all been replaced by microcytes.
A low RDW is not consistently associated with any hematologic disorder.
RDW may have prognostic value
Emerging data suggest that the RDW may also have prognostic value in nonhematologic diseases. In a retrospective study of 15,852 adult participants in the Third National Health and Nutrition Examination Survey (1988–1994), a higher RDW was associated with a higher risk of death, with the all-cause mortality rate increasing by 23% for every 1% increment in RDW.2
This correlation is particularly prominent in cardiac disorders. In 2 large retrospective studies of patients with symptomatic heart failure, a higher RDW was a strong predictor of morbidity and death (hazard ratio 1.17 per 1-standard deviation increase, P < .001), even stronger than more commonly used variables such as ejection fraction, New York Heart Association functional class, and renal function.3
In a retrospective analysis of 4,111 patients with myocardial infarction, the degree of RDW elevation correlated with the risk of repeat nonfatal myocardial infarction, coronary death, new symptomatic heart failure, and stroke.4
It is hypothesized that high RDW may reflect poor cell membrane integrity from altered cholesterol content, which in turn has deleterious effects on multiple organ systems and is therefore associated with adverse outcomes.5
Currently, using the RDW to assess prognosis remains investigational, and how best to interpret it in daily practice requires further study.
MEAN PLATELET VOLUME
The MPV, ie, the average size of platelets, is reported in femtoliters (fL). Because the MPV varies depending on the instrument used, each laboratory has a unique reference range, usually about 8 to 12 fL. The MPV must be interpreted in conjunction with the platelet count; the product of the MPV and platelet count is called the total platelet mass.
Using the MPV to find the cause of thrombocytopenia
The MPV can be used to help narrow the differential diagnosis of thrombocytopenia. For example, it is high in thrombocytopenia resulting from peripheral destruction, as in immune thrombocytopenic purpura. This is because as platelets are lost, thrombopoietin production increases and new, larger platelets are released from healthy megakaryocytes in an attempt to increase the total platelet mass.
In contrast, the MPV is low in patients with thrombocytopenia due to megakaryocyte hypoplasia, as malfunctioning megakaryocytes cannot maintain the total platelet mass, and any platelets produced remain small. This distinction can be obscured in the setting of splenomegaly, as larger platelets are more easily sequestered in the spleen and the MPV may therefore be low or normal.
The MPV can also be used to differentiate congenital thrombocytopenic disorders, which can be characterized by either a high MPV (eg, gray platelet syndrome, Bernard-Soulier syndrome) or a low MPV (eg, Wiskott-Aldrich syndrome) (Figure 2).
MPV may have prognostic value
Evidence suggests that the MPV also has potential prognostic value, particularly in vascular disease, as larger platelets are hypothesized to have increased hemostatic potential.
In a large meta-analysis of patients with coronary artery disease, a high MPV was associated with worse outcomes; the risk of death or myocardial infarction was 17% higher in those with a high MPV (the threshold ranged from 8.4 to 11.7 fL in the different studies) than in those with a low MPV.6
In a study of 213 patients with non-ST-segment elevation myocardial infarction, the risk of significant coronary artery disease was 4.18 times higher in patients with a high MPV and a high troponin level than in patients with a normal MPV and a high troponin.7 The authors suggested that a high MPV may help identify patients at highest risk of significant coronary artery disease who would benefit from invasive studies (ie, coronary angiography).
This correlation has also been observed in other forms of vascular disease. In 261 patients who underwent carotid angioplasty and stenting, an MPV higher than 10.1 fL was associated with a risk of in-stent restenosis more than 3 times higher.8
The MPV has also been found to be higher in patients with type 2 diabetes than in controls, particularly in those with microvascular complications such as retinopathy or microalbuminuria.9
Conversely, in patients with cancer, a low MPV appears to be associated with a poor prognosis. In a retrospective analysis of 236 patients with esophageal cancer, those who had an MPV of 7.4 fL or less had significantly shorter overall survival than patients with an MPV higher than 7.4 fL.10
A low MPV has also been associated with an increased risk of venous thromoboembolism in patients with cancer. In a prospective observational cohort study of 1,544 patients, the 2-year probability of venous thromboembolism was 9% in patients with an MPV less than 10.8 fL, compared with 5.5% in those with higher MPV values. The 2-year overall survival rate was also higher in patients with high MPV than in those with low MPV, at 64.7% vs 55.7%, respectively (P = .001).11
But the MPV is far from a perfect clinical metric. Since its measurement is subject to significant laboratory variation, an abnormal value should always be confirmed with evaluation of a peripheral blood smear. Furthermore, it is unclear why a high MPV portends poor prognosis in patients without cancer, whereas the opposite is true in patients with cancer. Therefore, its role in prognostication remains investigational, and further studies are essential to determine its appropriate usefulness in clinical practice.12
NUCLEATED RED BLOOD CELL COUNT
NRBCs are immature red blood cell precursors not present in the circulation of healthy adults. During erythropoiesis, the common myeloid progenitor cell first differentiates into a proerythroblast; subsequently, the chromatin in the nucleus of the proerythroblast gradually condenses until it becomes an orthochromatic erythroblast, also known as a nucleated red cell (Figure 2). Once the nucleus is expelled, the cell is known as a reticulocyte, which ultimately becomes a mature erythrocyte.
Healthy newborns have circulating NRBCs that rapidly disappear within a few weeks of birth. However, NRBCs can return to the circulation in a variety of disease states.
Causes of NRBCs
Brisk hemolysis or rapid blood loss can cause NRBCs to be released into the blood as erythropoiesis increases in an attempt to compensate for acute anemia.
Damage or stress to the bone marrow also causes NRBCs to be released into the peripheral blood, as is often the case in hematologic diseases. In a study of 478 patients with hematologic diseases, the frequency of NRBC positivity at diagnosis was highest in patients with chronic myeloid leukemia (100%), acute leukemia (62%), and myelodysplastic syndromes (45%).13 NRBCs also appeared at higher frequencies during chemotherapy in other hematologic conditions, such as hemophagocytic lymphohistiocytosis.
The mechanism by which NRBCs are expelled from the bone marrow is unclear, though studies have suggested that inflammation or hypoxia or both cause increased hematopoietic stress, resulting in the release of immature red cells. Increased concentrations of inflammatory cytokines (interleukin 6 and interleukin 3) and erythropoietin in the plasma and decreased arterial oxygen partial tension have been reported in patients with circulating NRBCs.14,15
Because they are associated with hematologic disorders, the finding of NRBCs should prompt evaluation of a peripheral smear to assess for abnormalities in other cell lines.
The NRBC count and prognosis
In critically ill patients, peripheral NRBCs can also indicate life-threatening conditions.
In a study of 421 adult intensive care patients, the in-hospital mortality rate was 42% in those with peripheral NRBCs vs 5.9% in those without them.16 Further, the higher the NRBC count and the more days that NRBCs were reported in the CBC, the higher the risk of death.
In adults with acute respiratory distress syndrome, the finding of any NRBCs in the peripheral blood was an independent risk factor for death, and an NRBC count higher than 220 cells/µL was associated with a more than 3-fold higher risk of death.17
Daily screening in patients in surgical intensive care units revealed that NRBCs appeared an average of 9 days before death, consistent with an early marker of impending decline.18
In another study,19 the risk of death within 90 days of hospital discharge was higher in NRBC-positive patients, reaching 21.9% in those who had a count higher than 200 cells/µL. The risk of unplanned hospital readmission within 30 days was also increased.
Leukoerythroblastosis
The combination of NRBCs and immature white blood cells (eg, myelocytes, metamyelocytes) is called leukoerythroblastosis.
Leukoerythroblastosis is classically seen in myelophthisic anemias in which hematopoietic cells in the marrow are displaced by fibrosis, tumor, or other space-occupying processes, but it can also occur in any situation of acute marrow stress, including critical illness.
In addition, leukoerythroblastosis appears in a rare complication of sickle cell hemoglobinopathies: bone marrow necrosis with fat embolism syndrome.20,21 As the marrow necroses, fat emboli are released in the systemic circulation causing micro- and macrovascular occlusions and multiorgan failure. The largest case series in the literature reports 58 patients with bone marrow necrosis with fat embolism syndrome.22
At our institution, we have seen 18 patients with this condition in the past 8 years, with the frequency of diagnosis increasing with heightened awareness of the disorder. We have found that leukoerythroblastosis is often an early marker of this unrecognized syndrome and can prompt emergency red cell exchange, which is considered to be lifesaving in this condition.22
These examples and many others show that the presence of NRBCs in the CBC can serve as an important clinical warning.
OLD TESTS CAN STILL BE USEFUL
The CBC provides much more than simple cell counts; it is a rich collection of information related to each blood cell. These days, with new diagnostic tests and prognostic tools based on molecular analysis, it is important to not overlook the value of the tests clinicians have been ordering for generations.
The RDW, MPV, and NRBC count will not likely provide definitive or flawless diagnostic or prognostic information, but when understood and used correctly, they provide readily available, cost-effective, and useful data that can supplement and guide clinical decision-making. By understanding the CBC more fully, providers can maximize the truly complete nature of this routine laboratory test.
- Lima CS, Reis AR, Grotto HZ, Saad ST, Costa FF. Comparison of red cell distribution width and a red cell discriminant function incorporating volume dispersion for distinguishing iron deficiency from beta thalassemia trait in patients with microcytosis. Sao Paulo Med J 1996; 114(5):1265–1269. pmid:9239926
- Perlstein TS, Weuve J, Pfeffer MA, Beckman JA. Red blood cell distribution width and mortality risk in a community-based prospective cohort. Arch Intern Med 2009; 169(6):588–594. doi:10.1001/archinternmed.2009.55
- Felker GM, Allen LA, Pocock SJ, et al; CHARM Investigators. Red cell distribution width as a novel prognostic marker in heart failure: data from the CHARM Program and the Duke Databank. J Am Coll Cardiol 2007; 50(1):40–47. doi:10.1016/j.jacc.2007.02.067
- Tonelli M, Sacks F, Arnold M, Moye L, Davis B, Pfeffer M; for the Cholesterol and Recurrent Events (CARE) Trial Investigators. Relation between red blood cell distribution width and cardiovascular event rate in people with coronary disease. Circulation 2008; 117(2):163–168. doi:10.1161/CIRCULATIONAHA.107.727545
- Goldstein MR, Mascitelli L, Pezzetta F. Is red cell distribution width a marker of overall membrane integrity? [Letter] Arch Intern Med 2009; 169(16):1539–1540. doi:10.1001/archinternmed.2009.275
- Sansanaydhu N, Numthavaj P, Muntham D, et al. Prognostic effect of mean platelet volume in patients with coronary artery disease. A systematic review and meta-analysis. Thromb Haemost 2015; 114(6):1299–1309. doi:10.1160/TH15-04-0280
- Taskesen T, Sekhon H, Wroblewski I, et al. Usefulness of mean platelet volume to predict significant coronary artery disease in patients with non-ST-elevation acute coronary syndromes. Am J Cardiol 2017; 119(2):192–196. doi:10.1016/j.amjcard.2016.09.042
- Dai Z, Gao J, Li S, et al. Mean platelet volume as a predictor for restenosis after carotid angioplasty and stenting. Stroke 2018; 49(4):872–876. doi:10.1161/STROKEAHA.117.019748
- Papanas N, Symeonidis G, Maltezos E, et al. Mean platelet volume in patients with type 2 diabetes mellitus. Platelets 2004; 15(8):475–478. doi:10.1080/0953710042000267707
- Shen W, Cui MM, Wang X, Wang RT. Reduced mean platelet volume is associated with poor prognosis in esophageal cancer. Cancer Biomark 2018; 22(3):559–563. doi:10.3233/CBM-181231
- Riedl J, Kaider A, Reitter EM, et al. Association of mean platelet volume with risk of venous thromboembolism and mortality in patients with cancer. Results from the Vienna Cancer and Thrombosis Study (CATS). Thromb Haemost 2014; 111(4):670–678. doi:10.1160/TH13-07-0603
- Tsiara S, Elisaf M, Jagroop IA, Mikhailidis DP. Platelets as predictors of vascular risk: is there a practical index of platelet activity? Clin Appl Thromb Hemost 2003; 9(3):177–190. pmid:14507105
- Danise P, Maconi M, Barrella F, et al. Evaluation of nucleated red blood cells in the peripheral blood of hematological diseases. Clin Chem Lab Med 2011; 50(2):357–360. doi:10.1515/CCLM.2011.766
- Stachon A, Bolulul O, Holland-Letz T, Krieg M. Association between nucleated red blood cells in blood and the levels of erythropoietin, interleukin 3, interleukin 6, and interleukin 12p70. Shock 2005; 24(1):34–39. pmid:15988318
- Kuert S, Holland-Letz T, Friese J, Stachon A. Association of nucleated red blood cells in blood and arterial oxygen partial tension. Clin Chem Lab Med 2011; 49(2):257–263. doi:10.1515/CCLM.2011.041
- Stachon A, Holland-Letz T, Krieg M. In-hospital mortality of intensive care patients with nucleated red blood cells in blood. Clin Chem Lab Med 2004; 42(8):933–938. doi:10.1515/CCLM.2004.151
- Menk M, Giebelhäuser L, Vorderwülbecke G, et al. Nucleated red blood cells as predictors of mortality in patients with acute respiratory distress syndrome (ARDS): an observational study. Ann Intensive Care 2018; 8(1):42. doi:10.1186/s13613-018-0387-5
- Stachon A, Kempf R, Holland-Letz T, Friese J, Becker A, Krieg M. Daily monitoring of nucleated red blood cells in the blood of surgical intensive care patients. Clin Chim Acta 2006; 366(1–2):329–335. doi:10.1016/j.cca.2005.11.022
- Purtle SW, Horkan CM, Moromizato T, Gibbons FK, Christopher KB. Nucleated red blood cells, critical illness survivors and postdischarge outcomes: a cohort study. Crit Care 2017; 21(1):154. doi:10.1186/s13054-017-1724-z
- May J, Sullivan JC, LaVie D, LaVie K, Marques MB. Inside out: bone marrow necrosis and fat embolism complicating sickle-beta+ thalassemia. Am J Med 2016; 129(12):e321–e324. doi:10.1016/j.amjmed.2016.05.027
- Gangaraju R, Reddy VV, Marques MB. Fat embolism syndrome secondary to bone marrow necrosis in patients with hemoglobinopathies. South Med J 2016; 109(9):549–553. doi:10.14423/SMJ.0000000000000520
- Tsitsikas DA, Gallinella G, Patel S, Seligman H, Greaves P, Amos RJ. Bone marrow necrosis and fat embolism syndrome in sickle cell disease: increased susceptibility of patients with non-SS genotypes and a possible association with human parvovirus B19 infection. Blood Rev 2014; 28(1):23–30. doi:10.1016/j.blre.2013.12.002
KEY POINTS
- The RDW can help differentiate the cause of anemia: eg, a high RDW suggests iron-deficiency anemia, while a normal RDW suggests thalassemia. Studies also suggest that a high RDW may be associated with an increased rate of all-cause mortality and may predict a poor prognosis in several cardiac diseases.
- The MPV can be used in the evaluation of thrombocytopenia. Furthermore, emerging evidence suggests that high MPV is associated with worse outcomes in cardiovascular disorders.
- An elevated NRBC count may predict poor outcomes in a number of critical care settings. It can also indicate a serious underlying hematologic disorder.

Assessing liver fibrosis without biopsy in patients with HCV or NAFLD
Staging of liver fibrosis, important for determining prognosis in patients with chronic liver disease and for the need to start screening for complications of cirrhosis, was traditionally done only by liver biopsy. While biopsy is still the gold standard method to stage fibrosis, noninvasive methods have been developed that can also assess disease severity.
This article briefly reviews the epidemiology and physiology of chronic liver disease and the traditional role of liver biopsy. Pros and cons of alternative fibrosis assessment methods are discussed, with a focus on their utility for patients with nonalcoholic fatty liver disease (NAFLD) and hepatitis C virus (HCV) infection.
CHRONIC LIVER DISEASE: A HUGE HEALTH BURDEN
Chronic liver disease is associated with enormous health and financial costs in the United States. Its prevalence is about 15%,1 and it is the 12th leading cause of death.2 Hospital costs are estimated at about $4 billion annually.3
The most common causes of chronic liver disease are NAFLD (which may be present in up to one-third of the US population and is increasing with the epidemic of obesity), its aggressive variant, nonalcoholic steatohepatitis (NASH) (present in about 3% of the population), and HCV infection (1%).4,5
Since direct-acting antiviral agents were introduced, HCV infection dropped from being the leading cause of liver transplant to third place.6 But at the same time, the number of patients on the transplant waiting list who have NASH has risen faster than for any other cause of chronic liver disease.7
FIBROSIS: A KEY INDICATOR OF DISEASE SEVERITY


In HCV infection, advanced fibrosis is defined as either stage 4 to 6 using the Ishak system10 or stage 3 to 4 using the Meta-analysis of Histological Data in Viral Hepatitis (METAVIR) system.11
In NAFLD, advanced fibrosis is defined as stage 3 to 4 using the NASH Clinical Research Network system.12
Staging fibrosis is also important so that patients with cirrhosis can be identified early to begin screening for hepatocellular carcinoma and esophageal varices to reduce the risks of illness and death. In addition, insurance companies often require documentation of fibrosis stage before treating HCV with the new direct-acting antiviral agents.
LIVER BIOPSY IS STILL THE GOLD STANDARD
Although invasive, liver biopsy remains the gold standard for determining fibrosis stage. Liver biopsies were performed “blindly” (without imaging) until the 1990s, but imaging-guided biopsy using ultrasonography was then developed, which entailed less pain and lower complication and hospitalization rates. Slightly more hepatic tissue is obtained with guided liver biopsy, but the difference was deemed clinically insignificant.13 Concern initially arose about the added cost involved with imaging, but imaging-guided biopsy was actually found to be more cost-effective.14
In the 2000s, transjugular liver biopsy via the right internal jugular vein became available. This method was originally used primarily in patients with ascites or significant coagulopathy. At first, there were concerns about the adequacy of specimens obtained to make an accurate diagnosis or establish fibrosis stage, but this limitation was overcome with improved techniques.15,16 Transjugular liver biopsy has the additional advantage of enabling one to measure the hepatic venous pressure gradient, which also has prognostic significance; a gradient greater than 10 mm Hg is associated with worse prognosis.17
Disadvantages of biopsy: Complications, sampling errors
Liver biopsy has disadvantages. Reported rates of complications necessitating hospitalization using the blind method were as high as 6% in the 1970s,18 dropping to 3.2% in a 1993 study.19 Bleeding remains the most worrisome complication. With the transjugular method, major and minor complication rates are less than 1% and 7%, respectively.15,16 Complication rates with imaging-guided biopsy are also low.
Liver biopsy is also prone to sampling error. The number of portal tracts obtained in the biopsy correlates with the accuracy of fibrosis staging, and smaller samples may lead to underestimating fibrosis stage. In patients with HCV, samples more than 15 mm long led to accurate staging diagnosis in 65% of patients, and those longer than 25 mm conferred 75% accuracy.20 Also, different stages can be diagnosed from samples obtained from separate locations in the liver, although rarely is the difference more than a single stage.21
Histologic evaluation of liver biopsies is operator-dependent. Although significant interobserver variation has been reported for degree of inflammation, there tends to be good concordance for fibrosis staging.22,23
STAGING BASED ON DEMOGRAPHIC AND LABORATORY VARIABLES
Several scores based on patient characteristics and laboratory values have been developed for assessing liver fibrosis and have been specifically validated for HCV infection, NAFLD, or both. They can serve as inexpensive initial screening tests for the presence or absence of advanced fibrosis.
FIB-4 index for HCV, NAFLD
The FIB-4 index predicts the presence of advanced fibrosis using, as its name indicates, a combination of 4 factors in fibrosis: age, platelet count, and the levels of aspartate aminotransferase (AST) and alanine aminotransferase (ALT), according to the formula:
FIB-4 index = (age × AST [U/L]) /
(platelet count [× 109/L] × √ALT [U/L]).
The index was derived from data from 832 patients co-infected with HCV and human immunodeficiency virus.24 The Ishak staging system10 for fibrosis on liver biopsy was used for confirmation, with stage 4 to 6 defined as advanced fibrosis. A cutoff value of more than 3.25 had a positive predictive value of 65% for advanced fibrosis, and to exclude advanced fibrosis, a cutoff value of less than 1.45 had a negative predictive value of 90%.
The FIB-4 index has since been validated in patients with HCV infection25 and NAFLD.26 In a subsequent study in 142 patients with NAFLD, the FIB-4 index was more accurate in diagnosing advanced fibrosis than the other noninvasive prediction models discussed below.27
NAFLD fibrosis score
The NAFLD fibrosis score, constructed and validated only in patients with biopsy-confirmed NAFLD, incorporates age, body mass index, presence of diabetes or prediabetes, albumin level, platelet count, and AST and ALT levels.
A group of 480 patients was used to construct the score, and 253 patients were used to validate it. Using the high cutoff value of 0.676, the presence of advanced fibrosis was diagnosed with a positive predictive value of 90% in the group used to construct the model (82% in the validation group). Using the low cutoff score of –1.455, advanced fibrosis could be excluded with a negative predictive value of 93% in the construction group and 88% in the validation group.28 A score between the cutoff values merits liver biopsy to determine fibrosis stage. The score is more accurate in patients with diabetes.29 When used by primary care physicians, the NAFLD fibrosis score is more cost-effective than transient elastography and liver biopsy for accurately predicting advanced fibrosis.30
AST-to-platelet ratio index score for HCV, NAFLD
The AST-to-platelet ratio index (APRI) score was developed in 2003 using a cohort of 270 patients with HCV and liver biopsy as the standard. A cutoff value of less than or equal to 0.5 had a negative predictive value of 86% for the absence of significant fibrosis, while a score of more than 1.5 detected the presence of significant fibrosis with a positive predictive value of 88%.31 The APRI score was subsequently validated for NAFLD.27,32
FibroSure uses a patented formula
FibroSure (LabCorp; labcorp.com) uses a patented mathematical formula that takes into account age, sex, and levels of gamma-glutamyl transferase, total bilirubin, haptoglobin, apolipoprotein-A, and alpha-2 macroglobulin to assess fibrosis. Developed in 2001 for use in patients with HCV infection, it was reported to have a positive predictive value of greater than 90% and a negative predictive value of 100% for clinically significant fibrosis, defined as stage 2 to 4 based on the METAVIR staging system in the prediction model.33 The use of FibroSure in patients with HCV was subsequently validated in various meta-analyses and systematic reviews.34,35 It is less accurate in patients with normal ALT levels.36
FibroSure also has good accuracy for predicting fibrosis stage in chronic liver disease due to other causes, including NAFLD.37
The prediction models discussed above use routine laboratory tests for chronic liver disease and thus are inexpensive. The high cost of additional testing needed for FibroSure, coupled with the risk of misdiagnosis, makes its cost-effectiveness questionable.38
IMAGING TO PREDICT FIBROSIS STAGE
Conventional ultrasonography (with or without vascular imaging) and computed tomography can detect cirrhosis on the basis of certain imaging characteristics,39,40 including the nodular contour of the liver, caudate lobe hypertrophy, ascites, reversal of blood flow in the portal vein, and splenomegaly. However, they cannot detect fibrosis in its early stages.
The 3 methods discussed below provide more accurate fibrosis staging by measuring the velocity of shear waves sent across hepatic tissue. Because shear-wave velocity increases with liver stiffness, the fibrosis stage can be estimated from this information.41
Transient elastography
Transient elastography uses a special ultrasound transducer. It is highly accurate for predicting advanced fibrosis for almost all causes of chronic liver disease, including HCV infection42,43 and NAFLD.44 The cutoff values of wave velocity to estimate fibrosis stage differ by liver disease etiology.
Transient elastography should not be used to evaluate fibrosis in patients with acute hepatitis, which transiently increases liver stiffness, resulting in a falsely high fibrosis stage diagnosis.45 It is also not a good method for evaluating fibrosis in patients with biliary obstruction or extrahepatic venous congestion. Because liver stiffness can increase after eating,46 the test should be done under fasting conditions.
A significant limitation of transient elastography has been its poor accuracy in patients with obesity.47 This has been largely overcome with the use of a more powerful (XL) probe but is still a limitation for those with morbid obesity.48 Because many patients with NAFLD are obese, this limitation can be significant.
Transient elastography has gained popularity for evaluating fibrosis in patients with chronic liver disease for multiple reasons: it is cost-effective and results are highly reproducible, with low variation in results among different observers and in individual observers.49 Combined with a platelet count, it can also be used to detect the development of clinically significant portal hypertension in patients with cirrhosis, thus determining the need to screen for esophageal varices using endoscopy.50 Screening endoscopy can be avoided in patients whose liver stiffness remains below 20 kPa or whose platelet count is above 150 × 109/L.
Acoustic radiation force imaging
Unlike transient elastography, which requires a separate transducer probe to assess shear- wave velocity, acoustic radiation force imaging uses the same transducer for both this function and imaging. Different image modes are available when testing for liver stiffness, so a region of interest that is optimal for avoiding vascular structures or masses can be selected, increasing accuracy.51
Acoustic radiation force imaging has been tested in different causes of chronic liver disease, including HCV and NAFLD,52 with accuracy similar to that of transient elastography.53 For overweight and obese patients, acoustic radiation force imaging is more accurate than transient elastography using the XL probe.54 However, this method is still new, and we need more data to support using one method over the other.
Magnetic resonance elastography
Magnetic resonance elastography uses a special transducer placed under the rib cage to transmit shear waves concurrently with magnetic resonance imaging. It has been tested in patients with HCV and NAFLD and has been found to have better diagnostic accuracy than transient elastography and acoustic radiation force imaging.55,56 Patients must be fasting for better diagnostic accuracy57 and must hold their breath while elastography is performed. The need for breath-holding and the high cost limit the use of this method for assessing fibrosis.
BOTTOM LINE FOR ASSESSING FIBROSIS

- Younossi ZM, Stepanova M, Afendy M, et al. Changes in the prevalence of the most common causes of chronic liver diseases in the United States from 1988 to 2008. Clin Gastroenterol Hepatol 2011; 9(6):524–530.e1. doi:10.1016/j.cgh.2011.03.020
- Kochanek KD, Xu J, Murphy SL, Miniño AM, Kung H-C. Deaths: final data for 2009. Natl Vital Stat Rep 2011; 60(3):1–116. pmid:24974587
- Volk ML, Tocco RS, Bazick J, Rakoski MO, Lok AS. Hospital readmissions among patients with decompensated cirrhosis. Am J Gastroenterol 2012; 107(2):247–252. doi:10.1038/ajg.2011.314
- Vernon G, Baranova A, Younossi ZM. Systematic review: the epidemiology and natural history of non-alcoholic fatty liver disease and non-alcoholic steatohepatitis in adults. Aliment Pharmacol Ther 2011; 34(3):274–285. doi:10.1111/j.1365-2036.2011.04724.x
- Udompap P, Kim D, Kim WR. Current and future burden of chronic nonmalignant liver disease. Clin Gastroenterol Hepatol 2015; 13(12):2031–2041. doi:10.1016/j.cgh.2015.08.015
- Kim WR, Lake JR, Smith JM, et al. OPTN/SRTR 2016 annual data report: liver. Am J Transplant 2018; 18(suppl 1):172–253. doi:10.1111/ajt.14559
- Wong RJ, Aguilar M, Cheung R, et al. Nonalcoholic steatohepatitis is the second leading etiology of liver disease among adults awaiting liver transplantation in the United States. Gastroenterology 2015; 148(3):547–555. doi:10.1053/j.gastro.2014.11.039
- Ishak K, Baptista A, Bianchi L, et al. Histological grading and staging of chronic hepatitis. J Hepatol 1995; 22(6):696–699. pmid:7560864
- Bedossa P, Poynard T. An algorithm for the grading of activity in chronic hepatitis C. Hepatology 1996; 24(2):289–293. doi:10.1002/hep.510240201
- Kleiner DE, Brunt EM, Van Natta M, et al; Nonalcoholic Steatohepatitis Clinical Research Network. Design and validation of a histological scoring system for nonalcoholic fatty liver disease. Hepatology 2005; 41(6):1313–1321. doi:10.1002/hep.20701
- Everhart JE, Wright EC, Goodman ZD, et al; HALT-C Trial Group. Prognostic value of Ishak fibrosis stage: findings from the hepatitis C antiviral long-term treatment against cirrhosis trial. Hepatology 2010; 51(2):585–594. doi:10.1002/hep.23315
- Angulo P, Kleiner DE, Dam-Larsen S, et al. Liver fibrosis, but no other histologic features, is associated with long-term outcomes of patients with nonalcoholic fatty liver disease. Gastroenterology 2015; 149(2):389–397.e10. doi:10.1053/j.gastro.2015.04.043
- Lindor KD, Bru C, Jorgensen RA, et al. The role of ultrasonography and automatic-needle biopsy in outpatient percutaneous liver biopsy. Hepatology 1996; 23(5):1079–1083. doi:10.1002/hep.510230522
- Pasha T, Gabriel S, Therneau T, Dickson ER, Lindor KD. Cost-effectiveness of ultrasound-guided liver biopsy. Hepatology 1998; 27(5):1220–1226. doi:10.1002/hep.510270506
- Alessandria C, Debernardi-Venon W, Rizzetto M, Marzano A. Transjugular liver biopsy: a relatively simple procedure with an indefinite past and an expected brilliant future. J Hepatol 2008; 48(1):171–173. doi:10.1016/j.jhep.2007.10.001
- Kalambokis G, Manousou P, Vibhakorn S, et al. Transjugular liver biopsy—indications, adequacy, quality of specimens, and complications—a systematic review. J Hepatol 2007; 47(2):284–294. doi:10.1016/j.jhep.2007.05.001
- Ripoll C, Groszmann R, Garcia-Tsao G, et al; Portal Hypertension Collaborative Group. Hepatic venous pressure gradient predicts clinical decompensation in patients with compensated cirrhosis. Gastroenterology 2007; 133(2):481–488. doi:10.1053/j.gastro.2007.05.024
- Perrault J, McGill DB, Ott BJ, Taylor WF. Liver biopsy: complications in 1000 inpatients and outpatients. Gastroenterology 1978; 74(1):103–106. pmid:618417
- Janes CH, Lindor KD. Outcome of patients hospitalized for complications after outpatient liver biopsy. Ann Intern Med 1993; 118(2):96–98. pmid:8416324
- Bedossa P, Dargere D, Paradis V. Sampling variability of liver fibrosis in chronic hepatitis C. Hepatology 2003; 38(6):1449–1457. doi:10.1016/j.hep.2003.09.022
- Regev A, Berho M, Jeffers LJ, et al. Sampling error and intraobserver variation in liver biopsy in patients with chronic HCV infection. Am J Gastroenterol 2002; 97(10):2614–2618. doi:10.1111/j.1572-0241.2002.06038.x
- Goldin RD, Goldin JG, Burt AD, et al. Intra-observer and inter-observer variation in the histopathological assessment of chronic viral hepatitis. J Hepatol 1996; 25(5):649–654. pmid:8938541
- Intraobserver and interobserver variations in liver biopsy interpretation in patients with chronic hepatitis C. The French METAVIR Cooperative Study Group. Hepatology 1994; 20(1 Pt 1):15–20. pmid:8020885
- Sterling RK, Lissen E, Clumeck N, et al; APRICOT Clinical Investigators. Development of a simple noninvasive index to predict significant fibrosis in patients with HIV/HCV coinfection. Hepatology 2006; 43(6):1317–1325. doi:10.1002/hep.21178
- Vallet-Pichard A, Mallet V, Nalpas B, et al. FIB-4: an inexpensive and accurate marker of fibrosis in HCV infection. comparison with liver biopsy and fibrotest. Hepatology 2007; 46(1):32–36. doi:10.1002/hep.21669
- Shah AG, Lydecker A, Murray K, Tetri BN, Contos MJ, Sanyal AJ; Nash Clinical Research Network. Comparison of noninvasive markers of fibrosis in patients with nonalcoholic fatty liver disease. Clin Gastroenterol Hepatol 2009; 7(10):1104–1112. doi:10.1016/j.cgh.2009.05.033
- McPherson S, Stewart SF, Henderson E, Burt AD, Day CP. Simple non-invasive fibrosis scoring systems can reliably exclude advanced fibrosis in patients with non-alcoholic fatty liver disease. Gut 2010; 59(9):1265–1269. doi:10.1136/gut.2010.216077
- Angulo P, Hui JM, Marchesini G, et al. The NAFLD fibrosis score: A noninvasive system that identifies liver fibrosis in patients with NAFLD. Hepatology 2007; 45(4):846–854. doi:10.1002/hep.21496
- Goh GB, Pagadala MR, Dasarathy J, et al. Clinical spectrum of non-alcoholic fatty liver disease in diabetic and non-diabetic patients. BBA Clin 2015; 3:141–145. doi:10.1016/j.bbacli.2014.09.001
- Tapper EB, Hunink MG, Afdhal NH, Lai M, Sengupta N. Cost-effectiveness analysis: risk stratification of nonalcoholic fatty liver disease (NAFLD) by the primary care physician using the NAFLD fibrosis score. PLoS One 2016; 11(2):e0147237. doi:10.1371/journal.pone.0147237
- Wai CT, Greenson JK, Fontana RJ, et al. A simple noninvasive index can predict both significant fibrosis and cirrhosis in patients with chronic hepatitis C. Hepatology 2003; 38(2):518–526. doi:10.1053/jhep.2003.50346
- Calès P, Lainé F, Boursier J, et al. Comparison of blood tests for liver fibrosis specific or not to NAFLD. J Hepatol 2009; 50(1):165–173. doi:10.1016/j.jhep.2008.07.035
- Imbert-Bismut F, Ratziu V, Pieroni L, Charlotte F, Benhamou Y, Poynard T; MULTIVIRC Group. Biochemical markers of liver fibrosis in patients with hepatitis C virus infection: a prospective study. Lancet 2001; 357(9262):1069–1075. doi:10.1016/S0140-6736(00)04258-6
- Shaheen AA, Wan AF, Myers RP. FibroTest and FibroScan for the prediction of hepatitis C-related fibrosis: a systematic review of diagnostic test accuracy. Am J Gastroenterol 2007; 102(11):2589–2600. doi:10.1111/j.1572-0241.2007.01466.x
- Smith JO, Sterling RK. Systematic review: non-invasive methods of fibrosis analysis in chronic hepatitis C. Aliment Pharmacol Ther 2009; 30(6):557–576. doi:10.1111/j.1365-2036.2009.04062.x
- Sebastiani G, Vario A, Guido M, Alberti A. Performance of noninvasive markers for liver fibrosis is reduced in chronic hepatitis C with normal transaminases. J Viral Hepat 2007; 15(3):212–218. doi:10.1111/j.1365-2893.2007.00932.x
- Poynard T, Morra R, Halfon P, et al. Meta-analyses of FibroTest diagnostic value in chronic liver disease. BMC Gastroenterol 2007; 7:40. doi:10.1186/1471-230X-7-40
- Carlson JJ, Kowdley KV, Sullivan SD, Ramsey SD, Veenstra DL. An evaluation of the potential cost-effectiveness of non-invasive testing strategies in the diagnosis of significant liver fibrosis. J Gastroenterol Hepatol 2009; 24(5):786–791. doi:10.1111/j.1440-1746.2009.05778.x
- Aubé C, Oberti F, Korali N, et al. Ultrasonographic diagnosis of hepatic fibrosis or cirrhosis. J Hepatol 1999; 30(3):472–478. pmid:10190731
- Di Lelio A, Cestari C, Lomazzi A, Beretta L. Cirrhosis: diagnosis with sonographic study of the liver surface. Radiology 1989; 172(2):389–392. doi:10.1148/radiology.172.2.2526349
- Wong VW, Chan HL. Transient elastography. J Gastroenterol Hepatol 2010; 25(11):1726–1731. doi:10.1111/j.1440-1746.2010.06437.x
- Arena U, Vizzutti F, Abraldes JG, et al. Reliability of transient elastography for the diagnosis of advanced fibrosis in chronic hepatitis C. Gut 2008; 57(9):1288–1293. doi:10.1136/gut.2008.149708
- Ziol M, Handra-Luca A, Kettaneh A, et al. Noninvasive assessment of liver fibrosis by measurement of stiffness in patients with chronic hepatitis C. Hepatology 2005; 41(1):48–54. doi:10.1002/hep.20506
- Wong VW, Vergniol J, Wong GL, et al. Diagnosis of fibrosis and cirrhosis using liver stiffness measurement in nonalcoholic fatty liver disease. Hepatology 2010; 51(2):454–462. doi:10.1002/hep.23312
- Sagir A, Erhardt A, Schmitt M, Häussinger D. Transient elastography is unreliable for detection of cirrhosis in patients with acute liver damage. Hepatology 2007; 48(2):592–595. doi:10.1002/hep.22056
- Mederacke I, Wursthorn K, Kirschner J, et al. Food intake increases liver stiffness in patients with chronic or resolved hepatitis C virus infection. Liver Int 2009; 29(10):1500–1506. doi:10.1111/j.1478-3231.2009.02100.x
- Castéra L, Foucher J, Bernard PH, et al. Pitfalls of liver stiffness measurement: a 5-year prospective study of 13,369 examinations. Hepatology 2010; 51(3):828–835. doi:10.1002/hep.23425
- Wong VW, Vergniol J, Wong GL, et al. Liver stiffness measurement using XL probe in patients with nonalcoholic fatty liver disease. Am J Gastroenterol 2012; 107(12):1862–1871. doi:10.1038/ajg.2012.331
- Fraquelli M, Rigamonti C, Casazza G, et al. Reproducibility of transient elastography in the evaluation of liver fibrosis in patients with chronic liver disease. Gut 2007; 56(7):968–973. doi:10.1136/gut.2006.111302
- de Franchis R; Baveno VI Faculty. Expanding consensus in portal hypertension: report of the Baveno VI Consensus Workshop: stratifying risk and individualizing care for portal hypertension. J Hepatol 2015; 63(3):743–752. doi:10.1016/j.jhep.2015.05.022
- Friedrich-Rust M, Wunder K, Kriener S, et al. Liver fibrosis in viral hepatitis: noninvasive assessment with acoustic radiation force impulse imaging versus transient elastography. Radiology 2009; 252(2):595–604. doi:10.1148/radiol.2523081928
- Yoneda M, Suzuki K, Kato S, et al. Nonalcoholic fatty liver disease: US-based acoustic radiation force impulse elastography. Radiology 2010; 256(2):640–647. doi:10.1148/radiol.10091662
- Bota S, Herkner H, Sporea I, et al. Meta-analysis: ARFI elastography versus transient elastography for the evaluation of liver fibrosis. Liver Int 2013; 33(8):1138–1147. doi:10.1111/liv.12240
- Attia D, Bantel H, Lenzen H, Manns MP, Gebel MJ, Potthoff A. Liver stiffness measurement using acoustic radiation force impulse elastography in overweight and obese patients. Aliment Pharmacol Ther 2016; 44(4):366–379. doi:10.1111/apt.13710
- Cui J, Heba E, Hernandez C, et al. Magnetic resonance elastography is superior to acoustic radiation force impulse for the diagnosis of fibrosis in patients with biopsy-proven nonalcoholic fatty liver disease: a prospective study. Hepatology 2016; 63(2):453–461. doi:10.1002/hep.28337
- Huwart L, Sempoux C, Vicaut E, et al. Magnetic resonance elastography for the noninvasive staging of liver fibrosis. Gastroenterology 2008; 135(1):32–40. doi:10.1053/j.gastro.2008.03.076
- Jajamovich GH, Dyvorne H, Donnerhack C, Taouli B. Quantitative liver MRI combining phase contrast imaging, elastography, and DWI: assessment of reproducibility and postprandial effect at 3.0 T. PLoS One 2014; 9(5):e97355. doi:10.1371/journal.pone.0097355
- Lim JK, Flamm SL, Singh S, Falck-Ytter YT; Clinical Guidelines Committee of the American Gastroenterological Association. American Gastroenterological Association Institute guideline on the role of elastography in the evaluation of liver fibrosis. Gastroenterology 2017; 152(6):1536–1543. doi:10.1053/j.gastro.2017.03.017
- N, Feldstein AE. Noninvasive diagnosis of nonalcoholic fatty liver disease: are we there yet? Metabolism 2016; 65(8):1087–1095. doi:10.1016/j.metabol.2016.01.013
Staging of liver fibrosis, important for determining prognosis in patients with chronic liver disease and for the need to start screening for complications of cirrhosis, was traditionally done only by liver biopsy. While biopsy is still the gold standard method to stage fibrosis, noninvasive methods have been developed that can also assess disease severity.
This article briefly reviews the epidemiology and physiology of chronic liver disease and the traditional role of liver biopsy. Pros and cons of alternative fibrosis assessment methods are discussed, with a focus on their utility for patients with nonalcoholic fatty liver disease (NAFLD) and hepatitis C virus (HCV) infection.
CHRONIC LIVER DISEASE: A HUGE HEALTH BURDEN
Chronic liver disease is associated with enormous health and financial costs in the United States. Its prevalence is about 15%,1 and it is the 12th leading cause of death.2 Hospital costs are estimated at about $4 billion annually.3
The most common causes of chronic liver disease are NAFLD (which may be present in up to one-third of the US population and is increasing with the epidemic of obesity), its aggressive variant, nonalcoholic steatohepatitis (NASH) (present in about 3% of the population), and HCV infection (1%).4,5
Since direct-acting antiviral agents were introduced, HCV infection dropped from being the leading cause of liver transplant to third place.6 But at the same time, the number of patients on the transplant waiting list who have NASH has risen faster than for any other cause of chronic liver disease.7
FIBROSIS: A KEY INDICATOR OF DISEASE SEVERITY
In HCV infection, advanced fibrosis is defined as either stage 4 to 6 using the Ishak system10 or stage 3 to 4 using the Meta-analysis of Histological Data in Viral Hepatitis (METAVIR) system.11
In NAFLD, advanced fibrosis is defined as stage 3 to 4 using the NASH Clinical Research Network system.12
Staging fibrosis is also important so that patients with cirrhosis can be identified early to begin screening for hepatocellular carcinoma and esophageal varices to reduce the risks of illness and death. In addition, insurance companies often require documentation of fibrosis stage before treating HCV with the new direct-acting antiviral agents.
LIVER BIOPSY IS STILL THE GOLD STANDARD
Although invasive, liver biopsy remains the gold standard for determining fibrosis stage. Liver biopsies were performed “blindly” (without imaging) until the 1990s, but imaging-guided biopsy using ultrasonography was then developed, which entailed less pain and lower complication and hospitalization rates. Slightly more hepatic tissue is obtained with guided liver biopsy, but the difference was deemed clinically insignificant.13 Concern initially arose about the added cost involved with imaging, but imaging-guided biopsy was actually found to be more cost-effective.14
In the 2000s, transjugular liver biopsy via the right internal jugular vein became available. This method was originally used primarily in patients with ascites or significant coagulopathy. At first, there were concerns about the adequacy of specimens obtained to make an accurate diagnosis or establish fibrosis stage, but this limitation was overcome with improved techniques.15,16 Transjugular liver biopsy has the additional advantage of enabling one to measure the hepatic venous pressure gradient, which also has prognostic significance; a gradient greater than 10 mm Hg is associated with worse prognosis.17
Disadvantages of biopsy: Complications, sampling errors
Liver biopsy has disadvantages. Reported rates of complications necessitating hospitalization using the blind method were as high as 6% in the 1970s,18 dropping to 3.2% in a 1993 study.19 Bleeding remains the most worrisome complication. With the transjugular method, major and minor complication rates are less than 1% and 7%, respectively.15,16 Complication rates with imaging-guided biopsy are also low.
Liver biopsy is also prone to sampling error. The number of portal tracts obtained in the biopsy correlates with the accuracy of fibrosis staging, and smaller samples may lead to underestimating fibrosis stage. In patients with HCV, samples more than 15 mm long led to accurate staging diagnosis in 65% of patients, and those longer than 25 mm conferred 75% accuracy.20 Also, different stages can be diagnosed from samples obtained from separate locations in the liver, although rarely is the difference more than a single stage.21
Histologic evaluation of liver biopsies is operator-dependent. Although significant interobserver variation has been reported for degree of inflammation, there tends to be good concordance for fibrosis staging.22,23
STAGING BASED ON DEMOGRAPHIC AND LABORATORY VARIABLES
Several scores based on patient characteristics and laboratory values have been developed for assessing liver fibrosis and have been specifically validated for HCV infection, NAFLD, or both. They can serve as inexpensive initial screening tests for the presence or absence of advanced fibrosis.
FIB-4 index for HCV, NAFLD
The FIB-4 index predicts the presence of advanced fibrosis using, as its name indicates, a combination of 4 factors in fibrosis: age, platelet count, and the levels of aspartate aminotransferase (AST) and alanine aminotransferase (ALT), according to the formula:
FIB-4 index = (age × AST [U/L]) /
(platelet count [× 109/L] × √ALT [U/L]).
The index was derived from data from 832 patients co-infected with HCV and human immunodeficiency virus.24 The Ishak staging system10 for fibrosis on liver biopsy was used for confirmation, with stage 4 to 6 defined as advanced fibrosis. A cutoff value of more than 3.25 had a positive predictive value of 65% for advanced fibrosis, and to exclude advanced fibrosis, a cutoff value of less than 1.45 had a negative predictive value of 90%.
The FIB-4 index has since been validated in patients with HCV infection25 and NAFLD.26 In a subsequent study in 142 patients with NAFLD, the FIB-4 index was more accurate in diagnosing advanced fibrosis than the other noninvasive prediction models discussed below.27
NAFLD fibrosis score
The NAFLD fibrosis score, constructed and validated only in patients with biopsy-confirmed NAFLD, incorporates age, body mass index, presence of diabetes or prediabetes, albumin level, platelet count, and AST and ALT levels.
A group of 480 patients was used to construct the score, and 253 patients were used to validate it. Using the high cutoff value of 0.676, the presence of advanced fibrosis was diagnosed with a positive predictive value of 90% in the group used to construct the model (82% in the validation group). Using the low cutoff score of –1.455, advanced fibrosis could be excluded with a negative predictive value of 93% in the construction group and 88% in the validation group.28 A score between the cutoff values merits liver biopsy to determine fibrosis stage. The score is more accurate in patients with diabetes.29 When used by primary care physicians, the NAFLD fibrosis score is more cost-effective than transient elastography and liver biopsy for accurately predicting advanced fibrosis.30
AST-to-platelet ratio index score for HCV, NAFLD
The AST-to-platelet ratio index (APRI) score was developed in 2003 using a cohort of 270 patients with HCV and liver biopsy as the standard. A cutoff value of less than or equal to 0.5 had a negative predictive value of 86% for the absence of significant fibrosis, while a score of more than 1.5 detected the presence of significant fibrosis with a positive predictive value of 88%.31 The APRI score was subsequently validated for NAFLD.27,32
FibroSure uses a patented formula
FibroSure (LabCorp; labcorp.com) uses a patented mathematical formula that takes into account age, sex, and levels of gamma-glutamyl transferase, total bilirubin, haptoglobin, apolipoprotein-A, and alpha-2 macroglobulin to assess fibrosis. Developed in 2001 for use in patients with HCV infection, it was reported to have a positive predictive value of greater than 90% and a negative predictive value of 100% for clinically significant fibrosis, defined as stage 2 to 4 based on the METAVIR staging system in the prediction model.33 The use of FibroSure in patients with HCV was subsequently validated in various meta-analyses and systematic reviews.34,35 It is less accurate in patients with normal ALT levels.36
FibroSure also has good accuracy for predicting fibrosis stage in chronic liver disease due to other causes, including NAFLD.37
The prediction models discussed above use routine laboratory tests for chronic liver disease and thus are inexpensive. The high cost of additional testing needed for FibroSure, coupled with the risk of misdiagnosis, makes its cost-effectiveness questionable.38
IMAGING TO PREDICT FIBROSIS STAGE
Conventional ultrasonography (with or without vascular imaging) and computed tomography can detect cirrhosis on the basis of certain imaging characteristics,39,40 including the nodular contour of the liver, caudate lobe hypertrophy, ascites, reversal of blood flow in the portal vein, and splenomegaly. However, they cannot detect fibrosis in its early stages.
The 3 methods discussed below provide more accurate fibrosis staging by measuring the velocity of shear waves sent across hepatic tissue. Because shear-wave velocity increases with liver stiffness, the fibrosis stage can be estimated from this information.41
Transient elastography
Transient elastography uses a special ultrasound transducer. It is highly accurate for predicting advanced fibrosis for almost all causes of chronic liver disease, including HCV infection42,43 and NAFLD.44 The cutoff values of wave velocity to estimate fibrosis stage differ by liver disease etiology.
Transient elastography should not be used to evaluate fibrosis in patients with acute hepatitis, which transiently increases liver stiffness, resulting in a falsely high fibrosis stage diagnosis.45 It is also not a good method for evaluating fibrosis in patients with biliary obstruction or extrahepatic venous congestion. Because liver stiffness can increase after eating,46 the test should be done under fasting conditions.
A significant limitation of transient elastography has been its poor accuracy in patients with obesity.47 This has been largely overcome with the use of a more powerful (XL) probe but is still a limitation for those with morbid obesity.48 Because many patients with NAFLD are obese, this limitation can be significant.
Transient elastography has gained popularity for evaluating fibrosis in patients with chronic liver disease for multiple reasons: it is cost-effective and results are highly reproducible, with low variation in results among different observers and in individual observers.49 Combined with a platelet count, it can also be used to detect the development of clinically significant portal hypertension in patients with cirrhosis, thus determining the need to screen for esophageal varices using endoscopy.50 Screening endoscopy can be avoided in patients whose liver stiffness remains below 20 kPa or whose platelet count is above 150 × 109/L.
Acoustic radiation force imaging
Unlike transient elastography, which requires a separate transducer probe to assess shear- wave velocity, acoustic radiation force imaging uses the same transducer for both this function and imaging. Different image modes are available when testing for liver stiffness, so a region of interest that is optimal for avoiding vascular structures or masses can be selected, increasing accuracy.51
Acoustic radiation force imaging has been tested in different causes of chronic liver disease, including HCV and NAFLD,52 with accuracy similar to that of transient elastography.53 For overweight and obese patients, acoustic radiation force imaging is more accurate than transient elastography using the XL probe.54 However, this method is still new, and we need more data to support using one method over the other.
Magnetic resonance elastography
Magnetic resonance elastography uses a special transducer placed under the rib cage to transmit shear waves concurrently with magnetic resonance imaging. It has been tested in patients with HCV and NAFLD and has been found to have better diagnostic accuracy than transient elastography and acoustic radiation force imaging.55,56 Patients must be fasting for better diagnostic accuracy57 and must hold their breath while elastography is performed. The need for breath-holding and the high cost limit the use of this method for assessing fibrosis.
BOTTOM LINE FOR ASSESSING FIBROSIS
- Younossi ZM, Stepanova M, Afendy M, et al. Changes in the prevalence of the most common causes of chronic liver diseases in the United States from 1988 to 2008. Clin Gastroenterol Hepatol 2011; 9(6):524–530.e1. doi:10.1016/j.cgh.2011.03.020
- Kochanek KD, Xu J, Murphy SL, Miniño AM, Kung H-C. Deaths: final data for 2009. Natl Vital Stat Rep 2011; 60(3):1–116. pmid:24974587
- Volk ML, Tocco RS, Bazick J, Rakoski MO, Lok AS. Hospital readmissions among patients with decompensated cirrhosis. Am J Gastroenterol 2012; 107(2):247–252. doi:10.1038/ajg.2011.314
- Vernon G, Baranova A, Younossi ZM. Systematic review: the epidemiology and natural history of non-alcoholic fatty liver disease and non-alcoholic steatohepatitis in adults. Aliment Pharmacol Ther 2011; 34(3):274–285. doi:10.1111/j.1365-2036.2011.04724.x
- Udompap P, Kim D, Kim WR. Current and future burden of chronic nonmalignant liver disease. Clin Gastroenterol Hepatol 2015; 13(12):2031–2041. doi:10.1016/j.cgh.2015.08.015
- Kim WR, Lake JR, Smith JM, et al. OPTN/SRTR 2016 annual data report: liver. Am J Transplant 2018; 18(suppl 1):172–253. doi:10.1111/ajt.14559
- Wong RJ, Aguilar M, Cheung R, et al. Nonalcoholic steatohepatitis is the second leading etiology of liver disease among adults awaiting liver transplantation in the United States. Gastroenterology 2015; 148(3):547–555. doi:10.1053/j.gastro.2014.11.039
- Ishak K, Baptista A, Bianchi L, et al. Histological grading and staging of chronic hepatitis. J Hepatol 1995; 22(6):696–699. pmid:7560864
- Bedossa P, Poynard T. An algorithm for the grading of activity in chronic hepatitis C. Hepatology 1996; 24(2):289–293. doi:10.1002/hep.510240201
- Kleiner DE, Brunt EM, Van Natta M, et al; Nonalcoholic Steatohepatitis Clinical Research Network. Design and validation of a histological scoring system for nonalcoholic fatty liver disease. Hepatology 2005; 41(6):1313–1321. doi:10.1002/hep.20701
- Everhart JE, Wright EC, Goodman ZD, et al; HALT-C Trial Group. Prognostic value of Ishak fibrosis stage: findings from the hepatitis C antiviral long-term treatment against cirrhosis trial. Hepatology 2010; 51(2):585–594. doi:10.1002/hep.23315
- Angulo P, Kleiner DE, Dam-Larsen S, et al. Liver fibrosis, but no other histologic features, is associated with long-term outcomes of patients with nonalcoholic fatty liver disease. Gastroenterology 2015; 149(2):389–397.e10. doi:10.1053/j.gastro.2015.04.043
- Lindor KD, Bru C, Jorgensen RA, et al. The role of ultrasonography and automatic-needle biopsy in outpatient percutaneous liver biopsy. Hepatology 1996; 23(5):1079–1083. doi:10.1002/hep.510230522
- Pasha T, Gabriel S, Therneau T, Dickson ER, Lindor KD. Cost-effectiveness of ultrasound-guided liver biopsy. Hepatology 1998; 27(5):1220–1226. doi:10.1002/hep.510270506
- Alessandria C, Debernardi-Venon W, Rizzetto M, Marzano A. Transjugular liver biopsy: a relatively simple procedure with an indefinite past and an expected brilliant future. J Hepatol 2008; 48(1):171–173. doi:10.1016/j.jhep.2007.10.001
- Kalambokis G, Manousou P, Vibhakorn S, et al. Transjugular liver biopsy—indications, adequacy, quality of specimens, and complications—a systematic review. J Hepatol 2007; 47(2):284–294. doi:10.1016/j.jhep.2007.05.001
- Ripoll C, Groszmann R, Garcia-Tsao G, et al; Portal Hypertension Collaborative Group. Hepatic venous pressure gradient predicts clinical decompensation in patients with compensated cirrhosis. Gastroenterology 2007; 133(2):481–488. doi:10.1053/j.gastro.2007.05.024
- Perrault J, McGill DB, Ott BJ, Taylor WF. Liver biopsy: complications in 1000 inpatients and outpatients. Gastroenterology 1978; 74(1):103–106. pmid:618417
- Janes CH, Lindor KD. Outcome of patients hospitalized for complications after outpatient liver biopsy. Ann Intern Med 1993; 118(2):96–98. pmid:8416324
- Bedossa P, Dargere D, Paradis V. Sampling variability of liver fibrosis in chronic hepatitis C. Hepatology 2003; 38(6):1449–1457. doi:10.1016/j.hep.2003.09.022
- Regev A, Berho M, Jeffers LJ, et al. Sampling error and intraobserver variation in liver biopsy in patients with chronic HCV infection. Am J Gastroenterol 2002; 97(10):2614–2618. doi:10.1111/j.1572-0241.2002.06038.x
- Goldin RD, Goldin JG, Burt AD, et al. Intra-observer and inter-observer variation in the histopathological assessment of chronic viral hepatitis. J Hepatol 1996; 25(5):649–654. pmid:8938541
- Intraobserver and interobserver variations in liver biopsy interpretation in patients with chronic hepatitis C. The French METAVIR Cooperative Study Group. Hepatology 1994; 20(1 Pt 1):15–20. pmid:8020885
- Sterling RK, Lissen E, Clumeck N, et al; APRICOT Clinical Investigators. Development of a simple noninvasive index to predict significant fibrosis in patients with HIV/HCV coinfection. Hepatology 2006; 43(6):1317–1325. doi:10.1002/hep.21178
- Vallet-Pichard A, Mallet V, Nalpas B, et al. FIB-4: an inexpensive and accurate marker of fibrosis in HCV infection. comparison with liver biopsy and fibrotest. Hepatology 2007; 46(1):32–36. doi:10.1002/hep.21669
- Shah AG, Lydecker A, Murray K, Tetri BN, Contos MJ, Sanyal AJ; Nash Clinical Research Network. Comparison of noninvasive markers of fibrosis in patients with nonalcoholic fatty liver disease. Clin Gastroenterol Hepatol 2009; 7(10):1104–1112. doi:10.1016/j.cgh.2009.05.033
- McPherson S, Stewart SF, Henderson E, Burt AD, Day CP. Simple non-invasive fibrosis scoring systems can reliably exclude advanced fibrosis in patients with non-alcoholic fatty liver disease. Gut 2010; 59(9):1265–1269. doi:10.1136/gut.2010.216077
- Angulo P, Hui JM, Marchesini G, et al. The NAFLD fibrosis score: A noninvasive system that identifies liver fibrosis in patients with NAFLD. Hepatology 2007; 45(4):846–854. doi:10.1002/hep.21496
- Goh GB, Pagadala MR, Dasarathy J, et al. Clinical spectrum of non-alcoholic fatty liver disease in diabetic and non-diabetic patients. BBA Clin 2015; 3:141–145. doi:10.1016/j.bbacli.2014.09.001
- Tapper EB, Hunink MG, Afdhal NH, Lai M, Sengupta N. Cost-effectiveness analysis: risk stratification of nonalcoholic fatty liver disease (NAFLD) by the primary care physician using the NAFLD fibrosis score. PLoS One 2016; 11(2):e0147237. doi:10.1371/journal.pone.0147237
- Wai CT, Greenson JK, Fontana RJ, et al. A simple noninvasive index can predict both significant fibrosis and cirrhosis in patients with chronic hepatitis C. Hepatology 2003; 38(2):518–526. doi:10.1053/jhep.2003.50346
- Calès P, Lainé F, Boursier J, et al. Comparison of blood tests for liver fibrosis specific or not to NAFLD. J Hepatol 2009; 50(1):165–173. doi:10.1016/j.jhep.2008.07.035
- Imbert-Bismut F, Ratziu V, Pieroni L, Charlotte F, Benhamou Y, Poynard T; MULTIVIRC Group. Biochemical markers of liver fibrosis in patients with hepatitis C virus infection: a prospective study. Lancet 2001; 357(9262):1069–1075. doi:10.1016/S0140-6736(00)04258-6
- Shaheen AA, Wan AF, Myers RP. FibroTest and FibroScan for the prediction of hepatitis C-related fibrosis: a systematic review of diagnostic test accuracy. Am J Gastroenterol 2007; 102(11):2589–2600. doi:10.1111/j.1572-0241.2007.01466.x
- Smith JO, Sterling RK. Systematic review: non-invasive methods of fibrosis analysis in chronic hepatitis C. Aliment Pharmacol Ther 2009; 30(6):557–576. doi:10.1111/j.1365-2036.2009.04062.x
- Sebastiani G, Vario A, Guido M, Alberti A. Performance of noninvasive markers for liver fibrosis is reduced in chronic hepatitis C with normal transaminases. J Viral Hepat 2007; 15(3):212–218. doi:10.1111/j.1365-2893.2007.00932.x
- Poynard T, Morra R, Halfon P, et al. Meta-analyses of FibroTest diagnostic value in chronic liver disease. BMC Gastroenterol 2007; 7:40. doi:10.1186/1471-230X-7-40
- Carlson JJ, Kowdley KV, Sullivan SD, Ramsey SD, Veenstra DL. An evaluation of the potential cost-effectiveness of non-invasive testing strategies in the diagnosis of significant liver fibrosis. J Gastroenterol Hepatol 2009; 24(5):786–791. doi:10.1111/j.1440-1746.2009.05778.x
- Aubé C, Oberti F, Korali N, et al. Ultrasonographic diagnosis of hepatic fibrosis or cirrhosis. J Hepatol 1999; 30(3):472–478. pmid:10190731
- Di Lelio A, Cestari C, Lomazzi A, Beretta L. Cirrhosis: diagnosis with sonographic study of the liver surface. Radiology 1989; 172(2):389–392. doi:10.1148/radiology.172.2.2526349
- Wong VW, Chan HL. Transient elastography. J Gastroenterol Hepatol 2010; 25(11):1726–1731. doi:10.1111/j.1440-1746.2010.06437.x
- Arena U, Vizzutti F, Abraldes JG, et al. Reliability of transient elastography for the diagnosis of advanced fibrosis in chronic hepatitis C. Gut 2008; 57(9):1288–1293. doi:10.1136/gut.2008.149708
- Ziol M, Handra-Luca A, Kettaneh A, et al. Noninvasive assessment of liver fibrosis by measurement of stiffness in patients with chronic hepatitis C. Hepatology 2005; 41(1):48–54. doi:10.1002/hep.20506
- Wong VW, Vergniol J, Wong GL, et al. Diagnosis of fibrosis and cirrhosis using liver stiffness measurement in nonalcoholic fatty liver disease. Hepatology 2010; 51(2):454–462. doi:10.1002/hep.23312
- Sagir A, Erhardt A, Schmitt M, Häussinger D. Transient elastography is unreliable for detection of cirrhosis in patients with acute liver damage. Hepatology 2007; 48(2):592–595. doi:10.1002/hep.22056
- Mederacke I, Wursthorn K, Kirschner J, et al. Food intake increases liver stiffness in patients with chronic or resolved hepatitis C virus infection. Liver Int 2009; 29(10):1500–1506. doi:10.1111/j.1478-3231.2009.02100.x
- Castéra L, Foucher J, Bernard PH, et al. Pitfalls of liver stiffness measurement: a 5-year prospective study of 13,369 examinations. Hepatology 2010; 51(3):828–835. doi:10.1002/hep.23425
- Wong VW, Vergniol J, Wong GL, et al. Liver stiffness measurement using XL probe in patients with nonalcoholic fatty liver disease. Am J Gastroenterol 2012; 107(12):1862–1871. doi:10.1038/ajg.2012.331
- Fraquelli M, Rigamonti C, Casazza G, et al. Reproducibility of transient elastography in the evaluation of liver fibrosis in patients with chronic liver disease. Gut 2007; 56(7):968–973. doi:10.1136/gut.2006.111302
- de Franchis R; Baveno VI Faculty. Expanding consensus in portal hypertension: report of the Baveno VI Consensus Workshop: stratifying risk and individualizing care for portal hypertension. J Hepatol 2015; 63(3):743–752. doi:10.1016/j.jhep.2015.05.022
- Friedrich-Rust M, Wunder K, Kriener S, et al. Liver fibrosis in viral hepatitis: noninvasive assessment with acoustic radiation force impulse imaging versus transient elastography. Radiology 2009; 252(2):595–604. doi:10.1148/radiol.2523081928
- Yoneda M, Suzuki K, Kato S, et al. Nonalcoholic fatty liver disease: US-based acoustic radiation force impulse elastography. Radiology 2010; 256(2):640–647. doi:10.1148/radiol.10091662
- Bota S, Herkner H, Sporea I, et al. Meta-analysis: ARFI elastography versus transient elastography for the evaluation of liver fibrosis. Liver Int 2013; 33(8):1138–1147. doi:10.1111/liv.12240
- Attia D, Bantel H, Lenzen H, Manns MP, Gebel MJ, Potthoff A. Liver stiffness measurement using acoustic radiation force impulse elastography in overweight and obese patients. Aliment Pharmacol Ther 2016; 44(4):366–379. doi:10.1111/apt.13710
- Cui J, Heba E, Hernandez C, et al. Magnetic resonance elastography is superior to acoustic radiation force impulse for the diagnosis of fibrosis in patients with biopsy-proven nonalcoholic fatty liver disease: a prospective study. Hepatology 2016; 63(2):453–461. doi:10.1002/hep.28337
- Huwart L, Sempoux C, Vicaut E, et al. Magnetic resonance elastography for the noninvasive staging of liver fibrosis. Gastroenterology 2008; 135(1):32–40. doi:10.1053/j.gastro.2008.03.076
- Jajamovich GH, Dyvorne H, Donnerhack C, Taouli B. Quantitative liver MRI combining phase contrast imaging, elastography, and DWI: assessment of reproducibility and postprandial effect at 3.0 T. PLoS One 2014; 9(5):e97355. doi:10.1371/journal.pone.0097355
- Lim JK, Flamm SL, Singh S, Falck-Ytter YT; Clinical Guidelines Committee of the American Gastroenterological Association. American Gastroenterological Association Institute guideline on the role of elastography in the evaluation of liver fibrosis. Gastroenterology 2017; 152(6):1536–1543. doi:10.1053/j.gastro.2017.03.017
- N, Feldstein AE. Noninvasive diagnosis of nonalcoholic fatty liver disease: are we there yet? Metabolism 2016; 65(8):1087–1095. doi:10.1016/j.metabol.2016.01.013
KEY POINTS
- Liver biopsy remains the gold standard for determining fibrosis stage but is expensive and entails risk of complications.
- For patients infected with HCV, fibrosis stage should be determined with transient elastography, a transthoracic ultrasonographic technique that measures shear-wave velocity.
- For patients with cirrhosis, transient elastography combined with a platelet count can detect developing portal hypertension and determine whether to screen for esophageal varices.
- For NAFLD, combined elastography and NAFLD fibrosis score—which incorporates patient characteristics and laboratory test results—should be used to determine the need for liver biopsy.
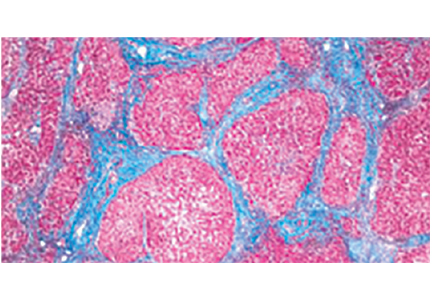
Laboratory tests in rheumatology: A rational approach
Laboratory tests are often ordered inappropriately for patients in whom a rheumatologic illness is suspected; this occurs in both primary and secondary care.1 Some tests are available both singly and as part of a battery of tests screening healthy people without symptoms.
The problem: negative test results are by no means always reassuring, and false-positive results raise the risks of unnecessary anxiety for patients and clinicians, needless referrals, and potential morbidity due to further unnecessary testing and exposure to wrong treatments.2 Clinicians should be aware of the pitfalls of these tests in order to choose them wisely and interpret the results correctly.
This article provides practical guidance on requesting and interpreting some common tests in rheumatology, with the aid of case vignettes.
RHEUMATOID FACTOR AND ANTICITRULLINATED PEPTIDE ANTIBODY
A 41-year-old woman, previously in good health, presents to her primary care practitioner with a 6-week history of pain and swelling in her hands and early morning stiffness lasting about 2 hours. She denies having any extraarticular symptoms. Physical examination reveals synovitis across her right metacarpophalangeal joints, proximal interphalangeal joint of the left middle finger, and left wrist. The primary care physician is concerned that her symptoms might be due to rheumatoid arthritis.
Would testing for rheumatoid factor and anticitrullinated peptide antibody be useful in this patient?
Rheumatoid factor is an antibody (immunoglobulin M, IgG, or IgA) targeted against the Fc fragment of IgG.3 It was so named because it was originally detected in patients with rheumatoid arthritis, but it is neither sensitive nor specific for this condition. A meta-analysis of more than 5,000 patients with rheumatoid arthritis reported that rheumatoid factor testing had a sensitivity of 69% and specificity of 85%.4

Anticitrullinated peptide antibody, on the other hand, is much more specific for rheumatoid arthritis (95%), as it is seldom seen in other conditions, but its sensitivity is similar to that of rheumatoid factor (68%).4–6 A positive result would thus lend strength to the diagnosis of rheumatoid arthritis, but a negative result would not exclude it.
Approach to early arthritis
When faced with a patient with early arthritis, some key questions to ask include7,8:
Is this an inflammatory or a mechanical problem? Inflammatory arthritis is suggested by joint swelling that is not due to trauma or bony hypertrophy, early morning stiffness lasting longer than 30 minutes, and elevated inflammatory markers (erythrocyte sedimentation rate or C-reactive protein). Involvement of the small joints of the hands and feet may be suggested by pain on compression of the metacarpophalangeal and metatarsophalangeal joints, respectively.
Is there a definite identifiable underlying cause for the inflammatory arthritis? The pattern of development of joint symptoms or the presence of extraarticular symptoms may suggest an underlying problem such as gout, psoriatic arthritis, systemic lupus erythematosus, or sarcoidosis.
If the arthritis is undifferentiated (ie, there is no definite identifiable cause), is it likely to remit or persist? This is perhaps the most important question to ask in order to prognosticate. Patients with risk factors for persistent disease, ie, for development of rheumatoid arthritis, should be referred to a rheumatologist early for timely institution of disease-modifying antirheumatic drug therapy.9 Multiple studies have shown that patients in whom this therapy is started early have much better clinical, functional, and radiologic outcomes than those in whom it is delayed.10–12
The revised American College of Rheumatology and European League Against Rheumatism criteria13 include the following factors as predictors of persistence:
- Number of involved joints (with greater weight given to involvement of small joints)
- Duration of symptoms 6 weeks or longer
- Elevated acute-phase response (erythrocyte sedimentation rate or C-reactive protein level)
- A positive serologic test (either rheumatoid factor or anticitrullinated peptide antibody).
If both rheumatoid factor and anticitrullinated peptide antibody are positive in a patient with early undifferentiated arthritis, the risk of progression to rheumatoid arthritis is almost 100%, thus underscoring the importance of testing for these antibodies.5,6 Referral to a rheumatologist should, however, not be delayed in patients with negative test results (more than one-third of patients with rheumatoid arthritis may be negative for both), and should be considered in those with inflammatory joint symptoms persisting longer than 6 weeks, especially with involvement of the small joints (sparing the distal interphalangeals) and elevated acute-phase response.
Rheumatoid factor in healthy people without symptoms
In some countries, testing for rheumatoid factor is offered as part of a battery of screening tests in healthy people who have no symptoms, a practice that should be strongly discouraged.
Multiple studies, both prospective and retrospective, have demonstrated that both rheumatoid factor and anticitrullinated peptide antibody may be present several years before the clinical diagnosis of rheumatoid arthritis.6,14–16 But the risk of developing rheumatoid arthritis for asymptomatic individuals who are rheumatoid factor-positive depends on the rheumatoid factor titer, positive family history of rheumatoid arthritis in first-degree relatives, and copresence of anticitrullinated peptide antibody. The absolute risk, nevertheless, is still very small. In some, there might be an alternative explanation such as undiagnosed Sjögren syndrome or hepatitis C.
In any event, no strategy is currently available that is proven to prevent the development of rheumatoid arthritis, and there is no role for disease-modifying therapy during the preclinical phase.16
Back to our patient
Blood testing in our patient reveals normal complete blood cell counts, aminotransferase levels, and serum creatinine concentration; findings on urinalysis are normal. Her erythrocyte sedimentation rate is 56 mm/hour (reference range 0–15), and her C-reactive protein level is 26 mg/dL (normal < 3). Testing is negative for rheumatoid factor and anticitrullinated peptide antibody.
Although her rheumatoid factor and anticitrullinated peptide antibody tests are negative, she is referred to a rheumatologist because she has predictors of persistent disease, ie, symptom duration of 6 weeks, involvement of the small joints of the hands, and elevated erythrocyte sedimentation rate and C-reactive protein. The rheumatologist checks her parvovirus serology, which is negative.
The patient is given parenteral depot corticosteroid therapy, to which she responds briefly. Because her symptoms persist and continue to worsen, methotrexate treatment is started after an additional 6 weeks.
ANTINUCLEAR ANTIBODY
A 37-year-old woman presents to her primary care physician with the complaint of tiredness. She has a family history of systemic lupus erythematosus in her sister and maternal aunt. She is understandably worried about lupus because of the family history and is asking to be tested for it.
Would testing for antinuclear antibody be reasonable?
Antinuclear antibody is not a single antibody but rather a family of autoantibodies that are directed against nuclear constituents such as single- or double-stranded deoxyribonucleic acid (dsDNA), histones, centromeres, proteins complexed with ribonucleic acid (RNA), and enzymes such as topoisomerase.17,18
Protein antigens complexed with RNA and some enzymes in the nucleus are also known as extractable nuclear antigens (ENAs). They include Ro, La, Sm, Jo-1, RNP, and ScL-70 and are named after the patient in whom they were first discovered (Robert, Lavine, Smith, and John), the antigen that is targeted (ribonucleoprotein or RNP), and the disease with which they are associated (anti-ScL-70 or antitopoisomerase in diffuse cutaneous scleroderma).
Antinuclear antibody testing is commonly requested to exclude connective tissue diseases such as lupus, but the clinician needs to be aware of the following points:
Antinuclear antibody may be encountered in conditions other than lupus
These include19:
- Other autoimmune diseases such as rheumatoid arthritis, primary Sjögren syndrome, systemic sclerosis, autoimmune thyroid disease, and myasthenia gravis
- Infection with organisms that share the epitope with self-antigens (molecular mimicry)
- Cancers
- Drugs such as hydralazine, procainamide, and minocycline.
Antinuclear antibody might also be produced by the healthy immune system from time to time to clear the nuclear debris that is extruded from aging cells.
A study in healthy individuals20 reported a prevalence of positive antinuclear antibody of 32% at a titer of 1/40, 15% at a titer of 1/80, 7% at a titer of 1/160, and 3% at a titer of 1/320. Importantly, a positive result was more common among family members of patients with autoimmune connective tissue diseases.21 Hence, a positive antinuclear antibody result does not always mean lupus.
Antinuclear antibody testing is highly sensitive for lupus
With current laboratory methods, antinuclear antibody testing has a sensitivity close to 100%. Hence, a negative result virtually rules out lupus.
Two methods are commonly used to test for antinuclear antibody: indirect immunofluorescence and enzyme-linked immunosorbent assay (ELISA).22 While human epithelial (Hep2) cells are used as the source of antigen in immunofluorescence, purified nuclear antigens coated on multiple-well plates are used in ELISA.
Although ELISA is simpler to perform, immunofluorescence has a slightly better sensitivity (because the Hep2 cells express a wide range of antigens) and is still considered the gold standard. As expected, the higher sensitivity occurs at the cost of reduced specificity (about 60%), so antinuclear antibody will also be detected in all the other conditions listed above.23
To improve the specificity of antinuclear antibody testing, laboratories report titers (the highest dilution of the test serum that tested positive); a cutoff of greater than 1/80 is generally considered significant.
Do not order antinuclear antibody testing indiscriminately


To sum up, the antinuclear antibody test should be requested only in patients with involvement of multiple organ systems. Although a negative result would make it extremely unlikely that the clinical presentation is due to lupus, a positive result is insufficient on its own to make a diagnosis of lupus.
Diagnosing lupus is straightforward when patients present with a specific manifestation such as inflammatory arthritis, photosensitive skin rash, hemolytic anemia, thrombocytopenia, or nephritis, or with specific antibodies such as those against dsDNA or Sm. Patients who present with nonspecific symptoms such as arthralgia or tiredness with a positive antinuclear antibody and negative anti-dsDNA and anti-Sm may present difficulties even for the specialist.25–27
Back to our patient
Our patient denies arthralgia. She has no extraarticular symptoms such as skin rashes, oral ulcers, sicca symptoms, muscle weakness, Raynaud phenomenon, pleuritic chest pain, or breathlessness. Findings on physical examination and urinalysis are unremarkable.
Her primary care physician decides to check her complete blood cell count, erythrocyte sedimentation rate, and thyroid-stimulating hormone level. Although she is reassured that her tiredness is not due to lupus, she insists on getting an antinuclear antibody test.
Her complete blood cell counts are normal. Her erythrocyte sedimentation rate is 6 mm/hour. However, her thyroid-stimulating hormone level is elevated, and subsequent testing shows low free thyroxine and positive thyroid peroxidase antibodies. The antinuclear antibody is positive in a titer of 1/80 and negative for anti-dsDNA and anti-ENA.
We explain to her that the positive antinuclear antibody is most likely related to her autoimmune thyroid disease. She is referred to an endocrinologist.
ANTIPHOSPHOLIPID ANTIBODIES
A 24-year-old woman presents to the emergency department with acute unprovoked deep vein thrombosis in her right leg, confirmed by ultrasonography. She has no history of previous thrombosis, and the relevant family history is unremarkable. She has never been pregnant. Her platelet count is 84 × 109/L (reference range 150–400), and her baseline activated partial thromboplastin time is prolonged at 62 seconds (reference range 23.0–32.4). The rest of her blood counts and her prothrombin time, liver enzyme levels, and serum creatinine level are normal.
Should this patient be tested for antiphospholipid antibodies?
Antiphospholipid antibodies are important because of their association with thrombotic risk (both venous and arterial) and pregnancy morbidity. The name is a misnomer, as these antibodies are targeted against some proteins that are bound to phospholipids and not only to the phospholipids themselves.
According to the modified Sapporo criteria for the classification of antiphospholipid syndrome,28 antiphospholipid antibodies should remain persistently positive on at least 2 separate occasions at least 12 weeks apart for the result to be considered significant because some infections and drugs may be associated with the transient presence of antiphospholipid antibodies.
Screening for antiphospholipid antibodies should include testing for IgM and IgG anticardiolipin antibodies, lupus anticoagulant, and IgM and IgG beta-2 glycoprotein I antibodies.29,30
Anticardiolipin antibodies
Anticardiolipin (aCL) antibodies may be targeted either against beta-2 glycoprotein I (beta-2GPI) that is bound to cardiolipin (a phospholipid) or against cardiolipin alone; the former is more specific. Antibodies directed against cardiolipin alone are usually transient and are associated with infections and drugs. The result is considered significant only when anticardiolipin antibodies are present in a medium to high titer (> 40 IgG phospholipid units or IgM phospholipid units, or > 99th percentile).
Lupus anticoagulant
The antibody with “lupus anticoagulant activity” is targeted against prothrombin plus phospholipid or beta-2GPI plus phospholipid. The test for it is a functional assay involving 3 steps:
Demonstrating the prolongation of a phospholipid-dependent coagulation assay like the activated partial thromboplastin time (aPTT). (This may explain the prolongation of aPTT in the patient described in the vignette.) Although the presence of lupus anticoagulant is associated with thrombosis, it is called an “anticoagulant” because of this in vitro prolongation of phospholipid-dependent coagulation assays.
Mixing study. The phospholipid-dependent coagulation assay could be prolonged because of either the deficiency of a coagulation factor or the presence of the antiphospholipid antibodies. This can be differentiated by mixing the patient’s plasma with normal plasma (which will have all the clotting factors) in a 1:1 ratio. If the coagulation assay remains prolonged after the addition of normal plasma, clotting factor deficiency can be excluded.
Addition of a phospholipid. If the prolongation of the coagulation assay is due to the presence of an antiphospholipid antibody, addition of extra phospholipid will correct this.
Beta-2 glycoprotein I antibody (anti-beta-2GPI)
The beta-2GPI that is not bound to the cardiolipin can be detected by separately testing for beta-2GPI (the anticardiolipin test only detects the beta-2GPI that is bound to the cardiolipin). The result is considered significant if beta-2GPI is present in a medium to high titer (> 99th percentile).
Studies have shown that antiphospholipid antibodies may be present in 1% to 5% of apparently healthy people in the general population.31 These are usually low-titer anticardiolipin or anti-beta-GPI IgM antibodies that are not associated with thrombosis or adverse pregnancy outcomes. Hence, the term antiphospholipid syndrome should be reserved for those who have had at least 1 episode of thrombosis or pregnancy morbidity and persistent antiphospholipid antibodies, and not those who have asymptomatic or transient antiphospholipid antibodies.
Triple positivity (positive anticardiolipin, lupus anticoagulant, and anti-beta-2GPI) seems to be associated with the highest risk of thrombosis, with a 10-year cumulative incidence of 37.1% (95% confidence interval [CI] 19.9–54.3) for a first thrombotic event,32 and 44.2% (95% CI 38.6–49.8) for recurrent thrombosis.33
The association with thrombosis is stronger for lupus anticoagulant than with the other 2 antibodies, with different studies34 finding an odds ratio ranging from 5 to 16. A positive lupus anticoagulant test with or without a moderate to high titer of anticardiolipin or anti-beta-2GPI IgM or IgG constitutes a high-risk profile, while a moderate to high titer of anticardiolipin or anti-beta-2GPI IgM or IgG constitutes a moderate-risk profile. A low titer of anticardiolipin or anti-beta-2GPI IgM or IgG constitutes a low-risk profile that may not be associated with thrombosis.35
Antiphospholipid syndrome is important to recognize because of the need for long-term anticoagulation to prevent recurrence.36 It may be primary, when it occurs on its own, or secondary, when it occurs in association with another autoimmune disease such as lupus.
Venous events in antiphospholipid syndrome most commonly manifest as lower-limb deep vein thrombosis or pulmonary embolism, while arterial events most commonly manifest as stroke or transient ischemic attack.37 Obstetric manifestations may include not only miscarriage and stillbirth, but also preterm delivery, intrauterine growth retardation, and preeclampsia, all occurring due to placental insufficiency.
The frequency of antiphospholipid antibodies has been estimated as 13.5% in patients with stroke, 11% with myocardial infarction, 9.5% with deep vein thrombosis, and 6% for those with pregnancy morbidity.38
Some noncriteria manifestations have also been recognized in antiphospholipid syndrome, such as thrombocytopenia, cardiac vegetations (Libman-Sachs endocarditis), livedo reticularis, and nephropathy.

Back to our patient
Our patient’s anticardiolipin IgG test is negative, while her lupus anticoagulant and beta-2GPI IgG are positive. She has no clinical or laboratory features suggesting lupus.
She is started on warfarin. After 3 months, the warfarin is interrupted for several days, and she is retested for all 3 antiphospholipid antibodies. Her beta-2GPI I IgG and lupus anticoagulant tests are again positive. Because of the persistent antiphospholipid antibody positivity and clinical history of deep vein thrombosis, her condition is diagnosed as primary antiphospholipid syndrome. She is advised to continue anticoagulant therapy indefinitely.
ANTINEUTROPHIL CYTOPLASMIC ANTIBODY
A 34-year-old man who is an injecting drug user presents with a 2-week history of fever, malaise, and generalized arthralgia. There are no localizing symptoms of infection. Notable findings on examination include a temperature of 38.0°C (100.4°F), needle track marks in his arms, nonblanching vasculitic rash in his legs, and a systolic murmur over the precordium.
His white blood cell count is 15.3 × 10⁹/L (reference range 3.7–11.0), and his C-reactive protein level is 234 mg/dL (normal < 3). Otherwise, results of blood cell counts, liver enzyme tests, renal function tests, urinalysis, and chest radiography are normal.
Two sets of blood cultures are drawn. Transthoracic echocardiography and the antineutrophil cytoplasmic antibody (ANCA) test are requested, as are screening tests for human immunodeficiency virus, hepatitis B, and hepatitis C.
Was the ANCA test indicated in this patient?
ANCAs are autoantibodies against antigens located in the cytoplasmic granules of neutrophils and monocytes. They are associated with small-vessel vasculitides such as granulomatosis with polyangiitis (GPA), microscopic polyangiitis (MPA), eosinophilic granulomatosis with polyangiitis (EGPA), and isolated pauciimmune crescentic glomerulonephritis, all collectively known as ANCA-associated vasculitis (AAV).39
Laboratory methods to detect ANCA include indirect immunofluorescence and antigen-specific enzyme immunoassays. Indirect immunofluorescence only tells us whether or not an antibody that is targeting a cytoplasmic antigen is present. Based on the indirect immunofluorescent pattern, ANCA can be classified as follows:
- Perinuclear or p-ANCA (if the targeted antigen is located just around the nucleus and extends into it)
- Cytoplasmic or c-ANCA (if the targeted antigen is located farther away from the nucleus)
- Atypical ANCA (if the indirect immunofluorescent pattern does not fit with either p-ANCA or c-ANCA).
Indirect immunofluorescence does not give information about the exact antigen that is targeted; this can only be obtained by performing 1 of the antigen-specific immunoassays. The target antigen for c-ANCA is usually proteinase-3 (PR3), while that for p-ANCA could be myeloperoxidase (MPO), cathepsin, lysozyme, lactoferrin, or bactericidal permeability inhibitor. Anti-PR3 is highly specific for GPA, while anti-MPO is usually associated with MPA and EGPA. Less commonly, anti-PR3 may be seen in patients with MPA and anti-MPO in those with GPA. Hence, there is an increasing trend toward classifying ANCA-associated vasculitis into PR3-associated or MPO-associated vasculitis rather than as GPA, MPA, EGPA, or renal-limited vasculitis.40
Several audits have shown that the ANCA test is widely misused and requested indiscriminately to rule out vasculitis. This results in a lower positive predictive value, possible harm to patients due to increased false-positive rates, and increased burden on the laboratory.41–43 At least 2 separate groups have demonstrated that a gating policy that refuses ANCA testing in patients without clinical evidence of systemic vasculitis can reduce the number of inappropriate requests, improve the diagnostic yield, and make it more clinically relevant and cost-effective.44,45
The clinician should bear in mind that:

Current guidelines recommend using one of the antigen-specific assays for PR3 and MPO as the primary screening method.48 Until recently, indirect immunofluorescence was used to screen for ANCA-associated vasculitis, and positive results were confirmed by ELISA to detect ANCAs specific for PR3 and MPO,49 but this is no longer recommended because of recent evidence suggesting a large variability between the different indirect immunofluorescent methods and improved diagnostic performance of the antigen-specific assays.
In a large multicenter study by Damoiseaux et al, the specificity with the different antigen-specific immunoassays was 98% to 99% for PR3-ANCA and 96% to 99% for MPO-ANCA.50
ANCA-associated vasculitis should not be considered excluded if the PR3 and MPO-ANCA are negative. In the Damoiseaux study, about 11% to 15% of patients with GPA and 8% to 24% of patients with MPA tested negative for both PR3 and MPO-ANCA.50
If the ANCA result is negative and clinical suspicion for ANCA-associated vasculitis is high, the clinician may wish to consider requesting another immunoassay method or indirect immunofluorescence. Results of indirect immunofluorescent testing results may be positive in those with a negative immunoassay, and vice versa.

Thus, the ANCA result should always be interpreted in the context of the whole clinical picture.51 Biopsy should still be considered the gold standard for the diagnosis of ANCA-associated vasculitis. The ANCA titer can help to improve clinical interpretation, because the likelihood of ANCA-associated vasculitis increases with higher levels of PR3 and MPO-ANCA.52
Back to our patient
Our patient’s blood cultures grow methicillin-sensitive Staphylococcus aureus in both sets after 48 hours. Transthoracic echocardiography reveals vegetations around the tricuspid valve, with no evidence of valvular regurgitation. The diagnosis is right-sided infective endocarditis. He is started on appropriate antibiotics.
Tests for human immunodeficiency virus, hepatitis B, and hepatitis C are negative. The ANCA test is positive for MPO-ANCA at 28 IU/mL (normal < 10).
The positive ANCA is thought to be related to the infective endocarditis. His vasculitis is most likely secondary to infective endocarditis and not ANCA-associated vasculitis. The ANCA test need not have been requested in the first place.
HUMAN LEUKOCYTE ANTIGEN-B27
A 22-year-old man presents to his primary care physician with a 4-month history of gradually worsening low back pain associated with early morning stiffness lasting more than 2 hours. He has no peripheral joint symptoms.
In the last 2 years, he has had 2 separate episodes of uveitis. There is a family history of ankylosing spondylitis in his father. Examination reveals global restriction of lumbar movements but is otherwise unremarkable. Magnetic resonance imaging (MRI) of the lumbar spine and sacroiliac joints is normal.
Should this patient be tested for human leukocyte antigen-B27 (HLA-B27)?
The major histocompatibility complex (MHC) is a gene complex that is present in all animals. It encodes proteins that help with immunologic tolerance. HLA simply refers to the human version of the MHC.53 The HLA gene complex, located on chromosome 6, is categorized into class I, class II, and class III. HLA-B is one of the 3 class I genes. Thus, a positive HLA-B27 result simply means that the particular gene is present in that person.
HLA-B27 is strongly associated with ankylosing spondylitis, also known as axial spondyloarthropathy.54 Other genes also contribute to the pathogenesis of ankylosing spondylitis, but HLA-B27 is present in more than 90% of patients with this disease and is by far considered the most important. The association is not as strong for peripheral spondyloarthropathy, with studies reporting a frequency of up to 75% for reactive arthritis and inflammatory bowel disease-associated arthritis, and up to 50% for psoriatic arthritis and uveitis.55
About 9% of healthy, asymptomatic individuals may have HLA-B27, so the mere presence of this gene is not evidence of disease.56 There may be up to a 20-fold increased risk of ankylosing spondylitis among those who are HLA-B27-positive.57
Some HLA genes have many different alleles, each of which is given a number (explaining the number 27 that follows the B). Closely related alleles that differ from one another by only a few amino-acid substitutions are then categorized together, thus accounting for more than 100 subtypes of HLA-B27 (designated from HLA-B*2701 to HLA-B*27106). These subtypes vary in frequency among different racial groups, and the population prevalence of ankylosing spondylitis parallels the frequency of HLA-B27.58 The most common subtype seen in white people and American Indians is B*2705. HLA-B27 is rare in blacks, explaining the rarity of ankylosing spondylitis in this population. Further examples include HLA-B*2704, which is seen in Asians, and HLA-B*2702, seen in Mediterranean populations. Not all subtypes of HLA-B27 are associated with disease, and some, like HLA-B*2706, may also be protective.
When should the clinician consider testing for HLA-B27?

Peripheral spondyloarthropathy may present with arthritis, enthesitis (eg, heel pain due to inflammation at the site of insertion of the Achilles tendon or plantar fascia), or dactylitis (“sausage” swelling of the whole finger or toe due to extension of inflammation beyond the margins of the joint). Other clues may include psoriasis, inflammatory bowel disease, history of preceding gastrointestinal or genitourinary infection, family history of similar conditions, and history of recurrent uveitis.
For the initial assessment of patients who have inflammatory back pain, plain radiography of the sacroiliac joints is considered the gold standard.59 If plain radiography does not show evidence of sacroiliitis, MRI of the sacroiliac joints should be considered. While plain radiography can reveal only structural changes such as sclerosis, erosions, and ankylosis, MRI is useful to evaluate for early inflammatory changes such as bone marrow edema. Imaging the lumbar spine is not necessary, as the sacroiliac joints are almost invariably involved in axial spondyloarthropathy, and lesions seldom occur in the lumbar spine in isolation.60
The diagnosis of ankylosing spondylitis previously relied on confirmatory imaging features, but based on the new International Society classification criteria,61–63 which can be applied to patients with more than 3 months of back pain and age of onset of symptoms before age 45, patients can be classified as having 1 of the following:
- Radiographic axial spondyloarthropathy, if they have evidence of sacroiliitis on imaging plus 1 other feature of spondyloarthropathy
- Nonradiographic axial spondyloarthropathy, if they have a positive HLA-B27 plus 2 other features of spondyloarthropathy (Table 7).
These new criteria have a sensitivity of 82.9% and specificity of 84.4%.62,63 The disease burden of radiographic and nonradiographic axial spondyloarthropathy has been shown to be similar, suggesting that they are part of the same disease spectrum. Thus, the HLA-B27 test is useful to make a diagnosis of axial spondyloarthropathy even in the absence of imaging features and could be requested in patients with 2 or more features of spondyloarthropathy. In the absence of imaging features and a negative HLA-B27 result, however, the patient cannot be classified as having axial spondyloarthropathy.
Back to our patient
The absence of radiographic evidence would not exclude axial spondyloarthropathy in our patient. The HLA-B27 test is requested because of the inflammatory back pain and the presence of 2 spondyloarthropathy features (uveitis and the family history) and is reported to be positive. His disease is classified as nonradiographic axial spondyloarthropathy.
He is started on regular naproxen and is referred to a physiotherapist. After 1 month, he reports significant symptomatic improvement. He asks if he can be retested for HLA-B27 to see if it has become negative. We tell him that there is no point in repeating it, as it is a gene and will not disappear.
SUMMARY: CONSIDER THE CLINICAL PICTURE
When approaching a patient suspected of having a rheumatologic disease, a clinician should first consider the clinical presentation and the intended purpose of each test. The tests, in general, might serve several purposes. They might help to:
Increase the likelihood of the diagnosis in question. For example, a positive rheumatoid factor or anticitrullinated peptide antibody can help diagnose rheumatoid arthritis in a patient with early polyarthritis, a positive HLA-B27 can help diagnose ankylosing spondylitis in patients with inflammatory back pain and normal imaging, and a positive ANCA can help diagnose ANCA-associated vasculitis in a patient with glomerulonephritis.
Reduce the likelihood of the diagnosis in question. For example, a negative antinuclear antibody test reduces the likelihood of lupus in a patient with joint pains.
Monitor the condition. For example DNA antibodies can be used to monitor the activity of lupus.
Plan the treatment strategy. For example, one might consider lifelong anticoagulation if antiphospholipid antibodies are persistently positive in a patient with thrombosis.
Prognosticate. For example, positive rheumatoid factor and anticitrullinated peptide antibody increase the risk of erosive rheumatoid arthritis.
If the test was requested in the absence of a clear indication and the result is positive, it is important to bear in mind the potential pitfalls associated with that test and not attach a diagnostic label prematurely. None of the tests can confirm or exclude a condition, so the results should always be interpreted in the context of the whole clinical picture.
- American College of Rheumatology Ad Hoc Committee on Immunologic Testing Guidelines. Guidelines for immunologic laboratory testing in the rheumatic diseases: an introduction. Arthritis Rheum 2002; 47(4):429–433. doi:10.1002/art.10381
- Rang M. The Ulysses syndrome. Can Med Assoc J 1972; 106(2):122–123. pmid:5058884
- Ingegnoli F, Castelli R, Gualtierotti R. Rheumatoid factors: clinical applications. Dis Markers 2013; 35(6):727–734. doi:10.1155/2013/726598
- Nishimura K, Sugiyama D, Kogata Y, et al. Meta-analysis: diagnostic accuracy of anti-cyclic citrullinated peptide antibody and rheumatoid factor for rheumatoid arthritis. Ann Intern Med 2007; 146(11):797–808. pmid:17548411
- Taylor P, Gartemann J, Hsieh J, Creeden J. A systematic review of serum biomarkers anti-cyclic citrullinated Peptide and rheumatoid factor as tests for rheumatoid arthritis. Autoimmune Dis 2011; 2011:815038. doi:10.4061/2011/815038
- Rantapää-Dahlqvist S, de Jong BA, Berglin E, et al. Antibodies against cyclic citrullinated peptide and IgA rheumatoid factor predict the development of rheumatoid arthritis. Arthritis Rheum 2003; 48(10):2741–2749. doi:10.1002/art.11223
- Suresh E. Diagnosis of early rheumatoid arthritis: what the non-specialist needs to know. J R Soc Med 2004; 97(9):421–424. doi:10.1258/jrsm.97.9.421
- Emery P, Breedveld FC, Dougados M, Kalden JR, Schiff MH, Smolen JS. Early referral recommendation for newly diagnosed rheumatoid arthritis: evidence based development of a clinical guide. Ann Rheum Dis 2002; 61(4):290–297. pmid:11874828
- Combe B, Landewe R, Daien CI, et al. 2016 update of the EULAR recommendations for the management of early arthritis. Ann Rheum Dis 2017; 76(6):948–959. doi:10.1136/annrheumdis-2016-210602
- Egsmose C, Lund B, Borg G, et al. Patients with rheumatoid arthritis benefit from early 2nd line therapy: 5 year follow up of a prospective double blind placebo controlled study. J Rheumatol 1995; 22(12):2208–2213. pmid:8835550
- van der Heide A, Jacobs JW, Bijlsma JW, et al. The effectiveness of early treatment with “second-line” antirheumatic drugs. A randomized, controlled trial. Ann Intern Med 1996; 124(8):699–707. pmid:8633829
- Andreson JJ, Wells G, Verhoeven AC, Felson DT. Factors predicting response to treatment in rheumatoid arthritis: the importance of disease duration. Arthritis Rheum 2000; 43(1):22–29. doi:10.1002/1529-0131(200001)43:1<22::AID-ANR4>3.0.CO;2-9
- Aletaha D, Neogi T, Silman AJ, et al. 2010 Rheumatoid arthritis classification criteria: an American College of Rheumatology/European League Against Rheumatism collaborative initiative. Arthritis Rheum 2010; 62(9):2569–2581. doi:10.1002/art.27584
- Nielen MM, van Schaardenburg D, Reesink HW, et al. Specific autoantibodies precede the symptoms of rheumatoid arthritis: a study of serial measurements in blood donors. Arthritis Rheum 2004; 50(2):380–386. doi:10.1002/art.20018
- del Puente A, Knowler WC, Pettitt DJ, Bennett PH. The incidence of rheumatoid arthritis is predicted by rheumatoid factor titer in a longitudinal population study. Arthritis Rheum 1988; 31(10):1239–1244. pmid:3178905
- Deane KD, Norris JM, Holers VM. Preclinical rheumatoid arthritis: identification, evaluation, and future directions for investigation. Rheum Dis Clin North Am 2010; 36(2):213–241. doi:10.1016/j.rdc.2010.02.001
- Kavanaugh A, Tomar R, Reveille J, Solomon DH, Homburger HA. Guidelines for clinical use of the antinuclear antibody test and tests for specific autoantibodies to nuclear antigens. American College of Pathologists. Arch Pathol Lab Med 2000; 124(1):71–81. doi:10.1043/0003-9985(2000)124<0071:GFCUOT>2.0.CO;2
- Suresh E. Systemic lupus erythematosus: diagnosis for the non-specialist. Br J Hosp Med (Lond) 2007; 68(10):538–541. doi:10.12968/hmed.2007.68.10.27324
- Illei GG, Klippel JH. Why is the ANA result positive? Bull Rheum Dis 1999; 48(1):1–4. pmid:10028188
- Tan EM, Feltkamp TE, Smolen JS, et al. Range of antinuclear antibodies in “healthy” individuals. Arthritis Rheum 1997; 40(9):1601–1611. doi:10.1002/art.1780400909
- Langkilde H, Voss A, Heegaard N, Laustrup H. Autoantibodies persist in relatives to systemic lupus erythematosus patients during 12 years follow-up. Lupus 2017; 26(7):723–728. doi:10.1177/0961203316676378
- Rondeel JM. Immunofluorescence versus ELISA for the detection of antinuclear antigens. Expert Rev Mol Diagn 2002; 2(3):226–232. doi:10.1586/14737159.2.3.226
- Solomon DH, Kavanaugh AJ, Schur PH; American College of Rheumatology Ad Hoc Committee on Immunologic Testing Guidelines. Evidence-based guidelines for the use of immunologic tests: antinuclear antibody testing. Arthritis Rheum 2002; 47(4):434–444. doi:10.1002/art.10561
- Slater CA, Davis RB, Shmerling RH. Antinuclear antibody testing. A study of clinical utility. Arch Intern Med 1996; 156(13):1421–1425. pmid:8678710
- Maddison PJ. Is it SLE? Best Pract Res Clin Rheumatol 2002; 16(2):167–180. doi:10.1053/berh.2001.0219
- Price E, Walker E. Diagnostic vertigo: the journey to diagnosis in systemic lupus erythematosus. Health (London) 2014; 18(3):223–239. doi:10.1177/1363459313488008
- Blumenthal DE. Tired, aching, ANA-positive: does your patient have lupus or fibromyalgia? Cleve Clin J Med 2002; 69(2):143–146, 151–152. pmid:11990644
- Miyakis S, Lockshin MD, Atsumi T, et al. International consensus statement on an update of the classification criteria for definite antiphospholipid syndrome (APS). J Thromb Haemost 2006; 4(2):295–306. doi:10.1111/j.1538-7836.2006.01753.x
- Keeling D, Mackie I, Moore GW, Greer IA, Greaves M; British Committee for Standards in Haematology. Guidelines on the investigation and management of antiphospholipid syndrome. Br J Haematol 2012; 157(1):47–58. doi:10.1111/j.1365-2141.2012.09037.x
- Giannakopoulos B, Passam F, Iannou Y, Krillis SA. How we diagnose the antiphospholipid syndrome. Blood 2009; 113(5):985–994. doi:10.1182/blood-2007-12-129627
- Biggioggero M, Meroni PL. The geoepidemiology of the antiphospholipid antibody syndrome. Autoimmun Rev 2010; 9(5):A299–A304. doi:10.1016/j.autrev.2009.11.013
- Pengo V, Ruffatti A, Legnani C, et al. Incidence of a first thromboembolic event in asymptomatic carriers of high-risk antiphospholipid antibody profile: a multicenter prospective study. Blood 2011; 118(17):4714–4718. doi:10.1182/blood-2011-03-340232
- Pengo V, Ruffatti A, Legnani C, et al. Clinical course of high-risk patients diagnosed with antiphospholipid syndrome. J Thromb Haemost 2010; 8(2):237–242. doi:10.1111/j.1538-7836.2009.03674.x
- Galli M, Luciani D, Bertolini G, Barbui T. Lupus anticoagulants are stronger risk factors for thrombosis than anticardiolipin antibodies in the antiphospholipid syndrome: a systematic review of the literature. Blood 2003; 101(5):1827–1832. doi:10.1182/blood-2002-02-0441
- Garcia D, Erkan D. Diagnosis and management of the antiphospholipid syndrome. N Engl J Med 2018; 378(21):2010–2021. doi:10.1056/NEJMra1705454
- Garcia D, Akl EA, Carr R, Kearon C. Antiphospholipid antibodies and the risk of recurrence after a first episode of venous thromboembolism: a systematic review. Blood 2013; 122(5):817–824. doi:10.1182/blood-2013-04-496257
- Cervera R. Lessons from the “Euro-Phospholipid” project. Autoimmun Rev 2008; 7(3):174–178. doi:10.1016/j.autrev.2007.11.011
- Andreoli L, Chighizola CB, Banzato A, Pons-Estel GJ, Ramire de Jesus G, Erkan D. Estimated frequency of antiphospholipid antibodies in patients with pregnancy morbidity, stroke, myocardial infarction, and deep vein thrombosis: a critical review of the literature. Arthritis Care Res (Hoboken) 2013; 65(11):1869–1873. doi:10.1002/acr.22066
- Miller A, Chan M, Wiik A, Misbah SA, Luqmani RA. An approach to the diagnosis and management of systemic vasculitis. Clin Exp Immunol 2010; 160(2):143–160. doi:10.1111/j.1365-2249.2009.04078.x
- Cornec D, Cornec-Le-Gall E, Fervenza FC, Specks U. ANCA-associated vasculitis—clinical utility of using ANCA specificity to classify patients. Nat Rev Rheumatol 2016; 12(10):570–579. doi:10.1038/nrrheum.2016.123
- Edgar JD, McMillan SA, Bruce IN, Conlan SK. An audit of ANCA in routine clinical practice. Postgrad Med J 1995; 71(840):605–612. pmid:8545289
- McLaren JS, Stimson RH, McRorie ER, Coia JE, Luqmani RA. The diagnostic value of anti-neutrophil cytoplasmic testing in a routine clinical setting. QJM 2001; 94(11):615–621. pmid:11704691
- Mandl LA, Solomon DH, Smith EL, Lew RA, Katz JN, Shmerling RH. Using antineutrophil cytoplasmic antibody testing to diagnose vasculitis: can test-ordering guidelines improve diagnostic accuracy? Arch Intern Med 2002; 162(13):1509–1514. pmid:12090888
- Sinclair D, Saas M, Stevens JM. The effect of a symptom related “gated policy” on ANCA requests in routine clinical practice. J Clin Pathol 2004; 57(2):131–134. pmid:14747434
- Arnold DF, Timms A, Luqmani R, Misbah SA. Does a gating policy for ANCA overlook patients with ANCA associated vasculitis? An audit of 263 patients. J Clin Pathol 2010; 63(8):678–680. doi:10.1136/jcp.2009.072504
- Savige J, Gills D, Benson E, et al. International consensus statement on testing and reporting of antineutrophil cytoplasmic antibodies (ANCA). Am J Clin Pathol 1999; 111(4):507–513. pmid:10191771
- Robinson PC, Steele RH. Appropriateness of antineutrophil cytoplasmic antibody testing in a tertiary hospital. J Clin Pathol 2009; 62(8):743–745. doi:10.1136/jcp.2009.064485
- Bossuyt X, Cohen Tervaert JW, Arimura Y, et al. Position paper: revised 2017 international consensus on testing of ANCAs in granulomatosis with polyangiitis and microscopic polyangiitis. Nat Rev Rheumatol 2017; 13(11):683–692. doi:10.1038/nrrheum.2017.140
- Hagen EC, Daha MR, Hermans J, et al. Diagnostic value of standardized assays for anti-neutrophil cytoplasmic antibodies in idiopathic systemic vasculitis. EC/BCR Project for ANCA Assay Standardization. Kidney Int 1998; 53(3):743–753. doi:10.1046/j.1523-1755.1998.00807.x
- Damoiseaux J, Csemok E, Rasmussen N, et al. Detection of antineutrophil antibodies (ANCAs): a multicentre European Vasculitis Study Group (EUVAS) evaluation of the value of indirect immunofluorescence (IIF) versus antigen specific immunoassays. Ann Rheum Dis 2017; 76(4):647–653. doi:10.1136/annrheumdis-2016-209507
- Suresh E. Diagnostic approach to patients with suspected vasculitis. Postgrad Med J 2006; 82(970):483–488. doi:10.1136/pgmj.2005.042648
- Vermeersch P, Blockmans D, Bossuyt X. Use of likelihood ratios can improve the clinical usefulness of enzyme immunoassays for the diagnosis of small-vessel vasculitis. Clin Chem 2009; 55(10):1886–1888. doi:10.1373/clinchem.2009.130583
- Bowness P. HLA-B27. Annu Rev Immunol 2015; 33:29–48. doi:10.1146/annurev-immunol-032414-112110
- Sieper J, Poddubnyy D. Axial spondyloarthritis. Lancet 2017; 390(10089):73–84. doi:10.1016/S0140-6736(16)31591-4
- Khan MA. Thoughts concerning the early diagnosis of ankylosing spondylitis and related diseases. Clin Exp Rheumatol 2002; 20(6 suppl 28):S6–S10. pmid:12463439
- Braun J, Bollow M, Remlinger G, et al. Prevalence of spondyloarthropathies in HLA-B27 positive and negative blood donors. Arthritis Rheum 1998; 41(1):58–67. doi:10.1002/1529-0131(199801)41:1<58::AID-ART8>3.0.CO;2-G
- van der Linden SM, Valkenburg HA, de Jongh BM, Cats A. The risk of developing ankylosing spondylitis in HLA-B27 positive individuals. A comparison of relatives of spondylitis patients with the general population. Arthritis Rheum 1984; 27(3):241–249. pmid:6608352
- Sheehan NJ. HLA-B27: what’s new? Rheumatology (Oxford) 2010; 49(4):621–631. doi:10.1093/rheumatology/kep450
- Baraliakos X, Maksymmowych WP. Imaging in the diagnosis and management of axial spondyloarthritis. Best Pract Res Clin Rheumatol 2016; 30(4):608–623. doi:10.1016/j.berh.2016.09.011
- Mandl P, Navarro-Compan V, Terslev L, et al; European League Against Rheumatism (EULAR). EULAR recommendations for the use of imaging in the diagnosis and management of spondyloarthritis in clinical practice. Ann Rheum Dis 2015; 74(7):1327–1339. doi:10.1136/annrheumdis-2014-206971
- McAllister K, Goodson N, Warburton I, Rogers G. Spondyloarthritis: diagnosis and management: summary of NICE guidance. BMJ 2017; 356:j839. doi:10.1136/bmj.j839
- Poddubnyy D, van Tubergen A, Landewé R, Sieper J, van der Heijde D; Assessment of SpondyloArthritis international Society (ASAS). Development of an ASAS-endorsed recommendation for the early referral of patients with a suspicion of axial spondyloarthritis. Ann Rheum Dis 2015; 74(8):1483–1487. doi:10.1136/annrheumdis-2014-207151
- Rudwaleit M, van der Heijde D, Landewe R, et al. The development of Assessment of SpondyloArthritis International Society classification criteria for axial spondyloarthritis (part II): validation and final selection. Ann Rheum Dis 2009; 68(6):777–783. doi:10.1136/ard.2009.108233
Laboratory tests are often ordered inappropriately for patients in whom a rheumatologic illness is suspected; this occurs in both primary and secondary care.1 Some tests are available both singly and as part of a battery of tests screening healthy people without symptoms.
The problem: negative test results are by no means always reassuring, and false-positive results raise the risks of unnecessary anxiety for patients and clinicians, needless referrals, and potential morbidity due to further unnecessary testing and exposure to wrong treatments.2 Clinicians should be aware of the pitfalls of these tests in order to choose them wisely and interpret the results correctly.
This article provides practical guidance on requesting and interpreting some common tests in rheumatology, with the aid of case vignettes.
RHEUMATOID FACTOR AND ANTICITRULLINATED PEPTIDE ANTIBODY
A 41-year-old woman, previously in good health, presents to her primary care practitioner with a 6-week history of pain and swelling in her hands and early morning stiffness lasting about 2 hours. She denies having any extraarticular symptoms. Physical examination reveals synovitis across her right metacarpophalangeal joints, proximal interphalangeal joint of the left middle finger, and left wrist. The primary care physician is concerned that her symptoms might be due to rheumatoid arthritis.
Would testing for rheumatoid factor and anticitrullinated peptide antibody be useful in this patient?
Rheumatoid factor is an antibody (immunoglobulin M, IgG, or IgA) targeted against the Fc fragment of IgG.3 It was so named because it was originally detected in patients with rheumatoid arthritis, but it is neither sensitive nor specific for this condition. A meta-analysis of more than 5,000 patients with rheumatoid arthritis reported that rheumatoid factor testing had a sensitivity of 69% and specificity of 85%.4
Anticitrullinated peptide antibody, on the other hand, is much more specific for rheumatoid arthritis (95%), as it is seldom seen in other conditions, but its sensitivity is similar to that of rheumatoid factor (68%).4–6 A positive result would thus lend strength to the diagnosis of rheumatoid arthritis, but a negative result would not exclude it.
Approach to early arthritis
When faced with a patient with early arthritis, some key questions to ask include7,8:
Is this an inflammatory or a mechanical problem? Inflammatory arthritis is suggested by joint swelling that is not due to trauma or bony hypertrophy, early morning stiffness lasting longer than 30 minutes, and elevated inflammatory markers (erythrocyte sedimentation rate or C-reactive protein). Involvement of the small joints of the hands and feet may be suggested by pain on compression of the metacarpophalangeal and metatarsophalangeal joints, respectively.
Is there a definite identifiable underlying cause for the inflammatory arthritis? The pattern of development of joint symptoms or the presence of extraarticular symptoms may suggest an underlying problem such as gout, psoriatic arthritis, systemic lupus erythematosus, or sarcoidosis.
If the arthritis is undifferentiated (ie, there is no definite identifiable cause), is it likely to remit or persist? This is perhaps the most important question to ask in order to prognosticate. Patients with risk factors for persistent disease, ie, for development of rheumatoid arthritis, should be referred to a rheumatologist early for timely institution of disease-modifying antirheumatic drug therapy.9 Multiple studies have shown that patients in whom this therapy is started early have much better clinical, functional, and radiologic outcomes than those in whom it is delayed.10–12
The revised American College of Rheumatology and European League Against Rheumatism criteria13 include the following factors as predictors of persistence:
- Number of involved joints (with greater weight given to involvement of small joints)
- Duration of symptoms 6 weeks or longer
- Elevated acute-phase response (erythrocyte sedimentation rate or C-reactive protein level)
- A positive serologic test (either rheumatoid factor or anticitrullinated peptide antibody).
If both rheumatoid factor and anticitrullinated peptide antibody are positive in a patient with early undifferentiated arthritis, the risk of progression to rheumatoid arthritis is almost 100%, thus underscoring the importance of testing for these antibodies.5,6 Referral to a rheumatologist should, however, not be delayed in patients with negative test results (more than one-third of patients with rheumatoid arthritis may be negative for both), and should be considered in those with inflammatory joint symptoms persisting longer than 6 weeks, especially with involvement of the small joints (sparing the distal interphalangeals) and elevated acute-phase response.
Rheumatoid factor in healthy people without symptoms
In some countries, testing for rheumatoid factor is offered as part of a battery of screening tests in healthy people who have no symptoms, a practice that should be strongly discouraged.
Multiple studies, both prospective and retrospective, have demonstrated that both rheumatoid factor and anticitrullinated peptide antibody may be present several years before the clinical diagnosis of rheumatoid arthritis.6,14–16 But the risk of developing rheumatoid arthritis for asymptomatic individuals who are rheumatoid factor-positive depends on the rheumatoid factor titer, positive family history of rheumatoid arthritis in first-degree relatives, and copresence of anticitrullinated peptide antibody. The absolute risk, nevertheless, is still very small. In some, there might be an alternative explanation such as undiagnosed Sjögren syndrome or hepatitis C.
In any event, no strategy is currently available that is proven to prevent the development of rheumatoid arthritis, and there is no role for disease-modifying therapy during the preclinical phase.16
Back to our patient
Blood testing in our patient reveals normal complete blood cell counts, aminotransferase levels, and serum creatinine concentration; findings on urinalysis are normal. Her erythrocyte sedimentation rate is 56 mm/hour (reference range 0–15), and her C-reactive protein level is 26 mg/dL (normal < 3). Testing is negative for rheumatoid factor and anticitrullinated peptide antibody.
Although her rheumatoid factor and anticitrullinated peptide antibody tests are negative, she is referred to a rheumatologist because she has predictors of persistent disease, ie, symptom duration of 6 weeks, involvement of the small joints of the hands, and elevated erythrocyte sedimentation rate and C-reactive protein. The rheumatologist checks her parvovirus serology, which is negative.
The patient is given parenteral depot corticosteroid therapy, to which she responds briefly. Because her symptoms persist and continue to worsen, methotrexate treatment is started after an additional 6 weeks.
ANTINUCLEAR ANTIBODY
A 37-year-old woman presents to her primary care physician with the complaint of tiredness. She has a family history of systemic lupus erythematosus in her sister and maternal aunt. She is understandably worried about lupus because of the family history and is asking to be tested for it.
Would testing for antinuclear antibody be reasonable?
Antinuclear antibody is not a single antibody but rather a family of autoantibodies that are directed against nuclear constituents such as single- or double-stranded deoxyribonucleic acid (dsDNA), histones, centromeres, proteins complexed with ribonucleic acid (RNA), and enzymes such as topoisomerase.17,18
Protein antigens complexed with RNA and some enzymes in the nucleus are also known as extractable nuclear antigens (ENAs). They include Ro, La, Sm, Jo-1, RNP, and ScL-70 and are named after the patient in whom they were first discovered (Robert, Lavine, Smith, and John), the antigen that is targeted (ribonucleoprotein or RNP), and the disease with which they are associated (anti-ScL-70 or antitopoisomerase in diffuse cutaneous scleroderma).
Antinuclear antibody testing is commonly requested to exclude connective tissue diseases such as lupus, but the clinician needs to be aware of the following points:
Antinuclear antibody may be encountered in conditions other than lupus
These include19:
- Other autoimmune diseases such as rheumatoid arthritis, primary Sjögren syndrome, systemic sclerosis, autoimmune thyroid disease, and myasthenia gravis
- Infection with organisms that share the epitope with self-antigens (molecular mimicry)
- Cancers
- Drugs such as hydralazine, procainamide, and minocycline.
Antinuclear antibody might also be produced by the healthy immune system from time to time to clear the nuclear debris that is extruded from aging cells.
A study in healthy individuals20 reported a prevalence of positive antinuclear antibody of 32% at a titer of 1/40, 15% at a titer of 1/80, 7% at a titer of 1/160, and 3% at a titer of 1/320. Importantly, a positive result was more common among family members of patients with autoimmune connective tissue diseases.21 Hence, a positive antinuclear antibody result does not always mean lupus.
Antinuclear antibody testing is highly sensitive for lupus
With current laboratory methods, antinuclear antibody testing has a sensitivity close to 100%. Hence, a negative result virtually rules out lupus.
Two methods are commonly used to test for antinuclear antibody: indirect immunofluorescence and enzyme-linked immunosorbent assay (ELISA).22 While human epithelial (Hep2) cells are used as the source of antigen in immunofluorescence, purified nuclear antigens coated on multiple-well plates are used in ELISA.
Although ELISA is simpler to perform, immunofluorescence has a slightly better sensitivity (because the Hep2 cells express a wide range of antigens) and is still considered the gold standard. As expected, the higher sensitivity occurs at the cost of reduced specificity (about 60%), so antinuclear antibody will also be detected in all the other conditions listed above.23
To improve the specificity of antinuclear antibody testing, laboratories report titers (the highest dilution of the test serum that tested positive); a cutoff of greater than 1/80 is generally considered significant.
Do not order antinuclear antibody testing indiscriminately
To sum up, the antinuclear antibody test should be requested only in patients with involvement of multiple organ systems. Although a negative result would make it extremely unlikely that the clinical presentation is due to lupus, a positive result is insufficient on its own to make a diagnosis of lupus.
Diagnosing lupus is straightforward when patients present with a specific manifestation such as inflammatory arthritis, photosensitive skin rash, hemolytic anemia, thrombocytopenia, or nephritis, or with specific antibodies such as those against dsDNA or Sm. Patients who present with nonspecific symptoms such as arthralgia or tiredness with a positive antinuclear antibody and negative anti-dsDNA and anti-Sm may present difficulties even for the specialist.25–27
Back to our patient
Our patient denies arthralgia. She has no extraarticular symptoms such as skin rashes, oral ulcers, sicca symptoms, muscle weakness, Raynaud phenomenon, pleuritic chest pain, or breathlessness. Findings on physical examination and urinalysis are unremarkable.
Her primary care physician decides to check her complete blood cell count, erythrocyte sedimentation rate, and thyroid-stimulating hormone level. Although she is reassured that her tiredness is not due to lupus, she insists on getting an antinuclear antibody test.
Her complete blood cell counts are normal. Her erythrocyte sedimentation rate is 6 mm/hour. However, her thyroid-stimulating hormone level is elevated, and subsequent testing shows low free thyroxine and positive thyroid peroxidase antibodies. The antinuclear antibody is positive in a titer of 1/80 and negative for anti-dsDNA and anti-ENA.
We explain to her that the positive antinuclear antibody is most likely related to her autoimmune thyroid disease. She is referred to an endocrinologist.
ANTIPHOSPHOLIPID ANTIBODIES
A 24-year-old woman presents to the emergency department with acute unprovoked deep vein thrombosis in her right leg, confirmed by ultrasonography. She has no history of previous thrombosis, and the relevant family history is unremarkable. She has never been pregnant. Her platelet count is 84 × 109/L (reference range 150–400), and her baseline activated partial thromboplastin time is prolonged at 62 seconds (reference range 23.0–32.4). The rest of her blood counts and her prothrombin time, liver enzyme levels, and serum creatinine level are normal.
Should this patient be tested for antiphospholipid antibodies?
Antiphospholipid antibodies are important because of their association with thrombotic risk (both venous and arterial) and pregnancy morbidity. The name is a misnomer, as these antibodies are targeted against some proteins that are bound to phospholipids and not only to the phospholipids themselves.
According to the modified Sapporo criteria for the classification of antiphospholipid syndrome,28 antiphospholipid antibodies should remain persistently positive on at least 2 separate occasions at least 12 weeks apart for the result to be considered significant because some infections and drugs may be associated with the transient presence of antiphospholipid antibodies.
Screening for antiphospholipid antibodies should include testing for IgM and IgG anticardiolipin antibodies, lupus anticoagulant, and IgM and IgG beta-2 glycoprotein I antibodies.29,30
Anticardiolipin antibodies
Anticardiolipin (aCL) antibodies may be targeted either against beta-2 glycoprotein I (beta-2GPI) that is bound to cardiolipin (a phospholipid) or against cardiolipin alone; the former is more specific. Antibodies directed against cardiolipin alone are usually transient and are associated with infections and drugs. The result is considered significant only when anticardiolipin antibodies are present in a medium to high titer (> 40 IgG phospholipid units or IgM phospholipid units, or > 99th percentile).
Lupus anticoagulant
The antibody with “lupus anticoagulant activity” is targeted against prothrombin plus phospholipid or beta-2GPI plus phospholipid. The test for it is a functional assay involving 3 steps:
Demonstrating the prolongation of a phospholipid-dependent coagulation assay like the activated partial thromboplastin time (aPTT). (This may explain the prolongation of aPTT in the patient described in the vignette.) Although the presence of lupus anticoagulant is associated with thrombosis, it is called an “anticoagulant” because of this in vitro prolongation of phospholipid-dependent coagulation assays.
Mixing study. The phospholipid-dependent coagulation assay could be prolonged because of either the deficiency of a coagulation factor or the presence of the antiphospholipid antibodies. This can be differentiated by mixing the patient’s plasma with normal plasma (which will have all the clotting factors) in a 1:1 ratio. If the coagulation assay remains prolonged after the addition of normal plasma, clotting factor deficiency can be excluded.
Addition of a phospholipid. If the prolongation of the coagulation assay is due to the presence of an antiphospholipid antibody, addition of extra phospholipid will correct this.
Beta-2 glycoprotein I antibody (anti-beta-2GPI)
The beta-2GPI that is not bound to the cardiolipin can be detected by separately testing for beta-2GPI (the anticardiolipin test only detects the beta-2GPI that is bound to the cardiolipin). The result is considered significant if beta-2GPI is present in a medium to high titer (> 99th percentile).
Studies have shown that antiphospholipid antibodies may be present in 1% to 5% of apparently healthy people in the general population.31 These are usually low-titer anticardiolipin or anti-beta-GPI IgM antibodies that are not associated with thrombosis or adverse pregnancy outcomes. Hence, the term antiphospholipid syndrome should be reserved for those who have had at least 1 episode of thrombosis or pregnancy morbidity and persistent antiphospholipid antibodies, and not those who have asymptomatic or transient antiphospholipid antibodies.
Triple positivity (positive anticardiolipin, lupus anticoagulant, and anti-beta-2GPI) seems to be associated with the highest risk of thrombosis, with a 10-year cumulative incidence of 37.1% (95% confidence interval [CI] 19.9–54.3) for a first thrombotic event,32 and 44.2% (95% CI 38.6–49.8) for recurrent thrombosis.33
The association with thrombosis is stronger for lupus anticoagulant than with the other 2 antibodies, with different studies34 finding an odds ratio ranging from 5 to 16. A positive lupus anticoagulant test with or without a moderate to high titer of anticardiolipin or anti-beta-2GPI IgM or IgG constitutes a high-risk profile, while a moderate to high titer of anticardiolipin or anti-beta-2GPI IgM or IgG constitutes a moderate-risk profile. A low titer of anticardiolipin or anti-beta-2GPI IgM or IgG constitutes a low-risk profile that may not be associated with thrombosis.35
Antiphospholipid syndrome is important to recognize because of the need for long-term anticoagulation to prevent recurrence.36 It may be primary, when it occurs on its own, or secondary, when it occurs in association with another autoimmune disease such as lupus.
Venous events in antiphospholipid syndrome most commonly manifest as lower-limb deep vein thrombosis or pulmonary embolism, while arterial events most commonly manifest as stroke or transient ischemic attack.37 Obstetric manifestations may include not only miscarriage and stillbirth, but also preterm delivery, intrauterine growth retardation, and preeclampsia, all occurring due to placental insufficiency.
The frequency of antiphospholipid antibodies has been estimated as 13.5% in patients with stroke, 11% with myocardial infarction, 9.5% with deep vein thrombosis, and 6% for those with pregnancy morbidity.38
Some noncriteria manifestations have also been recognized in antiphospholipid syndrome, such as thrombocytopenia, cardiac vegetations (Libman-Sachs endocarditis), livedo reticularis, and nephropathy.
Back to our patient
Our patient’s anticardiolipin IgG test is negative, while her lupus anticoagulant and beta-2GPI IgG are positive. She has no clinical or laboratory features suggesting lupus.
She is started on warfarin. After 3 months, the warfarin is interrupted for several days, and she is retested for all 3 antiphospholipid antibodies. Her beta-2GPI I IgG and lupus anticoagulant tests are again positive. Because of the persistent antiphospholipid antibody positivity and clinical history of deep vein thrombosis, her condition is diagnosed as primary antiphospholipid syndrome. She is advised to continue anticoagulant therapy indefinitely.
ANTINEUTROPHIL CYTOPLASMIC ANTIBODY
A 34-year-old man who is an injecting drug user presents with a 2-week history of fever, malaise, and generalized arthralgia. There are no localizing symptoms of infection. Notable findings on examination include a temperature of 38.0°C (100.4°F), needle track marks in his arms, nonblanching vasculitic rash in his legs, and a systolic murmur over the precordium.
His white blood cell count is 15.3 × 10⁹/L (reference range 3.7–11.0), and his C-reactive protein level is 234 mg/dL (normal < 3). Otherwise, results of blood cell counts, liver enzyme tests, renal function tests, urinalysis, and chest radiography are normal.
Two sets of blood cultures are drawn. Transthoracic echocardiography and the antineutrophil cytoplasmic antibody (ANCA) test are requested, as are screening tests for human immunodeficiency virus, hepatitis B, and hepatitis C.
Was the ANCA test indicated in this patient?
ANCAs are autoantibodies against antigens located in the cytoplasmic granules of neutrophils and monocytes. They are associated with small-vessel vasculitides such as granulomatosis with polyangiitis (GPA), microscopic polyangiitis (MPA), eosinophilic granulomatosis with polyangiitis (EGPA), and isolated pauciimmune crescentic glomerulonephritis, all collectively known as ANCA-associated vasculitis (AAV).39
Laboratory methods to detect ANCA include indirect immunofluorescence and antigen-specific enzyme immunoassays. Indirect immunofluorescence only tells us whether or not an antibody that is targeting a cytoplasmic antigen is present. Based on the indirect immunofluorescent pattern, ANCA can be classified as follows:
- Perinuclear or p-ANCA (if the targeted antigen is located just around the nucleus and extends into it)
- Cytoplasmic or c-ANCA (if the targeted antigen is located farther away from the nucleus)
- Atypical ANCA (if the indirect immunofluorescent pattern does not fit with either p-ANCA or c-ANCA).
Indirect immunofluorescence does not give information about the exact antigen that is targeted; this can only be obtained by performing 1 of the antigen-specific immunoassays. The target antigen for c-ANCA is usually proteinase-3 (PR3), while that for p-ANCA could be myeloperoxidase (MPO), cathepsin, lysozyme, lactoferrin, or bactericidal permeability inhibitor. Anti-PR3 is highly specific for GPA, while anti-MPO is usually associated with MPA and EGPA. Less commonly, anti-PR3 may be seen in patients with MPA and anti-MPO in those with GPA. Hence, there is an increasing trend toward classifying ANCA-associated vasculitis into PR3-associated or MPO-associated vasculitis rather than as GPA, MPA, EGPA, or renal-limited vasculitis.40
Several audits have shown that the ANCA test is widely misused and requested indiscriminately to rule out vasculitis. This results in a lower positive predictive value, possible harm to patients due to increased false-positive rates, and increased burden on the laboratory.41–43 At least 2 separate groups have demonstrated that a gating policy that refuses ANCA testing in patients without clinical evidence of systemic vasculitis can reduce the number of inappropriate requests, improve the diagnostic yield, and make it more clinically relevant and cost-effective.44,45
The clinician should bear in mind that:
Current guidelines recommend using one of the antigen-specific assays for PR3 and MPO as the primary screening method.48 Until recently, indirect immunofluorescence was used to screen for ANCA-associated vasculitis, and positive results were confirmed by ELISA to detect ANCAs specific for PR3 and MPO,49 but this is no longer recommended because of recent evidence suggesting a large variability between the different indirect immunofluorescent methods and improved diagnostic performance of the antigen-specific assays.
In a large multicenter study by Damoiseaux et al, the specificity with the different antigen-specific immunoassays was 98% to 99% for PR3-ANCA and 96% to 99% for MPO-ANCA.50
ANCA-associated vasculitis should not be considered excluded if the PR3 and MPO-ANCA are negative. In the Damoiseaux study, about 11% to 15% of patients with GPA and 8% to 24% of patients with MPA tested negative for both PR3 and MPO-ANCA.50
If the ANCA result is negative and clinical suspicion for ANCA-associated vasculitis is high, the clinician may wish to consider requesting another immunoassay method or indirect immunofluorescence. Results of indirect immunofluorescent testing results may be positive in those with a negative immunoassay, and vice versa.
Thus, the ANCA result should always be interpreted in the context of the whole clinical picture.51 Biopsy should still be considered the gold standard for the diagnosis of ANCA-associated vasculitis. The ANCA titer can help to improve clinical interpretation, because the likelihood of ANCA-associated vasculitis increases with higher levels of PR3 and MPO-ANCA.52
Back to our patient
Our patient’s blood cultures grow methicillin-sensitive Staphylococcus aureus in both sets after 48 hours. Transthoracic echocardiography reveals vegetations around the tricuspid valve, with no evidence of valvular regurgitation. The diagnosis is right-sided infective endocarditis. He is started on appropriate antibiotics.
Tests for human immunodeficiency virus, hepatitis B, and hepatitis C are negative. The ANCA test is positive for MPO-ANCA at 28 IU/mL (normal < 10).
The positive ANCA is thought to be related to the infective endocarditis. His vasculitis is most likely secondary to infective endocarditis and not ANCA-associated vasculitis. The ANCA test need not have been requested in the first place.
HUMAN LEUKOCYTE ANTIGEN-B27
A 22-year-old man presents to his primary care physician with a 4-month history of gradually worsening low back pain associated with early morning stiffness lasting more than 2 hours. He has no peripheral joint symptoms.
In the last 2 years, he has had 2 separate episodes of uveitis. There is a family history of ankylosing spondylitis in his father. Examination reveals global restriction of lumbar movements but is otherwise unremarkable. Magnetic resonance imaging (MRI) of the lumbar spine and sacroiliac joints is normal.
Should this patient be tested for human leukocyte antigen-B27 (HLA-B27)?
The major histocompatibility complex (MHC) is a gene complex that is present in all animals. It encodes proteins that help with immunologic tolerance. HLA simply refers to the human version of the MHC.53 The HLA gene complex, located on chromosome 6, is categorized into class I, class II, and class III. HLA-B is one of the 3 class I genes. Thus, a positive HLA-B27 result simply means that the particular gene is present in that person.
HLA-B27 is strongly associated with ankylosing spondylitis, also known as axial spondyloarthropathy.54 Other genes also contribute to the pathogenesis of ankylosing spondylitis, but HLA-B27 is present in more than 90% of patients with this disease and is by far considered the most important. The association is not as strong for peripheral spondyloarthropathy, with studies reporting a frequency of up to 75% for reactive arthritis and inflammatory bowel disease-associated arthritis, and up to 50% for psoriatic arthritis and uveitis.55
About 9% of healthy, asymptomatic individuals may have HLA-B27, so the mere presence of this gene is not evidence of disease.56 There may be up to a 20-fold increased risk of ankylosing spondylitis among those who are HLA-B27-positive.57
Some HLA genes have many different alleles, each of which is given a number (explaining the number 27 that follows the B). Closely related alleles that differ from one another by only a few amino-acid substitutions are then categorized together, thus accounting for more than 100 subtypes of HLA-B27 (designated from HLA-B*2701 to HLA-B*27106). These subtypes vary in frequency among different racial groups, and the population prevalence of ankylosing spondylitis parallels the frequency of HLA-B27.58 The most common subtype seen in white people and American Indians is B*2705. HLA-B27 is rare in blacks, explaining the rarity of ankylosing spondylitis in this population. Further examples include HLA-B*2704, which is seen in Asians, and HLA-B*2702, seen in Mediterranean populations. Not all subtypes of HLA-B27 are associated with disease, and some, like HLA-B*2706, may also be protective.
When should the clinician consider testing for HLA-B27?
Peripheral spondyloarthropathy may present with arthritis, enthesitis (eg, heel pain due to inflammation at the site of insertion of the Achilles tendon or plantar fascia), or dactylitis (“sausage” swelling of the whole finger or toe due to extension of inflammation beyond the margins of the joint). Other clues may include psoriasis, inflammatory bowel disease, history of preceding gastrointestinal or genitourinary infection, family history of similar conditions, and history of recurrent uveitis.
For the initial assessment of patients who have inflammatory back pain, plain radiography of the sacroiliac joints is considered the gold standard.59 If plain radiography does not show evidence of sacroiliitis, MRI of the sacroiliac joints should be considered. While plain radiography can reveal only structural changes such as sclerosis, erosions, and ankylosis, MRI is useful to evaluate for early inflammatory changes such as bone marrow edema. Imaging the lumbar spine is not necessary, as the sacroiliac joints are almost invariably involved in axial spondyloarthropathy, and lesions seldom occur in the lumbar spine in isolation.60
The diagnosis of ankylosing spondylitis previously relied on confirmatory imaging features, but based on the new International Society classification criteria,61–63 which can be applied to patients with more than 3 months of back pain and age of onset of symptoms before age 45, patients can be classified as having 1 of the following:
- Radiographic axial spondyloarthropathy, if they have evidence of sacroiliitis on imaging plus 1 other feature of spondyloarthropathy
- Nonradiographic axial spondyloarthropathy, if they have a positive HLA-B27 plus 2 other features of spondyloarthropathy (Table 7).
These new criteria have a sensitivity of 82.9% and specificity of 84.4%.62,63 The disease burden of radiographic and nonradiographic axial spondyloarthropathy has been shown to be similar, suggesting that they are part of the same disease spectrum. Thus, the HLA-B27 test is useful to make a diagnosis of axial spondyloarthropathy even in the absence of imaging features and could be requested in patients with 2 or more features of spondyloarthropathy. In the absence of imaging features and a negative HLA-B27 result, however, the patient cannot be classified as having axial spondyloarthropathy.
Back to our patient
The absence of radiographic evidence would not exclude axial spondyloarthropathy in our patient. The HLA-B27 test is requested because of the inflammatory back pain and the presence of 2 spondyloarthropathy features (uveitis and the family history) and is reported to be positive. His disease is classified as nonradiographic axial spondyloarthropathy.
He is started on regular naproxen and is referred to a physiotherapist. After 1 month, he reports significant symptomatic improvement. He asks if he can be retested for HLA-B27 to see if it has become negative. We tell him that there is no point in repeating it, as it is a gene and will not disappear.
SUMMARY: CONSIDER THE CLINICAL PICTURE
When approaching a patient suspected of having a rheumatologic disease, a clinician should first consider the clinical presentation and the intended purpose of each test. The tests, in general, might serve several purposes. They might help to:
Increase the likelihood of the diagnosis in question. For example, a positive rheumatoid factor or anticitrullinated peptide antibody can help diagnose rheumatoid arthritis in a patient with early polyarthritis, a positive HLA-B27 can help diagnose ankylosing spondylitis in patients with inflammatory back pain and normal imaging, and a positive ANCA can help diagnose ANCA-associated vasculitis in a patient with glomerulonephritis.
Reduce the likelihood of the diagnosis in question. For example, a negative antinuclear antibody test reduces the likelihood of lupus in a patient with joint pains.
Monitor the condition. For example DNA antibodies can be used to monitor the activity of lupus.
Plan the treatment strategy. For example, one might consider lifelong anticoagulation if antiphospholipid antibodies are persistently positive in a patient with thrombosis.
Prognosticate. For example, positive rheumatoid factor and anticitrullinated peptide antibody increase the risk of erosive rheumatoid arthritis.
If the test was requested in the absence of a clear indication and the result is positive, it is important to bear in mind the potential pitfalls associated with that test and not attach a diagnostic label prematurely. None of the tests can confirm or exclude a condition, so the results should always be interpreted in the context of the whole clinical picture.
- American College of Rheumatology Ad Hoc Committee on Immunologic Testing Guidelines. Guidelines for immunologic laboratory testing in the rheumatic diseases: an introduction. Arthritis Rheum 2002; 47(4):429–433. doi:10.1002/art.10381
- Rang M. The Ulysses syndrome. Can Med Assoc J 1972; 106(2):122–123. pmid:5058884
- Ingegnoli F, Castelli R, Gualtierotti R. Rheumatoid factors: clinical applications. Dis Markers 2013; 35(6):727–734. doi:10.1155/2013/726598
- Nishimura K, Sugiyama D, Kogata Y, et al. Meta-analysis: diagnostic accuracy of anti-cyclic citrullinated peptide antibody and rheumatoid factor for rheumatoid arthritis. Ann Intern Med 2007; 146(11):797–808. pmid:17548411
- Taylor P, Gartemann J, Hsieh J, Creeden J. A systematic review of serum biomarkers anti-cyclic citrullinated Peptide and rheumatoid factor as tests for rheumatoid arthritis. Autoimmune Dis 2011; 2011:815038. doi:10.4061/2011/815038
- Rantapää-Dahlqvist S, de Jong BA, Berglin E, et al. Antibodies against cyclic citrullinated peptide and IgA rheumatoid factor predict the development of rheumatoid arthritis. Arthritis Rheum 2003; 48(10):2741–2749. doi:10.1002/art.11223
- Suresh E. Diagnosis of early rheumatoid arthritis: what the non-specialist needs to know. J R Soc Med 2004; 97(9):421–424. doi:10.1258/jrsm.97.9.421
- Emery P, Breedveld FC, Dougados M, Kalden JR, Schiff MH, Smolen JS. Early referral recommendation for newly diagnosed rheumatoid arthritis: evidence based development of a clinical guide. Ann Rheum Dis 2002; 61(4):290–297. pmid:11874828
- Combe B, Landewe R, Daien CI, et al. 2016 update of the EULAR recommendations for the management of early arthritis. Ann Rheum Dis 2017; 76(6):948–959. doi:10.1136/annrheumdis-2016-210602
- Egsmose C, Lund B, Borg G, et al. Patients with rheumatoid arthritis benefit from early 2nd line therapy: 5 year follow up of a prospective double blind placebo controlled study. J Rheumatol 1995; 22(12):2208–2213. pmid:8835550
- van der Heide A, Jacobs JW, Bijlsma JW, et al. The effectiveness of early treatment with “second-line” antirheumatic drugs. A randomized, controlled trial. Ann Intern Med 1996; 124(8):699–707. pmid:8633829
- Andreson JJ, Wells G, Verhoeven AC, Felson DT. Factors predicting response to treatment in rheumatoid arthritis: the importance of disease duration. Arthritis Rheum 2000; 43(1):22–29. doi:10.1002/1529-0131(200001)43:1<22::AID-ANR4>3.0.CO;2-9
- Aletaha D, Neogi T, Silman AJ, et al. 2010 Rheumatoid arthritis classification criteria: an American College of Rheumatology/European League Against Rheumatism collaborative initiative. Arthritis Rheum 2010; 62(9):2569–2581. doi:10.1002/art.27584
- Nielen MM, van Schaardenburg D, Reesink HW, et al. Specific autoantibodies precede the symptoms of rheumatoid arthritis: a study of serial measurements in blood donors. Arthritis Rheum 2004; 50(2):380–386. doi:10.1002/art.20018
- del Puente A, Knowler WC, Pettitt DJ, Bennett PH. The incidence of rheumatoid arthritis is predicted by rheumatoid factor titer in a longitudinal population study. Arthritis Rheum 1988; 31(10):1239–1244. pmid:3178905
- Deane KD, Norris JM, Holers VM. Preclinical rheumatoid arthritis: identification, evaluation, and future directions for investigation. Rheum Dis Clin North Am 2010; 36(2):213–241. doi:10.1016/j.rdc.2010.02.001
- Kavanaugh A, Tomar R, Reveille J, Solomon DH, Homburger HA. Guidelines for clinical use of the antinuclear antibody test and tests for specific autoantibodies to nuclear antigens. American College of Pathologists. Arch Pathol Lab Med 2000; 124(1):71–81. doi:10.1043/0003-9985(2000)124<0071:GFCUOT>2.0.CO;2
- Suresh E. Systemic lupus erythematosus: diagnosis for the non-specialist. Br J Hosp Med (Lond) 2007; 68(10):538–541. doi:10.12968/hmed.2007.68.10.27324
- Illei GG, Klippel JH. Why is the ANA result positive? Bull Rheum Dis 1999; 48(1):1–4. pmid:10028188
- Tan EM, Feltkamp TE, Smolen JS, et al. Range of antinuclear antibodies in “healthy” individuals. Arthritis Rheum 1997; 40(9):1601–1611. doi:10.1002/art.1780400909
- Langkilde H, Voss A, Heegaard N, Laustrup H. Autoantibodies persist in relatives to systemic lupus erythematosus patients during 12 years follow-up. Lupus 2017; 26(7):723–728. doi:10.1177/0961203316676378
- Rondeel JM. Immunofluorescence versus ELISA for the detection of antinuclear antigens. Expert Rev Mol Diagn 2002; 2(3):226–232. doi:10.1586/14737159.2.3.226
- Solomon DH, Kavanaugh AJ, Schur PH; American College of Rheumatology Ad Hoc Committee on Immunologic Testing Guidelines. Evidence-based guidelines for the use of immunologic tests: antinuclear antibody testing. Arthritis Rheum 2002; 47(4):434–444. doi:10.1002/art.10561
- Slater CA, Davis RB, Shmerling RH. Antinuclear antibody testing. A study of clinical utility. Arch Intern Med 1996; 156(13):1421–1425. pmid:8678710
- Maddison PJ. Is it SLE? Best Pract Res Clin Rheumatol 2002; 16(2):167–180. doi:10.1053/berh.2001.0219
- Price E, Walker E. Diagnostic vertigo: the journey to diagnosis in systemic lupus erythematosus. Health (London) 2014; 18(3):223–239. doi:10.1177/1363459313488008
- Blumenthal DE. Tired, aching, ANA-positive: does your patient have lupus or fibromyalgia? Cleve Clin J Med 2002; 69(2):143–146, 151–152. pmid:11990644
- Miyakis S, Lockshin MD, Atsumi T, et al. International consensus statement on an update of the classification criteria for definite antiphospholipid syndrome (APS). J Thromb Haemost 2006; 4(2):295–306. doi:10.1111/j.1538-7836.2006.01753.x
- Keeling D, Mackie I, Moore GW, Greer IA, Greaves M; British Committee for Standards in Haematology. Guidelines on the investigation and management of antiphospholipid syndrome. Br J Haematol 2012; 157(1):47–58. doi:10.1111/j.1365-2141.2012.09037.x
- Giannakopoulos B, Passam F, Iannou Y, Krillis SA. How we diagnose the antiphospholipid syndrome. Blood 2009; 113(5):985–994. doi:10.1182/blood-2007-12-129627
- Biggioggero M, Meroni PL. The geoepidemiology of the antiphospholipid antibody syndrome. Autoimmun Rev 2010; 9(5):A299–A304. doi:10.1016/j.autrev.2009.11.013
- Pengo V, Ruffatti A, Legnani C, et al. Incidence of a first thromboembolic event in asymptomatic carriers of high-risk antiphospholipid antibody profile: a multicenter prospective study. Blood 2011; 118(17):4714–4718. doi:10.1182/blood-2011-03-340232
- Pengo V, Ruffatti A, Legnani C, et al. Clinical course of high-risk patients diagnosed with antiphospholipid syndrome. J Thromb Haemost 2010; 8(2):237–242. doi:10.1111/j.1538-7836.2009.03674.x
- Galli M, Luciani D, Bertolini G, Barbui T. Lupus anticoagulants are stronger risk factors for thrombosis than anticardiolipin antibodies in the antiphospholipid syndrome: a systematic review of the literature. Blood 2003; 101(5):1827–1832. doi:10.1182/blood-2002-02-0441
- Garcia D, Erkan D. Diagnosis and management of the antiphospholipid syndrome. N Engl J Med 2018; 378(21):2010–2021. doi:10.1056/NEJMra1705454
- Garcia D, Akl EA, Carr R, Kearon C. Antiphospholipid antibodies and the risk of recurrence after a first episode of venous thromboembolism: a systematic review. Blood 2013; 122(5):817–824. doi:10.1182/blood-2013-04-496257
- Cervera R. Lessons from the “Euro-Phospholipid” project. Autoimmun Rev 2008; 7(3):174–178. doi:10.1016/j.autrev.2007.11.011
- Andreoli L, Chighizola CB, Banzato A, Pons-Estel GJ, Ramire de Jesus G, Erkan D. Estimated frequency of antiphospholipid antibodies in patients with pregnancy morbidity, stroke, myocardial infarction, and deep vein thrombosis: a critical review of the literature. Arthritis Care Res (Hoboken) 2013; 65(11):1869–1873. doi:10.1002/acr.22066
- Miller A, Chan M, Wiik A, Misbah SA, Luqmani RA. An approach to the diagnosis and management of systemic vasculitis. Clin Exp Immunol 2010; 160(2):143–160. doi:10.1111/j.1365-2249.2009.04078.x
- Cornec D, Cornec-Le-Gall E, Fervenza FC, Specks U. ANCA-associated vasculitis—clinical utility of using ANCA specificity to classify patients. Nat Rev Rheumatol 2016; 12(10):570–579. doi:10.1038/nrrheum.2016.123
- Edgar JD, McMillan SA, Bruce IN, Conlan SK. An audit of ANCA in routine clinical practice. Postgrad Med J 1995; 71(840):605–612. pmid:8545289
- McLaren JS, Stimson RH, McRorie ER, Coia JE, Luqmani RA. The diagnostic value of anti-neutrophil cytoplasmic testing in a routine clinical setting. QJM 2001; 94(11):615–621. pmid:11704691
- Mandl LA, Solomon DH, Smith EL, Lew RA, Katz JN, Shmerling RH. Using antineutrophil cytoplasmic antibody testing to diagnose vasculitis: can test-ordering guidelines improve diagnostic accuracy? Arch Intern Med 2002; 162(13):1509–1514. pmid:12090888
- Sinclair D, Saas M, Stevens JM. The effect of a symptom related “gated policy” on ANCA requests in routine clinical practice. J Clin Pathol 2004; 57(2):131–134. pmid:14747434
- Arnold DF, Timms A, Luqmani R, Misbah SA. Does a gating policy for ANCA overlook patients with ANCA associated vasculitis? An audit of 263 patients. J Clin Pathol 2010; 63(8):678–680. doi:10.1136/jcp.2009.072504
- Savige J, Gills D, Benson E, et al. International consensus statement on testing and reporting of antineutrophil cytoplasmic antibodies (ANCA). Am J Clin Pathol 1999; 111(4):507–513. pmid:10191771
- Robinson PC, Steele RH. Appropriateness of antineutrophil cytoplasmic antibody testing in a tertiary hospital. J Clin Pathol 2009; 62(8):743–745. doi:10.1136/jcp.2009.064485
- Bossuyt X, Cohen Tervaert JW, Arimura Y, et al. Position paper: revised 2017 international consensus on testing of ANCAs in granulomatosis with polyangiitis and microscopic polyangiitis. Nat Rev Rheumatol 2017; 13(11):683–692. doi:10.1038/nrrheum.2017.140
- Hagen EC, Daha MR, Hermans J, et al. Diagnostic value of standardized assays for anti-neutrophil cytoplasmic antibodies in idiopathic systemic vasculitis. EC/BCR Project for ANCA Assay Standardization. Kidney Int 1998; 53(3):743–753. doi:10.1046/j.1523-1755.1998.00807.x
- Damoiseaux J, Csemok E, Rasmussen N, et al. Detection of antineutrophil antibodies (ANCAs): a multicentre European Vasculitis Study Group (EUVAS) evaluation of the value of indirect immunofluorescence (IIF) versus antigen specific immunoassays. Ann Rheum Dis 2017; 76(4):647–653. doi:10.1136/annrheumdis-2016-209507
- Suresh E. Diagnostic approach to patients with suspected vasculitis. Postgrad Med J 2006; 82(970):483–488. doi:10.1136/pgmj.2005.042648
- Vermeersch P, Blockmans D, Bossuyt X. Use of likelihood ratios can improve the clinical usefulness of enzyme immunoassays for the diagnosis of small-vessel vasculitis. Clin Chem 2009; 55(10):1886–1888. doi:10.1373/clinchem.2009.130583
- Bowness P. HLA-B27. Annu Rev Immunol 2015; 33:29–48. doi:10.1146/annurev-immunol-032414-112110
- Sieper J, Poddubnyy D. Axial spondyloarthritis. Lancet 2017; 390(10089):73–84. doi:10.1016/S0140-6736(16)31591-4
- Khan MA. Thoughts concerning the early diagnosis of ankylosing spondylitis and related diseases. Clin Exp Rheumatol 2002; 20(6 suppl 28):S6–S10. pmid:12463439
- Braun J, Bollow M, Remlinger G, et al. Prevalence of spondyloarthropathies in HLA-B27 positive and negative blood donors. Arthritis Rheum 1998; 41(1):58–67. doi:10.1002/1529-0131(199801)41:1<58::AID-ART8>3.0.CO;2-G
- van der Linden SM, Valkenburg HA, de Jongh BM, Cats A. The risk of developing ankylosing spondylitis in HLA-B27 positive individuals. A comparison of relatives of spondylitis patients with the general population. Arthritis Rheum 1984; 27(3):241–249. pmid:6608352
- Sheehan NJ. HLA-B27: what’s new? Rheumatology (Oxford) 2010; 49(4):621–631. doi:10.1093/rheumatology/kep450
- Baraliakos X, Maksymmowych WP. Imaging in the diagnosis and management of axial spondyloarthritis. Best Pract Res Clin Rheumatol 2016; 30(4):608–623. doi:10.1016/j.berh.2016.09.011
- Mandl P, Navarro-Compan V, Terslev L, et al; European League Against Rheumatism (EULAR). EULAR recommendations for the use of imaging in the diagnosis and management of spondyloarthritis in clinical practice. Ann Rheum Dis 2015; 74(7):1327–1339. doi:10.1136/annrheumdis-2014-206971
- McAllister K, Goodson N, Warburton I, Rogers G. Spondyloarthritis: diagnosis and management: summary of NICE guidance. BMJ 2017; 356:j839. doi:10.1136/bmj.j839
- Poddubnyy D, van Tubergen A, Landewé R, Sieper J, van der Heijde D; Assessment of SpondyloArthritis international Society (ASAS). Development of an ASAS-endorsed recommendation for the early referral of patients with a suspicion of axial spondyloarthritis. Ann Rheum Dis 2015; 74(8):1483–1487. doi:10.1136/annrheumdis-2014-207151
- Rudwaleit M, van der Heijde D, Landewe R, et al. The development of Assessment of SpondyloArthritis International Society classification criteria for axial spondyloarthritis (part II): validation and final selection. Ann Rheum Dis 2009; 68(6):777–783. doi:10.1136/ard.2009.108233
KEY POINTS
- If a test was requested without a clear indication and the result is positive, it is important to bear in mind the potential pitfalls associated with that test; immunologic tests have limited specificity.
- A positive rheumatoid factor or anticitrullinated peptide antibody test can help diagnose rheumatoid arthritis in a patient with early polyarthritis.
- A positive HLA-B27 test can help diagnose ankylosing spondylitis in patients with inflammatory back pain and normal imaging.
- Positive antinuclear cytoplasmic antibody (ANCA) can help diagnose ANCA-associated vasculitis in a patient with glomerulonephritis.
- A negative antinuclear antibody test reduces the likelihood of lupus in a patient with joint pain.
Statistical Modeling and Aggregate-Weighted Scoring Systems in Prediction of Mortality and ICU Transfer: A Systematic Review
Ensuring the delivery of safe and cost-effective care is the core mission of hospitals,1 but nearly 90% of unplanned patient transfers to critical care may be the result of a new or worsening condition.2 The cost of treatment of sepsis, respiratory failure, and arrest, which are among the deadliest conditions for hospitalized patients,3,4 are estimated to be $30.7 billion annually (8.1% of national hospital costs).5 As many as 44% of adverse events may be avoidable,6 and concerns about patient safety have motivated hospitals and health systems to find solutions to identify and treat deteriorating patients expeditiously. Evidence suggests that many hospitalized patients presenting with rapid decline showed warning signs 24-48 hours before the event.7 Therefore, ample time may be available for early identification and intervention in many patients.
As early as 1997, hospitals have used early warning systems (EWSs) to identify at-risk patients and proactively inform clinicians.8 EWSs can predict a proportion of patients who are at risk for clinical deterioration (this benefit is measured with sensitivity) with the tradeoff that some alerts are false (as measured with positive predictive value [PPV] or its inverse, workup-to-detection ratio [WDR]9-11). Historically, EWS tools were paper-based instruments designed for fast manual calculation by hospital staff. Many aggregate-weighted EWS instruments continue to be used for research and practice, including the Modified Early Warning Systems (MEWS)12 and National Early Warning System (NEWS).13,14 Aggregate-weighted EWSs lack predictive precision because they use simple addition of a few clinical parameter scores, including vital signs and level of consciousness.15 Recently, a new category has emerged, which use multivariable regression or machine learning; we refer to this category as “EWSs using statistical modeling”. This type of EWS uses more computationally intensive risk stratification methods to predict risk16 by adjusting for a larger set of clinical covariates, thereby reducing the degree of unexplained variance. Although these EWSs are thought to be more precise and to generate fewer false positive alarms compared with others,14,17-19 no review to date has systematically synthesized and compared their performance against aggregate-weighted EWSs.
Purpose
The purpose of this systematic review was to evaluate the recent literature regarding prognostic test accuracy and clinical workloads generated by EWSs using statistical modeling versus aggregate-weighted systems.
METHODS
Search Strategy
Adhering to PRISMA protocol guidelines for systematic reviews, we searched the peer-reviewed literature in PubMed and CINAHL Plus, as well as conference proceedings and online repositories of patient safety organizations published between January 1, 2012 and September 15, 2018. We selected this timeframe because EWSs using statistical modeling are relatively new approaches compared with the body of evidence concerning aggregate-weighted EWSs. An expert PhD researcher confirmed the search results in a blinded independent query.
Inclusion and Exclusion Criteria
We included peer-reviewed articles reporting the area under the receiver operator curve (AUC),20 or the equivalent c-statistic, of models predicting clinical deterioration (measured as the composite of transfer to intensive care unit (ICU) and/or mortality) among adult patients in general hospital wards. We excluded studies if they did not compare an EWS using statistical modeling with an aggregate-weighted EWS, did not report AUC, or only reported on an aggregate-weighted EWS. Excluded settings were pediatrics, obstetrics, emergency departments, ICUs, transitional care units, and oncology. We also excluded studies with samples limited to physiological monitoring, sepsis, or postsurgical subpopulations.
Data Abstraction
Following the TRIPOD guidelines for the reporting of predictive models,21 and the PRISMA and Cochrane Collaboration guidelines for systematic reviews,22-24 we extracted study characteristics (Table 1), sample demographics (Appendix Table 4), model characteristics and performance (Appendix Table 5), and level of scientific evidence and risk of bias (Appendix Table 6). To address the potential for overfitting, we selected model performance results of the validation dataset rather than the derivation dataset, if reported. If studies reported multiple models in either EWS category, we selected the best-performing model for comparison.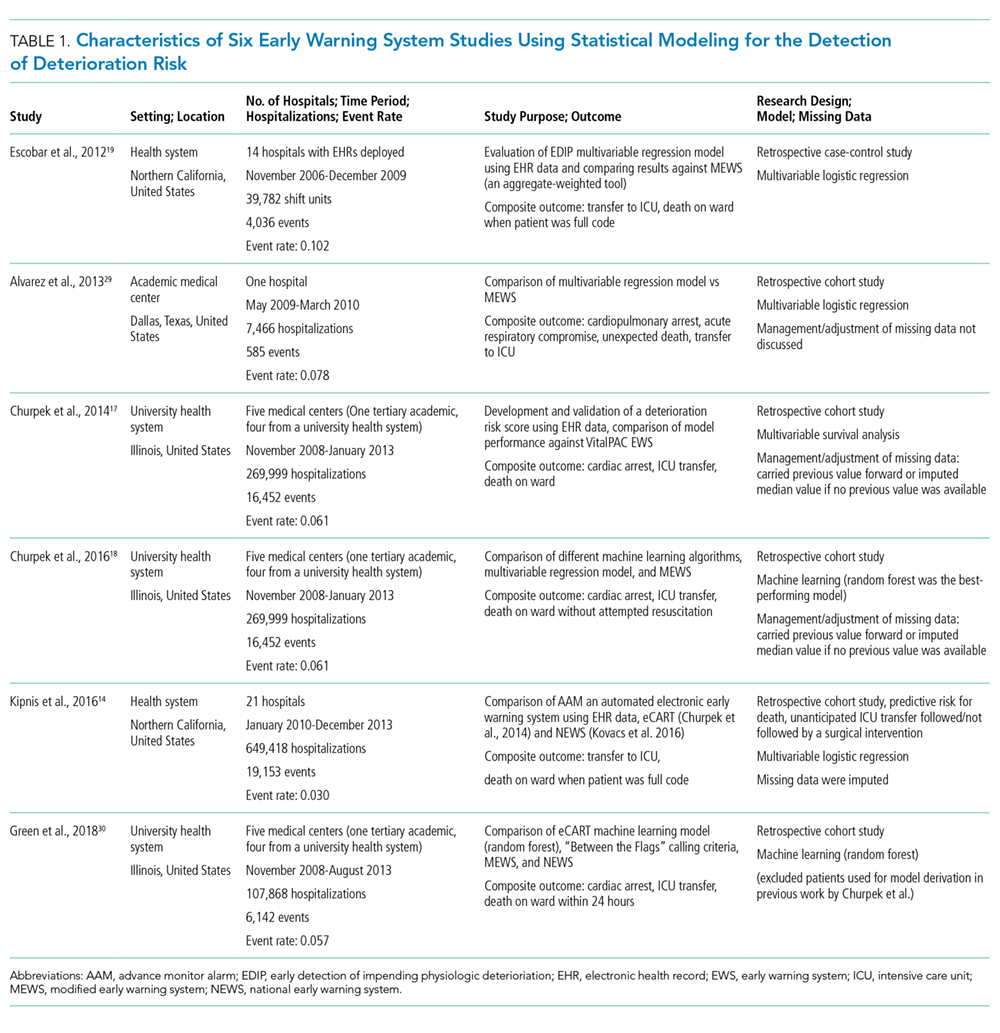
Measures of Model Performance
Because predictive models can achieve good case identification at the expense of high clinical workloads, an assessment of model performance would be incomplete without measures of clinical utility. For clinicians, this aspect can be measured as the model’s PPV (the percentage of true positive alerts among all alerts), or more intelligibly, as the WDR, which equals 1/PPV. WDR indicates the number of patients requiring evaluation to identify and treat one true positive case.9-11 It is known that differences in event rates (prevalence or pretest probability) influence a model’s PPV25 and its reciprocal WDR. However, for systematic comparison, PPV and WDR can be standardized using a fixed representative event rate across studies.24,26 We abstracted the reported PPV and WDR, and computed standardized PPV and WDR for an event rate of 4%.
Other measures included the area under the receiver operator curve (AUC),20 sensitivity, and specificity. AUC plots a model’s false positive rate (x-axis) against its true positive rate (y-axis), with an ideal scenario of very high y-values and very low x-values.27 Sensitivity (the model’s ability to detect a true positive case among all cases) and specificity (the model’s ability to detect a true noncase among all noncases28) are influenced by chosen alert thresholds. It is incorrect to assume that a given model produces only one sensitivity/specificity result; for systematic comparison, we therefore selected results in the 50% sensitivity range, and separately, in the 92% specificity range for EWSs using statistical modeling. Then, we simulated a fixed sensitivity of 0.51 and assumed specificity of 0.87 in aggregate-weighted EWSs.
RESULTS
Search Results
The PubMed search for “early warning score OR early warning system AND deterioration OR predict transfer ICU” returned 285 peer-reviewed articles. A search on CINAHL Plus using the same filters and query terms returned 219 articles with no additional matches (Figure 1). Of the 285 articles, we excluded 269 during the abstract screen and 10 additional articles during full-text review (Figure 1). A final review of the reference lists of the six selected studies did not yield additional articles.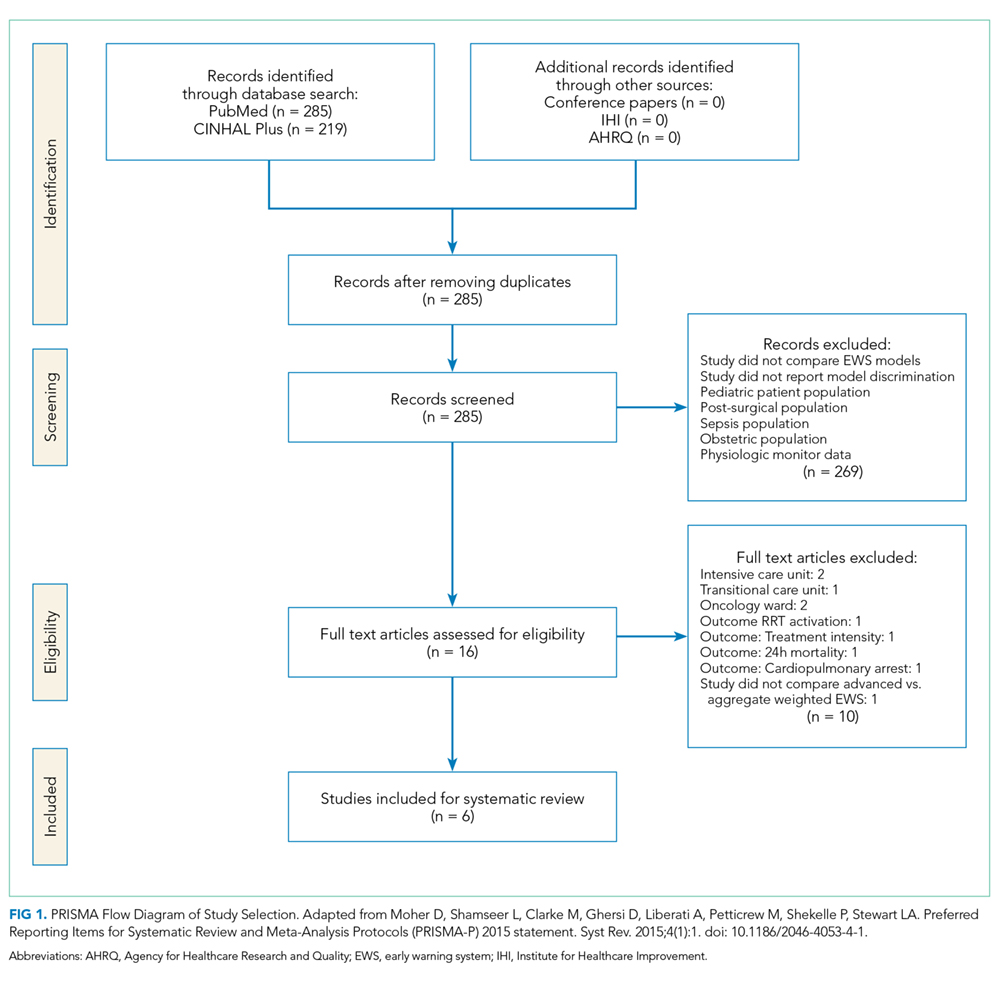
Study Characteristics
There were several similarities across the selected studies (Table 1). All occurred in the United States; all compared their model’s performance against at least one aggregate-weighted EWS model;14,17-19,29 and all used retrospective cohort designs. Of the six studies, one took place in a single hospital;29 three pooled data from five hospitals;17,18,30 and two occurred in a large integrated healthcare delivery system using data from 14 and, subsequently, 21 hospitals.14,19 The largest study14 included nearly 650,000 admissions, while the smallest study29 reported slightly less than 7,500 admissions. Of the six studies, four used multivariable regression,14,17,19,29 and two used machine learning techniques for outcome prediction.18,30
Outcome Variables
The primary outcome for inclusion in this review was clinical deterioration measured by the composite of transfer to ICU and some measure of mortality. Churpek et al.10,11 and Green et al.30 also included cardiac arrest, and Alvarez et al.22 included respiratory compromise in their outcome composite.
Researchers used varying definitions of mortality, including “death outside the ICU in a patient whose care directive was full code;”14,19 “death on the wards without attempted resuscitation;”17,18 “an in-hospital death in patients without a DNR order at admission that occurred on the medical ward or in ICU within 24 hours after transfer;”29 or “death within 24 hours.”30
Predictor Variables
We observed a broad assortment of predictor variables. All models included vital signs (heart rate, respiratory rate, blood pressure, and venous oxygen saturation); mental state; laboratory data; age; and sex. Additional variables included comorbidity, shock index,31 severity of illness score, length of stay, event time of day, season, admission category, and length of stay,14,19 among others.
Model Performance
Reported PPV ranged from 0.16 to 0.42 (mean = 0.27) in EWSs using statistical modeling and 0.15 to 0.28 (mean = 0.19) in aggregate-weighted EWS models. The weighted mean standardized PPV, adjusted for an event rate of 4% across studies (Table 2), was 0.21 in EWSs using statistical modeling versus 0.14 in aggregate-weighted EWS models (simulated at 0.51 sensitivity and 0.87 specificity).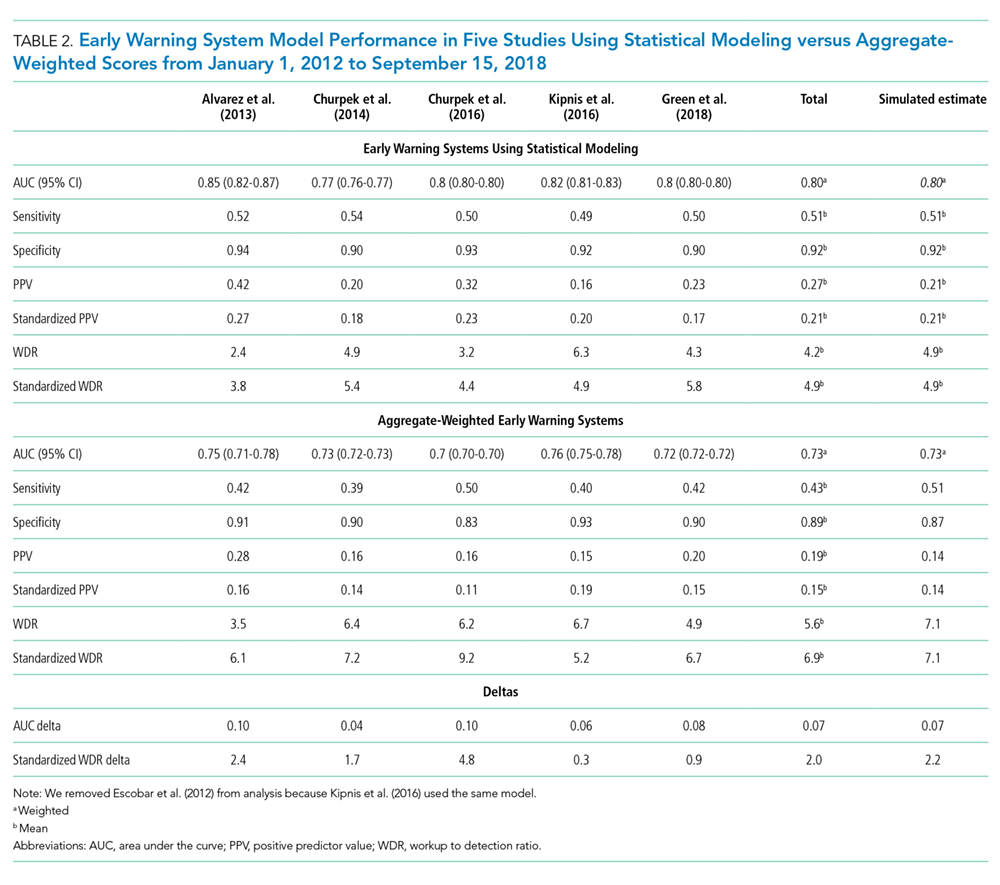
Only two studies14,19 reported the WDR metric (alerts generated to identify one true positive case) explicitly. Based on the above PPV results, EWSs using statistical modeling generated a standardized WDR of 4.9 in models using statistical modeling versus 7.1 in aggregate-weighted models (Figure 2). The delta of 2.2 evaluations to find and treat one true positive case equals a 45% relative increase in RRT evaluation workloads using aggregate-weighted EWSs.
AUC values ranged from 0.77 to 0.85 (weighted mean = 0.80) in EWSs using statistical modeling, indicating good model discrimination. AUCs of aggregate-weighted EWSs ranged from 0.70 to 0.76 (weighted mean = 0.73), indicating fair model discrimination (Figure 2). The overall AUC delta was 0.07. However, our estimates may possibly be favoring EWSs that use statistical modeling by virtue of their derivation in an original research population compared with aggregate-weighted EWSs that were derived externally. For example, sensitivity analysis of eCART,18 an EWS using machine learning, showed an AUC drop of 1% in a large external patient population,14 while NEWS AUCs13 dropped between 11% and 15% in two large external populations (Appendix Table 7).14,30 For hospitals adopting an externally developed EWS using statistical modeling, these results suggest that an AUC delta of approximately 5% can be expected and 7% for an internally developed EWS.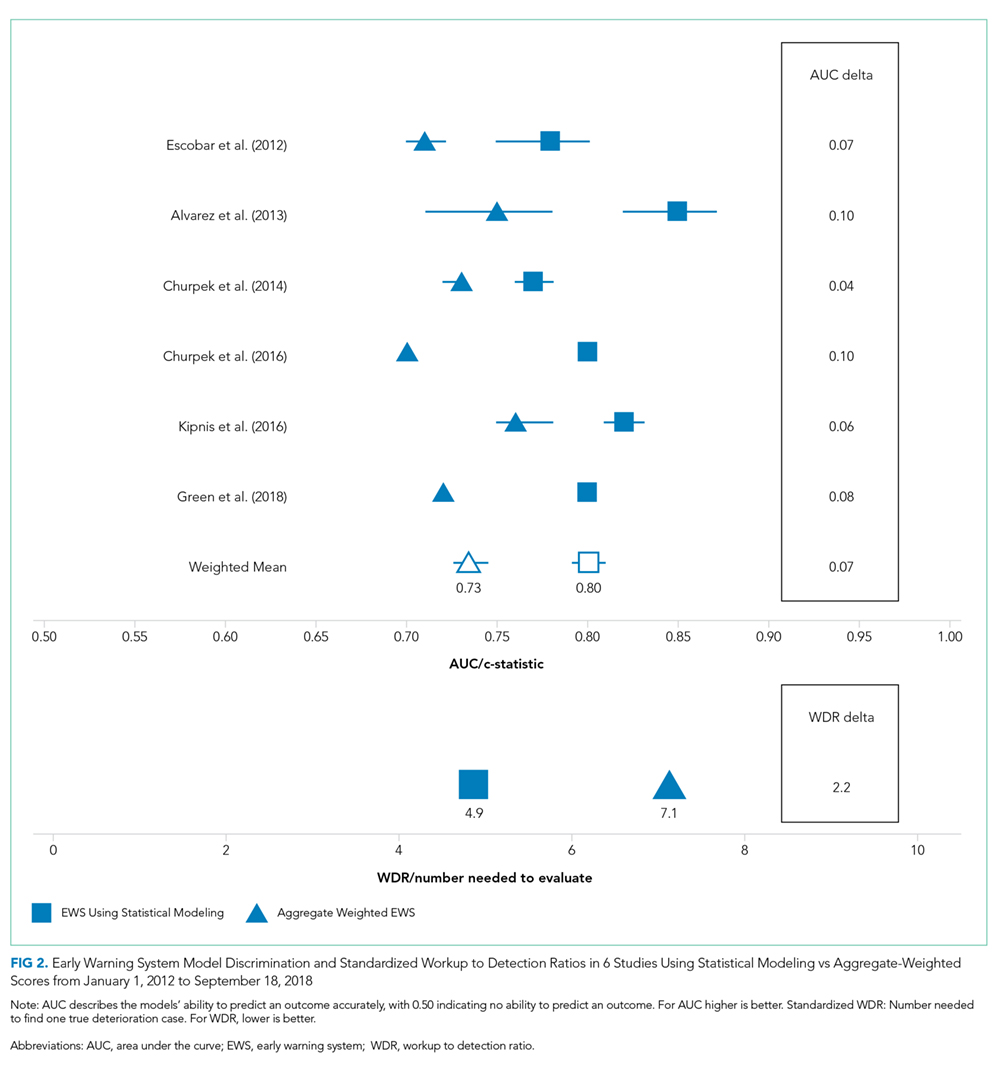
The models’ sensitivity ranged from 0.49 to 0.54 (mean = 0.51) for EWSs using statistical modeling and 0.39 to 0.50 (mean = 0.43). These results were based on chosen alert volume cutoffs. Specificity ranged from 0.90 to 0.94 (mean = 0.92) in EWSs using statistical modeling compared with 0.83 to 0.93 (mean = 0.89) in aggregate-weighted EWS models. At the 0.51 sensitivity level (mean sensitivity of reported EWSs using statistical modeling), aggregate-weighted EWSs would have an estimated specificity of approximately 0.87. Conversely, to reach a specificity of 0.92 (mean specificity of reported EWSs using statistical modeling, aggregate-weighted EWSs would have a sensitivity of approximately 0.42 compared with 0.50 in EWSs using statistical modeling (based on three studies reporting both sensitivity and specificity or an AUC graph).
Risk of Bias Assessment
We scored the studies by adapting the Cochrane Collaboration tool for assessing risk of bias 32 (Appendix Table 5). Of the six studies, five received total scores between 1.0 and 2.0 (indicating relatively low bias risk), and one study had a score of 3.5 (indicating higher bias risk). Low bias studies14,17-19,30 used large samples across multiple hospitals, discussed the choice of predictor variables and outcomes more precisely, and reported their measurement approaches and analytic methods in more detail, including imputation of missing data and model calibration.
DISCUSSION
In this systematic review, we assessed the predictive ability of EWSs using statistical modeling versus aggregate-weighted EWS models to detect clinical deterioration risk in hospitalized adults in general wards. From 2007 to 2018, at least five systematic reviews examined aggregate-weighted EWSs in adult inpatient settings.33-37 No systematic review, however, has synthesized the evidence of EWSs using statistical modeling.
The recent evidence is limited to six studies, of which five had favorable risk of bias scores. All studies included in this review demonstrated superior model performance of the EWSs using statistical modeling compared with an aggregate-weighted EWS, and at least five of the six studies employed rigor in design, measurement, and analytic method. The AUC absolute difference between EWSs using statistical modeling and aggregate-weighted EWSs was 7% overall, moving model performance from fair to good (Table 2; Figure 2). Although this increase in discriminative power may appear modest, it translates into avoiding a 45% increase in WDR workload generated by an aggregate-weighted EWS, approximately two patient evaluations for each true positive case.
Results of our review suggest that EWSs using statistical modeling predict clinical deterioration risk with better precision. This is an important finding for the following reasons: (1) Better risk prediction can support the activation of rescue; (2) Given federal mandates to curb spending, the elimination of some resource-intensive false positive evaluations supports high-value care;38 and (3) The Quadruple Aim39 accounts for clinician wellbeing. EWSs using statistical modeling may offer benefits in terms of clinician satisfaction with the human–system interface because better discrimination reduces the daily evaluation workload/cognitive burden and because the reduction of false positive alerts may reduce alert fatigue.40,41
Still, an important issue with risk detection is that it is unknown which percentage of patients are uniquely identified by an EWS and not already under evaluation by the clinical team. For example, a recent study by Bedoya et al.42 found that using NEWS did not improve clinical outcomes and nurses frequently disregarded the alert. Another study43 found that the combined clinical judgment of physicians and nurses had an AUC of 0.90 in predicting mortality. These results suggest that at certain times, an EWS alert may not add new useful information for clinicians even when it correctly identifies deterioration risk. It remains difficult to define exactly how many patients an EWS would have to uniquely identify to have clinical utility.
Even EWSs that use statistical modeling cannot detect all true deterioration cases perfectly, and they may at times trigger an alert only when the clinical team is already aware of a patient’s clinical decline. Consequently, EWSs using statistical modeling can at best augment and support—but not replace—RRT rounding, physician workup, and vigilant frontline staff. However, clinicians, too, are not perfect, and the failure-to-rescue literature suggests that certain human factors are antecedents to patient crises (eg, stress and distraction,44-46 judging by precedent/experience,44,47 and innate limitations of human cognition47). Because neither clinicians nor EWSs can predict deterioration perfectly, the best possible rescue response combines clinical vigilance, RRT rounding, and EWSs using statistical modeling as complementary solutions.
Our findings suggest that predictive models cannot be judged purely on AUC (in fact, it would be ill-advised) but also by their clinical utility (expressed in WDR and PPV): How many patients does a clinician need to evaluate?9-11 Precision is not meaningful if it comes at the expense of unmanageable evaluation workloads, and our findings suggest that clinicians should evaluate models based on their clinical utility. Hospitals considering adoption of an EWS using statistical modeling should consider that externally developed EWSs appear to experience a performance drop when applied to a new patient population; a slightly higher WDR and slightly lower AUC can be expected. EWSs using statistical modeling appear to perform best when tailored to the targeted patient population (or are derived in-house). Model depreciation over time will likely require recalibration. In addition, adoption of a machine learning algorithm may mean that original model results are obscured by the black box output of the algorithm.48-50
Findings from this systematic review are subject to several limitations. First, we applied strict inclusion criteria, which led us to exclude studies that offered findings in specialty units and specific patient subpopulations, among others. In the interest of systematic comparison, our findings are limited to general wards. We also restricted our search to recent studies that reported on models predicting clinical deterioration, which we defined as the composite of ICU transfer and/or death. Clinically, deteriorating patients in general wards either die or are transferred to ICU. This criterion resulted in exclusion of the Rothman Index,51 which predicts “death within 24 hours” but not ICU transfer. The AUC in this study was higher than those selected in this review (0.93 compared to 0.82 for MEWS; AUC delta: 0.09). The higher AUC may be a function of the outcome definition (30-day mortality would be more challenging to predict). Therefore, hospitals or health systems interested in purchasing an EWS using statistical modeling should carefully consider the outcome selection and definition.
Second, as is true for systematic reviews in general,52 the degree of clinical and methodological heterogeneity across the selected studies may limit our findings. Studies occurred in various settings (university hospital, teaching hospitals, and community hospitals), which may serve diverging patient populations. We observed that studies in university-based settings had a higher event rate ranging from 5.6% to 7.8%, which may result in higher PPV results in these settings. However, this increase would apply to both EWS types equally. To arrive at a “true” reflection of model performance, the simulations for PPV and WDR have used a more conservative event rate of 4%. We observed heterogenous mortality definitions, which did not always account for the reality that a patient’s death may be an appropriate outcome (ie, it was concordant with treatment wishes in the context of severe illness or an end-of-life trajectory). Studies also used different sampling procedures; some allowed multiple observations although most did not. The variation in sampling may change PPV and limit our systematic comparison. However, regardless of methodological differences, our review suggests that EWSs using statistical modeling perform better than aggregate-weighted EWSs in each of the selected studies.
Third, systematic reviews may be subject to the issue of publication bias because they can only compare published results and could possibly omit an unknown number of unpublished studies. However, the selected studies uniformly demonstrated similar model improvements, which are plausibly related to the larger number of covariates, statistical methods, and shrinkage of random error.
Finally, this review was limited to the comparison of observational studies, which aimed to answer how the two EWS classes compared. These studies did not address whether an alert had an impact on clinical care and patient outcomes. Results from at least one randomized nonblinded controlled trial suggest that alert-driven RRT activation may reduce the length of stay by 24 hours and use of oximetry, but has no impact on mortality, ICU transfer, and ICU length of stay.53
CONCLUSION
Our findings point to three areas of need for the field of predictive EWS research: (1) a standardized set of clinical deterioration outcome measures, (2) a standardized set of measures capturing clinical evaluation workload and alert frequency, and (3) cost estimates of clinical workloads with and without deployment of an EWS using statistical modeling. Given the present divergence of outcome definitions, EWS research may benefit from a common “clinical deterioration” outcome standard, including transfer to ICU, inpatient/30-day/90-day mortality, and death with DNR, comfort care, or hospice. The field is lacking a standardized clinical workload measure and an understanding of the net percentage of patients uniquely identified by an EWS.
By using predictive analytics, health systems may be better able to achieve the goals of high-value care and patient safety and support the Quadruple Aim. Still, gaps in knowledge exist regarding the measurement of the clinical processes triggered by EWSs, evaluation workloads, alert fatigue, clinician burnout associated with the human-alert interface, and costs versus benefits. Future research should evaluate the degree to which EWSs can identify risk among patients who are not already under evaluation by the clinical team, assess the balanced treatment effects of RRT interventions between decedents and survivors, and investigate clinical process times relative to the time of an EWS alert using statistical modeling.
Acknowledgments
The authors would like to thank Ms. Jill Pope at the Kaiser Permanente Center for Health Research in Portland, OR for her assistance with manuscript preparation. Daniel Linnen would like to thank Dr. Linda Franck, PhD, RN, FAAN, Professor at the University of California, San Francisco, School of Nursing for reviewing the manuscript.
Disclosures
The authors declare no conflicts of interest.
Funding
The Maribelle & Stephen Leavitt Scholarship, the Jonas Nurse Scholars Scholarship at the University of California, San Francisco, and the Nurse Scholars Academy Predoctoral Research Fellowship at Kaiser Permanente Northern California supported this study during Daniel Linnen’s doctoral training at the University of California, San Francisco. Dr. Vincent Liu was funded by National Institute of General Medical Sciences Grant K23GM112018.
1. Institute of Medicine (US) Committee on Quality of Health Care in America; Kohn LT, Corrigan JM, Donaldson MS, editors. To Err is Human: Building a Safer Health System. Washington (DC): National Academies Press (US); 2000. PubMed
2. Bapoje SR, Gaudiani JL, Narayanan V, Albert RK. Unplanned transfers to a medical intensive care unit: causes and relationship to preventable errors in care. J Hosp Med. 2011;6(2):68-72. doi: 10.1002/jhm.812. PubMed
3. Liu V, Escobar GJ, Greene JD, et al. Hospital deaths in patients with sepsis from 2 independent cohorts. JAMA. 2014;312(1):90-92. doi: 10.1001/jama.2014.5804. PubMed
4. Winters BD, Pham JC, Hunt EA, et al. Rapid response systems: a systematic review. Crit Care Med. 2007;35(5):1238-1243. doi: 10.1097/01.CCM.0000262388.85669.68. PubMed
5. Torio C. Andrews RM (AHRQ). National inpatient hospital costs: the most expensive conditions by payer, 2011. HCUP Statistical Brief# 160. August 2013. Agency for Healthcare Research and Quality, Rockville, MD. Agency for Healthcare Research and Quality. 2015. http://www.ncbi.nlm.nih.gov/books/NBK169005/. Accessed July 10, 2018. PubMed
6. Levinson DR, General I. Adverse events in hospitals: national incidence among Medicare beneficiaries. Department of Health and Human Services Office of the Inspector General. 2010.
7. McGaughey J, Alderdice F, Fowler R, et al. Outreach and Early Warning Systems (EWS) for the prevention of intensive care admission and death of critically ill adult patients on general hospital wards. Cochrane Database Syst Rev. 2007;3(3):CD005529:Cd005529. doi: 10.1002/14651858.CD005529.pub2. PubMed
8. Morgan R, Williams F, Wright M. An early warning score for the early detection of patients with impending illness. Clin Intensive Care. 1997;8:100.
9. Escobar GJ, Dellinger RP. Early detection, prevention, and mitigation of critical illness outside intensive care settings. J Hosp Med. 2016;11(1):S5-S10. doi: 10.1002/jhm.2653. PubMed
10. Escobar GJ, Ragins A, Scheirer P, et al. Nonelective rehospitalizations and postdischarge mortality: predictive models suitable for use in real time. Med Care. 2015;53(11):916-923. doi: 10.1097/MLR.0000000000000435. PubMed
11. Liu VX. Toward the “plateau of productivity”: enhancing the value of machine learning in critical care. Crit Care Med. 2018;46(7):1196-1197. doi: 10.1097/CCM.0000000000003170. PubMed
12. Subbe CP, Kruger M, Rutherford P, Gemmel L. Validation of a modified Early Warning Score in medical admissions. QJM. 2001;94(10):521-526. doi: 10.1093/qjmed/94.10.521. PubMed
13. Smith GB, Prytherch DR, Meredith P, Schmidt PE, Featherstone PI. The ability of the National Early Warning Score (NEWS) to discriminate patients at risk of early cardiac arrest, unanticipated intensive care unit admission, and death. Resuscitation. 2013;84(4):465-470. doi: 10.1016/j.resuscitation.2012.12.016. PubMed
14. Kipnis P, Turk BJ, Wulf DA, et al. Development and validation of an electronic medical record-based alert score for detection of inpatient deterioration outside the ICU. J Biomed Inform. 2016;64:10-19. doi: 10.1016/j.jbi.2016.09.013. PubMed
15. Romero-Brufau S, Huddleston JM, Naessens JM, et al. Widely used track and trigger scores: are they ready for automation in practice? Resuscitation. 2014;85(4):549-552. doi: 10.1016/j.resuscitation.2013.12.017. PubMed
16. Bates DW, Saria S, Ohno-Machado L, Shah A, Escobar G. Big data in health care: using analytics to identify and manage high-risk and high-cost patients. Health Aff (Millwood). 2014;33(7):1123-1131. doi: 10.1377/hlthaff.2014.0041. PubMed
17. Churpek MM, Yuen TC, Park SY, Gibbons R, Edelson DP. Using electronic health record data to develop and validate a prediction model for adverse outcomes in the wards. Crit Care Med. 2014;42(4):841-848. doi: 10.1097/CCM.0000000000000038. PubMed
18. Churpek MM, Yuen TC, Winslow C, et al. Multicenter comparison of machine learning methods and conventional regression for predicting clinical deterioration on the wards. Crit Care Med. 2016;44(2):368-374. doi: 10.1097/CCM.0000000000001571. PubMed
19. Escobar GJ, LaGuardia JC, Turk BJ, et al. Early detection of impending physiologic deterioration among patients who are not in intensive care: development of predictive models using data from an automated electronic medical record. J Hosp Med. 2012;7(5):388-395. doi: 10.1002/jhm.1929. PubMed
20. Zweig MH, Campbell G. Receiver-operating characteristic (ROC) plots: a fundamental evaluation tool in clinical medicine. Clin Chem. 1993;39(4):561-577. PubMed
21. Collins GS, Reitsma JB, Altman DG, Moons KG. Transparent reporting of a multivariable prediction model for individual prognosis or diagnosis (TRIPOD): the TRIPOD statement. BMC Med. 2015;13(1):1. doi: 10.1186/s12916-014-0241-z. PubMed
22. Moher D, Liberati A, Tetzlaff J, Altman DG, PRISMA Group. Preferred reporting items for systematic reviews and meta-analyses: the Prisma statement. PLOS Med. 2009;6(7):e1000097. doi: 10.1371/journal.pmed.1000097. PubMed
23. Higgins JP, Green S. Cochrane handbook for systematic reviews of interventions version 5.1. 0. The Cochrane Collaboration. 2011;5.
24. Bossuyt P, Davenport C, Deeks J, et al. Interpreting results and drawing conclusions. In: Higgins PTJ, Green S, eds. Cochrane Handbook for Systematic Reviews of Diagnostic Test Accuracy Version 0.9. The Cochrane Collaboration; 2013. Chapter 11
25. Altman DG, Bland JM. Statistics Notes: Diagnostic tests 2: predictive values. BMJ. 1994;309(6947):102. doi: 10.1136/bmj.309.6947.102. PubMed
26. Heston TF. Standardizing predictive values in diagnostic imaging research. J Magn Reson Imaging. 2011;33(2):505; author reply 506-507. doi: 10.1002/jmri.22466. PubMed
27. Hanley JA, McNeil BJ. The meaning and use of the area under a receiver operating characteristic (ROC) curve. Radiology. 1982;143(1):29-36. doi: 10.1148/radiology.143.1.7063747. PubMed
28. Bewick V, Cheek L, Ball J. Statistics review 13: receiver operating characteristic curves. Crit Care. 2004;8(6):508-512. doi: 10.1186/cc3000. PubMed
29. Alvarez CA, Clark CA, Zhang S, et al. Predicting out of intensive care unit cardiopulmonary arrest or death using electronic medical record data. BMC Med Inform Decis Mak. 2013;13:28. doi: 10.1186/1472-6947-13-28. PubMed
30. Green M, Lander H, Snyder A, et al. Comparison of the between the FLAGS calling criteria to the MEWS, NEWS and the electronic Cardiac Arrest Risk Triage (eCART) score for the identification of deteriorating ward patients. Resuscitation. 2018;123:86-91. doi: 10.1016/j.resuscitation.2017.10.028. PubMed
31. Berger T, Green J, Horeczko T, et al. Shock index and early recognition of sepsis in the emergency department: pilot study. West J Emerg Med. 2013;14(2):168-174. doi: 10.5811/westjem.2012.8.11546. PubMed
32. Higgins JPT, Altman DG, Gøtzsche PC, et al. The Cochrane Collaboration’s tool for assessing risk of bias in randomised trials. BMJ. 2011;343:d5928-d5928. doi: 10.1136/bmj.d5928.
33. Johnstone CC, Rattray J, Myers L. Physiological risk factors, early warning scoring systems and organizational changes. Nurs Crit Care. 2007;12(5):219-224. doi: 10.1111/j.1478-5153.2007.00238.x. PubMed
34. McNeill G, Bryden D. Do either early warning systems or emergency response teams improve hospital patient survival? A systematic review. Resuscitation. 2013;84(12):1652-1667. doi: 10.1016/j.resuscitation.2013.08.006. PubMed
35. Smith M, Chiovaro J, O’Neil M, et al. Early Warning System Scores: A Systematic Review. In: Washington (DC): Department of Veterans Affairs (US); 2014 Jan: https://www.ncbi.nlm.nih.gov/books/NBK259031/. Accessed January 23, 2017. PubMed
36. Smith ME, Chiovaro JC, O’Neil M, et al. Early warning system scores for clinical deterioration in hospitalized patients: a systematic review. Ann Am Thorac Soc. 2014;11(9):1454-1465. doi: 10.1513/AnnalsATS.201403-102OC. PubMed
37. Subbe CP, Williams E, Fligelstone L, Gemmell L. Does earlier detection of critically ill patients on surgical wards lead to better outcomes? Ann R Coll Surg Engl. 2005;87(4):226-232. doi: 10.1308/003588405X50921. PubMed
38. Berwick DM, Hackbarth AD. Eliminating waste in us health care. JAMA. 2012;307(14):1513-1516. doi: 10.1001/jama.2012.362. PubMed
39. Sikka R, Morath JM, Leape L. The Quadruple Aim: care, health, cost and meaning in work.. BMJ Quality & Safety. 2015;24(10):608-610. doi: 10.1136/bmjqs-2015-004160. PubMed
40. Guardia-Labar LM, Scruth EA, Edworthy J, Foss-Durant AM, Burgoon DH. Alarm fatigue: the human-system interface. Clin Nurse Spec. 2014;28(3):135-137. doi: 10.1097/NUR.0000000000000039. PubMed
41. Ruskin KJ, Hueske-Kraus D. Alarm fatigue: impacts on patient safety. Curr Opin Anaesthesiol. 2015;28(6):685-690. doi: 10.1097/ACO.0000000000000260. PubMed
42. Bedoya AD, Clement ME, Phelan M, et al. Minimal impact of implemented early warning score and best practice alert for patient deterioration. Crit Care Med. 2019;47(1):49-55. doi: 10.1097/CCM.0000000000003439. PubMed
43. Brabrand M, Hallas J, Knudsen T. Nurses and physicians in a medical admission unit can accurately predict mortality of acutely admitted patients: A prospective cohort study. PLoS One. 2014;9(7):e101739. doi: 10.1371/journal.pone.0101739. PubMed
44. Acquaviva K, Haskell H, Johnson J. Human cognition and the dynamics of failure to rescue: the Lewis Blackman case. J Prof Nurs. 2013;29(2):95-101. doi: 10.1016/j.profnurs.2012.12.009. PubMed
45. Jones A, Johnstone MJ. Inattentional blindness and failures to rescue the deteriorating patient in critical care, emergency and perioperative settings: four case scenarios. Aust Crit Care. 2017;30(4):219-223. doi: 10.1016/j.aucc.2016.09.005. PubMed
46. Reason J. Understanding adverse events: human factors. Qual Health Care. 1995;4(2):80-89. doi: 10.1136/qshc.4.2.80. PubMed
47. Bate L, Hutchinson A, Underhill J, Maskrey N. How clinical decisions are made. Br J Clin Pharmacol. 2012;74(4):614-620. doi: 10.1111/j.1365-2125.2012.04366.x. PubMed
48. Cabitza F, Rasoini R, Gensini GF. Unintended consequences of machine learning in medicine. JAMA. 2017;318(6):517-518. doi: 10.1001/jama.2017.7797. PubMed
49. Stead WW. Clinical implications and challenges of artificial intelligence and deep learning. JAMA. 2018;320(11):1107-1108. doi: 10.1001/jama.2018.11029. PubMed
50. Wong TY, Bressler NM. Artificial intelligence with deep learning technology looks into diabetic retinopathy screening. JAMA. 2016;316(22):2366-2367. doi: 10.1001/jama.2016.17563. PubMed
51. Finlay GD, Rothman MJ, Smith RA. Measuring the modified early warning score and the Rothman index: advantages of utilizing the electronic medical record in an early warning system. J Hosp Med. 2014;9(2):116-119. doi: 10.1002/jhm.2132. PubMed
52. Gagnier JJ, Moher D, Boon H, Beyene J, Bombardier C. Investigating clinical heterogeneity in systematic reviews: a methodologic review of guidance in the literature. BMC Med Res Methodol. 2012;12:111-111. doi: 10.1186/1471-2288-12-111. PubMed
53. Kollef MH, Chen Y, Heard K, et al. A randomized trial of real-time automated clinical deterioration alerts sent to a rapid response team. J Hosp Med. 2014;9(7):424-429. doi: 10.1002/jhm.2193. PubMed
Ensuring the delivery of safe and cost-effective care is the core mission of hospitals,1 but nearly 90% of unplanned patient transfers to critical care may be the result of a new or worsening condition.2 The cost of treatment of sepsis, respiratory failure, and arrest, which are among the deadliest conditions for hospitalized patients,3,4 are estimated to be $30.7 billion annually (8.1% of national hospital costs).5 As many as 44% of adverse events may be avoidable,6 and concerns about patient safety have motivated hospitals and health systems to find solutions to identify and treat deteriorating patients expeditiously. Evidence suggests that many hospitalized patients presenting with rapid decline showed warning signs 24-48 hours before the event.7 Therefore, ample time may be available for early identification and intervention in many patients.
As early as 1997, hospitals have used early warning systems (EWSs) to identify at-risk patients and proactively inform clinicians.8 EWSs can predict a proportion of patients who are at risk for clinical deterioration (this benefit is measured with sensitivity) with the tradeoff that some alerts are false (as measured with positive predictive value [PPV] or its inverse, workup-to-detection ratio [WDR]9-11). Historically, EWS tools were paper-based instruments designed for fast manual calculation by hospital staff. Many aggregate-weighted EWS instruments continue to be used for research and practice, including the Modified Early Warning Systems (MEWS)12 and National Early Warning System (NEWS).13,14 Aggregate-weighted EWSs lack predictive precision because they use simple addition of a few clinical parameter scores, including vital signs and level of consciousness.15 Recently, a new category has emerged, which use multivariable regression or machine learning; we refer to this category as “EWSs using statistical modeling”. This type of EWS uses more computationally intensive risk stratification methods to predict risk16 by adjusting for a larger set of clinical covariates, thereby reducing the degree of unexplained variance. Although these EWSs are thought to be more precise and to generate fewer false positive alarms compared with others,14,17-19 no review to date has systematically synthesized and compared their performance against aggregate-weighted EWSs.
Purpose
The purpose of this systematic review was to evaluate the recent literature regarding prognostic test accuracy and clinical workloads generated by EWSs using statistical modeling versus aggregate-weighted systems.
METHODS
Search Strategy
Adhering to PRISMA protocol guidelines for systematic reviews, we searched the peer-reviewed literature in PubMed and CINAHL Plus, as well as conference proceedings and online repositories of patient safety organizations published between January 1, 2012 and September 15, 2018. We selected this timeframe because EWSs using statistical modeling are relatively new approaches compared with the body of evidence concerning aggregate-weighted EWSs. An expert PhD researcher confirmed the search results in a blinded independent query.
Inclusion and Exclusion Criteria
We included peer-reviewed articles reporting the area under the receiver operator curve (AUC),20 or the equivalent c-statistic, of models predicting clinical deterioration (measured as the composite of transfer to intensive care unit (ICU) and/or mortality) among adult patients in general hospital wards. We excluded studies if they did not compare an EWS using statistical modeling with an aggregate-weighted EWS, did not report AUC, or only reported on an aggregate-weighted EWS. Excluded settings were pediatrics, obstetrics, emergency departments, ICUs, transitional care units, and oncology. We also excluded studies with samples limited to physiological monitoring, sepsis, or postsurgical subpopulations.
Data Abstraction
Following the TRIPOD guidelines for the reporting of predictive models,21 and the PRISMA and Cochrane Collaboration guidelines for systematic reviews,22-24 we extracted study characteristics (Table 1), sample demographics (Appendix Table 4), model characteristics and performance (Appendix Table 5), and level of scientific evidence and risk of bias (Appendix Table 6). To address the potential for overfitting, we selected model performance results of the validation dataset rather than the derivation dataset, if reported. If studies reported multiple models in either EWS category, we selected the best-performing model for comparison.
Measures of Model Performance
Because predictive models can achieve good case identification at the expense of high clinical workloads, an assessment of model performance would be incomplete without measures of clinical utility. For clinicians, this aspect can be measured as the model’s PPV (the percentage of true positive alerts among all alerts), or more intelligibly, as the WDR, which equals 1/PPV. WDR indicates the number of patients requiring evaluation to identify and treat one true positive case.9-11 It is known that differences in event rates (prevalence or pretest probability) influence a model’s PPV25 and its reciprocal WDR. However, for systematic comparison, PPV and WDR can be standardized using a fixed representative event rate across studies.24,26 We abstracted the reported PPV and WDR, and computed standardized PPV and WDR for an event rate of 4%.
Other measures included the area under the receiver operator curve (AUC),20 sensitivity, and specificity. AUC plots a model’s false positive rate (x-axis) against its true positive rate (y-axis), with an ideal scenario of very high y-values and very low x-values.27 Sensitivity (the model’s ability to detect a true positive case among all cases) and specificity (the model’s ability to detect a true noncase among all noncases28) are influenced by chosen alert thresholds. It is incorrect to assume that a given model produces only one sensitivity/specificity result; for systematic comparison, we therefore selected results in the 50% sensitivity range, and separately, in the 92% specificity range for EWSs using statistical modeling. Then, we simulated a fixed sensitivity of 0.51 and assumed specificity of 0.87 in aggregate-weighted EWSs.
RESULTS
Search Results
The PubMed search for “early warning score OR early warning system AND deterioration OR predict transfer ICU” returned 285 peer-reviewed articles. A search on CINAHL Plus using the same filters and query terms returned 219 articles with no additional matches (Figure 1). Of the 285 articles, we excluded 269 during the abstract screen and 10 additional articles during full-text review (Figure 1). A final review of the reference lists of the six selected studies did not yield additional articles.
Study Characteristics
There were several similarities across the selected studies (Table 1). All occurred in the United States; all compared their model’s performance against at least one aggregate-weighted EWS model;14,17-19,29 and all used retrospective cohort designs. Of the six studies, one took place in a single hospital;29 three pooled data from five hospitals;17,18,30 and two occurred in a large integrated healthcare delivery system using data from 14 and, subsequently, 21 hospitals.14,19 The largest study14 included nearly 650,000 admissions, while the smallest study29 reported slightly less than 7,500 admissions. Of the six studies, four used multivariable regression,14,17,19,29 and two used machine learning techniques for outcome prediction.18,30
Outcome Variables
The primary outcome for inclusion in this review was clinical deterioration measured by the composite of transfer to ICU and some measure of mortality. Churpek et al.10,11 and Green et al.30 also included cardiac arrest, and Alvarez et al.22 included respiratory compromise in their outcome composite.
Researchers used varying definitions of mortality, including “death outside the ICU in a patient whose care directive was full code;”14,19 “death on the wards without attempted resuscitation;”17,18 “an in-hospital death in patients without a DNR order at admission that occurred on the medical ward or in ICU within 24 hours after transfer;”29 or “death within 24 hours.”30
Predictor Variables
We observed a broad assortment of predictor variables. All models included vital signs (heart rate, respiratory rate, blood pressure, and venous oxygen saturation); mental state; laboratory data; age; and sex. Additional variables included comorbidity, shock index,31 severity of illness score, length of stay, event time of day, season, admission category, and length of stay,14,19 among others.
Model Performance
Reported PPV ranged from 0.16 to 0.42 (mean = 0.27) in EWSs using statistical modeling and 0.15 to 0.28 (mean = 0.19) in aggregate-weighted EWS models. The weighted mean standardized PPV, adjusted for an event rate of 4% across studies (Table 2), was 0.21 in EWSs using statistical modeling versus 0.14 in aggregate-weighted EWS models (simulated at 0.51 sensitivity and 0.87 specificity).
Only two studies14,19 reported the WDR metric (alerts generated to identify one true positive case) explicitly. Based on the above PPV results, EWSs using statistical modeling generated a standardized WDR of 4.9 in models using statistical modeling versus 7.1 in aggregate-weighted models (Figure 2). The delta of 2.2 evaluations to find and treat one true positive case equals a 45% relative increase in RRT evaluation workloads using aggregate-weighted EWSs.
AUC values ranged from 0.77 to 0.85 (weighted mean = 0.80) in EWSs using statistical modeling, indicating good model discrimination. AUCs of aggregate-weighted EWSs ranged from 0.70 to 0.76 (weighted mean = 0.73), indicating fair model discrimination (Figure 2). The overall AUC delta was 0.07. However, our estimates may possibly be favoring EWSs that use statistical modeling by virtue of their derivation in an original research population compared with aggregate-weighted EWSs that were derived externally. For example, sensitivity analysis of eCART,18 an EWS using machine learning, showed an AUC drop of 1% in a large external patient population,14 while NEWS AUCs13 dropped between 11% and 15% in two large external populations (Appendix Table 7).14,30 For hospitals adopting an externally developed EWS using statistical modeling, these results suggest that an AUC delta of approximately 5% can be expected and 7% for an internally developed EWS.
The models’ sensitivity ranged from 0.49 to 0.54 (mean = 0.51) for EWSs using statistical modeling and 0.39 to 0.50 (mean = 0.43). These results were based on chosen alert volume cutoffs. Specificity ranged from 0.90 to 0.94 (mean = 0.92) in EWSs using statistical modeling compared with 0.83 to 0.93 (mean = 0.89) in aggregate-weighted EWS models. At the 0.51 sensitivity level (mean sensitivity of reported EWSs using statistical modeling), aggregate-weighted EWSs would have an estimated specificity of approximately 0.87. Conversely, to reach a specificity of 0.92 (mean specificity of reported EWSs using statistical modeling, aggregate-weighted EWSs would have a sensitivity of approximately 0.42 compared with 0.50 in EWSs using statistical modeling (based on three studies reporting both sensitivity and specificity or an AUC graph).
Risk of Bias Assessment
We scored the studies by adapting the Cochrane Collaboration tool for assessing risk of bias 32 (Appendix Table 5). Of the six studies, five received total scores between 1.0 and 2.0 (indicating relatively low bias risk), and one study had a score of 3.5 (indicating higher bias risk). Low bias studies14,17-19,30 used large samples across multiple hospitals, discussed the choice of predictor variables and outcomes more precisely, and reported their measurement approaches and analytic methods in more detail, including imputation of missing data and model calibration.
DISCUSSION
In this systematic review, we assessed the predictive ability of EWSs using statistical modeling versus aggregate-weighted EWS models to detect clinical deterioration risk in hospitalized adults in general wards. From 2007 to 2018, at least five systematic reviews examined aggregate-weighted EWSs in adult inpatient settings.33-37 No systematic review, however, has synthesized the evidence of EWSs using statistical modeling.
The recent evidence is limited to six studies, of which five had favorable risk of bias scores. All studies included in this review demonstrated superior model performance of the EWSs using statistical modeling compared with an aggregate-weighted EWS, and at least five of the six studies employed rigor in design, measurement, and analytic method. The AUC absolute difference between EWSs using statistical modeling and aggregate-weighted EWSs was 7% overall, moving model performance from fair to good (Table 2; Figure 2). Although this increase in discriminative power may appear modest, it translates into avoiding a 45% increase in WDR workload generated by an aggregate-weighted EWS, approximately two patient evaluations for each true positive case.
Results of our review suggest that EWSs using statistical modeling predict clinical deterioration risk with better precision. This is an important finding for the following reasons: (1) Better risk prediction can support the activation of rescue; (2) Given federal mandates to curb spending, the elimination of some resource-intensive false positive evaluations supports high-value care;38 and (3) The Quadruple Aim39 accounts for clinician wellbeing. EWSs using statistical modeling may offer benefits in terms of clinician satisfaction with the human–system interface because better discrimination reduces the daily evaluation workload/cognitive burden and because the reduction of false positive alerts may reduce alert fatigue.40,41
Still, an important issue with risk detection is that it is unknown which percentage of patients are uniquely identified by an EWS and not already under evaluation by the clinical team. For example, a recent study by Bedoya et al.42 found that using NEWS did not improve clinical outcomes and nurses frequently disregarded the alert. Another study43 found that the combined clinical judgment of physicians and nurses had an AUC of 0.90 in predicting mortality. These results suggest that at certain times, an EWS alert may not add new useful information for clinicians even when it correctly identifies deterioration risk. It remains difficult to define exactly how many patients an EWS would have to uniquely identify to have clinical utility.
Even EWSs that use statistical modeling cannot detect all true deterioration cases perfectly, and they may at times trigger an alert only when the clinical team is already aware of a patient’s clinical decline. Consequently, EWSs using statistical modeling can at best augment and support—but not replace—RRT rounding, physician workup, and vigilant frontline staff. However, clinicians, too, are not perfect, and the failure-to-rescue literature suggests that certain human factors are antecedents to patient crises (eg, stress and distraction,44-46 judging by precedent/experience,44,47 and innate limitations of human cognition47). Because neither clinicians nor EWSs can predict deterioration perfectly, the best possible rescue response combines clinical vigilance, RRT rounding, and EWSs using statistical modeling as complementary solutions.
Our findings suggest that predictive models cannot be judged purely on AUC (in fact, it would be ill-advised) but also by their clinical utility (expressed in WDR and PPV): How many patients does a clinician need to evaluate?9-11 Precision is not meaningful if it comes at the expense of unmanageable evaluation workloads, and our findings suggest that clinicians should evaluate models based on their clinical utility. Hospitals considering adoption of an EWS using statistical modeling should consider that externally developed EWSs appear to experience a performance drop when applied to a new patient population; a slightly higher WDR and slightly lower AUC can be expected. EWSs using statistical modeling appear to perform best when tailored to the targeted patient population (or are derived in-house). Model depreciation over time will likely require recalibration. In addition, adoption of a machine learning algorithm may mean that original model results are obscured by the black box output of the algorithm.48-50
Findings from this systematic review are subject to several limitations. First, we applied strict inclusion criteria, which led us to exclude studies that offered findings in specialty units and specific patient subpopulations, among others. In the interest of systematic comparison, our findings are limited to general wards. We also restricted our search to recent studies that reported on models predicting clinical deterioration, which we defined as the composite of ICU transfer and/or death. Clinically, deteriorating patients in general wards either die or are transferred to ICU. This criterion resulted in exclusion of the Rothman Index,51 which predicts “death within 24 hours” but not ICU transfer. The AUC in this study was higher than those selected in this review (0.93 compared to 0.82 for MEWS; AUC delta: 0.09). The higher AUC may be a function of the outcome definition (30-day mortality would be more challenging to predict). Therefore, hospitals or health systems interested in purchasing an EWS using statistical modeling should carefully consider the outcome selection and definition.
Second, as is true for systematic reviews in general,52 the degree of clinical and methodological heterogeneity across the selected studies may limit our findings. Studies occurred in various settings (university hospital, teaching hospitals, and community hospitals), which may serve diverging patient populations. We observed that studies in university-based settings had a higher event rate ranging from 5.6% to 7.8%, which may result in higher PPV results in these settings. However, this increase would apply to both EWS types equally. To arrive at a “true” reflection of model performance, the simulations for PPV and WDR have used a more conservative event rate of 4%. We observed heterogenous mortality definitions, which did not always account for the reality that a patient’s death may be an appropriate outcome (ie, it was concordant with treatment wishes in the context of severe illness or an end-of-life trajectory). Studies also used different sampling procedures; some allowed multiple observations although most did not. The variation in sampling may change PPV and limit our systematic comparison. However, regardless of methodological differences, our review suggests that EWSs using statistical modeling perform better than aggregate-weighted EWSs in each of the selected studies.
Third, systematic reviews may be subject to the issue of publication bias because they can only compare published results and could possibly omit an unknown number of unpublished studies. However, the selected studies uniformly demonstrated similar model improvements, which are plausibly related to the larger number of covariates, statistical methods, and shrinkage of random error.
Finally, this review was limited to the comparison of observational studies, which aimed to answer how the two EWS classes compared. These studies did not address whether an alert had an impact on clinical care and patient outcomes. Results from at least one randomized nonblinded controlled trial suggest that alert-driven RRT activation may reduce the length of stay by 24 hours and use of oximetry, but has no impact on mortality, ICU transfer, and ICU length of stay.53
CONCLUSION
Our findings point to three areas of need for the field of predictive EWS research: (1) a standardized set of clinical deterioration outcome measures, (2) a standardized set of measures capturing clinical evaluation workload and alert frequency, and (3) cost estimates of clinical workloads with and without deployment of an EWS using statistical modeling. Given the present divergence of outcome definitions, EWS research may benefit from a common “clinical deterioration” outcome standard, including transfer to ICU, inpatient/30-day/90-day mortality, and death with DNR, comfort care, or hospice. The field is lacking a standardized clinical workload measure and an understanding of the net percentage of patients uniquely identified by an EWS.
By using predictive analytics, health systems may be better able to achieve the goals of high-value care and patient safety and support the Quadruple Aim. Still, gaps in knowledge exist regarding the measurement of the clinical processes triggered by EWSs, evaluation workloads, alert fatigue, clinician burnout associated with the human-alert interface, and costs versus benefits. Future research should evaluate the degree to which EWSs can identify risk among patients who are not already under evaluation by the clinical team, assess the balanced treatment effects of RRT interventions between decedents and survivors, and investigate clinical process times relative to the time of an EWS alert using statistical modeling.
Acknowledgments
The authors would like to thank Ms. Jill Pope at the Kaiser Permanente Center for Health Research in Portland, OR for her assistance with manuscript preparation. Daniel Linnen would like to thank Dr. Linda Franck, PhD, RN, FAAN, Professor at the University of California, San Francisco, School of Nursing for reviewing the manuscript.
Disclosures
The authors declare no conflicts of interest.
Funding
The Maribelle & Stephen Leavitt Scholarship, the Jonas Nurse Scholars Scholarship at the University of California, San Francisco, and the Nurse Scholars Academy Predoctoral Research Fellowship at Kaiser Permanente Northern California supported this study during Daniel Linnen’s doctoral training at the University of California, San Francisco. Dr. Vincent Liu was funded by National Institute of General Medical Sciences Grant K23GM112018.
1. Institute of Medicine (US) Committee on Quality of Health Care in America; Kohn LT, Corrigan JM, Donaldson MS, editors. To Err is Human: Building a Safer Health System. Washington (DC): National Academies Press (US); 2000. PubMed
2. Bapoje SR, Gaudiani JL, Narayanan V, Albert RK. Unplanned transfers to a medical intensive care unit: causes and relationship to preventable errors in care. J Hosp Med. 2011;6(2):68-72. doi: 10.1002/jhm.812. PubMed
3. Liu V, Escobar GJ, Greene JD, et al. Hospital deaths in patients with sepsis from 2 independent cohorts. JAMA. 2014;312(1):90-92. doi: 10.1001/jama.2014.5804. PubMed
4. Winters BD, Pham JC, Hunt EA, et al. Rapid response systems: a systematic review. Crit Care Med. 2007;35(5):1238-1243. doi: 10.1097/01.CCM.0000262388.85669.68. PubMed
5. Torio C. Andrews RM (AHRQ). National inpatient hospital costs: the most expensive conditions by payer, 2011. HCUP Statistical Brief# 160. August 2013. Agency for Healthcare Research and Quality, Rockville, MD. Agency for Healthcare Research and Quality. 2015. http://www.ncbi.nlm.nih.gov/books/NBK169005/. Accessed July 10, 2018. PubMed
6. Levinson DR, General I. Adverse events in hospitals: national incidence among Medicare beneficiaries. Department of Health and Human Services Office of the Inspector General. 2010.
7. McGaughey J, Alderdice F, Fowler R, et al. Outreach and Early Warning Systems (EWS) for the prevention of intensive care admission and death of critically ill adult patients on general hospital wards. Cochrane Database Syst Rev. 2007;3(3):CD005529:Cd005529. doi: 10.1002/14651858.CD005529.pub2. PubMed
8. Morgan R, Williams F, Wright M. An early warning score for the early detection of patients with impending illness. Clin Intensive Care. 1997;8:100.
9. Escobar GJ, Dellinger RP. Early detection, prevention, and mitigation of critical illness outside intensive care settings. J Hosp Med. 2016;11(1):S5-S10. doi: 10.1002/jhm.2653. PubMed
10. Escobar GJ, Ragins A, Scheirer P, et al. Nonelective rehospitalizations and postdischarge mortality: predictive models suitable for use in real time. Med Care. 2015;53(11):916-923. doi: 10.1097/MLR.0000000000000435. PubMed
11. Liu VX. Toward the “plateau of productivity”: enhancing the value of machine learning in critical care. Crit Care Med. 2018;46(7):1196-1197. doi: 10.1097/CCM.0000000000003170. PubMed
12. Subbe CP, Kruger M, Rutherford P, Gemmel L. Validation of a modified Early Warning Score in medical admissions. QJM. 2001;94(10):521-526. doi: 10.1093/qjmed/94.10.521. PubMed
13. Smith GB, Prytherch DR, Meredith P, Schmidt PE, Featherstone PI. The ability of the National Early Warning Score (NEWS) to discriminate patients at risk of early cardiac arrest, unanticipated intensive care unit admission, and death. Resuscitation. 2013;84(4):465-470. doi: 10.1016/j.resuscitation.2012.12.016. PubMed
14. Kipnis P, Turk BJ, Wulf DA, et al. Development and validation of an electronic medical record-based alert score for detection of inpatient deterioration outside the ICU. J Biomed Inform. 2016;64:10-19. doi: 10.1016/j.jbi.2016.09.013. PubMed
15. Romero-Brufau S, Huddleston JM, Naessens JM, et al. Widely used track and trigger scores: are they ready for automation in practice? Resuscitation. 2014;85(4):549-552. doi: 10.1016/j.resuscitation.2013.12.017. PubMed
16. Bates DW, Saria S, Ohno-Machado L, Shah A, Escobar G. Big data in health care: using analytics to identify and manage high-risk and high-cost patients. Health Aff (Millwood). 2014;33(7):1123-1131. doi: 10.1377/hlthaff.2014.0041. PubMed
17. Churpek MM, Yuen TC, Park SY, Gibbons R, Edelson DP. Using electronic health record data to develop and validate a prediction model for adverse outcomes in the wards. Crit Care Med. 2014;42(4):841-848. doi: 10.1097/CCM.0000000000000038. PubMed
18. Churpek MM, Yuen TC, Winslow C, et al. Multicenter comparison of machine learning methods and conventional regression for predicting clinical deterioration on the wards. Crit Care Med. 2016;44(2):368-374. doi: 10.1097/CCM.0000000000001571. PubMed
19. Escobar GJ, LaGuardia JC, Turk BJ, et al. Early detection of impending physiologic deterioration among patients who are not in intensive care: development of predictive models using data from an automated electronic medical record. J Hosp Med. 2012;7(5):388-395. doi: 10.1002/jhm.1929. PubMed
20. Zweig MH, Campbell G. Receiver-operating characteristic (ROC) plots: a fundamental evaluation tool in clinical medicine. Clin Chem. 1993;39(4):561-577. PubMed
21. Collins GS, Reitsma JB, Altman DG, Moons KG. Transparent reporting of a multivariable prediction model for individual prognosis or diagnosis (TRIPOD): the TRIPOD statement. BMC Med. 2015;13(1):1. doi: 10.1186/s12916-014-0241-z. PubMed
22. Moher D, Liberati A, Tetzlaff J, Altman DG, PRISMA Group. Preferred reporting items for systematic reviews and meta-analyses: the Prisma statement. PLOS Med. 2009;6(7):e1000097. doi: 10.1371/journal.pmed.1000097. PubMed
23. Higgins JP, Green S. Cochrane handbook for systematic reviews of interventions version 5.1. 0. The Cochrane Collaboration. 2011;5.
24. Bossuyt P, Davenport C, Deeks J, et al. Interpreting results and drawing conclusions. In: Higgins PTJ, Green S, eds. Cochrane Handbook for Systematic Reviews of Diagnostic Test Accuracy Version 0.9. The Cochrane Collaboration; 2013. Chapter 11
25. Altman DG, Bland JM. Statistics Notes: Diagnostic tests 2: predictive values. BMJ. 1994;309(6947):102. doi: 10.1136/bmj.309.6947.102. PubMed
26. Heston TF. Standardizing predictive values in diagnostic imaging research. J Magn Reson Imaging. 2011;33(2):505; author reply 506-507. doi: 10.1002/jmri.22466. PubMed
27. Hanley JA, McNeil BJ. The meaning and use of the area under a receiver operating characteristic (ROC) curve. Radiology. 1982;143(1):29-36. doi: 10.1148/radiology.143.1.7063747. PubMed
28. Bewick V, Cheek L, Ball J. Statistics review 13: receiver operating characteristic curves. Crit Care. 2004;8(6):508-512. doi: 10.1186/cc3000. PubMed
29. Alvarez CA, Clark CA, Zhang S, et al. Predicting out of intensive care unit cardiopulmonary arrest or death using electronic medical record data. BMC Med Inform Decis Mak. 2013;13:28. doi: 10.1186/1472-6947-13-28. PubMed
30. Green M, Lander H, Snyder A, et al. Comparison of the between the FLAGS calling criteria to the MEWS, NEWS and the electronic Cardiac Arrest Risk Triage (eCART) score for the identification of deteriorating ward patients. Resuscitation. 2018;123:86-91. doi: 10.1016/j.resuscitation.2017.10.028. PubMed
31. Berger T, Green J, Horeczko T, et al. Shock index and early recognition of sepsis in the emergency department: pilot study. West J Emerg Med. 2013;14(2):168-174. doi: 10.5811/westjem.2012.8.11546. PubMed
32. Higgins JPT, Altman DG, Gøtzsche PC, et al. The Cochrane Collaboration’s tool for assessing risk of bias in randomised trials. BMJ. 2011;343:d5928-d5928. doi: 10.1136/bmj.d5928.
33. Johnstone CC, Rattray J, Myers L. Physiological risk factors, early warning scoring systems and organizational changes. Nurs Crit Care. 2007;12(5):219-224. doi: 10.1111/j.1478-5153.2007.00238.x. PubMed
34. McNeill G, Bryden D. Do either early warning systems or emergency response teams improve hospital patient survival? A systematic review. Resuscitation. 2013;84(12):1652-1667. doi: 10.1016/j.resuscitation.2013.08.006. PubMed
35. Smith M, Chiovaro J, O’Neil M, et al. Early Warning System Scores: A Systematic Review. In: Washington (DC): Department of Veterans Affairs (US); 2014 Jan: https://www.ncbi.nlm.nih.gov/books/NBK259031/. Accessed January 23, 2017. PubMed
36. Smith ME, Chiovaro JC, O’Neil M, et al. Early warning system scores for clinical deterioration in hospitalized patients: a systematic review. Ann Am Thorac Soc. 2014;11(9):1454-1465. doi: 10.1513/AnnalsATS.201403-102OC. PubMed
37. Subbe CP, Williams E, Fligelstone L, Gemmell L. Does earlier detection of critically ill patients on surgical wards lead to better outcomes? Ann R Coll Surg Engl. 2005;87(4):226-232. doi: 10.1308/003588405X50921. PubMed
38. Berwick DM, Hackbarth AD. Eliminating waste in us health care. JAMA. 2012;307(14):1513-1516. doi: 10.1001/jama.2012.362. PubMed
39. Sikka R, Morath JM, Leape L. The Quadruple Aim: care, health, cost and meaning in work.. BMJ Quality & Safety. 2015;24(10):608-610. doi: 10.1136/bmjqs-2015-004160. PubMed
40. Guardia-Labar LM, Scruth EA, Edworthy J, Foss-Durant AM, Burgoon DH. Alarm fatigue: the human-system interface. Clin Nurse Spec. 2014;28(3):135-137. doi: 10.1097/NUR.0000000000000039. PubMed
41. Ruskin KJ, Hueske-Kraus D. Alarm fatigue: impacts on patient safety. Curr Opin Anaesthesiol. 2015;28(6):685-690. doi: 10.1097/ACO.0000000000000260. PubMed
42. Bedoya AD, Clement ME, Phelan M, et al. Minimal impact of implemented early warning score and best practice alert for patient deterioration. Crit Care Med. 2019;47(1):49-55. doi: 10.1097/CCM.0000000000003439. PubMed
43. Brabrand M, Hallas J, Knudsen T. Nurses and physicians in a medical admission unit can accurately predict mortality of acutely admitted patients: A prospective cohort study. PLoS One. 2014;9(7):e101739. doi: 10.1371/journal.pone.0101739. PubMed
44. Acquaviva K, Haskell H, Johnson J. Human cognition and the dynamics of failure to rescue: the Lewis Blackman case. J Prof Nurs. 2013;29(2):95-101. doi: 10.1016/j.profnurs.2012.12.009. PubMed
45. Jones A, Johnstone MJ. Inattentional blindness and failures to rescue the deteriorating patient in critical care, emergency and perioperative settings: four case scenarios. Aust Crit Care. 2017;30(4):219-223. doi: 10.1016/j.aucc.2016.09.005. PubMed
46. Reason J. Understanding adverse events: human factors. Qual Health Care. 1995;4(2):80-89. doi: 10.1136/qshc.4.2.80. PubMed
47. Bate L, Hutchinson A, Underhill J, Maskrey N. How clinical decisions are made. Br J Clin Pharmacol. 2012;74(4):614-620. doi: 10.1111/j.1365-2125.2012.04366.x. PubMed
48. Cabitza F, Rasoini R, Gensini GF. Unintended consequences of machine learning in medicine. JAMA. 2017;318(6):517-518. doi: 10.1001/jama.2017.7797. PubMed
49. Stead WW. Clinical implications and challenges of artificial intelligence and deep learning. JAMA. 2018;320(11):1107-1108. doi: 10.1001/jama.2018.11029. PubMed
50. Wong TY, Bressler NM. Artificial intelligence with deep learning technology looks into diabetic retinopathy screening. JAMA. 2016;316(22):2366-2367. doi: 10.1001/jama.2016.17563. PubMed
51. Finlay GD, Rothman MJ, Smith RA. Measuring the modified early warning score and the Rothman index: advantages of utilizing the electronic medical record in an early warning system. J Hosp Med. 2014;9(2):116-119. doi: 10.1002/jhm.2132. PubMed
52. Gagnier JJ, Moher D, Boon H, Beyene J, Bombardier C. Investigating clinical heterogeneity in systematic reviews: a methodologic review of guidance in the literature. BMC Med Res Methodol. 2012;12:111-111. doi: 10.1186/1471-2288-12-111. PubMed
53. Kollef MH, Chen Y, Heard K, et al. A randomized trial of real-time automated clinical deterioration alerts sent to a rapid response team. J Hosp Med. 2014;9(7):424-429. doi: 10.1002/jhm.2193. PubMed
© 2019 Society of Hospital Medicine
Addressing substance use in patients with intellectual disability: 5 Steps
Approximately 5% of patients with intellectual disability (ID) have a comorbid substance use disorder (SUD).1 These patients frequently abuse alcohol, tobacco, and cannabis, but are largely underdiagnosed and undertreated for SUDs. Treatment for SUDs in these patients is critical because substance abuse among patients with ID is associated with developing mood disorders, long-term health consequences, incarceration, and interpersonal instability.1 To ensure that these often-marginalized patients are adequately assessed and treated for SUDs, consider the following 5 steps.
1. Perform screening tests. Unfortunately, no substance use screening tests are validated specifically for patients with ID. When presented with mainstream screening tools, patients with ID could produce false positives or false negatives for 2 reasons:
- Patients with ID are more likely to respond in the affirmative to screening questions that they do not understand.
- Many screening questionnaires assume that patients possess an amount of knowledge and cognitive ability to abstract information that patients with ID may lack.
Clinicians should therefore adapt screening questions to better match the cognitive and communicative abilities of their patients with ID by simplifying sentences, using graphics, and avoiding negative phrases and confrontation. For example, while all-encompassing, the term “alcohol” may be confusing for some patients. Instead of broadly asking a patient, “Do you drink alcoholic beverages?” it may be necessary to specifically ask, “Do you drink wine?” or “Do you drink beer?” Similarly, it may be insufficient to ask a patient, “Do you smoke marijuana?” Instead, use colloquial terms (ie, weed, reefer) to ensure that the patient knows which substance you mean. Screening questions can be complemented by ordering urine drug testing and obtaining collateral information from caregivers.2
2. Use approved medications to treat SUDs. Medication-assisted treatment (MAT) is underprescribed for patients with ID. Medication compliance in patients with ID may be a concern; however, many of these patients are compliant with treatment because they often live with family members, in group homes, or in other settings where their medications are administered to them.
Also, be mindful of whether your patient has epilepsy. This condition is common among patients with ID,3 and some MAT can lower the seizure threshold. When starting and titrating MAT, always monitor patients carefully for benefits and adverse effects.4
3. Make a thorough assessment before recommending Alcoholics Anonymous or Narcotics Anonymous meetings. While the 12-step recovery model has proven benefits, the typical structure of 12-step meetings is not conducive to all patients with ID. Only recommend such meetings to patients who have 60- to 90-minute attention spans and demonstrate the cognitive, communicative, literacy, and social skills to fully engage during the meetings.5
4. Employ motivational interviewing. Many patients with ID have cursory knowledge of the health risks associated with substance abuse, particularly those with mild ID. Motivational interviewing techniques that include health education may help produce favorable outcomes in these patients.6
Continue to: Provide ongoing support
5. Provide ongoing support. Remember that addiction is a chronic disease with a risk of relapse. Provide continuous support for patients with ID and comorbid SUDs throughout all phases of their recovery, and refer them to addiction specialists, pain specialists, or psychotherapists as appropriate.
1. Chapman SL, Wu L. Substance abuse among individuals with intellectual disabilities. Res Dev Disabil. 2012;33(4):1147-1156.
2. Kiewik M, Vandernagel J, Engles, R, et al. Intellectually disabled and addicted: a call for evidence based tailor-made interventions. Addiction. 2017;112(45):20 67-2068.
3. Mcgrother C, Bhaumik S, Thorp C, et al. Epilepsy in adults with intellectual disabilities: prevalence, associations and service implications. Seizure. 2006;15(6):376-386.
4. Connery H. Medication-assisted treatment of opioid use disorder: review of the evidence and future directions. Harv Rev Psychiatry. 2015;23(2):63-75.
5. Slayter E. Disparities in access to substance abuse treatment among people with intellectual disabilities and serious mental illness. Health Soc Work. 2010;35(1):49-59.
6. Frielink N, Schuengel C, Kroon A, et al. Pretreatment for substance-abusing people with intellectual disabilities: intervening on autonomous motivation for treatment entry. J Intellect Disabil Res. 2015;59(12):1168-1182.
Approximately 5% of patients with intellectual disability (ID) have a comorbid substance use disorder (SUD).1 These patients frequently abuse alcohol, tobacco, and cannabis, but are largely underdiagnosed and undertreated for SUDs. Treatment for SUDs in these patients is critical because substance abuse among patients with ID is associated with developing mood disorders, long-term health consequences, incarceration, and interpersonal instability.1 To ensure that these often-marginalized patients are adequately assessed and treated for SUDs, consider the following 5 steps.
1. Perform screening tests. Unfortunately, no substance use screening tests are validated specifically for patients with ID. When presented with mainstream screening tools, patients with ID could produce false positives or false negatives for 2 reasons:
- Patients with ID are more likely to respond in the affirmative to screening questions that they do not understand.
- Many screening questionnaires assume that patients possess an amount of knowledge and cognitive ability to abstract information that patients with ID may lack.
Clinicians should therefore adapt screening questions to better match the cognitive and communicative abilities of their patients with ID by simplifying sentences, using graphics, and avoiding negative phrases and confrontation. For example, while all-encompassing, the term “alcohol” may be confusing for some patients. Instead of broadly asking a patient, “Do you drink alcoholic beverages?” it may be necessary to specifically ask, “Do you drink wine?” or “Do you drink beer?” Similarly, it may be insufficient to ask a patient, “Do you smoke marijuana?” Instead, use colloquial terms (ie, weed, reefer) to ensure that the patient knows which substance you mean. Screening questions can be complemented by ordering urine drug testing and obtaining collateral information from caregivers.2
2. Use approved medications to treat SUDs. Medication-assisted treatment (MAT) is underprescribed for patients with ID. Medication compliance in patients with ID may be a concern; however, many of these patients are compliant with treatment because they often live with family members, in group homes, or in other settings where their medications are administered to them.
Also, be mindful of whether your patient has epilepsy. This condition is common among patients with ID,3 and some MAT can lower the seizure threshold. When starting and titrating MAT, always monitor patients carefully for benefits and adverse effects.4
3. Make a thorough assessment before recommending Alcoholics Anonymous or Narcotics Anonymous meetings. While the 12-step recovery model has proven benefits, the typical structure of 12-step meetings is not conducive to all patients with ID. Only recommend such meetings to patients who have 60- to 90-minute attention spans and demonstrate the cognitive, communicative, literacy, and social skills to fully engage during the meetings.5
4. Employ motivational interviewing. Many patients with ID have cursory knowledge of the health risks associated with substance abuse, particularly those with mild ID. Motivational interviewing techniques that include health education may help produce favorable outcomes in these patients.6
Continue to: Provide ongoing support
5. Provide ongoing support. Remember that addiction is a chronic disease with a risk of relapse. Provide continuous support for patients with ID and comorbid SUDs throughout all phases of their recovery, and refer them to addiction specialists, pain specialists, or psychotherapists as appropriate.
1. Chapman SL, Wu L. Substance abuse among individuals with intellectual disabilities. Res Dev Disabil. 2012;33(4):1147-1156.
2. Kiewik M, Vandernagel J, Engles, R, et al. Intellectually disabled and addicted: a call for evidence based tailor-made interventions. Addiction. 2017;112(45):20 67-2068.
3. Mcgrother C, Bhaumik S, Thorp C, et al. Epilepsy in adults with intellectual disabilities: prevalence, associations and service implications. Seizure. 2006;15(6):376-386.
4. Connery H. Medication-assisted treatment of opioid use disorder: review of the evidence and future directions. Harv Rev Psychiatry. 2015;23(2):63-75.
5. Slayter E. Disparities in access to substance abuse treatment among people with intellectual disabilities and serious mental illness. Health Soc Work. 2010;35(1):49-59.
6. Frielink N, Schuengel C, Kroon A, et al. Pretreatment for substance-abusing people with intellectual disabilities: intervening on autonomous motivation for treatment entry. J Intellect Disabil Res. 2015;59(12):1168-1182.
Helping patients through a benzodiazepine taper
Benzodiazepines are one of the most commonly prescribed medication classes worldwide.1 Patients prescribed benzodiazepines who have no history of abuse or misuse may want to reduce or discontinue using these agents for various reasons, including adverse effects or wanting to reduce the number of medications they take. In this article, we offer strategies for creating an individualized taper plan, and describe additional nonpharmacologic interventions to help ensure that the taper is successful.
Formulating a taper plan
There is no gold-standard algorithm for tapering benzodiazepines.1,2 Even with a carefully designed plan, tapering can be challenging because approximately one-third of patients will experience difficulties such as withdrawal symptoms.1 Prior to creating a plan, carefully assess the patient’s history, including the type of benzodiazepine prescribed (short- or long-acting); the dose, dosing frequency, and duration of use; comorbid medical and psychiatric conditions; any previous experience with withdrawal symptoms; and psychosocial factors (eg, lifestyle and personality). Consider whether the patient can be safely tapered in an outpatient setting or will require hospitalization. Tapering designed to take place over several weeks or months tends to be more successful; however, patient-specific circumstances play a role in determining the duration of the taper.1,2
For the greatest chance of success, a benzodiazepine should not be reduced faster than 25% of the total daily dose per week.1 Consider which of the following pharmacologic approaches to benzodiazepine tapering might work best for your patient:
- Reduce the daily dose by one-eighth to one-tenth every 1 to 2 weeks over a 2- to 12-month period for patients with a physiological dependence.1
- Reduce the benzodiazepine dose by 10% to 25% every 2 weeks over a 4- to 8-week period.2
- Some guidelines have suggested converting the prescribed benzodiazepine to an equivalent dose of diazepam because of its long half-life, and then reducing the diazepam dose by one-eighth every 2 weeks.3
There is uncertainty in the medical literature about using a long-acting benzodiazepine to taper off a short-acting benzodiazepine, although this practice is generally clinically accepted.1,2 Similarly, there is no definitive evidence that supports using adjuvant medications to facilitate tapering.1,2
Nonpharmacologic interventions
Patients are more likely to have a successful taper if nonpharmacologic interventions are part of a comprehensive treatment plan.1
To help your patients through the challenges of a benzodiazepine taper:
- Validate their concerns, reassure them that you will support them throughout the taper, and provide information on additional resources for support.
- Provide education about the process of tapering and symptoms of withdrawal.
- Recommend therapies, such as cognitive-behavioral therapy or motivational interventions, that develop or enhance coping skills.
- Enlist the help of the patient’s family and friends for support and encouragement.
Despite some clinicians’ trepidation, 70% to 90% of patients can be successfully tapered off benzodiazepines by using an individualized approach that includes tailored tapering and nonpharmacologic interventions that provide benefits that persist after the patient completes the taper.1
1. Guina J, Merrill B. Benzodiazepines II: waking up on sedatives: providing optimal care when inheriting benzodiazepine prescriptions in transfer patients. J Clin Med. 2018;7(2):pii: E20. doi: 10.3390/jcm7020020.
2. Soyka M. Treatment of benzodiazepine dependence. N Engl J Med. 2017;376(12):1147-1157.
3. Diaper AM, Law FD, Melichar JK. Pharmacological strategies for detoxification. Br J Clin Pharmacol. 2014;77(2):302-314.
Benzodiazepines are one of the most commonly prescribed medication classes worldwide.1 Patients prescribed benzodiazepines who have no history of abuse or misuse may want to reduce or discontinue using these agents for various reasons, including adverse effects or wanting to reduce the number of medications they take. In this article, we offer strategies for creating an individualized taper plan, and describe additional nonpharmacologic interventions to help ensure that the taper is successful.
Formulating a taper plan
There is no gold-standard algorithm for tapering benzodiazepines.1,2 Even with a carefully designed plan, tapering can be challenging because approximately one-third of patients will experience difficulties such as withdrawal symptoms.1 Prior to creating a plan, carefully assess the patient’s history, including the type of benzodiazepine prescribed (short- or long-acting); the dose, dosing frequency, and duration of use; comorbid medical and psychiatric conditions; any previous experience with withdrawal symptoms; and psychosocial factors (eg, lifestyle and personality). Consider whether the patient can be safely tapered in an outpatient setting or will require hospitalization. Tapering designed to take place over several weeks or months tends to be more successful; however, patient-specific circumstances play a role in determining the duration of the taper.1,2
For the greatest chance of success, a benzodiazepine should not be reduced faster than 25% of the total daily dose per week.1 Consider which of the following pharmacologic approaches to benzodiazepine tapering might work best for your patient:
- Reduce the daily dose by one-eighth to one-tenth every 1 to 2 weeks over a 2- to 12-month period for patients with a physiological dependence.1
- Reduce the benzodiazepine dose by 10% to 25% every 2 weeks over a 4- to 8-week period.2
- Some guidelines have suggested converting the prescribed benzodiazepine to an equivalent dose of diazepam because of its long half-life, and then reducing the diazepam dose by one-eighth every 2 weeks.3
There is uncertainty in the medical literature about using a long-acting benzodiazepine to taper off a short-acting benzodiazepine, although this practice is generally clinically accepted.1,2 Similarly, there is no definitive evidence that supports using adjuvant medications to facilitate tapering.1,2
Nonpharmacologic interventions
Patients are more likely to have a successful taper if nonpharmacologic interventions are part of a comprehensive treatment plan.1
To help your patients through the challenges of a benzodiazepine taper:
- Validate their concerns, reassure them that you will support them throughout the taper, and provide information on additional resources for support.
- Provide education about the process of tapering and symptoms of withdrawal.
- Recommend therapies, such as cognitive-behavioral therapy or motivational interventions, that develop or enhance coping skills.
- Enlist the help of the patient’s family and friends for support and encouragement.
Despite some clinicians’ trepidation, 70% to 90% of patients can be successfully tapered off benzodiazepines by using an individualized approach that includes tailored tapering and nonpharmacologic interventions that provide benefits that persist after the patient completes the taper.1
1. Guina J, Merrill B. Benzodiazepines II: waking up on sedatives: providing optimal care when inheriting benzodiazepine prescriptions in transfer patients. J Clin Med. 2018;7(2):pii: E20. doi: 10.3390/jcm7020020.
2. Soyka M. Treatment of benzodiazepine dependence. N Engl J Med. 2017;376(12):1147-1157.
3. Diaper AM, Law FD, Melichar JK. Pharmacological strategies for detoxification. Br J Clin Pharmacol. 2014;77(2):302-314.
Management of treatment-resistant depression: A review of 3 studies
An estimated 7.1% of the adults in United States had a major depressive episode in 2017, and this prevalence has been trending upward over the past few years.1 The prevalence is even higher in adults between age 18 and 25 (13.1%).1 Like other psychiatric diagnoses, major depressive disorder (MDD) has a significant impact on productivity as well as daily functioning. Only one-third of patients with MDD achieve remission on the first antidepressant medication.2 This leaves an estimated 11.47 million people in the United States in need of an alternate regimen for management of their depressive episode.
The data on evidence-based biologic treatments for treatment-resistant depression are limited (other than for electroconvulsive therapy). Pharmacologic options include switching to a different medication, combining medications, and augmentation strategies or novel approaches such as ketamine and related agents. Here we summarize the findings from 3 recent studies that investigate alternate management options for MDD.
Ketamine: Randomized controlled trial
Traditional antidepressants may reduce suicidal ideation by improving depressive symptoms, but this effect may take weeks. Ketamine, an N-methyl-
_
1. Grunebaum MF, Galfalvy HC, Choo TH, et al. Ketamine for rapid reduction of suicidal thoughts in major depression: a midazolam-controlled randomized clinical trial. Am J Psychiatry. 2018;175(4):327-335.
Grunebaum et al3 evaluated the acute effect of adjunctive subanesthetic IV ketamine on clinically significant suicidal ideation in patients with MDD, with a comparison arm that received an infusion of midazolam.
Study design
- 80 inpatients (age 18 to 65 years) with MDD who had a score ≥16 on the Hamilton Depression Rating Scale (HAM-D) and a score ≥4 on the Scale for Suicidal Ideation (SSI). Approximately one-half (54%) were taking an antidepressant
- Patients were randomly assigned to IV racemic ketamine hydrochloride, .5 mg/kg, or IV midazolam, .02 mg/kg, both administered in 100 mL normal saline over 40 minutes.
Outcomes
- Scale for Suicidal Ideation scores were assessed at screening, before infusion, 230 minutes after infusion, 24 hours after infusion, and after 1 to 6 weeks of follow-up. The average SSI score on Day 1 was 4.96 points lower in the ketamine group compared with the midazolam group. The proportion of responders (defined as patients who experienced a 50% reduction in SSI score) on Day 1 was 55% for patients in the ketamine group compared with 30% in the midazolam group.
Conclusion
- Compared with midazolam, ketamine produced a greater clinically meaningful reduction in suicidal ideation 24 hours after infusion.
Apart from the primary outcome of reduction in suicidal ideation, greater reductions were also found in overall mood disturbance, depression subscale, and fatigue subscale scores as assessed on the Profile of Mood States (POMS). Although the study noted improvement in depression scores, the proportion of responders on Day 1 in depression scales, including HAM-D and the self-rated Beck Depression Inventory, fell short of statistical significance. Overall, compared with the midazolam infusion, a single adjunctive subanesthetic ketamine infusion was associated with a greater clinically significant reduction in suicidal ideation on Day 1.
Continue to: Ketamine
Ketamine: Review and meta-analysis
Wilkinson et al4 conducted a systematic review and individual participant data meta-analysis of 11 similar comparison intervention studies examining the effects of ketamine in reducing suicidal thoughts.
2. Wilkinson ST, Ballard ED, Bloch MH, et al. The effect of a single dose of intravenous ketamine on suicidal ideation: a systematic review and individual participant data meta-analysis. Am J Psychiatry. 2018;175(2):150-158.
Study design
- Review of 11 studies of a single dose of IV ketamine for treatment of any psychiatric disorder. Only comparison intervention trials using saline placebo or midazolam were included:
- Individual patient-level data of 298 patients were obtained from 10 of the 11 trials. Analysis was performed on 167 patients who had suicidal ideation at baseline.
- Results were assessed by clinician-administered rating scales.
Outcomes
- Ketamine reduced suicidal ideation more rapidly compared with control infusions as assessed by the Montgomery-Åsberg Depression Rating Scale (MADRS) and HAM-D, with significant benefits appearing on Day 1 and extending up to Day 7. The mean MADRS score in the ketamine group decreased to 19.5 from 33.8 within 1 day of infusion, compared with a reduction to 29.2 from 32.9 in the control groups.
- The number needed to treat to be free of suicidal ideation for ketamine (compared with control) was 3.1 to 4.0 for all time points in the first week after infusion.
Conclusion
- This meta-analysis provided evidence from the largest sample to date (N = 298) that ketamine reduces suicidal ideation partially independently of mood symptoms.
While the anti-suicidal effects of ketamine appear to be robust in the above studies, the possibility of rebound suicidal ideation remains in the weeks or months following exposure. Also, these studies only prove a reduction in suicidal ideation; reduction in suicidal behavior was not studied. Nevertheless, ketamine holds considerable promise as a potential rapid-acting agent in patients at risk of suicide.
Continue to: Strategies for augmentation or switching
Strategies for augmentation or switching
Only one-third of the patients with depression achieve remission on the first antidepressant medication. The American Psychiatric Association’s current management guidelines2 for patients who do not respond to the first-choice antidepressant include multiple options. Switching strategies recommended in these guidelines include changing to an antidepressant of the same class, or to one from a different class (eg, from a selective serotonin reuptake inhibitor [SSRI] to a serotonin-norepinephrine reuptake inhibitor, or from an SSRI to a tricyclic antidepressant). Augmentation strategies include augmenting with a non-monoamine oxidase inhibitor antidepressant from a different class, lithium, thyroid hormone, or an atypical antipsychotic.
The VAST-D trial5 evaluated the relative effectiveness and safety of 3 common treatments for treatment-resistant MDD:
- switching to bupropion
- augmenting the current treatment with bupropion
- augmenting the current treatment with the second-generation antipsychotic aripiprazole.
3. Mohamed S, Johnson GR, Chen P, et al. Effect of antidepressant switching vs augmentation on remission among patients with major depressive disorder unresponsive to antidepressant treatment: the VAST-D randomized clinical trial. JAMA. 2017;318(2):132-145.
Study design
- A multi-site, randomized, single-blind, parallel-assignment trial of 1,522 patients at 35 US Veteran Health Administration medical centers with nonpsychotic MDD with a suboptimal response to at least one antidepressant (defined as a score of ≥16 on the Quick Inventory Depressive Symptomatology-Clinician Rated questionnaire [QIDS-C16]).
- Participants were randomly assigned to 1 of 3 groups: switching to bupropion (n = 511), augmenting with bupropion (n = 506), or augmenting with aripiprazole (n = 505).
- The primary outcome was remission (defined as a QIDS-C16 score ≤5 at 2 consecutively scheduled follow-up visits). Secondary outcome was a reduction in QIDS-C16 score by ≥50%, or a Clinical Global Impression (CGI) Improvement scale score of 1 (very much improved) or 2 (much improved).
Outcomes
- The aripiprazole group showed a modest, statistically significant remission rate (28.9%) compared with the bupropion switch group (22.3%), but did not show any statistically significant difference compared with the bupropion augmentation group.
- For the secondary outcome, there was a significantly higher response rate in the aripiprazole group (74.3%) compared with the bupropion switch group (62.4%) and bupropion augmentation group (65.6%). Response measured by the CGI– Improvement scale score also favored the aripiprazole group (79%) compared with the bupropion switch group (70%) and bupropion augmentation group (74%).
Continue to: Conclusion
Conclusion
- Overall, the study found a statistically significant but modest increased likelihood of remission during 12 weeks of augmentation treatment with aripiprazole, compared with switching to bupropion monotherapy.

The studies discussed here, which are summarized in the Table,3-5 provide some potential avenues for research into interventions for patients who are acutely suicidal and those with treatment-resistant depression. Further research into long-term outcomes and adverse effects of ketamine use for suicidality in patients with depression is needed. The VAST-D trial suggests a need for further exploration into the efficacy of augmentation with second-generation antipsychotics for treatment-resistant depression.
1. Substance Abuse and Mental Health Services Administration. Reports and detailed tables from the 2017 National Survey on Drug Use and Health (NSDUH). https://www.samhsa.gov/data/nsduh/reports-detailed-tables-2017-NSDUH. Accessed November 12, 2018.
2. American Psychiatric Association. Practice guideline for the treatment of patients with major depressive disorder. 3rd ed. http://psychiatryonline.org/pb/assets/raw/sitewide/practice_guidelines/guidelines/mdd.pdf. Published 2010. Accessed November 12, 2018.
3. Grunebaum MF, Galfalvy HC, Choo TH, et al. Ketamine for rapid reduction of suicidal thoughts in major depression: a midazolam-controlled randomized clinical trial. Am J Psychiatry. 2018;175(4):327-335.
4. Wilkinson ST, Ballard ED, Bloch MH, et al. The effect of a single dose of intravenous ketamine on suicidal ideation: a systematic review and individual participant data meta-analysis. Am J Psychiatry. 2018;175(2):150-158.
5. Mohamed S, Johnson GR, Chen P, et al. Effect of antidepressant switching vs augmentation on remission among patients with major depressive disorder unresponsive to antidepressant treatment: the VAST-D randomized clinical trial. JAMA. 2017;318(2):132-145.
An estimated 7.1% of the adults in United States had a major depressive episode in 2017, and this prevalence has been trending upward over the past few years.1 The prevalence is even higher in adults between age 18 and 25 (13.1%).1 Like other psychiatric diagnoses, major depressive disorder (MDD) has a significant impact on productivity as well as daily functioning. Only one-third of patients with MDD achieve remission on the first antidepressant medication.2 This leaves an estimated 11.47 million people in the United States in need of an alternate regimen for management of their depressive episode.
The data on evidence-based biologic treatments for treatment-resistant depression are limited (other than for electroconvulsive therapy). Pharmacologic options include switching to a different medication, combining medications, and augmentation strategies or novel approaches such as ketamine and related agents. Here we summarize the findings from 3 recent studies that investigate alternate management options for MDD.
Ketamine: Randomized controlled trial
Traditional antidepressants may reduce suicidal ideation by improving depressive symptoms, but this effect may take weeks. Ketamine, an N-methyl-
_
1. Grunebaum MF, Galfalvy HC, Choo TH, et al. Ketamine for rapid reduction of suicidal thoughts in major depression: a midazolam-controlled randomized clinical trial. Am J Psychiatry. 2018;175(4):327-335.
Grunebaum et al3 evaluated the acute effect of adjunctive subanesthetic IV ketamine on clinically significant suicidal ideation in patients with MDD, with a comparison arm that received an infusion of midazolam.
Study design
- 80 inpatients (age 18 to 65 years) with MDD who had a score ≥16 on the Hamilton Depression Rating Scale (HAM-D) and a score ≥4 on the Scale for Suicidal Ideation (SSI). Approximately one-half (54%) were taking an antidepressant
- Patients were randomly assigned to IV racemic ketamine hydrochloride, .5 mg/kg, or IV midazolam, .02 mg/kg, both administered in 100 mL normal saline over 40 minutes.
Outcomes
- Scale for Suicidal Ideation scores were assessed at screening, before infusion, 230 minutes after infusion, 24 hours after infusion, and after 1 to 6 weeks of follow-up. The average SSI score on Day 1 was 4.96 points lower in the ketamine group compared with the midazolam group. The proportion of responders (defined as patients who experienced a 50% reduction in SSI score) on Day 1 was 55% for patients in the ketamine group compared with 30% in the midazolam group.
Conclusion
- Compared with midazolam, ketamine produced a greater clinically meaningful reduction in suicidal ideation 24 hours after infusion.
Apart from the primary outcome of reduction in suicidal ideation, greater reductions were also found in overall mood disturbance, depression subscale, and fatigue subscale scores as assessed on the Profile of Mood States (POMS). Although the study noted improvement in depression scores, the proportion of responders on Day 1 in depression scales, including HAM-D and the self-rated Beck Depression Inventory, fell short of statistical significance. Overall, compared with the midazolam infusion, a single adjunctive subanesthetic ketamine infusion was associated with a greater clinically significant reduction in suicidal ideation on Day 1.
Continue to: Ketamine
Ketamine: Review and meta-analysis
Wilkinson et al4 conducted a systematic review and individual participant data meta-analysis of 11 similar comparison intervention studies examining the effects of ketamine in reducing suicidal thoughts.
2. Wilkinson ST, Ballard ED, Bloch MH, et al. The effect of a single dose of intravenous ketamine on suicidal ideation: a systematic review and individual participant data meta-analysis. Am J Psychiatry. 2018;175(2):150-158.
Study design
- Review of 11 studies of a single dose of IV ketamine for treatment of any psychiatric disorder. Only comparison intervention trials using saline placebo or midazolam were included:
- Individual patient-level data of 298 patients were obtained from 10 of the 11 trials. Analysis was performed on 167 patients who had suicidal ideation at baseline.
- Results were assessed by clinician-administered rating scales.
Outcomes
- Ketamine reduced suicidal ideation more rapidly compared with control infusions as assessed by the Montgomery-Åsberg Depression Rating Scale (MADRS) and HAM-D, with significant benefits appearing on Day 1 and extending up to Day 7. The mean MADRS score in the ketamine group decreased to 19.5 from 33.8 within 1 day of infusion, compared with a reduction to 29.2 from 32.9 in the control groups.
- The number needed to treat to be free of suicidal ideation for ketamine (compared with control) was 3.1 to 4.0 for all time points in the first week after infusion.
Conclusion
- This meta-analysis provided evidence from the largest sample to date (N = 298) that ketamine reduces suicidal ideation partially independently of mood symptoms.
While the anti-suicidal effects of ketamine appear to be robust in the above studies, the possibility of rebound suicidal ideation remains in the weeks or months following exposure. Also, these studies only prove a reduction in suicidal ideation; reduction in suicidal behavior was not studied. Nevertheless, ketamine holds considerable promise as a potential rapid-acting agent in patients at risk of suicide.
Continue to: Strategies for augmentation or switching
Strategies for augmentation or switching
Only one-third of the patients with depression achieve remission on the first antidepressant medication. The American Psychiatric Association’s current management guidelines2 for patients who do not respond to the first-choice antidepressant include multiple options. Switching strategies recommended in these guidelines include changing to an antidepressant of the same class, or to one from a different class (eg, from a selective serotonin reuptake inhibitor [SSRI] to a serotonin-norepinephrine reuptake inhibitor, or from an SSRI to a tricyclic antidepressant). Augmentation strategies include augmenting with a non-monoamine oxidase inhibitor antidepressant from a different class, lithium, thyroid hormone, or an atypical antipsychotic.
The VAST-D trial5 evaluated the relative effectiveness and safety of 3 common treatments for treatment-resistant MDD:
- switching to bupropion
- augmenting the current treatment with bupropion
- augmenting the current treatment with the second-generation antipsychotic aripiprazole.
3. Mohamed S, Johnson GR, Chen P, et al. Effect of antidepressant switching vs augmentation on remission among patients with major depressive disorder unresponsive to antidepressant treatment: the VAST-D randomized clinical trial. JAMA. 2017;318(2):132-145.
Study design
- A multi-site, randomized, single-blind, parallel-assignment trial of 1,522 patients at 35 US Veteran Health Administration medical centers with nonpsychotic MDD with a suboptimal response to at least one antidepressant (defined as a score of ≥16 on the Quick Inventory Depressive Symptomatology-Clinician Rated questionnaire [QIDS-C16]).
- Participants were randomly assigned to 1 of 3 groups: switching to bupropion (n = 511), augmenting with bupropion (n = 506), or augmenting with aripiprazole (n = 505).
- The primary outcome was remission (defined as a QIDS-C16 score ≤5 at 2 consecutively scheduled follow-up visits). Secondary outcome was a reduction in QIDS-C16 score by ≥50%, or a Clinical Global Impression (CGI) Improvement scale score of 1 (very much improved) or 2 (much improved).
Outcomes
- The aripiprazole group showed a modest, statistically significant remission rate (28.9%) compared with the bupropion switch group (22.3%), but did not show any statistically significant difference compared with the bupropion augmentation group.
- For the secondary outcome, there was a significantly higher response rate in the aripiprazole group (74.3%) compared with the bupropion switch group (62.4%) and bupropion augmentation group (65.6%). Response measured by the CGI– Improvement scale score also favored the aripiprazole group (79%) compared with the bupropion switch group (70%) and bupropion augmentation group (74%).
Continue to: Conclusion
Conclusion
- Overall, the study found a statistically significant but modest increased likelihood of remission during 12 weeks of augmentation treatment with aripiprazole, compared with switching to bupropion monotherapy.
The studies discussed here, which are summarized in the Table,3-5 provide some potential avenues for research into interventions for patients who are acutely suicidal and those with treatment-resistant depression. Further research into long-term outcomes and adverse effects of ketamine use for suicidality in patients with depression is needed. The VAST-D trial suggests a need for further exploration into the efficacy of augmentation with second-generation antipsychotics for treatment-resistant depression.
1. Substance Abuse and Mental Health Services Administration. Reports and detailed tables from the 2017 National Survey on Drug Use and Health (NSDUH). https://www.samhsa.gov/data/nsduh/reports-detailed-tables-2017-NSDUH. Accessed November 12, 2018.
2. American Psychiatric Association. Practice guideline for the treatment of patients with major depressive disorder. 3rd ed. http://psychiatryonline.org/pb/assets/raw/sitewide/practice_guidelines/guidelines/mdd.pdf. Published 2010. Accessed November 12, 2018.
3. Grunebaum MF, Galfalvy HC, Choo TH, et al. Ketamine for rapid reduction of suicidal thoughts in major depression: a midazolam-controlled randomized clinical trial. Am J Psychiatry. 2018;175(4):327-335.
4. Wilkinson ST, Ballard ED, Bloch MH, et al. The effect of a single dose of intravenous ketamine on suicidal ideation: a systematic review and individual participant data meta-analysis. Am J Psychiatry. 2018;175(2):150-158.
5. Mohamed S, Johnson GR, Chen P, et al. Effect of antidepressant switching vs augmentation on remission among patients with major depressive disorder unresponsive to antidepressant treatment: the VAST-D randomized clinical trial. JAMA. 2017;318(2):132-145.

Antipsychotics and seizures: What are the risks?
Antipsychotics, especially second-generation antipsychotics (SGAs), have been proven effective for treating psychosis as well as mood disorders.1,2 Because antipsychotics can lower the epileptogenic threshold, seizures are a serious potential adverse effect. Antipsychotics can cause isolated EEG abnormalities in 7% of patients with no history of epilepsy, and clinical seizures in .5% to 1.2% of such patients.3 Additionally, the neuropathophysiology underlying epilepsy can predispose patients to psychiatric disorders4; the estimated prevalence of psychosis in patients with epilepsy is approximately 7%.5 This review will shed light on the risk of clinical seizures related to antipsychotics.
Comparing seizure risk among antipsychotics
In a review of the World Health Organization’s adverse drug reactions database, Kumlien and Lundberg6 calculated the ratio of the number of reports of seizures to the total number of reports for each drug. They found that approximately 9% of all adverse drug reaction reports involving clozapine were due to seizures. Equivalent ratios were 5.90% for quetiapine, 4.91% for olanzapine, 3.68% for risperidone, 3.27% for haloperidol, and 2.59% for aripiprazole. Using the database of the Pharmacovigilance Unit of the Basque Country, Lertxundi et al7 reported a 3.2-fold increased risk of seizure with SGAs in comparison with first-generation antipsychotics (FGAs) (95% confidence interval [CI], 2.21 to 4.63), which went down to 2.08 (CI, 1.39 to 3.12) once clozapine was excluded. However, as the authors of both studies noted, the quality and relevance of this data are limited because it relies on spontaneous reporting.
Overall, the evidence regarding the seizure risk associated with antipsychotics is scarce. To the best of our knowledge, only 2 large observational studies have compared the seizure risks associated with different antipsychotics.
Using data from the UK-based Clinical Practice Research Datalink between 1998 and 2013, Bloechlinger et al8 examined the incidence rates of seizures among patients newly diagnosed with schizophrenia, affective disorders, or dementia who were prescribed antipsychotics. They excluded patients with a history of seizures or antiepileptic use. In the cohort of 60,121 patients, the incidence rates of seizures per 10,000 person-years were 11.7 (CI, 10.0 to 13.4) for those who did not use antipsychotics, 12.4 (CI, 10.9 to 13.8) for past users, 115.4 (CI, 50.1 to 180.7) for current users of haloperidol, 48.8 (CI, 30.7 to 66.9) for current users of quetiapine, 25.9 (CI, 11.8 to 40.0) for current users of risperidone, and 19.0 (CI, 8.7 to 29.3) for current users of olanzapine. No data were available about clozapine use.
In subsequent analyses, the authors found that among patients with affective disorders, only current use of medium- to high-potency FGAs (haloperidol, prochlorperazine, and trifluoperazine) was associated with a significantly increased risk of seizures (adjusted odds ratio: 2.51, CI, 1.51 to 4.18) compared with non-users.8 Among patients with dementia, current use of olanzapine or quetiapine and current use of any FGAs were associated with significantly increased odds of seizures. This study suggests that the underlying mental illness might modulate the seizure risk associated with antipsychotics.8
Wu et al9 conducted a study based on the National Health Insurance Research Database in Taiwan. They examined the 1-year incidence of new-onset seizures among patients diagnosed with schizophrenia or mood disorders who were new to antipsychotic treatment, and calculated the risk of seizure associated with each antipsychotic in reference to risperidone. They found that those receiving clozapine, thioridazine, and haloperidol were 2 to 3 times more likely to develop seizures than those treated with risperidone; risks associated with the rest of the FGAs were similar to that of risperidone.
The results of these 2 large cohort studies are somewhat concurrent in indicating that, other than clozapine, SGAs incur similar risks of seizures; furthermore, they specify that, contrary to earlier studies,10 haloperidol is associated with significantly higher odds of seizures. While both of these cohort studies controlled for several sociodemographic and clinical confounders, they have several limitations. First, diagnoses of seizures were based on information available in databases, which might be subject to inaccuracies. Second, neither study evaluated the effect of drug dosage and duration of exposure on new-onset seizures.
Continue to: Most evidence is from case reports
Most evidence is from case reports
Other than these 2 large studies, most of the evidence addressing the relationship between the use of antipsychotics and incidence of seizures is low quality and relies on case reports or expert opinions. Older studies found that, among FGAs, seizure risk is highest with chlorpromazine and promazine, and lowest with thioridazine and haloperidol.10 As for SGAs, case reports have described seizuresassociated with the use of quetiapine, aripiprazole, risperidone, paliperidone, and olanzapine.
Quetiapine. Three case reports published between 2002 and 2010 describe generalized
Aripiprazole. Five case reports described staring spells and tonic-clonic seizures in patients receiving 10 to 15 mg of aripiprazole.15-19 In the New Drug Application (NDA) for aripiprazole, the incidence of seizures was estimated to be .11% (1 of 926 patients) in placebo-controlled trials and .46% (3 of 859 patients) in haloperidol-controlled trials.20
Risperidone’s product labeling suggests the drug should be used with caution in patients with a history of seizures or conditions that could result in a lower seizure threshold. In Phase III placebo-controlled trials, seizures occurred in .3% of patients treated with risperidone, although in some cases, the seizures were induced by electrolyte disturbances such as hyponatremia.21 Gonzalez-Heydrich et al22 and Holzhausen et al23 found no increase in seizure activity among patients with epilepsy who were receiving risperidone. Lane et al24 published a case report of a geriatric woman who presented with a generalized tonic-clonic seizure related to rapid titration of risperidone; however, with slower titration and lower doses, she stopped having seizures without adding any antiepileptic drugs. Komossa et al25 found that risperidone is less epileptogenic than clozapine, with a relative risk of .22.
Paliperidone is the active metabolite of risperidone and does not have pharmacokinetic interactions with drugs metabolized by the cytochrome P450 (CYP) enzymes. Its labeling indicates that the drug should be used with caution in patients with a history of seizures.26 In Phase III placebo-controlled trials of paliperidone, the rate of seizures was .22%.27 Two case reports suggest close monitoring of seizure risk in patients receiving paliperidone.28,29 Liang et al29 reported that co-administration of valproic acid could mask an underlying decrease of the seizure threshold caused by antipsychotics such as paliperidone.
Continue to: Olanzapine
Olanzapine is a thienobenzodiazepine derivative and is chemically related to clozapine.30 The olanzapine NDA31 shows that 23 of 3,139 patients developed seizures, mainly tonic-clonic, with evidence suggesting that the seizures may have been due to confounding factors such as a history of seizures or metabolic abnormalities. There were no statistically significant differences in the rate of seizures associated with olanzapine compared with placebo or haloperidol (P = .252 and .168, respectively).

A literature review for olanzapine yielded 1 case report of repetitive focal seizures and lingual dystonia,32 5 case reports of generalized tonic-clonic seizures and myoclonus,33-37 and 2 case reports of status epilepticus.38,39 Olanzapine’s clearance is 25% to 30% lower in women, and most of these case reports occurred women.40

Details of the above case reports are summarized in Table 1 (aripiprazole15-19), Table 2 (olanzapine32-39), and Table 3 (paliperidone,28,29 quetiapine,11-13 and risperidone22-24).

Ziprasidone. According to the NDA safety database, the seizure rate attributed to ziprasidone was 1.8 per 100 subject-years or 0.54% of participants (12 of 2,588).41 No additional studies have been published regarding its seizure risk.
Clozapine has a black-box warning

To the best of our knowledge, clozapine is the only antipsychotic that carries an FDA “black-box” warning regarding its risk of inducing seizures.42 Devinsky and Pacia43 reported a cumulative risk of 10% after 3.8 years of treatment. The literature has described clozapine-induced generalized tonic-clonic, myoclonic, simple and complex partial, and absence seizures.44 Table 445 lists the estimated frequency of each seizure type based on 101 cases of clozapine-induced seizures. Myoclonic seizures and drop attacks could be precursors/warning signs of grand mal tonic-clonic seizures.46,47 Seizures have been observed at all stages of treatment, but were more common during initiation of clozapine, which emphasizes the importance of a progressive and slow titration.43,48 The incidence of seizures was estimated to be 6% in a sample of 216 patients with schizophrenia with no history of epilepsy who were prescribed clozapine.49
Continue to: Regarding a possible association between...
Regarding a possible association between clozapine dose or clozapine plasma levels and seizure risk, there is a positive linear relationship between the dose of clozapine and its serum concentration over a dosing range of 25 to 800 mg/d.50 However, the plasma concentration is also significantly affected by factors such as smoking, gender, age, drug interactions, and CYP genotypes. Therefore, the same clozapine dose will yield a lower serum concentration in an older male who smokes compared with a younger, non-smoking female.51 Perry et al52 suggested a dosing nomogram to calculate the influence of gender and smoking. Seizure risk, especially for tonic-clonic seizures, has been reported to increase with clozapine doses >600 mg/d,53 and with plasma concentrations exceeding 1,000 to 1,300 mg/L.54 However, in a 2011 regression analysis, Varma et al55 found no statistically significant relationship between seizure risk and clozapine oral dose; there was not enough data to test a correlation between clozapine plasma levels and the incidence of seizures.
How antipsychotics might lower the seizure threshold
Researchers have suggested several possible mechanisms to explain how antipsychotics might lower the seizure threshold. Antagonism of dopamine D4, histamine H1, and acetylcholine-muscarinic receptors seems to induce EEG alterations and increase the risk of seizures.56 Additionally, modulation of the N-methyl-
Watch for pharmacokinetic interactions
The CYP enzymes involved in drug metabolism include CYP1A2, CYP2C9, CYP2C19, CYP2D6, and CYP3A4. Most commonly used antiepileptics and antipsychotics are metabolized by CYP enzymes, and may also act as inhibitors or inducers of these enzymes.61 Drug interactions may impair seizure control, which is why monotherapy is preferable to combination treatment in patients with epilepsy.62 Carbamazepine and phenytoin are inducers of both CYP1A2 (which metabolizes olanzapine and clozapine), and CYP3A4 (which metabolizes haloperidol, risperidone, quetiapine, ziprasidone and clozapine). Paliperidone is not metabolized by CYP enzymes.62 Discontinuing an enzyme-inducing agent may result in increased antipsychotic plasma concentrations, which might lead to an increased risk of seizures.
Valproic acid, which is often used to prevent or treat clozapine-induced seizures, has an unclear effect on clozapine plasma concentrations.63 Although valproic acid is known to inhibit clozapine metabolism, 2 reports have suggested that the plasma concentrations of clozapine and its metabolites may decrease after adding valproic acid.64,65 Other studies have found that valproic acid increases plasma concentrations of clozapine while it decreases plasma concentrations of norclozapine; norclozapine is the main clozapine metabolite responsible for inducing seizures.66,67
Steps for minimizing seizure risk
Determining the seizure risk for a patient taking an antipsychotic is challenging because doing so depends not only on the seizurogenic potential of each drug but also on individualized predisposing factors.11,57,68 Choosing the “best” antipsychotic therefore largely depends on each patient’s profile. The predisposing factors consist mainly of the individually inherited seizure threshold (personal history of febrile convulsions or a family history of seizures) and other comorbid seizurogenic conditions, such as a history of head trauma, brain injury, intellectual disability, cerebral arteriosclerosis, neurodegenerative diseases, encephalopathy, chronic renal insufficiency, and hyponatremia. Furthermore, seizure risk depends on the antipsychotic dose administered and the rate of titration.11
Continue to: There is not enough evidence...
There is not enough evidence to recommend performing an EEG in all patients taking antipsychotics. Such testing is recommended only for patients who have predisposing factors for seizures. If an EEG shows any abnormality in a patient taking clozapine, consider decreasing the clozapine dose69,70 or adding an antiepileptic drug such as valproic acid or lamotrigine.44,70
Although clozapine carries a black-box warning of increased risk of causing seizures, there is no consensus regarding the efficacy of co-prescribing an antiepileptic. Some studies have suggested prescribing valproic acid prophylactically,71 after the occurrence of 1 seizure,59 or after 2 seizures.54,72 Others have recommended prescribing prophylactic valproic acid for patients taking ≥600 mg/d of clozapine or whose clozapine plasma levels are >500 mg/L.73 Varma et al55 recommended starting an antiepileptic medication if there are clear epileptiform discharges on EEG, if the patient develops stuttering or speech difficulties, or if seizures occur. Liukkonen et al72 advised initiating an antiepileptic at the start of clozapine treatment in patients who are taking other epileptogenic medications, patients with pre-existing seizure disorder, and patients with neurologic abnormalities. On the other hand, Caetano51 argued against primary prevention of seizures for patients receiving >600 mg/d of clozapine, suggesting that “the risk of seizures would be better managed by close clinical monitoring and measures of clozapine serum concentration rather than adding an anticonvulsant drug.”
Current recommendations for primary and secondary prevention of clozapine-induced seizures are detailed in Table 5.42,44,45,51,55,57,69,74,75

Studies addressing the seizurogenic potential of SGAs other than clozapine have a low level of evidence and include patients who had comorbid conditions and were taking other medications that could cause seizures. Additionally, clinical trials of SGAs rarely include patients with seizure disorders; this might underestimate the risk of seizures.4
The effect of the mental illness itself on the seizure threshold needs to be considered.43 Bloechlinger et al8 found that dementia might be inherently associated with a higher risk of antipsychotic-related seizures. Moreover, numerous qualitative EEG studies have found abnormalities in 20% to 60% of patients with schizophrenia.56 Other quantitative studies have reported mild and nonspecific EEG abnormalities, such as increased delta and/or theta activity, in many non-medicated patients with schizophrenia.10,76 Additionally, brain tissue analysis of deceased patients who had schizophrenia has shown a significant increase in dopamine concentrations in the left amygdala compared with controls, and this might be responsible for enhanced electrical activity in this region.10 Some studies have described EEG slowing in the frontal brain regions of patients with schizophrenia,77 and was selectively normalized in these areas with antipsychotics.78
As always, start low, go slow
Mounting evidence suggests that antipsychotic medications decrease the seizure threshold. Practitioners should thus be cautious in prescribing antipsychotics and should target reaching the minimal effective dose with slow titration, especially in patients with predisposing factors for epilepsy.
Continue to: Although evidence suggests...
Although evidence suggests antipsychotics can induce different types of epileptic seizures, the quality of this evidence is low. Randomized controlled trials are needed to determine which antipsychotics increase seizure risk and whether there is a dose-effect relationship.
Bottom Line
Among second-generation antipsychotics, clozapine appears to increase the risk of clinical seizure the most. Correlations with dosage and/or plasma levels have not been proven. Psychiatrists should be vigilant for pharmacokinetic interactions between antipsychotics and antiepileptics, notably via CYP1A2 and CYP3A4.
Related Resources
- Druschky K, Bleich S, Grohmann R, et al. Seizure rates under treatment with antipsychotic drugs: Data from the AMSP project. World J Biol Psychiatry. 2018;15:1-10.
- Epilepsy Foundation. For professionals: Antipsychotics. https://www.epilepsy.com/learn/professionals/diagnosistreatment/psychotropic-drugs-developmental-disabilities/comorbid-5.
Drug Brand Names
Aripiprazole • Abilify
Benztropine • Cogentin
Bethanechol • Duvoid
Carbamazepine • Carbatrol, Tegretol
Chlorpromazine • Thorazine
Cimetidine • Tagamet
Ciprofloxacin • Cipro
Citalopram • Celexa
Clonazepam • Klonopin
Clozapine • Clozaril
Donepezil • Aricept
Enalapril • Vasotec
Erythromycin • Erythrocin
Escitalopram • Lexapro
Flunitrazepam • Rohypnol
Fluvoxamine • Luvox
Gabapentin • Neurontin
Haloperidol • Haldol
Lamotrigine • Lamictal
Lithium • Eskalith, Lithobid
Metformin • Fortamet, Glucophage
Mirtazapine • Remeron
Nitrofurantoin • Furadantin
Olanzapine • Zyprexa
Paliperidone • Invega
Phenobarbital • Luminal
Phenytoin • Dilantin
Prochlorperazine • Compazine
Procyclidine • Kemadrin
Propranolol • Inderal
Quetiapine • Seroquel
Risperidone • Risperdal
Sertraline • Zoloft
Simvastatin • Zocor
Sulfamethoxazole/trimethoprim • Bactrim, Sulfatrim
Topiramate • Topamax
Trifluoperazine • Stelazine
Valproic acid • Depakene, Depakote
Ziprasidone • Geodon
1. Bruijnzeel D, Suryadevara U, Tandon R. Antipsychotic treatment of schizophrenia: an update. Asian J Psychiatr. 2014;11:3-7.
2. Hrdlicka M, Dudova I. Atypical antipsychotics in the treatment of early-onset schizophrenia. Neuropsychiatr Dis Treat. 2015;11:907-913.
3. Koch-Stoecker S. Antipsychotic drugs and epilepsy: indications and treatment guidelines. Epilepsia. 2002;43(suppl 2):19-24.
4. Alper K, Schwartz KA, Kolts RL, et al. Seizure incidence in psychopharmacological clinical trials: an analysis of Food and Drug Administration (FDA) summary basis of approval reports. Biol Psychiatry. 2007;62(4):345-354.
5. Torta R, Keller R. Behavioral, psychotic, and anxiety disorders in epilepsy: etiology, clinical features, and therapeutic implications. Epilepsia. 1999;40(suppl 10):S2-S20.
6. Kumlien E, Lundberg PO. Seizure risk associated with neuroactive drugs: data from the WHO adverse drug reactions database. Seizure. 2010;19(2):69-73.
7. Lertxundi U, Hernandez R, Medrano J, et al. Antipsychotics and seizures: higher risk with atypicals? Seizure. 2013;22(2):141-143.
8. Bloechliger M, Rüegg S, Jick SS, et al. Antipsychotic drug use and the risk of seizures: follow-up study with a nested case-control analysis. CNS Drugs. 2015;29(7):591-603.
9. Wu CS, Wang SC, Yeh IJ, et al. Comparative risk of seizure with use of first- and second-generation antipsychotics in patients with schizophrenia and mood disorders. J Clin Psychiatry. 2016;77(5):e573-e579.
10. Cold JA, Wells BG, Froemming JH. Seizure activity associated with antipsychotic therapy. [Erratum in DICP. 1990;24(10):1012.] DICP. 1990;24(6):601-606.
11. Hedges DW, Jeppson KG. New-onset seizure associated with quetiapine and olanzapine. Ann Pharmacother. 2002;36(3):437-439.
12. Dogu O, Sevim S, Kaleagasi HS. Seizures associated with quetiapine treatment. Ann Pharmacother. 2003;37(9):1224-1227.
13. Young AC, Kleinschmidt KC, Wax PM. Late-onset seizures associated with quetiapine poisoning. J Med Toxicol. 2009;5(1):24-26.
14. US Food and Drug Administration. Recommendation of approvable action for quetiapine fumarate extended release (Seroquel® XR) for the treatment of schizophrenia. http://www.accessdata.fda.gov/drugsatfda_docs/nda/2007/022047Orig1s000MedR.pdf. April 24, 2007. Accessed January 28, 2019.
15. Malik AR, Ravasia S. Aripiprazole-induced seizure. Can J Psychiatry. 2005;50(3):186.
16. Tsai JF. Aripiprazole-associated seizure. J Clin Psychiatry. 2006;67(6):995-996.
17. Arora M, Arndorfer L. EEG abnormalities in a patient taking aripiprazole. Psychiatry (Edgmont). 2007;4(7):18-19.
18. Yueh CL, Yu SL, Chen HM, et al. Aripiprazole-induced seizure: a second case report. BMJ case reports. 2009;2009:bcr03.2009.1693. doi: 10.1136/bcr.03.2009.1693.
19. Thabet FI, Sweis RT, Joseph SA. Aripiprazole-induced seizure in a 3-year-old child: a case report and literature review. Clin Neuropharmacol. 2013;36(1):29-30.
20. US Food and Drug Administration. Abilify (Aripiprazole) tablets. Medical Review Part 2. http://www.accessdata.fda.gov/drugsatfda_docs/nda/2002/21-436_Abilify_medr_P2.pdf. Published March 07, 2003. Accessed January 28, 2019.
21. US Food and Drug Administration. Drugs@FDA: FDA approved drug products. Risperdal tablets, Risperdal oral solution & Risperdal M-tab orally disintegrating tablets. http://www.accessdata.fda.gov/drugsatfda_docs/nda/2003/021444_S004_RISPERDAL_TABLETS.pdf. Published September 10, 2003. Accessed January 28, 2019.
22. Gonzalez-Heydrich J, Pandina GJ, Fleisher CA, et al. No seizure exacerbation from risperidone in youth with comorbid epilepsy and psychiatric disorders: a case series. J Child Adolesc Psychopharmacol. 2004;14(2):295-310.
23. Holzhausen SPF, Guerreiro MM, Baccin CE, et al. Use of risperidone in children with epilepsy. Epilepsy Behav. 2007;10(3):412-416.
24. Lane HY, Chang WH, Chou JC. Seizure during risperidone treatment in an elderly woman treated with concomitant medications. J Clinl Psychiatry. 1998;59(2):81-82.
25. Komossa K, Rummel-Kluge C, Schwarz S, et al. Risperidone versus other atypical antipsychotics for schizophrenia. Cochrane Database Syst Rev. 2011;(1):19:CD006626.
26. Paliperidone [package insert]. Mountainville, CA: Janssen Pharmaceuticals, Inc.; 2007.
27. Brugge, MD; US Food and Drug Administration. Paliperidone OROS oral formulation. http://www.accessdata.fda.gov/drugsatfda_docs/nda/2006/021999s000_MedR_Part4.pdf. Accessed January 28, 2019.
28. Schneider RA, Lizer MH. Apparent seizure and atrial fibrillation associated with paliperidone. Am J Health System Pharm. 2008;65(22):2122-2125.
29. Liang CS, Yang FW, Chiang KT. Paliperidone-associated seizure after discontinuation of sodium valproate: a case report. J Clin Psychopharmacol. 2011;31(2):246-247.
30. Fulton B, Goa KL. Olanzapine. A review of its pharmacological properties and therapeutic efficacy in the management of schizophrenia and related psychoses. Drugs. 1997;53(2):281-298.
31. US Food and Drug Administration. Drugs@FDA: FDA approved drug products: Zyprexa (olanzapine). ORIG-1. http://www.accessdata.fda.gov/drugsatfda_docs/nda/96/020592_Original_Approval_Pkg%20.pdf. Published September 30, 1996. Accessed January 28, 2019.
32. Anzellotti F, Capasso M, Frazzini V, et al. Olanzapine-related repetitive focal seizures with lingual dystonia. Epileptic Disord. 2016;18(1):83-86.
33. Lee JW, Crismon ML, Dorson PG. Seizure associated with olanzapine. Ann Pharmac. 1999;33(5):554-556.
34. Woolley J, Smith S. Lowered seizure threshold on olanzapine. Br J Psychiatry. 2001;178(1):85-86.
35. Behere RV, Anjith D, Rao NP, et al. Olanzapine-induced clinical seizure: a case report. Clin Neuropharmacol. 2009;32(5):297-298.
36. Camacho A, García-Navarro M, Martínez B, et al. Olanzapine-induced myoclonic status. Clin Neuropharmacol. 2005;28(3):145-147.
37. Rosen JB, Milstein MJ, Haut SR. Olanzapine-associated myoclonus. Epilepsy Res. 2012;98(2-3):247-250.
38. Wyderski RJ, Starrett WG, Abou-Saif A. Fatal status epilepticus associated with olanzapine therapy. Ann Pharmacother. 1999;33(7-8):787-789.
39. Spyridi S, Sokolaki S, Nimatoudis J, et al. Status epilepticus in a patient treated with olanzapine and mirtazapine. Int J Clin Pharmacol Ther. 2009;47(2):120-123.
40. Schatzberg AF, Nemeroff CB. Essentials of clinical psychopharmacology. 2nd ed. Arlington, Virginia: American Psychiatric Publishing; 2006.
41. US Food and Drug Administration. Drug approval package: Geodon (Ziprasidone HCI) Capsules. Medical Review Part 2. http://www.accessdata.fda.gov/drugsatfda_docs/nda/2001/20-825_Geodan_medr_P2.pdf. Published February 5, 2001. Accessed January 29, 2019.
42. Clozaril [package insert]. East Hanover, NJ: Novartis; 2008.
43. Devinsky O, Pacia SV. Seizures during clozapine therapy. J Clin Psychiatry. 1994;55(suppl B):153-156.
44. Williams AM, Park SH. Seizure associated with clozapine: incidence, etiology, and management. CNS Drugs. 2015;29(2):101-111.
45. Wong J, Delva N. Clozapine-induced seizures: recognition and treatment. Can J Psychiatry. 2007;52(7):457-463.
46. Berman I, Zalma A, DuRand CJ, et al. Clozapine-induced myoclonic jerks and drop attacks. J Clin Psychiatry. 1992;53(9):329-330.
47. Gouzoulis E, Ozdaglar A, Kasper J. Myoclonic seizures followed by grand mal seizures during clozapine treatment. Am J Psychiatry. 1993;150(7):1128.
48. Sajatovic M, Meltzer HY. Clozapine-induced myoclonus and generalized seizures. Biol Psychiatry. 1996;39(5):367-370.
49. Grover S, Hazari N, Chakrabarti S, et al. Association of clozapine with seizures: a brief report involving 222 patients prescribed clozapine. East Asian Arch Psychiatry. 2015;25(2):73-78.
50. Byerly MJ, DeVane CL. Pharmacokinetics of clozapine and risperidone: a review of recent literature. J Clin Psychopharmacol. 1996;16(2):177-187.
51. Caetano D. Use of anticonvulsants as prophylaxis for seizures in patients on clozapine. Australas Psychiatry. 2014;22(1):78-83.
52. Perry PJ, Bever KA, Arndt S, et al. Relationship between patient variables and plasma clozapine concentrations: a dosing nomogram. Biol Psychiatry.1998;44(8):733-738.
53. Dumortier G, Mahé V, Pons D, et al. Clonic seizure associated with high clozapine plasma level. J Neuropsychiatry Clin Neurosci. 2001;13(2):302-303.
54. Funderburg LG, Vertrees JE, True JE, et al. Seizure following addition of erythromycin to clozapine treatment. Am J Psychiatry. 1994;151(12):1840-1841.
55. Varma S, Bishara D, Besag FMC, et al. Clozapine-related EEG changes and seizures: dose and plasma-level relationships. Ther Adv Psychopharmacol. 2011;1(2):47-66.
56. Amann BL, Pogarell O, Mergl R, et al. EEG abnormalities associated with antipsychotics: a comparison of quetiapine, olanzapine, haloperidol and healthy subjects. Hum Psychopharmacol. 2003;18(8):641-646.
57. Pisani F, Oteri G, Costa C, et al. Effects of psychotropic drugs on seizure threshold. Drug Saf. 2002;25(2):91-110.
58. Maurice T, Phan VL, Urani A, et al. Neuroactive neurosteroids as endogenous effectors for the sigma1 (sigma1) receptor: pharmacological evidence and therapeutic opportunities. Jpn J Pharmacol. 1999;81(2):125-155.
59. Haller E, Binder RL. Clozapine and seizures. Am J Psychiatry. 1990;147(8):1069-1071.
60. Torta R, Monaco F. Atypical antipsychotics and serotoninergic antidepressants in patients with epilepsy: pharmacodynamic considerations. Epilepsia. 2002;43(suppl 2):8-13.
61. Spina E. Drug interactions. In: Shorvon S, Perucca E, Engel J Jr, eds. The treatment of epilepsy. 3rd ed. Oxford, UK: Blackwell Publishing; 2009:361-377.
62. Spina E, Perucca E. Clinical significance of pharmacokinetic interactions between antiepileptic and psychotropic drugs. Epilepsia. 2002;43(suppl 2):37-44.
63. de Leon J, Santoro V, D’Arrigo C, et al. Interactions between antiepileptics and second-generation antipsychotics. Expert Opin Drug Metab Toxicol. 2012;8(3):311-334.
64. Finley P, Warner D. Potential impact of valproic acid therapy on clozapine disposition. Biol Psychiatry. 1994;36(7):487-488.
65. Longo LP, Salzman C. Valproic acid effects on serum concentrations of clozapine and norclozapine. Am J Psychiatry. 1995;152(4):650.
66. Centorrino F, Baldessarini RJ, Kando J, et al. Serum concentrations of clozapine and its major metabolites: effects of cotreatment with fluoxetine or valproate. Am J Psychiatry. 1994;151(1):123-125.
67. Facciolà G, Avenoso A, Scordo MG, et al. Small effects of valproic acid on the plasma concentrations of clozapine and its major metabolites in patients with schizophrenic or affective disorders. Ther Drug Monit. 1999;21(3):341-345.
68. Hyde TM, Weinberger DR. Seizures and schizophrenia. Schizophr Bull. 1997;23(4):611-622.
69. Muzyk A, Gala G, Kahn DA. Use of lamotrigine in a patient with a clozapine-related seizure. J Psychiatr Pract. 2010;16(2):125-128.
70. Kikuchi YS, Sato W, Ataka K, et al. Clozapine-induced seizures, electroencephalography abnormalities, and clinical responses in Japanese patients with schizophrenia. Neuropsychiatr Dis Treat. 2014;10:1973-1978.
71. Taner E, Coşar B, Işik E. Clozapine-induced myoclonic seizures and valproic acid. Int J Psychiatry Clin Pract. 1998;2(1):53-55.
72. Liukkonen J, Koponen HJ, Nousiainen U. Clinical picture and long-term course of epileptic seizures that occur during clozapine treatment. Psychiatry Res. 1992;44(2):107-112.
73. Devinsky O, Honigfeld G, Patin J. Clozapine-related seizures. Neurology. 1991;41(3):369-371.
74. Foster R, Olajide D. A case of clozapine-induced tonic-clonic seizures managed with valproate: implications for clinical care. J Psychopharmacol. 2005;19(1):93-96.
75. Gandelman-Marton R, Theitler J, Klein C, et al. Phenytoin intoxication in a clozapine-related prolonged seizure. J Emerg Med. 2008;35(4):407-409.
76. Primavera A, Giberti L, Scotto P, et al. Nonconvulsive status epilepticus as a cause of confusion in later life: a report of 5 cases. Neuropsychobiology. 1994;30(2-3):148-152.
77. Boutros NN, Arfken C, Galderisi S, et al. The status of spectral EEG abnormality as a diagnostic test for schizophrenia. Schizophrenia Res. 2008;99(1-3):225-237.
78. Takahashi T, Cho RY, Mizuno T, et al. Antipsychotics reverse abnormal EEG complexity in drug-naïve schizophrenia: a multiscale entropy analysis. Neuroimage. 2010;51(1):173-182.
Antipsychotics, especially second-generation antipsychotics (SGAs), have been proven effective for treating psychosis as well as mood disorders.1,2 Because antipsychotics can lower the epileptogenic threshold, seizures are a serious potential adverse effect. Antipsychotics can cause isolated EEG abnormalities in 7% of patients with no history of epilepsy, and clinical seizures in .5% to 1.2% of such patients.3 Additionally, the neuropathophysiology underlying epilepsy can predispose patients to psychiatric disorders4; the estimated prevalence of psychosis in patients with epilepsy is approximately 7%.5 This review will shed light on the risk of clinical seizures related to antipsychotics.
Comparing seizure risk among antipsychotics
In a review of the World Health Organization’s adverse drug reactions database, Kumlien and Lundberg6 calculated the ratio of the number of reports of seizures to the total number of reports for each drug. They found that approximately 9% of all adverse drug reaction reports involving clozapine were due to seizures. Equivalent ratios were 5.90% for quetiapine, 4.91% for olanzapine, 3.68% for risperidone, 3.27% for haloperidol, and 2.59% for aripiprazole. Using the database of the Pharmacovigilance Unit of the Basque Country, Lertxundi et al7 reported a 3.2-fold increased risk of seizure with SGAs in comparison with first-generation antipsychotics (FGAs) (95% confidence interval [CI], 2.21 to 4.63), which went down to 2.08 (CI, 1.39 to 3.12) once clozapine was excluded. However, as the authors of both studies noted, the quality and relevance of this data are limited because it relies on spontaneous reporting.
Overall, the evidence regarding the seizure risk associated with antipsychotics is scarce. To the best of our knowledge, only 2 large observational studies have compared the seizure risks associated with different antipsychotics.
Using data from the UK-based Clinical Practice Research Datalink between 1998 and 2013, Bloechlinger et al8 examined the incidence rates of seizures among patients newly diagnosed with schizophrenia, affective disorders, or dementia who were prescribed antipsychotics. They excluded patients with a history of seizures or antiepileptic use. In the cohort of 60,121 patients, the incidence rates of seizures per 10,000 person-years were 11.7 (CI, 10.0 to 13.4) for those who did not use antipsychotics, 12.4 (CI, 10.9 to 13.8) for past users, 115.4 (CI, 50.1 to 180.7) for current users of haloperidol, 48.8 (CI, 30.7 to 66.9) for current users of quetiapine, 25.9 (CI, 11.8 to 40.0) for current users of risperidone, and 19.0 (CI, 8.7 to 29.3) for current users of olanzapine. No data were available about clozapine use.
In subsequent analyses, the authors found that among patients with affective disorders, only current use of medium- to high-potency FGAs (haloperidol, prochlorperazine, and trifluoperazine) was associated with a significantly increased risk of seizures (adjusted odds ratio: 2.51, CI, 1.51 to 4.18) compared with non-users.8 Among patients with dementia, current use of olanzapine or quetiapine and current use of any FGAs were associated with significantly increased odds of seizures. This study suggests that the underlying mental illness might modulate the seizure risk associated with antipsychotics.8
Wu et al9 conducted a study based on the National Health Insurance Research Database in Taiwan. They examined the 1-year incidence of new-onset seizures among patients diagnosed with schizophrenia or mood disorders who were new to antipsychotic treatment, and calculated the risk of seizure associated with each antipsychotic in reference to risperidone. They found that those receiving clozapine, thioridazine, and haloperidol were 2 to 3 times more likely to develop seizures than those treated with risperidone; risks associated with the rest of the FGAs were similar to that of risperidone.
The results of these 2 large cohort studies are somewhat concurrent in indicating that, other than clozapine, SGAs incur similar risks of seizures; furthermore, they specify that, contrary to earlier studies,10 haloperidol is associated with significantly higher odds of seizures. While both of these cohort studies controlled for several sociodemographic and clinical confounders, they have several limitations. First, diagnoses of seizures were based on information available in databases, which might be subject to inaccuracies. Second, neither study evaluated the effect of drug dosage and duration of exposure on new-onset seizures.
Continue to: Most evidence is from case reports
Most evidence is from case reports
Other than these 2 large studies, most of the evidence addressing the relationship between the use of antipsychotics and incidence of seizures is low quality and relies on case reports or expert opinions. Older studies found that, among FGAs, seizure risk is highest with chlorpromazine and promazine, and lowest with thioridazine and haloperidol.10 As for SGAs, case reports have described seizuresassociated with the use of quetiapine, aripiprazole, risperidone, paliperidone, and olanzapine.
Quetiapine. Three case reports published between 2002 and 2010 describe generalized
Aripiprazole. Five case reports described staring spells and tonic-clonic seizures in patients receiving 10 to 15 mg of aripiprazole.15-19 In the New Drug Application (NDA) for aripiprazole, the incidence of seizures was estimated to be .11% (1 of 926 patients) in placebo-controlled trials and .46% (3 of 859 patients) in haloperidol-controlled trials.20
Risperidone’s product labeling suggests the drug should be used with caution in patients with a history of seizures or conditions that could result in a lower seizure threshold. In Phase III placebo-controlled trials, seizures occurred in .3% of patients treated with risperidone, although in some cases, the seizures were induced by electrolyte disturbances such as hyponatremia.21 Gonzalez-Heydrich et al22 and Holzhausen et al23 found no increase in seizure activity among patients with epilepsy who were receiving risperidone. Lane et al24 published a case report of a geriatric woman who presented with a generalized tonic-clonic seizure related to rapid titration of risperidone; however, with slower titration and lower doses, she stopped having seizures without adding any antiepileptic drugs. Komossa et al25 found that risperidone is less epileptogenic than clozapine, with a relative risk of .22.
Paliperidone is the active metabolite of risperidone and does not have pharmacokinetic interactions with drugs metabolized by the cytochrome P450 (CYP) enzymes. Its labeling indicates that the drug should be used with caution in patients with a history of seizures.26 In Phase III placebo-controlled trials of paliperidone, the rate of seizures was .22%.27 Two case reports suggest close monitoring of seizure risk in patients receiving paliperidone.28,29 Liang et al29 reported that co-administration of valproic acid could mask an underlying decrease of the seizure threshold caused by antipsychotics such as paliperidone.
Continue to: Olanzapine
Olanzapine is a thienobenzodiazepine derivative and is chemically related to clozapine.30 The olanzapine NDA31 shows that 23 of 3,139 patients developed seizures, mainly tonic-clonic, with evidence suggesting that the seizures may have been due to confounding factors such as a history of seizures or metabolic abnormalities. There were no statistically significant differences in the rate of seizures associated with olanzapine compared with placebo or haloperidol (P = .252 and .168, respectively).
A literature review for olanzapine yielded 1 case report of repetitive focal seizures and lingual dystonia,32 5 case reports of generalized tonic-clonic seizures and myoclonus,33-37 and 2 case reports of status epilepticus.38,39 Olanzapine’s clearance is 25% to 30% lower in women, and most of these case reports occurred women.40
Details of the above case reports are summarized in Table 1 (aripiprazole15-19), Table 2 (olanzapine32-39), and Table 3 (paliperidone,28,29 quetiapine,11-13 and risperidone22-24).
Ziprasidone. According to the NDA safety database, the seizure rate attributed to ziprasidone was 1.8 per 100 subject-years or 0.54% of participants (12 of 2,588).41 No additional studies have been published regarding its seizure risk.
Clozapine has a black-box warning
To the best of our knowledge, clozapine is the only antipsychotic that carries an FDA “black-box” warning regarding its risk of inducing seizures.42 Devinsky and Pacia43 reported a cumulative risk of 10% after 3.8 years of treatment. The literature has described clozapine-induced generalized tonic-clonic, myoclonic, simple and complex partial, and absence seizures.44 Table 445 lists the estimated frequency of each seizure type based on 101 cases of clozapine-induced seizures. Myoclonic seizures and drop attacks could be precursors/warning signs of grand mal tonic-clonic seizures.46,47 Seizures have been observed at all stages of treatment, but were more common during initiation of clozapine, which emphasizes the importance of a progressive and slow titration.43,48 The incidence of seizures was estimated to be 6% in a sample of 216 patients with schizophrenia with no history of epilepsy who were prescribed clozapine.49
Continue to: Regarding a possible association between...
Regarding a possible association between clozapine dose or clozapine plasma levels and seizure risk, there is a positive linear relationship between the dose of clozapine and its serum concentration over a dosing range of 25 to 800 mg/d.50 However, the plasma concentration is also significantly affected by factors such as smoking, gender, age, drug interactions, and CYP genotypes. Therefore, the same clozapine dose will yield a lower serum concentration in an older male who smokes compared with a younger, non-smoking female.51 Perry et al52 suggested a dosing nomogram to calculate the influence of gender and smoking. Seizure risk, especially for tonic-clonic seizures, has been reported to increase with clozapine doses >600 mg/d,53 and with plasma concentrations exceeding 1,000 to 1,300 mg/L.54 However, in a 2011 regression analysis, Varma et al55 found no statistically significant relationship between seizure risk and clozapine oral dose; there was not enough data to test a correlation between clozapine plasma levels and the incidence of seizures.
How antipsychotics might lower the seizure threshold
Researchers have suggested several possible mechanisms to explain how antipsychotics might lower the seizure threshold. Antagonism of dopamine D4, histamine H1, and acetylcholine-muscarinic receptors seems to induce EEG alterations and increase the risk of seizures.56 Additionally, modulation of the N-methyl-
Watch for pharmacokinetic interactions
The CYP enzymes involved in drug metabolism include CYP1A2, CYP2C9, CYP2C19, CYP2D6, and CYP3A4. Most commonly used antiepileptics and antipsychotics are metabolized by CYP enzymes, and may also act as inhibitors or inducers of these enzymes.61 Drug interactions may impair seizure control, which is why monotherapy is preferable to combination treatment in patients with epilepsy.62 Carbamazepine and phenytoin are inducers of both CYP1A2 (which metabolizes olanzapine and clozapine), and CYP3A4 (which metabolizes haloperidol, risperidone, quetiapine, ziprasidone and clozapine). Paliperidone is not metabolized by CYP enzymes.62 Discontinuing an enzyme-inducing agent may result in increased antipsychotic plasma concentrations, which might lead to an increased risk of seizures.
Valproic acid, which is often used to prevent or treat clozapine-induced seizures, has an unclear effect on clozapine plasma concentrations.63 Although valproic acid is known to inhibit clozapine metabolism, 2 reports have suggested that the plasma concentrations of clozapine and its metabolites may decrease after adding valproic acid.64,65 Other studies have found that valproic acid increases plasma concentrations of clozapine while it decreases plasma concentrations of norclozapine; norclozapine is the main clozapine metabolite responsible for inducing seizures.66,67
Steps for minimizing seizure risk
Determining the seizure risk for a patient taking an antipsychotic is challenging because doing so depends not only on the seizurogenic potential of each drug but also on individualized predisposing factors.11,57,68 Choosing the “best” antipsychotic therefore largely depends on each patient’s profile. The predisposing factors consist mainly of the individually inherited seizure threshold (personal history of febrile convulsions or a family history of seizures) and other comorbid seizurogenic conditions, such as a history of head trauma, brain injury, intellectual disability, cerebral arteriosclerosis, neurodegenerative diseases, encephalopathy, chronic renal insufficiency, and hyponatremia. Furthermore, seizure risk depends on the antipsychotic dose administered and the rate of titration.11
Continue to: There is not enough evidence...
There is not enough evidence to recommend performing an EEG in all patients taking antipsychotics. Such testing is recommended only for patients who have predisposing factors for seizures. If an EEG shows any abnormality in a patient taking clozapine, consider decreasing the clozapine dose69,70 or adding an antiepileptic drug such as valproic acid or lamotrigine.44,70
Although clozapine carries a black-box warning of increased risk of causing seizures, there is no consensus regarding the efficacy of co-prescribing an antiepileptic. Some studies have suggested prescribing valproic acid prophylactically,71 after the occurrence of 1 seizure,59 or after 2 seizures.54,72 Others have recommended prescribing prophylactic valproic acid for patients taking ≥600 mg/d of clozapine or whose clozapine plasma levels are >500 mg/L.73 Varma et al55 recommended starting an antiepileptic medication if there are clear epileptiform discharges on EEG, if the patient develops stuttering or speech difficulties, or if seizures occur. Liukkonen et al72 advised initiating an antiepileptic at the start of clozapine treatment in patients who are taking other epileptogenic medications, patients with pre-existing seizure disorder, and patients with neurologic abnormalities. On the other hand, Caetano51 argued against primary prevention of seizures for patients receiving >600 mg/d of clozapine, suggesting that “the risk of seizures would be better managed by close clinical monitoring and measures of clozapine serum concentration rather than adding an anticonvulsant drug.”
Current recommendations for primary and secondary prevention of clozapine-induced seizures are detailed in Table 5.42,44,45,51,55,57,69,74,75
Studies addressing the seizurogenic potential of SGAs other than clozapine have a low level of evidence and include patients who had comorbid conditions and were taking other medications that could cause seizures. Additionally, clinical trials of SGAs rarely include patients with seizure disorders; this might underestimate the risk of seizures.4
The effect of the mental illness itself on the seizure threshold needs to be considered.43 Bloechlinger et al8 found that dementia might be inherently associated with a higher risk of antipsychotic-related seizures. Moreover, numerous qualitative EEG studies have found abnormalities in 20% to 60% of patients with schizophrenia.56 Other quantitative studies have reported mild and nonspecific EEG abnormalities, such as increased delta and/or theta activity, in many non-medicated patients with schizophrenia.10,76 Additionally, brain tissue analysis of deceased patients who had schizophrenia has shown a significant increase in dopamine concentrations in the left amygdala compared with controls, and this might be responsible for enhanced electrical activity in this region.10 Some studies have described EEG slowing in the frontal brain regions of patients with schizophrenia,77 and was selectively normalized in these areas with antipsychotics.78
As always, start low, go slow
Mounting evidence suggests that antipsychotic medications decrease the seizure threshold. Practitioners should thus be cautious in prescribing antipsychotics and should target reaching the minimal effective dose with slow titration, especially in patients with predisposing factors for epilepsy.
Continue to: Although evidence suggests...
Although evidence suggests antipsychotics can induce different types of epileptic seizures, the quality of this evidence is low. Randomized controlled trials are needed to determine which antipsychotics increase seizure risk and whether there is a dose-effect relationship.
Bottom Line
Among second-generation antipsychotics, clozapine appears to increase the risk of clinical seizure the most. Correlations with dosage and/or plasma levels have not been proven. Psychiatrists should be vigilant for pharmacokinetic interactions between antipsychotics and antiepileptics, notably via CYP1A2 and CYP3A4.
Related Resources
- Druschky K, Bleich S, Grohmann R, et al. Seizure rates under treatment with antipsychotic drugs: Data from the AMSP project. World J Biol Psychiatry. 2018;15:1-10.
- Epilepsy Foundation. For professionals: Antipsychotics. https://www.epilepsy.com/learn/professionals/diagnosistreatment/psychotropic-drugs-developmental-disabilities/comorbid-5.
Drug Brand Names
Aripiprazole • Abilify
Benztropine • Cogentin
Bethanechol • Duvoid
Carbamazepine • Carbatrol, Tegretol
Chlorpromazine • Thorazine
Cimetidine • Tagamet
Ciprofloxacin • Cipro
Citalopram • Celexa
Clonazepam • Klonopin
Clozapine • Clozaril
Donepezil • Aricept
Enalapril • Vasotec
Erythromycin • Erythrocin
Escitalopram • Lexapro
Flunitrazepam • Rohypnol
Fluvoxamine • Luvox
Gabapentin • Neurontin
Haloperidol • Haldol
Lamotrigine • Lamictal
Lithium • Eskalith, Lithobid
Metformin • Fortamet, Glucophage
Mirtazapine • Remeron
Nitrofurantoin • Furadantin
Olanzapine • Zyprexa
Paliperidone • Invega
Phenobarbital • Luminal
Phenytoin • Dilantin
Prochlorperazine • Compazine
Procyclidine • Kemadrin
Propranolol • Inderal
Quetiapine • Seroquel
Risperidone • Risperdal
Sertraline • Zoloft
Simvastatin • Zocor
Sulfamethoxazole/trimethoprim • Bactrim, Sulfatrim
Topiramate • Topamax
Trifluoperazine • Stelazine
Valproic acid • Depakene, Depakote
Ziprasidone • Geodon
1. Bruijnzeel D, Suryadevara U, Tandon R. Antipsychotic treatment of schizophrenia: an update. Asian J Psychiatr. 2014;11:3-7.
2. Hrdlicka M, Dudova I. Atypical antipsychotics in the treatment of early-onset schizophrenia. Neuropsychiatr Dis Treat. 2015;11:907-913.
3. Koch-Stoecker S. Antipsychotic drugs and epilepsy: indications and treatment guidelines. Epilepsia. 2002;43(suppl 2):19-24.
4. Alper K, Schwartz KA, Kolts RL, et al. Seizure incidence in psychopharmacological clinical trials: an analysis of Food and Drug Administration (FDA) summary basis of approval reports. Biol Psychiatry. 2007;62(4):345-354.
5. Torta R, Keller R. Behavioral, psychotic, and anxiety disorders in epilepsy: etiology, clinical features, and therapeutic implications. Epilepsia. 1999;40(suppl 10):S2-S20.
6. Kumlien E, Lundberg PO. Seizure risk associated with neuroactive drugs: data from the WHO adverse drug reactions database. Seizure. 2010;19(2):69-73.
7. Lertxundi U, Hernandez R, Medrano J, et al. Antipsychotics and seizures: higher risk with atypicals? Seizure. 2013;22(2):141-143.
8. Bloechliger M, Rüegg S, Jick SS, et al. Antipsychotic drug use and the risk of seizures: follow-up study with a nested case-control analysis. CNS Drugs. 2015;29(7):591-603.
9. Wu CS, Wang SC, Yeh IJ, et al. Comparative risk of seizure with use of first- and second-generation antipsychotics in patients with schizophrenia and mood disorders. J Clin Psychiatry. 2016;77(5):e573-e579.
10. Cold JA, Wells BG, Froemming JH. Seizure activity associated with antipsychotic therapy. [Erratum in DICP. 1990;24(10):1012.] DICP. 1990;24(6):601-606.
11. Hedges DW, Jeppson KG. New-onset seizure associated with quetiapine and olanzapine. Ann Pharmacother. 2002;36(3):437-439.
12. Dogu O, Sevim S, Kaleagasi HS. Seizures associated with quetiapine treatment. Ann Pharmacother. 2003;37(9):1224-1227.
13. Young AC, Kleinschmidt KC, Wax PM. Late-onset seizures associated with quetiapine poisoning. J Med Toxicol. 2009;5(1):24-26.
14. US Food and Drug Administration. Recommendation of approvable action for quetiapine fumarate extended release (Seroquel® XR) for the treatment of schizophrenia. http://www.accessdata.fda.gov/drugsatfda_docs/nda/2007/022047Orig1s000MedR.pdf. April 24, 2007. Accessed January 28, 2019.
15. Malik AR, Ravasia S. Aripiprazole-induced seizure. Can J Psychiatry. 2005;50(3):186.
16. Tsai JF. Aripiprazole-associated seizure. J Clin Psychiatry. 2006;67(6):995-996.
17. Arora M, Arndorfer L. EEG abnormalities in a patient taking aripiprazole. Psychiatry (Edgmont). 2007;4(7):18-19.
18. Yueh CL, Yu SL, Chen HM, et al. Aripiprazole-induced seizure: a second case report. BMJ case reports. 2009;2009:bcr03.2009.1693. doi: 10.1136/bcr.03.2009.1693.
19. Thabet FI, Sweis RT, Joseph SA. Aripiprazole-induced seizure in a 3-year-old child: a case report and literature review. Clin Neuropharmacol. 2013;36(1):29-30.
20. US Food and Drug Administration. Abilify (Aripiprazole) tablets. Medical Review Part 2. http://www.accessdata.fda.gov/drugsatfda_docs/nda/2002/21-436_Abilify_medr_P2.pdf. Published March 07, 2003. Accessed January 28, 2019.
21. US Food and Drug Administration. Drugs@FDA: FDA approved drug products. Risperdal tablets, Risperdal oral solution & Risperdal M-tab orally disintegrating tablets. http://www.accessdata.fda.gov/drugsatfda_docs/nda/2003/021444_S004_RISPERDAL_TABLETS.pdf. Published September 10, 2003. Accessed January 28, 2019.
22. Gonzalez-Heydrich J, Pandina GJ, Fleisher CA, et al. No seizure exacerbation from risperidone in youth with comorbid epilepsy and psychiatric disorders: a case series. J Child Adolesc Psychopharmacol. 2004;14(2):295-310.
23. Holzhausen SPF, Guerreiro MM, Baccin CE, et al. Use of risperidone in children with epilepsy. Epilepsy Behav. 2007;10(3):412-416.
24. Lane HY, Chang WH, Chou JC. Seizure during risperidone treatment in an elderly woman treated with concomitant medications. J Clinl Psychiatry. 1998;59(2):81-82.
25. Komossa K, Rummel-Kluge C, Schwarz S, et al. Risperidone versus other atypical antipsychotics for schizophrenia. Cochrane Database Syst Rev. 2011;(1):19:CD006626.
26. Paliperidone [package insert]. Mountainville, CA: Janssen Pharmaceuticals, Inc.; 2007.
27. Brugge, MD; US Food and Drug Administration. Paliperidone OROS oral formulation. http://www.accessdata.fda.gov/drugsatfda_docs/nda/2006/021999s000_MedR_Part4.pdf. Accessed January 28, 2019.
28. Schneider RA, Lizer MH. Apparent seizure and atrial fibrillation associated with paliperidone. Am J Health System Pharm. 2008;65(22):2122-2125.
29. Liang CS, Yang FW, Chiang KT. Paliperidone-associated seizure after discontinuation of sodium valproate: a case report. J Clin Psychopharmacol. 2011;31(2):246-247.
30. Fulton B, Goa KL. Olanzapine. A review of its pharmacological properties and therapeutic efficacy in the management of schizophrenia and related psychoses. Drugs. 1997;53(2):281-298.
31. US Food and Drug Administration. Drugs@FDA: FDA approved drug products: Zyprexa (olanzapine). ORIG-1. http://www.accessdata.fda.gov/drugsatfda_docs/nda/96/020592_Original_Approval_Pkg%20.pdf. Published September 30, 1996. Accessed January 28, 2019.
32. Anzellotti F, Capasso M, Frazzini V, et al. Olanzapine-related repetitive focal seizures with lingual dystonia. Epileptic Disord. 2016;18(1):83-86.
33. Lee JW, Crismon ML, Dorson PG. Seizure associated with olanzapine. Ann Pharmac. 1999;33(5):554-556.
34. Woolley J, Smith S. Lowered seizure threshold on olanzapine. Br J Psychiatry. 2001;178(1):85-86.
35. Behere RV, Anjith D, Rao NP, et al. Olanzapine-induced clinical seizure: a case report. Clin Neuropharmacol. 2009;32(5):297-298.
36. Camacho A, García-Navarro M, Martínez B, et al. Olanzapine-induced myoclonic status. Clin Neuropharmacol. 2005;28(3):145-147.
37. Rosen JB, Milstein MJ, Haut SR. Olanzapine-associated myoclonus. Epilepsy Res. 2012;98(2-3):247-250.
38. Wyderski RJ, Starrett WG, Abou-Saif A. Fatal status epilepticus associated with olanzapine therapy. Ann Pharmacother. 1999;33(7-8):787-789.
39. Spyridi S, Sokolaki S, Nimatoudis J, et al. Status epilepticus in a patient treated with olanzapine and mirtazapine. Int J Clin Pharmacol Ther. 2009;47(2):120-123.
40. Schatzberg AF, Nemeroff CB. Essentials of clinical psychopharmacology. 2nd ed. Arlington, Virginia: American Psychiatric Publishing; 2006.
41. US Food and Drug Administration. Drug approval package: Geodon (Ziprasidone HCI) Capsules. Medical Review Part 2. http://www.accessdata.fda.gov/drugsatfda_docs/nda/2001/20-825_Geodan_medr_P2.pdf. Published February 5, 2001. Accessed January 29, 2019.
42. Clozaril [package insert]. East Hanover, NJ: Novartis; 2008.
43. Devinsky O, Pacia SV. Seizures during clozapine therapy. J Clin Psychiatry. 1994;55(suppl B):153-156.
44. Williams AM, Park SH. Seizure associated with clozapine: incidence, etiology, and management. CNS Drugs. 2015;29(2):101-111.
45. Wong J, Delva N. Clozapine-induced seizures: recognition and treatment. Can J Psychiatry. 2007;52(7):457-463.
46. Berman I, Zalma A, DuRand CJ, et al. Clozapine-induced myoclonic jerks and drop attacks. J Clin Psychiatry. 1992;53(9):329-330.
47. Gouzoulis E, Ozdaglar A, Kasper J. Myoclonic seizures followed by grand mal seizures during clozapine treatment. Am J Psychiatry. 1993;150(7):1128.
48. Sajatovic M, Meltzer HY. Clozapine-induced myoclonus and generalized seizures. Biol Psychiatry. 1996;39(5):367-370.
49. Grover S, Hazari N, Chakrabarti S, et al. Association of clozapine with seizures: a brief report involving 222 patients prescribed clozapine. East Asian Arch Psychiatry. 2015;25(2):73-78.
50. Byerly MJ, DeVane CL. Pharmacokinetics of clozapine and risperidone: a review of recent literature. J Clin Psychopharmacol. 1996;16(2):177-187.
51. Caetano D. Use of anticonvulsants as prophylaxis for seizures in patients on clozapine. Australas Psychiatry. 2014;22(1):78-83.
52. Perry PJ, Bever KA, Arndt S, et al. Relationship between patient variables and plasma clozapine concentrations: a dosing nomogram. Biol Psychiatry.1998;44(8):733-738.
53. Dumortier G, Mahé V, Pons D, et al. Clonic seizure associated with high clozapine plasma level. J Neuropsychiatry Clin Neurosci. 2001;13(2):302-303.
54. Funderburg LG, Vertrees JE, True JE, et al. Seizure following addition of erythromycin to clozapine treatment. Am J Psychiatry. 1994;151(12):1840-1841.
55. Varma S, Bishara D, Besag FMC, et al. Clozapine-related EEG changes and seizures: dose and plasma-level relationships. Ther Adv Psychopharmacol. 2011;1(2):47-66.
56. Amann BL, Pogarell O, Mergl R, et al. EEG abnormalities associated with antipsychotics: a comparison of quetiapine, olanzapine, haloperidol and healthy subjects. Hum Psychopharmacol. 2003;18(8):641-646.
57. Pisani F, Oteri G, Costa C, et al. Effects of psychotropic drugs on seizure threshold. Drug Saf. 2002;25(2):91-110.
58. Maurice T, Phan VL, Urani A, et al. Neuroactive neurosteroids as endogenous effectors for the sigma1 (sigma1) receptor: pharmacological evidence and therapeutic opportunities. Jpn J Pharmacol. 1999;81(2):125-155.
59. Haller E, Binder RL. Clozapine and seizures. Am J Psychiatry. 1990;147(8):1069-1071.
60. Torta R, Monaco F. Atypical antipsychotics and serotoninergic antidepressants in patients with epilepsy: pharmacodynamic considerations. Epilepsia. 2002;43(suppl 2):8-13.
61. Spina E. Drug interactions. In: Shorvon S, Perucca E, Engel J Jr, eds. The treatment of epilepsy. 3rd ed. Oxford, UK: Blackwell Publishing; 2009:361-377.
62. Spina E, Perucca E. Clinical significance of pharmacokinetic interactions between antiepileptic and psychotropic drugs. Epilepsia. 2002;43(suppl 2):37-44.
63. de Leon J, Santoro V, D’Arrigo C, et al. Interactions between antiepileptics and second-generation antipsychotics. Expert Opin Drug Metab Toxicol. 2012;8(3):311-334.
64. Finley P, Warner D. Potential impact of valproic acid therapy on clozapine disposition. Biol Psychiatry. 1994;36(7):487-488.
65. Longo LP, Salzman C. Valproic acid effects on serum concentrations of clozapine and norclozapine. Am J Psychiatry. 1995;152(4):650.
66. Centorrino F, Baldessarini RJ, Kando J, et al. Serum concentrations of clozapine and its major metabolites: effects of cotreatment with fluoxetine or valproate. Am J Psychiatry. 1994;151(1):123-125.
67. Facciolà G, Avenoso A, Scordo MG, et al. Small effects of valproic acid on the plasma concentrations of clozapine and its major metabolites in patients with schizophrenic or affective disorders. Ther Drug Monit. 1999;21(3):341-345.
68. Hyde TM, Weinberger DR. Seizures and schizophrenia. Schizophr Bull. 1997;23(4):611-622.
69. Muzyk A, Gala G, Kahn DA. Use of lamotrigine in a patient with a clozapine-related seizure. J Psychiatr Pract. 2010;16(2):125-128.
70. Kikuchi YS, Sato W, Ataka K, et al. Clozapine-induced seizures, electroencephalography abnormalities, and clinical responses in Japanese patients with schizophrenia. Neuropsychiatr Dis Treat. 2014;10:1973-1978.
71. Taner E, Coşar B, Işik E. Clozapine-induced myoclonic seizures and valproic acid. Int J Psychiatry Clin Pract. 1998;2(1):53-55.
72. Liukkonen J, Koponen HJ, Nousiainen U. Clinical picture and long-term course of epileptic seizures that occur during clozapine treatment. Psychiatry Res. 1992;44(2):107-112.
73. Devinsky O, Honigfeld G, Patin J. Clozapine-related seizures. Neurology. 1991;41(3):369-371.
74. Foster R, Olajide D. A case of clozapine-induced tonic-clonic seizures managed with valproate: implications for clinical care. J Psychopharmacol. 2005;19(1):93-96.
75. Gandelman-Marton R, Theitler J, Klein C, et al. Phenytoin intoxication in a clozapine-related prolonged seizure. J Emerg Med. 2008;35(4):407-409.
76. Primavera A, Giberti L, Scotto P, et al. Nonconvulsive status epilepticus as a cause of confusion in later life: a report of 5 cases. Neuropsychobiology. 1994;30(2-3):148-152.
77. Boutros NN, Arfken C, Galderisi S, et al. The status of spectral EEG abnormality as a diagnostic test for schizophrenia. Schizophrenia Res. 2008;99(1-3):225-237.
78. Takahashi T, Cho RY, Mizuno T, et al. Antipsychotics reverse abnormal EEG complexity in drug-naïve schizophrenia: a multiscale entropy analysis. Neuroimage. 2010;51(1):173-182.
