User login
Slight Hyperglycemia Risk Shouldn't Deter Statin Use
The Food and Drug Administration's announcement that the labeling of statins will now note their potential for raising a patient’s blood sugar and glycosylated hemoglobin levels is a reminder that, despite their relative safety, statin treatment poses some level of risk and hence should not be prescribed indiscriminately, experts said.
On the other hand, the risk for blood sugar elevation is modest enough that for the vast majority of patients who have significant cardiovascular disease (CVD) risk, the potential benefit from statin treatment continues to far outweigh the risk patients might face from statin-induced hyperglycemia, according to several experts interviewed for this article. Patients with cardiovascular disease risk who could remain on statins include those who have already had a cardiovascular event, the secondary prevention population, and patients who already have diabetes, considered a coronary risk equivalent because of the sizeable risk that diabetes confers for a future cardiovascular event.
"It would be a mistake to say that anyone at high risk for diabetes should be denied a statin because these people are also at high risk for cardiovascular disease."
Boosted hyperglycemia that pushes a person’s fasting plasma glucose level to 126 mg/dL or above, the range diagnosed as type 2 diabetes, "is probably the most frequent quantifiable harm from statins" but is still uncommon, noted Dr. Jennifer G. Robinson, professor of medicine and epidemiology at the University of Iowa in Iowa City. She estimated that of the 10%-15% of patients who will develop type 2 diabetes over a period of several years on statin treatment, roughly 1 new case of diabetes out of every 500 incident cases will be attributable to statin treatment, based on the risk information available today.
"It's not very much. It should not change any clinician’s day to day practice in any way," said Dr. Robinson, who is also a vice-chair of the Adult Treatment Panel IV, the group assembled by the National Heart, Lung, and Blood Institute to issue new U.S. cholesterol management guidelines, expected later this year. "It just means that you don’t give a statin to everyone, not someone with a 1% risk for a cardiovascular event over the next 10 years," she said.
Primary prevention poses the most complicated issues, when physicians prescribe statins to people who have not yet had any cardiovascular event. Prescribers face the difficult question of when the risk for incident hyperglycemia triggered by a statin starts to outweigh the benefit from cardiovascular risk reduction. Further muddying the question of whom to exclude from primary prevention with statin treatment are the unknowns that shroud the effect: How do statins cause this? Which patients are most susceptible? Do different statins pose varying levels of hyperglycemia risk?
"As increasingly large populations become candidates for statin treatment, with new guidelines and new methods for CVD risk-prediction modeling, it will be very important to look at the benefit to risk ratio of treatment, including the risk for developing diabetes," said Dr. JoAnn E. Manson, professor of medicine at Harvard Medical School and chief of preventive medicine at Brigham and Women’s Hospital in Boston.
Relatively low-risk groups of patients who are increasingly prescribed statins include adolescents, young adults, and middle-aged women, she noted. "The key is the absolute risk of CVD in these groups, more than their relative risk. In a population with a low absolute risk of CVD events, we need to look very carefully to see where the crossover occurs from net benefit to net risk of treatment."
A problem for the time being is that no good way exists for identifying what factors, beyond borderline high blood glucose at baseline, help identify patients at increased risk for developing diabetes while on statin treatment. Additional research and guidance about what level of fasting plasma glucose at baseline, before a statin regimen starts, should trigger concern, and how often plasma glucose should be monitored once a patient is on a statin, will be helpful, Dr. Manson said.
"Professional societies and expert groups should make clear recommendations about the need for routine vs. targeted glucose testing, as well as the frequency. Consensus guidelines don’t yet exist. The new statin label eliminates testing liver function. Will this be replaced by excessive testing of blood glucose, a practice that could be burdensome to patients and clinicians and drive up health care costs?" she said in an interview.
The dilemma physicians also face when deciding whether to prescribe a statin to patients toward the low end of the cardiovascular risk spectrum is that the same risk factors that might flag patients with a high risk for insulin resistance, hyperglycemia, and the development of type 2 diabetes – factors such as obesity, inadequate physical activity, elements of metabolic syndrome, and a "prediabetic" fasting plasma glucose level of 110-125 mg/dL – also function as cardiovascular disease risk factors.
"It would be a mistake to say that anyone at high risk for diabetes should be denied a statin because these people are also at high risk for cardiovascular disease," Dr. Manson said. She recommended that patients on statin treatment at least be told to be on the alert for developing new symptoms of diabetes: frequent thirst, frequent urination, and blurred vision. "And lifestyle modifications should be intensified to reduce both diabetes and CVD risk."
"The excess risk for diabetes is concentrated in the people with fasting blood sugars in the 115- to 125-mg/dL range" said Dr. Roger S. Blumenthal, professor of medicine and director of preventive medicine at Johns Hopkins Medical Institutions in Baltimore. "A lot of those people are clearly insulin resistant. We almost always have a fasting plasma glucose [when patients are about to start on a statin] as part of a basic lipid profile. With physicians aware of the association, I think this will focus more attention on vulnerable patients in the 115- to 125-mg/dL range, who are headed for diabetes if they don’t make significant improvements in their diet and exercise habits. It’s reasonable to look at glucose and tell patients that a statin might potentially raise their blood sugar by 5-7 mg/dL, but exercising and dropping some excess weight will significantly improve their blood sugar."

Targeted use of plasma glucose testing in statin recipients who seem to have the greatest risk for developing diabetes also received endorsement from Dr. Prakash Deedwania, professor of medicine at the University of California, San Francisco, in Fresno. He suggested possibly doing annual testing of patients with metabolic syndrome, those who are obese, those with a family history of diabetes, and patients who have previously shown impaired glucose tolerance on a tolerance test.
If a patient’s fasting plasma glucose began to creep up on a statin regimen, "I’d look for other reasons, such as did they gain weight?" he said. Seeing a possible hyperglycemic effect should also prompt a reassessment of whether the patient benefited from the statin, and whether they have made necessary lifestyle changes like improved diet and increased exercise. Rising blood sugar could be used to help motivate a patient to do better on lifestyle measures, and trigger a reevaluation of whether the patient is, on balance, benefiting from the statin, he said. Changing the statin used or the dosage is tricky, because no evidence exists now to support such steps.
But because the biggest signal for the prodiabetic effect of statins came in results from the Justification for the Use of Statins in Prevention: An Intervention Trial Evaluating Rosuvastatin (JUPITER) (N. Engl. J. Med. 2008;359:2195-207), the current perception among at least some physicians is that rosuvastatin (Crestor) poses the biggest hyperglycemic risk. "Some physicians might consider changing [the prescribed statin] from rosuvastatin to simvastatin or atorvastatin," Dr. Blumenthal said.
The FDA took the right step in adding the hyperglycemia information to statin labeling, said Dr. Deedwania. "They give the data, and leave it up to physicians to make their own conclusions."

As a consequence of the FDA’s actions "a lot more physicians will pay attention to glucose as they put patients on statins. The evidence is consistent, and most now agree that it’s real," said Dr. Stephen J. Nicholls, a cardiologist at the Cleveland Clinic. "But these are not completely healthy people with low glucose levels who suddenly, on a statin, become diabetic. What this reinforces is that while there will continue to be a lot of people who require statin treatment, the cornerstone of treatment is lifestyle change: diet, exercise, and weight loss. There is a continuum of risk: Patients at higher risk will benefit from a statin; for patients at very low risk use lifestyle. And if you put a patient on a statin, you need to keep an eye on them."
Dr. Robinson, Dr. Manson, and Dr. Blumenthal said that they had no relevant financial disclosures. Dr. Deedwania said that he has been a consultant to Pfizer, Amarin, and Amgen. Dr. Nicholls said he has received research support from AstraZeneca and has been a consultant to AstraZeneca, Merck, and Pfizer.
The Food and Drug Administration's announcement that the labeling of statins will now note their potential for raising a patient’s blood sugar and glycosylated hemoglobin levels is a reminder that, despite their relative safety, statin treatment poses some level of risk and hence should not be prescribed indiscriminately, experts said.
On the other hand, the risk for blood sugar elevation is modest enough that for the vast majority of patients who have significant cardiovascular disease (CVD) risk, the potential benefit from statin treatment continues to far outweigh the risk patients might face from statin-induced hyperglycemia, according to several experts interviewed for this article. Patients with cardiovascular disease risk who could remain on statins include those who have already had a cardiovascular event, the secondary prevention population, and patients who already have diabetes, considered a coronary risk equivalent because of the sizeable risk that diabetes confers for a future cardiovascular event.
"It would be a mistake to say that anyone at high risk for diabetes should be denied a statin because these people are also at high risk for cardiovascular disease."
Boosted hyperglycemia that pushes a person’s fasting plasma glucose level to 126 mg/dL or above, the range diagnosed as type 2 diabetes, "is probably the most frequent quantifiable harm from statins" but is still uncommon, noted Dr. Jennifer G. Robinson, professor of medicine and epidemiology at the University of Iowa in Iowa City. She estimated that of the 10%-15% of patients who will develop type 2 diabetes over a period of several years on statin treatment, roughly 1 new case of diabetes out of every 500 incident cases will be attributable to statin treatment, based on the risk information available today.
"It's not very much. It should not change any clinician’s day to day practice in any way," said Dr. Robinson, who is also a vice-chair of the Adult Treatment Panel IV, the group assembled by the National Heart, Lung, and Blood Institute to issue new U.S. cholesterol management guidelines, expected later this year. "It just means that you don’t give a statin to everyone, not someone with a 1% risk for a cardiovascular event over the next 10 years," she said.
Primary prevention poses the most complicated issues, when physicians prescribe statins to people who have not yet had any cardiovascular event. Prescribers face the difficult question of when the risk for incident hyperglycemia triggered by a statin starts to outweigh the benefit from cardiovascular risk reduction. Further muddying the question of whom to exclude from primary prevention with statin treatment are the unknowns that shroud the effect: How do statins cause this? Which patients are most susceptible? Do different statins pose varying levels of hyperglycemia risk?
"As increasingly large populations become candidates for statin treatment, with new guidelines and new methods for CVD risk-prediction modeling, it will be very important to look at the benefit to risk ratio of treatment, including the risk for developing diabetes," said Dr. JoAnn E. Manson, professor of medicine at Harvard Medical School and chief of preventive medicine at Brigham and Women’s Hospital in Boston.
Relatively low-risk groups of patients who are increasingly prescribed statins include adolescents, young adults, and middle-aged women, she noted. "The key is the absolute risk of CVD in these groups, more than their relative risk. In a population with a low absolute risk of CVD events, we need to look very carefully to see where the crossover occurs from net benefit to net risk of treatment."
A problem for the time being is that no good way exists for identifying what factors, beyond borderline high blood glucose at baseline, help identify patients at increased risk for developing diabetes while on statin treatment. Additional research and guidance about what level of fasting plasma glucose at baseline, before a statin regimen starts, should trigger concern, and how often plasma glucose should be monitored once a patient is on a statin, will be helpful, Dr. Manson said.
"Professional societies and expert groups should make clear recommendations about the need for routine vs. targeted glucose testing, as well as the frequency. Consensus guidelines don’t yet exist. The new statin label eliminates testing liver function. Will this be replaced by excessive testing of blood glucose, a practice that could be burdensome to patients and clinicians and drive up health care costs?" she said in an interview.
The dilemma physicians also face when deciding whether to prescribe a statin to patients toward the low end of the cardiovascular risk spectrum is that the same risk factors that might flag patients with a high risk for insulin resistance, hyperglycemia, and the development of type 2 diabetes – factors such as obesity, inadequate physical activity, elements of metabolic syndrome, and a "prediabetic" fasting plasma glucose level of 110-125 mg/dL – also function as cardiovascular disease risk factors.
"It would be a mistake to say that anyone at high risk for diabetes should be denied a statin because these people are also at high risk for cardiovascular disease," Dr. Manson said. She recommended that patients on statin treatment at least be told to be on the alert for developing new symptoms of diabetes: frequent thirst, frequent urination, and blurred vision. "And lifestyle modifications should be intensified to reduce both diabetes and CVD risk."
"The excess risk for diabetes is concentrated in the people with fasting blood sugars in the 115- to 125-mg/dL range" said Dr. Roger S. Blumenthal, professor of medicine and director of preventive medicine at Johns Hopkins Medical Institutions in Baltimore. "A lot of those people are clearly insulin resistant. We almost always have a fasting plasma glucose [when patients are about to start on a statin] as part of a basic lipid profile. With physicians aware of the association, I think this will focus more attention on vulnerable patients in the 115- to 125-mg/dL range, who are headed for diabetes if they don’t make significant improvements in their diet and exercise habits. It’s reasonable to look at glucose and tell patients that a statin might potentially raise their blood sugar by 5-7 mg/dL, but exercising and dropping some excess weight will significantly improve their blood sugar."
Targeted use of plasma glucose testing in statin recipients who seem to have the greatest risk for developing diabetes also received endorsement from Dr. Prakash Deedwania, professor of medicine at the University of California, San Francisco, in Fresno. He suggested possibly doing annual testing of patients with metabolic syndrome, those who are obese, those with a family history of diabetes, and patients who have previously shown impaired glucose tolerance on a tolerance test.
If a patient’s fasting plasma glucose began to creep up on a statin regimen, "I’d look for other reasons, such as did they gain weight?" he said. Seeing a possible hyperglycemic effect should also prompt a reassessment of whether the patient benefited from the statin, and whether they have made necessary lifestyle changes like improved diet and increased exercise. Rising blood sugar could be used to help motivate a patient to do better on lifestyle measures, and trigger a reevaluation of whether the patient is, on balance, benefiting from the statin, he said. Changing the statin used or the dosage is tricky, because no evidence exists now to support such steps.
But because the biggest signal for the prodiabetic effect of statins came in results from the Justification for the Use of Statins in Prevention: An Intervention Trial Evaluating Rosuvastatin (JUPITER) (N. Engl. J. Med. 2008;359:2195-207), the current perception among at least some physicians is that rosuvastatin (Crestor) poses the biggest hyperglycemic risk. "Some physicians might consider changing [the prescribed statin] from rosuvastatin to simvastatin or atorvastatin," Dr. Blumenthal said.
The FDA took the right step in adding the hyperglycemia information to statin labeling, said Dr. Deedwania. "They give the data, and leave it up to physicians to make their own conclusions."
As a consequence of the FDA’s actions "a lot more physicians will pay attention to glucose as they put patients on statins. The evidence is consistent, and most now agree that it’s real," said Dr. Stephen J. Nicholls, a cardiologist at the Cleveland Clinic. "But these are not completely healthy people with low glucose levels who suddenly, on a statin, become diabetic. What this reinforces is that while there will continue to be a lot of people who require statin treatment, the cornerstone of treatment is lifestyle change: diet, exercise, and weight loss. There is a continuum of risk: Patients at higher risk will benefit from a statin; for patients at very low risk use lifestyle. And if you put a patient on a statin, you need to keep an eye on them."
Dr. Robinson, Dr. Manson, and Dr. Blumenthal said that they had no relevant financial disclosures. Dr. Deedwania said that he has been a consultant to Pfizer, Amarin, and Amgen. Dr. Nicholls said he has received research support from AstraZeneca and has been a consultant to AstraZeneca, Merck, and Pfizer.
Care Transitions for the Underserved
Hospital readmissions are common and costly, and represent a significant burden to the healthcare system. The challenges of postdischarge medication uncertainty, lack of self‐management support, and lack of timely access to health professionals1 are compounded in uninsured and Medicaid individuals by limited access to medications and primary care, financial strain, insecure housing, and limited social support.2
Our hospital cares for a large number of uninsured and low‐income publicly insured patients. The Portland area safety‐net, which consists of a network of 14 federally qualified health centers and free clinics, has limited capacity for uncompensated care. Uninsured patientsand to a lesser degree, Medicaid patientshave difficulty establishing primary care. Prior to the implementation of our program, uninsured and Medicaid patients without a usual source of care were given a list of safety‐net clinics at discharge, but frequently could not access appointments or navigate the complex system. There were no well‐developed partnerships between hospital and outpatient clinics for uninsured or Medicaid patients. The hospital lacked a systematic approach to securing postdischarge follow‐up and peridischarge patient education, and uninsured patients were financially responsible for most medications upon discharge. The costs of uncompensated or undercompensated potentially preventable readmissions for these patients, along with the recognition of gaps in quality, ultimately provided the rationale for a medical center‐funded transitional care intervention for uninsured and low‐income publicly insured patients.
Several transitional care improvement programs have shown effectiveness in reducing hospital readmissions,1, 35 but most have been conducted in settings where patients have secure access to outpatient care, and none have focused specifically on uninsured or Medicaid patients. Moreover, the development of these programs requires time and capital. Transitional care programs that have published results, to date, have been funded through government or private foundation grants1, 35; however, broader implementation of transitional care innovations will require financial and intellectual engagement of healthcare institutions themselves.
This report describes development of the Care Transitions Innovation (C‐TraIn), a multicomponent transitional care intervention for uninsured and low‐income publicly insured adults at a large, urban academic medical center, Oregon Health & Science University (OHSU). Because institutional funding and engagement is critical to the sustainability and scalability of similar programs, we also describe our process for gaining institutional support. Our hypothesis is that C‐TraIn can reduce readmissions and emergency department (ED) use at 30 days after hospital discharge, compared with usual care.
METHODS
Engaging Institutional Leaders
Early and continued efforts to engage hospital administrators were integral to our ultimate success in gaining institutional funding and leadership support. Initially, we convened what we called a Health Systems Morbidity and Mortality conference, featuring an uninsured patient who told of his postdischarge experiences and costly, potentially preventable readmission. We invited a broad array of potential stakeholders, including representatives from hospital administration, hospital case managers and social workers, community safety‐net providers, inpatient and outpatient physicians, residents, and medical students. Our patient was previously admitted to OHSU and diagnosed with pneumonia, hypothyroidism, sleep apnea, and depression. At discharge, he was given a list of low‐cost clinics; however, he was unable to arrange follow‐up, could not afford prescriptions, and felt overwhelmed trying to navigate a complex system. Consequently, he received no outpatient healthcare and his illnesses progressed. Unable to stay awake as a long‐haul trucker, he lost his job and subsequently his housing, and was readmitted to the intensive care unit with severe hypercarbic respiratory failure, volume overload, and hypothyroidism. The $130,000 charge for his 19‐day rehospitalization was largely un‐recuperated by the hospital. The case was a stark example of the patient‐safety and financial costs of fragmented care, and the conference was a nidus for further institutional engagement and program development, the key steps of which are described in Table 1.
| Time | Key Step | How Step Was Achieved | Take Home Points |
|---|---|---|---|
| |||
| July 2008July 2009 | 1. Identified key stakeholders | Considered varied stakeholders impacted by transitional care gaps for uninsured and Medicaid patients | Casting a wide net early in the process promoted high level of engagement and allowed self‐identification of some stakeholders |
| 2. Framed problems and opportunities; exposed costs of existing system shortcomings | Educational conference (that we called a Health Systems M&M) fostered a blame‐free environment to explore varied perspectives | Individual patient story made policy issue more accessible to a wide range of stakeholders | |
| Discussion of exposed drivers and costs of misaligned incentives; highlighted inroads to developing a business case for change | |||
| Oct 2008June 2009 | 3. Identified administrative allies and leaders with high bridging capital | Follow‐up with administrator after Health System M&M allowed further identification of key administrative stakeholders | Administrator insight highlighted institutional priorities and strategic plans |
| Ongoing meetings over 9 moto advocate for change, explore support for program development | Key ally within administration facilitated conversation with executive leadership whose support was a critical for program success | ||
| July 2009June 2010 | 4. Framed processes locally with continued involvement from multiple stakeholders | Performed multicomponent needs assessment | Patient assessment included inpatients for ease of survey administration |
| Utilized efforts of student volunteers for low‐budget option | |||
| Existing administrative support aided patient tracking | |||
| Non‐integrated health system and lack of claims data for uninsured limited usefulness of administrative utilization data | |||
| 5. Performed cost analysis to further support the business and quality case | Used OHSU data from needs assessment patient sample to estimate potential costs and savings of saved readmissions and avoided ED visits | Business case highlighted existing costs to OHSU for uncompensated care; program presented a solution to realign incentives and better allocate existing hospital expenditures | |
| Qualitative patient interviews exposed opportunity for quality improvement | Highlighted pilot as an opportunity for institutional learning about transitional care improvements | ||
| 6. Use needs assessment to map intervention | Drew upon local and national health systems expertise through literature review and consultation with local and national program leaders | OHSU's Care Transitions Innovation (C‐TraIn) includes elements aimed at improving access, patient education, care coordination, and systems integration (Table 2) | |
| Matched patient needs to specific elements of program design | |||
Planning the Intervention
Findings from a patient needs assessment and community stakeholder meetingsdescribed belowdirectly informed a multicomponent intervention that includes linkages and payment for medical homes for uninsured patients who lack access to outpatient care, a transitional care nurse whose care bridges inpatient and outpatient settings, inpatient pharmacy consultation, and provision of 30 days of medications at hospital discharge for uninsured patients (Table 2).
| Program Element | Description | Resources per 200 Patients |
|---|---|---|
| ||
| Transitional care RN | Augments patient education and care coordination in the hospital until 30 days after discharge. Tasks include: | 1.0 FTE nurse salary* |
| developing a personal health record with inpatients | ||
| completing a home visit within 72 hr of discharge to focus on medication reconciliation and patient self‐management | ||
| low‐risk patients receive 3 calls and no home visit (see Supporting Information, Appendix 1, in the online version of this article) | ||
| 2 subsequent phone calls to provide additional coaching, identify unmet needs, and close the loop on incomplete financial paperwork | ||
| The nurse provides a warm handoff with clinic staff, assists in scheduling timely posthospital follow‐up, and assures timely transfer of DC summaries. She coordinates posthospital care management with Medicaid case‐workers when available. | ||
| Pharmacy | Consultation: Inpatient pharmacists reconcile and simplify medication regimens, educate patients, and assess adherence barriers. | 0.4 FTE inpatient pharmacist salary |
| Prescription support: For uninsured patients, pharmacists guide MD prescribing towards medications available on the C‐TraIn value‐based formulary, a low‐cost formulary that reflects medications available through $4 plans, a Medicaid formulary, and FQHC on‐site pharmacies. | Estimated $12/prescription; 6.5 prescriptions/patient | |
| Uninsured patients are given 30 days of bridging prescription medications at hospital discharge free of charge. | ||
| Outpatient medical home and specialty care linkages | OHSU has partnered with outpatient clinics on a per‐patient basis to support funding of primary care for uninsured patients who lack a usual source of care. Clinics also provide coordinated care for Medicaid patients without assigned primary care, and have committed to engaging in continuous quality improvement. Clinics include an academic general internal medicine practice, an FQHC specializing in addiction and care for the homeless, and an FQHC that serves a low‐income rural population. | Estimated 8 primary care visits/yr at $205/visit (FQHC reimbursement rate) equates to $1640/ patient/yr. |
| Timely posthospital specialty care related to index admission diagnoses is coordinated through OHSU's outpatient specialty clinics. | ||
| Monthly care coordination meetings | We convene a diverse team of community clinic champions, OHSU inpatient and outpatient pharmacy and nurse representatives, hospital administrative support, and a CareOregon representive. | |
| At each meeting, we review individual patient cases, seek feedback from diverse, and previously siloed, team members, and engage in ongoing quality improvement. | ||
Needs Assessment
We conducted a mixed‐methods needs assessment of consecutive nonelderly adult inpatients (65 years old) admitted to general medicine and cardiology, between July and October 2009, with no insurance, Medicaid, or MedicareMedicaid. Five volunteer medical and pre‐medical students surveyed 116 patients (see Supporting Information survey, Appendix 2, in the online version of this article). Forty patients reported prior admission within the last 6 months. With these participants, we conducted in‐depth semi‐structured interviews assessing self‐perceived transitional care barriers. Investigators drew preliminary themes from the interviews but delayed a scientifically rigorous qualitative analysis, given a compressed timeline in which to meet program development needs. Of the 116 patients surveyed, 22 had MedicareMedicaid. Given that many of these patients discharged to skilled nursing facilities, we focused program development using data from the 94 uninsured and Medicaid patients (Table 3).
| Uninsured (n = 43 patients) | Medicaid (n = 51 patients) | |
|---|---|---|
| ||
| Lack usual source of care (%) | 33.3 | 11.1* |
| Self‐reported 6 mo rehospitalization (%) | 60.0 | 48.6 |
| Average no. Rx prior to hospitalization | 4.4 | 13.8 |
| Barriers to taking meds as prescribed (%) | 42.9 | 21.6* |
| Cost of meds as leading barrier (%) | 30.0 | 2.9* |
| Marginal housing (%) | 40.5 | 32.4 |
| Low health literacy (%) | 41.5 | 41.7 |
| Transportation barrier (%) | 11.9 | 31.4* |
| Comorbid depression (%) | 54.8 | 45.9 |
| Income 30 K (%) | 79.5 | 96.8 |
Finding 1: Thirty‐three percent of uninsured and 11% of Medicaid patients lacked a usual source of care. This was highest among Portland‐area residents (45%). Program element: We forged relationships with 3 outpatient clinics and developed a contractual relationship whereby OHSU pays for medical homes for uninsured patients lacking usual care. Finding 2: Patients were unclear as to how to self‐manage care or who to contact with questions after hospitalization. Program element: Transitional care nurse provides intensive peridischarge education, performs home visits within 3 days of discharge, and serves as a point person for patients during the peridischarge period. Finding 3: Among uninsured patients, cost was the leading barrier to taking medications as prescribed and often led to self‐rationing of medications without provider input. Program element: We developed a low‐cost, value‐based formulary for uninsured patients that parallels partnering clinic formularies, $4 plans, and medication assistance programs. After 30 days of program‐funded medications, patients then get medications through these other sources. Inpatient pharmacists consult on all patients to reconcile medications, identify access and adherence gaps, provide patient education, and communicate across settings. Finding 4: Comorbid depression was common. Program element: We sought partnerships with clinics with integrated mental health services. Finding 5: Over half of patients live in 3 counties surrounding Portland. Program element: We restricted our intervention to patients residing in local counties and included postdischarge home visits in our model. Partnering clinics match patient geographic distribution. Finding 6: Self‐ reported 6‐month readmission (60%) rates exceeded rates estimated by hospital administrative data (18%), supporting qualitative findings that patients seek care at numerous hospitals. Program element: Given that utilization claims data are unavailable for the uninsured, we included phone follow‐up surveys to assess self‐reported utilization 30 days postdischarge. Finding 7: Using administrative data, we estimated that the hospital loses an average of $11,000 per readmission per patient in direct, unremunerated costs. Indirect costs (such as costs of hospital staff) and opportunity costs (of potential revenue from an insured patient occupying the bed) were excluded, thus presenting a conservative estimate of cost savings. Program element: We used local cost data to support the business case and emphasize potential value of an up‐front investment in transitional care.
Defining the Setting
We convened a series of 3 work group meetings with diverse internal and external stakeholders (Table 4) to further define an intervention in the context of local health system realities. Work groups shaped the program in several specific ways. First, community clinic leaders emphasized that limited specialty access is an important barrier when caring for recently hospitalized uninsured and Medicaid patients. They felt expanded postdischarge access to specialists would be important to increase their capacity for recently discharged patients. Thus, we streamlined patients' posthospital specialty access for conditions treated during hospitalization. Second, initially we considered linking with 1 clinic; however, health systems researchers and clinic providers cautioned us, suggesting that partnering with multiple clinics would make our work more broadly applicable. Finally, pharmacists and financial assistance staff revealed that financial assistance forms are often not completed during hospitalization because inpatients lack access to income documentation. This led us to incorporate help with financial paperwork into the postdischarge intervention.
| Clinical staff |
| Hospital medicine physician |
| General internal medicine physician |
| Hospital ward nurse staff |
| Pharmacy (inpatient, outpatient, medication assistance programs) |
| Care management/social work |
| Emergency medicine |
| Health system leadership |
| Hospital administrative leadership |
| Primary care clinic leadership |
| Safety‐net clinic leadership |
| Specialty clinic leadership |
| Hospital business development and strategic planning |
| CareOregon (Medicaid managed care) leadership |
| Other |
| Patients |
| Health systems researchers |
| Clinical informatics |
| Hospital financials (billing, financial screening, admitting) |
Pilot Testing
We conducted pilot testing over 4 weeks, incorporating a Plan‐Do‐Study‐Act approach. For example, our transitional care nurse initially used an intervention guide with a list of steps outlined; however, we quickly discovered that the multiple and varied needs of this patient populationincluding housing, transportation, and foodwere overwhelming and pulled the nurse in many directions. In consultation with our quality improvement experts, we reframed the intervention guide as a checklist to be completed for each patient.
Pilot testing also underscored the importance of monthly meetings to promote shared learning and create a forum for communication and problem solving across settings. During these meetings, patient case discussions inform continuous quality improvement and promote energy‐sustaining team‐building. Information is then disseminated to each clinic site and arm of the intervention through a designated champion from each group. We also planned to meet monthly with the hospital executive director to balance service and research needs, and engage in rapid‐cycle change throughout our 1‐year demonstration project.
Funding the Program
We talked to others with experience implementing nurse‐led transitional care interventions. Based on these discussions, we anticipated our nurse would be able to see 200 patients over the course of 1 year, and we developed our budget accordingly (Table 2). From our needs assessment, we knew 60% of patients reported at least 1 hospitalization in the 6 months prior. If we assumed that 60% (120) of the 200 patients randomized to our intervention would get readmitted, then a 20% reduction would lead to 24 avoided readmissions and translate into $264,000 in savings for the health system. Even though the hospital would not reap all of these savings, as patients get admitted to other area hospitals, hospital administration acknowledged the value of setting the stage for community‐wide solutions. Moreover, the benefit was felt to extend beyond financial savings to improved quality and institutional learning around transitional care.
PROGRAM EVALUATION
We are conducting a clustered, randomized controlled trial to evaluate C‐TraIn's impact on quality, access, and high‐cost utilization at 30 days after hospital discharge. Results are anticipated in mid‐2012. We chose to perform an analysis clustered by admitting team, because communication between the C‐TraIn nurse, physician team, and pharmacist consult services could introduce secular change effects that could impact the care received by other patients on a given team. There are 5 general medicine resident teams, 1 hospitalist service, and 1 cardiology service, and the physician personnel for each team changes from month to month. Because the cardiology and hospitalist services differ slightly from resident teams, we chose a randomized cross‐over design such that intervention and control teams are redesignated every 3 months. To enhance internal validity, study personnel who enroll patients and administer baseline and 30‐day surveys are blinded to intervention status. We are collecting data on prior utilization, usual source of care, outpatient access, insurance, patient activation,6 functional status,7, 8 self‐rated health,7 health literacy, care transitions education,9 alcohol and substance abuse, and social support.10 Our primary outcome will be self‐reported 30‐day hospital readmission and ED use. We will also evaluate administrative claims data to identify 30‐day OHSU readmission and ED utilization rates. We will assess whether improved access to medications, rates of outpatient follow‐up and time to follow‐up mediate any effect on primary outcomes. Secondary outcomes will include outpatient utilization, patient activation, self‐rated health, and functional status.
Given limited experience with transitional care programs in socioeconomically disadvantaged patients, we are measuring acceptability and feasibility by tracking rates of those declining the intervention, and through semi‐structured interviews at 30 days. We are monitoring fidelity to core elements of the program through chart and checklist reviews, and seeking provider feedback through in‐person meetings with key implementers. To ensure possibility of broader adoption beyond OHSU, we are developing a toolkit that defines core program elements and can be adapted for use in various settings.
DISCUSSION
Using a process of broad stakeholder engagement, exposure of financial incentives, and data‐driven understanding of institutional and population needs, we built consensus and gained institutional financial commitment for implementation of a multicomponent transitional care program for uninsured and Medicaid patients. Our experience is relevant to other hospital systems, and may have particular relevance to academic medical centers, whose tripartite mission of clinical care, research, and education make them a natural place for healthcare reform.11
Several key lessons from our experience may be widely applicable. First, key administrative allies helped us understand institutional priorities and identify key institutional change‐agents. Though initial attempts to gain support were met cautiously, persistent advocacy, development of a strong business case, and support from several administrative allies compelled further leadership support. Second, unlike traditional grant funding cycles, hospital budgets operate in real‐time rapid‐change cycles, necessitating rapid data collection, analysis, and program design. Such demands could potentially threaten the viability of the program itself, or result in premature diffusion of novel practices into disparate populations. Communication with administrative leadership about the value of sound research design within the context of faster‐paced institutional needs was important and allowed time for data‐driven program development and diffusion. Simultaneously, we recognized the need to move quickly, provide regular progress updates, and use existing institutional resources, such as volunteer students and business development office, when possible.
We found that cross‐site hospitalcommunity partnerships are an essential program element. Partnership occurs through a payment agreement and through active engagement in ongoing quality improvement, including clinic representation at monthly team meetings. Clinic partnerships have enabled multidisciplinary cross‐site communication and relationships that facilitate innovation across routinely siloed elements of the system, allowing the team to anticipate and respond to patient problems before they lead to readmissions or poor outcomes. Our experience matches findings from recent program evaluations that found that care coordination attempts are unsuccessful without strong cross‐site linkages.12 These linkages are especially challenging and needed for uninsured and Medicaid patients, given their traditional lack of access and the additional social and financial barriers that influence their care.13
Limitations of our study include: implementation at a single, academic medical center; secular changes (which we mitigate against using randomized trial design); and potential for low power, if readmission rates are lower than anticipated from needs assessment data. Additionally, the need for a willing and invested program champion to coordinate an often messy, complex intervention may limit generalizability.
While transitional care programs continue to proliferate in response to increasingly recognized gaps in a fragmented care system,14, 15 few interventions specifically address the needs of socioeconomically disadvantaged patients. The major study that did5 was conducted in Massachusetts, where many patients received care through a state Free Care program and robust local safety‐net. Others have largely been tested in integrated care settings,1 and target patients who are part of managed care programs.1, 4, 16
To our knowledge, there are no well‐described programs that include explicit purchasing of outpatient medical homes for uninsured patients who would not otherwise have access to care. Our experience shifts the paradigm of the role of hospitals in care for the uninsured and underinsured: instead of a reactive, uncoordinated role, we assert that the hospital's strategic up‐front allocation of resources has a sound business, quality, and ethical foundation. This is especially important, given a new era of payment reform and coordinated care organizations. There is an opportunity to both improve quality for the uninsured and Medicaid patients, control costs, and gain valuable experience that can inform transitional care improvements for broader patient populations. If our study is successful in reducing readmissions, there may be important implications as to how to redefine the hospital's role in outpatient access to care linkages, especially for uninsured and Medicaid patients.
Acknowledgements
The authors acknowledge Char Riley, Dawn Whitney, and Tara Harben of OHSU, as well as volunteer research assistants Amie Leaverton, Molly McClain, Emily Johnson, Travis Geraci, and Claudia Sells.
- ,,,.The care transitions intervention: results of a randomized controlled trial.Arch Intern Med.2006;166(17):1822–1828.
- ,,,,.Medicaid patients at high risk for frequent hospital admission: real‐time identification and remediable risks.J Urban Health.2009;86(2):230–241.
- ,,,,,.Transitional care of older adults hospitalized with heart failure: a randomized, controlled trial.J Am Geriatr Soc.2004;52(5):675–684.
- ,,,,.The effect of Evercare on hospital use.J Am Geriatr Soc.2003;51(10):1427–1434.
- ,,, et al.A reengineered hospital discharge program to decrease rehospitalization: a randomized trial.Ann Intern Med.2009;150(3):178–187.
- ,,,.Development of the patient activation measure (PAM): conceptualizing and measuring activation in patients and consumers.Health Serv Res.2004;39(4 pt 1):1005–1026.
- The EuroQol Group.EuroQol—a new facility for the measurement of health‐related quality of life.Health Policy.1990;16(3):199–208.
- ,,,,,.Trajectories of life‐space mobility after hospitalization.Ann Intern Med.2009;150(6):372–378.
- ,,.Assessing the quality of preparation for posthospital care from the patient's perspective: the care transitions measure.Med Care.2005;43(3):246–255.
- ,,,.Assessing social support: the social support questionnaire.J Pers Soc Psychol.1983;44(1):127–139.
- .Payment reform and the mission of academic medical centers.N Engl J Med.2010;363(19):1784–1786.
- ,,,.Effects of care coordination on hospitalization, quality of care, and health care expenditures among Medicare beneficiaries: 15 randomized trials.JAMA.2009;301(6):603–618.
- ,,,.Post‐discharge intervention in vulnerable, chronically ill patients.J Hosp Med.2012;7(2):124–130.
- ,,, et al.Discharge planning from hospital to home.Cochrane Database Syst Rev.2010(1):000313.
- .Preventing the rebound: improving care transition in hospital discharge processes.Aust Health Rev.2010;34(4):445–451.
- ,,, et al.Comprehensive discharge planning and home follow‐up of hospitalized elders: a randomized clinical trial.JAMA.1999;281(7):613–620.
Hospital readmissions are common and costly, and represent a significant burden to the healthcare system. The challenges of postdischarge medication uncertainty, lack of self‐management support, and lack of timely access to health professionals1 are compounded in uninsured and Medicaid individuals by limited access to medications and primary care, financial strain, insecure housing, and limited social support.2
Our hospital cares for a large number of uninsured and low‐income publicly insured patients. The Portland area safety‐net, which consists of a network of 14 federally qualified health centers and free clinics, has limited capacity for uncompensated care. Uninsured patientsand to a lesser degree, Medicaid patientshave difficulty establishing primary care. Prior to the implementation of our program, uninsured and Medicaid patients without a usual source of care were given a list of safety‐net clinics at discharge, but frequently could not access appointments or navigate the complex system. There were no well‐developed partnerships between hospital and outpatient clinics for uninsured or Medicaid patients. The hospital lacked a systematic approach to securing postdischarge follow‐up and peridischarge patient education, and uninsured patients were financially responsible for most medications upon discharge. The costs of uncompensated or undercompensated potentially preventable readmissions for these patients, along with the recognition of gaps in quality, ultimately provided the rationale for a medical center‐funded transitional care intervention for uninsured and low‐income publicly insured patients.
Several transitional care improvement programs have shown effectiveness in reducing hospital readmissions,1, 35 but most have been conducted in settings where patients have secure access to outpatient care, and none have focused specifically on uninsured or Medicaid patients. Moreover, the development of these programs requires time and capital. Transitional care programs that have published results, to date, have been funded through government or private foundation grants1, 35; however, broader implementation of transitional care innovations will require financial and intellectual engagement of healthcare institutions themselves.
This report describes development of the Care Transitions Innovation (C‐TraIn), a multicomponent transitional care intervention for uninsured and low‐income publicly insured adults at a large, urban academic medical center, Oregon Health & Science University (OHSU). Because institutional funding and engagement is critical to the sustainability and scalability of similar programs, we also describe our process for gaining institutional support. Our hypothesis is that C‐TraIn can reduce readmissions and emergency department (ED) use at 30 days after hospital discharge, compared with usual care.
METHODS
Engaging Institutional Leaders
Early and continued efforts to engage hospital administrators were integral to our ultimate success in gaining institutional funding and leadership support. Initially, we convened what we called a Health Systems Morbidity and Mortality conference, featuring an uninsured patient who told of his postdischarge experiences and costly, potentially preventable readmission. We invited a broad array of potential stakeholders, including representatives from hospital administration, hospital case managers and social workers, community safety‐net providers, inpatient and outpatient physicians, residents, and medical students. Our patient was previously admitted to OHSU and diagnosed with pneumonia, hypothyroidism, sleep apnea, and depression. At discharge, he was given a list of low‐cost clinics; however, he was unable to arrange follow‐up, could not afford prescriptions, and felt overwhelmed trying to navigate a complex system. Consequently, he received no outpatient healthcare and his illnesses progressed. Unable to stay awake as a long‐haul trucker, he lost his job and subsequently his housing, and was readmitted to the intensive care unit with severe hypercarbic respiratory failure, volume overload, and hypothyroidism. The $130,000 charge for his 19‐day rehospitalization was largely un‐recuperated by the hospital. The case was a stark example of the patient‐safety and financial costs of fragmented care, and the conference was a nidus for further institutional engagement and program development, the key steps of which are described in Table 1.
| Time | Key Step | How Step Was Achieved | Take Home Points |
|---|---|---|---|
| |||
| July 2008July 2009 | 1. Identified key stakeholders | Considered varied stakeholders impacted by transitional care gaps for uninsured and Medicaid patients | Casting a wide net early in the process promoted high level of engagement and allowed self‐identification of some stakeholders |
| 2. Framed problems and opportunities; exposed costs of existing system shortcomings | Educational conference (that we called a Health Systems M&M) fostered a blame‐free environment to explore varied perspectives | Individual patient story made policy issue more accessible to a wide range of stakeholders | |
| Discussion of exposed drivers and costs of misaligned incentives; highlighted inroads to developing a business case for change | |||
| Oct 2008June 2009 | 3. Identified administrative allies and leaders with high bridging capital | Follow‐up with administrator after Health System M&M allowed further identification of key administrative stakeholders | Administrator insight highlighted institutional priorities and strategic plans |
| Ongoing meetings over 9 moto advocate for change, explore support for program development | Key ally within administration facilitated conversation with executive leadership whose support was a critical for program success | ||
| July 2009June 2010 | 4. Framed processes locally with continued involvement from multiple stakeholders | Performed multicomponent needs assessment | Patient assessment included inpatients for ease of survey administration |
| Utilized efforts of student volunteers for low‐budget option | |||
| Existing administrative support aided patient tracking | |||
| Non‐integrated health system and lack of claims data for uninsured limited usefulness of administrative utilization data | |||
| 5. Performed cost analysis to further support the business and quality case | Used OHSU data from needs assessment patient sample to estimate potential costs and savings of saved readmissions and avoided ED visits | Business case highlighted existing costs to OHSU for uncompensated care; program presented a solution to realign incentives and better allocate existing hospital expenditures | |
| Qualitative patient interviews exposed opportunity for quality improvement | Highlighted pilot as an opportunity for institutional learning about transitional care improvements | ||
| 6. Use needs assessment to map intervention | Drew upon local and national health systems expertise through literature review and consultation with local and national program leaders | OHSU's Care Transitions Innovation (C‐TraIn) includes elements aimed at improving access, patient education, care coordination, and systems integration (Table 2) | |
| Matched patient needs to specific elements of program design | |||
Planning the Intervention
Findings from a patient needs assessment and community stakeholder meetingsdescribed belowdirectly informed a multicomponent intervention that includes linkages and payment for medical homes for uninsured patients who lack access to outpatient care, a transitional care nurse whose care bridges inpatient and outpatient settings, inpatient pharmacy consultation, and provision of 30 days of medications at hospital discharge for uninsured patients (Table 2).
| Program Element | Description | Resources per 200 Patients |
|---|---|---|
| ||
| Transitional care RN | Augments patient education and care coordination in the hospital until 30 days after discharge. Tasks include: | 1.0 FTE nurse salary* |
| developing a personal health record with inpatients | ||
| completing a home visit within 72 hr of discharge to focus on medication reconciliation and patient self‐management | ||
| low‐risk patients receive 3 calls and no home visit (see Supporting Information, Appendix 1, in the online version of this article) | ||
| 2 subsequent phone calls to provide additional coaching, identify unmet needs, and close the loop on incomplete financial paperwork | ||
| The nurse provides a warm handoff with clinic staff, assists in scheduling timely posthospital follow‐up, and assures timely transfer of DC summaries. She coordinates posthospital care management with Medicaid case‐workers when available. | ||
| Pharmacy | Consultation: Inpatient pharmacists reconcile and simplify medication regimens, educate patients, and assess adherence barriers. | 0.4 FTE inpatient pharmacist salary |
| Prescription support: For uninsured patients, pharmacists guide MD prescribing towards medications available on the C‐TraIn value‐based formulary, a low‐cost formulary that reflects medications available through $4 plans, a Medicaid formulary, and FQHC on‐site pharmacies. | Estimated $12/prescription; 6.5 prescriptions/patient | |
| Uninsured patients are given 30 days of bridging prescription medications at hospital discharge free of charge. | ||
| Outpatient medical home and specialty care linkages | OHSU has partnered with outpatient clinics on a per‐patient basis to support funding of primary care for uninsured patients who lack a usual source of care. Clinics also provide coordinated care for Medicaid patients without assigned primary care, and have committed to engaging in continuous quality improvement. Clinics include an academic general internal medicine practice, an FQHC specializing in addiction and care for the homeless, and an FQHC that serves a low‐income rural population. | Estimated 8 primary care visits/yr at $205/visit (FQHC reimbursement rate) equates to $1640/ patient/yr. |
| Timely posthospital specialty care related to index admission diagnoses is coordinated through OHSU's outpatient specialty clinics. | ||
| Monthly care coordination meetings | We convene a diverse team of community clinic champions, OHSU inpatient and outpatient pharmacy and nurse representatives, hospital administrative support, and a CareOregon representive. | |
| At each meeting, we review individual patient cases, seek feedback from diverse, and previously siloed, team members, and engage in ongoing quality improvement. | ||
Needs Assessment
We conducted a mixed‐methods needs assessment of consecutive nonelderly adult inpatients (65 years old) admitted to general medicine and cardiology, between July and October 2009, with no insurance, Medicaid, or MedicareMedicaid. Five volunteer medical and pre‐medical students surveyed 116 patients (see Supporting Information survey, Appendix 2, in the online version of this article). Forty patients reported prior admission within the last 6 months. With these participants, we conducted in‐depth semi‐structured interviews assessing self‐perceived transitional care barriers. Investigators drew preliminary themes from the interviews but delayed a scientifically rigorous qualitative analysis, given a compressed timeline in which to meet program development needs. Of the 116 patients surveyed, 22 had MedicareMedicaid. Given that many of these patients discharged to skilled nursing facilities, we focused program development using data from the 94 uninsured and Medicaid patients (Table 3).
| Uninsured (n = 43 patients) | Medicaid (n = 51 patients) | |
|---|---|---|
| ||
| Lack usual source of care (%) | 33.3 | 11.1* |
| Self‐reported 6 mo rehospitalization (%) | 60.0 | 48.6 |
| Average no. Rx prior to hospitalization | 4.4 | 13.8 |
| Barriers to taking meds as prescribed (%) | 42.9 | 21.6* |
| Cost of meds as leading barrier (%) | 30.0 | 2.9* |
| Marginal housing (%) | 40.5 | 32.4 |
| Low health literacy (%) | 41.5 | 41.7 |
| Transportation barrier (%) | 11.9 | 31.4* |
| Comorbid depression (%) | 54.8 | 45.9 |
| Income 30 K (%) | 79.5 | 96.8 |
Finding 1: Thirty‐three percent of uninsured and 11% of Medicaid patients lacked a usual source of care. This was highest among Portland‐area residents (45%). Program element: We forged relationships with 3 outpatient clinics and developed a contractual relationship whereby OHSU pays for medical homes for uninsured patients lacking usual care. Finding 2: Patients were unclear as to how to self‐manage care or who to contact with questions after hospitalization. Program element: Transitional care nurse provides intensive peridischarge education, performs home visits within 3 days of discharge, and serves as a point person for patients during the peridischarge period. Finding 3: Among uninsured patients, cost was the leading barrier to taking medications as prescribed and often led to self‐rationing of medications without provider input. Program element: We developed a low‐cost, value‐based formulary for uninsured patients that parallels partnering clinic formularies, $4 plans, and medication assistance programs. After 30 days of program‐funded medications, patients then get medications through these other sources. Inpatient pharmacists consult on all patients to reconcile medications, identify access and adherence gaps, provide patient education, and communicate across settings. Finding 4: Comorbid depression was common. Program element: We sought partnerships with clinics with integrated mental health services. Finding 5: Over half of patients live in 3 counties surrounding Portland. Program element: We restricted our intervention to patients residing in local counties and included postdischarge home visits in our model. Partnering clinics match patient geographic distribution. Finding 6: Self‐ reported 6‐month readmission (60%) rates exceeded rates estimated by hospital administrative data (18%), supporting qualitative findings that patients seek care at numerous hospitals. Program element: Given that utilization claims data are unavailable for the uninsured, we included phone follow‐up surveys to assess self‐reported utilization 30 days postdischarge. Finding 7: Using administrative data, we estimated that the hospital loses an average of $11,000 per readmission per patient in direct, unremunerated costs. Indirect costs (such as costs of hospital staff) and opportunity costs (of potential revenue from an insured patient occupying the bed) were excluded, thus presenting a conservative estimate of cost savings. Program element: We used local cost data to support the business case and emphasize potential value of an up‐front investment in transitional care.
Defining the Setting
We convened a series of 3 work group meetings with diverse internal and external stakeholders (Table 4) to further define an intervention in the context of local health system realities. Work groups shaped the program in several specific ways. First, community clinic leaders emphasized that limited specialty access is an important barrier when caring for recently hospitalized uninsured and Medicaid patients. They felt expanded postdischarge access to specialists would be important to increase their capacity for recently discharged patients. Thus, we streamlined patients' posthospital specialty access for conditions treated during hospitalization. Second, initially we considered linking with 1 clinic; however, health systems researchers and clinic providers cautioned us, suggesting that partnering with multiple clinics would make our work more broadly applicable. Finally, pharmacists and financial assistance staff revealed that financial assistance forms are often not completed during hospitalization because inpatients lack access to income documentation. This led us to incorporate help with financial paperwork into the postdischarge intervention.
| Clinical staff |
| Hospital medicine physician |
| General internal medicine physician |
| Hospital ward nurse staff |
| Pharmacy (inpatient, outpatient, medication assistance programs) |
| Care management/social work |
| Emergency medicine |
| Health system leadership |
| Hospital administrative leadership |
| Primary care clinic leadership |
| Safety‐net clinic leadership |
| Specialty clinic leadership |
| Hospital business development and strategic planning |
| CareOregon (Medicaid managed care) leadership |
| Other |
| Patients |
| Health systems researchers |
| Clinical informatics |
| Hospital financials (billing, financial screening, admitting) |
Pilot Testing
We conducted pilot testing over 4 weeks, incorporating a Plan‐Do‐Study‐Act approach. For example, our transitional care nurse initially used an intervention guide with a list of steps outlined; however, we quickly discovered that the multiple and varied needs of this patient populationincluding housing, transportation, and foodwere overwhelming and pulled the nurse in many directions. In consultation with our quality improvement experts, we reframed the intervention guide as a checklist to be completed for each patient.
Pilot testing also underscored the importance of monthly meetings to promote shared learning and create a forum for communication and problem solving across settings. During these meetings, patient case discussions inform continuous quality improvement and promote energy‐sustaining team‐building. Information is then disseminated to each clinic site and arm of the intervention through a designated champion from each group. We also planned to meet monthly with the hospital executive director to balance service and research needs, and engage in rapid‐cycle change throughout our 1‐year demonstration project.
Funding the Program
We talked to others with experience implementing nurse‐led transitional care interventions. Based on these discussions, we anticipated our nurse would be able to see 200 patients over the course of 1 year, and we developed our budget accordingly (Table 2). From our needs assessment, we knew 60% of patients reported at least 1 hospitalization in the 6 months prior. If we assumed that 60% (120) of the 200 patients randomized to our intervention would get readmitted, then a 20% reduction would lead to 24 avoided readmissions and translate into $264,000 in savings for the health system. Even though the hospital would not reap all of these savings, as patients get admitted to other area hospitals, hospital administration acknowledged the value of setting the stage for community‐wide solutions. Moreover, the benefit was felt to extend beyond financial savings to improved quality and institutional learning around transitional care.
PROGRAM EVALUATION
We are conducting a clustered, randomized controlled trial to evaluate C‐TraIn's impact on quality, access, and high‐cost utilization at 30 days after hospital discharge. Results are anticipated in mid‐2012. We chose to perform an analysis clustered by admitting team, because communication between the C‐TraIn nurse, physician team, and pharmacist consult services could introduce secular change effects that could impact the care received by other patients on a given team. There are 5 general medicine resident teams, 1 hospitalist service, and 1 cardiology service, and the physician personnel for each team changes from month to month. Because the cardiology and hospitalist services differ slightly from resident teams, we chose a randomized cross‐over design such that intervention and control teams are redesignated every 3 months. To enhance internal validity, study personnel who enroll patients and administer baseline and 30‐day surveys are blinded to intervention status. We are collecting data on prior utilization, usual source of care, outpatient access, insurance, patient activation,6 functional status,7, 8 self‐rated health,7 health literacy, care transitions education,9 alcohol and substance abuse, and social support.10 Our primary outcome will be self‐reported 30‐day hospital readmission and ED use. We will also evaluate administrative claims data to identify 30‐day OHSU readmission and ED utilization rates. We will assess whether improved access to medications, rates of outpatient follow‐up and time to follow‐up mediate any effect on primary outcomes. Secondary outcomes will include outpatient utilization, patient activation, self‐rated health, and functional status.
Given limited experience with transitional care programs in socioeconomically disadvantaged patients, we are measuring acceptability and feasibility by tracking rates of those declining the intervention, and through semi‐structured interviews at 30 days. We are monitoring fidelity to core elements of the program through chart and checklist reviews, and seeking provider feedback through in‐person meetings with key implementers. To ensure possibility of broader adoption beyond OHSU, we are developing a toolkit that defines core program elements and can be adapted for use in various settings.
DISCUSSION
Using a process of broad stakeholder engagement, exposure of financial incentives, and data‐driven understanding of institutional and population needs, we built consensus and gained institutional financial commitment for implementation of a multicomponent transitional care program for uninsured and Medicaid patients. Our experience is relevant to other hospital systems, and may have particular relevance to academic medical centers, whose tripartite mission of clinical care, research, and education make them a natural place for healthcare reform.11
Several key lessons from our experience may be widely applicable. First, key administrative allies helped us understand institutional priorities and identify key institutional change‐agents. Though initial attempts to gain support were met cautiously, persistent advocacy, development of a strong business case, and support from several administrative allies compelled further leadership support. Second, unlike traditional grant funding cycles, hospital budgets operate in real‐time rapid‐change cycles, necessitating rapid data collection, analysis, and program design. Such demands could potentially threaten the viability of the program itself, or result in premature diffusion of novel practices into disparate populations. Communication with administrative leadership about the value of sound research design within the context of faster‐paced institutional needs was important and allowed time for data‐driven program development and diffusion. Simultaneously, we recognized the need to move quickly, provide regular progress updates, and use existing institutional resources, such as volunteer students and business development office, when possible.
We found that cross‐site hospitalcommunity partnerships are an essential program element. Partnership occurs through a payment agreement and through active engagement in ongoing quality improvement, including clinic representation at monthly team meetings. Clinic partnerships have enabled multidisciplinary cross‐site communication and relationships that facilitate innovation across routinely siloed elements of the system, allowing the team to anticipate and respond to patient problems before they lead to readmissions or poor outcomes. Our experience matches findings from recent program evaluations that found that care coordination attempts are unsuccessful without strong cross‐site linkages.12 These linkages are especially challenging and needed for uninsured and Medicaid patients, given their traditional lack of access and the additional social and financial barriers that influence their care.13
Limitations of our study include: implementation at a single, academic medical center; secular changes (which we mitigate against using randomized trial design); and potential for low power, if readmission rates are lower than anticipated from needs assessment data. Additionally, the need for a willing and invested program champion to coordinate an often messy, complex intervention may limit generalizability.
While transitional care programs continue to proliferate in response to increasingly recognized gaps in a fragmented care system,14, 15 few interventions specifically address the needs of socioeconomically disadvantaged patients. The major study that did5 was conducted in Massachusetts, where many patients received care through a state Free Care program and robust local safety‐net. Others have largely been tested in integrated care settings,1 and target patients who are part of managed care programs.1, 4, 16
To our knowledge, there are no well‐described programs that include explicit purchasing of outpatient medical homes for uninsured patients who would not otherwise have access to care. Our experience shifts the paradigm of the role of hospitals in care for the uninsured and underinsured: instead of a reactive, uncoordinated role, we assert that the hospital's strategic up‐front allocation of resources has a sound business, quality, and ethical foundation. This is especially important, given a new era of payment reform and coordinated care organizations. There is an opportunity to both improve quality for the uninsured and Medicaid patients, control costs, and gain valuable experience that can inform transitional care improvements for broader patient populations. If our study is successful in reducing readmissions, there may be important implications as to how to redefine the hospital's role in outpatient access to care linkages, especially for uninsured and Medicaid patients.
Acknowledgements
The authors acknowledge Char Riley, Dawn Whitney, and Tara Harben of OHSU, as well as volunteer research assistants Amie Leaverton, Molly McClain, Emily Johnson, Travis Geraci, and Claudia Sells.
- ,,,.The care transitions intervention: results of a randomized controlled trial.Arch Intern Med.2006;166(17):1822–1828.
- ,,,,.Medicaid patients at high risk for frequent hospital admission: real‐time identification and remediable risks.J Urban Health.2009;86(2):230–241.
- ,,,,,.Transitional care of older adults hospitalized with heart failure: a randomized, controlled trial.J Am Geriatr Soc.2004;52(5):675–684.
- ,,,,.The effect of Evercare on hospital use.J Am Geriatr Soc.2003;51(10):1427–1434.
- ,,, et al.A reengineered hospital discharge program to decrease rehospitalization: a randomized trial.Ann Intern Med.2009;150(3):178–187.
- ,,,.Development of the patient activation measure (PAM): conceptualizing and measuring activation in patients and consumers.Health Serv Res.2004;39(4 pt 1):1005–1026.
- The EuroQol Group.EuroQol—a new facility for the measurement of health‐related quality of life.Health Policy.1990;16(3):199–208.
- ,,,,,.Trajectories of life‐space mobility after hospitalization.Ann Intern Med.2009;150(6):372–378.
- ,,.Assessing the quality of preparation for posthospital care from the patient's perspective: the care transitions measure.Med Care.2005;43(3):246–255.
- ,,,.Assessing social support: the social support questionnaire.J Pers Soc Psychol.1983;44(1):127–139.
- .Payment reform and the mission of academic medical centers.N Engl J Med.2010;363(19):1784–1786.
- ,,,.Effects of care coordination on hospitalization, quality of care, and health care expenditures among Medicare beneficiaries: 15 randomized trials.JAMA.2009;301(6):603–618.
- ,,,.Post‐discharge intervention in vulnerable, chronically ill patients.J Hosp Med.2012;7(2):124–130.
- ,,, et al.Discharge planning from hospital to home.Cochrane Database Syst Rev.2010(1):000313.
- .Preventing the rebound: improving care transition in hospital discharge processes.Aust Health Rev.2010;34(4):445–451.
- ,,, et al.Comprehensive discharge planning and home follow‐up of hospitalized elders: a randomized clinical trial.JAMA.1999;281(7):613–620.
FDA Announces Nationwide Recall of Three Cytarabine Lots
Three lots of the antineoplastic drug cytarabine have been recalled because they may not be sterile, according to a posting on the Food and Drug Administration’s MedWatch site.
The nationwide recall applies to lots of cytarabine for injection (1 gm/vial), manufactured by Bedford Laboratories. The risk for lack of sterility was determined from an investigation of the manufacturing area, after the product was released, according to the FDA.
The affected lot numbers are: 2066986, 2111675, and 2131148. Any hospital, physician, clinic, or other health care facility that has any of the affected products should not use it for patients and "should immediately quarantine any product for return," the statement said. Wholesalers, distributors, or retailers that have the recalled product should stop using it and contact the company at 800-562-4797. Click here to report the product to the FDA Medwatch program.
Bedford is one of several generic manufacturers of cytarabine.
Cytarabine is approved for use in combination with other approved cancer treatments for inducing remission of acute nonlymphocytic leukemia in children and adults, and has also been found to be useful in treating acute lymphocytic leukemia and the blast phase of chronic myelocytic leukemia. It is also indicated in the prophylaxis and treatment of meningeal leukemia, administered intrathecally for this indication.
To view the notice, visit the MedWatch site.
Duodenal Switch May Excel at Type 2 Diabetes Resolution
MADISON, WIS. – Total complication rates are high but comparable over the long term between duodenal switch surgery and Roux-en-Y gastric bypass, according to a propensity matched analysis of 309 superobese patients.
"Duodenal switch is a valid alternative to the Roux-en-Y gastric bypass, especially if significant comorbid illnesses are present, particularly diabetes," Dr. Robert B. Dorman said.

His conclusion is drawn from a study that focused on the long-term outcomes of 178 consecutive patients who underwent duodenal switch (DS) surgery and 139 propensity matched patients undergoing Roux-en-Y gastric bypass (RYGB). In addition to a chart review, the University of Minnesota Bariatric Surgery Outcomes Survey tool was used to prospectively track patients’ weight, comorbid illnesses, adverse outcomes, readmissions, and general health status. Mean follow-up was 3.7 years in the DS group and 6.2 years in the RYGB group.
There were five deaths in the DS group (postop day 38 and months 5, 7, 16, and 66) and three deaths in the RYGB group (postop months 3, 7, and 72), leaving 173 patients and 136 patients, respectively, in the analysis, Dr. Dorman said at the annual meeting of the Central Surgical Association.
Notably, weight loss in the two groups was comparable, decreasing from an average body mass index of 52 kg/m2 to 31 kg/m2 in the DS group and from 51 kg/m2 to 34 kg/m2 in the RYGB group, said Dr. Dorman, a general surgery resident at the University of Minnesota, Minneapolis.
Resolution of type 2 diabetes, hypertension, and hyperlipidemia was greatest among DS patients at 82%, 67%, and 81%, respectively, compared with 64%, 39%, and 55%, respectively, among RYGB patients.
DS patients, however, experienced significantly more loose stools, bloating, and heartburn than did RYGB patients, who had significantly more constipation. Nausea and emesis were comparable between the two groups.
With regard to complications, DS patients were significantly more likely to visit the emergency department (ED) than were RYGB patients (40% vs. 25%; P value less than .01) and to experience hair loss (67% vs. 41%; P less than .01), Dr. Dorman said.
There was also a nonsignificant trend for DS patients to be readmitted more often than RYGB patients (25.4% vs. 23.5%) and to have more gastrointestinal leaks (1.7% vs. 0%), abdominal reoperations (29% vs. 23%), total parenteral nutrition/tube feeds (7.6% vs. 3%), and infusion therapy (28.5% vs. 23.5%). The RYGB patients, however, underwent more endoscopy (22% vs. 14%).
Dr. Dorman said providers should explain to patients the adverse symptoms they can expect following duodenal switch, but noted that the investigators "still feel DS should be limited to surgeons and centers with experience."
Invited discussant Dr. James Wallace, a bariatric and general surgeon from the Medical College of Wisconsin, Milwaukee, described the 40% rate of ED visits in the DS group as "extreme," and questioned the use of nutritional, vitamin, and protein supplementation – particularly in light of the observed hair loss.
"I commend the authors for their excellent surgical outcomes with the duodenal switch – much better than others have reported in the literature – but I’m unconvinced that the incremental improvement in weight loss and resolution of metabolic derangements justifies the increased nutritional risk of the duodenal switch," he said.

Dr. Dorman responded that the ED visits may represent a "knee-jerk reflex" on the part of DS patients when they experience a complication. He added that the university has instituted more frequent checks and phone calls, particularly to high-risk DS patients, and has partnered with their transplant clinic’s infusion center to provide IV fluids. Nutritional support data in this study was insufficient to report on for all patients, but supplementary nutrition is implemented based on factors such as vitamin and albumin levels or difficulty with eating, according to Dr. Dorman.
Invited discussant Dr. Bradley Needleman, director of the bariatric surgery program at Ohio State University in Columbus, said he was most fascinated by the lack of a significant difference in weight loss between the two groups and asked how this finding would influence patient consultations.
Dr. Dorman said a recent case-matched study at their institution also found no significant difference in weight loss between the two procedures (Ann. Surg. 2012;255:287-93), although a recent prospective randomized European study reported that weight loss was significantly greater with duodenal switch surgery than with gastric bypass (Ann. Intern. Med. 2011;155:281-91).
"It seems to be a finding that exists only within our institution and that should be taken into account when we discuss with our own patients which operations they should undergo," Dr. Dorman said. "I think that duodenal switch in a patient with diabetes and BMI over 45-50 [kg/m2] is certainly a valid operation at an experienced center, as long as we understand the symptoms they may experience afterward."
Duodenal switch should remain a valid alternative because RYGB has its own inherent downfalls – notably, high marginal ulcer and stricture rates, as indicated in the current study by the trend toward significantly greater use of endoscopic procedures in the RYGB patients, said Dr. Sayeed Ikramuddin. Also, the group has now twice shown in matched patient populations the superiority by which the duodenal switch provides resolution of type 2 diabetes when compared with RYGB, added Dr. Ikramuddin, senior author and director of gastrointestinal surgery at the University of Minnesota.
"Lastly, the Roux-en-Y gastric bypass has a high long-term failure rate resulting in patients regaining their weight," Dr. Ikramuddin said in an interview. "This is a phenomenon not as common among duodenal switch patients, likely due to the more malabsorptive nature of the operation."
When asked what contraindications exist for duodenal switch surgery, Dr. Dorman replied that the only absolute contraindications are women of reproductive age because of concerns of nutritional malabsorption and patients unwilling to commit to follow-up. A patient with significant gastroesophageal reflux disease would most likely be offered RYGB, he said, noting that DS surgery had been performed on 5%-10% of their last 100 GI patients.
Dr. Dorman reported no relevant conflicts of interest.
MADISON, WIS. – Total complication rates are high but comparable over the long term between duodenal switch surgery and Roux-en-Y gastric bypass, according to a propensity matched analysis of 309 superobese patients.
"Duodenal switch is a valid alternative to the Roux-en-Y gastric bypass, especially if significant comorbid illnesses are present, particularly diabetes," Dr. Robert B. Dorman said.
His conclusion is drawn from a study that focused on the long-term outcomes of 178 consecutive patients who underwent duodenal switch (DS) surgery and 139 propensity matched patients undergoing Roux-en-Y gastric bypass (RYGB). In addition to a chart review, the University of Minnesota Bariatric Surgery Outcomes Survey tool was used to prospectively track patients’ weight, comorbid illnesses, adverse outcomes, readmissions, and general health status. Mean follow-up was 3.7 years in the DS group and 6.2 years in the RYGB group.
There were five deaths in the DS group (postop day 38 and months 5, 7, 16, and 66) and three deaths in the RYGB group (postop months 3, 7, and 72), leaving 173 patients and 136 patients, respectively, in the analysis, Dr. Dorman said at the annual meeting of the Central Surgical Association.
Notably, weight loss in the two groups was comparable, decreasing from an average body mass index of 52 kg/m2 to 31 kg/m2 in the DS group and from 51 kg/m2 to 34 kg/m2 in the RYGB group, said Dr. Dorman, a general surgery resident at the University of Minnesota, Minneapolis.
Resolution of type 2 diabetes, hypertension, and hyperlipidemia was greatest among DS patients at 82%, 67%, and 81%, respectively, compared with 64%, 39%, and 55%, respectively, among RYGB patients.
DS patients, however, experienced significantly more loose stools, bloating, and heartburn than did RYGB patients, who had significantly more constipation. Nausea and emesis were comparable between the two groups.
With regard to complications, DS patients were significantly more likely to visit the emergency department (ED) than were RYGB patients (40% vs. 25%; P value less than .01) and to experience hair loss (67% vs. 41%; P less than .01), Dr. Dorman said.
There was also a nonsignificant trend for DS patients to be readmitted more often than RYGB patients (25.4% vs. 23.5%) and to have more gastrointestinal leaks (1.7% vs. 0%), abdominal reoperations (29% vs. 23%), total parenteral nutrition/tube feeds (7.6% vs. 3%), and infusion therapy (28.5% vs. 23.5%). The RYGB patients, however, underwent more endoscopy (22% vs. 14%).
Dr. Dorman said providers should explain to patients the adverse symptoms they can expect following duodenal switch, but noted that the investigators "still feel DS should be limited to surgeons and centers with experience."
Invited discussant Dr. James Wallace, a bariatric and general surgeon from the Medical College of Wisconsin, Milwaukee, described the 40% rate of ED visits in the DS group as "extreme," and questioned the use of nutritional, vitamin, and protein supplementation – particularly in light of the observed hair loss.
"I commend the authors for their excellent surgical outcomes with the duodenal switch – much better than others have reported in the literature – but I’m unconvinced that the incremental improvement in weight loss and resolution of metabolic derangements justifies the increased nutritional risk of the duodenal switch," he said.
Dr. Dorman responded that the ED visits may represent a "knee-jerk reflex" on the part of DS patients when they experience a complication. He added that the university has instituted more frequent checks and phone calls, particularly to high-risk DS patients, and has partnered with their transplant clinic’s infusion center to provide IV fluids. Nutritional support data in this study was insufficient to report on for all patients, but supplementary nutrition is implemented based on factors such as vitamin and albumin levels or difficulty with eating, according to Dr. Dorman.
Invited discussant Dr. Bradley Needleman, director of the bariatric surgery program at Ohio State University in Columbus, said he was most fascinated by the lack of a significant difference in weight loss between the two groups and asked how this finding would influence patient consultations.
Dr. Dorman said a recent case-matched study at their institution also found no significant difference in weight loss between the two procedures (Ann. Surg. 2012;255:287-93), although a recent prospective randomized European study reported that weight loss was significantly greater with duodenal switch surgery than with gastric bypass (Ann. Intern. Med. 2011;155:281-91).
"It seems to be a finding that exists only within our institution and that should be taken into account when we discuss with our own patients which operations they should undergo," Dr. Dorman said. "I think that duodenal switch in a patient with diabetes and BMI over 45-50 [kg/m2] is certainly a valid operation at an experienced center, as long as we understand the symptoms they may experience afterward."
Duodenal switch should remain a valid alternative because RYGB has its own inherent downfalls – notably, high marginal ulcer and stricture rates, as indicated in the current study by the trend toward significantly greater use of endoscopic procedures in the RYGB patients, said Dr. Sayeed Ikramuddin. Also, the group has now twice shown in matched patient populations the superiority by which the duodenal switch provides resolution of type 2 diabetes when compared with RYGB, added Dr. Ikramuddin, senior author and director of gastrointestinal surgery at the University of Minnesota.
"Lastly, the Roux-en-Y gastric bypass has a high long-term failure rate resulting in patients regaining their weight," Dr. Ikramuddin said in an interview. "This is a phenomenon not as common among duodenal switch patients, likely due to the more malabsorptive nature of the operation."
When asked what contraindications exist for duodenal switch surgery, Dr. Dorman replied that the only absolute contraindications are women of reproductive age because of concerns of nutritional malabsorption and patients unwilling to commit to follow-up. A patient with significant gastroesophageal reflux disease would most likely be offered RYGB, he said, noting that DS surgery had been performed on 5%-10% of their last 100 GI patients.
Dr. Dorman reported no relevant conflicts of interest.
FROM THE ANNUAL MEETING OF THE CENTRAL SURGICAL ASSOCIATION
Major Finding: Resolution of type 2 diabetes, hypertension, and hyperlipidemia was greatest among duodenal switch patients, at 82%, 67%, and 81%, vs. 64%, 39%, and 55% among Roux-en-Y gastric bypass patients.
Data Source: Data were taken from a chart review and prospective survey of 309 superobese patients.
Disclosures: Dr. Dorman reported no relevant conflicts of interest.
ONLINE EXCLUSIVE: How the School of Medicine at Stanford University Is Addressing Women Physicians and Leadership
Whenever Hannah Valantine, MD, needs reassurance that women leadership interventions at Stanford University’s School of Medicine are working, she looks at the numbers.
In the span of five to six years, the medical school increased the percentage of women at each faculty rank so that it now surpasses national averages as calculated by the Association of American Medical Colleges. Indeed, the percentage of women at the full professor rank jumped from 14.5 percent to 22 percent.
“We really are making progress,” says Dr. Valantine, full professor of medicine and the medical school’s senior associate dean for diversity and leadership.
With structural elements such as tenure clock extension, extended maternity and family leave, onsite childcare, early stage research funding support, and mentoring in place, Dr. Valantine is turning her attention to the next round of interventions, which focus more on psychological and social factors impairing women’s advancement.
She will use a National Institutes of Health grant to develop interventions for the phenomenon of stereotype threat, which is the fear that one's behavior will confirm an existing stereotype about one’s social group. This fear may lead to an impairment of performance.
Over the next six months, Dr. Valantine and her team will also conduct several pilot programs involving map career customization, a model that encourages people to chart their career over the next 5 to 10 to 20 years, taking into consideration their life outside of work. The intent is to help individuals identify their priorities and goals and how they change over time, and also help supervisors better match the ebbs and flows of a person’s life to the workplace and identify and develop aspiring leaders.
Stanford’s medical school is organized around teams of doctors that care for groups of patients. Each team must achieve excellence in four academic missions: clinical care, education, research, and administration. The map career customization pilot programs are aimed at helping doctors within the team plan their career path around these four missions and then putting the individual plans together in a team context in order to meet the team’s goals, says Dr. Valantine.
“This way the work and the four missions are entirely covered,” she says. “We create a vibrant academic environment where we create new things and have time to think and integrate our life and work… It’s a little countercultural, but I think people are crying out for that and I think it stands a great chance of making the culture change.”
Stanford’s burgeoning efforts in map career customization have intrigued SHM board member Janet Nagamine, RN, MD, FHM, a hospitalist at Kaiser Permanente Medical Center in Santa Clara, Calif., and Stanford alum.
She hopes to collaborate with Dr. Valantine and incorporate in hospital medicine the interventions that Stanford is doing while conducting studies and developing workforce planning initiatives specific to hospitalists. The goal is to create a hospital medicine model that replicates Stanford’s success in cultivating women physician leaders.
“We make this false assumption that your career is going to look the same throughout your life and that’s just not realistic,” Dr. Nagamine says.
CDI: The Scope of the Problem
Clostridium difficile is a gram‐positive, spore‐forming, toxin‐producing, anaerobic bacillus that was established as the causative pathogen of most cases of antibiotic‐associated colitis in 1978. 1, 2 The spectrum of possible clinical presentations of C. difficile range from asymptomatic colonization, uncomplicated diarrhea, severe pseudomembranous colitis, paralytic ileus, to sepsis and death, with a mortality rate upwards of 80% in fulminant cases requiring colectomy. 3
Vegetative C. difficile cells die rapidly on dry surfaces, but they have been found to remain viable for up to 6 hours on moist surfaces in room air. 4 Spores shed from the gastrointestinal (GI) tract, however, are highly resistant to common hospital disinfectants, and can survive in the environment for many months. 2 C. difficile spores are primarily transmitted from patient to patient on the hands or equipment of healthcare workers. 2 Once spores are ingested and reach the GI tract, they germinate in the vegetative form. 2, 5 In the GI tract, C. difficile causes disease by the production of toxins, primarily toxins A and B, both of which cause severe inflammation. 5 Toxin A attracts neutrophils and monocytes, and toxin B breaks down colonic epithelial cells. 5 Both of these mechanisms lead to colitis, formation of pseudomembranes, and watery diarrhea. 5
After alteration of the healthy colonic bacterial flora, the immune response to C. difficile toxins appears to play a major role in determining host susceptibility to C. difficile infection (CDI). 5, 6 Those with antitoxin immunity are more likely to become symptomless carriers than patients without preexisting immunity. 3 More than 60% of healthy adults have protective immunity against a primary CDI, demonstrated by detectable serum IgG and IgA to both toxins A and B, as a consequence of childhood immunity or frequent exposure to C. difficile in the environment. 3 After a primary episode of CDI, many patients acquire protective immunity against C. difficile toxins, seen as significantly higher serum concentrations of IgM against C. difficile toxin by the third day from onset of diarrhea, and significantly higher serum concentrations of IgG against toxin A by the 12th day. 7 Patients who experience recurrent CDI lack development of this protective immunity to C. difficile. 6, 7
CDI INCIDENCE IS ON THE RISE
During the past decade, rates of CDI have increased steadily to levels not previously seen. A report published by the Agency of Healthcare Research and Quality demonstrated that the number of CDI diagnoses on hospital discharge more than doubled in the United States from 139,000 to 301,200 between 2000 and 2005 (Figure 1). 8 Examination of a more recent Nationwide Inpatient Sample (NIS) indicates continuation of this trend, with nearly 350,000 CDI diagnoses recorded upon discharge from acute care hospitals in 2008. 9 Of note, in 2006 the state of Ohio mandated CDI reporting from both hospitals and nursing homes. It was estimated there were more than 18,000 cases of CDI during this year, of which more than 60% were diagnosed in nursing homes. 10 Based on the 2008 NIS data and the data from Ohio, it is conceivable there were as many as 1 million cases of CDI in the US in 2008.

8
This increased incidence of CDI contrasts with several other healthcare‐associated infections, which have declined in incidence over the last decade. 1113 C. difficile is the most common causative agent of healthcare‐associated infections in some areas. A cohort study of common infections among inpatients at 30 community hospitals in the Duke Infection Control Outreach Network conducted between January 1, 2008 and June 30, 2009 found the incidence of CDI cases was 0.26 cases per 1000 patient‐days, which was higher than the incidence of methicillin‐resistant Staphylococcus aureus (MRSA) at 0.22 cases per 1000 patient‐days. 14 Another study utilizing the NIS data found that, while vancomycin‐resistant enterococcus and pseudomonas infections remained stable, CDI increased in many areas of the country and was more common than MRSA in some areas. 15
HYPERVIRULENT STRAIN OF C. DIFFICILE
In the early 2000s, an epidemic and hypervirulent strain of C. difficile emerged in North America and Europe that altered the epidemiology of CDI. 16 Due to multiple different methods for molecular typing of C. difficile, this strain has several names depending on the method of typing performed. The most common names for this strain are BI (REA typing), NAP1 (pulsed field gel electrophoresis), and 027 (PCR‐ribotyping). This strain has become the predominant strain of C. difficile in some areas, accounting for more than 80% of CDI cases in some areas. 3
The characteristics of this particular strain epidemic in North America typically include:
-
A deletion in the tcd gene that downregulates toxin production, which renders the gene nonfunctional in the epidemic strain. Some in vitro data have demonstrated that this epidemic strain produces 16‐fold higher concentrations of toxin A and 23‐fold higher concentrations of toxin B than nonepidemic strains of C. difficile. 17
-
Production of a third toxin, called binary toxin CDT. The role of this toxin in the pathogenesis of CDI is not clear, but the presence of this toxin has been associated with more severe CDI‐related diarrhea. 2, 16
-
High‐level resistance to fluoroquinolones, including moxifloxacin and gatifloxacin. 5, 16 It has been theorized that increasing use of fluoroquinolones during the past decade may have provided a selective advantage for the BI/NAP1/027 strain to predominate. 2
-
Production of more spores than other strains of C. difficile. 17, 18 This may increase its ability to contaminate the environment and be transmitted in a healthcare facility.
CDI SEVERITY IS INCREASING
Paralleling the increased prevalence of CDI, C. difficile infections are generally becoming more severe. In Sherbrooke, Quebec, Canada, which experienced a dramatic outbreak of CDI associated with increased CDI severity, the cumulative 1‐year attributable mortality was nearly 37% (60 of 161 CDI cases) in a hospital case review of nonsurgical admissions between January 2003 and June 2004. 19 In St Louis, Missouri in 2003, a 5.7% 180‐day mortality rate was reported in an endemic setting. 20 Among the 24% of patients readmitted within 180 days of discharge (4207 of 17,492) in this retrospective case review, patients with CDI were more than twice as likely as non‐CDI patients to be readmitted to the hospital (52% vs 23%, N = 4207). 20 Furthermore, patients with CDI were significantly more likely to require discharge to a long‐term care facility (32%) than non‐CDI controls (23%). 19
Based on NIS data for CDI‐related hospitalizations between 2000 and 2005, the crude, age‐adjusted case‐fatality rate rose from 1.2% in 2000 to 2.2% in 2004. 21 This increase was mirrored by a doubling of CDI cases admitted for hospitalization during the same 6‐year period. 21 According to the investigators, these findings indirectly confirm that the doubling in CDI deaths is attributable to an increase in C. difficile virulence. 21 A 6‐month prospective surveillance of CDI patient outcomes in 29 Canadian hospitals was conducted by the Canadian Nosocomial Infection Surveillance Program (CNISP) beginning in November 2004. 22 At 30 days after onset of CDI, the percentage of deaths directly or indirectly attributable to CDI was 5.7%, which represented an almost 4‐fold increase over CDI‐attributable deaths recorded in the 1997 CNISP survey. 22 Overall 30‐day mortality was retrospectively analyzed among patients with CDI in a St Louis, Missouri 1200‐bed teaching hospital intensive care unit (ICU) over a 2‐year period (20042005). 23 The 30‐day crude mortality among 278 patients admitted to the ICU with CDI was 37% (n = 102), and mortality directly attributable to CDI in these critically ill patients was 6%. 23 The number of deaths in the United States due to CDI increased sharply from 793 patients in 1999 to 6225 patients in 2006. 24 In 2006, it ranked among the top 20 causes of death for those aged 65 years and older. 24
INCREASE IN TREATMENT FAILURES
In addition to being more severe, there have been several reports of increases in CDI treatment failures and/or increases in recurrent CDI. 6 Recent studies indicate there may be more metronidazole treatment failures regardless of whether the infecting strain is the BI/NAP1/027 strain, despite a lack of laboratory evidence indicating resistance to metronidazole. 2529 Regardless of the initial therapy chosen, patients must be carefully monitored to ensure they are responding appropriately to treatment and their condition is not deteriorating. 29 Some of the original trials of CDI treatments found relapse rates as low as 5% to 15%. 30 More recent data indicate relapse occurs after 30% of initial CDI episodes, and as frequent as 65% if the patient has had multiple prior CDI episodes. 3, 6, 31
COMMUNITY‐ASSOCIATED CDI
The epidemiology of community‐associated CDI may also be changing. Virulent strains, which cause more severe disease in high‐risk patients, may also cause more frequent, severe disease in populations previously thought to be at low risk. Some studies have found an increase in community‐associated CDI in otherwise healthy individuals with little or no exposure to a healthcare facility. Although antimicrobial exposure remains the most important risk factor for community‐associated CDI, antimicrobial exposure is less common in community‐associated CDI than healthcare‐associated CDI. 3235
In a Canadian study, the rate of diagnosed community‐acquired CDI cases was stable at about 22 cases per 100,000 patient‐years per calendar year between 1998 and 2002, but rose steadily for the next 2 years to 53 cases per 100,000 patient‐years in 2004. 33 Similar results were seen in the United Kingdom, with an exponential increase from fewer than 1 case per 100,000 person‐years in 1994 to 22 cases per 100,000 person‐years in 2004. 32 There are currently no comprehensive longitudinal studies in the United States investigating the incidence of purely community‐acquired CDI where a patient had no prior hospital exposure. However, regional surveys have reported an incidence of community‐acquired CDI of 12 cases per 100,000 person‐years during 1992 to 1994, 36 7.6 cases per 100,000 person‐years in 2005, 37 and 6.9 cases per 100,000 person‐years in 2006. 34, 37
One patient population generally thought to be at low risk for CDI that may be at increased risk for severe CDI is pregnant women. In one study 419 infectious disease consultants who responded to a survey conducted by the Emerging Infections Network had seen or were aware of 55 cases of CDI in peripartum women. 38 There were 21 cases with complications, including 10 relapses and 5 cases of toxic megacolon. 38 In a prior report of severe CDI among 10 peripartum women, 3 women died and 3 infants (2 were twins) were stillborn. 38 This data emphasizes why clinicians must have a high index of suspicion for CDI, and should be aware of the potential for severe outcomes, even in patients traditionally considered to be at low risk. 38
ECONOMIC IMPACT OF CDI
The economic burden of CDI in the United States is staggering, with estimates ranging from $1.1 to $3.2 billion annually (Table 1). 3941 These estimates are based on the cost of caring for patients with CDI in acute care facilities and are primarily driven by increased length of stay in the hospital due to CDI. These data also predate the emergence of the BI/NAP1/027 strain. Therefore, the costs of CDI are likely higher than these estimates due to the increases in CDI severity seen since these studies were performed. It is important to note that these studies did not include patients diagnosed and treated in nursing homes or the community, nor the increase in costs due to discharge to a long‐term care facility. 39
| Study | Patient Population | Estimated Attributable Cost per Episode* | Increase in LOS, days | Estimated Annual Attributable Cost, US |
|---|---|---|---|---|
| ||||
| Kyne et al 40 | Two medical wards (n = 40) | $3669 | 3.6 | $1.1 billion |
| Dubberke et al 39 | Nonsurgical patients∥ (n = 439) | $2454$3240 | 3.0 | $897 million$1.3 billion# |
| O'Brien et al 41 | Massachusetts discharge database (n = 3692)** | Primary diagnosis: $10,212; secondary diagnosis: $13,675 | Primary diagnosis: 6.4; secondary diagnosis: 2.9 | $3.2 billion |
SUMMARY
C. difficile infections are becoming more prevalent and more severe. The issue is sufficiently serious that healthcare‐onset CDI has recently been called a major public health threat. 42 For this reason, efforts to combat virulent C. difficile should include good antimicrobial stewardship, effective infection control, and control of environmental factors that promote transmission. 35 Healthcare professionals who oversee the care of inpatients should act as catalysts for improvement by taking a leadership role in the multidisciplinary approach needed to reduce the morbidity, mortality, and cost burden for patients and the healthcare system.
- . Narrative review: the new epidemic of Clostridium difficile‐associated enteric disease. Ann Intern Med. 2006;145(10): 758–764.
- Association for Professionals in Infection Control and Epidemiology, Inc (APIC). Guide to the elimination of Clostridium difficile in healthcare settings. Available at: http://www.apic.org/Content/NavigationMenu/PracticeGuidance/APICEliminationGuides/C.diff_Elimination_guide_logo.pdf. 2008. Accessed October 8, 2011.
- . Clostridium difficile and the disease it causes. Methods Mol Biol. 2010;646:9–35.
- , , . Vegetative Clostridium difficile survives in room air on moist surfaces and in gastric contents with reduced acidity: a potential mechanism to explain the association between proton pump inhibitors and C. difficile‐associated diarrhea?Antimicrob Agents Chemother. 2007;51(8): 2883–2887.
- , . Clostridium difficile‐associated disease: new challenges from an established pathogen. Cleve Clin J Med. 2006;73(2): 187–197.
- . A 76‐year‐old man with recurrent Clostridium difficile‐associated diarrhea: review of C difficile infection. JAMA. 2009;301(9): 954–962.
- , , , . Association between antibody response to toxin A and protection against recurrent Clostridium difficile diarrhoea. Lancet. 2001;357(9251): 189–193.
- , .Clostridium difficile‐associated disease in US hospitals, 1993–2005. Healthcare Cost and Utilization Project. Statistical Brief #50. April 2008. Available at: http://www.ncbi.nlm.nih.gov/books/NBK56038/pdf/sb50.pdf. Accessed December 12, 2011.
- Agency of Healthcare Research and Quality. Healthcare Cost and Utilization Project Database. Available at: http://www.hcup‐us.ahrq.gov/nisoverview.jsp. Accessed April 2011.
- , , , et al. Clostridium difficile infection in Ohio hospitals and nursing homes during 2006. Infect Control Hosp Epidemiol. 2009;30(6): 526–533.
- , , , et al. Trends in catheter‐associated urinary tract infections in adult intensive care units—United States, 1990–2007. Infect Control Hosp Epidemiol. 2011;32(8): 748–756.
- , , , et al. Methicillin‐resistant Staphylococcus aureus central line‐associated bloodstream infections in US intensive care units, 1997–2007. JAMA. 2009;301(7): 727–736.
- , , , et al. An intervention to decrease catheter‐related bloodstream infections in the ICU. N Engl J Med. 2006;355(26): 2725–2732.
- , , , .The impact of hospital‐onset healthcare facility associated (HO‐HCFA) Clostridium difficile infection (CDI) in community hospitals: surpassing methicillin‐resistant Staphylococcus aureus (MRSA) as the new superbug [abstract 386]. Presented at: The Fifth Decennial International Conference on Healthcare‐Associated Infections (ICHAI). March 20, 2010; Atlanta, GA.
- , , . Growth and geographic variation in hospitalizations with resistant infections, United States, 2000–2005. Emerg Infect Dis. 2008;14(11): 1756–1758.
- , , . An epidemic, toxin gene‐variant strain of Clostridium difficile. New Engl J Med. 2005;353(23): 2433–2441.
- , , , et al. Toxin production by an emerging strain of Clostridium difficile associated with outbreaks of severe disease in North America and Europe. Lancet. 2005;366(9491): 1079–1084.
- , , , et al. Increased sporulation rate of epidemic Clostridium difficile type 027/NAP1. J Clin Microbiol. 2008;46(4): 1530–1533.
- , , . Mortality attributable to nosocomial Clostridium difficile‐ associated disease during an epidemic caused by a hypervirulent strain in Quebec. Can Med Assoc J. 2005;173(9): 1037–1042.
- , , , et al. Attributable outcomes of endemic Clostridium difficile‐associated disease in nonsurgical patients. Emerg Infect Dis. 2008;14:1031–1038.
- , , . Increase in adult Clostridium difficile‐related hospitalizations and case‐fatality rate, United States, 2000–2005. Emerg Infect Dis. 2008;14(6): 929–931.
- , , , et al. Health care‐associated Clostridium difficile infection in adults admitted to acute care hospitals in Canada: a Canadian Nosocomial Infection Surveillance Program study. Clin Infect Dis. 2009:48(5);568–576.
- , , , et al. Analysis of 30‐day mortality for Clostridium difficile‐associated disease in the ICU setting. Cheat. 2007;132(2): 418–424.
- , , , et al. Deaths: final data for 2006. Natl Vital Stat Rep. 2009;57(14): 1–134.
- , , . Factors associated with failure of metronidazole in Clostridium difficile‐associated disease. J Clin Gastroenterol. 2004;38(5): 414–418.
- , , , et al. Relatively poor outcome after treatment of Clostridium difficile colitis with metronidazole. Clin Infect Dis. 2005;40(11): 1586–1590.
- , , , et al. Increasing risk of relapse after treatment of Clostridium difficile colitis in Quebec, Canada. Clin Infect Dis. 2005;40(11): 1591–1597.
- , , , et al. Outcome of metronidazole therapy for Clostridium difficile disease and correlation with a scoring system. J Infect. 2007;55(6): 495–501.
- Centers for Disease Control and Prevention. Information about the current strain of Clostridium difficile. Available at: http://www.cdc.gov/HAI/organisms/cdiff/Cdiff‐current‐strain.html. Last updated: January 25, 2011. Accessed October 9, 2011.
- , , , et al. Comparison of vancomycin, teicoplanin, metronidazole, and fusidic acid for the treatment of Clostridium difficile‐associated diarrhea. Clin Infect Dis. 1996;22(5): 813–818.
- , , . Breaking the cycle: treatment strategies for 163 cases of recurrent Clostridium difficile disease. Am J Gastroenterol. 2002;97(7): 1769–1775.
- , , , . Use of gastric acid‐suppressive agents and the risk of community‐acquired Clostridium difficile‐associated disease. JAMA. 2005;294(23): 2989–2995.
- , , , , . Patterns of antibiotic use and risk of hospital admission because of Clostridium difficile infection. Can Med Assoc J. 2008;179(8): 767–772.
- Centers for Disease Control and Prevention. Severe Clostridium difficile‐associated disease in populations previously at low risk—four states, 2005. MMWR. 2005;54(47): 1201–1205.
- . Clostridium difficile‐associated disease: an emerging threat to patient safety: insights from the Society of Infectious Diseases Pharmacists. Pharmacotherapy. 2006;26(3): 299–311.
- , , , et al. Antibiotics and Clostridium difficile in the ambulatory care setting. Clin Ther. 2000;22(1): 91–102.
- Centers for Disease Control and Prevention. Surveillance for community‐associated C. difficile—Connecticut, 2006. MMWR. 2008;57:340–343.
- , O', , et al. Clostridium difficile‐associated diarrhea: an emerging threat to pregnant women. Am J Obstet Gynecol. 2008;198(6):635.e1–635.e6.
- , , , et al. Short‐ and long‐term attributable costs of Clostridium difficile‐associated disease in nonsurgical inpatients. Clin Infect Dis. 2008;46(4): 497–504.
- , , , . Health care costs and mortality associated with nosocomial diarrhea due to Clostridium difficile. Clin Infect Dis. 2002;34(3): 346–353.
- , , , . The emerging infectious challenge of Clostridium difficile‐associated disease in Massachusetts hospitals: clinical and economic consequences. Infect Control Hosp Epidemiol. 2007;28(11): 1219–1227.
- , , , , . National Clostridium difficile infection (CDI) related hospitalizations approaches MRSA related hospitalizations. The need for antibiotic stewardship program [poster 94]. Presented at: The SHEA 2011 Annual Scientific Meeting. April 2, 2011; Dallas, TX.
Clostridium difficile is a gram‐positive, spore‐forming, toxin‐producing, anaerobic bacillus that was established as the causative pathogen of most cases of antibiotic‐associated colitis in 1978. 1, 2 The spectrum of possible clinical presentations of C. difficile range from asymptomatic colonization, uncomplicated diarrhea, severe pseudomembranous colitis, paralytic ileus, to sepsis and death, with a mortality rate upwards of 80% in fulminant cases requiring colectomy. 3
Vegetative C. difficile cells die rapidly on dry surfaces, but they have been found to remain viable for up to 6 hours on moist surfaces in room air. 4 Spores shed from the gastrointestinal (GI) tract, however, are highly resistant to common hospital disinfectants, and can survive in the environment for many months. 2 C. difficile spores are primarily transmitted from patient to patient on the hands or equipment of healthcare workers. 2 Once spores are ingested and reach the GI tract, they germinate in the vegetative form. 2, 5 In the GI tract, C. difficile causes disease by the production of toxins, primarily toxins A and B, both of which cause severe inflammation. 5 Toxin A attracts neutrophils and monocytes, and toxin B breaks down colonic epithelial cells. 5 Both of these mechanisms lead to colitis, formation of pseudomembranes, and watery diarrhea. 5
After alteration of the healthy colonic bacterial flora, the immune response to C. difficile toxins appears to play a major role in determining host susceptibility to C. difficile infection (CDI). 5, 6 Those with antitoxin immunity are more likely to become symptomless carriers than patients without preexisting immunity. 3 More than 60% of healthy adults have protective immunity against a primary CDI, demonstrated by detectable serum IgG and IgA to both toxins A and B, as a consequence of childhood immunity or frequent exposure to C. difficile in the environment. 3 After a primary episode of CDI, many patients acquire protective immunity against C. difficile toxins, seen as significantly higher serum concentrations of IgM against C. difficile toxin by the third day from onset of diarrhea, and significantly higher serum concentrations of IgG against toxin A by the 12th day. 7 Patients who experience recurrent CDI lack development of this protective immunity to C. difficile. 6, 7
CDI INCIDENCE IS ON THE RISE
During the past decade, rates of CDI have increased steadily to levels not previously seen. A report published by the Agency of Healthcare Research and Quality demonstrated that the number of CDI diagnoses on hospital discharge more than doubled in the United States from 139,000 to 301,200 between 2000 and 2005 (Figure 1). 8 Examination of a more recent Nationwide Inpatient Sample (NIS) indicates continuation of this trend, with nearly 350,000 CDI diagnoses recorded upon discharge from acute care hospitals in 2008. 9 Of note, in 2006 the state of Ohio mandated CDI reporting from both hospitals and nursing homes. It was estimated there were more than 18,000 cases of CDI during this year, of which more than 60% were diagnosed in nursing homes. 10 Based on the 2008 NIS data and the data from Ohio, it is conceivable there were as many as 1 million cases of CDI in the US in 2008.
8
This increased incidence of CDI contrasts with several other healthcare‐associated infections, which have declined in incidence over the last decade. 1113 C. difficile is the most common causative agent of healthcare‐associated infections in some areas. A cohort study of common infections among inpatients at 30 community hospitals in the Duke Infection Control Outreach Network conducted between January 1, 2008 and June 30, 2009 found the incidence of CDI cases was 0.26 cases per 1000 patient‐days, which was higher than the incidence of methicillin‐resistant Staphylococcus aureus (MRSA) at 0.22 cases per 1000 patient‐days. 14 Another study utilizing the NIS data found that, while vancomycin‐resistant enterococcus and pseudomonas infections remained stable, CDI increased in many areas of the country and was more common than MRSA in some areas. 15
HYPERVIRULENT STRAIN OF C. DIFFICILE
In the early 2000s, an epidemic and hypervirulent strain of C. difficile emerged in North America and Europe that altered the epidemiology of CDI. 16 Due to multiple different methods for molecular typing of C. difficile, this strain has several names depending on the method of typing performed. The most common names for this strain are BI (REA typing), NAP1 (pulsed field gel electrophoresis), and 027 (PCR‐ribotyping). This strain has become the predominant strain of C. difficile in some areas, accounting for more than 80% of CDI cases in some areas. 3
The characteristics of this particular strain epidemic in North America typically include:
-
A deletion in the tcd gene that downregulates toxin production, which renders the gene nonfunctional in the epidemic strain. Some in vitro data have demonstrated that this epidemic strain produces 16‐fold higher concentrations of toxin A and 23‐fold higher concentrations of toxin B than nonepidemic strains of C. difficile. 17
-
Production of a third toxin, called binary toxin CDT. The role of this toxin in the pathogenesis of CDI is not clear, but the presence of this toxin has been associated with more severe CDI‐related diarrhea. 2, 16
-
High‐level resistance to fluoroquinolones, including moxifloxacin and gatifloxacin. 5, 16 It has been theorized that increasing use of fluoroquinolones during the past decade may have provided a selective advantage for the BI/NAP1/027 strain to predominate. 2
-
Production of more spores than other strains of C. difficile. 17, 18 This may increase its ability to contaminate the environment and be transmitted in a healthcare facility.
CDI SEVERITY IS INCREASING
Paralleling the increased prevalence of CDI, C. difficile infections are generally becoming more severe. In Sherbrooke, Quebec, Canada, which experienced a dramatic outbreak of CDI associated with increased CDI severity, the cumulative 1‐year attributable mortality was nearly 37% (60 of 161 CDI cases) in a hospital case review of nonsurgical admissions between January 2003 and June 2004. 19 In St Louis, Missouri in 2003, a 5.7% 180‐day mortality rate was reported in an endemic setting. 20 Among the 24% of patients readmitted within 180 days of discharge (4207 of 17,492) in this retrospective case review, patients with CDI were more than twice as likely as non‐CDI patients to be readmitted to the hospital (52% vs 23%, N = 4207). 20 Furthermore, patients with CDI were significantly more likely to require discharge to a long‐term care facility (32%) than non‐CDI controls (23%). 19
Based on NIS data for CDI‐related hospitalizations between 2000 and 2005, the crude, age‐adjusted case‐fatality rate rose from 1.2% in 2000 to 2.2% in 2004. 21 This increase was mirrored by a doubling of CDI cases admitted for hospitalization during the same 6‐year period. 21 According to the investigators, these findings indirectly confirm that the doubling in CDI deaths is attributable to an increase in C. difficile virulence. 21 A 6‐month prospective surveillance of CDI patient outcomes in 29 Canadian hospitals was conducted by the Canadian Nosocomial Infection Surveillance Program (CNISP) beginning in November 2004. 22 At 30 days after onset of CDI, the percentage of deaths directly or indirectly attributable to CDI was 5.7%, which represented an almost 4‐fold increase over CDI‐attributable deaths recorded in the 1997 CNISP survey. 22 Overall 30‐day mortality was retrospectively analyzed among patients with CDI in a St Louis, Missouri 1200‐bed teaching hospital intensive care unit (ICU) over a 2‐year period (20042005). 23 The 30‐day crude mortality among 278 patients admitted to the ICU with CDI was 37% (n = 102), and mortality directly attributable to CDI in these critically ill patients was 6%. 23 The number of deaths in the United States due to CDI increased sharply from 793 patients in 1999 to 6225 patients in 2006. 24 In 2006, it ranked among the top 20 causes of death for those aged 65 years and older. 24
INCREASE IN TREATMENT FAILURES
In addition to being more severe, there have been several reports of increases in CDI treatment failures and/or increases in recurrent CDI. 6 Recent studies indicate there may be more metronidazole treatment failures regardless of whether the infecting strain is the BI/NAP1/027 strain, despite a lack of laboratory evidence indicating resistance to metronidazole. 2529 Regardless of the initial therapy chosen, patients must be carefully monitored to ensure they are responding appropriately to treatment and their condition is not deteriorating. 29 Some of the original trials of CDI treatments found relapse rates as low as 5% to 15%. 30 More recent data indicate relapse occurs after 30% of initial CDI episodes, and as frequent as 65% if the patient has had multiple prior CDI episodes. 3, 6, 31
COMMUNITY‐ASSOCIATED CDI
The epidemiology of community‐associated CDI may also be changing. Virulent strains, which cause more severe disease in high‐risk patients, may also cause more frequent, severe disease in populations previously thought to be at low risk. Some studies have found an increase in community‐associated CDI in otherwise healthy individuals with little or no exposure to a healthcare facility. Although antimicrobial exposure remains the most important risk factor for community‐associated CDI, antimicrobial exposure is less common in community‐associated CDI than healthcare‐associated CDI. 3235
In a Canadian study, the rate of diagnosed community‐acquired CDI cases was stable at about 22 cases per 100,000 patient‐years per calendar year between 1998 and 2002, but rose steadily for the next 2 years to 53 cases per 100,000 patient‐years in 2004. 33 Similar results were seen in the United Kingdom, with an exponential increase from fewer than 1 case per 100,000 person‐years in 1994 to 22 cases per 100,000 person‐years in 2004. 32 There are currently no comprehensive longitudinal studies in the United States investigating the incidence of purely community‐acquired CDI where a patient had no prior hospital exposure. However, regional surveys have reported an incidence of community‐acquired CDI of 12 cases per 100,000 person‐years during 1992 to 1994, 36 7.6 cases per 100,000 person‐years in 2005, 37 and 6.9 cases per 100,000 person‐years in 2006. 34, 37
One patient population generally thought to be at low risk for CDI that may be at increased risk for severe CDI is pregnant women. In one study 419 infectious disease consultants who responded to a survey conducted by the Emerging Infections Network had seen or were aware of 55 cases of CDI in peripartum women. 38 There were 21 cases with complications, including 10 relapses and 5 cases of toxic megacolon. 38 In a prior report of severe CDI among 10 peripartum women, 3 women died and 3 infants (2 were twins) were stillborn. 38 This data emphasizes why clinicians must have a high index of suspicion for CDI, and should be aware of the potential for severe outcomes, even in patients traditionally considered to be at low risk. 38
ECONOMIC IMPACT OF CDI
The economic burden of CDI in the United States is staggering, with estimates ranging from $1.1 to $3.2 billion annually (Table 1). 3941 These estimates are based on the cost of caring for patients with CDI in acute care facilities and are primarily driven by increased length of stay in the hospital due to CDI. These data also predate the emergence of the BI/NAP1/027 strain. Therefore, the costs of CDI are likely higher than these estimates due to the increases in CDI severity seen since these studies were performed. It is important to note that these studies did not include patients diagnosed and treated in nursing homes or the community, nor the increase in costs due to discharge to a long‐term care facility. 39
| Study | Patient Population | Estimated Attributable Cost per Episode* | Increase in LOS, days | Estimated Annual Attributable Cost, US |
|---|---|---|---|---|
| ||||
| Kyne et al 40 | Two medical wards (n = 40) | $3669 | 3.6 | $1.1 billion |
| Dubberke et al 39 | Nonsurgical patients∥ (n = 439) | $2454$3240 | 3.0 | $897 million$1.3 billion# |
| O'Brien et al 41 | Massachusetts discharge database (n = 3692)** | Primary diagnosis: $10,212; secondary diagnosis: $13,675 | Primary diagnosis: 6.4; secondary diagnosis: 2.9 | $3.2 billion |
SUMMARY
C. difficile infections are becoming more prevalent and more severe. The issue is sufficiently serious that healthcare‐onset CDI has recently been called a major public health threat. 42 For this reason, efforts to combat virulent C. difficile should include good antimicrobial stewardship, effective infection control, and control of environmental factors that promote transmission. 35 Healthcare professionals who oversee the care of inpatients should act as catalysts for improvement by taking a leadership role in the multidisciplinary approach needed to reduce the morbidity, mortality, and cost burden for patients and the healthcare system.
- . Narrative review: the new epidemic of Clostridium difficile‐associated enteric disease. Ann Intern Med. 2006;145(10): 758–764.
- Association for Professionals in Infection Control and Epidemiology, Inc (APIC). Guide to the elimination of Clostridium difficile in healthcare settings. Available at: http://www.apic.org/Content/NavigationMenu/PracticeGuidance/APICEliminationGuides/C.diff_Elimination_guide_logo.pdf. 2008. Accessed October 8, 2011.
- . Clostridium difficile and the disease it causes. Methods Mol Biol. 2010;646:9–35.
- , , . Vegetative Clostridium difficile survives in room air on moist surfaces and in gastric contents with reduced acidity: a potential mechanism to explain the association between proton pump inhibitors and C. difficile‐associated diarrhea?Antimicrob Agents Chemother. 2007;51(8): 2883–2887.
- , . Clostridium difficile‐associated disease: new challenges from an established pathogen. Cleve Clin J Med. 2006;73(2): 187–197.
- . A 76‐year‐old man with recurrent Clostridium difficile‐associated diarrhea: review of C difficile infection. JAMA. 2009;301(9): 954–962.
- , , , . Association between antibody response to toxin A and protection against recurrent Clostridium difficile diarrhoea. Lancet. 2001;357(9251): 189–193.
- , .Clostridium difficile‐associated disease in US hospitals, 1993–2005. Healthcare Cost and Utilization Project. Statistical Brief #50. April 2008. Available at: http://www.ncbi.nlm.nih.gov/books/NBK56038/pdf/sb50.pdf. Accessed December 12, 2011.
- Agency of Healthcare Research and Quality. Healthcare Cost and Utilization Project Database. Available at: http://www.hcup‐us.ahrq.gov/nisoverview.jsp. Accessed April 2011.
- , , , et al. Clostridium difficile infection in Ohio hospitals and nursing homes during 2006. Infect Control Hosp Epidemiol. 2009;30(6): 526–533.
- , , , et al. Trends in catheter‐associated urinary tract infections in adult intensive care units—United States, 1990–2007. Infect Control Hosp Epidemiol. 2011;32(8): 748–756.
- , , , et al. Methicillin‐resistant Staphylococcus aureus central line‐associated bloodstream infections in US intensive care units, 1997–2007. JAMA. 2009;301(7): 727–736.
- , , , et al. An intervention to decrease catheter‐related bloodstream infections in the ICU. N Engl J Med. 2006;355(26): 2725–2732.
- , , , .The impact of hospital‐onset healthcare facility associated (HO‐HCFA) Clostridium difficile infection (CDI) in community hospitals: surpassing methicillin‐resistant Staphylococcus aureus (MRSA) as the new superbug [abstract 386]. Presented at: The Fifth Decennial International Conference on Healthcare‐Associated Infections (ICHAI). March 20, 2010; Atlanta, GA.
- , , . Growth and geographic variation in hospitalizations with resistant infections, United States, 2000–2005. Emerg Infect Dis. 2008;14(11): 1756–1758.
- , , . An epidemic, toxin gene‐variant strain of Clostridium difficile. New Engl J Med. 2005;353(23): 2433–2441.
- , , , et al. Toxin production by an emerging strain of Clostridium difficile associated with outbreaks of severe disease in North America and Europe. Lancet. 2005;366(9491): 1079–1084.
- , , , et al. Increased sporulation rate of epidemic Clostridium difficile type 027/NAP1. J Clin Microbiol. 2008;46(4): 1530–1533.
- , , . Mortality attributable to nosocomial Clostridium difficile‐ associated disease during an epidemic caused by a hypervirulent strain in Quebec. Can Med Assoc J. 2005;173(9): 1037–1042.
- , , , et al. Attributable outcomes of endemic Clostridium difficile‐associated disease in nonsurgical patients. Emerg Infect Dis. 2008;14:1031–1038.
- , , . Increase in adult Clostridium difficile‐related hospitalizations and case‐fatality rate, United States, 2000–2005. Emerg Infect Dis. 2008;14(6): 929–931.
- , , , et al. Health care‐associated Clostridium difficile infection in adults admitted to acute care hospitals in Canada: a Canadian Nosocomial Infection Surveillance Program study. Clin Infect Dis. 2009:48(5);568–576.
- , , , et al. Analysis of 30‐day mortality for Clostridium difficile‐associated disease in the ICU setting. Cheat. 2007;132(2): 418–424.
- , , , et al. Deaths: final data for 2006. Natl Vital Stat Rep. 2009;57(14): 1–134.
- , , . Factors associated with failure of metronidazole in Clostridium difficile‐associated disease. J Clin Gastroenterol. 2004;38(5): 414–418.
- , , , et al. Relatively poor outcome after treatment of Clostridium difficile colitis with metronidazole. Clin Infect Dis. 2005;40(11): 1586–1590.
- , , , et al. Increasing risk of relapse after treatment of Clostridium difficile colitis in Quebec, Canada. Clin Infect Dis. 2005;40(11): 1591–1597.
- , , , et al. Outcome of metronidazole therapy for Clostridium difficile disease and correlation with a scoring system. J Infect. 2007;55(6): 495–501.
- Centers for Disease Control and Prevention. Information about the current strain of Clostridium difficile. Available at: http://www.cdc.gov/HAI/organisms/cdiff/Cdiff‐current‐strain.html. Last updated: January 25, 2011. Accessed October 9, 2011.
- , , , et al. Comparison of vancomycin, teicoplanin, metronidazole, and fusidic acid for the treatment of Clostridium difficile‐associated diarrhea. Clin Infect Dis. 1996;22(5): 813–818.
- , , . Breaking the cycle: treatment strategies for 163 cases of recurrent Clostridium difficile disease. Am J Gastroenterol. 2002;97(7): 1769–1775.
- , , , . Use of gastric acid‐suppressive agents and the risk of community‐acquired Clostridium difficile‐associated disease. JAMA. 2005;294(23): 2989–2995.
- , , , , . Patterns of antibiotic use and risk of hospital admission because of Clostridium difficile infection. Can Med Assoc J. 2008;179(8): 767–772.
- Centers for Disease Control and Prevention. Severe Clostridium difficile‐associated disease in populations previously at low risk—four states, 2005. MMWR. 2005;54(47): 1201–1205.
- . Clostridium difficile‐associated disease: an emerging threat to patient safety: insights from the Society of Infectious Diseases Pharmacists. Pharmacotherapy. 2006;26(3): 299–311.
- , , , et al. Antibiotics and Clostridium difficile in the ambulatory care setting. Clin Ther. 2000;22(1): 91–102.
- Centers for Disease Control and Prevention. Surveillance for community‐associated C. difficile—Connecticut, 2006. MMWR. 2008;57:340–343.
- , O', , et al. Clostridium difficile‐associated diarrhea: an emerging threat to pregnant women. Am J Obstet Gynecol. 2008;198(6):635.e1–635.e6.
- , , , et al. Short‐ and long‐term attributable costs of Clostridium difficile‐associated disease in nonsurgical inpatients. Clin Infect Dis. 2008;46(4): 497–504.
- , , , . Health care costs and mortality associated with nosocomial diarrhea due to Clostridium difficile. Clin Infect Dis. 2002;34(3): 346–353.
- , , , . The emerging infectious challenge of Clostridium difficile‐associated disease in Massachusetts hospitals: clinical and economic consequences. Infect Control Hosp Epidemiol. 2007;28(11): 1219–1227.
- , , , , . National Clostridium difficile infection (CDI) related hospitalizations approaches MRSA related hospitalizations. The need for antibiotic stewardship program [poster 94]. Presented at: The SHEA 2011 Annual Scientific Meeting. April 2, 2011; Dallas, TX.
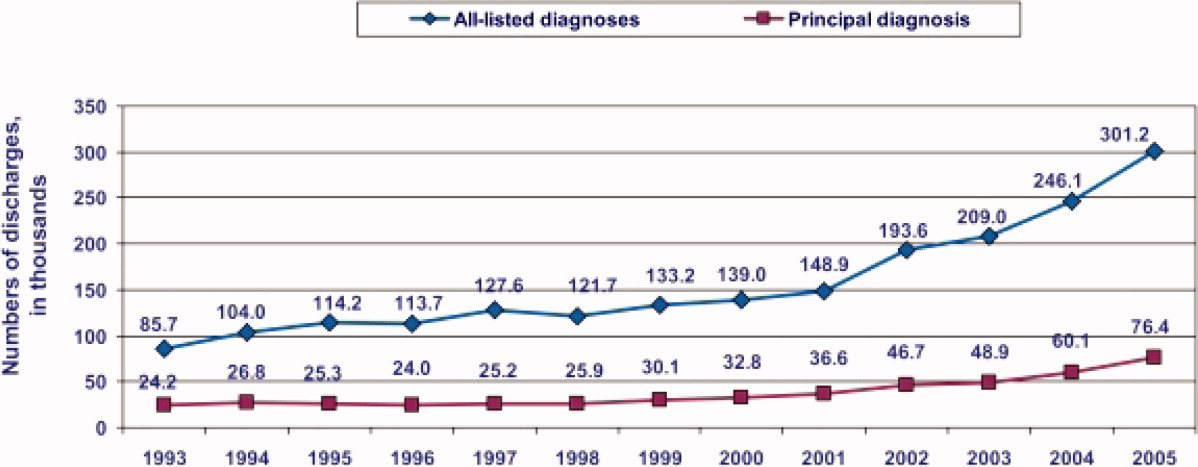
Management of Initial CDI
The incidence and severity of Clostridium difficile infections (CDI) have increased steadily over the past decade, paralleling the emergence of an epidemic strain of C. difficile in North America, the North American pulsed field type 1 (NAP1), restriction‐endonuclease analysis type BI, polymerase‐chain‐reaction ribotype 027, commonly referred to as NAP1/BI/027. The reduced responsiveness of CDI to standard antibiotic therapy, and increased death rate attributable to CDI, present a significant challenge to clinicians. 1 This is a brief review of clinical strategies for effective management of initial CDI for hospital‐based physicians.
Effective management of CDI requires a multidisciplinary effort that includes identification of patients at risk, rapid implementation of contact isolation for patients suspected of having CDI, and implementation of early and appropriate treatment based on current clinical evidence. 2 Early recognition is, in large part, based on suspecting CDI anytime a patient develops antibiotic‐associated diarrhea. An understanding of traditional and emerging risk factors for CDI can help clinicians identify this serious condition early.
CASE STUDY
A.L. is an 87‐year‐old woman in a rehabilitation facility who is recovering from left hip replacement surgery performed 3 weeks ago. Her past medical history is positive for heart failure, atrial fibrillation, type 2 diabetes mellitus, and chronic obstructive pulmonary disease. During her hospitalization, she was treated preoperatively with cephalexin for prophylaxis. She was recently started on ciprofloxacin for a urinary tract infection, and has been taking this for 6 days.
During morning rounds, her nurse reports that A.L. has had diarrhea for 2 days. She is currently afebrile, and her white blood cell (WBC) count is 11,400/L. Ciprofloxacin was discontinued and a stool test for C. difficile toxin was ordered.
RISK FACTORS FOR CDI
The risk of developing CDI depends on 3 groups of factors: impairment of colonization resistance, risk of exposure to toxigenic C. difficile or its spores, and host health and immune status.
Impairment of Colonization Resistance
C. difficile is extremely common in the general environment. However, balanced intestinal microflora normally confer colonization resistance, a host factor that limits the proliferation of pathogenic microorganisms such as C. difficile. 3 While colonization of C. difficile occurs in the community in only 1% to 4% of healthy adults, the rate of colonization in hospitalized adults is much higher, approximately 20% to 30%. 4 Loss of normal resistance to C. difficile in adults is most commonly a consequence of antimicrobial therapy, which disrupts the intestinal microflora. The propensity of different antimicrobial agents to increase the risk for CDI varies due to differences in the complex relationship of their luminal concentrations, activity against C. difficile, and effects on the normal intestinal microflora. 4 Almost every available antibiotic has been associated with CDI; however, broad‐spectrum agents with antianaerobic activity appear to cause the greatest risk (Table 1). 5 Second‐ and third‐generation cephalosporins and fluoroquinolones are the most problematic because of their frequent use and high levels of resistance among strains of C. difficile to these agents. 1, 69 Regimens with multiple antibiotics and/or longer treatment courses are also associated with an increased risk. 9
| Very Commonly Related | Less Commonly Related | Uncommonly Related |
|---|---|---|
| Clindamycin | Other penicillins | Aminoglycosides |
| Cephalosporins | Sulfonamides | Bacitracin |
| Fluoroquinolones | Trimethoprim | Metronidazole |
| Ampicillin | Cotrimoxazole | Teicoplanin |
| Amoxicillin | Macrolides | Rifampin |
| Chloramphenicol | ||
| Tetracyclines | ||
| Carbapenems | ||
| Daptomycin | ||
| Tigecycline | ||
Clinicians should be aware that while CDI usually presents during or shortly after initiation of the causative antimicrobial, onset may be delayed for 2 or 3 months. 3 Healthcare professionals should consider CDI in patients who present with diarrhea and have a history of recent antimicrobial treatment in a hospital or as an outpatient. Other factors that may disrupt intestinal flora and lead to colonization by C. difficile include:
-
Bowel preparation for colonoscopy or surgery.
-
Cytotoxic chemotherapy.
-
Colitis caused by inflammatory bowel disease.
Risk of Exposure to Toxigenic C. difficile or Its Spores
C. difficile spores, which are highly resistant to drying, temperature fluxes, and many common disinfectants, contaminate the patient care environment in hospitals and other healthcare facilities. They are viable for long periods and may be transmitted from the hands or fomites of healthcare personnel to patients. It is not surprising that this leads to a major infection control challenge. 3
Host Health and Immune Status
A healthy immune response to C. difficile and toxins A and B is associated with milder forms of the condition. Many patients colonized by pathogenic strains of C. difficile do not have symptoms; this carrier state is associated with high circulating titers of immunoglobulin G (IgG) antitoxin. Conversely, several important individual factors that increase the risk for CDI include advancing age, hospital admission, longer duration of hospital stay, severe underlying disease, impairment of immune function, suppression of gastric acid secretion (eg, with proton pump inhibitors), enteral feedings (especially with use of a post‐pyloric tube), and mechanical ventilation. 1, 10
RISK FACTORS FOR RECURRENT CDI
The incidence of recurrent CDI within 60 to 90 days of initial CDI resolution following a course of treatment with metronidazole, vancomycin, or both is mostly 19% to 29%, but was 50% in 1 report. 11 The risk for CDI recurrence increases with each recurrent episode 12: Patients with 1 prior episode of recurrent CDI have a >40% risk for an additional recurrence, and those with 2 or more episodes have a >60% risk. 13, 14 Two likely mechanisms that predispose patients to recurrent CDI are an inadequate immune response to C. difficile toxins and persistent disruption of the normal colonic flora due to therapy with metronidazole, vancomycin, or other concomitant antibiotics. 15 Recurrent CDI is seldom due to resistance of vegetative cells of C. difficile to vancomycin or metronidazole. 14 Two other important factors associated with recurrence are infection with a hypervirulent strain of C. difficile, and the fact that the current hospital population generally consists of older and sicker patients who have been treated with many broad‐spectrum antibiotics. 16
Specific patient risk factors associated with recurrent CDI include 14, 17, 18:
-
Previous history of recurrence.
-
Increased age (>65).
-
Severe underlying disease.
-
Renal impairment.
-
Conditions or treatments that lead to immunocompromise.
-
Hospital admission (especially prolonged hospital stay).
-
Use of additional antibiotics.
As noted above, ongoing treatment with antibiotics plays an important role in the risk for recurrence. Hu and colleagues found that concomitant antibiotic use after a diagnosis of CDI was associated with a 10‐fold increased risk for recurrence (odds ratio [OR], 10.0; 95% confidence interval [CI], 1.5‐68.3). 12 Johnson and colleagues found that the rate of sustained response to CDI therapy, without subsequent recurrence, was higher in patients able to stop all other antibiotics and be treated with only fidaxomicin or vancomycin than it was in a group of patients treated with 1 of these agents plus an additional antibiotic (91.9% and 76.1%, respectively). 19 In general, patients who require concomitant antibiotics have more comorbidities and are sicker, so the entire difference cannot be attributed to antibiotics. However, clinicians should carefully consider the ongoing need for antibiotics if CDI is suspected or confirmed.
Continued exposure to C. difficile in the hospital or home environment often leads to reinfection when vancomycin and metronidazole concentrations have decreased. Data show that at least half of clinical recurrences are reinfection with a different strain, and half are due to persisting intestinal infection with the original infecting strain. 20 Therefore, patients with CDI should be educated about appropriate hygiene at home.
CLINICAL MANIFESTATIONS OF CDI
CDI has a wide range of clinical manifestations, ranging from a mild and self‐limited diarrheal illness to fulminant, life‐threatening colitis. The onset of symptoms usually occurs within 3 to 7 days of antibiotic exposure, but may not arise for up to 10 weeks after stopping antibiotics. 5 CDI is associated with watery diarrhea that is often accompanied by cramping abdominal pain and low‐grade fever. Systemic symptoms generally increase with the degree of colitis. Patients with severe disease may also progress to having an ileus, or toxic megacolon or acute abdomen. 5
Up to 20% of critically ill patients have ileus or toxic megacolon, and therefore may not present with diarrhea; this, combined with a limited ability to communicate among some critically ill patients makes early diagnosis of CDI in this patient population extremely challenging. Therefore, physicians and other clinical staff must be vigilant about evaluating patients for the presence of CDI based on physical exam and laboratory findings. For example, fever, abdominal pain, and abdominal distention are likely to be present in patients with severe colitis. In addition, patients often have significant leukocytosis (often >20,000 cells/mm 3) with bandemia. In advanced cases, an elevated serum lactate dehydrogenase may be seenthis is a nonspecific finding for gastrointestinal disease, but provides a clue to the presence of CDI. Because these findings often precede multiorgan dysfunction, the presence of CDI must be determined quickly and appropriate treatment initiated. 5
PRINCIPLES OF DIAGNOSIS
C. difficile infection should be suspected in patients with antimicrobial‐associated diarrhea. Confirmatory testing should be performed, but only on watery or loose stools because the rate of symptomless colonization with C. difficile in hospitalized patients is high; a positive result on a normal stool sample proves only that the patient is colonized with C. difficile, but not necessarily infected. 14 A notable exception is when CDI is suspected in a patient with ileus; as many laboratories will not accept solid stool for C. difficile testing, the clinician should notify the laboratory about the specific request and reasons for suspecting CDI. 21 Stool testing for eradication of C. difficile during or after therapy is not advised, as many successfully treated patients will continue to shed the organism and its spores. 2 This symptomless carriage does not require additional treatment.
CASE STUDY CONTINUED
A.L. was empirically started on oral metronidazole, 500 mg 3 times a day, pending results of the stool C. difficile test.
On rounds the following day, diarrhea was less frequent (decreased from 9 to 4 loose bowel movements in 24 hours). She reported mild abdominal discomfort and nausea, but was tolerating oral intake. Her temperature was 100.8F.
Her lab results returned later in the afternoon were:
-
WBC: 18,600 cells/L.
-
Potassium: 3.2 mEq/mL.
-
Creatinine: 2.4 mg/dL (up from 1.1).
-
Stool C. difficile test: negative.
There are a variety of tests for C. difficile, each with advantages and disadvantages (Table 2). 2, 3, 21 Factors to consider when selecting a diagnostic test include turnaround time, sensitivity, specificity, cost, whether there is an ongoing outbreak, and the availability of particular tests. 21 Recent guidelines for CDI management jointly developed by the Society for Healthcare Epidemiology of America (SHEA) and the Infectious Disease Society of America (IDSA) note that stool culture is the gold standard, but recognize the clinical limitations of its long turnaround time. 2 Enzyme immunoassay (EIA) is noted to be a suboptimal alternative approach for diagnosis than the cell cytotoxin assay. 2 Therefore, because EIA is most often used in clinical practice, it is important to be aware that a high clinical suspicion for CDI may warrant empiric therapy or repeat testing with a more sensitive test in a patient with an initial negative test result. 3, 21
| Test | Advantage(s) | Disadvantage(s) |
|---|---|---|
| Toxin testing | ||
| Enzyme immunoassay | Rapid, simple, | Least sensitive method, some detect only toxin A (some strains only produce toxin B) |
| Cell cytotoxin assay | More sensitive than enzyme immunoassay | Labor intensive; requires 72 hr for a final result, special equipment |
| Organism identification | ||
| Detection of glutamate dehydrogenase | Rapid, sensitive, may prove useful as a triage or screening tool | Not specific, toxin testing required to verify diagnosis; may not be 100% sensitive |
| Polymerase chain reaction | Rapid, sensitive, detects presence of toxin gene | Cost, special equipment needed |
| Stool culture | Most sensitive test available when performed appropriately | May be associated with false‐positive results if isolate is not tested for toxin; labor‐intensive; requires 72 hr for results |
CURRENT STRATEGIES FOR CDI MANAGEMENT
While current guidelines recommend that treatment of CDI be based on disease severity, 2, 22 determination of severity is challenging, in part, because standard definitions are lacking and because the illness varies along a continuum of symptoms. 5 In general, CDI can be categorized as: mild to moderate, severe, and severe disease with complications. Mild to moderate CDI is characterized by diarrhea and abdominal cramping, only without systemic symptoms. 5, 21 Severe CDI is distinguished by abundant diarrhea, severe abdominal pain/distension, leukocytosis, fever, or other systemic symptoms (Table 3). 5, 21, 2326 Patients with severe disease and other complications may present with a wide range of gastrointestinal symptoms accompanied by paralytic ileus, toxic megacolon, or other life‐threatening conditions. 5, 21 CDI may progress in severity rapidly, even after initiation of treatment, so ongoing assessment of the patient's condition and disease category is important. 5, 21
| Severe diarrhea (>10 bowel movements/day) |
| Leukocytosis |
| WBC >15,000 associated with severe CDI |
| WBC >25,000 associated with increased fatality |
| High or rising (50% increase) serum creatinine, or creatinine >2 mg/dL |
| Low serum albumin (2.5 mg/dL) |
| Severe abdominal distension, pain |
| Ileus or toxic megacolon |
| Colonic thickening on CT scan |
| Ascites on CT scan |
| Pseudomembranes on endoscopy |
| Hemodynamic instability |
| Organ failure |
In 2010, SHEA/IDSA published evidence‐based guidelines for managing CDI based on severity of illness (summarized in Table 4). 2 The first and most important step in the effective management of CDI in all patients, regardless of severity, is to discontinue the causative antibiotic(s). 1 Data show that when all antibiotics are stopped, about 25% of patients with mild CDI who are otherwise healthy have resolution of diarrhea within 48 hours 27; most importantly, recurrent CDI is unlikely. Many hospitalized patients, especially in the intensive care setting, have serious concomitant infections, and therefore it may not be appropriate to discontinue the inciting antibiotic. In these patients, the regimen and available culture and sensitivity results should be thoughtfully reviewed, and change made when possible to a more narrow‐spectrum regimen less likely to cause or exacerbate CDI (Table 1).
| Clinical Severity | Supportive Laboratory Data | Recommended Treatment |
|---|---|---|
| ||
| Mild to moderate | WBC 15,000 cells/L) or serum creatinine 1.5 times premorbid level | Metronidazole 500 mg orally 3 times per day for 10‐14 days |
| Severe | WBC 15,000 cells/L) or serum creatinine 1.5 times premorbid level | Vancomycin 125 mg orally 4 times per day for 10‐14 days |
| Severe, complicated | Hypotension or shock, ileus and/or megacolon; organ failure (eg, ARDS); coagulopathy | Vancomycin 500 mg 4 times per day orally or by nasogastric tube plus metronidazole 500 mg IV every 8 hr |
The next step, as discussed above, is to send a stool sample for C. difficile testing. Based on the patient's clinical circumstances, the decision must be made whether or not to begin empiric therapy. In general, beginning treatment without testing for C. difficile is not recommended, because, at most, only about a third of hospitalized patients with diarrhea have CDI, even in an epidemic setting. 21 If a patient is severely ill or has a rapidly deteriorating clinical course and is at high risk for CDI, empiric therapy may be appropriate while awaiting test results. 21
In patients with severe CDI and complications, reduced or absent bowel motility can reduce the amount of orally administered vancomycin that reaches the site of infection. Intracolonic administration of vancomycin may be indicated in these cases, or when oral therapy cannot be tolerated. 28 Higher doses of oral vancomycin may also be used, with the goal of increasing fecal concentrations, however this strategy has not been studied. 5 In all patients, antiperistaltic agents are usually avoided because of unproven concerns that they might mask symptoms and/or increase the risk for toxic megacolon. 2
Fidaxomicin, a new macrolide antibiotic in the macrocyclic group, has a narrow‐spectrum and excellent activity against C. difficile. The US Food and Drug Administration approved fidaxomicin for treatment of adults for C. difficileassociated diarrhea (CDAD) in May 2011. 29 Approval was based on 2 phase III trials involving 1105 patients with CDAD in which fidaxomicin was shown to have similar initial clinical efficacy and safety as vancomycin. 30 In addition, more patients treated with fidaxomicin had a sustained response 25 days following discontinuation of treatment than patients treated with vancomycin. 31 The recommended dosage of fidaxomicin is one 200‐mg tablet orally twice daily for 10 days. 31
In a phase III trial (N = 596) of fidaxomicin (200 mg orally every 12 hours) versus vancomycin (125 mg orally every 6 hours) for 10 days, fidaxomicin was shown to be noninferior to vancomycin in achieving an initial clinical response and significantly better at preventing recurrent CDI. 32 The rates of initial clinical response, the primary endpoint, and rates of recurrent CDI are shown in Table 5. The significant difference in recurrence may be explained by the fact that metronidazole and vancomycin impact commensal microflora populations that normally mediate competitive exclusion of C. difficile. Compared with vancomycin, fidaxomicin has less effect on the composition of the fecal microbiota, in particular some clostridial clusters and Bifidobacterium. 33 While acquisition costs for this new antibiotic are a consideration, they may be offset by a reduction in recurrent CDI, especially in high‐risk patients.
| Modified Intention‐to‐Treat Population | Per‐Protocol Population | |||
|---|---|---|---|---|
| Fidaxomicin n/N (%) | Vancomycin n/N (%) | Fidaxomicin n/N (%) | Vancomycin n/N (%) | |
| ||||
| Rates of initial clinical response | ||||
| Total population | 253/287 (88.2) | 265/309 (85.8) | 244/265 (92.1) | 254/283 (89.8) |
| Non‐NAP1/BI/027 strain type | 117/125 (93.6) | 121/132 (91.7) | 115/119 (96.6) | 119/126 (94.4) |
| Use of concomitant systemic antimicrobial therapy | 67/83 (80.7) | 72/94 (76.6) | 63/71 (88.7) | 67/80 (83.8) |
| Rates of recurrence of C. difficile infection | ||||
| Total population | 39/253 (15.4)* | 67/265 (25.3)* | 28/211 (13.3) | 53/221 (24.0) |
| Non‐NAP1/BI/027 strain type | 12/117 (10.3) | 34/121 (28.1) | 8/103 (7.8) | 27/106 (25.5) |
| Use of concomitant systemic antimicrobial therapy | 14/81 (17.3) | 25/90 (27.8) | 8/56 (14.3) | 20/65 (30.8) |
FOCUS ON FULMINANT/REFRACTORY CDI
Management of CDI that is fulminant and/or refractory can be extremely challenging. 3 In clinical practice, these conditions often overlap. Clinical characteristics that may help identify fulminant CDI include abdominal pain and tenderness, colonic distension, and signs of sepsis. Diarrhea may be absent or minimal due to ileus. Furthermore, a diagnosis of CDI is easy to miss, as these symptoms are also consistent with ischemic bowel or a perforated viscus. 3 Gentle, flexible sigmoidoscopy or colonoscopy (without bowel preparation and with minimal air insufflation) may be extremely valuable to allow for immediate identification of pseudomembranous colitis, which speeds appropriate medical and surgical management. 3
First‐line treatment for fulminant or refractory CDI is oral or intragastric vancomycin 500 mg every 6 hours. 2, 3 Intravenous (IV) metronidazole 500 mg every 6 hours should be added to the treatment regimen in those with ileus or megacolon. For patients with complete ileus, vancomycin can be administered rectally as 500 mg in 100 mL of normal saline every 6 hours. 3 Normal pooled IV immunoglobulin has been used with mixed success, in patients with fulminant and/or refractory CDI, in an attempt to avert surgery or death by providing passive immunotherapy against C. difficile toxins A and B. 34 In a study of monoclonal antibodies to toxins A and B that included 200 patients, recurrence rates among those with the epidemic NAP1/BI/027 strain were 8% for the antibody group and 32% for the placebo group (P = 0.06); in a subset with more than 1 previous episode of CDI, recurrence rates were 7% and 38%, respectively (P = 0.006). 35
Some patients with fulminant or refractory CDI are best managed with subtotal colectomy, which may be lifesaving. 36 However, the optimal timing of surgery is difficult to establish, and the decision to proceed with this course can be difficult because patients with severe CDI are typically poor surgical candidates. 3 Delaying surgery until the development of a systemic inflammatory response syndrome with concomitant severe disease, such as multisystem organ failure, immunocompromise, or hemodynamic instability, usually results in a poor outcome. 37, 38 The best approach is to get a surgical consult early, when the course of CDI starts to deteriorate, so that management decisions can be based on input from a multidisciplinary team of clinicians. 3
CASE STUDY CONTINUED
A.L. was subsequently transferred to an acute care facility. Her therapy for C. difficile was switched to oral vancomycin, 125 mg 4 times daily. On arrival in the emergency department, the following findings were noted:
-
No further diarrhea, but abdominal distention noted.
-
Temperature: 101.4F.
-
Fall in blood pressure (BP) to 90/48 mmHg during transfer, which responded to a fluid bolus, and increased to 108/74.
-
WBC: 27,000/L.
-
Abdominal computed tomography (CT) showed thickening of descending and sigmoid colon, and the rectum.
-
Proctoscopy confirmed pseudomembranous colitis.
Oral vancomycin was increased to 500 mg 4 times daily, and IV metronidazole 500 mg every 8 hours was added. C. difficile infection responded to this regimen and she was subsequently discharged to home care.
- .Narrative review: the new epidemic of Clostridium difficile‐associated enteric disease.Ann Intern Med.2006;145(10):758–764.
- ,,, et al.Clinical practice guidelines for Clostridium diffcile infection in adults: 2010 update by the Society for Healthcare Epidemiology of America (SHEA) and the Infectious Diseases Society of America (IDSA).Infect Control Hosp Epidemiol.2010;31(5):431–455.
- .A 76‐year‐old man with recurrent Clostridium difficile–associated diarrhea: review of C difficile infection.JAMA.2009;301(9):954–962.
- .Antibiotic‐associated diarrhea.N Engl J Med.2002;346(5):334–339.
- ,.Clostridium difficile infection in the intensive care unit.Infect Dis Clin North Am.2009;23(3):727–743.
- ,,, et al.A predominantly clonal multi‐institutional outbreak of Clostridium difficile‐associated diarrhea with high morbidity and mortality.N Engl J Med.2005;353:2442–2449.
- ,,.Antimicrobial therapy of Clostridium difficile‐associated diarrhea.Med Clin North Am.2006;90(6):1141–1163.
- ,,,,.Patterns of antibiotic use and risk of hospital admission because of Clostridium difficile.Can Med Assoc J.2008;179(8):767–772.
- ,,, et al.Emergence of fluoroquinolones as the predominant risk factor for Clostridium difficile‐associated diarrhea: a cohort study during an epidemic in Quebec.Clin Infect Dis.2005;41(9):1254–1260.
- .Clostridium difficile and the disease it causes.Methods Mol Biol.2010;646:9–35.
- ,,.Treatment of Clostridium difficile‐associated disease: old therapies and new.Lancet Infect Dis.2005;5(9):549–557.
- , , , et al. Prospective derviation and validation of a clinical prediction rule for recurrent Clostridium difficile infection. Gastroenterology. 2009;136:1206–1214.
- ,,, et al.A randomized placebo‐controlled trial of Saccharomyces boulardii in combination with standard antibiotics for Clostridium difficile disease.JAMA.1994;271(24):1913–1918.
- ,,.Breaking the cycle: treatment strategies for 163 cases of recurrent Clostridium difficile disease.Am J Gastroenterol.2002;97(7):1769–1775.
- .Recurrent Clostridium difficile infection: a review of risk factors, treatments, and outcomes.J Infect.2009;58(6):403–410.
- ,.Clostridium difficile: recent epidemiologic findings and advances in therapy.Pharmacotherapy.2007;27(7):1029–1039.
- ,,, et al.Risk factors for early recurrent Clostridium difficile‐associated diarrheas.Clin Infect Dis.1998;26(4):954–959.
- ,,,.Association between antibody response to toxin A and protection against recurrent Clostridium difficile diarrhoea.Lancet.2001;357(9251):189–193.
- ,,,,,.Randomized clinical trial in Clostridium difficile infection confirms superiority of fidaxomicin over vancomycin [abstract 828630]. Presented at: Digestive Disease Week 2010; May 4,2010; New Orleans, LA.
- ,,,.Recurrence of symptoms in Clostridium difficile infection—relapse or reinfection?J Hosp Infect.1998;38(2):93–100.
- ,.Clostridium difficile‐associated disease: new challenges from an established pathogen.Cleve Clin J Med.2006;73(2):187–197.
- ,,,.A comparison of vancomycin and metronidazole for the treatment of Clostridium difficile–associated diarrhea, stratified by disease severity.Clin Infect Dis.2007;45(3):302–307.
- ,,, et al.Clostridium difficile–associated diarrhea in a region of Quebec from 1991 to 2003: a changing pattern of disease severity.Can Med Assoc J.2004;171(5):466–472.
- ,.Clinical recognition and diagnosis of Clostridium difficile infection.Clin Infect Dis.2008;46(suppl 1):S12–S18.
- ,,,.Clinical risk factors for severe Clostridium difficile‐associated disease.Emerg Infect Dis.2009;15(3):415–422.
- ,,.European Society of Clinical Microbiology and Infectious Diseases (ESCMID): treatment guidance document for Clostridium difficile infection (CDI).Clin Microbiol Infect.2009;15(12):1067–1079.
- ,,, et al.Prospective randomised trial of metronidazole versus vancomycin for Clostridium difficile–associated diarrhoea and colitis.Lancet.1983;2(8358):1043–1046.
- ,,.Adjunctive intracolonic vancomycin for severe Clostridium difficile colitis: case series and review of the literature.Clin Infect Dis.2002;35(6):690–696.
- United States Food and Drug Administration. FDA approves treatment for Clostridium difficile infection. Available at: www.fda.gov/NewsEvents/Newsroom/PressAnnouncements/ucm257024.htm. Last updated: May, 27, 2011. Accessed June 15,2011.
- ,,, et al.Efficacy and safety of fidaxomicin (FDX) vs. vancomycin (VAN) in Clostridium difficile infection (CDI) in 2 randomized controlled trials (RCT) with 1105 patients [abstract 1417]. Presented at: The 48th Annual IDSA Meeting; October 21–24,2010; Vancouver, BC, Canada.
- Dificid [package insert].San Diego, CA:Optimer Pharmaceuticals, Inc;2011.
- ,,, et al.Fidaxomicin versus vancomycin for Clostridium difficile infection.N Engl J Med.2011;364(5):422–431.
- ,,, et al.A new macrocyclic antibiotic, fidaxomicin (OPT‐80), causes less alteration to the bowel microbiota of Clostridium difficile‐infected patients than does vancomycin.Microbiology.2010;156(pt 11):3354–3359.
- ,,,.Intravenous immunoglobulin for the treatment of severe Clostridium difficile colitis: an observational study and review of the literature.J Hosp Med.2010;5(1):E1–E9.
- ,,, et al.Treatment with monoclonal antibodies against Clostridium difficile toxins.N Engl J Med.2010;362(3):197–205.
- ,.Surgical aspects of fulminant Clostridium difficile colitis.Am J Surg.2010;200(1):131–135.
- ,,, et al.Clostridium difficile colitis in the critically ill.Dis Colon Rectum.1996;39(6):619–623.
- ,,.Early surgical intervention for fulminant pseudomembranous colitis.Am Surg.74(1):20–26.
The incidence and severity of Clostridium difficile infections (CDI) have increased steadily over the past decade, paralleling the emergence of an epidemic strain of C. difficile in North America, the North American pulsed field type 1 (NAP1), restriction‐endonuclease analysis type BI, polymerase‐chain‐reaction ribotype 027, commonly referred to as NAP1/BI/027. The reduced responsiveness of CDI to standard antibiotic therapy, and increased death rate attributable to CDI, present a significant challenge to clinicians. 1 This is a brief review of clinical strategies for effective management of initial CDI for hospital‐based physicians.
Effective management of CDI requires a multidisciplinary effort that includes identification of patients at risk, rapid implementation of contact isolation for patients suspected of having CDI, and implementation of early and appropriate treatment based on current clinical evidence. 2 Early recognition is, in large part, based on suspecting CDI anytime a patient develops antibiotic‐associated diarrhea. An understanding of traditional and emerging risk factors for CDI can help clinicians identify this serious condition early.
CASE STUDY
A.L. is an 87‐year‐old woman in a rehabilitation facility who is recovering from left hip replacement surgery performed 3 weeks ago. Her past medical history is positive for heart failure, atrial fibrillation, type 2 diabetes mellitus, and chronic obstructive pulmonary disease. During her hospitalization, she was treated preoperatively with cephalexin for prophylaxis. She was recently started on ciprofloxacin for a urinary tract infection, and has been taking this for 6 days.
During morning rounds, her nurse reports that A.L. has had diarrhea for 2 days. She is currently afebrile, and her white blood cell (WBC) count is 11,400/L. Ciprofloxacin was discontinued and a stool test for C. difficile toxin was ordered.
RISK FACTORS FOR CDI
The risk of developing CDI depends on 3 groups of factors: impairment of colonization resistance, risk of exposure to toxigenic C. difficile or its spores, and host health and immune status.
Impairment of Colonization Resistance
C. difficile is extremely common in the general environment. However, balanced intestinal microflora normally confer colonization resistance, a host factor that limits the proliferation of pathogenic microorganisms such as C. difficile. 3 While colonization of C. difficile occurs in the community in only 1% to 4% of healthy adults, the rate of colonization in hospitalized adults is much higher, approximately 20% to 30%. 4 Loss of normal resistance to C. difficile in adults is most commonly a consequence of antimicrobial therapy, which disrupts the intestinal microflora. The propensity of different antimicrobial agents to increase the risk for CDI varies due to differences in the complex relationship of their luminal concentrations, activity against C. difficile, and effects on the normal intestinal microflora. 4 Almost every available antibiotic has been associated with CDI; however, broad‐spectrum agents with antianaerobic activity appear to cause the greatest risk (Table 1). 5 Second‐ and third‐generation cephalosporins and fluoroquinolones are the most problematic because of their frequent use and high levels of resistance among strains of C. difficile to these agents. 1, 69 Regimens with multiple antibiotics and/or longer treatment courses are also associated with an increased risk. 9
| Very Commonly Related | Less Commonly Related | Uncommonly Related |
|---|---|---|
| Clindamycin | Other penicillins | Aminoglycosides |
| Cephalosporins | Sulfonamides | Bacitracin |
| Fluoroquinolones | Trimethoprim | Metronidazole |
| Ampicillin | Cotrimoxazole | Teicoplanin |
| Amoxicillin | Macrolides | Rifampin |
| Chloramphenicol | ||
| Tetracyclines | ||
| Carbapenems | ||
| Daptomycin | ||
| Tigecycline | ||
Clinicians should be aware that while CDI usually presents during or shortly after initiation of the causative antimicrobial, onset may be delayed for 2 or 3 months. 3 Healthcare professionals should consider CDI in patients who present with diarrhea and have a history of recent antimicrobial treatment in a hospital or as an outpatient. Other factors that may disrupt intestinal flora and lead to colonization by C. difficile include:
-
Bowel preparation for colonoscopy or surgery.
-
Cytotoxic chemotherapy.
-
Colitis caused by inflammatory bowel disease.
Risk of Exposure to Toxigenic C. difficile or Its Spores
C. difficile spores, which are highly resistant to drying, temperature fluxes, and many common disinfectants, contaminate the patient care environment in hospitals and other healthcare facilities. They are viable for long periods and may be transmitted from the hands or fomites of healthcare personnel to patients. It is not surprising that this leads to a major infection control challenge. 3
Host Health and Immune Status
A healthy immune response to C. difficile and toxins A and B is associated with milder forms of the condition. Many patients colonized by pathogenic strains of C. difficile do not have symptoms; this carrier state is associated with high circulating titers of immunoglobulin G (IgG) antitoxin. Conversely, several important individual factors that increase the risk for CDI include advancing age, hospital admission, longer duration of hospital stay, severe underlying disease, impairment of immune function, suppression of gastric acid secretion (eg, with proton pump inhibitors), enteral feedings (especially with use of a post‐pyloric tube), and mechanical ventilation. 1, 10
RISK FACTORS FOR RECURRENT CDI
The incidence of recurrent CDI within 60 to 90 days of initial CDI resolution following a course of treatment with metronidazole, vancomycin, or both is mostly 19% to 29%, but was 50% in 1 report. 11 The risk for CDI recurrence increases with each recurrent episode 12: Patients with 1 prior episode of recurrent CDI have a >40% risk for an additional recurrence, and those with 2 or more episodes have a >60% risk. 13, 14 Two likely mechanisms that predispose patients to recurrent CDI are an inadequate immune response to C. difficile toxins and persistent disruption of the normal colonic flora due to therapy with metronidazole, vancomycin, or other concomitant antibiotics. 15 Recurrent CDI is seldom due to resistance of vegetative cells of C. difficile to vancomycin or metronidazole. 14 Two other important factors associated with recurrence are infection with a hypervirulent strain of C. difficile, and the fact that the current hospital population generally consists of older and sicker patients who have been treated with many broad‐spectrum antibiotics. 16
Specific patient risk factors associated with recurrent CDI include 14, 17, 18:
-
Previous history of recurrence.
-
Increased age (>65).
-
Severe underlying disease.
-
Renal impairment.
-
Conditions or treatments that lead to immunocompromise.
-
Hospital admission (especially prolonged hospital stay).
-
Use of additional antibiotics.
As noted above, ongoing treatment with antibiotics plays an important role in the risk for recurrence. Hu and colleagues found that concomitant antibiotic use after a diagnosis of CDI was associated with a 10‐fold increased risk for recurrence (odds ratio [OR], 10.0; 95% confidence interval [CI], 1.5‐68.3). 12 Johnson and colleagues found that the rate of sustained response to CDI therapy, without subsequent recurrence, was higher in patients able to stop all other antibiotics and be treated with only fidaxomicin or vancomycin than it was in a group of patients treated with 1 of these agents plus an additional antibiotic (91.9% and 76.1%, respectively). 19 In general, patients who require concomitant antibiotics have more comorbidities and are sicker, so the entire difference cannot be attributed to antibiotics. However, clinicians should carefully consider the ongoing need for antibiotics if CDI is suspected or confirmed.
Continued exposure to C. difficile in the hospital or home environment often leads to reinfection when vancomycin and metronidazole concentrations have decreased. Data show that at least half of clinical recurrences are reinfection with a different strain, and half are due to persisting intestinal infection with the original infecting strain. 20 Therefore, patients with CDI should be educated about appropriate hygiene at home.
CLINICAL MANIFESTATIONS OF CDI
CDI has a wide range of clinical manifestations, ranging from a mild and self‐limited diarrheal illness to fulminant, life‐threatening colitis. The onset of symptoms usually occurs within 3 to 7 days of antibiotic exposure, but may not arise for up to 10 weeks after stopping antibiotics. 5 CDI is associated with watery diarrhea that is often accompanied by cramping abdominal pain and low‐grade fever. Systemic symptoms generally increase with the degree of colitis. Patients with severe disease may also progress to having an ileus, or toxic megacolon or acute abdomen. 5
Up to 20% of critically ill patients have ileus or toxic megacolon, and therefore may not present with diarrhea; this, combined with a limited ability to communicate among some critically ill patients makes early diagnosis of CDI in this patient population extremely challenging. Therefore, physicians and other clinical staff must be vigilant about evaluating patients for the presence of CDI based on physical exam and laboratory findings. For example, fever, abdominal pain, and abdominal distention are likely to be present in patients with severe colitis. In addition, patients often have significant leukocytosis (often >20,000 cells/mm 3) with bandemia. In advanced cases, an elevated serum lactate dehydrogenase may be seenthis is a nonspecific finding for gastrointestinal disease, but provides a clue to the presence of CDI. Because these findings often precede multiorgan dysfunction, the presence of CDI must be determined quickly and appropriate treatment initiated. 5
PRINCIPLES OF DIAGNOSIS
C. difficile infection should be suspected in patients with antimicrobial‐associated diarrhea. Confirmatory testing should be performed, but only on watery or loose stools because the rate of symptomless colonization with C. difficile in hospitalized patients is high; a positive result on a normal stool sample proves only that the patient is colonized with C. difficile, but not necessarily infected. 14 A notable exception is when CDI is suspected in a patient with ileus; as many laboratories will not accept solid stool for C. difficile testing, the clinician should notify the laboratory about the specific request and reasons for suspecting CDI. 21 Stool testing for eradication of C. difficile during or after therapy is not advised, as many successfully treated patients will continue to shed the organism and its spores. 2 This symptomless carriage does not require additional treatment.
CASE STUDY CONTINUED
A.L. was empirically started on oral metronidazole, 500 mg 3 times a day, pending results of the stool C. difficile test.
On rounds the following day, diarrhea was less frequent (decreased from 9 to 4 loose bowel movements in 24 hours). She reported mild abdominal discomfort and nausea, but was tolerating oral intake. Her temperature was 100.8F.
Her lab results returned later in the afternoon were:
-
WBC: 18,600 cells/L.
-
Potassium: 3.2 mEq/mL.
-
Creatinine: 2.4 mg/dL (up from 1.1).
-
Stool C. difficile test: negative.
There are a variety of tests for C. difficile, each with advantages and disadvantages (Table 2). 2, 3, 21 Factors to consider when selecting a diagnostic test include turnaround time, sensitivity, specificity, cost, whether there is an ongoing outbreak, and the availability of particular tests. 21 Recent guidelines for CDI management jointly developed by the Society for Healthcare Epidemiology of America (SHEA) and the Infectious Disease Society of America (IDSA) note that stool culture is the gold standard, but recognize the clinical limitations of its long turnaround time. 2 Enzyme immunoassay (EIA) is noted to be a suboptimal alternative approach for diagnosis than the cell cytotoxin assay. 2 Therefore, because EIA is most often used in clinical practice, it is important to be aware that a high clinical suspicion for CDI may warrant empiric therapy or repeat testing with a more sensitive test in a patient with an initial negative test result. 3, 21
| Test | Advantage(s) | Disadvantage(s) |
|---|---|---|
| Toxin testing | ||
| Enzyme immunoassay | Rapid, simple, | Least sensitive method, some detect only toxin A (some strains only produce toxin B) |
| Cell cytotoxin assay | More sensitive than enzyme immunoassay | Labor intensive; requires 72 hr for a final result, special equipment |
| Organism identification | ||
| Detection of glutamate dehydrogenase | Rapid, sensitive, may prove useful as a triage or screening tool | Not specific, toxin testing required to verify diagnosis; may not be 100% sensitive |
| Polymerase chain reaction | Rapid, sensitive, detects presence of toxin gene | Cost, special equipment needed |
| Stool culture | Most sensitive test available when performed appropriately | May be associated with false‐positive results if isolate is not tested for toxin; labor‐intensive; requires 72 hr for results |
CURRENT STRATEGIES FOR CDI MANAGEMENT
While current guidelines recommend that treatment of CDI be based on disease severity, 2, 22 determination of severity is challenging, in part, because standard definitions are lacking and because the illness varies along a continuum of symptoms. 5 In general, CDI can be categorized as: mild to moderate, severe, and severe disease with complications. Mild to moderate CDI is characterized by diarrhea and abdominal cramping, only without systemic symptoms. 5, 21 Severe CDI is distinguished by abundant diarrhea, severe abdominal pain/distension, leukocytosis, fever, or other systemic symptoms (Table 3). 5, 21, 2326 Patients with severe disease and other complications may present with a wide range of gastrointestinal symptoms accompanied by paralytic ileus, toxic megacolon, or other life‐threatening conditions. 5, 21 CDI may progress in severity rapidly, even after initiation of treatment, so ongoing assessment of the patient's condition and disease category is important. 5, 21
| Severe diarrhea (>10 bowel movements/day) |
| Leukocytosis |
| WBC >15,000 associated with severe CDI |
| WBC >25,000 associated with increased fatality |
| High or rising (50% increase) serum creatinine, or creatinine >2 mg/dL |
| Low serum albumin (2.5 mg/dL) |
| Severe abdominal distension, pain |
| Ileus or toxic megacolon |
| Colonic thickening on CT scan |
| Ascites on CT scan |
| Pseudomembranes on endoscopy |
| Hemodynamic instability |
| Organ failure |
In 2010, SHEA/IDSA published evidence‐based guidelines for managing CDI based on severity of illness (summarized in Table 4). 2 The first and most important step in the effective management of CDI in all patients, regardless of severity, is to discontinue the causative antibiotic(s). 1 Data show that when all antibiotics are stopped, about 25% of patients with mild CDI who are otherwise healthy have resolution of diarrhea within 48 hours 27; most importantly, recurrent CDI is unlikely. Many hospitalized patients, especially in the intensive care setting, have serious concomitant infections, and therefore it may not be appropriate to discontinue the inciting antibiotic. In these patients, the regimen and available culture and sensitivity results should be thoughtfully reviewed, and change made when possible to a more narrow‐spectrum regimen less likely to cause or exacerbate CDI (Table 1).
| Clinical Severity | Supportive Laboratory Data | Recommended Treatment |
|---|---|---|
| ||
| Mild to moderate | WBC 15,000 cells/L) or serum creatinine 1.5 times premorbid level | Metronidazole 500 mg orally 3 times per day for 10‐14 days |
| Severe | WBC 15,000 cells/L) or serum creatinine 1.5 times premorbid level | Vancomycin 125 mg orally 4 times per day for 10‐14 days |
| Severe, complicated | Hypotension or shock, ileus and/or megacolon; organ failure (eg, ARDS); coagulopathy | Vancomycin 500 mg 4 times per day orally or by nasogastric tube plus metronidazole 500 mg IV every 8 hr |
The next step, as discussed above, is to send a stool sample for C. difficile testing. Based on the patient's clinical circumstances, the decision must be made whether or not to begin empiric therapy. In general, beginning treatment without testing for C. difficile is not recommended, because, at most, only about a third of hospitalized patients with diarrhea have CDI, even in an epidemic setting. 21 If a patient is severely ill or has a rapidly deteriorating clinical course and is at high risk for CDI, empiric therapy may be appropriate while awaiting test results. 21
In patients with severe CDI and complications, reduced or absent bowel motility can reduce the amount of orally administered vancomycin that reaches the site of infection. Intracolonic administration of vancomycin may be indicated in these cases, or when oral therapy cannot be tolerated. 28 Higher doses of oral vancomycin may also be used, with the goal of increasing fecal concentrations, however this strategy has not been studied. 5 In all patients, antiperistaltic agents are usually avoided because of unproven concerns that they might mask symptoms and/or increase the risk for toxic megacolon. 2
Fidaxomicin, a new macrolide antibiotic in the macrocyclic group, has a narrow‐spectrum and excellent activity against C. difficile. The US Food and Drug Administration approved fidaxomicin for treatment of adults for C. difficileassociated diarrhea (CDAD) in May 2011. 29 Approval was based on 2 phase III trials involving 1105 patients with CDAD in which fidaxomicin was shown to have similar initial clinical efficacy and safety as vancomycin. 30 In addition, more patients treated with fidaxomicin had a sustained response 25 days following discontinuation of treatment than patients treated with vancomycin. 31 The recommended dosage of fidaxomicin is one 200‐mg tablet orally twice daily for 10 days. 31
In a phase III trial (N = 596) of fidaxomicin (200 mg orally every 12 hours) versus vancomycin (125 mg orally every 6 hours) for 10 days, fidaxomicin was shown to be noninferior to vancomycin in achieving an initial clinical response and significantly better at preventing recurrent CDI. 32 The rates of initial clinical response, the primary endpoint, and rates of recurrent CDI are shown in Table 5. The significant difference in recurrence may be explained by the fact that metronidazole and vancomycin impact commensal microflora populations that normally mediate competitive exclusion of C. difficile. Compared with vancomycin, fidaxomicin has less effect on the composition of the fecal microbiota, in particular some clostridial clusters and Bifidobacterium. 33 While acquisition costs for this new antibiotic are a consideration, they may be offset by a reduction in recurrent CDI, especially in high‐risk patients.
| Modified Intention‐to‐Treat Population | Per‐Protocol Population | |||
|---|---|---|---|---|
| Fidaxomicin n/N (%) | Vancomycin n/N (%) | Fidaxomicin n/N (%) | Vancomycin n/N (%) | |
| ||||
| Rates of initial clinical response | ||||
| Total population | 253/287 (88.2) | 265/309 (85.8) | 244/265 (92.1) | 254/283 (89.8) |
| Non‐NAP1/BI/027 strain type | 117/125 (93.6) | 121/132 (91.7) | 115/119 (96.6) | 119/126 (94.4) |
| Use of concomitant systemic antimicrobial therapy | 67/83 (80.7) | 72/94 (76.6) | 63/71 (88.7) | 67/80 (83.8) |
| Rates of recurrence of C. difficile infection | ||||
| Total population | 39/253 (15.4)* | 67/265 (25.3)* | 28/211 (13.3) | 53/221 (24.0) |
| Non‐NAP1/BI/027 strain type | 12/117 (10.3) | 34/121 (28.1) | 8/103 (7.8) | 27/106 (25.5) |
| Use of concomitant systemic antimicrobial therapy | 14/81 (17.3) | 25/90 (27.8) | 8/56 (14.3) | 20/65 (30.8) |
FOCUS ON FULMINANT/REFRACTORY CDI
Management of CDI that is fulminant and/or refractory can be extremely challenging. 3 In clinical practice, these conditions often overlap. Clinical characteristics that may help identify fulminant CDI include abdominal pain and tenderness, colonic distension, and signs of sepsis. Diarrhea may be absent or minimal due to ileus. Furthermore, a diagnosis of CDI is easy to miss, as these symptoms are also consistent with ischemic bowel or a perforated viscus. 3 Gentle, flexible sigmoidoscopy or colonoscopy (without bowel preparation and with minimal air insufflation) may be extremely valuable to allow for immediate identification of pseudomembranous colitis, which speeds appropriate medical and surgical management. 3
First‐line treatment for fulminant or refractory CDI is oral or intragastric vancomycin 500 mg every 6 hours. 2, 3 Intravenous (IV) metronidazole 500 mg every 6 hours should be added to the treatment regimen in those with ileus or megacolon. For patients with complete ileus, vancomycin can be administered rectally as 500 mg in 100 mL of normal saline every 6 hours. 3 Normal pooled IV immunoglobulin has been used with mixed success, in patients with fulminant and/or refractory CDI, in an attempt to avert surgery or death by providing passive immunotherapy against C. difficile toxins A and B. 34 In a study of monoclonal antibodies to toxins A and B that included 200 patients, recurrence rates among those with the epidemic NAP1/BI/027 strain were 8% for the antibody group and 32% for the placebo group (P = 0.06); in a subset with more than 1 previous episode of CDI, recurrence rates were 7% and 38%, respectively (P = 0.006). 35
Some patients with fulminant or refractory CDI are best managed with subtotal colectomy, which may be lifesaving. 36 However, the optimal timing of surgery is difficult to establish, and the decision to proceed with this course can be difficult because patients with severe CDI are typically poor surgical candidates. 3 Delaying surgery until the development of a systemic inflammatory response syndrome with concomitant severe disease, such as multisystem organ failure, immunocompromise, or hemodynamic instability, usually results in a poor outcome. 37, 38 The best approach is to get a surgical consult early, when the course of CDI starts to deteriorate, so that management decisions can be based on input from a multidisciplinary team of clinicians. 3
CASE STUDY CONTINUED
A.L. was subsequently transferred to an acute care facility. Her therapy for C. difficile was switched to oral vancomycin, 125 mg 4 times daily. On arrival in the emergency department, the following findings were noted:
-
No further diarrhea, but abdominal distention noted.
-
Temperature: 101.4F.
-
Fall in blood pressure (BP) to 90/48 mmHg during transfer, which responded to a fluid bolus, and increased to 108/74.
-
WBC: 27,000/L.
-
Abdominal computed tomography (CT) showed thickening of descending and sigmoid colon, and the rectum.
-
Proctoscopy confirmed pseudomembranous colitis.
Oral vancomycin was increased to 500 mg 4 times daily, and IV metronidazole 500 mg every 8 hours was added. C. difficile infection responded to this regimen and she was subsequently discharged to home care.
- .Narrative review: the new epidemic of Clostridium difficile‐associated enteric disease.Ann Intern Med.2006;145(10):758–764.
- ,,, et al.Clinical practice guidelines for Clostridium diffcile infection in adults: 2010 update by the Society for Healthcare Epidemiology of America (SHEA) and the Infectious Diseases Society of America (IDSA).Infect Control Hosp Epidemiol.2010;31(5):431–455.
- .A 76‐year‐old man with recurrent Clostridium difficile–associated diarrhea: review of C difficile infection.JAMA.2009;301(9):954–962.
- .Antibiotic‐associated diarrhea.N Engl J Med.2002;346(5):334–339.
- ,.Clostridium difficile infection in the intensive care unit.Infect Dis Clin North Am.2009;23(3):727–743.
- ,,, et al.A predominantly clonal multi‐institutional outbreak of Clostridium difficile‐associated diarrhea with high morbidity and mortality.N Engl J Med.2005;353:2442–2449.
- ,,.Antimicrobial therapy of Clostridium difficile‐associated diarrhea.Med Clin North Am.2006;90(6):1141–1163.
- ,,,,.Patterns of antibiotic use and risk of hospital admission because of Clostridium difficile.Can Med Assoc J.2008;179(8):767–772.
- ,,, et al.Emergence of fluoroquinolones as the predominant risk factor for Clostridium difficile‐associated diarrhea: a cohort study during an epidemic in Quebec.Clin Infect Dis.2005;41(9):1254–1260.
- .Clostridium difficile and the disease it causes.Methods Mol Biol.2010;646:9–35.
- ,,.Treatment of Clostridium difficile‐associated disease: old therapies and new.Lancet Infect Dis.2005;5(9):549–557.
- , , , et al. Prospective derviation and validation of a clinical prediction rule for recurrent Clostridium difficile infection. Gastroenterology. 2009;136:1206–1214.
- ,,, et al.A randomized placebo‐controlled trial of Saccharomyces boulardii in combination with standard antibiotics for Clostridium difficile disease.JAMA.1994;271(24):1913–1918.
- ,,.Breaking the cycle: treatment strategies for 163 cases of recurrent Clostridium difficile disease.Am J Gastroenterol.2002;97(7):1769–1775.
- .Recurrent Clostridium difficile infection: a review of risk factors, treatments, and outcomes.J Infect.2009;58(6):403–410.
- ,.Clostridium difficile: recent epidemiologic findings and advances in therapy.Pharmacotherapy.2007;27(7):1029–1039.
- ,,, et al.Risk factors for early recurrent Clostridium difficile‐associated diarrheas.Clin Infect Dis.1998;26(4):954–959.
- ,,,.Association between antibody response to toxin A and protection against recurrent Clostridium difficile diarrhoea.Lancet.2001;357(9251):189–193.
- ,,,,,.Randomized clinical trial in Clostridium difficile infection confirms superiority of fidaxomicin over vancomycin [abstract 828630]. Presented at: Digestive Disease Week 2010; May 4,2010; New Orleans, LA.
- ,,,.Recurrence of symptoms in Clostridium difficile infection—relapse or reinfection?J Hosp Infect.1998;38(2):93–100.
- ,.Clostridium difficile‐associated disease: new challenges from an established pathogen.Cleve Clin J Med.2006;73(2):187–197.
- ,,,.A comparison of vancomycin and metronidazole for the treatment of Clostridium difficile–associated diarrhea, stratified by disease severity.Clin Infect Dis.2007;45(3):302–307.
- ,,, et al.Clostridium difficile–associated diarrhea in a region of Quebec from 1991 to 2003: a changing pattern of disease severity.Can Med Assoc J.2004;171(5):466–472.
- ,.Clinical recognition and diagnosis of Clostridium difficile infection.Clin Infect Dis.2008;46(suppl 1):S12–S18.
- ,,,.Clinical risk factors for severe Clostridium difficile‐associated disease.Emerg Infect Dis.2009;15(3):415–422.
- ,,.European Society of Clinical Microbiology and Infectious Diseases (ESCMID): treatment guidance document for Clostridium difficile infection (CDI).Clin Microbiol Infect.2009;15(12):1067–1079.
- ,,, et al.Prospective randomised trial of metronidazole versus vancomycin for Clostridium difficile–associated diarrhoea and colitis.Lancet.1983;2(8358):1043–1046.
- ,,.Adjunctive intracolonic vancomycin for severe Clostridium difficile colitis: case series and review of the literature.Clin Infect Dis.2002;35(6):690–696.
- United States Food and Drug Administration. FDA approves treatment for Clostridium difficile infection. Available at: www.fda.gov/NewsEvents/Newsroom/PressAnnouncements/ucm257024.htm. Last updated: May, 27, 2011. Accessed June 15,2011.
- ,,, et al.Efficacy and safety of fidaxomicin (FDX) vs. vancomycin (VAN) in Clostridium difficile infection (CDI) in 2 randomized controlled trials (RCT) with 1105 patients [abstract 1417]. Presented at: The 48th Annual IDSA Meeting; October 21–24,2010; Vancouver, BC, Canada.
- Dificid [package insert].San Diego, CA:Optimer Pharmaceuticals, Inc;2011.
- ,,, et al.Fidaxomicin versus vancomycin for Clostridium difficile infection.N Engl J Med.2011;364(5):422–431.
- ,,, et al.A new macrocyclic antibiotic, fidaxomicin (OPT‐80), causes less alteration to the bowel microbiota of Clostridium difficile‐infected patients than does vancomycin.Microbiology.2010;156(pt 11):3354–3359.
- ,,,.Intravenous immunoglobulin for the treatment of severe Clostridium difficile colitis: an observational study and review of the literature.J Hosp Med.2010;5(1):E1–E9.
- ,,, et al.Treatment with monoclonal antibodies against Clostridium difficile toxins.N Engl J Med.2010;362(3):197–205.
- ,.Surgical aspects of fulminant Clostridium difficile colitis.Am J Surg.2010;200(1):131–135.
- ,,, et al.Clostridium difficile colitis in the critically ill.Dis Colon Rectum.1996;39(6):619–623.
- ,,.Early surgical intervention for fulminant pseudomembranous colitis.Am Surg.74(1):20–26.
Meeting the Challenge of Recurrent CDI
As noted elsewhere in this supplement, recent studies show a high rate of recurrent Clostridium difficile infection (CDI) despite the availability of evidence‐based guidelines for CDI treatment. 1, 2 Treatment with vancomycin has been associated with recurrence in 25% or more of patients. The risk for recurrence increases with each episode, and is greater than 60% in patients with more than 2 episodes. 1, 3, 4 Identification of patients at risk for recurrence is critical to early diagnosis and prompt treatment. 5 Because recurrent CDI is so widespread, it should be common practice to educate patients about this complication, including:
-
The risk for continued exposure to C. difficile in the hospital or home environment and strategies for appropriate hygiene to minimize reinfection.
-
When to contact a healthcare professional for recurrent symptoms. 1
CASE STUDY CONTINUED
In the previous article in this supplement, a case study for patient A.L. was presented. A.L. is an 87‐year‐old woman who developed initial inpatient CDI in a rehabilitation facility. She was empirically started on oral metronidazole, 500 mg 3 times a day. Her symptoms improved but she became febrile with an elevated white blood cell (WBC) count. She was transferred to an acute care facility where her treatment was switched to oral vancomycin 125 mg 4 times daily. A proctoscopic exam confirmed pseudomembranous colitis, and her treatment regimen was increased to oral vancomycin 500 mg 4 times daily plus intravenous (IV) metronidazole 500 mg every 8 hours. The CDI responded to therapy and she was discharged to home care.
Ten days after her hospital discharge, A.L. noted a change in the character of her stools, which became looser and increased in frequency, accompanied by a foul odor that she recalls was present during her previous episode. The following day, she developed frank watery stools occurring every 1‐2 hours and had 2 incontinent episodes. Her family brought her to the emergency department because she was also light‐headed, confused, and had increased abdominal cramping. Intravenous fluid resuscitation was started, along with oral vancomycin, 125 mg every 6 hours for 14 days, followed by a vancomycin taper and pulse, which consisted of 125 mg twice daily for 7 days, once daily for 7 days, once every other day for 7 days, then every third day. Stool was sent to the lab for C. difficile testing in the middle of the taper regimen. The result was negative. Ten days after tapering the oral vancomycin regimen to every third day, she developed loose stools with the same odor, followed by increased frequency and frank watery stools.
This case illustrates several aspects of recurrent CDI. First, the recurrent episode may be severe, as evidenced by the need for IV fluid resuscitation in addition to specific anti‐C. difficile treatment. Second, although the patient was treated appropriately with standard 4 times daily vancomycin followed by a taper, subsequent recurrences may still occur, usually near the end of the taper/pulse (as in this case) or shortly after finishing the regimen. Finally, test of cure stool testing (either toxin testing, culture, or polymerase chain reaction [PCR]) may be misleading and is NOT recommended for managing recurrent CDI. Although subsequent management of this case was not addressed, repeating the standard vancomycin regimen, followed again by a taper/pulse would be a realistic option, as vancomycin resistance in C. difficile has not been reported and the patient would be expected to respond. Other management options should also be considered and are discussed below.
SHEA/IDSA RECOMMENDATIONS
There is no strong evidence to support a particular treatment strategy for recurrent CDI. 5 The Society for Healthcare Epidemiology of America/Infectious Diseases Society of America (SHEA/IDSA) guidelines 6 recommends the following:
-
When severe or complicated CDI is suspected, initiate empiric treatment as soon as the diagnosis is suspected (C‐III).
-
Treatment of the first recurrence is usually with the same regimen as for the initial episode (A‐II), but should be stratified by disease severity (C‐III).
-
Do not use metronidazole beyond first recurrence or for long‐term chronic therapy (B‐II).
-
Treatment of second or later recurrences with vancomycin using a taper and/or pulse regimen is the preferred next strategy (B‐III).
-
No recommendations can be made regarding prevention of recurrent CDI in patients requiring continued antimicrobial therapy (C‐III).
The vancomycin taper/pulse regimen is one of the most widely used regimens for treatment of recurrent CDI. 5 A tapered oral vancomycin regimen consists of a stepwise decrease in dose over a period of time. Intermittent or pulsed vancomycin therapy consists of administering the drug every few days.
A standard course of antibiotic therapy eradicates vegetative cells of C. difficile, but is not effective against spores. Administering antibiotics over an extended time period at decreasing doses (tapered regimen) or intermittent delivery (pulsed regimen) gradually clears C. difficile by eradicating cells as the spores germinate. 5 Thus, a taper/pulse regimen of vancomycin, in theory, leads to a decreased rate of recurrence and may aid restoration of the normal microflora. 5
Evidence for efficacy of the tapered dosage regimen is based on a post hoc analysis of patients treated for recurrence in 2 trials of probiotic treatment with Saccharomyces boulardii. When standard‐dose oral vancomycin (125 mg 4 times daily) was compared with high‐dose vancomycin (500 mg twice daily for 7 to 14 days), recurrence rates were not statistically different. However, a tapered regimen of vancomycin resulted in significantly fewer recurrences (31%, P = 0.01), as did a pulsed dose of vancomycin (14.3%, P = 0.02). 4 One empiric pulsed‐dose regimen consists of oral vancomycin, 125 mg every 6 hours for 14 days, followed by tapering to 125 mg every 12 hours for 7 days, then 125 mg once daily for another 7 days, followed in turn by pulse‐dosed vancomycin (125 mg once every 2 days for 4 doses, then once every 3 days for 5 doses, or longer). 1 Prolonged courses of metronidazole are not recommended because of potential adverse effects, including peripheral neuropathy. 1
Management of patients with multiple recurrences of CDI is difficult, and no regimens are supported by adequate clinical evidence. 5 Various strategies have been tried, including probiotics, antibiotics, toxin binders, and immune‐based treatments. 1 The strategy behind use of probiotics is to augment colonization resistance. The probiotic S. boulardii, 1 g daily for 4 weeks, decreased recurrence compared with placebo in a small study of 60 patients when given during and after standard treatment (ie, metronidazole or vancomycin). In patients receiving high‐dose vancomycin plus S. boulardii, 3 of 18 (16.7%) had a recurrence compared with 7 of 14 (50%) receiving high‐dose vancomycin plus placebo (P = 0.05). 7 However, a larger follow‐up study did not show a significant overall benefit of S. boulardii over placebo. 1, 7 In addition, there have been a few case reports of systemic infections in immunocompromised patients treated with probiotics. 8 Overall, the results of studies with probiotics, including Lactobacilli, have been inconsistent.
Another approach to restoring a normal gastrointestinal microflora is fecal transplantation, where a small amount of fresh feces from a healthy donor (ideally someone who lives with the patient), is suspended in saline, filtered, and administered through a nasogastric tube, by colonoscope, or by enema. In a recent case series of 18 patients, this approach showed a 94% success rate. 9
Another potential strategy to prevent recurrence is to block colonization of pathogenic C. difficile strains by administration of nontoxigenic and nonpathogenic strains of C. difficile. Researchers have identified a nontoxigenic strain that is being developed as a targeted biotherapeutic probiotic for human use. 1 Because patients with recurrent CDI lack a strong immune response to C. difficile toxins, IV immunoglobulin (IVIG) has been used empirically to provide passive immunotherapy. It has shown benefit in some case series of patients with multiple recurrences. 1, 10, 11
Other antibiotics have also been investigated in conjunction with vancomycin for recurrent infection. Rifaximin has good in vitro activity against C. difficile, and is not absorbed from the gastrointestinal tract. Oral rifaximin, 400 to 800 mg daily for 14 days following discontinuation of vancomycin, was shown to prevent further recurrence in 7 of 8 patients with a history of 4 to 8 CDI recurrences. 1, 12 It is important to note that rifaximin resistance has been reported in clinical isolates of C. difficile, and may be more common than initially thought, particularly among epidemic strains. 13
Fidaxomicin, a narrow‐spectrum macrocyclic antibiotic, was also compared with vancomycin in 2 multicenter, randomized, double‐blind Phase 3 clinical trials of 1105 adults with confirmed CDI. 14 Patients were treated with either oral fidaxomicin (200 mg every 12 hours) or oral vancomycin (125 mg every 6 hours) for 10 days. 15, 16 The clinical cure rate with fidaxomicin was comparable to vancomycin in both studies. 14 In the more recent study, 59.8% of subjects (N = 535) were receiving concomitant antibiotics during CDI treatment; among this group, treatment with fidaxomicin was associated with a significantly lower recurrence rate than treatment with vancomycin (17.6% vs 29.5%, P = 0.027). 15 In addition, there was a sustained clinical response. Global cure, also a secondary endpoint, was defined as patients who were cured and did not have a recurrence during a subsequent 4‐week period, compared with treatment with vancomycin (67.5% vs 53.4%, P = 0.020). 15 These results confirm the findings from the first fidaxomicin Phase 3 study 16 and suggest that even when concomitant antibiotics are administered, fidaxomicin may be more effective than vancomycin in preventing CDI recurrence.
SUMMARY
Because hospitalists take a leadership role and often coordinate care for patients with CDI, they can take an active role to ensure that clinicians are aware of evidence‐based treatments for recurrent CDI, and the importance of routine follow‐up and persistence. The most important considerations in managing patients with recurrent CDI are to:
-
Continue to try new or previous approaches, beginning with those that are evidence‐based, followed by options that have been shown to work but are not backed by strong clinical evidence.
-
Provide consistent follow‐up and ongoing support.
-
Be sympatheticbecause this condition has significant detrimental impact on quality of life.
- . A 76‐year‐old man with recurrent Clostridium difficile‐associated diarrhea: review of C difficile infection. JAMA. 2009;301(9):954–962.
- . Clostridium difficile and the disease it causes. Methods Mol Biol. 2010;646:9–35.
- , , , et al. A randomized placebo‐controlled trial of Saccharomyces boulardii in combination with standard antibiotics for Clostridium difficile disease. JAMA. 1994;271(24):1913–1918.
- , , . Breaking the cycle: treatment strategies for 163 cases of recurrent Clostridium difficile disease. Am J Gastroenterol. 2002;97(7):1769–1775.
- . Recurrent Clostridium difficile infection: a review of risk factors, treatments, and outcomes. J Infect. 2009;58(6):403–410.
- , , , et al. Clinical practice guidelines for Clostridium difficile infection in adults: 2010 update by the Society for Healthcare Epidemiology of America (SHEA) and the Infectious Diseases Society of America (IDSA). Infect Control Hosp Epidemiol. 2010;31(5):431–455.
- , , , et al. The search for a better treatment for recurrent Clostridium difficile disease: use of high‐dose vancomycin combined with Saccharomyces boulardii. Clin Infect Dis. 2000;31(4):1012–1017.
- , , , et al. Saccharomyces cerevisiae fungemia after Saccharomyces boulardii treatment in immunocompromised patients. J Clin Gastroenterol. 2003;36(1):41–43.
- , , . Recurrent Clostridium difficile colitis: case series involving 18 patients treated with donor stool administered via a nasogastric tube. Clin Infect Dis. 2003;36(5):580–585.
- , , , et al. Treatment with intravenously administered gamma globulin of chronic relapsing colitis induced by Clostridium difficile toxin. J Pediatr. 1991;118(4 pt 1):633–637.
- . Descriptive study of intravenous immunoglobulin for the treatment of recurrent Clostridium difficile diarrhoea. J Antimicrob Chemother. 2004;53(5):882–884.
- , , , , . Interruption of recurrent Clostridium difficile‐associated diarrhea episodes by serial therapy with vancomycin and rifaximin. Clin Infect Dis. 2007;44(6):846–848.
- , , , et al. Rifampin and rifaximin resistance in clinical isolates of Clostridium difficile. Antimicrob Agents Chemother. 2008;52(8):2813–2817.
- , , , , , . Efficacy and safety of fidaxomicin (FDX) vs. vancomycin (VAN) in Clostridium difficile infection (CDI) in 2 randomized controlled trials (RCT) with 1105 patients [abstract 1417]. Presented at: The 48th Annual IDSA Meeting; October 21–24, 2010; Vancouver, BC, Canada.
- , , , , , . Randomized clinical trial in Clostridium difficile infection confirms superiority of fidaxomicin over vancomycin [abstract 828630]. Presented at: Digestive Disease Week 2010; May 4, 2010; New Orleans, LA.
- , , , et al for the OPT‐80–003 Clinical Study Group. Fidaxomicin versus vancomycin for Clostridium difficile infection. N Engl J Med. 2011;364(5):422–431.
As noted elsewhere in this supplement, recent studies show a high rate of recurrent Clostridium difficile infection (CDI) despite the availability of evidence‐based guidelines for CDI treatment. 1, 2 Treatment with vancomycin has been associated with recurrence in 25% or more of patients. The risk for recurrence increases with each episode, and is greater than 60% in patients with more than 2 episodes. 1, 3, 4 Identification of patients at risk for recurrence is critical to early diagnosis and prompt treatment. 5 Because recurrent CDI is so widespread, it should be common practice to educate patients about this complication, including:
-
The risk for continued exposure to C. difficile in the hospital or home environment and strategies for appropriate hygiene to minimize reinfection.
-
When to contact a healthcare professional for recurrent symptoms. 1
CASE STUDY CONTINUED
In the previous article in this supplement, a case study for patient A.L. was presented. A.L. is an 87‐year‐old woman who developed initial inpatient CDI in a rehabilitation facility. She was empirically started on oral metronidazole, 500 mg 3 times a day. Her symptoms improved but she became febrile with an elevated white blood cell (WBC) count. She was transferred to an acute care facility where her treatment was switched to oral vancomycin 125 mg 4 times daily. A proctoscopic exam confirmed pseudomembranous colitis, and her treatment regimen was increased to oral vancomycin 500 mg 4 times daily plus intravenous (IV) metronidazole 500 mg every 8 hours. The CDI responded to therapy and she was discharged to home care.
Ten days after her hospital discharge, A.L. noted a change in the character of her stools, which became looser and increased in frequency, accompanied by a foul odor that she recalls was present during her previous episode. The following day, she developed frank watery stools occurring every 1‐2 hours and had 2 incontinent episodes. Her family brought her to the emergency department because she was also light‐headed, confused, and had increased abdominal cramping. Intravenous fluid resuscitation was started, along with oral vancomycin, 125 mg every 6 hours for 14 days, followed by a vancomycin taper and pulse, which consisted of 125 mg twice daily for 7 days, once daily for 7 days, once every other day for 7 days, then every third day. Stool was sent to the lab for C. difficile testing in the middle of the taper regimen. The result was negative. Ten days after tapering the oral vancomycin regimen to every third day, she developed loose stools with the same odor, followed by increased frequency and frank watery stools.
This case illustrates several aspects of recurrent CDI. First, the recurrent episode may be severe, as evidenced by the need for IV fluid resuscitation in addition to specific anti‐C. difficile treatment. Second, although the patient was treated appropriately with standard 4 times daily vancomycin followed by a taper, subsequent recurrences may still occur, usually near the end of the taper/pulse (as in this case) or shortly after finishing the regimen. Finally, test of cure stool testing (either toxin testing, culture, or polymerase chain reaction [PCR]) may be misleading and is NOT recommended for managing recurrent CDI. Although subsequent management of this case was not addressed, repeating the standard vancomycin regimen, followed again by a taper/pulse would be a realistic option, as vancomycin resistance in C. difficile has not been reported and the patient would be expected to respond. Other management options should also be considered and are discussed below.
SHEA/IDSA RECOMMENDATIONS
There is no strong evidence to support a particular treatment strategy for recurrent CDI. 5 The Society for Healthcare Epidemiology of America/Infectious Diseases Society of America (SHEA/IDSA) guidelines 6 recommends the following:
-
When severe or complicated CDI is suspected, initiate empiric treatment as soon as the diagnosis is suspected (C‐III).
-
Treatment of the first recurrence is usually with the same regimen as for the initial episode (A‐II), but should be stratified by disease severity (C‐III).
-
Do not use metronidazole beyond first recurrence or for long‐term chronic therapy (B‐II).
-
Treatment of second or later recurrences with vancomycin using a taper and/or pulse regimen is the preferred next strategy (B‐III).
-
No recommendations can be made regarding prevention of recurrent CDI in patients requiring continued antimicrobial therapy (C‐III).
The vancomycin taper/pulse regimen is one of the most widely used regimens for treatment of recurrent CDI. 5 A tapered oral vancomycin regimen consists of a stepwise decrease in dose over a period of time. Intermittent or pulsed vancomycin therapy consists of administering the drug every few days.
A standard course of antibiotic therapy eradicates vegetative cells of C. difficile, but is not effective against spores. Administering antibiotics over an extended time period at decreasing doses (tapered regimen) or intermittent delivery (pulsed regimen) gradually clears C. difficile by eradicating cells as the spores germinate. 5 Thus, a taper/pulse regimen of vancomycin, in theory, leads to a decreased rate of recurrence and may aid restoration of the normal microflora. 5
Evidence for efficacy of the tapered dosage regimen is based on a post hoc analysis of patients treated for recurrence in 2 trials of probiotic treatment with Saccharomyces boulardii. When standard‐dose oral vancomycin (125 mg 4 times daily) was compared with high‐dose vancomycin (500 mg twice daily for 7 to 14 days), recurrence rates were not statistically different. However, a tapered regimen of vancomycin resulted in significantly fewer recurrences (31%, P = 0.01), as did a pulsed dose of vancomycin (14.3%, P = 0.02). 4 One empiric pulsed‐dose regimen consists of oral vancomycin, 125 mg every 6 hours for 14 days, followed by tapering to 125 mg every 12 hours for 7 days, then 125 mg once daily for another 7 days, followed in turn by pulse‐dosed vancomycin (125 mg once every 2 days for 4 doses, then once every 3 days for 5 doses, or longer). 1 Prolonged courses of metronidazole are not recommended because of potential adverse effects, including peripheral neuropathy. 1
Management of patients with multiple recurrences of CDI is difficult, and no regimens are supported by adequate clinical evidence. 5 Various strategies have been tried, including probiotics, antibiotics, toxin binders, and immune‐based treatments. 1 The strategy behind use of probiotics is to augment colonization resistance. The probiotic S. boulardii, 1 g daily for 4 weeks, decreased recurrence compared with placebo in a small study of 60 patients when given during and after standard treatment (ie, metronidazole or vancomycin). In patients receiving high‐dose vancomycin plus S. boulardii, 3 of 18 (16.7%) had a recurrence compared with 7 of 14 (50%) receiving high‐dose vancomycin plus placebo (P = 0.05). 7 However, a larger follow‐up study did not show a significant overall benefit of S. boulardii over placebo. 1, 7 In addition, there have been a few case reports of systemic infections in immunocompromised patients treated with probiotics. 8 Overall, the results of studies with probiotics, including Lactobacilli, have been inconsistent.
Another approach to restoring a normal gastrointestinal microflora is fecal transplantation, where a small amount of fresh feces from a healthy donor (ideally someone who lives with the patient), is suspended in saline, filtered, and administered through a nasogastric tube, by colonoscope, or by enema. In a recent case series of 18 patients, this approach showed a 94% success rate. 9
Another potential strategy to prevent recurrence is to block colonization of pathogenic C. difficile strains by administration of nontoxigenic and nonpathogenic strains of C. difficile. Researchers have identified a nontoxigenic strain that is being developed as a targeted biotherapeutic probiotic for human use. 1 Because patients with recurrent CDI lack a strong immune response to C. difficile toxins, IV immunoglobulin (IVIG) has been used empirically to provide passive immunotherapy. It has shown benefit in some case series of patients with multiple recurrences. 1, 10, 11
Other antibiotics have also been investigated in conjunction with vancomycin for recurrent infection. Rifaximin has good in vitro activity against C. difficile, and is not absorbed from the gastrointestinal tract. Oral rifaximin, 400 to 800 mg daily for 14 days following discontinuation of vancomycin, was shown to prevent further recurrence in 7 of 8 patients with a history of 4 to 8 CDI recurrences. 1, 12 It is important to note that rifaximin resistance has been reported in clinical isolates of C. difficile, and may be more common than initially thought, particularly among epidemic strains. 13
Fidaxomicin, a narrow‐spectrum macrocyclic antibiotic, was also compared with vancomycin in 2 multicenter, randomized, double‐blind Phase 3 clinical trials of 1105 adults with confirmed CDI. 14 Patients were treated with either oral fidaxomicin (200 mg every 12 hours) or oral vancomycin (125 mg every 6 hours) for 10 days. 15, 16 The clinical cure rate with fidaxomicin was comparable to vancomycin in both studies. 14 In the more recent study, 59.8% of subjects (N = 535) were receiving concomitant antibiotics during CDI treatment; among this group, treatment with fidaxomicin was associated with a significantly lower recurrence rate than treatment with vancomycin (17.6% vs 29.5%, P = 0.027). 15 In addition, there was a sustained clinical response. Global cure, also a secondary endpoint, was defined as patients who were cured and did not have a recurrence during a subsequent 4‐week period, compared with treatment with vancomycin (67.5% vs 53.4%, P = 0.020). 15 These results confirm the findings from the first fidaxomicin Phase 3 study 16 and suggest that even when concomitant antibiotics are administered, fidaxomicin may be more effective than vancomycin in preventing CDI recurrence.
SUMMARY
Because hospitalists take a leadership role and often coordinate care for patients with CDI, they can take an active role to ensure that clinicians are aware of evidence‐based treatments for recurrent CDI, and the importance of routine follow‐up and persistence. The most important considerations in managing patients with recurrent CDI are to:
-
Continue to try new or previous approaches, beginning with those that are evidence‐based, followed by options that have been shown to work but are not backed by strong clinical evidence.
-
Provide consistent follow‐up and ongoing support.
-
Be sympatheticbecause this condition has significant detrimental impact on quality of life.
- . A 76‐year‐old man with recurrent Clostridium difficile‐associated diarrhea: review of C difficile infection. JAMA. 2009;301(9):954–962.
- . Clostridium difficile and the disease it causes. Methods Mol Biol. 2010;646:9–35.
- , , , et al. A randomized placebo‐controlled trial of Saccharomyces boulardii in combination with standard antibiotics for Clostridium difficile disease. JAMA. 1994;271(24):1913–1918.
- , , . Breaking the cycle: treatment strategies for 163 cases of recurrent Clostridium difficile disease. Am J Gastroenterol. 2002;97(7):1769–1775.
- . Recurrent Clostridium difficile infection: a review of risk factors, treatments, and outcomes. J Infect. 2009;58(6):403–410.
- , , , et al. Clinical practice guidelines for Clostridium difficile infection in adults: 2010 update by the Society for Healthcare Epidemiology of America (SHEA) and the Infectious Diseases Society of America (IDSA). Infect Control Hosp Epidemiol. 2010;31(5):431–455.
- , , , et al. The search for a better treatment for recurrent Clostridium difficile disease: use of high‐dose vancomycin combined with Saccharomyces boulardii. Clin Infect Dis. 2000;31(4):1012–1017.
- , , , et al. Saccharomyces cerevisiae fungemia after Saccharomyces boulardii treatment in immunocompromised patients. J Clin Gastroenterol. 2003;36(1):41–43.
- , , . Recurrent Clostridium difficile colitis: case series involving 18 patients treated with donor stool administered via a nasogastric tube. Clin Infect Dis. 2003;36(5):580–585.
- , , , et al. Treatment with intravenously administered gamma globulin of chronic relapsing colitis induced by Clostridium difficile toxin. J Pediatr. 1991;118(4 pt 1):633–637.
- . Descriptive study of intravenous immunoglobulin for the treatment of recurrent Clostridium difficile diarrhoea. J Antimicrob Chemother. 2004;53(5):882–884.
- , , , , . Interruption of recurrent Clostridium difficile‐associated diarrhea episodes by serial therapy with vancomycin and rifaximin. Clin Infect Dis. 2007;44(6):846–848.
- , , , et al. Rifampin and rifaximin resistance in clinical isolates of Clostridium difficile. Antimicrob Agents Chemother. 2008;52(8):2813–2817.
- , , , , , . Efficacy and safety of fidaxomicin (FDX) vs. vancomycin (VAN) in Clostridium difficile infection (CDI) in 2 randomized controlled trials (RCT) with 1105 patients [abstract 1417]. Presented at: The 48th Annual IDSA Meeting; October 21–24, 2010; Vancouver, BC, Canada.
- , , , , , . Randomized clinical trial in Clostridium difficile infection confirms superiority of fidaxomicin over vancomycin [abstract 828630]. Presented at: Digestive Disease Week 2010; May 4, 2010; New Orleans, LA.
- , , , et al for the OPT‐80–003 Clinical Study Group. Fidaxomicin versus vancomycin for Clostridium difficile infection. N Engl J Med. 2011;364(5):422–431.
Strategies for Prevention of CDI
Infection control is a critical component of an overall management strategy for Clostridium difficile infection (CDI). In fact, preventing patients from acquiring this nosocomial condition in the healthcare setting has been identified as the most essential component.1 In 2008, the Society for Healthcare Epidemiology of America/Infectious Diseases Society of America (SHEA/IDSA) published a compendium of strategies to prevent healthcare‐associated infections, including CDI. This guideline includes graded recommendations and provides helpful strategies for applying them in a healthcare facility. An effective and comprehensive preventive program to reduce the incidence and impact of CDI requires several key components:2
-
Communication of responsibilities and accountability.
-
Application of special recommendations if the incidence of CDI is not adequately controlled with the basic recommendations (Table 2).2
| Recommendation | Grade* |
|---|---|
| |
| Contact precautions for patients with CDI until 48 hr after diarrhea resolves | A‐I for gloves |
| A‐II for hand hygiene | |
| B‐III for gowns | |
| B‐III for single‐patient room | |
| Ensure adequate disinfection of equipment and environment | B‐II for environment |
| B‐III for equipment | |
| Laboratory‐based alert system to notify clinical and infection prevention and control personnel if patient diagnosed with CDI | B‐III for alert system |
| Conduct CDI surveillance and feedback data to units and hospital administrators | B‐III for CDI surveillance |
| Educate healthcare personnel, housekeeping personnel, and hospital administration about CDI | B‐III for hospital staff education |
| Educate patients and their families about CDI, as appropriate | B‐III for patient education |
| Measure hand hygiene and contact precaution compliance | B‐III for monitoring compliance |
| Recommendations | Grade* |
|---|---|
| |
| Initiate an antimicrobial stewardship program | A‐II |
| Use diluted sodium hypochlorite for environmental disinfection if current practices deemed adequate | B‐II |
| Intensify efforts at hand hygiene and contact precaution compliance | B‐III |
| Preferentially use soap and water when performing hand hygiene after caring for a patient with CDI | B‐III |
| Place patients in contact precautions while C. difficile testing is pending | B‐III |
| Prolong contact precautions until discharge | B‐III |
| Assess the adequacy of room cleaning | B‐III |
Many healthcare providers are involved in patient care, and therefore each of these departmentsincluding administration, the medical staff, the infection control department, nursing, pharmacy, the clinical laboratory, and environmental controlmust be supportive of, and accountable for, implementing strategies to prevent CDI. Hospital administration must ensure that nursing, environmental services, and infection prevention and control have adequate support. The department of infection prevention and control should take the lead role in designing, implementing, and monitoring the CDI prevention program, including the education of hospital staff.
Clinical staff must comply with infection prevention and control policies, and have a high index of suspicion for rapid identification of patients with CDI, so they can be placed under contact precautions and started on treatment quickly. Nursing and physician leaders must hold personnel accountable for adhering to infection prevention and control policies. Finally, environmental services play a key role and must ensure that housekeeping personnel are appropriately trained and monitored to ensure they are following effective cleaning policies and procedures.
TRANSMISSION OF CDI
Healthcare workers are a primary mode of C. difficile transmission. C. difficile spores end up on multiple hospital surfaces and contaminate healthcare worker hands and medical devices (stethoscopes, thermometers, etc) used on multiple patients. One study found that after caring for a patient with CDI, 59% of healthcare workers had hand contamination regardless of whether or not they actually touched the patient.3 Many studies have shown that patients in adjacent rooms are at equal or higher risk of acquiring CDI as patients admitted to the same room.4, 5 Although a recent study found that admission to an intensive care unit room that previously housed a patient for CDI was a risk factor for developing CDI, 89% of patients who actually developed CDI did not have this risk factor.6 This indicates that most C. difficile acquisitions came from healthcare workers.
CONTACT PRECAUTIONS AND STRICT HAND HYGIENE ARE KEY
The combination of appropriate contact precautions and strict hand hygiene has been reported to reduce the incidence of CDI by as much as 80%.1, 7, 8 The CDI prevention recommendation with the strongest level of evidence is the donning of gloves when caring for a patient with CDI (Table 1).9
The optimal method of hand hygiene after caring for a patient with CDI is a matter of some confusion. Alcohol‐based hand sanitizers did not reduce the amount of C. difficile spores on the hands of volunteers contaminated with a known quantity of C. difficile spores.10 However, studies have not found an increase in CDI with use of alcohol‐based hand sanitizers or a decrease in CDI with use of soap and water.11 In addition, several of these studies have found the use of alcohol‐based hand hygiene products to be associated with decreases in methicillin‐resistant Staphylococcus aureus or vancomycin‐resistant enterococcus. For these reasons, in non‐outbreak settings, hand hygiene with alcohol‐based hand sanitizers, in addition to wearing gloves as a component of contact precautions, is considered an acceptable method of hand hygiene after caring for a patient with CDI.11 In outbreak settings, however, preferential use of soap and water is recommended after caring for a patient with CDI because of the theoretical increase in risk of C. difficile transmission based on the volunteer hand contamination studies.2, 11, 12
DISINFECTION OF EQUIPMENT AND ENVIRONMENT
Environmental services staff must be educated about the incidence, transmission of, and impact of CDI, as well as strategies effective for C. difficile spores, which are resistant to standard cleaning products and may persist in patient rooms for many months.1 During CDI outbreaks, rooms should be cleaned with a chlorine‐based disinfectant (either an Environmental Protection Agency‐approved disinfectant with known sporicidal activity or a 1:10 dilution of household bleach), which rapidly destroys C. difficile spores.1 The sporicidal solution should have a contact time of at least 10 minutes.2 Efforts to control spores in the environment and prevent transmission are even more important considering recent data demonstrating that hypervirulent C. difficile strains may have increased sporulation, which in combination with increased toxin production, pose a major management challenge.13 Identification and removal of other sources of C. difficile, including replacement of electronic rectal thermometers with disposable thermometers, can also reduce the incidence of CDI.12
ANTIMICROBIAL STEWARDSHIP AND RESTRICTION
Interventions to ensure appropriate use of antibiotics, including antimicrobial stewardship programs and antibiotic restriction programs, are also effective. A study during an outbreak of a hypervirulent strain of C. difficile showed that an antimicrobial stewardship program reduced the incidence of CDI by 60%.14 In this study, the antimicrobial stewardship program focused on shifting antimicrobial selection to antimicrobials that were associated with a lower risk of CDI at their institution whenever possible. Reducing unnecessary antimicrobial use was stressed as well. Formal restrictions were not instituted; rather, clinicians received education and pocket guides to assist in antimicrobial selection.
Several studies have found respiratory fluoroquinolones, such as gatifloxacin or moxifloxacin, to be associated with the highest risk of CDI during outbreaks due to the BI/NAP1/027 strain.15, 16 Interestingly, this antimicrobial stewardship program recommended respiratory fluoroquinolones over cephalosporins for community‐acquired pneumonia, as cephalosporins historically have been strongly associated with CDI. Nevertheless, the incidence of CDI decreased after initiation of the antimicrobial stewardship program, despite increased use of respiratory fluoroquinolones. The antimicrobial stewardship program was implemented prior to the identification of the fluoroquinolone‐resistant epidemic strain. This shows that herd protection against CDI can occur by improvements in overall antimicrobial prescribing practices by decreasing the total number of patients at risk for CDI. This, in turn, will decrease the number of patients who develop CDI and contribute to the spread of C. difficile. In addition to using education to improve antimicrobial prescribing, several studies have found that restriction of specific antimicrobials associated with CDI (for example, clindamycin or fluoroquinolones) can result in a decrease in CDI.1, 1720
INSIGHTS ABOUT OPPORTUNITIES FOR IMPROVEMENT
Results of a recent point prevalence survey conducted by the Association for Professionals in Infection Control and Epidemiology, Inc (APIC) provide important insights into knowledge and clinical practice gaps related to early diagnosis and prevention of CDI.21 More than 12,000 APIC members were asked to provide a 1‐day snapshot of patients identified with CDI or colonization at their institutions. Responses from 648 (12.5%) acute care hospitals in the United States, representing 47 states, indicate a clear need to improve infection control practices.21 The following recommendations are based on recent evidence:
-
Patients should be placed in contact isolation at the first suspicion of CDI, and kept in isolation for up to 2 days after diarrhea resolves because contamination persists in the environment that long.2 Of note, this differs from the SHEA/IDSA Clinical Practice Guidelines for Clostridium difficile Infection in Adults, which state: Maintain contact precautions for the duration of diarrhea.12 The Centers for Disease Control and Prevention (CDC) currently recommends contact precautions for the duration of illness when caring for patients with CDI.22
-
Bleach solution should be used for routine and terminal cleaning during CDI outbreaks, as recommended by SHEA/IDSA and the CDC.
-
Hand washing with soap and water is more effective than alcohol‐based hand sanitizers for removal of spores. However, appropriate donning and removal of gloves prevents hand contamination with C. difficile spores, likely explaining why hand washing with soap and water has not been associated with a decrease in CDI compared with alcohol‐based products.
-
A formal program to educate environmental services personnel should be implemented to ensure they understand their critical role on the infection control team and effective strategies for cleaning.
SPECIAL APPROACHES
When basic approaches are not effective to reduce the incidence of CDI, the SHEA has recommendations for special approaches, which should be implemented as appropriate for each institution (summarized in Table 2).2 Strategies for prevention of CDI are also available from the CDC and the Institute for Healthcare Improvement (IHI).23, 24
SUMMARY
Effective management and prevention of CDI requires a multidisciplinary approach that includes leaders in hospital administration, clinicians, the infection control department, nursing, pharmacy, and the clinical laboratory, as well as environmental services. All of these professionals must be accountable and take an active role in implementing and complying with evidence‐based strategies to ensure that patients at risk are identified early and managed appropriately, and that effective strategies for prevention are in place. Hospitalists, as front‐line caregivers, physician leaders in their hospitals, and coordinators of patient care, can play a key role in these regards. Care when deciding when and which antimicrobial to use to treat non‐CDI infections; being attuned to symptoms that may be due to CDI, and prompt diagnosis and treatment of CDI; adhering to infection control policies; awareness of cleaning practices; and also being an active member of the infection control committee are all ways that hospitalists may take active roles in preventing CDI.
- ,.Clostridium difficile infection in the intensive care unit.Infect Dis Clin North Am.2009;23(3):727–743.
- ,,.Strategies to prevent Clostridium difficile infections in acute care hospitals.Infect Control Hosp Epidemiol.2008;29(suppl 1):S81–S92.
- ,,,.Nosocomial acquisition of Clostridium difficile infection.N Engl J Med.1989;320(4):204–210.
- ,,, et al.Acquisition of Clostridium difficile by hospitalized patients: evidence for colonized new admissions as a source of infection.J Infect Dis.1992;166:561–567.
- ,.The role of physical proximity in nosocomial diarrhea.Clin Infect Dis.2000;31(3):717–722.
- ,,, et al.Evaluation of hospital room assignment and acquisition of Clostridium difficile infection.Infect Control Hosp Epidemiol.2011;32(3):201–206.
- ,,,,.Effectiveness of infection control program in controlling nosocomial Clostridium difficile.Am J Infect Control.1998;26(6):588–593.
- ,,, et al.Control of an outbreak of infection with the hypervirulent Clostridium difficile BI strain in a university hospital using a comprehensive “bundle” approach.Clin Infect Dis.2007;45(10):1266–1273.
- ,,, et al.Epidemics of diarrhea caused by a clindamycin‐resistant strain of Clostridium difficile in four hospitals.N Engl J Med.1999;341(22):1645–1651.
- ,,,,.Hand hygiene with soap and water is superior to alcohol rub and antiseptic wipes for removal of Clostridium difficile.Infect Control Hosp Epidemiol.2009;30(10):939–944.
- ,,.Measures to control and prevent Clostridium difficile infection.Clin Infect Dis.2008;46(suppl 1):S43–S49.
- ,,, et al.Clinical practice guidelines for Clostridium difficile infection in adults: 2010 update by the Society for Healthcare Epidemiology of America (SHEA) and the Infectious Diseases Society of America (IDSA).Infect Control Hosp Epidemiol.2010;31(5):431–455.
- ,,, et al.Human hypervirulent Clostridium difficile strains exhibit increased sporulation as well as robust toxin production.J Bacteriol.2010;192(19):4904–4911.
- ,,,,.Impact of a reduction in the use of high‐risk antibiotics on the course of an epidemic of Clostridium difficile‐associated disease caused by the hypervirulent NAP1/027 strain.Clin Infect Dis.2007;45(suppl 2):S112–S121.
- ,,, et al.Emergence of fluoroquinolones as the predominant risk factor for Clostridium difficile‐associated diarrhea: a cohort study during an epidemic in Quebec, Canada.Clin Infect Dis.2005;41(9):1254–1260.
- ,,,, et al.A predominantly clonal multi‐institutional outbreak of Clostridium difficile‐associated diarrhea with high morbidity and mortality.N Engl J Med.2005;353:2442–2449.
- ,,, et al.Hospital‐wide restriction of clindamycin: effect on the incidence of Clostridium difficile‐associated diarrhea and cost.Ann Intern Med.1998;128:989–995.
- ,,, et al.Interventions to improve antibiotic prescribing practices for hospital inpatients.Cochrane Database Syst Rev.2005CD003543.
- ,.Impact of changes in antibiotic policy on Clostridium difficile‐associated diarrhoea (CDAD) over a five‐year period in a district general hospital.J Hosp Infect.2003;54:104–108.
- ,,, et al.Antibiotic prescribing policy and Clostridium difficile diarrhoea.Q J Med.2004;97:423–429.
- Association for Professionals in Infection Control and Epidemiology (APIC). Guide to the elimination of Clostridium difficile in healthcare settings. Available at: http://www.apic.org/Content/NavigationMenu/PracticeGuidance/APICEliminationGuides/C.diff_Elimination_guide_logo.pdf. Accessed August 9,2011.
- Centers for Disease Control and Prevention. Frequently asked questions about Clostridium difficile for healthcare providers. Available at: http://www.cdc.gov/HAI/organisms/cdiff/Cdiff_faqs_HCP.html. Accessed August 9,2011.
- Centers for Disease Control and Prevention. Information about the current strain of Clostridium difficile. Available at: http://www.cdc.gov/HAI/organisms/cdiff/Cdiff‐current‐strain.html. Accessed June 15,2011.
- Institute for Healthcare Improvement. Available at: http://www.ihi.org. Accessed July 26,2011.
Infection control is a critical component of an overall management strategy for Clostridium difficile infection (CDI). In fact, preventing patients from acquiring this nosocomial condition in the healthcare setting has been identified as the most essential component.1 In 2008, the Society for Healthcare Epidemiology of America/Infectious Diseases Society of America (SHEA/IDSA) published a compendium of strategies to prevent healthcare‐associated infections, including CDI. This guideline includes graded recommendations and provides helpful strategies for applying them in a healthcare facility. An effective and comprehensive preventive program to reduce the incidence and impact of CDI requires several key components:2
-
Communication of responsibilities and accountability.
-
Application of special recommendations if the incidence of CDI is not adequately controlled with the basic recommendations (Table 2).2
| Recommendation | Grade* |
|---|---|
| |
| Contact precautions for patients with CDI until 48 hr after diarrhea resolves | A‐I for gloves |
| A‐II for hand hygiene | |
| B‐III for gowns | |
| B‐III for single‐patient room | |
| Ensure adequate disinfection of equipment and environment | B‐II for environment |
| B‐III for equipment | |
| Laboratory‐based alert system to notify clinical and infection prevention and control personnel if patient diagnosed with CDI | B‐III for alert system |
| Conduct CDI surveillance and feedback data to units and hospital administrators | B‐III for CDI surveillance |
| Educate healthcare personnel, housekeeping personnel, and hospital administration about CDI | B‐III for hospital staff education |
| Educate patients and their families about CDI, as appropriate | B‐III for patient education |
| Measure hand hygiene and contact precaution compliance | B‐III for monitoring compliance |
| Recommendations | Grade* |
|---|---|
| |
| Initiate an antimicrobial stewardship program | A‐II |
| Use diluted sodium hypochlorite for environmental disinfection if current practices deemed adequate | B‐II |
| Intensify efforts at hand hygiene and contact precaution compliance | B‐III |
| Preferentially use soap and water when performing hand hygiene after caring for a patient with CDI | B‐III |
| Place patients in contact precautions while C. difficile testing is pending | B‐III |
| Prolong contact precautions until discharge | B‐III |
| Assess the adequacy of room cleaning | B‐III |
Many healthcare providers are involved in patient care, and therefore each of these departmentsincluding administration, the medical staff, the infection control department, nursing, pharmacy, the clinical laboratory, and environmental controlmust be supportive of, and accountable for, implementing strategies to prevent CDI. Hospital administration must ensure that nursing, environmental services, and infection prevention and control have adequate support. The department of infection prevention and control should take the lead role in designing, implementing, and monitoring the CDI prevention program, including the education of hospital staff.
Clinical staff must comply with infection prevention and control policies, and have a high index of suspicion for rapid identification of patients with CDI, so they can be placed under contact precautions and started on treatment quickly. Nursing and physician leaders must hold personnel accountable for adhering to infection prevention and control policies. Finally, environmental services play a key role and must ensure that housekeeping personnel are appropriately trained and monitored to ensure they are following effective cleaning policies and procedures.
TRANSMISSION OF CDI
Healthcare workers are a primary mode of C. difficile transmission. C. difficile spores end up on multiple hospital surfaces and contaminate healthcare worker hands and medical devices (stethoscopes, thermometers, etc) used on multiple patients. One study found that after caring for a patient with CDI, 59% of healthcare workers had hand contamination regardless of whether or not they actually touched the patient.3 Many studies have shown that patients in adjacent rooms are at equal or higher risk of acquiring CDI as patients admitted to the same room.4, 5 Although a recent study found that admission to an intensive care unit room that previously housed a patient for CDI was a risk factor for developing CDI, 89% of patients who actually developed CDI did not have this risk factor.6 This indicates that most C. difficile acquisitions came from healthcare workers.
CONTACT PRECAUTIONS AND STRICT HAND HYGIENE ARE KEY
The combination of appropriate contact precautions and strict hand hygiene has been reported to reduce the incidence of CDI by as much as 80%.1, 7, 8 The CDI prevention recommendation with the strongest level of evidence is the donning of gloves when caring for a patient with CDI (Table 1).9
The optimal method of hand hygiene after caring for a patient with CDI is a matter of some confusion. Alcohol‐based hand sanitizers did not reduce the amount of C. difficile spores on the hands of volunteers contaminated with a known quantity of C. difficile spores.10 However, studies have not found an increase in CDI with use of alcohol‐based hand sanitizers or a decrease in CDI with use of soap and water.11 In addition, several of these studies have found the use of alcohol‐based hand hygiene products to be associated with decreases in methicillin‐resistant Staphylococcus aureus or vancomycin‐resistant enterococcus. For these reasons, in non‐outbreak settings, hand hygiene with alcohol‐based hand sanitizers, in addition to wearing gloves as a component of contact precautions, is considered an acceptable method of hand hygiene after caring for a patient with CDI.11 In outbreak settings, however, preferential use of soap and water is recommended after caring for a patient with CDI because of the theoretical increase in risk of C. difficile transmission based on the volunteer hand contamination studies.2, 11, 12
DISINFECTION OF EQUIPMENT AND ENVIRONMENT
Environmental services staff must be educated about the incidence, transmission of, and impact of CDI, as well as strategies effective for C. difficile spores, which are resistant to standard cleaning products and may persist in patient rooms for many months.1 During CDI outbreaks, rooms should be cleaned with a chlorine‐based disinfectant (either an Environmental Protection Agency‐approved disinfectant with known sporicidal activity or a 1:10 dilution of household bleach), which rapidly destroys C. difficile spores.1 The sporicidal solution should have a contact time of at least 10 minutes.2 Efforts to control spores in the environment and prevent transmission are even more important considering recent data demonstrating that hypervirulent C. difficile strains may have increased sporulation, which in combination with increased toxin production, pose a major management challenge.13 Identification and removal of other sources of C. difficile, including replacement of electronic rectal thermometers with disposable thermometers, can also reduce the incidence of CDI.12
ANTIMICROBIAL STEWARDSHIP AND RESTRICTION
Interventions to ensure appropriate use of antibiotics, including antimicrobial stewardship programs and antibiotic restriction programs, are also effective. A study during an outbreak of a hypervirulent strain of C. difficile showed that an antimicrobial stewardship program reduced the incidence of CDI by 60%.14 In this study, the antimicrobial stewardship program focused on shifting antimicrobial selection to antimicrobials that were associated with a lower risk of CDI at their institution whenever possible. Reducing unnecessary antimicrobial use was stressed as well. Formal restrictions were not instituted; rather, clinicians received education and pocket guides to assist in antimicrobial selection.
Several studies have found respiratory fluoroquinolones, such as gatifloxacin or moxifloxacin, to be associated with the highest risk of CDI during outbreaks due to the BI/NAP1/027 strain.15, 16 Interestingly, this antimicrobial stewardship program recommended respiratory fluoroquinolones over cephalosporins for community‐acquired pneumonia, as cephalosporins historically have been strongly associated with CDI. Nevertheless, the incidence of CDI decreased after initiation of the antimicrobial stewardship program, despite increased use of respiratory fluoroquinolones. The antimicrobial stewardship program was implemented prior to the identification of the fluoroquinolone‐resistant epidemic strain. This shows that herd protection against CDI can occur by improvements in overall antimicrobial prescribing practices by decreasing the total number of patients at risk for CDI. This, in turn, will decrease the number of patients who develop CDI and contribute to the spread of C. difficile. In addition to using education to improve antimicrobial prescribing, several studies have found that restriction of specific antimicrobials associated with CDI (for example, clindamycin or fluoroquinolones) can result in a decrease in CDI.1, 1720
INSIGHTS ABOUT OPPORTUNITIES FOR IMPROVEMENT
Results of a recent point prevalence survey conducted by the Association for Professionals in Infection Control and Epidemiology, Inc (APIC) provide important insights into knowledge and clinical practice gaps related to early diagnosis and prevention of CDI.21 More than 12,000 APIC members were asked to provide a 1‐day snapshot of patients identified with CDI or colonization at their institutions. Responses from 648 (12.5%) acute care hospitals in the United States, representing 47 states, indicate a clear need to improve infection control practices.21 The following recommendations are based on recent evidence:
-
Patients should be placed in contact isolation at the first suspicion of CDI, and kept in isolation for up to 2 days after diarrhea resolves because contamination persists in the environment that long.2 Of note, this differs from the SHEA/IDSA Clinical Practice Guidelines for Clostridium difficile Infection in Adults, which state: Maintain contact precautions for the duration of diarrhea.12 The Centers for Disease Control and Prevention (CDC) currently recommends contact precautions for the duration of illness when caring for patients with CDI.22
-
Bleach solution should be used for routine and terminal cleaning during CDI outbreaks, as recommended by SHEA/IDSA and the CDC.
-
Hand washing with soap and water is more effective than alcohol‐based hand sanitizers for removal of spores. However, appropriate donning and removal of gloves prevents hand contamination with C. difficile spores, likely explaining why hand washing with soap and water has not been associated with a decrease in CDI compared with alcohol‐based products.
-
A formal program to educate environmental services personnel should be implemented to ensure they understand their critical role on the infection control team and effective strategies for cleaning.
SPECIAL APPROACHES
When basic approaches are not effective to reduce the incidence of CDI, the SHEA has recommendations for special approaches, which should be implemented as appropriate for each institution (summarized in Table 2).2 Strategies for prevention of CDI are also available from the CDC and the Institute for Healthcare Improvement (IHI).23, 24
SUMMARY
Effective management and prevention of CDI requires a multidisciplinary approach that includes leaders in hospital administration, clinicians, the infection control department, nursing, pharmacy, and the clinical laboratory, as well as environmental services. All of these professionals must be accountable and take an active role in implementing and complying with evidence‐based strategies to ensure that patients at risk are identified early and managed appropriately, and that effective strategies for prevention are in place. Hospitalists, as front‐line caregivers, physician leaders in their hospitals, and coordinators of patient care, can play a key role in these regards. Care when deciding when and which antimicrobial to use to treat non‐CDI infections; being attuned to symptoms that may be due to CDI, and prompt diagnosis and treatment of CDI; adhering to infection control policies; awareness of cleaning practices; and also being an active member of the infection control committee are all ways that hospitalists may take active roles in preventing CDI.
- ,.Clostridium difficile infection in the intensive care unit.Infect Dis Clin North Am.2009;23(3):727–743.
- ,,.Strategies to prevent Clostridium difficile infections in acute care hospitals.Infect Control Hosp Epidemiol.2008;29(suppl 1):S81–S92.
- ,,,.Nosocomial acquisition of Clostridium difficile infection.N Engl J Med.1989;320(4):204–210.
- ,,, et al.Acquisition of Clostridium difficile by hospitalized patients: evidence for colonized new admissions as a source of infection.J Infect Dis.1992;166:561–567.
- ,.The role of physical proximity in nosocomial diarrhea.Clin Infect Dis.2000;31(3):717–722.
- ,,, et al.Evaluation of hospital room assignment and acquisition of Clostridium difficile infection.Infect Control Hosp Epidemiol.2011;32(3):201–206.
- ,,,,.Effectiveness of infection control program in controlling nosocomial Clostridium difficile.Am J Infect Control.1998;26(6):588–593.
- ,,, et al.Control of an outbreak of infection with the hypervirulent Clostridium difficile BI strain in a university hospital using a comprehensive “bundle” approach.Clin Infect Dis.2007;45(10):1266–1273.
- ,,, et al.Epidemics of diarrhea caused by a clindamycin‐resistant strain of Clostridium difficile in four hospitals.N Engl J Med.1999;341(22):1645–1651.
- ,,,,.Hand hygiene with soap and water is superior to alcohol rub and antiseptic wipes for removal of Clostridium difficile.Infect Control Hosp Epidemiol.2009;30(10):939–944.
- ,,.Measures to control and prevent Clostridium difficile infection.Clin Infect Dis.2008;46(suppl 1):S43–S49.
- ,,, et al.Clinical practice guidelines for Clostridium difficile infection in adults: 2010 update by the Society for Healthcare Epidemiology of America (SHEA) and the Infectious Diseases Society of America (IDSA).Infect Control Hosp Epidemiol.2010;31(5):431–455.
- ,,, et al.Human hypervirulent Clostridium difficile strains exhibit increased sporulation as well as robust toxin production.J Bacteriol.2010;192(19):4904–4911.
- ,,,,.Impact of a reduction in the use of high‐risk antibiotics on the course of an epidemic of Clostridium difficile‐associated disease caused by the hypervirulent NAP1/027 strain.Clin Infect Dis.2007;45(suppl 2):S112–S121.
- ,,, et al.Emergence of fluoroquinolones as the predominant risk factor for Clostridium difficile‐associated diarrhea: a cohort study during an epidemic in Quebec, Canada.Clin Infect Dis.2005;41(9):1254–1260.
- ,,,, et al.A predominantly clonal multi‐institutional outbreak of Clostridium difficile‐associated diarrhea with high morbidity and mortality.N Engl J Med.2005;353:2442–2449.
- ,,, et al.Hospital‐wide restriction of clindamycin: effect on the incidence of Clostridium difficile‐associated diarrhea and cost.Ann Intern Med.1998;128:989–995.
- ,,, et al.Interventions to improve antibiotic prescribing practices for hospital inpatients.Cochrane Database Syst Rev.2005CD003543.
- ,.Impact of changes in antibiotic policy on Clostridium difficile‐associated diarrhoea (CDAD) over a five‐year period in a district general hospital.J Hosp Infect.2003;54:104–108.
- ,,, et al.Antibiotic prescribing policy and Clostridium difficile diarrhoea.Q J Med.2004;97:423–429.
- Association for Professionals in Infection Control and Epidemiology (APIC). Guide to the elimination of Clostridium difficile in healthcare settings. Available at: http://www.apic.org/Content/NavigationMenu/PracticeGuidance/APICEliminationGuides/C.diff_Elimination_guide_logo.pdf. Accessed August 9,2011.
- Centers for Disease Control and Prevention. Frequently asked questions about Clostridium difficile for healthcare providers. Available at: http://www.cdc.gov/HAI/organisms/cdiff/Cdiff_faqs_HCP.html. Accessed August 9,2011.
- Centers for Disease Control and Prevention. Information about the current strain of Clostridium difficile. Available at: http://www.cdc.gov/HAI/organisms/cdiff/Cdiff‐current‐strain.html. Accessed June 15,2011.
- Institute for Healthcare Improvement. Available at: http://www.ihi.org. Accessed July 26,2011.
Improving Sleep in Hospitalized Patients
In recent years, the philosophy of major hospitals has become more patient‐centered with increased focus on outcomes, safety, and patient satisfaction. To this end, many hospitals are looking for innovative ways not only to optimize quality of care, but also to improve patient satisfaction.
Sleep is a domain in which the goals of improving patient outcomes and satisfaction can be mutually achieved. Poor sleep has become a prevalent problem, and a single night of complete sleep loss can result in the undesirable consequences of daytime sleepiness, lethargy, irritability, confusion, and poor short‐term memory.1, 2 Literature has also suggested that chronic partial sleep loss can have significant consequences for safety, mood stability, neurological and medical functioning, and quality of life.38 The importance of acknowledging the relationship between sleep and a patient's level of functioning is magnified in the context of hospitalized patients, particularly those undergoing neurological inpatient care. Changes in level of alertness due to sleep loss can have serious implications for these patients, as they can lead to unnecessary testing and decreased participation with rehabilitative services.
Among the potential causes of sleep deprivation in hospitalized patients are poor pain control, lights, activities of others, and increased noise levels. The effect that increased noise has on patients has been evaluated in a variety of hospital settings, most notably in pediatric and adult intensive care units and nursing homes.9, 10 Noise has been shown to increase blood pressure, heart rate, respiratory rate, and body temperature. It has also been associated with failure to thrive, impaired immune function, delayed wound healing, and increased stress levels.11
The majority of literature regarding sleep disturbance in the hospital has focused on sleep disruption in the intensive care unit, where interventions associated with sleep loss are required to deliver the appropriate standard level of care.1218 However, few evidence‐based strategies to promote sleep quality in hospitalized patients have been evaluated.16, 1823 In this study, we aimed to examine sleep among neurological and neurosurgical inpatients, identify specific sleep‐disruptive factors, and assess patient satisfaction regarding their sleep. We implemented a sleep‐promoting protocol with the hypothesis that improvement of modifiable sleep‐disruptive factors would improve sleep and patient satisfaction.
METHODS
Study Design
This prospective, observational study was designed and implemented by an interdisciplinary team of physicians, neuroscience nurses, and hospital administrators.
Patient Selection
The study was performed on a Neurology and Neurosurgery unit, with both private and semi‐private rooms, at a large, urban, tertiary teaching hospital from February 2009 through June 2010. During enrollment periods, all patients on the unit were screened daily for eligibility. Eligible patients were medically stable and capable of giving verbal consent. Patients who were less than 16 years of age, encephalopathic, aphasic, or non‐English speaking were excluded. Eligible patients were asked for consent to participate in the study. After consultation with the hospital's institutional review board (IRB) committee, written consent was waived in this observational, quality improvement study.
Study Timeline
The study comprised 4 phases (Figure 1). In Phase 1, we collected baseline data on patients in the unit. Data were collected in the form of sleep surveys, Press Ganey surveys, and noise meter recordings. The baseline phase (Phase 1) lasted 10 weeks from February to April 2009. We then implemented a novel sleep‐promoting intervention called Basic Sleep Rounds (Phase 2, May to August 2009). After discontinuing Basic Sleep Rounds, data were collected for the washout phase (Phase 3, September 2009 to February 2010). An enhanced version of the sleep‐promoting intervention called Deluxe Sleep Rounds was then instituted (Phase 4, March to June 2010). In Phases 2 and 4, sleep rounds were implemented for 2 weeks before data collection to ensure uniform application of Sleep Rounds.

Sleep Promoting Interventions
Prior to implementing Basic Sleep Rounds in Phase 2, a nursing in‐service was performed where staff were educated about sleep in the hospital and about the planned interventions, and posters promoting sleep were hung on the unit. Basic Sleep Rounds were performed during Phase 2 by the patient's bedside nurse or the unit charge nurse. This occurred for all patients on the unit at approximately 23:00 nightly using the Basic Sleep Rounds checklist, which formalized simple hospital functions, such as lights out, television off, room temperature adjustment, and a final restroom usage (Figure 2). For Phase 4, a team of undergraduate volunteers was organized to assist with the delivery of Sleep Rounds. In this phase (Deluxe Sleep Rounds), nurses performed Basic Sleep Rounds by completing the checklist, and undergraduate volunteers offered patients any of the following sleep amenities: warm blanket, warm milk, white‐noise machine, hypoallergenic lotion, or room spritzer.24, 25

Additionally, during the Basic and Deluxe intervention phases, noise‐sensitive traffic lights (Talk Light Too;
Data Collection
A survey was designed to evaluate sleep quality, estimate sleep quantity, identify sleep disruptors, and assess patient satisfaction (see Supporting Figure 1 in the online version of this article). The survey was given to all eligible participants on the morning after their second night in the unit. This time point was chosen to account for potentially confounding first night effects, and to ensure that enrolled patients spent a full night in the unit.
To better evaluate one of the sleep disruptors, a subset of the survey participants had noise meters placed in their rooms. Every morning, a member of the team would visit all eligible patients to ask if they were willing to participate in this portion of the study. Data recorded between 8:00 PM and 8:00 AM on the second night of each participant's stay were later used for analysis. Noise was recorded in decibels using a Vernier Sound Level Meter, attached to a LabQuest data collection device (
Scores from Press Ganey surveys were also analyzed. These surveys were mailed to patients shortly after hospital discharge, and subsequently processed by Press Ganey Associates, Inc (
Data Analysis
Most datasets were not described by a normal distribution, thus most data are presented as medians with interquartile ranges (IQR), and comparisons between datasets were made using the MannWhitney U test. Press Ganey data are presented as means with standard errors of the mean, as distributed by Press Ganey. P 0.05 was considered significant for all data comparisons.
RESULTS
Basic demographic data were available on all participants from whom both noise and survey data were collected. As in Table 1, these participants were demographically similar (P 0.05) with regards to age, sex, and ethnic background. For unknown reasons, neurosurgery patients comprised the majority of participants in Phases 1 and 3, and neurology patients comprised the majority in Phase 2. This difference was not significant.
| Demographic | Phase 1 (n = 32) | Phase 2 (n = 33) | Phase 3 (n = 30) |
|---|---|---|---|
| Average age | 49 1 | 43 3 | 46 3 |
| % Female | 71% | 71% | 57% |
| % Neurology | 42% | 65% | 37% |
| % White | 67% | 77% | 73% |
Sleep Survey
A total of 253 sleep surveys were collected in all 4 phases. Data generated from these surveys are demonstrated in Table 2. On a 7‐point scale (1 being the best score, corresponding to the answer none, and 7 the worst, corresponding to extreme), the median scores for overall difficulty sleeping were not significantly different in Phases 1, 2, and 4. In Phase 3, the median score was 4 (moderate), significantly worse than in the other 3 phases (0.002 P 0.01). Despite the reported difficulty sleeping during Phase 3, the median number of hours of sleep and awakenings in Phases 1, 2, 3, and 4 were not significantly different. Sleep latency was scored on a 6‐point scale (1 being the best, corresponding to 010 min, and 6 the worst, corresponding to greater than 45 minutes). Similar sleep latency was reported in Phases 1, 3, and 4. However, median sleep latency in Phase 2 was 1 (010 min), significantly shorter than in the other phases (0.001 P 0.02). Despite similar survey results throughout most of the phases, there was a significant improvement in sleep latency in the Basic Sleep Rounds phase (Phase 2), and a significant worsening in overall difficulty sleeping in the washout phase (Phase 3).
| Survey Question | Phase 1 | Phase 2 | Phase 3 | Phase 4 |
|---|---|---|---|---|
| ||||
| 1. How much difficulty did you have sleeping last night? | 3 | 2 | 4* | 3 |
| IQR 4 N = 100 | IQR 4 N = 78 | IQR 3 N = 75 | IQR 2 N = 22 | |
| 2. How many hours did you sleep last night? | 6 hr | 6 hr | 5 hr | 5 hr |
| IQR 4 N = 98 | IQR 3 N = 77 | IQR 3 N = 72 | IQR 2 N = 22 | |
| 3. About how many times did you wake up during the night while you were trying to sleep? | 3 | 3 | 4 | 3 |
| IQR 3 N = 101 | IQR 3 N = 77 | IQR 3 N = 73 | IQR 3 N = 22 | |
| 4. How long did it take you to go to sleep last night? | 3 (1620 min) | 1 (010 min) | 2 (1115 min) | 2 (1115 min) |
| IQR 3 N = 101 | IQR 2 N = 77 | IQR 4 N = 75 | IQR 3 N = 22 | |
Participants also ranked each of the 7 queried disruptive factors on a 7‐point scale with regards to degree of sleep interruption. Even though less than half of the participants were in shared rooms, the presence of a roommate among those with roommates was the only sleep disrupter that ranked differently among the 4 phases. In Phases 1 and 2, when asked how much their sleep was disturbed by roommates, the median response was 1 (none), IQR = 1 (N = 41 and 31, respectively). In Phase 4, the median was 2 (a little), IQR = 2 (N = 6), but not significantly different. Answers in Phase 3 were significantly different, with a median of 3 (mild), IQR = 3 (N = 30) (0.005 P 0.006). Because there were no other statistically significant differences among individual sleep disruptors as compared by phases, survey data from all 4 phases for these factors was also analyzed collectively. Pain and staff interruptions (IQR = 3, N = 252 and IQR = 2, N = 253, respectively) were reported as the most disturbing factors, each with a median of 2 (a little). All remaining factors had a median score of 1 (none): noise inside the room (IQR = 2, N = 253), noise outside of the room (IQR = 1, N = 253), temperature (IQR = 1, N = 253), noise outside of the building (IQR = 0, N = 252), and light (IQR = 0, N = 252).
Noise Meter Recordings
Noise data were recorded from 95 participants in Phases 1 through 3, yielding high‐quality data suitable for analysis from 63 participants (11 in Phase 1, 24 in Phase 2, and 28 in Phase 3). Recorded noise ranged from 35 to 80 dB. As shown in Supporting Figure 2 in the online version of this article, raw data were plotted as decibels as a function of time. Noise levels were then analyzed in aggregate and for each of four 3‐hour time blocks (8 PM11 PM, 11 PM 2 AM,, 2 AM 5 AM, and 5 AM8 AM). Median noise levels during the entire 12‐hour period increased significantly between the first 3 phases of the study (P 0.001): 38.6 dB (IQR 5.4) in Phase 1; 40.6 dB (IQR 5.3) in Phase 2; and 43.5 (IQR 7) in Phase 3. As in Supporting Table 1 in the online version of this article, within each phase, the median noise levels were significantly less during the 11 PM2 AM and 2 AM5 AM periods, as compared to the 8 PM11 PM and 5 AM8 AM periods (P 0.001). Due to equipment dysfunction, noise data were not available for Phase 4.
Press Ganey Survey
A total of 457 Press Ganey surveys were collected. According to these surveys, patients' mean raw score of noise, on a scale from 1 to 100 (100 representing the best score), ranged from a low of 59.5 7.2 (January 2010; N = 21) to a high of 82.1 5.2 (April 2009; N = 21). Figure 3 illustrates the monthly trend of the mean score for noise compared to the national average compiled from other large hospitals around the country. It demonstrates that during the phases in which Sleep Rounds were performed (Phases 2 and 4), patients' perceptions of noise were improved.

DISCUSSION
The major conclusions of this study are: 1) hospitalized patients suffer from poor sleep quality and quantity; 2) implementation of simple measures such as Sleep Rounds to change standard practice within the hospital is feasible and effective; and 3) despite an increase in measured noise, patients' perception of their sleep and of noise levels was improved by these measures. This study developed and tested a sleep promotion program that could easily be implemented on any inpatient floor. Our Sleep Rounds checklist outlines a novel, but simple approach to sleep health by hospital providers, with the immediate goal of improving sleep among inpatients and the ultimate goal of improving outcomes.
Our study confirms that sleep disruption is prevalent among patients admitted to general hospital wards. In this study, patients reported a median of 5 hours of sleep, 3 awakenings, and sleep latency of 1115 minutes. Although not alarmingly low, 5 hours is only 60% of the recommended 8 hours of sleep for healthy individuals each night and 72% of the 6.9 hours of sleep reported by the average American each night.26 Poor pain control, frequent staff interactions, and the presence of roommates were rated as most problematic by the patients we surveyed. Interestingly, patients rated noise, temperature, and light as less problematic sleep disruptors.
Although we did not detect a statistically significant improvement in total sleep time or number of awakenings, there was a significant improvement in sleep latency during Phase 2 of the study when Basic Sleep Rounds were performed. In Phase 3 (washout phase), there was less active participation by the nursing staff in sleep hygiene promotion, and patients' perception of sleep quality was significantly worse than it was in other phases. These results suggest that the perception of sleep quality and quantity could have been enhanced by both our Basic (Phase 2) and Deluxe (Phase 4) Sleep Rounds interventions.
We were able to achieve appropriate noise levels at night (40 dB) during this study, even before our intervention began.27 Noise levels increased 2 dB between Phases 1 and 2, and another 3 dB in Phase 3. Although the changes in decibel level were statistically significant, a change of 23 dB is barely perceptible.28 Interestingly, despite the increase in measured noise throughout the study, Press Ganey results showed a trend towards perceived improvement in noise levels just before implementation of the first intervention. This may be attributable to an increased awareness of noise created by consenting patients and placing noise meters in their rooms. Perception of noise worsened significantly during the washout phase, suggesting that abandonment of Sleep Rounds was associated with less concern about noise.
Prior to initiating this study, an educational in‐service was conducted for the nursing team regarding the purpose and overall aims of this project. This may have raised awareness of the importance of sleep before collection of Phase 1 data, and had the unintended effect of an increased focus on sleep even before Sleep Rounds began. Other limitations of the study include lack of objective sleep data, nonrandomized design, inability to demonstrate causality, generalizability of results, inability to control for comorbidity including baseline sleep hygiene, limited patient numbers, inability to blind patients and team members, and difficulty obtaining accurate and complete noise data on all patients enrolled.
This study suggests that although it remains difficult for patients to sleep well in the hospital, it is possible to improve sleep and patients' perception of their sleep while they are hospitalized. Further studies are warranted to systematically evaluate interventions aimed at improving and overcoming the identified sleep disruptors without compromising patient care. However, we believe that Sleep Rounds could be associated with improvements in inpatient sleep hygiene and patient satisfaction, and could ultimately benefit patient outcomes.
Acknowledgements
The authors thank JoEllen Robinson, Jane Hill, and the nursing staff of Meyer 8 for their invaluable contributions to this project.
- .Sleep in acute care settings: an integrative review.J Nurs Scholarsh.2000;32(1):31–38.
- ,.Nursing standard‐of‐practice protocol: sleep disturbances in elderly patients. The NICHE Faculty.Geriatr Nurs.1995;16(5):238–243.
- ,,, et al.Sleep patterns and mortality among elderly patients in a geriatric hospital.Gerontology.2000;46(6):318–322.
- ,,.Sleep, insomnia and falls in elderly patients.Sleep Med.2008;9(suppl 1):S18–S22.
- ,,,,,.Behavioural and physiological reactivity to noise in the newborn.J Paediatr Child Health.2004;40(5–6):275–281.
- ,,.Sleep problems as a risk factor for falls in a sample of community‐dwelling adults aged 64–99 years.J Am Geriatr Soc.2000;48(10):1234–1240.
- ,,, et al.Reducing dangerous nighttime events in persons with dementia by using a nighttime monitoring system.Alzheimers Dement.2009;5(5):419–426.
- ,.Neurocognitive consequences of sleep deprivation.Semin Neurol.2005;25(1):117–129.
- ,,,,.The nursing home at night: effects of an intervention on noise, light, and sleep.J Am Geriatr Soc.1999;47(4):430–438.
- ,,,,.Sleep in hospitalized elders: a pilot study.Geriatr Nurs.2010;31(4):263–271.
- ,.Interactive relationships between hospital patients' noise‐induced stress and other stress with sleep.Heart Lung.2001;30(4):237–243.
- ,,.The impact of noise on patients' sleep and the effectiveness of noise reduction strategies in intensive care units.Crit Care.2009;13(2):208.
- ,,,,,.Sleep in critically ill patients requiring mechanical ventilation.Chest.2000;117(3):809–818.
- ,.Adverse effects of sleep deprivation in the ICU.Crit Care Clin.2008;24(3):461–476, v–vi.
- ,,,,.Abnormal sleep/wake cycles and the effect of environmental noise on sleep disruption in the intensive care unit.Am J Respir Crit Care Med.2001;163(2):451–457.
- ,.Responses of premature infants to routine nursing interventions and noise in the NICU.Nurs Res.1995;44(3):179–185.
- ,,,,.Noise, stress, and annoyance in a pediatric intensive care unit.Crit Care Med.2003;31(1):113–119.
- ,,,,.Effects of guidelines implementation in a surgical intensive care unit to control nighttime light and noise levels.Crit Care Med.2000;28(7):2242–2247.
- ,,,,.Noise control: a nursing team's approach to sleep promotion.Am J Nurs.2004;104(2):40–48; quiz 48–49.
- ,,, et al.Environmental noise sources and interventions to minimize them: a tale of 2 hospitals.J Nurs Care Qual.2008;23(3):216–224; quiz 225–216.
- ,,, et al.Interventions to reduce decibel levels on patient care units.Am Surg.1998;64(9):894–899.
- ,,,.Examining the feasibility of implementing specific nursing interventions to promote sleep in hospitalized elderly patients.Geriatr Nurs.2008;29(3):197–206.
- ,,,.Applicability of two brief evidence‐based interventions to improve sleep quality in inpatient mental health care.Int J Ment Health Nurs.2011;20(5)319–327.
- .Sleep deprivation in critical care units.Crit Care Nurs Q.2003;26(3):179–189; quiz 190–171.
- ,,,.Sleep promotion in hospitalized elders.Medsurg Nurs.2003;12(5):279–289; quiz 290.
- 2005 NSF Sleep in America Poll.Washington, DC:National Sleep Foundation;2005.
- ,,.Guidelines for Community Noise.Geneva, Switzerland:World Health Organization;1999.
- PhysicsArchives.com.2010. Available at: http://physicsarchives.com/index.php/courses/219. Accessed May 15, 2011.
In recent years, the philosophy of major hospitals has become more patient‐centered with increased focus on outcomes, safety, and patient satisfaction. To this end, many hospitals are looking for innovative ways not only to optimize quality of care, but also to improve patient satisfaction.
Sleep is a domain in which the goals of improving patient outcomes and satisfaction can be mutually achieved. Poor sleep has become a prevalent problem, and a single night of complete sleep loss can result in the undesirable consequences of daytime sleepiness, lethargy, irritability, confusion, and poor short‐term memory.1, 2 Literature has also suggested that chronic partial sleep loss can have significant consequences for safety, mood stability, neurological and medical functioning, and quality of life.38 The importance of acknowledging the relationship between sleep and a patient's level of functioning is magnified in the context of hospitalized patients, particularly those undergoing neurological inpatient care. Changes in level of alertness due to sleep loss can have serious implications for these patients, as they can lead to unnecessary testing and decreased participation with rehabilitative services.
Among the potential causes of sleep deprivation in hospitalized patients are poor pain control, lights, activities of others, and increased noise levels. The effect that increased noise has on patients has been evaluated in a variety of hospital settings, most notably in pediatric and adult intensive care units and nursing homes.9, 10 Noise has been shown to increase blood pressure, heart rate, respiratory rate, and body temperature. It has also been associated with failure to thrive, impaired immune function, delayed wound healing, and increased stress levels.11
The majority of literature regarding sleep disturbance in the hospital has focused on sleep disruption in the intensive care unit, where interventions associated with sleep loss are required to deliver the appropriate standard level of care.1218 However, few evidence‐based strategies to promote sleep quality in hospitalized patients have been evaluated.16, 1823 In this study, we aimed to examine sleep among neurological and neurosurgical inpatients, identify specific sleep‐disruptive factors, and assess patient satisfaction regarding their sleep. We implemented a sleep‐promoting protocol with the hypothesis that improvement of modifiable sleep‐disruptive factors would improve sleep and patient satisfaction.
METHODS
Study Design
This prospective, observational study was designed and implemented by an interdisciplinary team of physicians, neuroscience nurses, and hospital administrators.
Patient Selection
The study was performed on a Neurology and Neurosurgery unit, with both private and semi‐private rooms, at a large, urban, tertiary teaching hospital from February 2009 through June 2010. During enrollment periods, all patients on the unit were screened daily for eligibility. Eligible patients were medically stable and capable of giving verbal consent. Patients who were less than 16 years of age, encephalopathic, aphasic, or non‐English speaking were excluded. Eligible patients were asked for consent to participate in the study. After consultation with the hospital's institutional review board (IRB) committee, written consent was waived in this observational, quality improvement study.
Study Timeline
The study comprised 4 phases (Figure 1). In Phase 1, we collected baseline data on patients in the unit. Data were collected in the form of sleep surveys, Press Ganey surveys, and noise meter recordings. The baseline phase (Phase 1) lasted 10 weeks from February to April 2009. We then implemented a novel sleep‐promoting intervention called Basic Sleep Rounds (Phase 2, May to August 2009). After discontinuing Basic Sleep Rounds, data were collected for the washout phase (Phase 3, September 2009 to February 2010). An enhanced version of the sleep‐promoting intervention called Deluxe Sleep Rounds was then instituted (Phase 4, March to June 2010). In Phases 2 and 4, sleep rounds were implemented for 2 weeks before data collection to ensure uniform application of Sleep Rounds.
Sleep Promoting Interventions
Prior to implementing Basic Sleep Rounds in Phase 2, a nursing in‐service was performed where staff were educated about sleep in the hospital and about the planned interventions, and posters promoting sleep were hung on the unit. Basic Sleep Rounds were performed during Phase 2 by the patient's bedside nurse or the unit charge nurse. This occurred for all patients on the unit at approximately 23:00 nightly using the Basic Sleep Rounds checklist, which formalized simple hospital functions, such as lights out, television off, room temperature adjustment, and a final restroom usage (Figure 2). For Phase 4, a team of undergraduate volunteers was organized to assist with the delivery of Sleep Rounds. In this phase (Deluxe Sleep Rounds), nurses performed Basic Sleep Rounds by completing the checklist, and undergraduate volunteers offered patients any of the following sleep amenities: warm blanket, warm milk, white‐noise machine, hypoallergenic lotion, or room spritzer.24, 25
Additionally, during the Basic and Deluxe intervention phases, noise‐sensitive traffic lights (Talk Light Too;
Data Collection
A survey was designed to evaluate sleep quality, estimate sleep quantity, identify sleep disruptors, and assess patient satisfaction (see Supporting Figure 1 in the online version of this article). The survey was given to all eligible participants on the morning after their second night in the unit. This time point was chosen to account for potentially confounding first night effects, and to ensure that enrolled patients spent a full night in the unit.
To better evaluate one of the sleep disruptors, a subset of the survey participants had noise meters placed in their rooms. Every morning, a member of the team would visit all eligible patients to ask if they were willing to participate in this portion of the study. Data recorded between 8:00 PM and 8:00 AM on the second night of each participant's stay were later used for analysis. Noise was recorded in decibels using a Vernier Sound Level Meter, attached to a LabQuest data collection device (
Scores from Press Ganey surveys were also analyzed. These surveys were mailed to patients shortly after hospital discharge, and subsequently processed by Press Ganey Associates, Inc (
Data Analysis
Most datasets were not described by a normal distribution, thus most data are presented as medians with interquartile ranges (IQR), and comparisons between datasets were made using the MannWhitney U test. Press Ganey data are presented as means with standard errors of the mean, as distributed by Press Ganey. P 0.05 was considered significant for all data comparisons.
RESULTS
Basic demographic data were available on all participants from whom both noise and survey data were collected. As in Table 1, these participants were demographically similar (P 0.05) with regards to age, sex, and ethnic background. For unknown reasons, neurosurgery patients comprised the majority of participants in Phases 1 and 3, and neurology patients comprised the majority in Phase 2. This difference was not significant.
| Demographic | Phase 1 (n = 32) | Phase 2 (n = 33) | Phase 3 (n = 30) |
|---|---|---|---|
| Average age | 49 1 | 43 3 | 46 3 |
| % Female | 71% | 71% | 57% |
| % Neurology | 42% | 65% | 37% |
| % White | 67% | 77% | 73% |
Sleep Survey
A total of 253 sleep surveys were collected in all 4 phases. Data generated from these surveys are demonstrated in Table 2. On a 7‐point scale (1 being the best score, corresponding to the answer none, and 7 the worst, corresponding to extreme), the median scores for overall difficulty sleeping were not significantly different in Phases 1, 2, and 4. In Phase 3, the median score was 4 (moderate), significantly worse than in the other 3 phases (0.002 P 0.01). Despite the reported difficulty sleeping during Phase 3, the median number of hours of sleep and awakenings in Phases 1, 2, 3, and 4 were not significantly different. Sleep latency was scored on a 6‐point scale (1 being the best, corresponding to 010 min, and 6 the worst, corresponding to greater than 45 minutes). Similar sleep latency was reported in Phases 1, 3, and 4. However, median sleep latency in Phase 2 was 1 (010 min), significantly shorter than in the other phases (0.001 P 0.02). Despite similar survey results throughout most of the phases, there was a significant improvement in sleep latency in the Basic Sleep Rounds phase (Phase 2), and a significant worsening in overall difficulty sleeping in the washout phase (Phase 3).
| Survey Question | Phase 1 | Phase 2 | Phase 3 | Phase 4 |
|---|---|---|---|---|
| ||||
| 1. How much difficulty did you have sleeping last night? | 3 | 2 | 4* | 3 |
| IQR 4 N = 100 | IQR 4 N = 78 | IQR 3 N = 75 | IQR 2 N = 22 | |
| 2. How many hours did you sleep last night? | 6 hr | 6 hr | 5 hr | 5 hr |
| IQR 4 N = 98 | IQR 3 N = 77 | IQR 3 N = 72 | IQR 2 N = 22 | |
| 3. About how many times did you wake up during the night while you were trying to sleep? | 3 | 3 | 4 | 3 |
| IQR 3 N = 101 | IQR 3 N = 77 | IQR 3 N = 73 | IQR 3 N = 22 | |
| 4. How long did it take you to go to sleep last night? | 3 (1620 min) | 1 (010 min) | 2 (1115 min) | 2 (1115 min) |
| IQR 3 N = 101 | IQR 2 N = 77 | IQR 4 N = 75 | IQR 3 N = 22 | |
Participants also ranked each of the 7 queried disruptive factors on a 7‐point scale with regards to degree of sleep interruption. Even though less than half of the participants were in shared rooms, the presence of a roommate among those with roommates was the only sleep disrupter that ranked differently among the 4 phases. In Phases 1 and 2, when asked how much their sleep was disturbed by roommates, the median response was 1 (none), IQR = 1 (N = 41 and 31, respectively). In Phase 4, the median was 2 (a little), IQR = 2 (N = 6), but not significantly different. Answers in Phase 3 were significantly different, with a median of 3 (mild), IQR = 3 (N = 30) (0.005 P 0.006). Because there were no other statistically significant differences among individual sleep disruptors as compared by phases, survey data from all 4 phases for these factors was also analyzed collectively. Pain and staff interruptions (IQR = 3, N = 252 and IQR = 2, N = 253, respectively) were reported as the most disturbing factors, each with a median of 2 (a little). All remaining factors had a median score of 1 (none): noise inside the room (IQR = 2, N = 253), noise outside of the room (IQR = 1, N = 253), temperature (IQR = 1, N = 253), noise outside of the building (IQR = 0, N = 252), and light (IQR = 0, N = 252).
Noise Meter Recordings
Noise data were recorded from 95 participants in Phases 1 through 3, yielding high‐quality data suitable for analysis from 63 participants (11 in Phase 1, 24 in Phase 2, and 28 in Phase 3). Recorded noise ranged from 35 to 80 dB. As shown in Supporting Figure 2 in the online version of this article, raw data were plotted as decibels as a function of time. Noise levels were then analyzed in aggregate and for each of four 3‐hour time blocks (8 PM11 PM, 11 PM 2 AM,, 2 AM 5 AM, and 5 AM8 AM). Median noise levels during the entire 12‐hour period increased significantly between the first 3 phases of the study (P 0.001): 38.6 dB (IQR 5.4) in Phase 1; 40.6 dB (IQR 5.3) in Phase 2; and 43.5 (IQR 7) in Phase 3. As in Supporting Table 1 in the online version of this article, within each phase, the median noise levels were significantly less during the 11 PM2 AM and 2 AM5 AM periods, as compared to the 8 PM11 PM and 5 AM8 AM periods (P 0.001). Due to equipment dysfunction, noise data were not available for Phase 4.
Press Ganey Survey
A total of 457 Press Ganey surveys were collected. According to these surveys, patients' mean raw score of noise, on a scale from 1 to 100 (100 representing the best score), ranged from a low of 59.5 7.2 (January 2010; N = 21) to a high of 82.1 5.2 (April 2009; N = 21). Figure 3 illustrates the monthly trend of the mean score for noise compared to the national average compiled from other large hospitals around the country. It demonstrates that during the phases in which Sleep Rounds were performed (Phases 2 and 4), patients' perceptions of noise were improved.
DISCUSSION
The major conclusions of this study are: 1) hospitalized patients suffer from poor sleep quality and quantity; 2) implementation of simple measures such as Sleep Rounds to change standard practice within the hospital is feasible and effective; and 3) despite an increase in measured noise, patients' perception of their sleep and of noise levels was improved by these measures. This study developed and tested a sleep promotion program that could easily be implemented on any inpatient floor. Our Sleep Rounds checklist outlines a novel, but simple approach to sleep health by hospital providers, with the immediate goal of improving sleep among inpatients and the ultimate goal of improving outcomes.
Our study confirms that sleep disruption is prevalent among patients admitted to general hospital wards. In this study, patients reported a median of 5 hours of sleep, 3 awakenings, and sleep latency of 1115 minutes. Although not alarmingly low, 5 hours is only 60% of the recommended 8 hours of sleep for healthy individuals each night and 72% of the 6.9 hours of sleep reported by the average American each night.26 Poor pain control, frequent staff interactions, and the presence of roommates were rated as most problematic by the patients we surveyed. Interestingly, patients rated noise, temperature, and light as less problematic sleep disruptors.
Although we did not detect a statistically significant improvement in total sleep time or number of awakenings, there was a significant improvement in sleep latency during Phase 2 of the study when Basic Sleep Rounds were performed. In Phase 3 (washout phase), there was less active participation by the nursing staff in sleep hygiene promotion, and patients' perception of sleep quality was significantly worse than it was in other phases. These results suggest that the perception of sleep quality and quantity could have been enhanced by both our Basic (Phase 2) and Deluxe (Phase 4) Sleep Rounds interventions.
We were able to achieve appropriate noise levels at night (40 dB) during this study, even before our intervention began.27 Noise levels increased 2 dB between Phases 1 and 2, and another 3 dB in Phase 3. Although the changes in decibel level were statistically significant, a change of 23 dB is barely perceptible.28 Interestingly, despite the increase in measured noise throughout the study, Press Ganey results showed a trend towards perceived improvement in noise levels just before implementation of the first intervention. This may be attributable to an increased awareness of noise created by consenting patients and placing noise meters in their rooms. Perception of noise worsened significantly during the washout phase, suggesting that abandonment of Sleep Rounds was associated with less concern about noise.
Prior to initiating this study, an educational in‐service was conducted for the nursing team regarding the purpose and overall aims of this project. This may have raised awareness of the importance of sleep before collection of Phase 1 data, and had the unintended effect of an increased focus on sleep even before Sleep Rounds began. Other limitations of the study include lack of objective sleep data, nonrandomized design, inability to demonstrate causality, generalizability of results, inability to control for comorbidity including baseline sleep hygiene, limited patient numbers, inability to blind patients and team members, and difficulty obtaining accurate and complete noise data on all patients enrolled.
This study suggests that although it remains difficult for patients to sleep well in the hospital, it is possible to improve sleep and patients' perception of their sleep while they are hospitalized. Further studies are warranted to systematically evaluate interventions aimed at improving and overcoming the identified sleep disruptors without compromising patient care. However, we believe that Sleep Rounds could be associated with improvements in inpatient sleep hygiene and patient satisfaction, and could ultimately benefit patient outcomes.
Acknowledgements
The authors thank JoEllen Robinson, Jane Hill, and the nursing staff of Meyer 8 for their invaluable contributions to this project.
- .Sleep in acute care settings: an integrative review.J Nurs Scholarsh.2000;32(1):31–38.
- ,.Nursing standard‐of‐practice protocol: sleep disturbances in elderly patients. The NICHE Faculty.Geriatr Nurs.1995;16(5):238–243.
- ,,, et al.Sleep patterns and mortality among elderly patients in a geriatric hospital.Gerontology.2000;46(6):318–322.
- ,,.Sleep, insomnia and falls in elderly patients.Sleep Med.2008;9(suppl 1):S18–S22.
- ,,,,,.Behavioural and physiological reactivity to noise in the newborn.J Paediatr Child Health.2004;40(5–6):275–281.
- ,,.Sleep problems as a risk factor for falls in a sample of community‐dwelling adults aged 64–99 years.J Am Geriatr Soc.2000;48(10):1234–1240.
- ,,, et al.Reducing dangerous nighttime events in persons with dementia by using a nighttime monitoring system.Alzheimers Dement.2009;5(5):419–426.
- ,.Neurocognitive consequences of sleep deprivation.Semin Neurol.2005;25(1):117–129.
- ,,,,.The nursing home at night: effects of an intervention on noise, light, and sleep.J Am Geriatr Soc.1999;47(4):430–438.
- ,,,,.Sleep in hospitalized elders: a pilot study.Geriatr Nurs.2010;31(4):263–271.
- ,.Interactive relationships between hospital patients' noise‐induced stress and other stress with sleep.Heart Lung.2001;30(4):237–243.
- ,,.The impact of noise on patients' sleep and the effectiveness of noise reduction strategies in intensive care units.Crit Care.2009;13(2):208.
- ,,,,,.Sleep in critically ill patients requiring mechanical ventilation.Chest.2000;117(3):809–818.
- ,.Adverse effects of sleep deprivation in the ICU.Crit Care Clin.2008;24(3):461–476, v–vi.
- ,,,,.Abnormal sleep/wake cycles and the effect of environmental noise on sleep disruption in the intensive care unit.Am J Respir Crit Care Med.2001;163(2):451–457.
- ,.Responses of premature infants to routine nursing interventions and noise in the NICU.Nurs Res.1995;44(3):179–185.
- ,,,,.Noise, stress, and annoyance in a pediatric intensive care unit.Crit Care Med.2003;31(1):113–119.
- ,,,,.Effects of guidelines implementation in a surgical intensive care unit to control nighttime light and noise levels.Crit Care Med.2000;28(7):2242–2247.
- ,,,,.Noise control: a nursing team's approach to sleep promotion.Am J Nurs.2004;104(2):40–48; quiz 48–49.
- ,,, et al.Environmental noise sources and interventions to minimize them: a tale of 2 hospitals.J Nurs Care Qual.2008;23(3):216–224; quiz 225–216.
- ,,, et al.Interventions to reduce decibel levels on patient care units.Am Surg.1998;64(9):894–899.
- ,,,.Examining the feasibility of implementing specific nursing interventions to promote sleep in hospitalized elderly patients.Geriatr Nurs.2008;29(3):197–206.
- ,,,.Applicability of two brief evidence‐based interventions to improve sleep quality in inpatient mental health care.Int J Ment Health Nurs.2011;20(5)319–327.
- .Sleep deprivation in critical care units.Crit Care Nurs Q.2003;26(3):179–189; quiz 190–171.
- ,,,.Sleep promotion in hospitalized elders.Medsurg Nurs.2003;12(5):279–289; quiz 290.
- 2005 NSF Sleep in America Poll.Washington, DC:National Sleep Foundation;2005.
- ,,.Guidelines for Community Noise.Geneva, Switzerland:World Health Organization;1999.
- PhysicsArchives.com.2010. Available at: http://physicsarchives.com/index.php/courses/219. Accessed May 15, 2011.