User login
ITL: Physician Reviews of HM-Relevant Research
Clinical question: What are the current job satisfaction levels of hospitalists?
Background: The number of hospitalists is growing rapidly, and there are now estimated to be 30,000 hospitalists in the U.S. Despite this rapid growth, little is known about whether being a hospitalist is a viable long-term career choice or if hospitalists are prone to burnout. This study sought to examine the job satisfaction levels of hospitalists and assess their risk of burnout.
Study design: Survey.
Setting: A representative, stratified sample of practicing hospitalists who were members of SHM or had attended an SHM event were surveyed using the Hospital Medicine Physician Work-Life Survey, an instrument developed by SHM’s Career Satisfaction Task Force. The survey measured 22 domains, including general job and specialty satisfaction, specific satisfaction domains (e.g. compensation, workload, personal time), stress, burnout, and intent to leave.
Synopsis: A total of 816 hospitalists responded to the survey for a response rate of 26%. Nearly 63% of respondents reported high overall job satisfaction and 69% reported high satisfaction with hospital medicine as a specialty. The majority of respondents reported high satisfaction with care quality (82.3%), relationships with staff (79.5%), colleagues (76.2%), and their leaders (75.4%). A minority of respondents reported satisfaction with organizational fairness (31.2%), personal time (28.3%), compensation (27.9%), and autonomy (17.4%).
Burnout symptoms were reported by 29.9% of hospitalists. Among the respondents who reported burnout symptoms, many reported that they were “very likely” (24.6%) or “somewhat likely” (20.8%) to leave their current practice within two years.
The response rate was low and might not accurately reflect the opinion of non-SHM members.
Bottom line: Most hospitalists reported high satisfaction with their job and with the specialty of hospital medicine, but a significant minority reported burnout symptoms and a likelihood of leaving their current practice.
Citation: Hinami K, Whelan CT, Wolosin RJ, Miller JA, Wetterneck TB. Worklife and satisfaction of hospitalists: toward flourishing careers. J Gen Intern Med. 27:28-36.
Clinical question: What are the current job satisfaction levels of hospitalists?
Background: The number of hospitalists is growing rapidly, and there are now estimated to be 30,000 hospitalists in the U.S. Despite this rapid growth, little is known about whether being a hospitalist is a viable long-term career choice or if hospitalists are prone to burnout. This study sought to examine the job satisfaction levels of hospitalists and assess their risk of burnout.
Study design: Survey.
Setting: A representative, stratified sample of practicing hospitalists who were members of SHM or had attended an SHM event were surveyed using the Hospital Medicine Physician Work-Life Survey, an instrument developed by SHM’s Career Satisfaction Task Force. The survey measured 22 domains, including general job and specialty satisfaction, specific satisfaction domains (e.g. compensation, workload, personal time), stress, burnout, and intent to leave.
Synopsis: A total of 816 hospitalists responded to the survey for a response rate of 26%. Nearly 63% of respondents reported high overall job satisfaction and 69% reported high satisfaction with hospital medicine as a specialty. The majority of respondents reported high satisfaction with care quality (82.3%), relationships with staff (79.5%), colleagues (76.2%), and their leaders (75.4%). A minority of respondents reported satisfaction with organizational fairness (31.2%), personal time (28.3%), compensation (27.9%), and autonomy (17.4%).
Burnout symptoms were reported by 29.9% of hospitalists. Among the respondents who reported burnout symptoms, many reported that they were “very likely” (24.6%) or “somewhat likely” (20.8%) to leave their current practice within two years.
The response rate was low and might not accurately reflect the opinion of non-SHM members.
Bottom line: Most hospitalists reported high satisfaction with their job and with the specialty of hospital medicine, but a significant minority reported burnout symptoms and a likelihood of leaving their current practice.
Citation: Hinami K, Whelan CT, Wolosin RJ, Miller JA, Wetterneck TB. Worklife and satisfaction of hospitalists: toward flourishing careers. J Gen Intern Med. 27:28-36.
Clinical question: What are the current job satisfaction levels of hospitalists?
Background: The number of hospitalists is growing rapidly, and there are now estimated to be 30,000 hospitalists in the U.S. Despite this rapid growth, little is known about whether being a hospitalist is a viable long-term career choice or if hospitalists are prone to burnout. This study sought to examine the job satisfaction levels of hospitalists and assess their risk of burnout.
Study design: Survey.
Setting: A representative, stratified sample of practicing hospitalists who were members of SHM or had attended an SHM event were surveyed using the Hospital Medicine Physician Work-Life Survey, an instrument developed by SHM’s Career Satisfaction Task Force. The survey measured 22 domains, including general job and specialty satisfaction, specific satisfaction domains (e.g. compensation, workload, personal time), stress, burnout, and intent to leave.
Synopsis: A total of 816 hospitalists responded to the survey for a response rate of 26%. Nearly 63% of respondents reported high overall job satisfaction and 69% reported high satisfaction with hospital medicine as a specialty. The majority of respondents reported high satisfaction with care quality (82.3%), relationships with staff (79.5%), colleagues (76.2%), and their leaders (75.4%). A minority of respondents reported satisfaction with organizational fairness (31.2%), personal time (28.3%), compensation (27.9%), and autonomy (17.4%).
Burnout symptoms were reported by 29.9% of hospitalists. Among the respondents who reported burnout symptoms, many reported that they were “very likely” (24.6%) or “somewhat likely” (20.8%) to leave their current practice within two years.
The response rate was low and might not accurately reflect the opinion of non-SHM members.
Bottom line: Most hospitalists reported high satisfaction with their job and with the specialty of hospital medicine, but a significant minority reported burnout symptoms and a likelihood of leaving their current practice.
Citation: Hinami K, Whelan CT, Wolosin RJ, Miller JA, Wetterneck TB. Worklife and satisfaction of hospitalists: toward flourishing careers. J Gen Intern Med. 27:28-36.
Lessons After the Storm: Joplin Surgeon Looks Back
Take emergency weather warnings seriously, prepare a plan to triage and treat mass casualties, and consider how you would work in a worst-case scenario following a major natural disaster. These are some lessons learned by a thoracic surgeon who survived a devastating EF 5 tornado that ripped through his hometown of Joplin, Mo.
All normal communications were down when Dr. Michael Phillips arrived at his hospital, the Freeman Health System Heart and Vascular Institute. Staff figured out they could communicate via Facebook, Twitter, and texts.
There was no water pressure or clean water. "We were on generator power only, with no ability to identify any patient and no labs or x-rays," Dr. Phillips said at the annual meeting of the American Association for Thoracic Surgery.
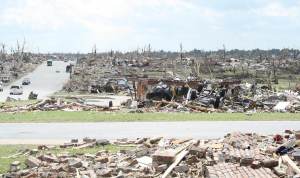
Nearby St. John’s Regional Medical Center, a 360-bed hospital, "was lifted off the ground and moved four inches off its foundation." There were 183 inpatients at St. John’s when the tornado touched down with winds approaching 300 mph on May 22, 2011. More than 70 patients, including 11 on ventilator support, "came to our hospital needing a place to stay, and we were already full. We have a 250 bed hospital – what do you do from there?"
More than 1,000 patients were treated in the first 24 hours. There were 11 deaths in the first six hours and "I pronounced seven of them," said Dr. Phillips, a cardiothoracic surgeon at Freeman. There were 161 deaths overall, making the Joplin tornado the deadliest on record since 1950.
"We didn’t sleep. We operated nonstop. We performed 22 operations during that time, 13 of which I performed. It was almost 30 hours before I took a break, the same thing with all the people around me," Dr. Phillips replied. "I was really blessed by having a wonderful staff around me."

"There were so many challenges to overcome; it’s really hard to put into words. You have to overcome that initial shock. The layperson doesn’t understand the devastation around them; you do. You have to get your arms around it and move on and deal with the situation at hand."
"One can never train enough for such an event. We have to try to be prepared as much as possible. Preparation should include all levels within the health system," Dr. Phillips said. "Mass triage plans are critical."
Lessons learned include taking weather warnings seriously. "We used to blow these off and we pay attention now," Dr. Phillips said. Take shelter when a siren sounds and review your plans for worst case scenarios. All this advice applies to other natural disasters – including tsunamis, typhoons, and hurricanes, he said.
"These are all natural disasters that not only take life and create mass casualties, but they also take away our basic essentials of communications, food, clothing, and shelter."
–Damian McNamara (on Twitter @MedReporter )
Take emergency weather warnings seriously, prepare a plan to triage and treat mass casualties, and consider how you would work in a worst-case scenario following a major natural disaster. These are some lessons learned by a thoracic surgeon who survived a devastating EF 5 tornado that ripped through his hometown of Joplin, Mo.
All normal communications were down when Dr. Michael Phillips arrived at his hospital, the Freeman Health System Heart and Vascular Institute. Staff figured out they could communicate via Facebook, Twitter, and texts.
There was no water pressure or clean water. "We were on generator power only, with no ability to identify any patient and no labs or x-rays," Dr. Phillips said at the annual meeting of the American Association for Thoracic Surgery.
Nearby St. John’s Regional Medical Center, a 360-bed hospital, "was lifted off the ground and moved four inches off its foundation." There were 183 inpatients at St. John’s when the tornado touched down with winds approaching 300 mph on May 22, 2011. More than 70 patients, including 11 on ventilator support, "came to our hospital needing a place to stay, and we were already full. We have a 250 bed hospital – what do you do from there?"
More than 1,000 patients were treated in the first 24 hours. There were 11 deaths in the first six hours and "I pronounced seven of them," said Dr. Phillips, a cardiothoracic surgeon at Freeman. There were 161 deaths overall, making the Joplin tornado the deadliest on record since 1950.
"We didn’t sleep. We operated nonstop. We performed 22 operations during that time, 13 of which I performed. It was almost 30 hours before I took a break, the same thing with all the people around me," Dr. Phillips replied. "I was really blessed by having a wonderful staff around me."
"There were so many challenges to overcome; it’s really hard to put into words. You have to overcome that initial shock. The layperson doesn’t understand the devastation around them; you do. You have to get your arms around it and move on and deal with the situation at hand."
"One can never train enough for such an event. We have to try to be prepared as much as possible. Preparation should include all levels within the health system," Dr. Phillips said. "Mass triage plans are critical."
Lessons learned include taking weather warnings seriously. "We used to blow these off and we pay attention now," Dr. Phillips said. Take shelter when a siren sounds and review your plans for worst case scenarios. All this advice applies to other natural disasters – including tsunamis, typhoons, and hurricanes, he said.
"These are all natural disasters that not only take life and create mass casualties, but they also take away our basic essentials of communications, food, clothing, and shelter."
–Damian McNamara (on Twitter @MedReporter )
Take emergency weather warnings seriously, prepare a plan to triage and treat mass casualties, and consider how you would work in a worst-case scenario following a major natural disaster. These are some lessons learned by a thoracic surgeon who survived a devastating EF 5 tornado that ripped through his hometown of Joplin, Mo.
All normal communications were down when Dr. Michael Phillips arrived at his hospital, the Freeman Health System Heart and Vascular Institute. Staff figured out they could communicate via Facebook, Twitter, and texts.
There was no water pressure or clean water. "We were on generator power only, with no ability to identify any patient and no labs or x-rays," Dr. Phillips said at the annual meeting of the American Association for Thoracic Surgery.
Nearby St. John’s Regional Medical Center, a 360-bed hospital, "was lifted off the ground and moved four inches off its foundation." There were 183 inpatients at St. John’s when the tornado touched down with winds approaching 300 mph on May 22, 2011. More than 70 patients, including 11 on ventilator support, "came to our hospital needing a place to stay, and we were already full. We have a 250 bed hospital – what do you do from there?"
More than 1,000 patients were treated in the first 24 hours. There were 11 deaths in the first six hours and "I pronounced seven of them," said Dr. Phillips, a cardiothoracic surgeon at Freeman. There were 161 deaths overall, making the Joplin tornado the deadliest on record since 1950.
"We didn’t sleep. We operated nonstop. We performed 22 operations during that time, 13 of which I performed. It was almost 30 hours before I took a break, the same thing with all the people around me," Dr. Phillips replied. "I was really blessed by having a wonderful staff around me."
"There were so many challenges to overcome; it’s really hard to put into words. You have to overcome that initial shock. The layperson doesn’t understand the devastation around them; you do. You have to get your arms around it and move on and deal with the situation at hand."
"One can never train enough for such an event. We have to try to be prepared as much as possible. Preparation should include all levels within the health system," Dr. Phillips said. "Mass triage plans are critical."
Lessons learned include taking weather warnings seriously. "We used to blow these off and we pay attention now," Dr. Phillips said. Take shelter when a siren sounds and review your plans for worst case scenarios. All this advice applies to other natural disasters – including tsunamis, typhoons, and hurricanes, he said.
"These are all natural disasters that not only take life and create mass casualties, but they also take away our basic essentials of communications, food, clothing, and shelter."
–Damian McNamara (on Twitter @MedReporter )
Making News at NEJM
Turns out there’s more to the process of deciding which studies to publish in top medical journals than simply peer review and the selections of sage editors. At the New England Journal of Medicine, editors conducted around a half-dozen informal polls in the past year to help them assess the worthiness of a particular research question, according to Editor-in-Chief Dr. Jeffrey M. Drazen.
A case in point: When considering the study "Early vs. Late Parenteral Nutrition in Critically Ill Adults," the editors knew that most ICUs in the United States don’t start parenteral nutrition for a week, and the study results supported this "late" start (New Engl. J. Med. 2011;365:506-517). So, was this a question that really needed to be answered?

Rather than rely on intuition or American self-absorption, the editors used an editorial intern who worked for the journal to do an informal survey by calling ICU doctors around the world. To their surprise, they found that ICUs in Australia, New Zealand, and most of Europe start parenteral nutrition earlier than in the United States, he said in a discussion at the annual meeting of the American Thoracic Society.
"Since we have more readers outside the U.S. than in the U.S., we figured this was something that was important to publish," said Dr. Drazen, professor of medicine at Harvard University, Boston.
"I think it has a message for ICU interventions in general. Most of the things that we reasoned based on physiology – the physiology tells you that you need to provide these calories in order for the body to heal – may be wrong," he added. "It’s hard to take the kind of physiology that we’ve learned in animals and translate it clinically to humans. We really didn’t test these questions one at a time."
The journal sifts through 5,000 submissions to publish around 200 original research articles each year. "We take the job seriously," and sometimes an informal poll helps the process, he said. The parenteral nutrition study didn’t seem to be so important at first, but "it turns out that we were wrong.
"We like to make decisions based on information rather than guessing," Dr. Drazen said. "It should be the same when treating patients."
–Sherry Boschert (on Twitter @sherryboschert)
Turns out there’s more to the process of deciding which studies to publish in top medical journals than simply peer review and the selections of sage editors. At the New England Journal of Medicine, editors conducted around a half-dozen informal polls in the past year to help them assess the worthiness of a particular research question, according to Editor-in-Chief Dr. Jeffrey M. Drazen.
A case in point: When considering the study "Early vs. Late Parenteral Nutrition in Critically Ill Adults," the editors knew that most ICUs in the United States don’t start parenteral nutrition for a week, and the study results supported this "late" start (New Engl. J. Med. 2011;365:506-517). So, was this a question that really needed to be answered?
Rather than rely on intuition or American self-absorption, the editors used an editorial intern who worked for the journal to do an informal survey by calling ICU doctors around the world. To their surprise, they found that ICUs in Australia, New Zealand, and most of Europe start parenteral nutrition earlier than in the United States, he said in a discussion at the annual meeting of the American Thoracic Society.
"Since we have more readers outside the U.S. than in the U.S., we figured this was something that was important to publish," said Dr. Drazen, professor of medicine at Harvard University, Boston.
"I think it has a message for ICU interventions in general. Most of the things that we reasoned based on physiology – the physiology tells you that you need to provide these calories in order for the body to heal – may be wrong," he added. "It’s hard to take the kind of physiology that we’ve learned in animals and translate it clinically to humans. We really didn’t test these questions one at a time."
The journal sifts through 5,000 submissions to publish around 200 original research articles each year. "We take the job seriously," and sometimes an informal poll helps the process, he said. The parenteral nutrition study didn’t seem to be so important at first, but "it turns out that we were wrong.
"We like to make decisions based on information rather than guessing," Dr. Drazen said. "It should be the same when treating patients."
–Sherry Boschert (on Twitter @sherryboschert)
Turns out there’s more to the process of deciding which studies to publish in top medical journals than simply peer review and the selections of sage editors. At the New England Journal of Medicine, editors conducted around a half-dozen informal polls in the past year to help them assess the worthiness of a particular research question, according to Editor-in-Chief Dr. Jeffrey M. Drazen.
A case in point: When considering the study "Early vs. Late Parenteral Nutrition in Critically Ill Adults," the editors knew that most ICUs in the United States don’t start parenteral nutrition for a week, and the study results supported this "late" start (New Engl. J. Med. 2011;365:506-517). So, was this a question that really needed to be answered?
Rather than rely on intuition or American self-absorption, the editors used an editorial intern who worked for the journal to do an informal survey by calling ICU doctors around the world. To their surprise, they found that ICUs in Australia, New Zealand, and most of Europe start parenteral nutrition earlier than in the United States, he said in a discussion at the annual meeting of the American Thoracic Society.
"Since we have more readers outside the U.S. than in the U.S., we figured this was something that was important to publish," said Dr. Drazen, professor of medicine at Harvard University, Boston.
"I think it has a message for ICU interventions in general. Most of the things that we reasoned based on physiology – the physiology tells you that you need to provide these calories in order for the body to heal – may be wrong," he added. "It’s hard to take the kind of physiology that we’ve learned in animals and translate it clinically to humans. We really didn’t test these questions one at a time."
The journal sifts through 5,000 submissions to publish around 200 original research articles each year. "We take the job seriously," and sometimes an informal poll helps the process, he said. The parenteral nutrition study didn’t seem to be so important at first, but "it turns out that we were wrong.
"We like to make decisions based on information rather than guessing," Dr. Drazen said. "It should be the same when treating patients."
–Sherry Boschert (on Twitter @sherryboschert)
States Don't Measure Up on Injury Prevention
More than half of U.S. states (29) do not require bicycle helmets for all children, and 14 states do not have strong laws to prevent youth concussion during sports, according to a report card on injury prevention released May 22.
The report card is part of a new report on injury prevention – "The Facts Hurt: A State-By-State Injury Prevention Policy Report" – released by the Trust for America’s Health and the Robert Wood Johnson Foundation. The report was developed in partnership with leading injury-prevention experts from the Safe States Alliance and the Society for the Advancement of Violence and Injury Research.
Injuries are the third leading cause of death nationally and are the leading cause of death for Americans between the ages of 1 and 44 years. Almost half of states (24) scored a 5 out of 10 or lower on the report card, which consists of 10 injury-prevention indicators. California and New York received the highest score of 9; Montana and Ohio scored the lowest with 2.
"Overall, we need to redouble our efforts to make safety research and policy a national priority. There’s compelling evidence that we should adopt, implement, and enforce any existing policies and programs to help spare millions of Americans from needless harm," said Andrea Gielen, Sc.D., director of the Johns Hopkins Center for Injury Research and Policy and past president of the Society for the Advancement of Violence and Injury Research.
"We know that bicycle crashes lead to around 700 deaths and more than 500,000 emergency room visits each year," said Dr. Gielen. "According to research, wearing an approved helmet in the proper way provides up to an 88% reduction in the risk of head and brain injury for bicyclists of all ages."
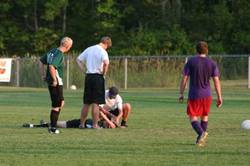
Brain injury as a result of sports participation also has garnered more attention in the United States in recent years. However, some states have yet to pass protective laws, according to Amber Williams, executive director of the Safe States Alliance.
"We focused on the growing understanding of steps that can be taken to reduce injuries in youth sports," she said. Prevention measures should include education, removal from play for suspected concussion, and required return-to-play evaluations.
The report includes data on the growing misuse of prescription drugs, particularly painkillers, Ms. Williams said. Sales of prescription painkillers tripled between 1999 and 2010, as did the number of fatal poisonings due to prescription pain medication. "Enough prescription painkillers were prescribed in 2010 to medicate every American adult continually for a month," she noted. The authors found that all but two states had drug-monitoring programs in place.
The key indicators used in the report card are as follows:
– Does the state have a strong youth sports concussion safety law? Fourteen states do not.
– Did the state enact a prescription drug-monitoring program? Two states and the District of Columbia have not.
– Does the state allow people in dating relationships to get protection orders? Only six states do not.
– Did the state receive an A grade according to the teen dating violence laws analysis conducted by the Break the Cycle organization? Forty-four states did not.
– Does the state have a primary seat belt law? Eighteen states do not.
– Does the state require mandatory ignition interlocks for all convicted drunk drivers, even first-time offenders? Thirty-four states and the District of Columbia do not.
– Does the state have a law requiring helmets for all motorcycle riders? Thirty-one states do not.
– Does the state require car seats or booster seats for children at least to age 8? Seventeen states do not.
– Does the state require bicycle helmets for all children? Twenty-nine states do not.
– Did more than 90% of injury discharges from hospitals in the state receive external cause-of-injury coding, which helps researchers and health officials track trends and evaluate prevention programs? Twenty-seven states and the District of Columbia did not.
The report identified other top causes of injury and emerging threats, including bullying, vehicular collisions that occur while the driver is texting, and falls.
According to the report, one person dies from an injury every 3 minutes, and injuries generate $406 billion annually in lifetime costs for medical care and lost productivity. Around 50 million Americans (18% of the population) are medically treated for injuries each year. Each year, more than 29 million people are treated in emergency departments for injuries, 2.8 million are hospitalized, and more than 180,000 die, according to the report. Roughly 9.2 million youth under the age of 20 years are treated in emergency departments for accidental injuries each year, and more than 12,000 of them die.
No conflicts of interest were reported for the authors.
More than half of U.S. states (29) do not require bicycle helmets for all children, and 14 states do not have strong laws to prevent youth concussion during sports, according to a report card on injury prevention released May 22.
The report card is part of a new report on injury prevention – "The Facts Hurt: A State-By-State Injury Prevention Policy Report" – released by the Trust for America’s Health and the Robert Wood Johnson Foundation. The report was developed in partnership with leading injury-prevention experts from the Safe States Alliance and the Society for the Advancement of Violence and Injury Research.
Injuries are the third leading cause of death nationally and are the leading cause of death for Americans between the ages of 1 and 44 years. Almost half of states (24) scored a 5 out of 10 or lower on the report card, which consists of 10 injury-prevention indicators. California and New York received the highest score of 9; Montana and Ohio scored the lowest with 2.
"Overall, we need to redouble our efforts to make safety research and policy a national priority. There’s compelling evidence that we should adopt, implement, and enforce any existing policies and programs to help spare millions of Americans from needless harm," said Andrea Gielen, Sc.D., director of the Johns Hopkins Center for Injury Research and Policy and past president of the Society for the Advancement of Violence and Injury Research.
"We know that bicycle crashes lead to around 700 deaths and more than 500,000 emergency room visits each year," said Dr. Gielen. "According to research, wearing an approved helmet in the proper way provides up to an 88% reduction in the risk of head and brain injury for bicyclists of all ages."
Brain injury as a result of sports participation also has garnered more attention in the United States in recent years. However, some states have yet to pass protective laws, according to Amber Williams, executive director of the Safe States Alliance.
"We focused on the growing understanding of steps that can be taken to reduce injuries in youth sports," she said. Prevention measures should include education, removal from play for suspected concussion, and required return-to-play evaluations.
The report includes data on the growing misuse of prescription drugs, particularly painkillers, Ms. Williams said. Sales of prescription painkillers tripled between 1999 and 2010, as did the number of fatal poisonings due to prescription pain medication. "Enough prescription painkillers were prescribed in 2010 to medicate every American adult continually for a month," she noted. The authors found that all but two states had drug-monitoring programs in place.
The key indicators used in the report card are as follows:
– Does the state have a strong youth sports concussion safety law? Fourteen states do not.
– Did the state enact a prescription drug-monitoring program? Two states and the District of Columbia have not.
– Does the state allow people in dating relationships to get protection orders? Only six states do not.
– Did the state receive an A grade according to the teen dating violence laws analysis conducted by the Break the Cycle organization? Forty-four states did not.
– Does the state have a primary seat belt law? Eighteen states do not.
– Does the state require mandatory ignition interlocks for all convicted drunk drivers, even first-time offenders? Thirty-four states and the District of Columbia do not.
– Does the state have a law requiring helmets for all motorcycle riders? Thirty-one states do not.
– Does the state require car seats or booster seats for children at least to age 8? Seventeen states do not.
– Does the state require bicycle helmets for all children? Twenty-nine states do not.
– Did more than 90% of injury discharges from hospitals in the state receive external cause-of-injury coding, which helps researchers and health officials track trends and evaluate prevention programs? Twenty-seven states and the District of Columbia did not.
The report identified other top causes of injury and emerging threats, including bullying, vehicular collisions that occur while the driver is texting, and falls.
According to the report, one person dies from an injury every 3 minutes, and injuries generate $406 billion annually in lifetime costs for medical care and lost productivity. Around 50 million Americans (18% of the population) are medically treated for injuries each year. Each year, more than 29 million people are treated in emergency departments for injuries, 2.8 million are hospitalized, and more than 180,000 die, according to the report. Roughly 9.2 million youth under the age of 20 years are treated in emergency departments for accidental injuries each year, and more than 12,000 of them die.
No conflicts of interest were reported for the authors.
More than half of U.S. states (29) do not require bicycle helmets for all children, and 14 states do not have strong laws to prevent youth concussion during sports, according to a report card on injury prevention released May 22.
The report card is part of a new report on injury prevention – "The Facts Hurt: A State-By-State Injury Prevention Policy Report" – released by the Trust for America’s Health and the Robert Wood Johnson Foundation. The report was developed in partnership with leading injury-prevention experts from the Safe States Alliance and the Society for the Advancement of Violence and Injury Research.
Injuries are the third leading cause of death nationally and are the leading cause of death for Americans between the ages of 1 and 44 years. Almost half of states (24) scored a 5 out of 10 or lower on the report card, which consists of 10 injury-prevention indicators. California and New York received the highest score of 9; Montana and Ohio scored the lowest with 2.
"Overall, we need to redouble our efforts to make safety research and policy a national priority. There’s compelling evidence that we should adopt, implement, and enforce any existing policies and programs to help spare millions of Americans from needless harm," said Andrea Gielen, Sc.D., director of the Johns Hopkins Center for Injury Research and Policy and past president of the Society for the Advancement of Violence and Injury Research.
"We know that bicycle crashes lead to around 700 deaths and more than 500,000 emergency room visits each year," said Dr. Gielen. "According to research, wearing an approved helmet in the proper way provides up to an 88% reduction in the risk of head and brain injury for bicyclists of all ages."
Brain injury as a result of sports participation also has garnered more attention in the United States in recent years. However, some states have yet to pass protective laws, according to Amber Williams, executive director of the Safe States Alliance.
"We focused on the growing understanding of steps that can be taken to reduce injuries in youth sports," she said. Prevention measures should include education, removal from play for suspected concussion, and required return-to-play evaluations.
The report includes data on the growing misuse of prescription drugs, particularly painkillers, Ms. Williams said. Sales of prescription painkillers tripled between 1999 and 2010, as did the number of fatal poisonings due to prescription pain medication. "Enough prescription painkillers were prescribed in 2010 to medicate every American adult continually for a month," she noted. The authors found that all but two states had drug-monitoring programs in place.
The key indicators used in the report card are as follows:
– Does the state have a strong youth sports concussion safety law? Fourteen states do not.
– Did the state enact a prescription drug-monitoring program? Two states and the District of Columbia have not.
– Does the state allow people in dating relationships to get protection orders? Only six states do not.
– Did the state receive an A grade according to the teen dating violence laws analysis conducted by the Break the Cycle organization? Forty-four states did not.
– Does the state have a primary seat belt law? Eighteen states do not.
– Does the state require mandatory ignition interlocks for all convicted drunk drivers, even first-time offenders? Thirty-four states and the District of Columbia do not.
– Does the state have a law requiring helmets for all motorcycle riders? Thirty-one states do not.
– Does the state require car seats or booster seats for children at least to age 8? Seventeen states do not.
– Does the state require bicycle helmets for all children? Twenty-nine states do not.
– Did more than 90% of injury discharges from hospitals in the state receive external cause-of-injury coding, which helps researchers and health officials track trends and evaluate prevention programs? Twenty-seven states and the District of Columbia did not.
The report identified other top causes of injury and emerging threats, including bullying, vehicular collisions that occur while the driver is texting, and falls.
According to the report, one person dies from an injury every 3 minutes, and injuries generate $406 billion annually in lifetime costs for medical care and lost productivity. Around 50 million Americans (18% of the population) are medically treated for injuries each year. Each year, more than 29 million people are treated in emergency departments for injuries, 2.8 million are hospitalized, and more than 180,000 die, according to the report. Roughly 9.2 million youth under the age of 20 years are treated in emergency departments for accidental injuries each year, and more than 12,000 of them die.
No conflicts of interest were reported for the authors.
Lymphadenectomy Underused in GI Cancer Surgery
SAN DIEGO – Lymph node removal during gastrointestinal cancer surgery remains underperformed in a large proportion of patients in the United States, although the median number of resected nodes increased from 1998 to 2009.
Those are the key findings of a 10-year analysis of medical records from the National Cancer Institute’s Surveillance Epidemiology and End Results (SEER) database.

Several reports in the literature show a correlation between long-term survival and the removal of possibly metastatic lymph nodes along with the cancerous organ during surgery, Dr. Attila Dubecz explained in an interview at the annual Digestive Disease Week. There are also survival differences based on sex, race or poverty status, and differences in lymph node removal between these groups in certain cancer types, he said. "We wanted to determine if these differences are more related to cancer types therefore the type of operation, for example or to these underprivileged groups."
Using SEER data from 1998 to 2009, Dr. Dubecz of Klinikum Nürnberg (Germany) and his colleagues identified 326,243 patients with a surgically treated GI malignancy. This included 13,165 malignancies in the esophagus, 18,588 in the stomach, 7,666 in the small bowel, 232,345 in the colon, 42,338 in the rectum, and 12,141 in the pancreas.
Adequate lymphadenectomy was defined as removal of at least 15 lymph nodes for cancer of the esophagus and the stomach; at least 12 for cancer of the small bowel, colon, and rectum; and at least 15 for cancer of the pancreas. The researchers evaluated the median number of lymph nodes removed and the prevalence of adequate and/or no lymphadenectomy for each cancer type over the 10-year period. They used multivariate logistic regression analysis to identify factors predicting adequate lymphadenectomy.
Dr. Dubecz, a surgeon, reported that the median number of excised nodes improved over the 10-year period in all types of cancer: from 7 to 13 in esophageal cancer, 8 to 12 in stomach cancer, 2 to 7 in small bowel cancer, 9 to 16 in colon cancer, 8 to 13 in rectal cancer, and 7 to 13 in pancreatic cancer.
In addition, the percentage of patients with an adequate lymphadenectomy (a median of 49% for all types) steadily increased and those with zero nodes removed (a median of 6% for all types) steadily decreased in all types of cancer, "although both remained far from ideal," the researchers wrote.
By 2009, the percentage of patients with adequate lymphadenectomy was 43% for esophageal cancer, 42% for stomach cancer, 35% for small bowel cancer, 77% for colon cancer, 61% for rectal cancer and 42% for pancreatic cancer. Men, patients older than age 65, or those undergoing surgical therapy earlier in the study period and living in areas with high poverty rates were significantly less likely to receive adequate lymphadenectomy (P less than .0001 for all groups).
"The main surprise was that race was an insignificant factor, and gender, age, and socioeconomic differences between the groups with adequate versus inadequate lymph node dissection were also much less [than] between the groups of different cancer types," Dr. Dubecz said at the annual meeting of the Digestive Disease Week.
Dr. Dubecz acknowledged certain limitations of the study, including the potential for misclassification of patient information in the SEER database. "Furthermore, despite being advocated by several practice organizations and consensus panels, the definitions of adequate lymphadenectomy used in this study are not universally accepted," he noted. "Third, our analyses are limited to the available variables in the SEER database with no information regarding patient insurance status, comorbidities, body mass index, or [neo]adjuvant chemotherapy, which could influence lymph node dissection and the disparities."
Dr. Dubecz said he had no relevant financial disclosures.
SAN DIEGO – Lymph node removal during gastrointestinal cancer surgery remains underperformed in a large proportion of patients in the United States, although the median number of resected nodes increased from 1998 to 2009.
Those are the key findings of a 10-year analysis of medical records from the National Cancer Institute’s Surveillance Epidemiology and End Results (SEER) database.
Several reports in the literature show a correlation between long-term survival and the removal of possibly metastatic lymph nodes along with the cancerous organ during surgery, Dr. Attila Dubecz explained in an interview at the annual Digestive Disease Week. There are also survival differences based on sex, race or poverty status, and differences in lymph node removal between these groups in certain cancer types, he said. "We wanted to determine if these differences are more related to cancer types therefore the type of operation, for example or to these underprivileged groups."
Using SEER data from 1998 to 2009, Dr. Dubecz of Klinikum Nürnberg (Germany) and his colleagues identified 326,243 patients with a surgically treated GI malignancy. This included 13,165 malignancies in the esophagus, 18,588 in the stomach, 7,666 in the small bowel, 232,345 in the colon, 42,338 in the rectum, and 12,141 in the pancreas.
Adequate lymphadenectomy was defined as removal of at least 15 lymph nodes for cancer of the esophagus and the stomach; at least 12 for cancer of the small bowel, colon, and rectum; and at least 15 for cancer of the pancreas. The researchers evaluated the median number of lymph nodes removed and the prevalence of adequate and/or no lymphadenectomy for each cancer type over the 10-year period. They used multivariate logistic regression analysis to identify factors predicting adequate lymphadenectomy.
Dr. Dubecz, a surgeon, reported that the median number of excised nodes improved over the 10-year period in all types of cancer: from 7 to 13 in esophageal cancer, 8 to 12 in stomach cancer, 2 to 7 in small bowel cancer, 9 to 16 in colon cancer, 8 to 13 in rectal cancer, and 7 to 13 in pancreatic cancer.
In addition, the percentage of patients with an adequate lymphadenectomy (a median of 49% for all types) steadily increased and those with zero nodes removed (a median of 6% for all types) steadily decreased in all types of cancer, "although both remained far from ideal," the researchers wrote.
By 2009, the percentage of patients with adequate lymphadenectomy was 43% for esophageal cancer, 42% for stomach cancer, 35% for small bowel cancer, 77% for colon cancer, 61% for rectal cancer and 42% for pancreatic cancer. Men, patients older than age 65, or those undergoing surgical therapy earlier in the study period and living in areas with high poverty rates were significantly less likely to receive adequate lymphadenectomy (P less than .0001 for all groups).
"The main surprise was that race was an insignificant factor, and gender, age, and socioeconomic differences between the groups with adequate versus inadequate lymph node dissection were also much less [than] between the groups of different cancer types," Dr. Dubecz said at the annual meeting of the Digestive Disease Week.
Dr. Dubecz acknowledged certain limitations of the study, including the potential for misclassification of patient information in the SEER database. "Furthermore, despite being advocated by several practice organizations and consensus panels, the definitions of adequate lymphadenectomy used in this study are not universally accepted," he noted. "Third, our analyses are limited to the available variables in the SEER database with no information regarding patient insurance status, comorbidities, body mass index, or [neo]adjuvant chemotherapy, which could influence lymph node dissection and the disparities."
Dr. Dubecz said he had no relevant financial disclosures.
SAN DIEGO – Lymph node removal during gastrointestinal cancer surgery remains underperformed in a large proportion of patients in the United States, although the median number of resected nodes increased from 1998 to 2009.
Those are the key findings of a 10-year analysis of medical records from the National Cancer Institute’s Surveillance Epidemiology and End Results (SEER) database.
Several reports in the literature show a correlation between long-term survival and the removal of possibly metastatic lymph nodes along with the cancerous organ during surgery, Dr. Attila Dubecz explained in an interview at the annual Digestive Disease Week. There are also survival differences based on sex, race or poverty status, and differences in lymph node removal between these groups in certain cancer types, he said. "We wanted to determine if these differences are more related to cancer types therefore the type of operation, for example or to these underprivileged groups."
Using SEER data from 1998 to 2009, Dr. Dubecz of Klinikum Nürnberg (Germany) and his colleagues identified 326,243 patients with a surgically treated GI malignancy. This included 13,165 malignancies in the esophagus, 18,588 in the stomach, 7,666 in the small bowel, 232,345 in the colon, 42,338 in the rectum, and 12,141 in the pancreas.
Adequate lymphadenectomy was defined as removal of at least 15 lymph nodes for cancer of the esophagus and the stomach; at least 12 for cancer of the small bowel, colon, and rectum; and at least 15 for cancer of the pancreas. The researchers evaluated the median number of lymph nodes removed and the prevalence of adequate and/or no lymphadenectomy for each cancer type over the 10-year period. They used multivariate logistic regression analysis to identify factors predicting adequate lymphadenectomy.
Dr. Dubecz, a surgeon, reported that the median number of excised nodes improved over the 10-year period in all types of cancer: from 7 to 13 in esophageal cancer, 8 to 12 in stomach cancer, 2 to 7 in small bowel cancer, 9 to 16 in colon cancer, 8 to 13 in rectal cancer, and 7 to 13 in pancreatic cancer.
In addition, the percentage of patients with an adequate lymphadenectomy (a median of 49% for all types) steadily increased and those with zero nodes removed (a median of 6% for all types) steadily decreased in all types of cancer, "although both remained far from ideal," the researchers wrote.
By 2009, the percentage of patients with adequate lymphadenectomy was 43% for esophageal cancer, 42% for stomach cancer, 35% for small bowel cancer, 77% for colon cancer, 61% for rectal cancer and 42% for pancreatic cancer. Men, patients older than age 65, or those undergoing surgical therapy earlier in the study period and living in areas with high poverty rates were significantly less likely to receive adequate lymphadenectomy (P less than .0001 for all groups).
"The main surprise was that race was an insignificant factor, and gender, age, and socioeconomic differences between the groups with adequate versus inadequate lymph node dissection were also much less [than] between the groups of different cancer types," Dr. Dubecz said at the annual meeting of the Digestive Disease Week.
Dr. Dubecz acknowledged certain limitations of the study, including the potential for misclassification of patient information in the SEER database. "Furthermore, despite being advocated by several practice organizations and consensus panels, the definitions of adequate lymphadenectomy used in this study are not universally accepted," he noted. "Third, our analyses are limited to the available variables in the SEER database with no information regarding patient insurance status, comorbidities, body mass index, or [neo]adjuvant chemotherapy, which could influence lymph node dissection and the disparities."
Dr. Dubecz said he had no relevant financial disclosures.
FROM THE ANNUAL DIGESTIVE DISEASE WEEK
Major Finding: By 2009, the percentage of patients with adequate lymphadenectomy during surgery for gastrointestinal cancer was 43% for esophageal cancer, 42% for stomach cancer, 35% for small bowel cancer, 77% for colon cancer, 61% for rectal cancer, and 42% for pancreatic cancer.
Data Source: Findings are based on a 10-year analysis of medical records from 326,243 patients in the National Cancer Institute’s Surveillance Epidemiology and End Results (SEER) database.
Disclosures: Dr. Dubecz said he had no relevant financial disclosures.
Rise in Adolescent NAFLD Outpacing Obesity
Obese children seem to have gotten fatter around the middle over time, and that development may account in part for an observed increase in suspected nonalcoholic fatty liver disease among adolescents.
Nonalcoholic fatty liver disease (NAFLD) in adolescents has nearly tripled from 1998 to 2008, Dr. Miriam Vos said during a teleconference reporting the results of an observational study that she will present on Monday, May 21, at Digestive Disease Week 2012. In a review of nationally representative data from the National Health and Nutrition Examination Survey (NHANES), the tripling of NAFLD cases outpaced a near doubling of adolescent obesity during the same period.

Thus, "our findings suggest that obesity alone does not explain the growing prevalence of the liver disease," she said.
The most common cause of chronic pediatric liver disease, NAFLD has been associated with hypertension, type 2 diabetes, metabolic abnormalities, liver damage, and cancer. Anecdotal data have previously suggested a risk in NAFLD that was linked to obesity in children, but "this finding has not been confirmed in previous studies," said Dr. Vos of Children’s Healthcare of Atlanta. "We wanted to know whether the rates seem high because clinicians are looking more closely [for NAFLD] or because there really are more cases."
The researchers examined the NHANES data sets from 1988 to 2008, which account for 10,359 12- to 18-year-olds after those with incomplete information or known liver disease were excluded.
More conservative cutoff parameters for suspected NAFLD were implemented during the period of the study, so the researchers conducted their analyses using both cutoffs to allow for comparisons with earlier studies, Dr. Vos explained. "Based on the earlier cut-off, [NAFLD] was suspected in adolescents with a BMI in the 85th percentile or higher, and elevated [ALT] levels (defined as greater than 30)," she said. The newly recommended ALT cutoffs are sex-specific; NAFLD is suspected in adolescents in the same BMI range, but at ALT levels greater than 25.8 for boys and 22.1 for girls (Gastroenterology 2010;138:1357-64).
When the sex-specific cutoffs were used, NAFLD rates "increased among all adolescents, from 3.6% to 9.9%," she said.
Dr. Vos said that age, sex, race, and percentage of overweight adolescents did not differ from 1988 to 2008; however, the percentage of overweight adolescents who were obese increased significantly (from 11.2% to 20.6%).
Among overweight adolescents, the prevalence of elevated ALT levels was 13.2% in 2007-2008, which did not represent a significant linear increase over time. Among obese adolescents, however, elevated ALT levels rose from 16.7% to 36.9% from 1988 to 2008. Similar increases were observed in this group when the previous ALT cutoff of 30 was used, as well.
The findings may be limited somewhat by the study’s inclusion criteria, according to Dr. Vos. "It’s tricky to identify NAFLD using population data like this, so we set our definition to look at overweight children who also have elevated serum ALT. By choosing to look only at the overweight children, we might have missed some cases."
Even so, the findings are important from a public health standpoint. "We need to know this kind of information to plan programs that tackle the prevention and treatment of NAFLD, and it also helps us look for clues about why so many children are getting fatty liver disease," Dr. Vos said.
"We need to look beyond just the increase in obesity among children." For example, a further analysis of the cross-sectional data found a parallel increase between NAFLD prevalence and waist circumference. "While the cross-sectional design of our study can’t point to causation, we can hypothesize that the increase in NAFLD may be linked to an increase in visceral adiposity or centrally located fat in kids today," she said, noting that what might be causing such increases is fodder for additional investigation.
Dr. Vos has received financial support in the form of a career award from the National Institute of Diabetes and Digestive and Kidney Diseases, and from the Children’s Digestive Health and Nutrition Foundation. She is the author of "The No-Diet Obesity Solution for Kids" (Bethesda, Md.: AGA Institute Press, 2009), for which she receives royalties.
Obese children seem to have gotten fatter around the middle over time, and that development may account in part for an observed increase in suspected nonalcoholic fatty liver disease among adolescents.
Nonalcoholic fatty liver disease (NAFLD) in adolescents has nearly tripled from 1998 to 2008, Dr. Miriam Vos said during a teleconference reporting the results of an observational study that she will present on Monday, May 21, at Digestive Disease Week 2012. In a review of nationally representative data from the National Health and Nutrition Examination Survey (NHANES), the tripling of NAFLD cases outpaced a near doubling of adolescent obesity during the same period.
Thus, "our findings suggest that obesity alone does not explain the growing prevalence of the liver disease," she said.
The most common cause of chronic pediatric liver disease, NAFLD has been associated with hypertension, type 2 diabetes, metabolic abnormalities, liver damage, and cancer. Anecdotal data have previously suggested a risk in NAFLD that was linked to obesity in children, but "this finding has not been confirmed in previous studies," said Dr. Vos of Children’s Healthcare of Atlanta. "We wanted to know whether the rates seem high because clinicians are looking more closely [for NAFLD] or because there really are more cases."
The researchers examined the NHANES data sets from 1988 to 2008, which account for 10,359 12- to 18-year-olds after those with incomplete information or known liver disease were excluded.
More conservative cutoff parameters for suspected NAFLD were implemented during the period of the study, so the researchers conducted their analyses using both cutoffs to allow for comparisons with earlier studies, Dr. Vos explained. "Based on the earlier cut-off, [NAFLD] was suspected in adolescents with a BMI in the 85th percentile or higher, and elevated [ALT] levels (defined as greater than 30)," she said. The newly recommended ALT cutoffs are sex-specific; NAFLD is suspected in adolescents in the same BMI range, but at ALT levels greater than 25.8 for boys and 22.1 for girls (Gastroenterology 2010;138:1357-64).
When the sex-specific cutoffs were used, NAFLD rates "increased among all adolescents, from 3.6% to 9.9%," she said.
Dr. Vos said that age, sex, race, and percentage of overweight adolescents did not differ from 1988 to 2008; however, the percentage of overweight adolescents who were obese increased significantly (from 11.2% to 20.6%).
Among overweight adolescents, the prevalence of elevated ALT levels was 13.2% in 2007-2008, which did not represent a significant linear increase over time. Among obese adolescents, however, elevated ALT levels rose from 16.7% to 36.9% from 1988 to 2008. Similar increases were observed in this group when the previous ALT cutoff of 30 was used, as well.
The findings may be limited somewhat by the study’s inclusion criteria, according to Dr. Vos. "It’s tricky to identify NAFLD using population data like this, so we set our definition to look at overweight children who also have elevated serum ALT. By choosing to look only at the overweight children, we might have missed some cases."
Even so, the findings are important from a public health standpoint. "We need to know this kind of information to plan programs that tackle the prevention and treatment of NAFLD, and it also helps us look for clues about why so many children are getting fatty liver disease," Dr. Vos said.
"We need to look beyond just the increase in obesity among children." For example, a further analysis of the cross-sectional data found a parallel increase between NAFLD prevalence and waist circumference. "While the cross-sectional design of our study can’t point to causation, we can hypothesize that the increase in NAFLD may be linked to an increase in visceral adiposity or centrally located fat in kids today," she said, noting that what might be causing such increases is fodder for additional investigation.
Dr. Vos has received financial support in the form of a career award from the National Institute of Diabetes and Digestive and Kidney Diseases, and from the Children’s Digestive Health and Nutrition Foundation. She is the author of "The No-Diet Obesity Solution for Kids" (Bethesda, Md.: AGA Institute Press, 2009), for which she receives royalties.
Obese children seem to have gotten fatter around the middle over time, and that development may account in part for an observed increase in suspected nonalcoholic fatty liver disease among adolescents.
Nonalcoholic fatty liver disease (NAFLD) in adolescents has nearly tripled from 1998 to 2008, Dr. Miriam Vos said during a teleconference reporting the results of an observational study that she will present on Monday, May 21, at Digestive Disease Week 2012. In a review of nationally representative data from the National Health and Nutrition Examination Survey (NHANES), the tripling of NAFLD cases outpaced a near doubling of adolescent obesity during the same period.
Thus, "our findings suggest that obesity alone does not explain the growing prevalence of the liver disease," she said.
The most common cause of chronic pediatric liver disease, NAFLD has been associated with hypertension, type 2 diabetes, metabolic abnormalities, liver damage, and cancer. Anecdotal data have previously suggested a risk in NAFLD that was linked to obesity in children, but "this finding has not been confirmed in previous studies," said Dr. Vos of Children’s Healthcare of Atlanta. "We wanted to know whether the rates seem high because clinicians are looking more closely [for NAFLD] or because there really are more cases."
The researchers examined the NHANES data sets from 1988 to 2008, which account for 10,359 12- to 18-year-olds after those with incomplete information or known liver disease were excluded.
More conservative cutoff parameters for suspected NAFLD were implemented during the period of the study, so the researchers conducted their analyses using both cutoffs to allow for comparisons with earlier studies, Dr. Vos explained. "Based on the earlier cut-off, [NAFLD] was suspected in adolescents with a BMI in the 85th percentile or higher, and elevated [ALT] levels (defined as greater than 30)," she said. The newly recommended ALT cutoffs are sex-specific; NAFLD is suspected in adolescents in the same BMI range, but at ALT levels greater than 25.8 for boys and 22.1 for girls (Gastroenterology 2010;138:1357-64).
When the sex-specific cutoffs were used, NAFLD rates "increased among all adolescents, from 3.6% to 9.9%," she said.
Dr. Vos said that age, sex, race, and percentage of overweight adolescents did not differ from 1988 to 2008; however, the percentage of overweight adolescents who were obese increased significantly (from 11.2% to 20.6%).
Among overweight adolescents, the prevalence of elevated ALT levels was 13.2% in 2007-2008, which did not represent a significant linear increase over time. Among obese adolescents, however, elevated ALT levels rose from 16.7% to 36.9% from 1988 to 2008. Similar increases were observed in this group when the previous ALT cutoff of 30 was used, as well.
The findings may be limited somewhat by the study’s inclusion criteria, according to Dr. Vos. "It’s tricky to identify NAFLD using population data like this, so we set our definition to look at overweight children who also have elevated serum ALT. By choosing to look only at the overweight children, we might have missed some cases."
Even so, the findings are important from a public health standpoint. "We need to know this kind of information to plan programs that tackle the prevention and treatment of NAFLD, and it also helps us look for clues about why so many children are getting fatty liver disease," Dr. Vos said.
"We need to look beyond just the increase in obesity among children." For example, a further analysis of the cross-sectional data found a parallel increase between NAFLD prevalence and waist circumference. "While the cross-sectional design of our study can’t point to causation, we can hypothesize that the increase in NAFLD may be linked to an increase in visceral adiposity or centrally located fat in kids today," she said, noting that what might be causing such increases is fodder for additional investigation.
Dr. Vos has received financial support in the form of a career award from the National Institute of Diabetes and Digestive and Kidney Diseases, and from the Children’s Digestive Health and Nutrition Foundation. She is the author of "The No-Diet Obesity Solution for Kids" (Bethesda, Md.: AGA Institute Press, 2009), for which she receives royalties.
FROM THE ANNUAL DIGESTIVE DISEASE WEEK
Major Finding: Among obese adolescents, elevated ALT levels rose from 16.7% in 1988 to 36.9% in 2008.
Data Source: A retrospective analysis of nationally representative data in 12-18 years from the National Health and Examination Survey datasets for 1988-2008.
Disclosures: Dr. Vos has received financial support in the form of a career award from the NIDDK and from the Children’s Digestive Health and Nutrition Foundation. She is the author of "The No-Diet Obesity Solution for Kids" for which she receives royalties.
FDA approves drugs faster than EMA, Health Canada
The FDA generally approves drugs faster than its Canadian and European counterparts, according to a study published in this week’s edition of NEJM.
The researchers say these results refute criticisms that the drug approval process in the US is slow and that agencies in other countries tend to approve new therapies first.
“The perception that the FDA is too slow implies that sick patients are waiting unnecessarily for regulators to complete their review of new drug applications,” said lead study author Nicholas Downing, a medical student at Yale University.
He and his colleagues decided to conduct this study because there have been no recent comparisons of the FDA’s review speed with that of agencies in other countries.
So the researchers reviewed drug approval decisions made by the FDA, Health Canada, and the European Medicines Agency (EMA) between 2001 and 2010. The team said they chose Health Canada and the EMA as comparisons because these agencies face similar pressures to approve new drugs quickly while ensuring they don’t put patients at risk.
The investigators studied each regulator’s database of drug approvals to identify novel therapeutics, as well as the timing of key regulatory events. They then calculated each agency’s review speed.
The median total time to review a new drug application was 322 days at the FDA, 366 days at the EMA, and 393 days at Health Canada.
“Among the subsample of drugs approved for all 3 regulators, the FDA’s reviews were over 3 months faster than those of the EMA or Health Canada,” Downing said. “The total review time at the FDA was faster than EMA, despite the FDA’s far higher proportion of applications requiring multiple regulatory reviews.”
The researchers also found that, during the review period, the FDA approved 225 new drugs, the EMA approved 186, and Health Canada approved 99. Additionally, of the therapies that have been approved by all 3 agencies, most drugs were first approved in the US.
“[W]e found that 64% of medicines approved in both the US and in Europe were approved for US patients first,” Downing said. “And 86% of medicines approved in both the US and Canada were also approved first in the US.”
Downing and his colleagues noted that this study has 2 key limitations. First, the researchers didn’t account for drugs that were ultimately rejected, as the regulatory agencies don’t release review times for drugs that are never approved. However, the team also pointed out that the FDA approves more than 80% of its applications, so the exclusion may not have made much of an impact.
Secondly, the study included only new molecular entities and original biologic agents. In order to get a more accurate reading on the regulatory review process, research would need to evaluate the review of generic drugs, reformulated drugs, combination therapies, and medical devices.
The FDA generally approves drugs faster than its Canadian and European counterparts, according to a study published in this week’s edition of NEJM.
The researchers say these results refute criticisms that the drug approval process in the US is slow and that agencies in other countries tend to approve new therapies first.
“The perception that the FDA is too slow implies that sick patients are waiting unnecessarily for regulators to complete their review of new drug applications,” said lead study author Nicholas Downing, a medical student at Yale University.
He and his colleagues decided to conduct this study because there have been no recent comparisons of the FDA’s review speed with that of agencies in other countries.
So the researchers reviewed drug approval decisions made by the FDA, Health Canada, and the European Medicines Agency (EMA) between 2001 and 2010. The team said they chose Health Canada and the EMA as comparisons because these agencies face similar pressures to approve new drugs quickly while ensuring they don’t put patients at risk.
The investigators studied each regulator’s database of drug approvals to identify novel therapeutics, as well as the timing of key regulatory events. They then calculated each agency’s review speed.
The median total time to review a new drug application was 322 days at the FDA, 366 days at the EMA, and 393 days at Health Canada.
“Among the subsample of drugs approved for all 3 regulators, the FDA’s reviews were over 3 months faster than those of the EMA or Health Canada,” Downing said. “The total review time at the FDA was faster than EMA, despite the FDA’s far higher proportion of applications requiring multiple regulatory reviews.”
The researchers also found that, during the review period, the FDA approved 225 new drugs, the EMA approved 186, and Health Canada approved 99. Additionally, of the therapies that have been approved by all 3 agencies, most drugs were first approved in the US.
“[W]e found that 64% of medicines approved in both the US and in Europe were approved for US patients first,” Downing said. “And 86% of medicines approved in both the US and Canada were also approved first in the US.”
Downing and his colleagues noted that this study has 2 key limitations. First, the researchers didn’t account for drugs that were ultimately rejected, as the regulatory agencies don’t release review times for drugs that are never approved. However, the team also pointed out that the FDA approves more than 80% of its applications, so the exclusion may not have made much of an impact.
Secondly, the study included only new molecular entities and original biologic agents. In order to get a more accurate reading on the regulatory review process, research would need to evaluate the review of generic drugs, reformulated drugs, combination therapies, and medical devices.
The FDA generally approves drugs faster than its Canadian and European counterparts, according to a study published in this week’s edition of NEJM.
The researchers say these results refute criticisms that the drug approval process in the US is slow and that agencies in other countries tend to approve new therapies first.
“The perception that the FDA is too slow implies that sick patients are waiting unnecessarily for regulators to complete their review of new drug applications,” said lead study author Nicholas Downing, a medical student at Yale University.
He and his colleagues decided to conduct this study because there have been no recent comparisons of the FDA’s review speed with that of agencies in other countries.
So the researchers reviewed drug approval decisions made by the FDA, Health Canada, and the European Medicines Agency (EMA) between 2001 and 2010. The team said they chose Health Canada and the EMA as comparisons because these agencies face similar pressures to approve new drugs quickly while ensuring they don’t put patients at risk.
The investigators studied each regulator’s database of drug approvals to identify novel therapeutics, as well as the timing of key regulatory events. They then calculated each agency’s review speed.
The median total time to review a new drug application was 322 days at the FDA, 366 days at the EMA, and 393 days at Health Canada.
“Among the subsample of drugs approved for all 3 regulators, the FDA’s reviews were over 3 months faster than those of the EMA or Health Canada,” Downing said. “The total review time at the FDA was faster than EMA, despite the FDA’s far higher proportion of applications requiring multiple regulatory reviews.”
The researchers also found that, during the review period, the FDA approved 225 new drugs, the EMA approved 186, and Health Canada approved 99. Additionally, of the therapies that have been approved by all 3 agencies, most drugs were first approved in the US.
“[W]e found that 64% of medicines approved in both the US and in Europe were approved for US patients first,” Downing said. “And 86% of medicines approved in both the US and Canada were also approved first in the US.”
Downing and his colleagues noted that this study has 2 key limitations. First, the researchers didn’t account for drugs that were ultimately rejected, as the regulatory agencies don’t release review times for drugs that are never approved. However, the team also pointed out that the FDA approves more than 80% of its applications, so the exclusion may not have made much of an impact.
Secondly, the study included only new molecular entities and original biologic agents. In order to get a more accurate reading on the regulatory review process, research would need to evaluate the review of generic drugs, reformulated drugs, combination therapies, and medical devices.
Training a Hospitalist Workforce
DEVELOPMENT OF THE POSITION PAPER
In June of 2011, the executive leadership of the Society of Critical Care Medicine (SCCM) and the Society of Hospital Medicine (SHM) convened a daylong summit to discuss intensive care unit (ICU) workforce issues as they affect intensivists and hospitalists. Attendees included the executive leadership of both societies and invited participants with cross‐disciplinary expertise in hospital medicine and critical care medicine.0
| Pathway | Prerequisites | Duration | Minimum Clinical Training Requirements | Research Requirement |
|---|---|---|---|---|
| ||||
| Medical critical care39 | Complete a 3‐yr internal medicine program | 24 mo for general internists 12 mo for internists who are enrolled in, or have completed, an accredited 2‐yr IM fellowship | 6 mo MICU | Research required; no duration is stipulated |
| 3 mo other ICU | Research requirement waived for 1‐yr fellows | |||
| 3 mo elective (determined by individual program) | ||||
| Pulmonary critical care40 | Complete a 3‐yr internal medicine program | 36 mo | 9 mo of critical care (identical to medical critical care) | Research required, but duration not specified; generally 1218 mo |
| 9 mo of pulmonary medicine | ||||
| 6 mo of relevant electives encouraged | ||||
| 30 mo of pulmonary clinic | ||||
| Surgical critical care41, 42 | Complete at least 3 yr of training in general surgery, neurosurgery, urology, or OB/GYN | 12 mo | 8 mo in SICU | No research requirement |
| 2 mo in other ICUs | ||||
| 2 mo in relevant non‐ICU electives | ||||
| Anesthesiology critical care43 | Complete a 4‐yr anesthesiology program | 12 mo | 9 mo in ICU | No research requirement |
| 3 mo in clinical activities or research relevant to critical care | ||||
| Emergency medicine critical care | Complete an emergency medicine program and maintain ABEM board certification | 24 mo | 6 mo MICU | Research required; no duration is stipulated |
| 3 mo other ICU | ||||
| 3 mo elective (determined by individual program) | ||||
| Pediatric critical care | Complete a pediatrics or anesthesiology program | 36 mo | At least 12 mo of relevant clinical rotations; no other specifications | At least 12 mo of research |
The summit was convened to address the following issues:
-
Defining hospitalists' roles in providing ICU coverage in the presence or absence of intensivists.
-
Developing standardized and universally recognized supplementary training pathways for hospitalists who practice in the ICU.
-
Identifying clinical, logistical, and political barriers that might impair or preclude such training.
At the close of the summit, the executive leadership of both societies agreed that they had sufficient consensus on the aforementioned issues to delegate a subgroup of participants to formulate a position paper. The authors of the position paper were selected based upon their diverse professional experience, senior leadership in both SHM and SCCM, and their cross‐disciplinary expertise in hospital medicine and critical care medicine. Four of the 5 authors (E.M.S., J.R.D., M.J.G., P.A.L.) are board‐certified intensivists. Three (E.M.S., J.R.D., M.J.G.) are members of both SCCM and SHM, 2 (M.J.G., J.R.D.) are Past‐Presidents of SHM, and 1 (P.A.L.) is Immediate Past‐President of SCCM. E.M.S. and D.D.D. are current members of the SHM Board of Directors.
After the summit, the authors held several conference calls to review the structure and content of the position paper. The boards of directors of both societies independently approved a draft of the paper and the executive leadership of both societies approved subsequent revisions. The position paper was submitted for joint publication in the Journal of Hospital Medicine and Critical Care Medicine and underwent formal peer‐review by reviewers representing both societies.
INTRODUCTION
The growing shortage of intensivists and its implications for hospitalized Americans is well documented and remains an ongoing concern for hospitals, clinicians, payers, and the federal government.17 Despite numerous recommendations that intensivists manage critically ill adults,8, 9 most American hospitals cannot and will not meet this proposed standard.10, 11 When surveyed, only 20% of Michigan hospitals participating in the Keystone Project responded that they staffed their ICUs exclusively with board‐certified intensivists, and 75% maintained open ICU staffing models.12 The mismatch between intensivist supply and demand is expected to worsen as inpatient volume and acuity grow in concert with an aging and increasingly comorbid American population, yet with the exception of a 2010 agreement between the American Board of Internal Medicine (ABIM) and American Board of Emergency Medicine (ABEM) to cosponsor a medical critical care fellowship pathway for emergency medicine (EM) physicians, little has changed to expand the intensivist trainee pipeline. Although the addition of a sanctioned EM critical care pathway is a positive development, it is unlikely to significantly impact the intensivist shortage in the near term. Between 2000 and 2007, 43 emergency medicine physicians entered non‐board sanctioned American critical care fellowships,13 while in the 20112012 academic year, 1957 trainees are enrolled in adult critical care medicine fellowships (surgery, anesthesia, medical critical care, and pulmonary/critical care).14 It remains to be seen if the availability of a formal critical care pathway will significantly increase the numbers of emergency medicine physicians who pursue critical care training.
The growing intensivist shortage has coincided with the appearance of hospitalists, physicians who focus on the care of hospitalized medical patients, on the healthcare landscape.15 Increasing from 2000 to 34,000 practitioners in 15 years, hospital medicine is the fastest growing specialty in organized medicine, with an estimated plateau of as many as 50,000 practitioners.16 As of 2009, hospitalists were present in 89% of hospitals with over 200 beds, largely replacing primary care physicians as the managers of ICU patients in non‐tertiary hospital settings.16 In surveys performed by the Society of Hospital Medicine, 75% of hospitalists reported that they practice in the ICU, often shouldering much of the responsibility for managing critically ill patients.17 In 37.5% of Michigan Keystone Project hospitals, hospitalists served as attending physicians of record in the ICU.10 Although legitimate concerns have been raised about whether hospitalists are uniformly qualified to practice in the ICU, this issue has become moot at many hospitals where intensivists are either in short supply or entirely absent.1821 As previously noted by Heisler,22 the issue is no longer whether hospitalists should practice in the ICU, but rather to ensure that they do so safely, effectively, and seamlessly in collaboration with intensivists, or independently when intensivists are unavailable.
POTENTIAL VALUE OF HOSPITALISTS IN THE ICU
Hospital medicine and critical care medicine share similar competencies and values. Eighty‐five percent of practicing hospitalists are internists, who have historically been well trained to manage acutely ill hospitalized patients. Categorical internal medicine (IM) training emphasizes acute inpatient medicine, with residents spending approximately two‐thirds of their training time in the hospital. Many of the cognitive skills required for practicing critical care medicine are encompassed in categorical IM training, as well as in the Core Competencies in Hospital Medicine.23, 24 Furthermore, hospitalist staffing models are specifically adapted to meet the needs of acutely ill patients. With their consistent presence in the hospital (many programs provide 24:7 in‐house coverage), hospitalists see patients several times a day if necessary and can respond to their acute needs in real time. In many institutions, hospitalists are tasked as first responders to in‐house emergencies, often covering ICUs when intensivists are unavailable.
Most importantly, hospital medicine and critical care medicine are philosophically aligned. Both disciplines are defined by their location of practice rather than by an organ system or constellation of diseases. Both specialties embrace hospital‐based process improvement, lead multidisciplinary teams, and champion quality and safety initiatives.23, 25 Hospitalists and intensivists routinely collaborate to improve hospital care through shared protocol implementation, patient throughput management, and quality improvement initiatives. The ideology and mechanics of high‐performing hospitalist and intensivist programs are extremely similar.
LIMITATIONS OF HOSPITALISTS IN ICUs
Although the majority of hospitalists are general internists, individual hospitalists' skills may be heterogeneous, reflecting differences in training and clinical practice experience prior to becoming hospitalists. A hospitalist entering practice directly from a rigorous categorical IM training program will likely have different skills and knowledge than an ambulatory‐based general internist who makes a mid‐career switch to hospital medicine. Furthermore, increasingly stringent restrictions on housestaff work hours and patient loads, coupled with increasing emphasis on ambulatory medicine, have substantially decreased IM residents' cumulative exposure to acutely ill inpatients and inpatient procedures, raising concerns that the current generation of IM residents are less well‐prepared to manage ICU patients than their predecessors. The growing prevalence of family practitioners in the adult hospitalist workforce (currently estimated at 6%8%), who generally are not as rigorously or comprehensively trained in critical care medicine as internists, further complicates efforts to broadly categorize adult hospitalists' ICU skills.26, 27
Once hospitalists enter the workforce, they have few formal opportunities to significantly advance their critical care knowledge and skills. Existing critical care educational offerings are generally limited to 1‐ or 2‐day critical care refresher courses or narrowly focused ICU skills courses, such as acute airway management or critical care ultrasonography. These courses, while valuable, are often insufficient for hospitalists who need to broaden their general critical care knowledge base or obtain skills that they did not acquire in residency training. The result is a hospitalist workforce that practices in the ICU but has limited opportunity to enhance the skills and knowledge necessary to do so safely and competently.
ENHANCING HOSPITALISTS' SKILLS TO PROVIDE CRITICAL CARE SERVICES
In the absence of a systemic solution to the intensivist shortage, the healthcare marketplace is independently developing alternative critical care delivery solutions, such as deploying telemedicine systems and expanding the roles of nurse practitioners and physician assistants in the ICU. To a lesser extent, there have been calls for hospitalists to fill similar intensivist extender roles in the ICU, and Heisler and others have suggested developing limited, competency‐based critical care training to allow hospitalists to manage a subset of ICU patients, either independently or collaboratively with intensivists.22 Several healthcare systems are in various stages of developing such critical care training programs for their hospitalists, many of whom already practice in the ICU. These programs will likely blend fellowship‐level training with supervised attending duties in the ICU, with the expectation that graduates will be able to independently manage a portion of an ICU population (Timothy G. Buchman, MD, PhD, Department of Surgery, Emory University School of Medicine, personal communication, May 11, 2011).
Although informal hospitalist training programs could make an important contribution to ICU staffing, they raise new concerns as well. In the absence of uniform, formal training and evaluation standards, the quality and consistency of these homegrown programs could vary widely, with participants developing critical care skills and competencies that might not conform to requirements set forth by the Accreditation Council for Graduate Medical Education (ACGME). Even if training could be standardized, the practical implementation of a 2‐tier intensivist model would create extreme political and operational challenges for hospitals, which would be required to differentially credential and privilege providers with similar training and overlapping patient responsibilities. In light of these complexities and uncertainties, hospitalists might be unwilling to risk investing in lengthy training offering uncertain recognition and delineation of what they can and cannot do in the ICU.
A more durable long‐term solution is to create an ACGME‐sanctioned and accredited critical care certification pathway for IM hospitalists, with the express goal of expanding the intensivist workforce by attracting practicing hospitalists to critical care fellowship training. Hospitalists who complete such training would be full‐fledged intensivists, subject to the same privileges and expectations as any other intensivist.
We believe that many hospitalists could acquire the competencies necessary to become board‐eligible intensivists in less than the 2 years currently required for general internists to complete critical care medicine training. The existence of 6 unique pathways for critical care training and board certification in the United States, all maintaining unique training criteria and durations of training, strongly suggests that competent intensivists can be trained through disparate pathways to achieve equivalent outcomes (Table 1). For example, both surgical and anesthesia critical care programs require only a single added year of training following their respective residency training programs.28, 29 Of the 24 months that comprise a medical critical care fellowship, only 12 months of clinical duties are required, with the remainder allocated to electives, quality‐improvement initiatives, research, and other academic pursuits.30 The ACGME and ABIM have tacitly acknowledged that medical critical care training is achievable in less than 2 years, by allowing those who enter or complete accredited 2‐year fellowships in other medical specialties to obtain critical care certification with a single additional year of critical care training.30 If infectious disease and nephrology fellows can become competent intensivists with a single year of critical care training, it is reasonable to believe that experienced IM hospitalists can do so as well.
Offering a 1‐year critical care fellowship training track for experienced IM hospitalists will require careful consideration of which components of existing 2‐year critical care fellowship can be removed or condensed without materially compromising the quality of training. Hospitalists participating in a condensed 1‐year training program would need the maturity and experience to hit the ground running, mandating a robust entry bar predicated upon relevant prior clinical practice experience. We believe that 3 sequential years of prior hospitalist practice experience is a reasonable prerequisite for participation. Additionally, eligible hospitalists would need to participate in the (currently voluntary) ABIM Focused Practice in Hospital Medicine Maintenance of Certification (MOC) process,31 which mandates completion of hospital‐based education and practice improvement modules. Prior training and participation in quality improvement (QI) processes could supplant some of the scholarly activity that is currently expected during the nonclinical portion of a traditional 2‐year medical critical care fellowship, and candidates would be required to have completed at least one meaningful hospital‐based QI initiative while still in practice.
Although new curricular standards would need to be developed, 1‐year medical intensivist fellowships could coexist alongside 2‐year fellowships within a single critical care training program, as is the case when internal medicine fellows in other specialties complete an added year of critical care fellowship. However, to meaningfully impact the intensivist shortage, the number and capacity of medical critical care fellowships, which currently train approximately 10% of the critical care workforce, would need to significantly expand.13
Importantly, the impact that critical care‐trained hospitalists will have on the quality and safety of patient care in the ICU will require evaluation and study. We presume that inserting this new cohort of intensivists into previously unmanaged or undermanaged ICUs will improve care, but this, like many other uncertainties regarding optimal models of ICU staffing, should be subject to rigorous and objective examination through additional clinical research.10, 3236
Offering a 1‐year critical care training track will raise new challenges. Skepticism about the rigor and content of 1‐year programs may foster the perception that graduates are inadequately trained or skilled to function at the level of other board‐certified intensivists. It is also possible that a 1‐year hospitalistcritical care fellowship could divert trainees from traditional critical care programs, offsetting net gains in the number of intensivists. However, we suspect that a 1‐year fellowship program will attract primarily practicing hospitalists, while 2‐year tracks will continue to attract IM residents. We conceptualize participation in a 1‐year hospitalistcritical care fellowship program as a (minimum) 4‐year post‐residency commitment, consisting of at least 3 years of clinical practice as a hospitalist, followed by 1 year of critical care fellowship training. Internal medicine residents would find a shorter pathway to intensivist practice by enrolling in traditional 2‐year critical care or even 3‐year pulmonary/critical care training programs. The compensation advantage afforded to intensivists relative to hospitalists (approximately $100,000 per year) would offset any financial advantage gained by shaving a year off of critical care fellowship training.37, 38 We also suspect that those seeking careers in academic medicine would almost exclusively opt for a traditional 2‐year training pathway.
Finally, while Europe and Australia offer a single common pathway to critical care certification, the United States maintains multiple, independent, specialty‐specific training pathways, each with unique durations, requirements, and certification processes. Although consideration of this important issue is beyond the scope of this paper, we believe that developing a hospitalist‐intensivist workforce should be part of a broader initiative to reform critical care training to better meet the demand for intensivists across the spectrum of American ICUs. Adopting a global intensivist training strategy that is specialty‐independent and specific to critical care medicine may result in a more consistent, collaborative, and interoperable critical care workforce.
CONCLUSION
American critical care training programs have failed to produce enough intensivists to meet demand, and this mismatch between supply and demand will substantially worsen over upcoming decades. Hospitals and healthcare systems, faced with the mandate to provide care for their ICU populations, have already innovated to offset this shortage through the use of telemedicine and the extension of nonphysician providers into ICUs. As the gap between intensivist supply and demand widens, healthcare systems will be increasingly likely to pursue more radical solutions, up to and including independently training their own critical care workforces. We believe that there are better alternatives.
Hospitalists have rapidly proliferated to become the dominant provider of inpatient medical care in American hospitals and are already providing a substantial amount of critical care. As such, they remain a largely untapped and potentially significant source of new intensivists. The skills, competencies, and values embodied in hospital medicine are already highly congruent with those of critical care. By virtue of their numbers and penetrance into the vast majority of large American hospitals, hospitalists are well situated to make a substantial impact on the intensivist shortage. If only 5% of the projected hospitalist workforce were to receive the critical care training that we propose, 2500 new intensivists would enter the critical care workforce, substantially decreasing the impact of the national intensivist shortage.12
Internal medicine hospitalists who obtain additional training as intensivists would also bring new capabilities and flexibility to hospitals seeking to implement intensivist programs. In smaller hospitals that cannot support freestanding intensivist programs, hospitalist‐intensivists might divide their time between ICU and ward duties. In larger hospitals, these clinicians might function exclusively as intensivists alongside their traditionally trained peers. Whether they affiliate as hospitalists, intensivists, or something else entirely will largely depend upon the roles that they fulfill, the governance of their institutions, and the departments that most effectively meet their clinical and organizational needs.
Bringing qualified hospitalists into the critical care workforce through rigorous sanctioned and accredited 1‐year training programs, will open a new intensivist training pipeline and potentially offer more critically ill patients the benefit of providers who are unequivocally qualified to care for them. Similarly, unification of critical care training and certification across disciplines will better focus efforts to expand the intensivist workforce, more efficiently leverage limited training resources, and facilitate standardization of critical care skills, policies, and procedures across the nation's ICUs. Although moving this agenda forward may be logistically challenging and politically daunting, we believe that the results will be worth the effort.
Acknowledgements
Disclosure: All authors disclose no relevant or financial conflicts of interest. This position paper also published in Critical Care Medicine. (Siegal EM, Dressler DD, Dichter JR, Gorman MJ, Lipsett PA. Training a Hospitalist Workforce to Address the Intensivist Shortage in American Hospitals: A Position Paper From the Society of Hospital Medicine and the Society of Critical Care Medicine. Crit Care Med. 2012;40(6):19521956).
- ,,,,.Current and projected workforce requirements for care of the critically ill and patients with pulmonary disease: can we meet the requirements of an aging population?JAMA.2000;284(21):2762–2770.
- Health Resources and Services Administration report to Congress: the critical care workforce: a study of the supply and demand for critical care physicians. Available at: http://www.bhpr.hrsa.gov/healthworkforce/reports/criticalcare/default.htm. Accessed April 24,2011.
- ,,, et al.The critical care crisis in the United States: a report from the profession.Chest.2004;125(4):1514–1517.
- ,,,,,.The critical care medicine crisis: a call for federal action. A white paper from the critical care professional societies.Chest.2004;125(4):1518–1521.
- .Critical care workforce.Crit Care Med.2008;36(4):1350–1353.
- .Critical care workforce crisis: time to look in the mirror.Crit Care Med.2008;36(4):1385–1386.
- ,,, et al.Prioritizing the organization and management of intensive care services in the Unites States: the PrOMIS conference.Crit Care Med.2007;35:1103–1111.
- ,,,,.Association between ICU physician staffing and outcomes: a systematic review.Crit Care Med.1999;27:A43.
- The Leapfrog Group Factsheet. ICU Physician Staffing (IPS). Available at: http://www.leapfroggroup.org/media/file/FactSheet_IPS.pdf. Accessed November 20,2011.
- ,,,,,.Physician staffing patterns and clinical outcomes in critically ill patients: a systematic review.JAMA.2002;288(17):2151–2162.
- ,,,,,.Association between critical care physician management and patient mortality in the intensive care unit.Ann Intern Med.2008;148(11):801–809.
- ,,, et al.Characteristics of intensive care units in Michigan: not an open and closed case.J Hosp Med.2010;5(1):4–9.
- ,,.Current practice, demographics and trends of critical care trained emergency physicians in the United States.Acad Emer Med.2010;17:325–329.
- List of ACGME Accredited Programs and Sponsoring Institutions. Available at: http://www.acgme.org/adspublic. Accessed February 22,2012.
- ,.The emerging role of “hospitalists” in the American health care system.N Engl J Med.1996;335:514–517.
- American Hospital Association.2009 Annual Survey.Chicago, IL:American Hospital Association;2009.
- 2005–2006 Society of Hospital Medicine Compensation and Productivity Survey. Available at: http://www.hospitalmedicine.org/AM/Template.cfm?Section=Surveys24(4):2–3.
- .Hospitalists in the intensive care unit: an intensivist perspective.The Hospitalist.1999;3(4):5.
- .The new intensivists.The Hospitalist. October2008.
- .Intensive care unit staffing: an academic debate but a community crisis.Crit Care Med.2012;40(3):1032.
- .Hospitalists and intensivists: partners in caring for the critically ill—the time has come.J Hosp Med.2010;5:1–3.
- ,,,,.The core competencies in hospital medicine: a framework for curriculum development.J Hosp Med.2006;1(suppl 1):2–95.
- ,,,,.The core competencies in hospital medicine: development and methodology.J Hosp Med.2006;1:48–56.
- ,,, et al.An intervention to decrease catheter‐related bloodstream infections in the ICU.N Engl J Med.2006;355:2725–2732.
- ACGME Internal Medicine Program Requirements. Available at: http://www.acgme.org/acwebsite/rrc_140/140_prindex.asp. Accessed November 20,2011.
- ACGME Program Requirements for Resident Education in Internal Medicine. Available at: http://www.acgme.org/acWebsite/reviewComment/140_internal_medicine_PRs_R
DEVELOPMENT OF THE POSITION PAPER
In June of 2011, the executive leadership of the Society of Critical Care Medicine (SCCM) and the Society of Hospital Medicine (SHM) convened a daylong summit to discuss intensive care unit (ICU) workforce issues as they affect intensivists and hospitalists. Attendees included the executive leadership of both societies and invited participants with cross‐disciplinary expertise in hospital medicine and critical care medicine.0
| Pathway | Prerequisites | Duration | Minimum Clinical Training Requirements | Research Requirement |
|---|---|---|---|---|
| ||||
| Medical critical care39 | Complete a 3‐yr internal medicine program | 24 mo for general internists 12 mo for internists who are enrolled in, or have completed, an accredited 2‐yr IM fellowship | 6 mo MICU | Research required; no duration is stipulated |
| 3 mo other ICU | Research requirement waived for 1‐yr fellows | |||
| 3 mo elective (determined by individual program) | ||||
| Pulmonary critical care40 | Complete a 3‐yr internal medicine program | 36 mo | 9 mo of critical care (identical to medical critical care) | Research required, but duration not specified; generally 1218 mo |
| 9 mo of pulmonary medicine | ||||
| 6 mo of relevant electives encouraged | ||||
| 30 mo of pulmonary clinic | ||||
| Surgical critical care41, 42 | Complete at least 3 yr of training in general surgery, neurosurgery, urology, or OB/GYN | 12 mo | 8 mo in SICU | No research requirement |
| 2 mo in other ICUs | ||||
| 2 mo in relevant non‐ICU electives | ||||
| Anesthesiology critical care43 | Complete a 4‐yr anesthesiology program | 12 mo | 9 mo in ICU | No research requirement |
| 3 mo in clinical activities or research relevant to critical care | ||||
| Emergency medicine critical care | Complete an emergency medicine program and maintain ABEM board certification | 24 mo | 6 mo MICU | Research required; no duration is stipulated |
| 3 mo other ICU | ||||
| 3 mo elective (determined by individual program) | ||||
| Pediatric critical care | Complete a pediatrics or anesthesiology program | 36 mo | At least 12 mo of relevant clinical rotations; no other specifications | At least 12 mo of research |
The summit was convened to address the following issues:
-
Defining hospitalists' roles in providing ICU coverage in the presence or absence of intensivists.
-
Developing standardized and universally recognized supplementary training pathways for hospitalists who practice in the ICU.
-
Identifying clinical, logistical, and political barriers that might impair or preclude such training.
At the close of the summit, the executive leadership of both societies agreed that they had sufficient consensus on the aforementioned issues to delegate a subgroup of participants to formulate a position paper. The authors of the position paper were selected based upon their diverse professional experience, senior leadership in both SHM and SCCM, and their cross‐disciplinary expertise in hospital medicine and critical care medicine. Four of the 5 authors (E.M.S., J.R.D., M.J.G., P.A.L.) are board‐certified intensivists. Three (E.M.S., J.R.D., M.J.G.) are members of both SCCM and SHM, 2 (M.J.G., J.R.D.) are Past‐Presidents of SHM, and 1 (P.A.L.) is Immediate Past‐President of SCCM. E.M.S. and D.D.D. are current members of the SHM Board of Directors.
After the summit, the authors held several conference calls to review the structure and content of the position paper. The boards of directors of both societies independently approved a draft of the paper and the executive leadership of both societies approved subsequent revisions. The position paper was submitted for joint publication in the Journal of Hospital Medicine and Critical Care Medicine and underwent formal peer‐review by reviewers representing both societies.
INTRODUCTION
The growing shortage of intensivists and its implications for hospitalized Americans is well documented and remains an ongoing concern for hospitals, clinicians, payers, and the federal government.17 Despite numerous recommendations that intensivists manage critically ill adults,8, 9 most American hospitals cannot and will not meet this proposed standard.10, 11 When surveyed, only 20% of Michigan hospitals participating in the Keystone Project responded that they staffed their ICUs exclusively with board‐certified intensivists, and 75% maintained open ICU staffing models.12 The mismatch between intensivist supply and demand is expected to worsen as inpatient volume and acuity grow in concert with an aging and increasingly comorbid American population, yet with the exception of a 2010 agreement between the American Board of Internal Medicine (ABIM) and American Board of Emergency Medicine (ABEM) to cosponsor a medical critical care fellowship pathway for emergency medicine (EM) physicians, little has changed to expand the intensivist trainee pipeline. Although the addition of a sanctioned EM critical care pathway is a positive development, it is unlikely to significantly impact the intensivist shortage in the near term. Between 2000 and 2007, 43 emergency medicine physicians entered non‐board sanctioned American critical care fellowships,13 while in the 20112012 academic year, 1957 trainees are enrolled in adult critical care medicine fellowships (surgery, anesthesia, medical critical care, and pulmonary/critical care).14 It remains to be seen if the availability of a formal critical care pathway will significantly increase the numbers of emergency medicine physicians who pursue critical care training.
The growing intensivist shortage has coincided with the appearance of hospitalists, physicians who focus on the care of hospitalized medical patients, on the healthcare landscape.15 Increasing from 2000 to 34,000 practitioners in 15 years, hospital medicine is the fastest growing specialty in organized medicine, with an estimated plateau of as many as 50,000 practitioners.16 As of 2009, hospitalists were present in 89% of hospitals with over 200 beds, largely replacing primary care physicians as the managers of ICU patients in non‐tertiary hospital settings.16 In surveys performed by the Society of Hospital Medicine, 75% of hospitalists reported that they practice in the ICU, often shouldering much of the responsibility for managing critically ill patients.17 In 37.5% of Michigan Keystone Project hospitals, hospitalists served as attending physicians of record in the ICU.10 Although legitimate concerns have been raised about whether hospitalists are uniformly qualified to practice in the ICU, this issue has become moot at many hospitals where intensivists are either in short supply or entirely absent.1821 As previously noted by Heisler,22 the issue is no longer whether hospitalists should practice in the ICU, but rather to ensure that they do so safely, effectively, and seamlessly in collaboration with intensivists, or independently when intensivists are unavailable.
POTENTIAL VALUE OF HOSPITALISTS IN THE ICU
Hospital medicine and critical care medicine share similar competencies and values. Eighty‐five percent of practicing hospitalists are internists, who have historically been well trained to manage acutely ill hospitalized patients. Categorical internal medicine (IM) training emphasizes acute inpatient medicine, with residents spending approximately two‐thirds of their training time in the hospital. Many of the cognitive skills required for practicing critical care medicine are encompassed in categorical IM training, as well as in the Core Competencies in Hospital Medicine.23, 24 Furthermore, hospitalist staffing models are specifically adapted to meet the needs of acutely ill patients. With their consistent presence in the hospital (many programs provide 24:7 in‐house coverage), hospitalists see patients several times a day if necessary and can respond to their acute needs in real time. In many institutions, hospitalists are tasked as first responders to in‐house emergencies, often covering ICUs when intensivists are unavailable.
Most importantly, hospital medicine and critical care medicine are philosophically aligned. Both disciplines are defined by their location of practice rather than by an organ system or constellation of diseases. Both specialties embrace hospital‐based process improvement, lead multidisciplinary teams, and champion quality and safety initiatives.23, 25 Hospitalists and intensivists routinely collaborate to improve hospital care through shared protocol implementation, patient throughput management, and quality improvement initiatives. The ideology and mechanics of high‐performing hospitalist and intensivist programs are extremely similar.
LIMITATIONS OF HOSPITALISTS IN ICUs
Although the majority of hospitalists are general internists, individual hospitalists' skills may be heterogeneous, reflecting differences in training and clinical practice experience prior to becoming hospitalists. A hospitalist entering practice directly from a rigorous categorical IM training program will likely have different skills and knowledge than an ambulatory‐based general internist who makes a mid‐career switch to hospital medicine. Furthermore, increasingly stringent restrictions on housestaff work hours and patient loads, coupled with increasing emphasis on ambulatory medicine, have substantially decreased IM residents' cumulative exposure to acutely ill inpatients and inpatient procedures, raising concerns that the current generation of IM residents are less well‐prepared to manage ICU patients than their predecessors. The growing prevalence of family practitioners in the adult hospitalist workforce (currently estimated at 6%8%), who generally are not as rigorously or comprehensively trained in critical care medicine as internists, further complicates efforts to broadly categorize adult hospitalists' ICU skills.26, 27
Once hospitalists enter the workforce, they have few formal opportunities to significantly advance their critical care knowledge and skills. Existing critical care educational offerings are generally limited to 1‐ or 2‐day critical care refresher courses or narrowly focused ICU skills courses, such as acute airway management or critical care ultrasonography. These courses, while valuable, are often insufficient for hospitalists who need to broaden their general critical care knowledge base or obtain skills that they did not acquire in residency training. The result is a hospitalist workforce that practices in the ICU but has limited opportunity to enhance the skills and knowledge necessary to do so safely and competently.
ENHANCING HOSPITALISTS' SKILLS TO PROVIDE CRITICAL CARE SERVICES
In the absence of a systemic solution to the intensivist shortage, the healthcare marketplace is independently developing alternative critical care delivery solutions, such as deploying telemedicine systems and expanding the roles of nurse practitioners and physician assistants in the ICU. To a lesser extent, there have been calls for hospitalists to fill similar intensivist extender roles in the ICU, and Heisler and others have suggested developing limited, competency‐based critical care training to allow hospitalists to manage a subset of ICU patients, either independently or collaboratively with intensivists.22 Several healthcare systems are in various stages of developing such critical care training programs for their hospitalists, many of whom already practice in the ICU. These programs will likely blend fellowship‐level training with supervised attending duties in the ICU, with the expectation that graduates will be able to independently manage a portion of an ICU population (Timothy G. Buchman, MD, PhD, Department of Surgery, Emory University School of Medicine, personal communication, May 11, 2011).
Although informal hospitalist training programs could make an important contribution to ICU staffing, they raise new concerns as well. In the absence of uniform, formal training and evaluation standards, the quality and consistency of these homegrown programs could vary widely, with participants developing critical care skills and competencies that might not conform to requirements set forth by the Accreditation Council for Graduate Medical Education (ACGME). Even if training could be standardized, the practical implementation of a 2‐tier intensivist model would create extreme political and operational challenges for hospitals, which would be required to differentially credential and privilege providers with similar training and overlapping patient responsibilities. In light of these complexities and uncertainties, hospitalists might be unwilling to risk investing in lengthy training offering uncertain recognition and delineation of what they can and cannot do in the ICU.
A more durable long‐term solution is to create an ACGME‐sanctioned and accredited critical care certification pathway for IM hospitalists, with the express goal of expanding the intensivist workforce by attracting practicing hospitalists to critical care fellowship training. Hospitalists who complete such training would be full‐fledged intensivists, subject to the same privileges and expectations as any other intensivist.
We believe that many hospitalists could acquire the competencies necessary to become board‐eligible intensivists in less than the 2 years currently required for general internists to complete critical care medicine training. The existence of 6 unique pathways for critical care training and board certification in the United States, all maintaining unique training criteria and durations of training, strongly suggests that competent intensivists can be trained through disparate pathways to achieve equivalent outcomes (Table 1). For example, both surgical and anesthesia critical care programs require only a single added year of training following their respective residency training programs.28, 29 Of the 24 months that comprise a medical critical care fellowship, only 12 months of clinical duties are required, with the remainder allocated to electives, quality‐improvement initiatives, research, and other academic pursuits.30 The ACGME and ABIM have tacitly acknowledged that medical critical care training is achievable in less than 2 years, by allowing those who enter or complete accredited 2‐year fellowships in other medical specialties to obtain critical care certification with a single additional year of critical care training.30 If infectious disease and nephrology fellows can become competent intensivists with a single year of critical care training, it is reasonable to believe that experienced IM hospitalists can do so as well.
Offering a 1‐year critical care fellowship training track for experienced IM hospitalists will require careful consideration of which components of existing 2‐year critical care fellowship can be removed or condensed without materially compromising the quality of training. Hospitalists participating in a condensed 1‐year training program would need the maturity and experience to hit the ground running, mandating a robust entry bar predicated upon relevant prior clinical practice experience. We believe that 3 sequential years of prior hospitalist practice experience is a reasonable prerequisite for participation. Additionally, eligible hospitalists would need to participate in the (currently voluntary) ABIM Focused Practice in Hospital Medicine Maintenance of Certification (MOC) process,31 which mandates completion of hospital‐based education and practice improvement modules. Prior training and participation in quality improvement (QI) processes could supplant some of the scholarly activity that is currently expected during the nonclinical portion of a traditional 2‐year medical critical care fellowship, and candidates would be required to have completed at least one meaningful hospital‐based QI initiative while still in practice.
Although new curricular standards would need to be developed, 1‐year medical intensivist fellowships could coexist alongside 2‐year fellowships within a single critical care training program, as is the case when internal medicine fellows in other specialties complete an added year of critical care fellowship. However, to meaningfully impact the intensivist shortage, the number and capacity of medical critical care fellowships, which currently train approximately 10% of the critical care workforce, would need to significantly expand.13
Importantly, the impact that critical care‐trained hospitalists will have on the quality and safety of patient care in the ICU will require evaluation and study. We presume that inserting this new cohort of intensivists into previously unmanaged or undermanaged ICUs will improve care, but this, like many other uncertainties regarding optimal models of ICU staffing, should be subject to rigorous and objective examination through additional clinical research.10, 3236
Offering a 1‐year critical care training track will raise new challenges. Skepticism about the rigor and content of 1‐year programs may foster the perception that graduates are inadequately trained or skilled to function at the level of other board‐certified intensivists. It is also possible that a 1‐year hospitalistcritical care fellowship could divert trainees from traditional critical care programs, offsetting net gains in the number of intensivists. However, we suspect that a 1‐year fellowship program will attract primarily practicing hospitalists, while 2‐year tracks will continue to attract IM residents. We conceptualize participation in a 1‐year hospitalistcritical care fellowship program as a (minimum) 4‐year post‐residency commitment, consisting of at least 3 years of clinical practice as a hospitalist, followed by 1 year of critical care fellowship training. Internal medicine residents would find a shorter pathway to intensivist practice by enrolling in traditional 2‐year critical care or even 3‐year pulmonary/critical care training programs. The compensation advantage afforded to intensivists relative to hospitalists (approximately $100,000 per year) would offset any financial advantage gained by shaving a year off of critical care fellowship training.37, 38 We also suspect that those seeking careers in academic medicine would almost exclusively opt for a traditional 2‐year training pathway.
Finally, while Europe and Australia offer a single common pathway to critical care certification, the United States maintains multiple, independent, specialty‐specific training pathways, each with unique durations, requirements, and certification processes. Although consideration of this important issue is beyond the scope of this paper, we believe that developing a hospitalist‐intensivist workforce should be part of a broader initiative to reform critical care training to better meet the demand for intensivists across the spectrum of American ICUs. Adopting a global intensivist training strategy that is specialty‐independent and specific to critical care medicine may result in a more consistent, collaborative, and interoperable critical care workforce.
CONCLUSION
American critical care training programs have failed to produce enough intensivists to meet demand, and this mismatch between supply and demand will substantially worsen over upcoming decades. Hospitals and healthcare systems, faced with the mandate to provide care for their ICU populations, have already innovated to offset this shortage through the use of telemedicine and the extension of nonphysician providers into ICUs. As the gap between intensivist supply and demand widens, healthcare systems will be increasingly likely to pursue more radical solutions, up to and including independently training their own critical care workforces. We believe that there are better alternatives.
Hospitalists have rapidly proliferated to become the dominant provider of inpatient medical care in American hospitals and are already providing a substantial amount of critical care. As such, they remain a largely untapped and potentially significant source of new intensivists. The skills, competencies, and values embodied in hospital medicine are already highly congruent with those of critical care. By virtue of their numbers and penetrance into the vast majority of large American hospitals, hospitalists are well situated to make a substantial impact on the intensivist shortage. If only 5% of the projected hospitalist workforce were to receive the critical care training that we propose, 2500 new intensivists would enter the critical care workforce, substantially decreasing the impact of the national intensivist shortage.12
Internal medicine hospitalists who obtain additional training as intensivists would also bring new capabilities and flexibility to hospitals seeking to implement intensivist programs. In smaller hospitals that cannot support freestanding intensivist programs, hospitalist‐intensivists might divide their time between ICU and ward duties. In larger hospitals, these clinicians might function exclusively as intensivists alongside their traditionally trained peers. Whether they affiliate as hospitalists, intensivists, or something else entirely will largely depend upon the roles that they fulfill, the governance of their institutions, and the departments that most effectively meet their clinical and organizational needs.
Bringing qualified hospitalists into the critical care workforce through rigorous sanctioned and accredited 1‐year training programs, will open a new intensivist training pipeline and potentially offer more critically ill patients the benefit of providers who are unequivocally qualified to care for them. Similarly, unification of critical care training and certification across disciplines will better focus efforts to expand the intensivist workforce, more efficiently leverage limited training resources, and facilitate standardization of critical care skills, policies, and procedures across the nation's ICUs. Although moving this agenda forward may be logistically challenging and politically daunting, we believe that the results will be worth the effort.
Acknowledgements
Disclosure: All authors disclose no relevant or financial conflicts of interest. This position paper also published in Critical Care Medicine. (Siegal EM, Dressler DD, Dichter JR, Gorman MJ, Lipsett PA. Training a Hospitalist Workforce to Address the Intensivist Shortage in American Hospitals: A Position Paper From the Society of Hospital Medicine and the Society of Critical Care Medicine. Crit Care Med. 2012;40(6):19521956).
DEVELOPMENT OF THE POSITION PAPER
In June of 2011, the executive leadership of the Society of Critical Care Medicine (SCCM) and the Society of Hospital Medicine (SHM) convened a daylong summit to discuss intensive care unit (ICU) workforce issues as they affect intensivists and hospitalists. Attendees included the executive leadership of both societies and invited participants with cross‐disciplinary expertise in hospital medicine and critical care medicine.0
| Pathway | Prerequisites | Duration | Minimum Clinical Training Requirements | Research Requirement |
|---|---|---|---|---|
| ||||
| Medical critical care39 | Complete a 3‐yr internal medicine program | 24 mo for general internists 12 mo for internists who are enrolled in, or have completed, an accredited 2‐yr IM fellowship | 6 mo MICU | Research required; no duration is stipulated |
| 3 mo other ICU | Research requirement waived for 1‐yr fellows | |||
| 3 mo elective (determined by individual program) | ||||
| Pulmonary critical care40 | Complete a 3‐yr internal medicine program | 36 mo | 9 mo of critical care (identical to medical critical care) | Research required, but duration not specified; generally 1218 mo |
| 9 mo of pulmonary medicine | ||||
| 6 mo of relevant electives encouraged | ||||
| 30 mo of pulmonary clinic | ||||
| Surgical critical care41, 42 | Complete at least 3 yr of training in general surgery, neurosurgery, urology, or OB/GYN | 12 mo | 8 mo in SICU | No research requirement |
| 2 mo in other ICUs | ||||
| 2 mo in relevant non‐ICU electives | ||||
| Anesthesiology critical care43 | Complete a 4‐yr anesthesiology program | 12 mo | 9 mo in ICU | No research requirement |
| 3 mo in clinical activities or research relevant to critical care | ||||
| Emergency medicine critical care | Complete an emergency medicine program and maintain ABEM board certification | 24 mo | 6 mo MICU | Research required; no duration is stipulated |
| 3 mo other ICU | ||||
| 3 mo elective (determined by individual program) | ||||
| Pediatric critical care | Complete a pediatrics or anesthesiology program | 36 mo | At least 12 mo of relevant clinical rotations; no other specifications | At least 12 mo of research |
The summit was convened to address the following issues:
-
Defining hospitalists' roles in providing ICU coverage in the presence or absence of intensivists.
-
Developing standardized and universally recognized supplementary training pathways for hospitalists who practice in the ICU.
-
Identifying clinical, logistical, and political barriers that might impair or preclude such training.
At the close of the summit, the executive leadership of both societies agreed that they had sufficient consensus on the aforementioned issues to delegate a subgroup of participants to formulate a position paper. The authors of the position paper were selected based upon their diverse professional experience, senior leadership in both SHM and SCCM, and their cross‐disciplinary expertise in hospital medicine and critical care medicine. Four of the 5 authors (E.M.S., J.R.D., M.J.G., P.A.L.) are board‐certified intensivists. Three (E.M.S., J.R.D., M.J.G.) are members of both SCCM and SHM, 2 (M.J.G., J.R.D.) are Past‐Presidents of SHM, and 1 (P.A.L.) is Immediate Past‐President of SCCM. E.M.S. and D.D.D. are current members of the SHM Board of Directors.
After the summit, the authors held several conference calls to review the structure and content of the position paper. The boards of directors of both societies independently approved a draft of the paper and the executive leadership of both societies approved subsequent revisions. The position paper was submitted for joint publication in the Journal of Hospital Medicine and Critical Care Medicine and underwent formal peer‐review by reviewers representing both societies.
INTRODUCTION
The growing shortage of intensivists and its implications for hospitalized Americans is well documented and remains an ongoing concern for hospitals, clinicians, payers, and the federal government.17 Despite numerous recommendations that intensivists manage critically ill adults,8, 9 most American hospitals cannot and will not meet this proposed standard.10, 11 When surveyed, only 20% of Michigan hospitals participating in the Keystone Project responded that they staffed their ICUs exclusively with board‐certified intensivists, and 75% maintained open ICU staffing models.12 The mismatch between intensivist supply and demand is expected to worsen as inpatient volume and acuity grow in concert with an aging and increasingly comorbid American population, yet with the exception of a 2010 agreement between the American Board of Internal Medicine (ABIM) and American Board of Emergency Medicine (ABEM) to cosponsor a medical critical care fellowship pathway for emergency medicine (EM) physicians, little has changed to expand the intensivist trainee pipeline. Although the addition of a sanctioned EM critical care pathway is a positive development, it is unlikely to significantly impact the intensivist shortage in the near term. Between 2000 and 2007, 43 emergency medicine physicians entered non‐board sanctioned American critical care fellowships,13 while in the 20112012 academic year, 1957 trainees are enrolled in adult critical care medicine fellowships (surgery, anesthesia, medical critical care, and pulmonary/critical care).14 It remains to be seen if the availability of a formal critical care pathway will significantly increase the numbers of emergency medicine physicians who pursue critical care training.
The growing intensivist shortage has coincided with the appearance of hospitalists, physicians who focus on the care of hospitalized medical patients, on the healthcare landscape.15 Increasing from 2000 to 34,000 practitioners in 15 years, hospital medicine is the fastest growing specialty in organized medicine, with an estimated plateau of as many as 50,000 practitioners.16 As of 2009, hospitalists were present in 89% of hospitals with over 200 beds, largely replacing primary care physicians as the managers of ICU patients in non‐tertiary hospital settings.16 In surveys performed by the Society of Hospital Medicine, 75% of hospitalists reported that they practice in the ICU, often shouldering much of the responsibility for managing critically ill patients.17 In 37.5% of Michigan Keystone Project hospitals, hospitalists served as attending physicians of record in the ICU.10 Although legitimate concerns have been raised about whether hospitalists are uniformly qualified to practice in the ICU, this issue has become moot at many hospitals where intensivists are either in short supply or entirely absent.1821 As previously noted by Heisler,22 the issue is no longer whether hospitalists should practice in the ICU, but rather to ensure that they do so safely, effectively, and seamlessly in collaboration with intensivists, or independently when intensivists are unavailable.
POTENTIAL VALUE OF HOSPITALISTS IN THE ICU
Hospital medicine and critical care medicine share similar competencies and values. Eighty‐five percent of practicing hospitalists are internists, who have historically been well trained to manage acutely ill hospitalized patients. Categorical internal medicine (IM) training emphasizes acute inpatient medicine, with residents spending approximately two‐thirds of their training time in the hospital. Many of the cognitive skills required for practicing critical care medicine are encompassed in categorical IM training, as well as in the Core Competencies in Hospital Medicine.23, 24 Furthermore, hospitalist staffing models are specifically adapted to meet the needs of acutely ill patients. With their consistent presence in the hospital (many programs provide 24:7 in‐house coverage), hospitalists see patients several times a day if necessary and can respond to their acute needs in real time. In many institutions, hospitalists are tasked as first responders to in‐house emergencies, often covering ICUs when intensivists are unavailable.
Most importantly, hospital medicine and critical care medicine are philosophically aligned. Both disciplines are defined by their location of practice rather than by an organ system or constellation of diseases. Both specialties embrace hospital‐based process improvement, lead multidisciplinary teams, and champion quality and safety initiatives.23, 25 Hospitalists and intensivists routinely collaborate to improve hospital care through shared protocol implementation, patient throughput management, and quality improvement initiatives. The ideology and mechanics of high‐performing hospitalist and intensivist programs are extremely similar.
LIMITATIONS OF HOSPITALISTS IN ICUs
Although the majority of hospitalists are general internists, individual hospitalists' skills may be heterogeneous, reflecting differences in training and clinical practice experience prior to becoming hospitalists. A hospitalist entering practice directly from a rigorous categorical IM training program will likely have different skills and knowledge than an ambulatory‐based general internist who makes a mid‐career switch to hospital medicine. Furthermore, increasingly stringent restrictions on housestaff work hours and patient loads, coupled with increasing emphasis on ambulatory medicine, have substantially decreased IM residents' cumulative exposure to acutely ill inpatients and inpatient procedures, raising concerns that the current generation of IM residents are less well‐prepared to manage ICU patients than their predecessors. The growing prevalence of family practitioners in the adult hospitalist workforce (currently estimated at 6%8%), who generally are not as rigorously or comprehensively trained in critical care medicine as internists, further complicates efforts to broadly categorize adult hospitalists' ICU skills.26, 27
Once hospitalists enter the workforce, they have few formal opportunities to significantly advance their critical care knowledge and skills. Existing critical care educational offerings are generally limited to 1‐ or 2‐day critical care refresher courses or narrowly focused ICU skills courses, such as acute airway management or critical care ultrasonography. These courses, while valuable, are often insufficient for hospitalists who need to broaden their general critical care knowledge base or obtain skills that they did not acquire in residency training. The result is a hospitalist workforce that practices in the ICU but has limited opportunity to enhance the skills and knowledge necessary to do so safely and competently.
ENHANCING HOSPITALISTS' SKILLS TO PROVIDE CRITICAL CARE SERVICES
In the absence of a systemic solution to the intensivist shortage, the healthcare marketplace is independently developing alternative critical care delivery solutions, such as deploying telemedicine systems and expanding the roles of nurse practitioners and physician assistants in the ICU. To a lesser extent, there have been calls for hospitalists to fill similar intensivist extender roles in the ICU, and Heisler and others have suggested developing limited, competency‐based critical care training to allow hospitalists to manage a subset of ICU patients, either independently or collaboratively with intensivists.22 Several healthcare systems are in various stages of developing such critical care training programs for their hospitalists, many of whom already practice in the ICU. These programs will likely blend fellowship‐level training with supervised attending duties in the ICU, with the expectation that graduates will be able to independently manage a portion of an ICU population (Timothy G. Buchman, MD, PhD, Department of Surgery, Emory University School of Medicine, personal communication, May 11, 2011).
Although informal hospitalist training programs could make an important contribution to ICU staffing, they raise new concerns as well. In the absence of uniform, formal training and evaluation standards, the quality and consistency of these homegrown programs could vary widely, with participants developing critical care skills and competencies that might not conform to requirements set forth by the Accreditation Council for Graduate Medical Education (ACGME). Even if training could be standardized, the practical implementation of a 2‐tier intensivist model would create extreme political and operational challenges for hospitals, which would be required to differentially credential and privilege providers with similar training and overlapping patient responsibilities. In light of these complexities and uncertainties, hospitalists might be unwilling to risk investing in lengthy training offering uncertain recognition and delineation of what they can and cannot do in the ICU.
A more durable long‐term solution is to create an ACGME‐sanctioned and accredited critical care certification pathway for IM hospitalists, with the express goal of expanding the intensivist workforce by attracting practicing hospitalists to critical care fellowship training. Hospitalists who complete such training would be full‐fledged intensivists, subject to the same privileges and expectations as any other intensivist.
We believe that many hospitalists could acquire the competencies necessary to become board‐eligible intensivists in less than the 2 years currently required for general internists to complete critical care medicine training. The existence of 6 unique pathways for critical care training and board certification in the United States, all maintaining unique training criteria and durations of training, strongly suggests that competent intensivists can be trained through disparate pathways to achieve equivalent outcomes (Table 1). For example, both surgical and anesthesia critical care programs require only a single added year of training following their respective residency training programs.28, 29 Of the 24 months that comprise a medical critical care fellowship, only 12 months of clinical duties are required, with the remainder allocated to electives, quality‐improvement initiatives, research, and other academic pursuits.30 The ACGME and ABIM have tacitly acknowledged that medical critical care training is achievable in less than 2 years, by allowing those who enter or complete accredited 2‐year fellowships in other medical specialties to obtain critical care certification with a single additional year of critical care training.30 If infectious disease and nephrology fellows can become competent intensivists with a single year of critical care training, it is reasonable to believe that experienced IM hospitalists can do so as well.
Offering a 1‐year critical care fellowship training track for experienced IM hospitalists will require careful consideration of which components of existing 2‐year critical care fellowship can be removed or condensed without materially compromising the quality of training. Hospitalists participating in a condensed 1‐year training program would need the maturity and experience to hit the ground running, mandating a robust entry bar predicated upon relevant prior clinical practice experience. We believe that 3 sequential years of prior hospitalist practice experience is a reasonable prerequisite for participation. Additionally, eligible hospitalists would need to participate in the (currently voluntary) ABIM Focused Practice in Hospital Medicine Maintenance of Certification (MOC) process,31 which mandates completion of hospital‐based education and practice improvement modules. Prior training and participation in quality improvement (QI) processes could supplant some of the scholarly activity that is currently expected during the nonclinical portion of a traditional 2‐year medical critical care fellowship, and candidates would be required to have completed at least one meaningful hospital‐based QI initiative while still in practice.
Although new curricular standards would need to be developed, 1‐year medical intensivist fellowships could coexist alongside 2‐year fellowships within a single critical care training program, as is the case when internal medicine fellows in other specialties complete an added year of critical care fellowship. However, to meaningfully impact the intensivist shortage, the number and capacity of medical critical care fellowships, which currently train approximately 10% of the critical care workforce, would need to significantly expand.13
Importantly, the impact that critical care‐trained hospitalists will have on the quality and safety of patient care in the ICU will require evaluation and study. We presume that inserting this new cohort of intensivists into previously unmanaged or undermanaged ICUs will improve care, but this, like many other uncertainties regarding optimal models of ICU staffing, should be subject to rigorous and objective examination through additional clinical research.10, 3236
Offering a 1‐year critical care training track will raise new challenges. Skepticism about the rigor and content of 1‐year programs may foster the perception that graduates are inadequately trained or skilled to function at the level of other board‐certified intensivists. It is also possible that a 1‐year hospitalistcritical care fellowship could divert trainees from traditional critical care programs, offsetting net gains in the number of intensivists. However, we suspect that a 1‐year fellowship program will attract primarily practicing hospitalists, while 2‐year tracks will continue to attract IM residents. We conceptualize participation in a 1‐year hospitalistcritical care fellowship program as a (minimum) 4‐year post‐residency commitment, consisting of at least 3 years of clinical practice as a hospitalist, followed by 1 year of critical care fellowship training. Internal medicine residents would find a shorter pathway to intensivist practice by enrolling in traditional 2‐year critical care or even 3‐year pulmonary/critical care training programs. The compensation advantage afforded to intensivists relative to hospitalists (approximately $100,000 per year) would offset any financial advantage gained by shaving a year off of critical care fellowship training.37, 38 We also suspect that those seeking careers in academic medicine would almost exclusively opt for a traditional 2‐year training pathway.
Finally, while Europe and Australia offer a single common pathway to critical care certification, the United States maintains multiple, independent, specialty‐specific training pathways, each with unique durations, requirements, and certification processes. Although consideration of this important issue is beyond the scope of this paper, we believe that developing a hospitalist‐intensivist workforce should be part of a broader initiative to reform critical care training to better meet the demand for intensivists across the spectrum of American ICUs. Adopting a global intensivist training strategy that is specialty‐independent and specific to critical care medicine may result in a more consistent, collaborative, and interoperable critical care workforce.
CONCLUSION
American critical care training programs have failed to produce enough intensivists to meet demand, and this mismatch between supply and demand will substantially worsen over upcoming decades. Hospitals and healthcare systems, faced with the mandate to provide care for their ICU populations, have already innovated to offset this shortage through the use of telemedicine and the extension of nonphysician providers into ICUs. As the gap between intensivist supply and demand widens, healthcare systems will be increasingly likely to pursue more radical solutions, up to and including independently training their own critical care workforces. We believe that there are better alternatives.
Hospitalists have rapidly proliferated to become the dominant provider of inpatient medical care in American hospitals and are already providing a substantial amount of critical care. As such, they remain a largely untapped and potentially significant source of new intensivists. The skills, competencies, and values embodied in hospital medicine are already highly congruent with those of critical care. By virtue of their numbers and penetrance into the vast majority of large American hospitals, hospitalists are well situated to make a substantial impact on the intensivist shortage. If only 5% of the projected hospitalist workforce were to receive the critical care training that we propose, 2500 new intensivists would enter the critical care workforce, substantially decreasing the impact of the national intensivist shortage.12
Internal medicine hospitalists who obtain additional training as intensivists would also bring new capabilities and flexibility to hospitals seeking to implement intensivist programs. In smaller hospitals that cannot support freestanding intensivist programs, hospitalist‐intensivists might divide their time between ICU and ward duties. In larger hospitals, these clinicians might function exclusively as intensivists alongside their traditionally trained peers. Whether they affiliate as hospitalists, intensivists, or something else entirely will largely depend upon the roles that they fulfill, the governance of their institutions, and the departments that most effectively meet their clinical and organizational needs.
Bringing qualified hospitalists into the critical care workforce through rigorous sanctioned and accredited 1‐year training programs, will open a new intensivist training pipeline and potentially offer more critically ill patients the benefit of providers who are unequivocally qualified to care for them. Similarly, unification of critical care training and certification across disciplines will better focus efforts to expand the intensivist workforce, more efficiently leverage limited training resources, and facilitate standardization of critical care skills, policies, and procedures across the nation's ICUs. Although moving this agenda forward may be logistically challenging and politically daunting, we believe that the results will be worth the effort.
Acknowledgements
Disclosure: All authors disclose no relevant or financial conflicts of interest. This position paper also published in Critical Care Medicine. (Siegal EM, Dressler DD, Dichter JR, Gorman MJ, Lipsett PA. Training a Hospitalist Workforce to Address the Intensivist Shortage in American Hospitals: A Position Paper From the Society of Hospital Medicine and the Society of Critical Care Medicine. Crit Care Med. 2012;40(6):19521956).
- ,,,,.Current and projected workforce requirements for care of the critically ill and patients with pulmonary disease: can we meet the requirements of an aging population?JAMA.2000;284(21):2762–2770.
- Health Resources and Services Administration report to Congress: the critical care workforce: a study of the supply and demand for critical care physicians. Available at: http://www.bhpr.hrsa.gov/healthworkforce/reports/criticalcare/default.htm. Accessed April 24,2011.
- ,,, et al.The critical care crisis in the United States: a report from the profession.Chest.2004;125(4):1514–1517.
- ,,,,,.The critical care medicine crisis: a call for federal action. A white paper from the critical care professional societies.Chest.2004;125(4):1518–1521.
- .Critical care workforce.Crit Care Med.2008;36(4):1350–1353.
- .Critical care workforce crisis: time to look in the mirror.Crit Care Med.2008;36(4):1385–1386.
- ,,, et al.Prioritizing the organization and management of intensive care services in the Unites States: the PrOMIS conference.Crit Care Med.2007;35:1103–1111.
- ,,,,.Association between ICU physician staffing and outcomes: a systematic review.Crit Care Med.1999;27:A43.
- The Leapfrog Group Factsheet. ICU Physician Staffing (IPS). Available at: http://www.leapfroggroup.org/media/file/FactSheet_IPS.pdf. Accessed November 20,2011.
- ,,,,,.Physician staffing patterns and clinical outcomes in critically ill patients: a systematic review.JAMA.2002;288(17):2151–2162.
- ,,,,,.Association between critical care physician management and patient mortality in the intensive care unit.Ann Intern Med.2008;148(11):801–809.
- ,,, et al.Characteristics of intensive care units in Michigan: not an open and closed case.J Hosp Med.2010;5(1):4–9.
- ,,.Current practice, demographics and trends of critical care trained emergency physicians in the United States.Acad Emer Med.2010;17:325–329.
- List of ACGME Accredited Programs and Sponsoring Institutions. Available at: http://www.acgme.org/adspublic. Accessed February 22,2012.
- ,.The emerging role of “hospitalists” in the American health care system.N Engl J Med.1996;335:514–517.
- American Hospital Association.2009 Annual Survey.Chicago, IL:American Hospital Association;2009.
- 2005–2006 Society of Hospital Medicine Compensation and Productivity Survey. Available at: http://www.hospitalmedicine.org/AM/Template.cfm?Section=Surveys24(4):2–3.
- .Hospitalists in the intensive care unit: an intensivist perspective.The Hospitalist.1999;3(4):5.
- .The new intensivists.The Hospitalist. October2008.
- .Intensive care unit staffing: an academic debate but a community crisis.Crit Care Med.2012;40(3):1032.
- .Hospitalists and intensivists: partners in caring for the critically ill—the time has come.J Hosp Med.2010;5:1–3.
- ,,,,.The core competencies in hospital medicine: a framework for curriculum development.J Hosp Med.2006;1(suppl 1):2–95.
- ,,,,.The core competencies in hospital medicine: development and methodology.J Hosp Med.2006;1:48–56.
- ,,, et al.An intervention to decrease catheter‐related bloodstream infections in the ICU.N Engl J Med.2006;355:2725–2732.
- ACGME Internal Medicine Program Requirements. Available at: http://www.acgme.org/acwebsite/rrc_140/140_prindex.asp. Accessed November 20,2011.
- ACGME Program Requirements for Resident Education in Internal Medicine. Available at: http://www.acgme.org/acWebsite/reviewComment/140_internal_medicine_PRs_R
- ,,,,.Current and projected workforce requirements for care of the critically ill and patients with pulmonary disease: can we meet the requirements of an aging population?JAMA.2000;284(21):2762–2770.
- Health Resources and Services Administration report to Congress: the critical care workforce: a study of the supply and demand for critical care physicians. Available at: http://www.bhpr.hrsa.gov/healthworkforce/reports/criticalcare/default.htm. Accessed April 24,2011.
- ,,, et al.The critical care crisis in the United States: a report from the profession.Chest.2004;125(4):1514–1517.
- ,,,,,.The critical care medicine crisis: a call for federal action. A white paper from the critical care professional societies.Chest.2004;125(4):1518–1521.
- .Critical care workforce.Crit Care Med.2008;36(4):1350–1353.
- .Critical care workforce crisis: time to look in the mirror.Crit Care Med.2008;36(4):1385–1386.
- ,,, et al.Prioritizing the organization and management of intensive care services in the Unites States: the PrOMIS conference.Crit Care Med.2007;35:1103–1111.
- ,,,,.Association between ICU physician staffing and outcomes: a systematic review.Crit Care Med.1999;27:A43.
- The Leapfrog Group Factsheet. ICU Physician Staffing (IPS). Available at: http://www.leapfroggroup.org/media/file/FactSheet_IPS.pdf. Accessed November 20,2011.
- ,,,,,.Physician staffing patterns and clinical outcomes in critically ill patients: a systematic review.JAMA.2002;288(17):2151–2162.
- ,,,,,.Association between critical care physician management and patient mortality in the intensive care unit.Ann Intern Med.2008;148(11):801–809.
- ,,, et al.Characteristics of intensive care units in Michigan: not an open and closed case.J Hosp Med.2010;5(1):4–9.
- ,,.Current practice, demographics and trends of critical care trained emergency physicians in the United States.Acad Emer Med.2010;17:325–329.
- List of ACGME Accredited Programs and Sponsoring Institutions. Available at: http://www.acgme.org/adspublic. Accessed February 22,2012.
- ,.The emerging role of “hospitalists” in the American health care system.N Engl J Med.1996;335:514–517.
- American Hospital Association.2009 Annual Survey.Chicago, IL:American Hospital Association;2009.
- 2005–2006 Society of Hospital Medicine Compensation and Productivity Survey. Available at: http://www.hospitalmedicine.org/AM/Template.cfm?Section=Surveys24(4):2–3.
- .Hospitalists in the intensive care unit: an intensivist perspective.The Hospitalist.1999;3(4):5.
- .The new intensivists.The Hospitalist. October2008.
- .Intensive care unit staffing: an academic debate but a community crisis.Crit Care Med.2012;40(3):1032.
- .Hospitalists and intensivists: partners in caring for the critically ill—the time has come.J Hosp Med.2010;5:1–3.
- ,,,,.The core competencies in hospital medicine: a framework for curriculum development.J Hosp Med.2006;1(suppl 1):2–95.
- ,,,,.The core competencies in hospital medicine: development and methodology.J Hosp Med.2006;1:48–56.
- ,,, et al.An intervention to decrease catheter‐related bloodstream infections in the ICU.N Engl J Med.2006;355:2725–2732.
- ACGME Internal Medicine Program Requirements. Available at: http://www.acgme.org/acwebsite/rrc_140/140_prindex.asp. Accessed November 20,2011.
- ACGME Program Requirements for Resident Education in Internal Medicine. Available at: http://www.acgme.org/acWebsite/reviewComment/140_internal_medicine_PRs_R
Impact of In‐Hospital EVPCR Testing
Non‐polio enteroviruses are the most common cause of aseptic meningitis in children.1 While bacterial meningitis requires parenteral antibiotics, aseptic meningitis requires only supportive care.1 Enteroviral reverse transcription polymerase chain reaction (EVPCR) testing of the cerebrospinal fluid (CSF) allows the virus to be detected with high sensitivity and specificity.2 Because children with a positive EVPCR test are at low risk of bacterial meningitis,3 access to rapid EVPCR results has the potential to impact the clinical management of children with meningitis.4, 5 We studied the impact of implementing an in‐hospital EVPCR testing protocol on the clinical management of children with meningitis in a single‐center retrospective cohort.
MATERIALS AND METHODS
Study Design and Population
We identified children, 19 years of age, with meningitis evaluated at a single tertiary care pediatric center between July 2006 and June 2010. We defined meningitis as a CSF white blood cell (WBC) count 10 cells/mm3 corrected for the presence of CSF red blood cells (RBCs) (1 WBC for every 500 RBCs).6 We excluded children with any of the following: critical illness (defined as hypotension or respiratory failure), purpura, recent neurosurgery, ventricular shunt, immunosuppression, focal bacterial infection requiring parenteral antibiotics, positive CSF Gram stain, or known Lyme disease. The Institutional Review Board approved this study with waiver of informed consent.
Data Collection and Case Definitions
We abstracted historical and physical examination findings, as well as laboratory and microbiologic results, from the medical record. We defined bacterial meningitis as the isolation of pathogenic bacteria from the CSF or blood cultures. Children who had received antibiotics within 72 hours of diagnostic lumbar puncture, with negative cultures, were considered to have pretreated culture‐negative meningitis. Otherwise, children with negative bacterial cultures were classified as having aseptic meningitis.
EVPCR Testing
During the study pre‐period (July 1, 2006 through June 23, 2008), EVPCR tests were flown once daily to a commercial laboratory (ARUP Laboratories, Salt Lake City, UT) where they were run in batches. During the post‐period (June 24, 2008 through June 30, 2010), the study institution replaced the send‐out test with an in‐hospital EVPCR test (Gene Xpert EV Technology; Cepheid, Sunnyvale, CA)7 that allows multiple specimens to be run simultaneously, multiple times daily (between 7:00 AM and 10:00 PM), with results available in as little as 2.5 hours. We defined turnaround time for the test from specimen obtainment to test result.
Outcome Measures
Our 2 primary outcomes were length of stay and duration of parenteral antibiotics. Length of stay was measured as time from emergency department arrival to discharge (emergency department or inpatient discharge). We defined the duration of parenteral antibiotics as time from the first to the last dose of parenteral antibiotics administered, plus the standard antibiotic dosing interval for that antibiotic. For children with Lyme meningitis, the duration of parenteral antibiotic coverage was defined a priori as 48 hours, the standard time to reliably exclude bacterial growth from culture.8
Statistical Methods
Primary outcomes were compared using univariate analyses in 6 patient groups: 1) all patients, and those with 2) a positive EVPCR test, 3) a negative EVPCR test, and a positive test who were 4) 90 days old, 5) >90 days old, and 6) presented during peak enteroviral season (June through October). We utilized MannWhitney tests for continuous variables and 2 tests for proportions. We compared the median turnaround time for EVPCR results and the percentage of tests returning prior to discharge between the pre‐ and post‐periods. We performed interrupted time series spline analyses to assess for trends in our primary outcomes, independent of the change in EVPCR testing protocol. All analyses were conducted using the Statistical Package for the Social Sciences (IBM SPSS Inc, Chicago, IL).9
RESULTS
Of the 593 children with meningitis, 152 (26%) were excluded for the reasons noted above. The 441 patients included in our analyses had the following final diagnoses: bacterial meningitis (1 patient with Streptococcus pneumoniae, 0.2%), pretreated culture‐negative meningitis (42 patients, 10%), and aseptic meningitis (398 patients, 90%).
We compared patient populations and EVPCR testing characteristics between the pre‐ and post‐study periods (Table 1). While CSF glucose differed between study periods, the difference was not felt to be clinically significant. However, during the post‐period, more children presented during enteroviral season. Clinicians were more likely to order an EVPCR test for children with aseptic, than bacterial, meningitis (213/370 [58%] vs 0/1 [0%]).
| Characteristic | Pre‐period (N = 225) | Post‐period (N = 216) | P Value |
|---|---|---|---|
| |||
| Demographics | |||
| Age (months)* | 3 (2106) | 3 (188) | 0.20 |
| Male, n (%) | 135 (60) | 129 (60) | 0.95 |
| Historical features | |||
| Duration of illness (days)* | 2 (14) | 2 (14) | 0.20 |
| Duration of fever (days)* | 1 (12) | 1 (12) | 0.52 |
| Antibiotic pretreatment, n (%) | 29 (13) | 13 (6.0) | 0.015 |
| Temperature at ED presentation* (C) | 37.6 (36.838.4) | 37.8 (37.138.2) | 0.51 |
| Presentation June through October, n (%) | 127 (56) | 143 (66) | 0.040 |
| Laboratory results | |||
| Peripheral WBC (cells/mm3)* | 10.4 (8.213.7) | 10.4 (7.813.6) | 0.67 |
| Peripheral ANC (cells/mm3)* | 5.2 (3.17.4) | 4.9 (2.68.2) | 0.47 |
| CSF WBC (cells/mm3)* | 55 (19176) | 62 (17250) | 0.66 |
| CSF ANC (cells/mm3)* | 8 (045) | 7 (141) | 0.78 |
| CSF glucose (mg/dL)* | 57 (5065) | 54 (4860) | 0.01 |
| CSF protein(mg/dL)* | 50 (3480) | 48 (3470) | 0.73 |
| Traumatic lumbar puncture (CSF RBC 500 cells/mm3), n (%) | 48 (21) | 43 (20) | 0.71 |
| Patient management | |||
| Admission to the hospital, n (%) | 196 (87) | 190 (88) | 0.68 |
| Parenteral antibiotics initiated, n (%) | 206 (92) | 200 (93) | 0.80 |
| Enteroviral PCR Testing | |||
| Testing utilization, n (%) | 62 (28) | 133 (62) | 0.001 |
| 90 days of age, n (%) | 18 (16) | 57/114 (50) | 0.001 |
| >90 days of age, n (%) | 44 (39) | 76/102 (75) | 0.001 |
| Positive test result, n (%) | 33 (53) | 80 (60) | 0.22 |
| Test turnaround time, hours* | 53 (4667) | 12 (617) | 0.001 |
We evaluated the impact of the in‐hospital EVPCR test on the length of stay and duration of parenteral antibiotics for the 6 predefined patient groups (Table 2). Length of stay could be determined for 432 (98%) of study patients, and duration of parenteral antibiotics for 365 (83%). We found a clinically important decrease in both length of stay and duration of parenteral antibiotics for children with a positive EVPCR test in the post‐period. For every hour earlier the EVPCR results returned, length of stay was reduced by 0.3 hours ( = 0.3, 95% confidence interval [CI] 0.10.5), and parenteral antibiotics were reduced by 0.3 hours ( = 0.3, 95% CI 0.10.5). However, even in the post‐period, the median length of time from a positive EVPCR test result to hospital discharge was 14 hours (interquartile range, 533 hours).
| Patient Group | Pre‐Period | Post‐Period | P Value1 |
|---|---|---|---|
| |||
| 1) All study patients | N = 225 | N = 216 | |
| Length of stay* | 49 (2662) | 47 (2662) | 0.09 |
| Duration of parenteral antibiotics* | 48 (2464) | 48 (2460) | 0.23 |
| 2) Children with a positive EVPCR test | N = 32 | N = 80 | |
| Length of stay* | 44 (2854) | 28 (1946) | 0.005 |
| Duration of parenteral antibiotics* | 48 (3072) | 36 (2449) | 0.037 |
| 3) Children with a negative EVPCR test | N = 29 | N = 53 | |
| Length of stay* | 61 (30114) | 59 (45109) | 0.67 |
| Duration of parenteral antibiotics* | 52 (4784) | 54 (4870) | 0.93 |
| 4) Children 90 days of age with positive EVPCR test | N = 9 | N =39 | |
| Length of stay* | 66 (5071) | 37 (2753) | 0.003 |
| Duration of parenteral antibiotics* | 74 (6994) | 48 (3660) | 0.002 |
| 5) Children >90 days of age with positive EVPCR test | N = 23 | N = 41 | |
| Length of stay* | 32 (2750) | 21 (430) | 0.002 |
| Duration of parenteral antibiotics* | 38 (2460) | 24 (2436) | 0.009 |
| 6) Children with a positive EVPCR test who presented during peak enteroviral season | N = 29 | N = 72 | |
| Length of stay* | 43 (2853) | 26 (1738) | 0.002 |
| Duration of parenteral antibiotics* | 46 (2470) | 36 (2448) | 0.05 |
We observed no trend in length of stay in either testing period ( = 0.17, 95% CI 3.9 to 3.6 pre vs = 1.64, 95% CI 6.3 to 3.0 post), with no change following the introduction of the faster EVPCR protocol (P = 0.52). We observed an increase in duration of parenteral antibiotics in the pre‐period ( = 5.4, 95% CI 0.3 to 10.6), with no trend in the post‐period ( = 1.7, 95% CI 5.2 to 1.8), but the difference was not significant (P = 0.08).
DISCUSSION
The in‐hospital EVPCR testing protocol reduced test turnaround time and increased testing. Children with a positive test had a shorter length of stay and duration of parenteral antibiotics. Decreasing the test turnaround time for EVPCR improved the care of children with enteroviral meningitis by reducing the length of unnecessary hospitalizations and parenteral antibiotics, with the potential for reducing the costs associated with these admissions.
Accurate identification of children with enteroviral meningitis, an often self‐limited infection requiring supportive care, can reduce hospitalization and unnecessary antibiotics. Previously, a positive EVPCR test result has been associated with a reduction in length of stay and of parenteral antibiotics,4, 5, 1012 with a direct correlation between test turnaround time and length of stay.12, 13 Moreover, positive EVPCR test results that were available prior to hospital discharge resulted in shorter length of hospital stay and duration of parenteral antibiotics.10
Our study is the largest to investigate the impact of implementing an in‐hospital EVPCR testing protocol, with the goal of making results available in a clinically useful time frame for all patients. Older EVPCR tests were typically performed in batches, or at centralized laboratories.4, 5, 1013 The in‐hospital EVPCR test utilized is a simple testing platform, which can be run multiple times daily. While there were higher charges associated with increased testing in the post‐period, these were more than offset by a reduced length of stay. Using study institution patient charges, we estimate that overall patient charges decreased approximately $80,000 in the post‐period, compared to the pre‐period (an average reduction of $375 per patient).
Many children were not discharged when a positive EVPCR test result became available. Some children with enteroviral meningitis will have persistent symptoms that require inpatient management. In addition, results that returned in the evening or nighttime were less likely to result in immediate hospital discharge. However, children with a positive EVPCR test are at very low risk for bacterial meningitis.3 As clinicians' knowledge of, and comfort with, the EVPCR test increase, this technology has the potential to further decrease the costs of caring for children with enteroviral meningitis.14
Our study had several limitations. First, it was retrospective; however, primary outcomes were objective measures accurately recorded in the medical record for most patients. Second, our study was single‐center, and findings may not be generalizable to other settings. Third, the management of children with meningitis may have been changing over the study period, independent of the in‐hospital EVPCR test. However, among children with a negative test, we observed no change in either of our primary outcomes. Fourth, given the large number of physicians involved with testing and treatment decisions, we could not adjust for clustering at the physician level. Fifth, we corrected CSF WBC in the case of a traumatic lumbar puncture (LP). Although use of this correction might underestimate the true CSF WBC count,6 the percentage of children with traumatic lumbar punctures was the same in both testing periods. Lastly, we evaluated the impact of a diagnostic test immediately after introduction into the clinical setting. As new medical technologies often take time to be adopted into clinical practice,15 we would expect the impact to increase over time.
CONCLUSIONS
In‐hospital EVPCR testing can improve the care of children with meningitis by reducing the length of unnecessary hospitalizations and parenteral antibiotics. Clinicians caring for children with meningitis should have access to in‐hospital EVPCR testing.
Acknowledgements
Disclosure: Nothing to report.
- .Enteroviral infections of the central nervous system.Clin Infect Dis.1995;20(4):971–981.
- ,,, et al.Clinical utility of the polymerase chain reaction for diagnosis of enteroviral meningitis in infancy.J Pediatr.1997;131(3):393–397.
- ,,,.Low risk of bacterial meningitis in children with a positive enteroviral polymerase chain reaction test result.Clin Infect Dis.2010;51(10):1221–1222.
- ,,,,,.Impact of rapid polymerase chain reaction results on management of pediatric patients with enteroviral meningitis.Pediatr Infect Dis J.2002;21(4):283–286.
- ,,,,,.Routine cerebrospinal fluid enterovirus polymerase chain reaction testing reduces hospitalization and antibiotic use for infants 90 days of age or younger.Pediatrics.2007;120(3):489–496.
- ,,,,,.Traumatic lumbar punctures in neonates: test performance of the cerebrospinal fluid white blood cell count.Pediatr Infect Dis J.2008;27(12):1047–1051.
- ,,, et al.Multicenter beta trial of the GeneXpert enterovirus assay.J Clin Microbiol.2007;45(4):1081–1086.
- ,.Most cerebrospinal fluid cultures in children with bacterial meningitis are positive within two days.Pediatr Infect Dis J.1999;18(8):732–733.
- SPSS for Windows [computer program]. Version 19.0.0.Chicago, IL:IBM SPSS Inc;2009.
- ,,,,.Impact of a diagnostic cerebrospinal fluid enterovirus polymerase chain reaction test on patient management.JAMA.2000;283(20):2680–2685.
- ,,,,.The impact of an enteroviral RT‐PCR assay on the diagnosis of aseptic meningitis and patient management.J Clin Virol.2002;25(suppl 1):S19–S26.
- ,,, et al.Impact of rapid enterovirus molecular diagnosis on the management of infants, children, and adults with aseptic meningitis.J Med Virol.2009;81(1):42–48.
- ,,, et al.A one‐step RT‐PCR assay using an enzyme‐linked detection system for the diagnosis of enterovirus meningitis.J Clin Virol.2000;17(3):143–149.
- ,.Cost analysis of enteroviral polymerase chain reaction in infants with fever and cerebrospinal fluid pleocytosis.Arch Pediatr Adolesc Med.2000;154(8):817–821.
- .Adoption of new surgical technology.BMJ.2006;332(7533):112–114.
Non‐polio enteroviruses are the most common cause of aseptic meningitis in children.1 While bacterial meningitis requires parenteral antibiotics, aseptic meningitis requires only supportive care.1 Enteroviral reverse transcription polymerase chain reaction (EVPCR) testing of the cerebrospinal fluid (CSF) allows the virus to be detected with high sensitivity and specificity.2 Because children with a positive EVPCR test are at low risk of bacterial meningitis,3 access to rapid EVPCR results has the potential to impact the clinical management of children with meningitis.4, 5 We studied the impact of implementing an in‐hospital EVPCR testing protocol on the clinical management of children with meningitis in a single‐center retrospective cohort.
MATERIALS AND METHODS
Study Design and Population
We identified children, 19 years of age, with meningitis evaluated at a single tertiary care pediatric center between July 2006 and June 2010. We defined meningitis as a CSF white blood cell (WBC) count 10 cells/mm3 corrected for the presence of CSF red blood cells (RBCs) (1 WBC for every 500 RBCs).6 We excluded children with any of the following: critical illness (defined as hypotension or respiratory failure), purpura, recent neurosurgery, ventricular shunt, immunosuppression, focal bacterial infection requiring parenteral antibiotics, positive CSF Gram stain, or known Lyme disease. The Institutional Review Board approved this study with waiver of informed consent.
Data Collection and Case Definitions
We abstracted historical and physical examination findings, as well as laboratory and microbiologic results, from the medical record. We defined bacterial meningitis as the isolation of pathogenic bacteria from the CSF or blood cultures. Children who had received antibiotics within 72 hours of diagnostic lumbar puncture, with negative cultures, were considered to have pretreated culture‐negative meningitis. Otherwise, children with negative bacterial cultures were classified as having aseptic meningitis.
EVPCR Testing
During the study pre‐period (July 1, 2006 through June 23, 2008), EVPCR tests were flown once daily to a commercial laboratory (ARUP Laboratories, Salt Lake City, UT) where they were run in batches. During the post‐period (June 24, 2008 through June 30, 2010), the study institution replaced the send‐out test with an in‐hospital EVPCR test (Gene Xpert EV Technology; Cepheid, Sunnyvale, CA)7 that allows multiple specimens to be run simultaneously, multiple times daily (between 7:00 AM and 10:00 PM), with results available in as little as 2.5 hours. We defined turnaround time for the test from specimen obtainment to test result.
Outcome Measures
Our 2 primary outcomes were length of stay and duration of parenteral antibiotics. Length of stay was measured as time from emergency department arrival to discharge (emergency department or inpatient discharge). We defined the duration of parenteral antibiotics as time from the first to the last dose of parenteral antibiotics administered, plus the standard antibiotic dosing interval for that antibiotic. For children with Lyme meningitis, the duration of parenteral antibiotic coverage was defined a priori as 48 hours, the standard time to reliably exclude bacterial growth from culture.8
Statistical Methods
Primary outcomes were compared using univariate analyses in 6 patient groups: 1) all patients, and those with 2) a positive EVPCR test, 3) a negative EVPCR test, and a positive test who were 4) 90 days old, 5) >90 days old, and 6) presented during peak enteroviral season (June through October). We utilized MannWhitney tests for continuous variables and 2 tests for proportions. We compared the median turnaround time for EVPCR results and the percentage of tests returning prior to discharge between the pre‐ and post‐periods. We performed interrupted time series spline analyses to assess for trends in our primary outcomes, independent of the change in EVPCR testing protocol. All analyses were conducted using the Statistical Package for the Social Sciences (IBM SPSS Inc, Chicago, IL).9
RESULTS
Of the 593 children with meningitis, 152 (26%) were excluded for the reasons noted above. The 441 patients included in our analyses had the following final diagnoses: bacterial meningitis (1 patient with Streptococcus pneumoniae, 0.2%), pretreated culture‐negative meningitis (42 patients, 10%), and aseptic meningitis (398 patients, 90%).
We compared patient populations and EVPCR testing characteristics between the pre‐ and post‐study periods (Table 1). While CSF glucose differed between study periods, the difference was not felt to be clinically significant. However, during the post‐period, more children presented during enteroviral season. Clinicians were more likely to order an EVPCR test for children with aseptic, than bacterial, meningitis (213/370 [58%] vs 0/1 [0%]).
| Characteristic | Pre‐period (N = 225) | Post‐period (N = 216) | P Value |
|---|---|---|---|
| |||
| Demographics | |||
| Age (months)* | 3 (2106) | 3 (188) | 0.20 |
| Male, n (%) | 135 (60) | 129 (60) | 0.95 |
| Historical features | |||
| Duration of illness (days)* | 2 (14) | 2 (14) | 0.20 |
| Duration of fever (days)* | 1 (12) | 1 (12) | 0.52 |
| Antibiotic pretreatment, n (%) | 29 (13) | 13 (6.0) | 0.015 |
| Temperature at ED presentation* (C) | 37.6 (36.838.4) | 37.8 (37.138.2) | 0.51 |
| Presentation June through October, n (%) | 127 (56) | 143 (66) | 0.040 |
| Laboratory results | |||
| Peripheral WBC (cells/mm3)* | 10.4 (8.213.7) | 10.4 (7.813.6) | 0.67 |
| Peripheral ANC (cells/mm3)* | 5.2 (3.17.4) | 4.9 (2.68.2) | 0.47 |
| CSF WBC (cells/mm3)* | 55 (19176) | 62 (17250) | 0.66 |
| CSF ANC (cells/mm3)* | 8 (045) | 7 (141) | 0.78 |
| CSF glucose (mg/dL)* | 57 (5065) | 54 (4860) | 0.01 |
| CSF protein(mg/dL)* | 50 (3480) | 48 (3470) | 0.73 |
| Traumatic lumbar puncture (CSF RBC 500 cells/mm3), n (%) | 48 (21) | 43 (20) | 0.71 |
| Patient management | |||
| Admission to the hospital, n (%) | 196 (87) | 190 (88) | 0.68 |
| Parenteral antibiotics initiated, n (%) | 206 (92) | 200 (93) | 0.80 |
| Enteroviral PCR Testing | |||
| Testing utilization, n (%) | 62 (28) | 133 (62) | 0.001 |
| 90 days of age, n (%) | 18 (16) | 57/114 (50) | 0.001 |
| >90 days of age, n (%) | 44 (39) | 76/102 (75) | 0.001 |
| Positive test result, n (%) | 33 (53) | 80 (60) | 0.22 |
| Test turnaround time, hours* | 53 (4667) | 12 (617) | 0.001 |
We evaluated the impact of the in‐hospital EVPCR test on the length of stay and duration of parenteral antibiotics for the 6 predefined patient groups (Table 2). Length of stay could be determined for 432 (98%) of study patients, and duration of parenteral antibiotics for 365 (83%). We found a clinically important decrease in both length of stay and duration of parenteral antibiotics for children with a positive EVPCR test in the post‐period. For every hour earlier the EVPCR results returned, length of stay was reduced by 0.3 hours ( = 0.3, 95% confidence interval [CI] 0.10.5), and parenteral antibiotics were reduced by 0.3 hours ( = 0.3, 95% CI 0.10.5). However, even in the post‐period, the median length of time from a positive EVPCR test result to hospital discharge was 14 hours (interquartile range, 533 hours).
| Patient Group | Pre‐Period | Post‐Period | P Value1 |
|---|---|---|---|
| |||
| 1) All study patients | N = 225 | N = 216 | |
| Length of stay* | 49 (2662) | 47 (2662) | 0.09 |
| Duration of parenteral antibiotics* | 48 (2464) | 48 (2460) | 0.23 |
| 2) Children with a positive EVPCR test | N = 32 | N = 80 | |
| Length of stay* | 44 (2854) | 28 (1946) | 0.005 |
| Duration of parenteral antibiotics* | 48 (3072) | 36 (2449) | 0.037 |
| 3) Children with a negative EVPCR test | N = 29 | N = 53 | |
| Length of stay* | 61 (30114) | 59 (45109) | 0.67 |
| Duration of parenteral antibiotics* | 52 (4784) | 54 (4870) | 0.93 |
| 4) Children 90 days of age with positive EVPCR test | N = 9 | N =39 | |
| Length of stay* | 66 (5071) | 37 (2753) | 0.003 |
| Duration of parenteral antibiotics* | 74 (6994) | 48 (3660) | 0.002 |
| 5) Children >90 days of age with positive EVPCR test | N = 23 | N = 41 | |
| Length of stay* | 32 (2750) | 21 (430) | 0.002 |
| Duration of parenteral antibiotics* | 38 (2460) | 24 (2436) | 0.009 |
| 6) Children with a positive EVPCR test who presented during peak enteroviral season | N = 29 | N = 72 | |
| Length of stay* | 43 (2853) | 26 (1738) | 0.002 |
| Duration of parenteral antibiotics* | 46 (2470) | 36 (2448) | 0.05 |
We observed no trend in length of stay in either testing period ( = 0.17, 95% CI 3.9 to 3.6 pre vs = 1.64, 95% CI 6.3 to 3.0 post), with no change following the introduction of the faster EVPCR protocol (P = 0.52). We observed an increase in duration of parenteral antibiotics in the pre‐period ( = 5.4, 95% CI 0.3 to 10.6), with no trend in the post‐period ( = 1.7, 95% CI 5.2 to 1.8), but the difference was not significant (P = 0.08).
DISCUSSION
The in‐hospital EVPCR testing protocol reduced test turnaround time and increased testing. Children with a positive test had a shorter length of stay and duration of parenteral antibiotics. Decreasing the test turnaround time for EVPCR improved the care of children with enteroviral meningitis by reducing the length of unnecessary hospitalizations and parenteral antibiotics, with the potential for reducing the costs associated with these admissions.
Accurate identification of children with enteroviral meningitis, an often self‐limited infection requiring supportive care, can reduce hospitalization and unnecessary antibiotics. Previously, a positive EVPCR test result has been associated with a reduction in length of stay and of parenteral antibiotics,4, 5, 1012 with a direct correlation between test turnaround time and length of stay.12, 13 Moreover, positive EVPCR test results that were available prior to hospital discharge resulted in shorter length of hospital stay and duration of parenteral antibiotics.10
Our study is the largest to investigate the impact of implementing an in‐hospital EVPCR testing protocol, with the goal of making results available in a clinically useful time frame for all patients. Older EVPCR tests were typically performed in batches, or at centralized laboratories.4, 5, 1013 The in‐hospital EVPCR test utilized is a simple testing platform, which can be run multiple times daily. While there were higher charges associated with increased testing in the post‐period, these were more than offset by a reduced length of stay. Using study institution patient charges, we estimate that overall patient charges decreased approximately $80,000 in the post‐period, compared to the pre‐period (an average reduction of $375 per patient).
Many children were not discharged when a positive EVPCR test result became available. Some children with enteroviral meningitis will have persistent symptoms that require inpatient management. In addition, results that returned in the evening or nighttime were less likely to result in immediate hospital discharge. However, children with a positive EVPCR test are at very low risk for bacterial meningitis.3 As clinicians' knowledge of, and comfort with, the EVPCR test increase, this technology has the potential to further decrease the costs of caring for children with enteroviral meningitis.14
Our study had several limitations. First, it was retrospective; however, primary outcomes were objective measures accurately recorded in the medical record for most patients. Second, our study was single‐center, and findings may not be generalizable to other settings. Third, the management of children with meningitis may have been changing over the study period, independent of the in‐hospital EVPCR test. However, among children with a negative test, we observed no change in either of our primary outcomes. Fourth, given the large number of physicians involved with testing and treatment decisions, we could not adjust for clustering at the physician level. Fifth, we corrected CSF WBC in the case of a traumatic lumbar puncture (LP). Although use of this correction might underestimate the true CSF WBC count,6 the percentage of children with traumatic lumbar punctures was the same in both testing periods. Lastly, we evaluated the impact of a diagnostic test immediately after introduction into the clinical setting. As new medical technologies often take time to be adopted into clinical practice,15 we would expect the impact to increase over time.
CONCLUSIONS
In‐hospital EVPCR testing can improve the care of children with meningitis by reducing the length of unnecessary hospitalizations and parenteral antibiotics. Clinicians caring for children with meningitis should have access to in‐hospital EVPCR testing.
Acknowledgements
Disclosure: Nothing to report.
Non‐polio enteroviruses are the most common cause of aseptic meningitis in children.1 While bacterial meningitis requires parenteral antibiotics, aseptic meningitis requires only supportive care.1 Enteroviral reverse transcription polymerase chain reaction (EVPCR) testing of the cerebrospinal fluid (CSF) allows the virus to be detected with high sensitivity and specificity.2 Because children with a positive EVPCR test are at low risk of bacterial meningitis,3 access to rapid EVPCR results has the potential to impact the clinical management of children with meningitis.4, 5 We studied the impact of implementing an in‐hospital EVPCR testing protocol on the clinical management of children with meningitis in a single‐center retrospective cohort.
MATERIALS AND METHODS
Study Design and Population
We identified children, 19 years of age, with meningitis evaluated at a single tertiary care pediatric center between July 2006 and June 2010. We defined meningitis as a CSF white blood cell (WBC) count 10 cells/mm3 corrected for the presence of CSF red blood cells (RBCs) (1 WBC for every 500 RBCs).6 We excluded children with any of the following: critical illness (defined as hypotension or respiratory failure), purpura, recent neurosurgery, ventricular shunt, immunosuppression, focal bacterial infection requiring parenteral antibiotics, positive CSF Gram stain, or known Lyme disease. The Institutional Review Board approved this study with waiver of informed consent.
Data Collection and Case Definitions
We abstracted historical and physical examination findings, as well as laboratory and microbiologic results, from the medical record. We defined bacterial meningitis as the isolation of pathogenic bacteria from the CSF or blood cultures. Children who had received antibiotics within 72 hours of diagnostic lumbar puncture, with negative cultures, were considered to have pretreated culture‐negative meningitis. Otherwise, children with negative bacterial cultures were classified as having aseptic meningitis.
EVPCR Testing
During the study pre‐period (July 1, 2006 through June 23, 2008), EVPCR tests were flown once daily to a commercial laboratory (ARUP Laboratories, Salt Lake City, UT) where they were run in batches. During the post‐period (June 24, 2008 through June 30, 2010), the study institution replaced the send‐out test with an in‐hospital EVPCR test (Gene Xpert EV Technology; Cepheid, Sunnyvale, CA)7 that allows multiple specimens to be run simultaneously, multiple times daily (between 7:00 AM and 10:00 PM), with results available in as little as 2.5 hours. We defined turnaround time for the test from specimen obtainment to test result.
Outcome Measures
Our 2 primary outcomes were length of stay and duration of parenteral antibiotics. Length of stay was measured as time from emergency department arrival to discharge (emergency department or inpatient discharge). We defined the duration of parenteral antibiotics as time from the first to the last dose of parenteral antibiotics administered, plus the standard antibiotic dosing interval for that antibiotic. For children with Lyme meningitis, the duration of parenteral antibiotic coverage was defined a priori as 48 hours, the standard time to reliably exclude bacterial growth from culture.8
Statistical Methods
Primary outcomes were compared using univariate analyses in 6 patient groups: 1) all patients, and those with 2) a positive EVPCR test, 3) a negative EVPCR test, and a positive test who were 4) 90 days old, 5) >90 days old, and 6) presented during peak enteroviral season (June through October). We utilized MannWhitney tests for continuous variables and 2 tests for proportions. We compared the median turnaround time for EVPCR results and the percentage of tests returning prior to discharge between the pre‐ and post‐periods. We performed interrupted time series spline analyses to assess for trends in our primary outcomes, independent of the change in EVPCR testing protocol. All analyses were conducted using the Statistical Package for the Social Sciences (IBM SPSS Inc, Chicago, IL).9
RESULTS
Of the 593 children with meningitis, 152 (26%) were excluded for the reasons noted above. The 441 patients included in our analyses had the following final diagnoses: bacterial meningitis (1 patient with Streptococcus pneumoniae, 0.2%), pretreated culture‐negative meningitis (42 patients, 10%), and aseptic meningitis (398 patients, 90%).
We compared patient populations and EVPCR testing characteristics between the pre‐ and post‐study periods (Table 1). While CSF glucose differed between study periods, the difference was not felt to be clinically significant. However, during the post‐period, more children presented during enteroviral season. Clinicians were more likely to order an EVPCR test for children with aseptic, than bacterial, meningitis (213/370 [58%] vs 0/1 [0%]).
| Characteristic | Pre‐period (N = 225) | Post‐period (N = 216) | P Value |
|---|---|---|---|
| |||
| Demographics | |||
| Age (months)* | 3 (2106) | 3 (188) | 0.20 |
| Male, n (%) | 135 (60) | 129 (60) | 0.95 |
| Historical features | |||
| Duration of illness (days)* | 2 (14) | 2 (14) | 0.20 |
| Duration of fever (days)* | 1 (12) | 1 (12) | 0.52 |
| Antibiotic pretreatment, n (%) | 29 (13) | 13 (6.0) | 0.015 |
| Temperature at ED presentation* (C) | 37.6 (36.838.4) | 37.8 (37.138.2) | 0.51 |
| Presentation June through October, n (%) | 127 (56) | 143 (66) | 0.040 |
| Laboratory results | |||
| Peripheral WBC (cells/mm3)* | 10.4 (8.213.7) | 10.4 (7.813.6) | 0.67 |
| Peripheral ANC (cells/mm3)* | 5.2 (3.17.4) | 4.9 (2.68.2) | 0.47 |
| CSF WBC (cells/mm3)* | 55 (19176) | 62 (17250) | 0.66 |
| CSF ANC (cells/mm3)* | 8 (045) | 7 (141) | 0.78 |
| CSF glucose (mg/dL)* | 57 (5065) | 54 (4860) | 0.01 |
| CSF protein(mg/dL)* | 50 (3480) | 48 (3470) | 0.73 |
| Traumatic lumbar puncture (CSF RBC 500 cells/mm3), n (%) | 48 (21) | 43 (20) | 0.71 |
| Patient management | |||
| Admission to the hospital, n (%) | 196 (87) | 190 (88) | 0.68 |
| Parenteral antibiotics initiated, n (%) | 206 (92) | 200 (93) | 0.80 |
| Enteroviral PCR Testing | |||
| Testing utilization, n (%) | 62 (28) | 133 (62) | 0.001 |
| 90 days of age, n (%) | 18 (16) | 57/114 (50) | 0.001 |
| >90 days of age, n (%) | 44 (39) | 76/102 (75) | 0.001 |
| Positive test result, n (%) | 33 (53) | 80 (60) | 0.22 |
| Test turnaround time, hours* | 53 (4667) | 12 (617) | 0.001 |
We evaluated the impact of the in‐hospital EVPCR test on the length of stay and duration of parenteral antibiotics for the 6 predefined patient groups (Table 2). Length of stay could be determined for 432 (98%) of study patients, and duration of parenteral antibiotics for 365 (83%). We found a clinically important decrease in both length of stay and duration of parenteral antibiotics for children with a positive EVPCR test in the post‐period. For every hour earlier the EVPCR results returned, length of stay was reduced by 0.3 hours ( = 0.3, 95% confidence interval [CI] 0.10.5), and parenteral antibiotics were reduced by 0.3 hours ( = 0.3, 95% CI 0.10.5). However, even in the post‐period, the median length of time from a positive EVPCR test result to hospital discharge was 14 hours (interquartile range, 533 hours).
| Patient Group | Pre‐Period | Post‐Period | P Value1 |
|---|---|---|---|
| |||
| 1) All study patients | N = 225 | N = 216 | |
| Length of stay* | 49 (2662) | 47 (2662) | 0.09 |
| Duration of parenteral antibiotics* | 48 (2464) | 48 (2460) | 0.23 |
| 2) Children with a positive EVPCR test | N = 32 | N = 80 | |
| Length of stay* | 44 (2854) | 28 (1946) | 0.005 |
| Duration of parenteral antibiotics* | 48 (3072) | 36 (2449) | 0.037 |
| 3) Children with a negative EVPCR test | N = 29 | N = 53 | |
| Length of stay* | 61 (30114) | 59 (45109) | 0.67 |
| Duration of parenteral antibiotics* | 52 (4784) | 54 (4870) | 0.93 |
| 4) Children 90 days of age with positive EVPCR test | N = 9 | N =39 | |
| Length of stay* | 66 (5071) | 37 (2753) | 0.003 |
| Duration of parenteral antibiotics* | 74 (6994) | 48 (3660) | 0.002 |
| 5) Children >90 days of age with positive EVPCR test | N = 23 | N = 41 | |
| Length of stay* | 32 (2750) | 21 (430) | 0.002 |
| Duration of parenteral antibiotics* | 38 (2460) | 24 (2436) | 0.009 |
| 6) Children with a positive EVPCR test who presented during peak enteroviral season | N = 29 | N = 72 | |
| Length of stay* | 43 (2853) | 26 (1738) | 0.002 |
| Duration of parenteral antibiotics* | 46 (2470) | 36 (2448) | 0.05 |
We observed no trend in length of stay in either testing period ( = 0.17, 95% CI 3.9 to 3.6 pre vs = 1.64, 95% CI 6.3 to 3.0 post), with no change following the introduction of the faster EVPCR protocol (P = 0.52). We observed an increase in duration of parenteral antibiotics in the pre‐period ( = 5.4, 95% CI 0.3 to 10.6), with no trend in the post‐period ( = 1.7, 95% CI 5.2 to 1.8), but the difference was not significant (P = 0.08).
DISCUSSION
The in‐hospital EVPCR testing protocol reduced test turnaround time and increased testing. Children with a positive test had a shorter length of stay and duration of parenteral antibiotics. Decreasing the test turnaround time for EVPCR improved the care of children with enteroviral meningitis by reducing the length of unnecessary hospitalizations and parenteral antibiotics, with the potential for reducing the costs associated with these admissions.
Accurate identification of children with enteroviral meningitis, an often self‐limited infection requiring supportive care, can reduce hospitalization and unnecessary antibiotics. Previously, a positive EVPCR test result has been associated with a reduction in length of stay and of parenteral antibiotics,4, 5, 1012 with a direct correlation between test turnaround time and length of stay.12, 13 Moreover, positive EVPCR test results that were available prior to hospital discharge resulted in shorter length of hospital stay and duration of parenteral antibiotics.10
Our study is the largest to investigate the impact of implementing an in‐hospital EVPCR testing protocol, with the goal of making results available in a clinically useful time frame for all patients. Older EVPCR tests were typically performed in batches, or at centralized laboratories.4, 5, 1013 The in‐hospital EVPCR test utilized is a simple testing platform, which can be run multiple times daily. While there were higher charges associated with increased testing in the post‐period, these were more than offset by a reduced length of stay. Using study institution patient charges, we estimate that overall patient charges decreased approximately $80,000 in the post‐period, compared to the pre‐period (an average reduction of $375 per patient).
Many children were not discharged when a positive EVPCR test result became available. Some children with enteroviral meningitis will have persistent symptoms that require inpatient management. In addition, results that returned in the evening or nighttime were less likely to result in immediate hospital discharge. However, children with a positive EVPCR test are at very low risk for bacterial meningitis.3 As clinicians' knowledge of, and comfort with, the EVPCR test increase, this technology has the potential to further decrease the costs of caring for children with enteroviral meningitis.14
Our study had several limitations. First, it was retrospective; however, primary outcomes were objective measures accurately recorded in the medical record for most patients. Second, our study was single‐center, and findings may not be generalizable to other settings. Third, the management of children with meningitis may have been changing over the study period, independent of the in‐hospital EVPCR test. However, among children with a negative test, we observed no change in either of our primary outcomes. Fourth, given the large number of physicians involved with testing and treatment decisions, we could not adjust for clustering at the physician level. Fifth, we corrected CSF WBC in the case of a traumatic lumbar puncture (LP). Although use of this correction might underestimate the true CSF WBC count,6 the percentage of children with traumatic lumbar punctures was the same in both testing periods. Lastly, we evaluated the impact of a diagnostic test immediately after introduction into the clinical setting. As new medical technologies often take time to be adopted into clinical practice,15 we would expect the impact to increase over time.
CONCLUSIONS
In‐hospital EVPCR testing can improve the care of children with meningitis by reducing the length of unnecessary hospitalizations and parenteral antibiotics. Clinicians caring for children with meningitis should have access to in‐hospital EVPCR testing.
Acknowledgements
Disclosure: Nothing to report.
- .Enteroviral infections of the central nervous system.Clin Infect Dis.1995;20(4):971–981.
- ,,, et al.Clinical utility of the polymerase chain reaction for diagnosis of enteroviral meningitis in infancy.J Pediatr.1997;131(3):393–397.
- ,,,.Low risk of bacterial meningitis in children with a positive enteroviral polymerase chain reaction test result.Clin Infect Dis.2010;51(10):1221–1222.
- ,,,,,.Impact of rapid polymerase chain reaction results on management of pediatric patients with enteroviral meningitis.Pediatr Infect Dis J.2002;21(4):283–286.
- ,,,,,.Routine cerebrospinal fluid enterovirus polymerase chain reaction testing reduces hospitalization and antibiotic use for infants 90 days of age or younger.Pediatrics.2007;120(3):489–496.
- ,,,,,.Traumatic lumbar punctures in neonates: test performance of the cerebrospinal fluid white blood cell count.Pediatr Infect Dis J.2008;27(12):1047–1051.
- ,,, et al.Multicenter beta trial of the GeneXpert enterovirus assay.J Clin Microbiol.2007;45(4):1081–1086.
- ,.Most cerebrospinal fluid cultures in children with bacterial meningitis are positive within two days.Pediatr Infect Dis J.1999;18(8):732–733.
- SPSS for Windows [computer program]. Version 19.0.0.Chicago, IL:IBM SPSS Inc;2009.
- ,,,,.Impact of a diagnostic cerebrospinal fluid enterovirus polymerase chain reaction test on patient management.JAMA.2000;283(20):2680–2685.
- ,,,,.The impact of an enteroviral RT‐PCR assay on the diagnosis of aseptic meningitis and patient management.J Clin Virol.2002;25(suppl 1):S19–S26.
- ,,, et al.Impact of rapid enterovirus molecular diagnosis on the management of infants, children, and adults with aseptic meningitis.J Med Virol.2009;81(1):42–48.
- ,,, et al.A one‐step RT‐PCR assay using an enzyme‐linked detection system for the diagnosis of enterovirus meningitis.J Clin Virol.2000;17(3):143–149.
- ,.Cost analysis of enteroviral polymerase chain reaction in infants with fever and cerebrospinal fluid pleocytosis.Arch Pediatr Adolesc Med.2000;154(8):817–821.
- .Adoption of new surgical technology.BMJ.2006;332(7533):112–114.
- .Enteroviral infections of the central nervous system.Clin Infect Dis.1995;20(4):971–981.
- ,,, et al.Clinical utility of the polymerase chain reaction for diagnosis of enteroviral meningitis in infancy.J Pediatr.1997;131(3):393–397.
- ,,,.Low risk of bacterial meningitis in children with a positive enteroviral polymerase chain reaction test result.Clin Infect Dis.2010;51(10):1221–1222.
- ,,,,,.Impact of rapid polymerase chain reaction results on management of pediatric patients with enteroviral meningitis.Pediatr Infect Dis J.2002;21(4):283–286.
- ,,,,,.Routine cerebrospinal fluid enterovirus polymerase chain reaction testing reduces hospitalization and antibiotic use for infants 90 days of age or younger.Pediatrics.2007;120(3):489–496.
- ,,,,,.Traumatic lumbar punctures in neonates: test performance of the cerebrospinal fluid white blood cell count.Pediatr Infect Dis J.2008;27(12):1047–1051.
- ,,, et al.Multicenter beta trial of the GeneXpert enterovirus assay.J Clin Microbiol.2007;45(4):1081–1086.
- ,.Most cerebrospinal fluid cultures in children with bacterial meningitis are positive within two days.Pediatr Infect Dis J.1999;18(8):732–733.
- SPSS for Windows [computer program]. Version 19.0.0.Chicago, IL:IBM SPSS Inc;2009.
- ,,,,.Impact of a diagnostic cerebrospinal fluid enterovirus polymerase chain reaction test on patient management.JAMA.2000;283(20):2680–2685.
- ,,,,.The impact of an enteroviral RT‐PCR assay on the diagnosis of aseptic meningitis and patient management.J Clin Virol.2002;25(suppl 1):S19–S26.
- ,,, et al.Impact of rapid enterovirus molecular diagnosis on the management of infants, children, and adults with aseptic meningitis.J Med Virol.2009;81(1):42–48.
- ,,, et al.A one‐step RT‐PCR assay using an enzyme‐linked detection system for the diagnosis of enterovirus meningitis.J Clin Virol.2000;17(3):143–149.
- ,.Cost analysis of enteroviral polymerase chain reaction in infants with fever and cerebrospinal fluid pleocytosis.Arch Pediatr Adolesc Med.2000;154(8):817–821.
- .Adoption of new surgical technology.BMJ.2006;332(7533):112–114.
Unprofessional Behavior and Hospitalists
The discrepancy between what is taught about professionalism in formal medical education and what is witnessed in the hospital has received increasing attention.17 This latter aspect of medical education contributes to the hidden curriculum and impacts medical trainees' views on professionalism.8 The hidden curriculum refers to the lessons trainees learn through informal interactions within the multilayered educational learning environment.9 A growing body of work examines how the hidden curriculum and disruptive physicians impact the learning environment.9, 10 In response, regulatory agencies, such as the Liaison Committee on Medical Education (LCME) and Accreditation Council for Graduate Medical Education (ACGME), require training programs and medical schools to maintain standards of professionalism, and to regularly evaluate the learning environment and its impact on professionalism.11, 12 The ACGME in 2011 expanded its standards regarding professionalism by making certain that the program director and institution ensure a culture of professionalism that supports patient safety and personal responsibility.11 Given this increasing focus on professionalism in medical school and residency training programs, it is critical to examine faculty perceptions and actions that may perpetuate the discrepancy between the formal and hidden curriculum.13 This early exposure is especially significant because unprofessional behavior in medical school is strongly associated with later disciplinary action by a medical board.14, 15 Certain unprofessional behaviors can also compromise patient care and safety, and can detract from the hospital working environment.1618
In our previous work, we demonstrated that internal medicine interns reported increased participation in unprofessional behaviors regarding on‐call etiquette during internship.19, 20 Examples of these behaviors include refusing an admission (ie, blocking) and misrepresenting a test as urgent. Interestingly, students and residents have highlighted the powerful role of supervising faculty physicians in condoning or inhibiting such behavior. Given the increasing role of hospitalists as resident supervisors, it is important to consider the perceptions and actions of hospitalists with respect to perpetuating or hindering some unprofessional behaviors. Although hospital medicine is a relatively new specialty, many hospitalists are in frequent contact with medical trainees, perhaps because many residency programs and medical schools have a strong inpatient focus.2123 It is thus possible that hospitalists have a major influence on residents' behaviors and views of professionalism. In fact, the Society of Hospital Medicine's Core Competencies for Hospital Medicine explicitly state that hospitalists are expected to serve as a role model for professional and ethical conduct to house staff, medical students and other members of the interdisciplinary team.24
Therefore, the current study had 2 aims: first, to measure internal medicine hospitalists' perceptions of, and participation in, unprofessional behaviors using a previously validated survey; and second, to examine associations between job characteristics and participation in unprofessional behaviors.
METHODS
Study Design
This was a multi‐institutional, observational study that took place at the University of Chicago Pritzker School of Medicine, Northwestern University Feinberg School of Medicine, and NorthShore University HealthSystem. Hospitalist physicians employed at these hospitals were recruited for this study between June 2010 and July 2010. The Institutional Review Boards of the University of Chicago, Northwestern University, and NorthShore University HealthSystem approved this study. All subjects provided informed consent before participating.
Survey Development and Administration
Based on a prior survey of interns and third‐year medical students, a 35‐item survey was used to measure perceptions of, and participation in, unprofessional behaviors.8, 19, 20 The original survey was developed in 2005 by medical students who observed behaviors by trainees and faculty that they considered to be unprofessional. The survey was subsequently modified by interns to ascertain unprofessional behavior among interns. For this iteration, hospitalists and study authors at each site reviewed the survey items and adapted each item to ensure relevance to hospitalist work and also generalizability to site. New items were also created to refer specifically to work routinely performed by hospitalist attendings (attesting to resident notes, transferring patients to other services to reduce workload, etc). Because of this, certain items utilized jargon to refer to the unprofessional behavior as hospitalists do (ie, blocking admissions and turfing), and resonate with literature describing these phenomena.25 Items were also written in such a fashion to elicit the unprofessional nature (ie, blocking an admission that could be appropriate for your service).
The final survey (see Supporting Information, Appendix, in the online version of this article) included domains such as interactions with others, interactions with trainees, and patient‐care scenarios. Demographic information and job characteristics were collected including year of residency completion, total amount of clinical work, amount of night work, and amount of administrative work. Hospitalists were not asked whether they completed residency at the institution where they currently work in order to maintain anonymity in the context of a small sample. Instead, they were asked to rate their familiarity with residents at their institution on a Likert‐type scale ranging from very unfamiliar (1) to familiar (3) to very familiar (5). To help standardize levels of familiarity across hospitalists, we developed anchors that corresponded to how well a hospitalist would know resident names with familiar defined as knowing over half of resident names.
Participants reported whether they participated in, or observed, a particular behavior and rated their perception of each behavior from 1 (unprofessional) to 5 (professional), with unprofessional and somewhat unprofessional defined as unprofessional. A site champion administered paper surveys during a routine faculty meeting at each site. An electronic version was administered using SurveyMonkey (SurveyMonkey, Palo Alto, CA) to hospitalists not present at the faculty meeting. Participants chose a unique, nonidentifiable code to facilitate truthful reporting while allowing data tracking in follow‐up studies.
Data Analysis
Clinical time was dichotomized using above and below 50% full‐time equivalents (FTE) to define those that did less clinical. Because teaching time was relatively low with the median percent FTE spent on teaching at 10%, we used a cutoff of greater than 10% as greater teaching. Because many hospitalists engaged in no night work, night work was reported as those who engaged in any night work and those who did not. Similarly, because many hospitalists had no administrative time, administrative time was split into those with any administrative work and those without any administrative work. Lastly, those born after 1970 were classified as younger hospitalists.
Chi‐square tests were used to compare site response rates, and descriptive statistics were used to examine demographic characteristics of hospitalist respondents, in addition to perception of, and participation in, unprofessional behaviors. Because items on the survey were highly correlated, we used factor analysis to identify the underlying constructs that related to unprofessional behavior.26 Factor analysis is a statistical procedure that is most often used to explore which variables in a data set are most related or correlated to each other. By examining the patterns of similar responses, the underlying factors can be identified and extracted. These factors, by definition, are not correlated with each other. To select the number of factors to retain, the most common convention is to use Kaiser criterion, or retain all factors with eigenvalues greater than, or equal to, one.27 An eigenvalue measures the amount of variation in all of the items on the survey which is accounted for by that factor. If a factor has a low eigenvalue (less than 1 is the convention), then it is contributing little and is ignored, as it is likely redundant with the higher value factors.
Because use of Kaiser criterion often overestimates the number of factors to retain, another method is to use a scree plot which tends to underestimate the factors. Both were used in this study to ensure a stable solution. To name the factors, we examined which items or group of items loaded or were most highly related to which factor. To ensure an optimal factor solution, items with minimal participation (less than 3%) were excluded from factor analysis.
Then, site‐adjusted multivariate regression analysis was used to examine associations between job and demographic characteristics, and the factors of unprofessional behavior identified. Models controlled for gender and familiarity with residents. Because sample medians were used to define greater teaching (>10% FTE), we also performed a sensitivity analysis using different cutoffs for teaching time (>20% FTE and teaching tertiles). Likewise, we also used varying definitions of less clinical time to ensure that any statistically significant associations were robust across varying definitions. All data were analyzed using STATA 11.0 (Stata Corp, College Station, TX) and statistical significance was defined as P < 0.05.
RESULTS
Seventy‐seven of the 101 hospitalists (76.2%) at 3 sites completed the survey. While response rates varied by site (site 1, 67%; site 2, 74%; site 3, 86%), the differences were not statistically significant (2 = 2.9, P = 0.24). Most hospitalists (79.2%) completed residency after 2000. Over half (57.1%) of participants were male, and over half (61%) reported having worked with their current hospitalist group from 1 to 4 years. Almost 60% (59.7%) reported being unfamiliar with residents in the program. Over 40% of hospitalists did not do any night work. Hospitalists were largely clinical, one‐quarter of hospitalists reported working over 50% FTE, and the median was 80% FTE. While 78% of hospitalists reported some teaching time, median time on teaching service was low at 10% (Table 1).
| Total n (%) | |
|---|---|
| |
| Male (%) | 44 (57.1) |
| Completed residency (%) | |
| Between 1981 and 1990 | 2 (2.6) |
| Between 1991 and 2000 | 14 (18.2) |
| After 2000 | 61 (79.2) |
| Medical school matriculation (%) (n = 76) | |
| US medical school | 59 (77.6) |
| International medical school | 17 (22.3) |
| Years spent with current hospitalist group (%) | |
| <1 yr | 14 (18.2) |
| 14 yr | 47 (61.0) |
| 59 yr | 15 (19.5) |
| >10 yr | 1 (1.3) |
| Familiarity with residents (%) | |
| Familiar | 31 (40.2) |
| Unfamiliar | 46 (59.7) |
| No. of weeks per year spent on (median IQR) | |
| Hospitalist practice (n = 72) | 26.0 [16.026.0] |
| Teaching services (n = 68) | 4.0 [1.08.0] |
| Weeks working nights* (n = 71) | |
| >2 wk | 16 (22.5) |
| 12 wk | 24 (33.8) |
| 0 wk | 31 (43.7) |
| % Clinical time (median IQR)* (n = 73) | 80 (5099) |
| % Teaching time (median IQR)* (n = 74) | 10 (120) |
| Any research time (%)* (n = 71) | 22 (31.0) |
| Any administrative time (%) (n = 72) | 29 (40.3) |
| Completed fellowship (%)* | 12 (15.6) |
| Won teaching awards (%)* (n = 76) | 21 (27.6) |
| View a career in hospital medicine as (%) | |
| Temporary | 11 (14.3) |
| Long term | 47 (61.0) |
| Unsure | 19 (24.7) |
Hospitalists perceived almost all behaviors as unprofessional (unprofessional or somewhat unprofessional on a 5‐point Likert Scale). The only behavior rated as professional with a mean of 4.25 (95% CI 4.014.49) was staying past shift limit to complete a patient‐care task that could have been signed out. This behavior also had the highest level of participation by hospitalists (81.7%). Hospitalists were most ambivalent when rating professionalism of attending an industry‐sponsored dinner or social event (mean 3.20, 95% CI 2.983.41) (Table 2).
| Behavior | Reported Perception (Mean Likert score)* | Reported Participation (%) | Reported Observation (%) |
|---|---|---|---|
| |||
| Having nonmedical/personal conversations in patient corridors (eg, discussing evening plans) | 2.55 (2.342.76) | 67.1 | 80.3 |
| Ordering a routine test as urgent to get it expedited | 2.82 (2.583.06) | 62.3 | 80.5 |
| Making fun of other physicians to colleagues | 1.56 (1.391.70) | 40.3 | 67.5 |
| Disparaging the ER team/outpatient doctor to others for findings later discovered on the floor (eg, after the patient is admitted) | 2.01 (1.842.19) | 39.5 | 67.1 |
| Signing out patients over the phone at the end of shift when sign‐out could have been done in person | 2.95 (2.743.16) | 40.8 | 65.8 |
| Texting or using smartphone during educational conferences (ie, noon lecture) | 2.16 (1.952.36) | 39.0 | 72.7 |
| Discussing patient information in public spaces | 1.49 (1.341.63) | 37.7 | 66.2 |
| Making fun of other attendings to colleagues | 1.62 (1.461.78) | 35.1 | 61.0 |
| Deferring family members' concerns about a change in the patient's clinical course to the primary team in order to avoid engaging in such a discussion | 2.16 (1.912.40) | 30.3 | 55.3 |
| Making disparaging comments about a patient on rounds | 1.42 (1.271.56) | 29.8 | 67.5 |
| Attending an industry (eg, pharmaceutical or equipment/device manufacturer)‐sponsored dinner or social event | 3.20 (2.983.41) | 28.6 | 60.5 |
| Ignoring family member's nonurgent questions about a cross‐cover patient when you had time to answer | 2.05 (1.852.25) | 26.3 | 48.7 |
| Attesting to a resident's note when not fully confident of the content of their documentation | 1.65 (1.451.85) | 23.4 | 32.5 |
| Making fun of support staff to colleagues | 1.45 (1.311.59) | 22.1 | 57.9 |
| Not correcting someone who mistakes a student for a physician | 2.19 (2.012.38) | 20.8 | 35.1 |
| Celebrating a blocked‐admission | 1.80 (1.612.00) | 21.1 | 60.5 |
| Making fun of residents to colleagues | 1.53 (1.371.70) | 18.2 | 44.2 |
| Coming to work when you have a significant illness (eg, influenza) | 1.99 (1.792.19) | 14.3 | 35.1 |
| Celebrating a successful turf | 1.71 (1.511.92) | 11.7 | 39.0 |
| Failing to notify the patient that a member of the team made, or is concerned that they made, an error | 1.53 (1.341.71) | 10.4 | 20.8 |
| Transferring a patient, who could be cared for on one's own service, to another service in order to reduce one's census (eg, turfing) | 1.72 (1.521.91) | 9.3 | 58.7 |
| Refusing an admission which could be considered appropriate for your service (eg, blocking) | 1.63 (1.441.82) | 7.9 | 68.4 |
| Falsifying patient records (ie, back‐dating a note, copying forward unverified information, or documenting physical findings not personally obtained) | 1.22 (1.101.34) | 6.5 | 27.3 |
| Making fun of students to colleagues | 1.35 (1.191.51) | 6.5 | 24.7 |
| Failing to notify patient‐safety or risk management that a member of the team made, or is concerned that they made, an error | 1.64 (1.461.82) | 5.2 | 13.2 |
| Introducing a student as a doctor to patients | 1.96 (1.762.16) | 3.9 | 20.8 |
| Signing‐out a procedure or task, that could have been completed during a required shift or by the primary team, in order to go home as early in the day as possible | 1.48 (1.321.64) | 3.9 | 48.1 |
| Performing medical or surgical procedures on a patient beyond self‐perceived level of skill | 1.27 (1.141.41) | 2.6 | 7.8 |
| Asking a student to obtain written consent from a patient or their proxy without supervision (eg, for blood transfusion or minor procedures) | 1.60 (1.421.78) | 2.63 | 6.5 |
| Encouraging a student to state that they are a doctor in order to expedite patient care | 1.31 (1.151.47) | 2.6 | 6.5 |
| Discharging a patient before they are ready to go home in order to reduce one's census | 1.18 (1.071.29) | 2.6 | 19.5 |
| Reporting patient information (eg, labs, test results, exam results) as normal when uncertain of the true results | 1.29 (1.161.41) | 2.6 | 15.6 |
| Asking a student to perform medical or surgical procedures which are perceived to be beyond their level of skill | 1.26 (1.121.40) | 1.3 | 3.9 |
| Asking a student to discuss, with patients, medical or surgical information which is perceived to be beyond their level of knowledge | 1.41 (1.261.56) | 0.0 | 15.8 |
Participation in egregious behaviors, such as falsifying patient records (6.49%) and performing medical or surgical procedures on a patient beyond self‐perceived level of skill (2.60%), was very low. The most common behaviors rated as unprofessional that hospitalists reported participating in were having nonmedical/personal conversations in patient corridors (67.1%), ordering a routine test as urgent to expedite care (62.3%), and making fun of other physicians to colleagues (40.3%). Forty percent of participants reported disparaging the emergency room (ER) team or primary care physician for findings later discovered, signing out over the phone when it could have been done in person, and texting or using smartphones during educational conferences. In particular, participation in unprofessional behaviors related to trainees was close to zero (eg, asking a student to discuss, with patients, medical or surgical information which is perceived to be beyond their level of knowledge). The least common behaviors that hospitalists reported participating in were discharging a patient before they are ready to go home in order to reduce one's census (2.56%) and reporting patient information as normal when uncertain of the true results (2.60%). Like previous studies of unprofessional behaviors, those that reported participation were less likely to report the behavior as unprofessional.8, 19
Observation of behaviors ranged from 4% to 80%. In all cases, observation of the behavior was reported at a higher level than participation. Correlation between observation and participation was also high, with the exception of a few behaviors that had zero or near zero participation rates (ie, reporting patient information as normal when unsure of true results.)
After performing factor analysis, 4 factors had eigenvalues greater than 1 and were therefore retained and extracted for further analysis. These 4 factors accounted for 76% of the variance in responses reported on the survey. By examining which items or groups of items most strongly loaded on each factor, the factors were named accordingly: factor 1 referred to behaviors related to making fun of others, factor 2 referred to workload management, factor 3 referred to behaviors related to the learning environment, and factor 4 referred to behaviors related to time pressure (Table 3).
|
| Factor 1: Making fun of others |
| Making fun of other physicians (0.78) |
| Making fun of attendings (0.77) |
| Making fun of residents (0.70) |
| Making disparaging comments about a patient on rounds (0.51) |
| Factor 2: Workload management |
| Celebrating a successful turf (0.81) |
| Celebrating a blocked‐admission (0.65) |
| Coming to work sick (0.56) |
| Transferring a patient, who could be cared for on one's own service, to another service in order to reduce one's census (eg, turfing.) (0.51) |
| Disparaging the ER team/outpatient doctor to others for findings later discovered on the floor (0.48) |
| Discharging a patient before they are ready to go home in order to reduce one's census (0.43) |
| Factor 3: Learning environment |
| Not correcting someone who mistakes a student for a physician (0.72) |
| Texting or using smartphone during educational conferences (ie, noon lecture) (0.51) |
| Failing to notify patient‐safety or risk management that a member of the team made, or is concerned that they made, an error (0.45) |
| Having nonmedical/personal conversations in patient corridors (eg, discussing evening plans) (0.43) |
| Factor 4: Time pressure |
| Ignoring family member's nonurgent questions about a cross‐cover patient when you had the time to answer (0.50) |
| Signing out patients over the phone at the end of shift when sign‐out could have been done in person (0.46) |
| Attesting to a resident's note when not fully confident of the content of their documentation (0.44) |
Using site‐adjusted multivariate regression, certain hospitalist job characteristics were associated with certain patterns of participating in unprofessional behavior (Table 4). Those with less clinical time (<50% FTE) were more likely to participate in unprofessional behaviors related to making fun of others (factor 1, value = 0.94, 95% CI 0.32 to 1.56, P value <0.05). Hospitalists who had any administrative time ( value = 0.61, 95% CI 0.111.10, P value <0.05) were more likely to report participation in behaviors related to workload management. Hospitalists engaged in any night work were more likely to report participation in unprofessional behaviors related to time pressure ( value = 0.67, 95% CI 0.171.17, P value <0.05). Time devoted to teaching or research was not associated with greater participation in any of the domains of unprofessional behavior surveyed.
| Model | Making Fun of Others | Learning Environment | Workload Management | Time Pressure |
|---|---|---|---|---|
| Predictor | Beta [95% CI] | Beta [95% CI] | Beta [95% CI] | Beta [95% CI] |
| ||||
| Job characteristics | ||||
| Less clinical | 0.94 [0.32, 1.56]* | 0.01 [0.66, 0.64] | 0.17 [0.84, 0.49] | 0.39 [0.24, 1.01] |
| Administrative | 0.30 [0.16, 0.76] | 0.06 [0.43, 0.54] | 0.61 [0.11, 1.10]* | 0.26 [0.20, 0.72] |
| Teaching | 0.01 [0.49, 0.48] | 0.09 [0.60, 0.42] | 0.12 [0.64, 0.40] | 0.16 [0.33, 0.65] |
| Research | 0.30 [0.87, 0.27] | 0.38 [0.98, 0.22] | 0.37 [0.98, 0.24] | 0.13 [0.45, 0.71] |
| Any nights | 0.08 [0.58, 0.42] | 0.24 [0.28, 0.77] | 0.24 [0.29, 0.76] | 0.67 [0.17,1.17]* |
| Demographic characteristics | ||||
| Male | 0.06 [0.42, 0.53] | 0.03 [0.47, 0.53] | 0.05 [0.56, 0.47] | 0.40 [0.89, 0.08] |
| Younger∥ | 0.05 [0.79, 0.69] | 0.64 [1.42, 0.14] | 0.87 [0.07, 1.67]* | 0.62 [0.13, 1.37] |
| Unfamiliar with residents | 0.32 [0.85, 0.22] | 0.32 [0.89, 0.24] | 0.13 [0.45, 0.70] | 0.47 [0.08, 1.01] |
| Institution | ||||
| Site 1 | 0.58 [0.22, 1.38] | 0.05 [0.89, 0.79] | 1.01 [0.15, 1.86]* | 0.77 [1.57, 0.04] |
| Site 3 | 0.11 [0.68, 0.47] | 0.70 [1.31, 0.09]* | 0.43 [0.20, 1.05] | 0.45 [0.13, 1.04] |
| Constant | 0.03 [0.99, 1.06] | 0.94 [0.14, 2.02] | 1.23[2.34, 0.13]* | 1.34[2.39, 0.31]* |
The only demographic characteristic that was significantly associated with unprofessional behavior was age. Specifically, those who were born after 1970 were more likely to participate in unprofessional behaviors related to workload management ( value = 0.87, 95% CI 0.071.67, P value <0.05). Site differences were also present. Specifically, one site was more likely to report participation in unprofessional behaviors related to workload management ( value site 1 = 1.01, 95% CI 0.15 to 1.86, P value <0.05), while another site was less likely to report participation in behaviors related to the learning environment ( value site 3 = 0.70, 95% CI 1.31 to 0.09, P value <0.05). Gender and familiarity with residents were not significant predictors of participation in unprofessional behaviors. Results remained robust in sensitivity analyses using different cutoffs of clinical time and teaching time.
DISCUSSION
This multisite study adds to what is known about the perceptions of, and participation in, unprofessional behaviors among internal medicine hospitalists. Hospitalists perceived almost all surveyed behaviors as unprofessional. Participation in egregious and trainee‐related unprofessional behaviors was very low. Four categories appeared to explain the variability in how hospitalists reported participation in unprofessional behaviors: making fun of others, workload management, learning environment, and time pressure. Participation in behaviors within these factors was associated with certain job characteristics, such as clinical time, administrative time, and night work, as well as age and site.
It is reassuring that participation in, and trainee‐related, unprofessional behaviors is very low, and it is noteworthy that attending an industry‐sponsored dinner is not considered unprofessional. This was surprising in the setting of increased external pressures to report and ban such interactions.28 Perception that attending such dinners is acceptable may reflect a lag between current practice and national recommendations.
It is important to explore why certain job characteristics are associated with participation in unprofessional behaviors. For example, those with less clinical time were more likely to participate in making fun of others. It may be the case that hospitalists with more clinical time may make a larger effort to develop and maintain positive relationships. Another possible explanation is that hospitalists with less clinical time are more easily influenced by those in the learning environment who make fun of others, such as residents who they are supervising for only a brief period.
For unprofessional behaviors related to workload management, those who were younger, and those with any administrative time, were more likely to participate in behaviors such as celebrating a blocked‐admission. Our prior work shows that behaviors related to workload management are more widespread in residency, and therefore younger hospitalists, who are often recent residency graduates, may be more prone to participating in these behaviors. While unproven, it is possible that those with more administrative time may have competing priorities with their administrative roles, which motivate them to more actively manage their workload, leading them to participate in workload management behaviors.
Hospitalists who did any night work were more likely to participate in unprofessional behaviors related to time pressure. This could reflect the high workloads that night hospitalists may face and the pressure they feel to wrap up work, resulting in a hasty handoff (ie, over the phone) or to defer work (ie, family questions). Site differences were also observed for participation in behaviors related to the learning environment, speaking to the importance of institutional culture.
It is worth mentioning that hospitalists who were teachers were not any less likely to report participating in certain behaviors. While 78% of hospitalists reported some level of teaching, the median reported percentage of teaching was 10% FTE. This level of teaching likely reflects the diverse nature of work in which hospitalists engage. While hospitalists spend some time working with trainees, services that are not staffed with residents (eg, uncovered services) are becoming increasingly common due to stricter resident duty hour restrictions. This may explain why 60% of hospitalists reported being unfamiliar with residents. We also used a high bar for familiarity, which we defined as knowing half of residents by name, and served as a proxy for those who may have trained at the institution where they currently work. In spite of hospitalists reporting a low fraction of their total clinical time devoted to resident services, a significant fraction of resident services were staffed by hospitalists at all sites, making them a natural target for interventions.
These results have implications for future work to assess and improve professionalism in the hospital learning environment. First, interventions to address unprofessional behaviors should focus on behaviors with the highest participation rates. Like our earlier studies of residents, participation is high in certain behaviors, such as misrepresenting a test as urgent, or disparaging the ER or primary care physician (PCP) for a missed finding.19, 20 While blocking an admission was common in our studies of residents, reported participation among hospitalists was low. Similar to a prior study of clinical year medical students at one of our sites, 1 in 5 hospitalists reported not correcting someone who mistakes a student for a physician, highlighting the role that hospitalists may have in perpetuating this behavior.8 Additionally, addressing the behaviors identified in this study, through novel curricular tools, may help to teach residents many of the interpersonal and communication skills called for in the 2011 ACGME Common Program Requirements.11 The ACGME requirements also include the expectation that faculty model how to manage their time before, during, and after clinical assignments, and recognize that transferring a patient to a rested provider is best. Given that most hospitalists believe staying past shift limit is professional, these requirements will be difficult to adopt without widespread culture change.
Moreover, interventions could be tailored to hospitalists with certain job characteristics. Interventions may be educational or systems based. An example of the former is stressing the impact of the learning and working environment on trainees, and an example of the latter is streamlining the process in which ordered tests are executed to result in a more timely completion of tests. This may result in fewer physicians misrepresenting a test as urgent in order to have the test done in a timely manner. Additionally, hospitalists with less clinical time could receive education on their impact as a role model for trainees. Hospitalists who are younger or with administrative commitments could be trained on the importance of avoiding behaviors related to workload management, such as blocking or turfing patients. Lastly, given the site differences, critical examination of institutional culture and policies is also important. With funding from the American Board of Internal Medicine (ABIM) Foundation, we are currently creating an educational intervention, targeting those behaviors that were most frequent among hospitalists and residents at our institutions to promote dialogue and critical reflection, with the hope of reducing the most prevalent behaviors encountered.
There are several limitations to this study. Despite the anonymity of the survey, participants may have inaccurately reported their participation in unprofessional behaviors due to socially desirable response. In addition, because we used factor analysis and multivariate regression models with a small sample size, item nonresponse limited the sample for regression analyses and raises the concern for response bias. However, all significant associations remained so after performing backwards stepwise elimination of covariates that were P > 0.10 in models that were larger (ranging from 65 to 69). Because we used self‐report and not direct observation of participation in unprofessional behaviors, it is not possible to validate the responses given. Future work could rely on the use of 360 degree evaluations or other methods to validate responses given by self‐report. It is also important to consider assessing whether these behaviors are associated with actual patient outcomes, such as length of stay or readmission. Some items may not always be unprofessional. For example, texting during an educational conference might be to advance care, which would not necessarily be unprofessional. The order in which the questions were asked could have led to bias. We asked about participation before perception to try to limit bias reporting in participation. Changing the order of these questions would potentially have resulted in under‐reporting participation in behaviors that one perceived to be unprofessional. This study was conducted at 3 institutions located in Chicago, limiting generalizability to institutions outside of this area. Only internal medicine hospitalists were surveyed, which also limits generalizability to other disciplines and specialties within internal medicine. Lastly, it is important to highlight that hospitalists are not the sole teachers on inpatient services, since residents encounter a variety of faculty who serve as teaching attendings. Future work should expand to other centers and other specialties.
In conclusion, in this multi‐institutional study of hospitalists, participation in egregious behaviors was low. Four factors or patterns underlie hospitalists' reports of participation in unprofessional behavior: making fun of others, learning environment, workload management, and time pressure. Job characteristics (clinical time, administrative time, night work), age, and site were all associated with different patterns of unprofessional behavior. Specifically, hospitalists with less clinical time were more likely to make fun of others. Hospitalists who were younger in age, as well as those who had any administrative work, were more likely to participate in behaviors related to workload management. Hospitalists who work nights were more likely to report behaviors related to time pressure. Interventions to promote professionalism should take institutional culture into account and should focus on behaviors with the highest participation rates. Efforts should also be made to address underlying reasons for participation in these behaviors.
Acknowledgements
The authors thank Meryl Prochaska for her research assistance and manuscript preparation.
Disclosures: The authors acknowledge funding from the ABIM Foundation and the Pritzker Summer Research Program. The funders had no role in the design of the study; the collection, analysis, and interpretation of the data; or the decision to approve publication of the finished manuscript. Prior presentations of the data include the 2010 University of Chicago Pritzker School of Medicine Summer Research Forum, the 2010 University of Chicago Pritzker School of Medicine Medical Education Day, the 2010 Midwest Society of Hospital Medicine Meeting in Chicago, IL, and the 2011 Society of Hospital Medicine National Meeting in Dallas, TX. All authors disclose no relevant or financial conflicts of interest.
- .Practicing what we preach? An analysis of the curriculum of values in medical education.Am J Med.1998;104:569–575.
- ,,.Medical professionalism: conflicting values for tomorrow's doctors.J Gen Intern Med.2010;25(12):1330–1336.
- ,,,,.Medical students' professionalism narratives: a window on the informal and hidden curriculum.Acad Med.2010;85(1):124–133.
- ,,,,,.Interpreting values conflicts experienced by obstetrics‐gynecology clerkship students using reflective writing.Acad Med.2009;84(5):587–596.
- .The teaching of professionalism during residency: why it is failing and a suggestion to improve its success.Anesth Analg.2009;108(3):948–954.
- ,.What we don't know we are teaching: unveiling the hidden curriculum.Clin Orthop Relat Res.2006;449:20–27.
- .Definitions of professionalism: a search for meaning and identity.Clin Orthop Relat Res.2006;449:193–204.
- ,,, et al.Third‐year medical students' participation in and perceptions of unprofessional behaviors.Acad Med.2007;82:S35–S39.
- .Beyond curriculum reform: confronting medicine's hidden curriculum.Acad Med.1998;73:403–407.
- .Physicians' “disruptive” behavior: consequences for medical quality and safety.Am J Med Qual.2008;23:165–167.
- Accreditation Council for Graduate Medical Education. Common Program Requirements: General Competencies. Available at: http://www.acgme.org/acwebsite/home/common_program_requirements_07012011.pdf. Accessed December 19,2011.
- Liaison Committee on Medical Education. Functions and Structure of a Medical School. Available at: http://www.lcme.org/functions2010jun.pdf.. Accessed June 30,2010.
- ,,,,.Residents' perceptions of their own professionalism and the professionalism of their learning environment.J Grad Med Educ.2009;1:208–215.
- ,,,.Unprofessional behavior in medical school is associated with subsequent disciplinary action by a state medical board.Acad Med.2004;79:244–249.
- ,,, et al.Disciplinary action by medical boards and prior behavior in medical school.N Engl J Med.2005;353:2673–2682.
- ,.A survey of the impact of disruptive behaviors and communication defects on patient safety.Jt Comm J Qual Patient Saf.2008;34:464–471.
- ,.Managing disruptive physician behavior—impact on staff relationships and patient care.Neurology.2008;70:1564–1570.
- The Joint Commission.Behaviors that undermine a culture of safety. Sentinel Event Alert.2008. Available at: http://www.jointcommission.org/assets/1/18/SEA_40.PDF. Accessed April 28, 2012.
- ,,,,.Participation in and perceptions of unprofessional behaviors among incoming internal medicine interns.JAMA.2008;300:1132–1134.
- ,,, et al.Changes in perception of and participation in unprofessional behaviors during internship.Acad Med.2010;85:S76–S80.
- .Reflections: the hospitalist movement a decade later.J Hosp Med.2006;1:248–252.
- Society of Hospital Medicine, 2007–2008 Bi‐Annual Survey.2008. Available at: http://www.medscape.org/viewarticle/578134. Accessed April 28, 2012.
- ,,, et al.Reforming internal medicine residency training. A report from the Society of General Internal Medicine's Task Force for Residency Reform.J Gen Intern Med.2005;20:1165–1172.
- Society of Hospital Medicine.The Core Competencies in Hospital Medicine: a framework for curriculum development by the Society of Hospital Medicine.J Hosp Med.2006;1(suppl 1):2–5.
- ,,.Can patients tell when they are unwanted? “Turfing” in residency training.Patient Educ Couns.2005;56:104–111.
- ,.Best practices in exploratory factor analysis: four recommendations for getting the most from your analysis.Pract Assess Res Eval.2005;10:1–9.
- Principal Components and Factor Analysis. StatSoft Electronic Statistics Textbook. Available at: http://www.statsoft.com/textbook/principal‐components‐factor‐analysis/. Accessed December 30,2011.
- ,,, et al.Health industry practices that create conflicts of interest: a policy proposal for academic medical centers.JAMA.2006;295(4):429–433.
The discrepancy between what is taught about professionalism in formal medical education and what is witnessed in the hospital has received increasing attention.17 This latter aspect of medical education contributes to the hidden curriculum and impacts medical trainees' views on professionalism.8 The hidden curriculum refers to the lessons trainees learn through informal interactions within the multilayered educational learning environment.9 A growing body of work examines how the hidden curriculum and disruptive physicians impact the learning environment.9, 10 In response, regulatory agencies, such as the Liaison Committee on Medical Education (LCME) and Accreditation Council for Graduate Medical Education (ACGME), require training programs and medical schools to maintain standards of professionalism, and to regularly evaluate the learning environment and its impact on professionalism.11, 12 The ACGME in 2011 expanded its standards regarding professionalism by making certain that the program director and institution ensure a culture of professionalism that supports patient safety and personal responsibility.11 Given this increasing focus on professionalism in medical school and residency training programs, it is critical to examine faculty perceptions and actions that may perpetuate the discrepancy between the formal and hidden curriculum.13 This early exposure is especially significant because unprofessional behavior in medical school is strongly associated with later disciplinary action by a medical board.14, 15 Certain unprofessional behaviors can also compromise patient care and safety, and can detract from the hospital working environment.1618
In our previous work, we demonstrated that internal medicine interns reported increased participation in unprofessional behaviors regarding on‐call etiquette during internship.19, 20 Examples of these behaviors include refusing an admission (ie, blocking) and misrepresenting a test as urgent. Interestingly, students and residents have highlighted the powerful role of supervising faculty physicians in condoning or inhibiting such behavior. Given the increasing role of hospitalists as resident supervisors, it is important to consider the perceptions and actions of hospitalists with respect to perpetuating or hindering some unprofessional behaviors. Although hospital medicine is a relatively new specialty, many hospitalists are in frequent contact with medical trainees, perhaps because many residency programs and medical schools have a strong inpatient focus.2123 It is thus possible that hospitalists have a major influence on residents' behaviors and views of professionalism. In fact, the Society of Hospital Medicine's Core Competencies for Hospital Medicine explicitly state that hospitalists are expected to serve as a role model for professional and ethical conduct to house staff, medical students and other members of the interdisciplinary team.24
Therefore, the current study had 2 aims: first, to measure internal medicine hospitalists' perceptions of, and participation in, unprofessional behaviors using a previously validated survey; and second, to examine associations between job characteristics and participation in unprofessional behaviors.
METHODS
Study Design
This was a multi‐institutional, observational study that took place at the University of Chicago Pritzker School of Medicine, Northwestern University Feinberg School of Medicine, and NorthShore University HealthSystem. Hospitalist physicians employed at these hospitals were recruited for this study between June 2010 and July 2010. The Institutional Review Boards of the University of Chicago, Northwestern University, and NorthShore University HealthSystem approved this study. All subjects provided informed consent before participating.
Survey Development and Administration
Based on a prior survey of interns and third‐year medical students, a 35‐item survey was used to measure perceptions of, and participation in, unprofessional behaviors.8, 19, 20 The original survey was developed in 2005 by medical students who observed behaviors by trainees and faculty that they considered to be unprofessional. The survey was subsequently modified by interns to ascertain unprofessional behavior among interns. For this iteration, hospitalists and study authors at each site reviewed the survey items and adapted each item to ensure relevance to hospitalist work and also generalizability to site. New items were also created to refer specifically to work routinely performed by hospitalist attendings (attesting to resident notes, transferring patients to other services to reduce workload, etc). Because of this, certain items utilized jargon to refer to the unprofessional behavior as hospitalists do (ie, blocking admissions and turfing), and resonate with literature describing these phenomena.25 Items were also written in such a fashion to elicit the unprofessional nature (ie, blocking an admission that could be appropriate for your service).
The final survey (see Supporting Information, Appendix, in the online version of this article) included domains such as interactions with others, interactions with trainees, and patient‐care scenarios. Demographic information and job characteristics were collected including year of residency completion, total amount of clinical work, amount of night work, and amount of administrative work. Hospitalists were not asked whether they completed residency at the institution where they currently work in order to maintain anonymity in the context of a small sample. Instead, they were asked to rate their familiarity with residents at their institution on a Likert‐type scale ranging from very unfamiliar (1) to familiar (3) to very familiar (5). To help standardize levels of familiarity across hospitalists, we developed anchors that corresponded to how well a hospitalist would know resident names with familiar defined as knowing over half of resident names.
Participants reported whether they participated in, or observed, a particular behavior and rated their perception of each behavior from 1 (unprofessional) to 5 (professional), with unprofessional and somewhat unprofessional defined as unprofessional. A site champion administered paper surveys during a routine faculty meeting at each site. An electronic version was administered using SurveyMonkey (SurveyMonkey, Palo Alto, CA) to hospitalists not present at the faculty meeting. Participants chose a unique, nonidentifiable code to facilitate truthful reporting while allowing data tracking in follow‐up studies.
Data Analysis
Clinical time was dichotomized using above and below 50% full‐time equivalents (FTE) to define those that did less clinical. Because teaching time was relatively low with the median percent FTE spent on teaching at 10%, we used a cutoff of greater than 10% as greater teaching. Because many hospitalists engaged in no night work, night work was reported as those who engaged in any night work and those who did not. Similarly, because many hospitalists had no administrative time, administrative time was split into those with any administrative work and those without any administrative work. Lastly, those born after 1970 were classified as younger hospitalists.
Chi‐square tests were used to compare site response rates, and descriptive statistics were used to examine demographic characteristics of hospitalist respondents, in addition to perception of, and participation in, unprofessional behaviors. Because items on the survey were highly correlated, we used factor analysis to identify the underlying constructs that related to unprofessional behavior.26 Factor analysis is a statistical procedure that is most often used to explore which variables in a data set are most related or correlated to each other. By examining the patterns of similar responses, the underlying factors can be identified and extracted. These factors, by definition, are not correlated with each other. To select the number of factors to retain, the most common convention is to use Kaiser criterion, or retain all factors with eigenvalues greater than, or equal to, one.27 An eigenvalue measures the amount of variation in all of the items on the survey which is accounted for by that factor. If a factor has a low eigenvalue (less than 1 is the convention), then it is contributing little and is ignored, as it is likely redundant with the higher value factors.
Because use of Kaiser criterion often overestimates the number of factors to retain, another method is to use a scree plot which tends to underestimate the factors. Both were used in this study to ensure a stable solution. To name the factors, we examined which items or group of items loaded or were most highly related to which factor. To ensure an optimal factor solution, items with minimal participation (less than 3%) were excluded from factor analysis.
Then, site‐adjusted multivariate regression analysis was used to examine associations between job and demographic characteristics, and the factors of unprofessional behavior identified. Models controlled for gender and familiarity with residents. Because sample medians were used to define greater teaching (>10% FTE), we also performed a sensitivity analysis using different cutoffs for teaching time (>20% FTE and teaching tertiles). Likewise, we also used varying definitions of less clinical time to ensure that any statistically significant associations were robust across varying definitions. All data were analyzed using STATA 11.0 (Stata Corp, College Station, TX) and statistical significance was defined as P < 0.05.
RESULTS
Seventy‐seven of the 101 hospitalists (76.2%) at 3 sites completed the survey. While response rates varied by site (site 1, 67%; site 2, 74%; site 3, 86%), the differences were not statistically significant (2 = 2.9, P = 0.24). Most hospitalists (79.2%) completed residency after 2000. Over half (57.1%) of participants were male, and over half (61%) reported having worked with their current hospitalist group from 1 to 4 years. Almost 60% (59.7%) reported being unfamiliar with residents in the program. Over 40% of hospitalists did not do any night work. Hospitalists were largely clinical, one‐quarter of hospitalists reported working over 50% FTE, and the median was 80% FTE. While 78% of hospitalists reported some teaching time, median time on teaching service was low at 10% (Table 1).
| Total n (%) | |
|---|---|
| |
| Male (%) | 44 (57.1) |
| Completed residency (%) | |
| Between 1981 and 1990 | 2 (2.6) |
| Between 1991 and 2000 | 14 (18.2) |
| After 2000 | 61 (79.2) |
| Medical school matriculation (%) (n = 76) | |
| US medical school | 59 (77.6) |
| International medical school | 17 (22.3) |
| Years spent with current hospitalist group (%) | |
| <1 yr | 14 (18.2) |
| 14 yr | 47 (61.0) |
| 59 yr | 15 (19.5) |
| >10 yr | 1 (1.3) |
| Familiarity with residents (%) | |
| Familiar | 31 (40.2) |
| Unfamiliar | 46 (59.7) |
| No. of weeks per year spent on (median IQR) | |
| Hospitalist practice (n = 72) | 26.0 [16.026.0] |
| Teaching services (n = 68) | 4.0 [1.08.0] |
| Weeks working nights* (n = 71) | |
| >2 wk | 16 (22.5) |
| 12 wk | 24 (33.8) |
| 0 wk | 31 (43.7) |
| % Clinical time (median IQR)* (n = 73) | 80 (5099) |
| % Teaching time (median IQR)* (n = 74) | 10 (120) |
| Any research time (%)* (n = 71) | 22 (31.0) |
| Any administrative time (%) (n = 72) | 29 (40.3) |
| Completed fellowship (%)* | 12 (15.6) |
| Won teaching awards (%)* (n = 76) | 21 (27.6) |
| View a career in hospital medicine as (%) | |
| Temporary | 11 (14.3) |
| Long term | 47 (61.0) |
| Unsure | 19 (24.7) |
Hospitalists perceived almost all behaviors as unprofessional (unprofessional or somewhat unprofessional on a 5‐point Likert Scale). The only behavior rated as professional with a mean of 4.25 (95% CI 4.014.49) was staying past shift limit to complete a patient‐care task that could have been signed out. This behavior also had the highest level of participation by hospitalists (81.7%). Hospitalists were most ambivalent when rating professionalism of attending an industry‐sponsored dinner or social event (mean 3.20, 95% CI 2.983.41) (Table 2).
| Behavior | Reported Perception (Mean Likert score)* | Reported Participation (%) | Reported Observation (%) |
|---|---|---|---|
| |||
| Having nonmedical/personal conversations in patient corridors (eg, discussing evening plans) | 2.55 (2.342.76) | 67.1 | 80.3 |
| Ordering a routine test as urgent to get it expedited | 2.82 (2.583.06) | 62.3 | 80.5 |
| Making fun of other physicians to colleagues | 1.56 (1.391.70) | 40.3 | 67.5 |
| Disparaging the ER team/outpatient doctor to others for findings later discovered on the floor (eg, after the patient is admitted) | 2.01 (1.842.19) | 39.5 | 67.1 |
| Signing out patients over the phone at the end of shift when sign‐out could have been done in person | 2.95 (2.743.16) | 40.8 | 65.8 |
| Texting or using smartphone during educational conferences (ie, noon lecture) | 2.16 (1.952.36) | 39.0 | 72.7 |
| Discussing patient information in public spaces | 1.49 (1.341.63) | 37.7 | 66.2 |
| Making fun of other attendings to colleagues | 1.62 (1.461.78) | 35.1 | 61.0 |
| Deferring family members' concerns about a change in the patient's clinical course to the primary team in order to avoid engaging in such a discussion | 2.16 (1.912.40) | 30.3 | 55.3 |
| Making disparaging comments about a patient on rounds | 1.42 (1.271.56) | 29.8 | 67.5 |
| Attending an industry (eg, pharmaceutical or equipment/device manufacturer)‐sponsored dinner or social event | 3.20 (2.983.41) | 28.6 | 60.5 |
| Ignoring family member's nonurgent questions about a cross‐cover patient when you had time to answer | 2.05 (1.852.25) | 26.3 | 48.7 |
| Attesting to a resident's note when not fully confident of the content of their documentation | 1.65 (1.451.85) | 23.4 | 32.5 |
| Making fun of support staff to colleagues | 1.45 (1.311.59) | 22.1 | 57.9 |
| Not correcting someone who mistakes a student for a physician | 2.19 (2.012.38) | 20.8 | 35.1 |
| Celebrating a blocked‐admission | 1.80 (1.612.00) | 21.1 | 60.5 |
| Making fun of residents to colleagues | 1.53 (1.371.70) | 18.2 | 44.2 |
| Coming to work when you have a significant illness (eg, influenza) | 1.99 (1.792.19) | 14.3 | 35.1 |
| Celebrating a successful turf | 1.71 (1.511.92) | 11.7 | 39.0 |
| Failing to notify the patient that a member of the team made, or is concerned that they made, an error | 1.53 (1.341.71) | 10.4 | 20.8 |
| Transferring a patient, who could be cared for on one's own service, to another service in order to reduce one's census (eg, turfing) | 1.72 (1.521.91) | 9.3 | 58.7 |
| Refusing an admission which could be considered appropriate for your service (eg, blocking) | 1.63 (1.441.82) | 7.9 | 68.4 |
| Falsifying patient records (ie, back‐dating a note, copying forward unverified information, or documenting physical findings not personally obtained) | 1.22 (1.101.34) | 6.5 | 27.3 |
| Making fun of students to colleagues | 1.35 (1.191.51) | 6.5 | 24.7 |
| Failing to notify patient‐safety or risk management that a member of the team made, or is concerned that they made, an error | 1.64 (1.461.82) | 5.2 | 13.2 |
| Introducing a student as a doctor to patients | 1.96 (1.762.16) | 3.9 | 20.8 |
| Signing‐out a procedure or task, that could have been completed during a required shift or by the primary team, in order to go home as early in the day as possible | 1.48 (1.321.64) | 3.9 | 48.1 |
| Performing medical or surgical procedures on a patient beyond self‐perceived level of skill | 1.27 (1.141.41) | 2.6 | 7.8 |
| Asking a student to obtain written consent from a patient or their proxy without supervision (eg, for blood transfusion or minor procedures) | 1.60 (1.421.78) | 2.63 | 6.5 |
| Encouraging a student to state that they are a doctor in order to expedite patient care | 1.31 (1.151.47) | 2.6 | 6.5 |
| Discharging a patient before they are ready to go home in order to reduce one's census | 1.18 (1.071.29) | 2.6 | 19.5 |
| Reporting patient information (eg, labs, test results, exam results) as normal when uncertain of the true results | 1.29 (1.161.41) | 2.6 | 15.6 |
| Asking a student to perform medical or surgical procedures which are perceived to be beyond their level of skill | 1.26 (1.121.40) | 1.3 | 3.9 |
| Asking a student to discuss, with patients, medical or surgical information which is perceived to be beyond their level of knowledge | 1.41 (1.261.56) | 0.0 | 15.8 |
Participation in egregious behaviors, such as falsifying patient records (6.49%) and performing medical or surgical procedures on a patient beyond self‐perceived level of skill (2.60%), was very low. The most common behaviors rated as unprofessional that hospitalists reported participating in were having nonmedical/personal conversations in patient corridors (67.1%), ordering a routine test as urgent to expedite care (62.3%), and making fun of other physicians to colleagues (40.3%). Forty percent of participants reported disparaging the emergency room (ER) team or primary care physician for findings later discovered, signing out over the phone when it could have been done in person, and texting or using smartphones during educational conferences. In particular, participation in unprofessional behaviors related to trainees was close to zero (eg, asking a student to discuss, with patients, medical or surgical information which is perceived to be beyond their level of knowledge). The least common behaviors that hospitalists reported participating in were discharging a patient before they are ready to go home in order to reduce one's census (2.56%) and reporting patient information as normal when uncertain of the true results (2.60%). Like previous studies of unprofessional behaviors, those that reported participation were less likely to report the behavior as unprofessional.8, 19
Observation of behaviors ranged from 4% to 80%. In all cases, observation of the behavior was reported at a higher level than participation. Correlation between observation and participation was also high, with the exception of a few behaviors that had zero or near zero participation rates (ie, reporting patient information as normal when unsure of true results.)
After performing factor analysis, 4 factors had eigenvalues greater than 1 and were therefore retained and extracted for further analysis. These 4 factors accounted for 76% of the variance in responses reported on the survey. By examining which items or groups of items most strongly loaded on each factor, the factors were named accordingly: factor 1 referred to behaviors related to making fun of others, factor 2 referred to workload management, factor 3 referred to behaviors related to the learning environment, and factor 4 referred to behaviors related to time pressure (Table 3).
|
| Factor 1: Making fun of others |
| Making fun of other physicians (0.78) |
| Making fun of attendings (0.77) |
| Making fun of residents (0.70) |
| Making disparaging comments about a patient on rounds (0.51) |
| Factor 2: Workload management |
| Celebrating a successful turf (0.81) |
| Celebrating a blocked‐admission (0.65) |
| Coming to work sick (0.56) |
| Transferring a patient, who could be cared for on one's own service, to another service in order to reduce one's census (eg, turfing.) (0.51) |
| Disparaging the ER team/outpatient doctor to others for findings later discovered on the floor (0.48) |
| Discharging a patient before they are ready to go home in order to reduce one's census (0.43) |
| Factor 3: Learning environment |
| Not correcting someone who mistakes a student for a physician (0.72) |
| Texting or using smartphone during educational conferences (ie, noon lecture) (0.51) |
| Failing to notify patient‐safety or risk management that a member of the team made, or is concerned that they made, an error (0.45) |
| Having nonmedical/personal conversations in patient corridors (eg, discussing evening plans) (0.43) |
| Factor 4: Time pressure |
| Ignoring family member's nonurgent questions about a cross‐cover patient when you had the time to answer (0.50) |
| Signing out patients over the phone at the end of shift when sign‐out could have been done in person (0.46) |
| Attesting to a resident's note when not fully confident of the content of their documentation (0.44) |
Using site‐adjusted multivariate regression, certain hospitalist job characteristics were associated with certain patterns of participating in unprofessional behavior (Table 4). Those with less clinical time (<50% FTE) were more likely to participate in unprofessional behaviors related to making fun of others (factor 1, value = 0.94, 95% CI 0.32 to 1.56, P value <0.05). Hospitalists who had any administrative time ( value = 0.61, 95% CI 0.111.10, P value <0.05) were more likely to report participation in behaviors related to workload management. Hospitalists engaged in any night work were more likely to report participation in unprofessional behaviors related to time pressure ( value = 0.67, 95% CI 0.171.17, P value <0.05). Time devoted to teaching or research was not associated with greater participation in any of the domains of unprofessional behavior surveyed.
| Model | Making Fun of Others | Learning Environment | Workload Management | Time Pressure |
|---|---|---|---|---|
| Predictor | Beta [95% CI] | Beta [95% CI] | Beta [95% CI] | Beta [95% CI] |
| ||||
| Job characteristics | ||||
| Less clinical | 0.94 [0.32, 1.56]* | 0.01 [0.66, 0.64] | 0.17 [0.84, 0.49] | 0.39 [0.24, 1.01] |
| Administrative | 0.30 [0.16, 0.76] | 0.06 [0.43, 0.54] | 0.61 [0.11, 1.10]* | 0.26 [0.20, 0.72] |
| Teaching | 0.01 [0.49, 0.48] | 0.09 [0.60, 0.42] | 0.12 [0.64, 0.40] | 0.16 [0.33, 0.65] |
| Research | 0.30 [0.87, 0.27] | 0.38 [0.98, 0.22] | 0.37 [0.98, 0.24] | 0.13 [0.45, 0.71] |
| Any nights | 0.08 [0.58, 0.42] | 0.24 [0.28, 0.77] | 0.24 [0.29, 0.76] | 0.67 [0.17,1.17]* |
| Demographic characteristics | ||||
| Male | 0.06 [0.42, 0.53] | 0.03 [0.47, 0.53] | 0.05 [0.56, 0.47] | 0.40 [0.89, 0.08] |
| Younger∥ | 0.05 [0.79, 0.69] | 0.64 [1.42, 0.14] | 0.87 [0.07, 1.67]* | 0.62 [0.13, 1.37] |
| Unfamiliar with residents | 0.32 [0.85, 0.22] | 0.32 [0.89, 0.24] | 0.13 [0.45, 0.70] | 0.47 [0.08, 1.01] |
| Institution | ||||
| Site 1 | 0.58 [0.22, 1.38] | 0.05 [0.89, 0.79] | 1.01 [0.15, 1.86]* | 0.77 [1.57, 0.04] |
| Site 3 | 0.11 [0.68, 0.47] | 0.70 [1.31, 0.09]* | 0.43 [0.20, 1.05] | 0.45 [0.13, 1.04] |
| Constant | 0.03 [0.99, 1.06] | 0.94 [0.14, 2.02] | 1.23[2.34, 0.13]* | 1.34[2.39, 0.31]* |
The only demographic characteristic that was significantly associated with unprofessional behavior was age. Specifically, those who were born after 1970 were more likely to participate in unprofessional behaviors related to workload management ( value = 0.87, 95% CI 0.071.67, P value <0.05). Site differences were also present. Specifically, one site was more likely to report participation in unprofessional behaviors related to workload management ( value site 1 = 1.01, 95% CI 0.15 to 1.86, P value <0.05), while another site was less likely to report participation in behaviors related to the learning environment ( value site 3 = 0.70, 95% CI 1.31 to 0.09, P value <0.05). Gender and familiarity with residents were not significant predictors of participation in unprofessional behaviors. Results remained robust in sensitivity analyses using different cutoffs of clinical time and teaching time.
DISCUSSION
This multisite study adds to what is known about the perceptions of, and participation in, unprofessional behaviors among internal medicine hospitalists. Hospitalists perceived almost all surveyed behaviors as unprofessional. Participation in egregious and trainee‐related unprofessional behaviors was very low. Four categories appeared to explain the variability in how hospitalists reported participation in unprofessional behaviors: making fun of others, workload management, learning environment, and time pressure. Participation in behaviors within these factors was associated with certain job characteristics, such as clinical time, administrative time, and night work, as well as age and site.
It is reassuring that participation in, and trainee‐related, unprofessional behaviors is very low, and it is noteworthy that attending an industry‐sponsored dinner is not considered unprofessional. This was surprising in the setting of increased external pressures to report and ban such interactions.28 Perception that attending such dinners is acceptable may reflect a lag between current practice and national recommendations.
It is important to explore why certain job characteristics are associated with participation in unprofessional behaviors. For example, those with less clinical time were more likely to participate in making fun of others. It may be the case that hospitalists with more clinical time may make a larger effort to develop and maintain positive relationships. Another possible explanation is that hospitalists with less clinical time are more easily influenced by those in the learning environment who make fun of others, such as residents who they are supervising for only a brief period.
For unprofessional behaviors related to workload management, those who were younger, and those with any administrative time, were more likely to participate in behaviors such as celebrating a blocked‐admission. Our prior work shows that behaviors related to workload management are more widespread in residency, and therefore younger hospitalists, who are often recent residency graduates, may be more prone to participating in these behaviors. While unproven, it is possible that those with more administrative time may have competing priorities with their administrative roles, which motivate them to more actively manage their workload, leading them to participate in workload management behaviors.
Hospitalists who did any night work were more likely to participate in unprofessional behaviors related to time pressure. This could reflect the high workloads that night hospitalists may face and the pressure they feel to wrap up work, resulting in a hasty handoff (ie, over the phone) or to defer work (ie, family questions). Site differences were also observed for participation in behaviors related to the learning environment, speaking to the importance of institutional culture.
It is worth mentioning that hospitalists who were teachers were not any less likely to report participating in certain behaviors. While 78% of hospitalists reported some level of teaching, the median reported percentage of teaching was 10% FTE. This level of teaching likely reflects the diverse nature of work in which hospitalists engage. While hospitalists spend some time working with trainees, services that are not staffed with residents (eg, uncovered services) are becoming increasingly common due to stricter resident duty hour restrictions. This may explain why 60% of hospitalists reported being unfamiliar with residents. We also used a high bar for familiarity, which we defined as knowing half of residents by name, and served as a proxy for those who may have trained at the institution where they currently work. In spite of hospitalists reporting a low fraction of their total clinical time devoted to resident services, a significant fraction of resident services were staffed by hospitalists at all sites, making them a natural target for interventions.
These results have implications for future work to assess and improve professionalism in the hospital learning environment. First, interventions to address unprofessional behaviors should focus on behaviors with the highest participation rates. Like our earlier studies of residents, participation is high in certain behaviors, such as misrepresenting a test as urgent, or disparaging the ER or primary care physician (PCP) for a missed finding.19, 20 While blocking an admission was common in our studies of residents, reported participation among hospitalists was low. Similar to a prior study of clinical year medical students at one of our sites, 1 in 5 hospitalists reported not correcting someone who mistakes a student for a physician, highlighting the role that hospitalists may have in perpetuating this behavior.8 Additionally, addressing the behaviors identified in this study, through novel curricular tools, may help to teach residents many of the interpersonal and communication skills called for in the 2011 ACGME Common Program Requirements.11 The ACGME requirements also include the expectation that faculty model how to manage their time before, during, and after clinical assignments, and recognize that transferring a patient to a rested provider is best. Given that most hospitalists believe staying past shift limit is professional, these requirements will be difficult to adopt without widespread culture change.
Moreover, interventions could be tailored to hospitalists with certain job characteristics. Interventions may be educational or systems based. An example of the former is stressing the impact of the learning and working environment on trainees, and an example of the latter is streamlining the process in which ordered tests are executed to result in a more timely completion of tests. This may result in fewer physicians misrepresenting a test as urgent in order to have the test done in a timely manner. Additionally, hospitalists with less clinical time could receive education on their impact as a role model for trainees. Hospitalists who are younger or with administrative commitments could be trained on the importance of avoiding behaviors related to workload management, such as blocking or turfing patients. Lastly, given the site differences, critical examination of institutional culture and policies is also important. With funding from the American Board of Internal Medicine (ABIM) Foundation, we are currently creating an educational intervention, targeting those behaviors that were most frequent among hospitalists and residents at our institutions to promote dialogue and critical reflection, with the hope of reducing the most prevalent behaviors encountered.
There are several limitations to this study. Despite the anonymity of the survey, participants may have inaccurately reported their participation in unprofessional behaviors due to socially desirable response. In addition, because we used factor analysis and multivariate regression models with a small sample size, item nonresponse limited the sample for regression analyses and raises the concern for response bias. However, all significant associations remained so after performing backwards stepwise elimination of covariates that were P > 0.10 in models that were larger (ranging from 65 to 69). Because we used self‐report and not direct observation of participation in unprofessional behaviors, it is not possible to validate the responses given. Future work could rely on the use of 360 degree evaluations or other methods to validate responses given by self‐report. It is also important to consider assessing whether these behaviors are associated with actual patient outcomes, such as length of stay or readmission. Some items may not always be unprofessional. For example, texting during an educational conference might be to advance care, which would not necessarily be unprofessional. The order in which the questions were asked could have led to bias. We asked about participation before perception to try to limit bias reporting in participation. Changing the order of these questions would potentially have resulted in under‐reporting participation in behaviors that one perceived to be unprofessional. This study was conducted at 3 institutions located in Chicago, limiting generalizability to institutions outside of this area. Only internal medicine hospitalists were surveyed, which also limits generalizability to other disciplines and specialties within internal medicine. Lastly, it is important to highlight that hospitalists are not the sole teachers on inpatient services, since residents encounter a variety of faculty who serve as teaching attendings. Future work should expand to other centers and other specialties.
In conclusion, in this multi‐institutional study of hospitalists, participation in egregious behaviors was low. Four factors or patterns underlie hospitalists' reports of participation in unprofessional behavior: making fun of others, learning environment, workload management, and time pressure. Job characteristics (clinical time, administrative time, night work), age, and site were all associated with different patterns of unprofessional behavior. Specifically, hospitalists with less clinical time were more likely to make fun of others. Hospitalists who were younger in age, as well as those who had any administrative work, were more likely to participate in behaviors related to workload management. Hospitalists who work nights were more likely to report behaviors related to time pressure. Interventions to promote professionalism should take institutional culture into account and should focus on behaviors with the highest participation rates. Efforts should also be made to address underlying reasons for participation in these behaviors.
Acknowledgements
The authors thank Meryl Prochaska for her research assistance and manuscript preparation.
Disclosures: The authors acknowledge funding from the ABIM Foundation and the Pritzker Summer Research Program. The funders had no role in the design of the study; the collection, analysis, and interpretation of the data; or the decision to approve publication of the finished manuscript. Prior presentations of the data include the 2010 University of Chicago Pritzker School of Medicine Summer Research Forum, the 2010 University of Chicago Pritzker School of Medicine Medical Education Day, the 2010 Midwest Society of Hospital Medicine Meeting in Chicago, IL, and the 2011 Society of Hospital Medicine National Meeting in Dallas, TX. All authors disclose no relevant or financial conflicts of interest.
The discrepancy between what is taught about professionalism in formal medical education and what is witnessed in the hospital has received increasing attention.17 This latter aspect of medical education contributes to the hidden curriculum and impacts medical trainees' views on professionalism.8 The hidden curriculum refers to the lessons trainees learn through informal interactions within the multilayered educational learning environment.9 A growing body of work examines how the hidden curriculum and disruptive physicians impact the learning environment.9, 10 In response, regulatory agencies, such as the Liaison Committee on Medical Education (LCME) and Accreditation Council for Graduate Medical Education (ACGME), require training programs and medical schools to maintain standards of professionalism, and to regularly evaluate the learning environment and its impact on professionalism.11, 12 The ACGME in 2011 expanded its standards regarding professionalism by making certain that the program director and institution ensure a culture of professionalism that supports patient safety and personal responsibility.11 Given this increasing focus on professionalism in medical school and residency training programs, it is critical to examine faculty perceptions and actions that may perpetuate the discrepancy between the formal and hidden curriculum.13 This early exposure is especially significant because unprofessional behavior in medical school is strongly associated with later disciplinary action by a medical board.14, 15 Certain unprofessional behaviors can also compromise patient care and safety, and can detract from the hospital working environment.1618
In our previous work, we demonstrated that internal medicine interns reported increased participation in unprofessional behaviors regarding on‐call etiquette during internship.19, 20 Examples of these behaviors include refusing an admission (ie, blocking) and misrepresenting a test as urgent. Interestingly, students and residents have highlighted the powerful role of supervising faculty physicians in condoning or inhibiting such behavior. Given the increasing role of hospitalists as resident supervisors, it is important to consider the perceptions and actions of hospitalists with respect to perpetuating or hindering some unprofessional behaviors. Although hospital medicine is a relatively new specialty, many hospitalists are in frequent contact with medical trainees, perhaps because many residency programs and medical schools have a strong inpatient focus.2123 It is thus possible that hospitalists have a major influence on residents' behaviors and views of professionalism. In fact, the Society of Hospital Medicine's Core Competencies for Hospital Medicine explicitly state that hospitalists are expected to serve as a role model for professional and ethical conduct to house staff, medical students and other members of the interdisciplinary team.24
Therefore, the current study had 2 aims: first, to measure internal medicine hospitalists' perceptions of, and participation in, unprofessional behaviors using a previously validated survey; and second, to examine associations between job characteristics and participation in unprofessional behaviors.
METHODS
Study Design
This was a multi‐institutional, observational study that took place at the University of Chicago Pritzker School of Medicine, Northwestern University Feinberg School of Medicine, and NorthShore University HealthSystem. Hospitalist physicians employed at these hospitals were recruited for this study between June 2010 and July 2010. The Institutional Review Boards of the University of Chicago, Northwestern University, and NorthShore University HealthSystem approved this study. All subjects provided informed consent before participating.
Survey Development and Administration
Based on a prior survey of interns and third‐year medical students, a 35‐item survey was used to measure perceptions of, and participation in, unprofessional behaviors.8, 19, 20 The original survey was developed in 2005 by medical students who observed behaviors by trainees and faculty that they considered to be unprofessional. The survey was subsequently modified by interns to ascertain unprofessional behavior among interns. For this iteration, hospitalists and study authors at each site reviewed the survey items and adapted each item to ensure relevance to hospitalist work and also generalizability to site. New items were also created to refer specifically to work routinely performed by hospitalist attendings (attesting to resident notes, transferring patients to other services to reduce workload, etc). Because of this, certain items utilized jargon to refer to the unprofessional behavior as hospitalists do (ie, blocking admissions and turfing), and resonate with literature describing these phenomena.25 Items were also written in such a fashion to elicit the unprofessional nature (ie, blocking an admission that could be appropriate for your service).
The final survey (see Supporting Information, Appendix, in the online version of this article) included domains such as interactions with others, interactions with trainees, and patient‐care scenarios. Demographic information and job characteristics were collected including year of residency completion, total amount of clinical work, amount of night work, and amount of administrative work. Hospitalists were not asked whether they completed residency at the institution where they currently work in order to maintain anonymity in the context of a small sample. Instead, they were asked to rate their familiarity with residents at their institution on a Likert‐type scale ranging from very unfamiliar (1) to familiar (3) to very familiar (5). To help standardize levels of familiarity across hospitalists, we developed anchors that corresponded to how well a hospitalist would know resident names with familiar defined as knowing over half of resident names.
Participants reported whether they participated in, or observed, a particular behavior and rated their perception of each behavior from 1 (unprofessional) to 5 (professional), with unprofessional and somewhat unprofessional defined as unprofessional. A site champion administered paper surveys during a routine faculty meeting at each site. An electronic version was administered using SurveyMonkey (SurveyMonkey, Palo Alto, CA) to hospitalists not present at the faculty meeting. Participants chose a unique, nonidentifiable code to facilitate truthful reporting while allowing data tracking in follow‐up studies.
Data Analysis
Clinical time was dichotomized using above and below 50% full‐time equivalents (FTE) to define those that did less clinical. Because teaching time was relatively low with the median percent FTE spent on teaching at 10%, we used a cutoff of greater than 10% as greater teaching. Because many hospitalists engaged in no night work, night work was reported as those who engaged in any night work and those who did not. Similarly, because many hospitalists had no administrative time, administrative time was split into those with any administrative work and those without any administrative work. Lastly, those born after 1970 were classified as younger hospitalists.
Chi‐square tests were used to compare site response rates, and descriptive statistics were used to examine demographic characteristics of hospitalist respondents, in addition to perception of, and participation in, unprofessional behaviors. Because items on the survey were highly correlated, we used factor analysis to identify the underlying constructs that related to unprofessional behavior.26 Factor analysis is a statistical procedure that is most often used to explore which variables in a data set are most related or correlated to each other. By examining the patterns of similar responses, the underlying factors can be identified and extracted. These factors, by definition, are not correlated with each other. To select the number of factors to retain, the most common convention is to use Kaiser criterion, or retain all factors with eigenvalues greater than, or equal to, one.27 An eigenvalue measures the amount of variation in all of the items on the survey which is accounted for by that factor. If a factor has a low eigenvalue (less than 1 is the convention), then it is contributing little and is ignored, as it is likely redundant with the higher value factors.
Because use of Kaiser criterion often overestimates the number of factors to retain, another method is to use a scree plot which tends to underestimate the factors. Both were used in this study to ensure a stable solution. To name the factors, we examined which items or group of items loaded or were most highly related to which factor. To ensure an optimal factor solution, items with minimal participation (less than 3%) were excluded from factor analysis.
Then, site‐adjusted multivariate regression analysis was used to examine associations between job and demographic characteristics, and the factors of unprofessional behavior identified. Models controlled for gender and familiarity with residents. Because sample medians were used to define greater teaching (>10% FTE), we also performed a sensitivity analysis using different cutoffs for teaching time (>20% FTE and teaching tertiles). Likewise, we also used varying definitions of less clinical time to ensure that any statistically significant associations were robust across varying definitions. All data were analyzed using STATA 11.0 (Stata Corp, College Station, TX) and statistical significance was defined as P < 0.05.
RESULTS
Seventy‐seven of the 101 hospitalists (76.2%) at 3 sites completed the survey. While response rates varied by site (site 1, 67%; site 2, 74%; site 3, 86%), the differences were not statistically significant (2 = 2.9, P = 0.24). Most hospitalists (79.2%) completed residency after 2000. Over half (57.1%) of participants were male, and over half (61%) reported having worked with their current hospitalist group from 1 to 4 years. Almost 60% (59.7%) reported being unfamiliar with residents in the program. Over 40% of hospitalists did not do any night work. Hospitalists were largely clinical, one‐quarter of hospitalists reported working over 50% FTE, and the median was 80% FTE. While 78% of hospitalists reported some teaching time, median time on teaching service was low at 10% (Table 1).
| Total n (%) | |
|---|---|
| |
| Male (%) | 44 (57.1) |
| Completed residency (%) | |
| Between 1981 and 1990 | 2 (2.6) |
| Between 1991 and 2000 | 14 (18.2) |
| After 2000 | 61 (79.2) |
| Medical school matriculation (%) (n = 76) | |
| US medical school | 59 (77.6) |
| International medical school | 17 (22.3) |
| Years spent with current hospitalist group (%) | |
| <1 yr | 14 (18.2) |
| 14 yr | 47 (61.0) |
| 59 yr | 15 (19.5) |
| >10 yr | 1 (1.3) |
| Familiarity with residents (%) | |
| Familiar | 31 (40.2) |
| Unfamiliar | 46 (59.7) |
| No. of weeks per year spent on (median IQR) | |
| Hospitalist practice (n = 72) | 26.0 [16.026.0] |
| Teaching services (n = 68) | 4.0 [1.08.0] |
| Weeks working nights* (n = 71) | |
| >2 wk | 16 (22.5) |
| 12 wk | 24 (33.8) |
| 0 wk | 31 (43.7) |
| % Clinical time (median IQR)* (n = 73) | 80 (5099) |
| % Teaching time (median IQR)* (n = 74) | 10 (120) |
| Any research time (%)* (n = 71) | 22 (31.0) |
| Any administrative time (%) (n = 72) | 29 (40.3) |
| Completed fellowship (%)* | 12 (15.6) |
| Won teaching awards (%)* (n = 76) | 21 (27.6) |
| View a career in hospital medicine as (%) | |
| Temporary | 11 (14.3) |
| Long term | 47 (61.0) |
| Unsure | 19 (24.7) |
Hospitalists perceived almost all behaviors as unprofessional (unprofessional or somewhat unprofessional on a 5‐point Likert Scale). The only behavior rated as professional with a mean of 4.25 (95% CI 4.014.49) was staying past shift limit to complete a patient‐care task that could have been signed out. This behavior also had the highest level of participation by hospitalists (81.7%). Hospitalists were most ambivalent when rating professionalism of attending an industry‐sponsored dinner or social event (mean 3.20, 95% CI 2.983.41) (Table 2).
| Behavior | Reported Perception (Mean Likert score)* | Reported Participation (%) | Reported Observation (%) |
|---|---|---|---|
| |||
| Having nonmedical/personal conversations in patient corridors (eg, discussing evening plans) | 2.55 (2.342.76) | 67.1 | 80.3 |
| Ordering a routine test as urgent to get it expedited | 2.82 (2.583.06) | 62.3 | 80.5 |
| Making fun of other physicians to colleagues | 1.56 (1.391.70) | 40.3 | 67.5 |
| Disparaging the ER team/outpatient doctor to others for findings later discovered on the floor (eg, after the patient is admitted) | 2.01 (1.842.19) | 39.5 | 67.1 |
| Signing out patients over the phone at the end of shift when sign‐out could have been done in person | 2.95 (2.743.16) | 40.8 | 65.8 |
| Texting or using smartphone during educational conferences (ie, noon lecture) | 2.16 (1.952.36) | 39.0 | 72.7 |
| Discussing patient information in public spaces | 1.49 (1.341.63) | 37.7 | 66.2 |
| Making fun of other attendings to colleagues | 1.62 (1.461.78) | 35.1 | 61.0 |
| Deferring family members' concerns about a change in the patient's clinical course to the primary team in order to avoid engaging in such a discussion | 2.16 (1.912.40) | 30.3 | 55.3 |
| Making disparaging comments about a patient on rounds | 1.42 (1.271.56) | 29.8 | 67.5 |
| Attending an industry (eg, pharmaceutical or equipment/device manufacturer)‐sponsored dinner or social event | 3.20 (2.983.41) | 28.6 | 60.5 |
| Ignoring family member's nonurgent questions about a cross‐cover patient when you had time to answer | 2.05 (1.852.25) | 26.3 | 48.7 |
| Attesting to a resident's note when not fully confident of the content of their documentation | 1.65 (1.451.85) | 23.4 | 32.5 |
| Making fun of support staff to colleagues | 1.45 (1.311.59) | 22.1 | 57.9 |
| Not correcting someone who mistakes a student for a physician | 2.19 (2.012.38) | 20.8 | 35.1 |
| Celebrating a blocked‐admission | 1.80 (1.612.00) | 21.1 | 60.5 |
| Making fun of residents to colleagues | 1.53 (1.371.70) | 18.2 | 44.2 |
| Coming to work when you have a significant illness (eg, influenza) | 1.99 (1.792.19) | 14.3 | 35.1 |
| Celebrating a successful turf | 1.71 (1.511.92) | 11.7 | 39.0 |
| Failing to notify the patient that a member of the team made, or is concerned that they made, an error | 1.53 (1.341.71) | 10.4 | 20.8 |
| Transferring a patient, who could be cared for on one's own service, to another service in order to reduce one's census (eg, turfing) | 1.72 (1.521.91) | 9.3 | 58.7 |
| Refusing an admission which could be considered appropriate for your service (eg, blocking) | 1.63 (1.441.82) | 7.9 | 68.4 |
| Falsifying patient records (ie, back‐dating a note, copying forward unverified information, or documenting physical findings not personally obtained) | 1.22 (1.101.34) | 6.5 | 27.3 |
| Making fun of students to colleagues | 1.35 (1.191.51) | 6.5 | 24.7 |
| Failing to notify patient‐safety or risk management that a member of the team made, or is concerned that they made, an error | 1.64 (1.461.82) | 5.2 | 13.2 |
| Introducing a student as a doctor to patients | 1.96 (1.762.16) | 3.9 | 20.8 |
| Signing‐out a procedure or task, that could have been completed during a required shift or by the primary team, in order to go home as early in the day as possible | 1.48 (1.321.64) | 3.9 | 48.1 |
| Performing medical or surgical procedures on a patient beyond self‐perceived level of skill | 1.27 (1.141.41) | 2.6 | 7.8 |
| Asking a student to obtain written consent from a patient or their proxy without supervision (eg, for blood transfusion or minor procedures) | 1.60 (1.421.78) | 2.63 | 6.5 |
| Encouraging a student to state that they are a doctor in order to expedite patient care | 1.31 (1.151.47) | 2.6 | 6.5 |
| Discharging a patient before they are ready to go home in order to reduce one's census | 1.18 (1.071.29) | 2.6 | 19.5 |
| Reporting patient information (eg, labs, test results, exam results) as normal when uncertain of the true results | 1.29 (1.161.41) | 2.6 | 15.6 |
| Asking a student to perform medical or surgical procedures which are perceived to be beyond their level of skill | 1.26 (1.121.40) | 1.3 | 3.9 |
| Asking a student to discuss, with patients, medical or surgical information which is perceived to be beyond their level of knowledge | 1.41 (1.261.56) | 0.0 | 15.8 |
Participation in egregious behaviors, such as falsifying patient records (6.49%) and performing medical or surgical procedures on a patient beyond self‐perceived level of skill (2.60%), was very low. The most common behaviors rated as unprofessional that hospitalists reported participating in were having nonmedical/personal conversations in patient corridors (67.1%), ordering a routine test as urgent to expedite care (62.3%), and making fun of other physicians to colleagues (40.3%). Forty percent of participants reported disparaging the emergency room (ER) team or primary care physician for findings later discovered, signing out over the phone when it could have been done in person, and texting or using smartphones during educational conferences. In particular, participation in unprofessional behaviors related to trainees was close to zero (eg, asking a student to discuss, with patients, medical or surgical information which is perceived to be beyond their level of knowledge). The least common behaviors that hospitalists reported participating in were discharging a patient before they are ready to go home in order to reduce one's census (2.56%) and reporting patient information as normal when uncertain of the true results (2.60%). Like previous studies of unprofessional behaviors, those that reported participation were less likely to report the behavior as unprofessional.8, 19
Observation of behaviors ranged from 4% to 80%. In all cases, observation of the behavior was reported at a higher level than participation. Correlation between observation and participation was also high, with the exception of a few behaviors that had zero or near zero participation rates (ie, reporting patient information as normal when unsure of true results.)
After performing factor analysis, 4 factors had eigenvalues greater than 1 and were therefore retained and extracted for further analysis. These 4 factors accounted for 76% of the variance in responses reported on the survey. By examining which items or groups of items most strongly loaded on each factor, the factors were named accordingly: factor 1 referred to behaviors related to making fun of others, factor 2 referred to workload management, factor 3 referred to behaviors related to the learning environment, and factor 4 referred to behaviors related to time pressure (Table 3).
|
| Factor 1: Making fun of others |
| Making fun of other physicians (0.78) |
| Making fun of attendings (0.77) |
| Making fun of residents (0.70) |
| Making disparaging comments about a patient on rounds (0.51) |
| Factor 2: Workload management |
| Celebrating a successful turf (0.81) |
| Celebrating a blocked‐admission (0.65) |
| Coming to work sick (0.56) |
| Transferring a patient, who could be cared for on one's own service, to another service in order to reduce one's census (eg, turfing.) (0.51) |
| Disparaging the ER team/outpatient doctor to others for findings later discovered on the floor (0.48) |
| Discharging a patient before they are ready to go home in order to reduce one's census (0.43) |
| Factor 3: Learning environment |
| Not correcting someone who mistakes a student for a physician (0.72) |
| Texting or using smartphone during educational conferences (ie, noon lecture) (0.51) |
| Failing to notify patient‐safety or risk management that a member of the team made, or is concerned that they made, an error (0.45) |
| Having nonmedical/personal conversations in patient corridors (eg, discussing evening plans) (0.43) |
| Factor 4: Time pressure |
| Ignoring family member's nonurgent questions about a cross‐cover patient when you had the time to answer (0.50) |
| Signing out patients over the phone at the end of shift when sign‐out could have been done in person (0.46) |
| Attesting to a resident's note when not fully confident of the content of their documentation (0.44) |
Using site‐adjusted multivariate regression, certain hospitalist job characteristics were associated with certain patterns of participating in unprofessional behavior (Table 4). Those with less clinical time (<50% FTE) were more likely to participate in unprofessional behaviors related to making fun of others (factor 1, value = 0.94, 95% CI 0.32 to 1.56, P value <0.05). Hospitalists who had any administrative time ( value = 0.61, 95% CI 0.111.10, P value <0.05) were more likely to report participation in behaviors related to workload management. Hospitalists engaged in any night work were more likely to report participation in unprofessional behaviors related to time pressure ( value = 0.67, 95% CI 0.171.17, P value <0.05). Time devoted to teaching or research was not associated with greater participation in any of the domains of unprofessional behavior surveyed.
| Model | Making Fun of Others | Learning Environment | Workload Management | Time Pressure |
|---|---|---|---|---|
| Predictor | Beta [95% CI] | Beta [95% CI] | Beta [95% CI] | Beta [95% CI] |
| ||||
| Job characteristics | ||||
| Less clinical | 0.94 [0.32, 1.56]* | 0.01 [0.66, 0.64] | 0.17 [0.84, 0.49] | 0.39 [0.24, 1.01] |
| Administrative | 0.30 [0.16, 0.76] | 0.06 [0.43, 0.54] | 0.61 [0.11, 1.10]* | 0.26 [0.20, 0.72] |
| Teaching | 0.01 [0.49, 0.48] | 0.09 [0.60, 0.42] | 0.12 [0.64, 0.40] | 0.16 [0.33, 0.65] |
| Research | 0.30 [0.87, 0.27] | 0.38 [0.98, 0.22] | 0.37 [0.98, 0.24] | 0.13 [0.45, 0.71] |
| Any nights | 0.08 [0.58, 0.42] | 0.24 [0.28, 0.77] | 0.24 [0.29, 0.76] | 0.67 [0.17,1.17]* |
| Demographic characteristics | ||||
| Male | 0.06 [0.42, 0.53] | 0.03 [0.47, 0.53] | 0.05 [0.56, 0.47] | 0.40 [0.89, 0.08] |
| Younger∥ | 0.05 [0.79, 0.69] | 0.64 [1.42, 0.14] | 0.87 [0.07, 1.67]* | 0.62 [0.13, 1.37] |
| Unfamiliar with residents | 0.32 [0.85, 0.22] | 0.32 [0.89, 0.24] | 0.13 [0.45, 0.70] | 0.47 [0.08, 1.01] |
| Institution | ||||
| Site 1 | 0.58 [0.22, 1.38] | 0.05 [0.89, 0.79] | 1.01 [0.15, 1.86]* | 0.77 [1.57, 0.04] |
| Site 3 | 0.11 [0.68, 0.47] | 0.70 [1.31, 0.09]* | 0.43 [0.20, 1.05] | 0.45 [0.13, 1.04] |
| Constant | 0.03 [0.99, 1.06] | 0.94 [0.14, 2.02] | 1.23[2.34, 0.13]* | 1.34[2.39, 0.31]* |
The only demographic characteristic that was significantly associated with unprofessional behavior was age. Specifically, those who were born after 1970 were more likely to participate in unprofessional behaviors related to workload management ( value = 0.87, 95% CI 0.071.67, P value <0.05). Site differences were also present. Specifically, one site was more likely to report participation in unprofessional behaviors related to workload management ( value site 1 = 1.01, 95% CI 0.15 to 1.86, P value <0.05), while another site was less likely to report participation in behaviors related to the learning environment ( value site 3 = 0.70, 95% CI 1.31 to 0.09, P value <0.05). Gender and familiarity with residents were not significant predictors of participation in unprofessional behaviors. Results remained robust in sensitivity analyses using different cutoffs of clinical time and teaching time.
DISCUSSION
This multisite study adds to what is known about the perceptions of, and participation in, unprofessional behaviors among internal medicine hospitalists. Hospitalists perceived almost all surveyed behaviors as unprofessional. Participation in egregious and trainee‐related unprofessional behaviors was very low. Four categories appeared to explain the variability in how hospitalists reported participation in unprofessional behaviors: making fun of others, workload management, learning environment, and time pressure. Participation in behaviors within these factors was associated with certain job characteristics, such as clinical time, administrative time, and night work, as well as age and site.
It is reassuring that participation in, and trainee‐related, unprofessional behaviors is very low, and it is noteworthy that attending an industry‐sponsored dinner is not considered unprofessional. This was surprising in the setting of increased external pressures to report and ban such interactions.28 Perception that attending such dinners is acceptable may reflect a lag between current practice and national recommendations.
It is important to explore why certain job characteristics are associated with participation in unprofessional behaviors. For example, those with less clinical time were more likely to participate in making fun of others. It may be the case that hospitalists with more clinical time may make a larger effort to develop and maintain positive relationships. Another possible explanation is that hospitalists with less clinical time are more easily influenced by those in the learning environment who make fun of others, such as residents who they are supervising for only a brief period.
For unprofessional behaviors related to workload management, those who were younger, and those with any administrative time, were more likely to participate in behaviors such as celebrating a blocked‐admission. Our prior work shows that behaviors related to workload management are more widespread in residency, and therefore younger hospitalists, who are often recent residency graduates, may be more prone to participating in these behaviors. While unproven, it is possible that those with more administrative time may have competing priorities with their administrative roles, which motivate them to more actively manage their workload, leading them to participate in workload management behaviors.
Hospitalists who did any night work were more likely to participate in unprofessional behaviors related to time pressure. This could reflect the high workloads that night hospitalists may face and the pressure they feel to wrap up work, resulting in a hasty handoff (ie, over the phone) or to defer work (ie, family questions). Site differences were also observed for participation in behaviors related to the learning environment, speaking to the importance of institutional culture.
It is worth mentioning that hospitalists who were teachers were not any less likely to report participating in certain behaviors. While 78% of hospitalists reported some level of teaching, the median reported percentage of teaching was 10% FTE. This level of teaching likely reflects the diverse nature of work in which hospitalists engage. While hospitalists spend some time working with trainees, services that are not staffed with residents (eg, uncovered services) are becoming increasingly common due to stricter resident duty hour restrictions. This may explain why 60% of hospitalists reported being unfamiliar with residents. We also used a high bar for familiarity, which we defined as knowing half of residents by name, and served as a proxy for those who may have trained at the institution where they currently work. In spite of hospitalists reporting a low fraction of their total clinical time devoted to resident services, a significant fraction of resident services were staffed by hospitalists at all sites, making them a natural target for interventions.
These results have implications for future work to assess and improve professionalism in the hospital learning environment. First, interventions to address unprofessional behaviors should focus on behaviors with the highest participation rates. Like our earlier studies of residents, participation is high in certain behaviors, such as misrepresenting a test as urgent, or disparaging the ER or primary care physician (PCP) for a missed finding.19, 20 While blocking an admission was common in our studies of residents, reported participation among hospitalists was low. Similar to a prior study of clinical year medical students at one of our sites, 1 in 5 hospitalists reported not correcting someone who mistakes a student for a physician, highlighting the role that hospitalists may have in perpetuating this behavior.8 Additionally, addressing the behaviors identified in this study, through novel curricular tools, may help to teach residents many of the interpersonal and communication skills called for in the 2011 ACGME Common Program Requirements.11 The ACGME requirements also include the expectation that faculty model how to manage their time before, during, and after clinical assignments, and recognize that transferring a patient to a rested provider is best. Given that most hospitalists believe staying past shift limit is professional, these requirements will be difficult to adopt without widespread culture change.
Moreover, interventions could be tailored to hospitalists with certain job characteristics. Interventions may be educational or systems based. An example of the former is stressing the impact of the learning and working environment on trainees, and an example of the latter is streamlining the process in which ordered tests are executed to result in a more timely completion of tests. This may result in fewer physicians misrepresenting a test as urgent in order to have the test done in a timely manner. Additionally, hospitalists with less clinical time could receive education on their impact as a role model for trainees. Hospitalists who are younger or with administrative commitments could be trained on the importance of avoiding behaviors related to workload management, such as blocking or turfing patients. Lastly, given the site differences, critical examination of institutional culture and policies is also important. With funding from the American Board of Internal Medicine (ABIM) Foundation, we are currently creating an educational intervention, targeting those behaviors that were most frequent among hospitalists and residents at our institutions to promote dialogue and critical reflection, with the hope of reducing the most prevalent behaviors encountered.
There are several limitations to this study. Despite the anonymity of the survey, participants may have inaccurately reported their participation in unprofessional behaviors due to socially desirable response. In addition, because we used factor analysis and multivariate regression models with a small sample size, item nonresponse limited the sample for regression analyses and raises the concern for response bias. However, all significant associations remained so after performing backwards stepwise elimination of covariates that were P > 0.10 in models that were larger (ranging from 65 to 69). Because we used self‐report and not direct observation of participation in unprofessional behaviors, it is not possible to validate the responses given. Future work could rely on the use of 360 degree evaluations or other methods to validate responses given by self‐report. It is also important to consider assessing whether these behaviors are associated with actual patient outcomes, such as length of stay or readmission. Some items may not always be unprofessional. For example, texting during an educational conference might be to advance care, which would not necessarily be unprofessional. The order in which the questions were asked could have led to bias. We asked about participation before perception to try to limit bias reporting in participation. Changing the order of these questions would potentially have resulted in under‐reporting participation in behaviors that one perceived to be unprofessional. This study was conducted at 3 institutions located in Chicago, limiting generalizability to institutions outside of this area. Only internal medicine hospitalists were surveyed, which also limits generalizability to other disciplines and specialties within internal medicine. Lastly, it is important to highlight that hospitalists are not the sole teachers on inpatient services, since residents encounter a variety of faculty who serve as teaching attendings. Future work should expand to other centers and other specialties.
In conclusion, in this multi‐institutional study of hospitalists, participation in egregious behaviors was low. Four factors or patterns underlie hospitalists' reports of participation in unprofessional behavior: making fun of others, learning environment, workload management, and time pressure. Job characteristics (clinical time, administrative time, night work), age, and site were all associated with different patterns of unprofessional behavior. Specifically, hospitalists with less clinical time were more likely to make fun of others. Hospitalists who were younger in age, as well as those who had any administrative work, were more likely to participate in behaviors related to workload management. Hospitalists who work nights were more likely to report behaviors related to time pressure. Interventions to promote professionalism should take institutional culture into account and should focus on behaviors with the highest participation rates. Efforts should also be made to address underlying reasons for participation in these behaviors.
Acknowledgements
The authors thank Meryl Prochaska for her research assistance and manuscript preparation.
Disclosures: The authors acknowledge funding from the ABIM Foundation and the Pritzker Summer Research Program. The funders had no role in the design of the study; the collection, analysis, and interpretation of the data; or the decision to approve publication of the finished manuscript. Prior presentations of the data include the 2010 University of Chicago Pritzker School of Medicine Summer Research Forum, the 2010 University of Chicago Pritzker School of Medicine Medical Education Day, the 2010 Midwest Society of Hospital Medicine Meeting in Chicago, IL, and the 2011 Society of Hospital Medicine National Meeting in Dallas, TX. All authors disclose no relevant or financial conflicts of interest.
- .Practicing what we preach? An analysis of the curriculum of values in medical education.Am J Med.1998;104:569–575.
- ,,.Medical professionalism: conflicting values for tomorrow's doctors.J Gen Intern Med.2010;25(12):1330–1336.
- ,,,,.Medical students' professionalism narratives: a window on the informal and hidden curriculum.Acad Med.2010;85(1):124–133.
- ,,,,,.Interpreting values conflicts experienced by obstetrics‐gynecology clerkship students using reflective writing.Acad Med.2009;84(5):587–596.
- .The teaching of professionalism during residency: why it is failing and a suggestion to improve its success.Anesth Analg.2009;108(3):948–954.
- ,.What we don't know we are teaching: unveiling the hidden curriculum.Clin Orthop Relat Res.2006;449:20–27.
- .Definitions of professionalism: a search for meaning and identity.Clin Orthop Relat Res.2006;449:193–204.
- ,,, et al.Third‐year medical students' participation in and perceptions of unprofessional behaviors.Acad Med.2007;82:S35–S39.
- .Beyond curriculum reform: confronting medicine's hidden curriculum.Acad Med.1998;73:403–407.
- .Physicians' “disruptive” behavior: consequences for medical quality and safety.Am J Med Qual.2008;23:165–167.
- Accreditation Council for Graduate Medical Education. Common Program Requirements: General Competencies. Available at: http://www.acgme.org/acwebsite/home/common_program_requirements_07012011.pdf. Accessed December 19,2011.
- Liaison Committee on Medical Education. Functions and Structure of a Medical School. Available at: http://www.lcme.org/functions2010jun.pdf.. Accessed June 30,2010.
- ,,,,.Residents' perceptions of their own professionalism and the professionalism of their learning environment.J Grad Med Educ.2009;1:208–215.
- ,,,.Unprofessional behavior in medical school is associated with subsequent disciplinary action by a state medical board.Acad Med.2004;79:244–249.
- ,,, et al.Disciplinary action by medical boards and prior behavior in medical school.N Engl J Med.2005;353:2673–2682.
- ,.A survey of the impact of disruptive behaviors and communication defects on patient safety.Jt Comm J Qual Patient Saf.2008;34:464–471.
- ,.Managing disruptive physician behavior—impact on staff relationships and patient care.Neurology.2008;70:1564–1570.
- The Joint Commission.Behaviors that undermine a culture of safety. Sentinel Event Alert.2008. Available at: http://www.jointcommission.org/assets/1/18/SEA_40.PDF. Accessed April 28, 2012.
- ,,,,.Participation in and perceptions of unprofessional behaviors among incoming internal medicine interns.JAMA.2008;300:1132–1134.
- ,,, et al.Changes in perception of and participation in unprofessional behaviors during internship.Acad Med.2010;85:S76–S80.
- .Reflections: the hospitalist movement a decade later.J Hosp Med.2006;1:248–252.
- Society of Hospital Medicine, 2007–2008 Bi‐Annual Survey.2008. Available at: http://www.medscape.org/viewarticle/578134. Accessed April 28, 2012.
- ,,, et al.Reforming internal medicine residency training. A report from the Society of General Internal Medicine's Task Force for Residency Reform.J Gen Intern Med.2005;20:1165–1172.
- Society of Hospital Medicine.The Core Competencies in Hospital Medicine: a framework for curriculum development by the Society of Hospital Medicine.J Hosp Med.2006;1(suppl 1):2–5.
- ,,.Can patients tell when they are unwanted? “Turfing” in residency training.Patient Educ Couns.2005;56:104–111.
- ,.Best practices in exploratory factor analysis: four recommendations for getting the most from your analysis.Pract Assess Res Eval.2005;10:1–9.
- Principal Components and Factor Analysis. StatSoft Electronic Statistics Textbook. Available at: http://www.statsoft.com/textbook/principal‐components‐factor‐analysis/. Accessed December 30,2011.
- ,,, et al.Health industry practices that create conflicts of interest: a policy proposal for academic medical centers.JAMA.2006;295(4):429–433.
- .Practicing what we preach? An analysis of the curriculum of values in medical education.Am J Med.1998;104:569–575.
- ,,.Medical professionalism: conflicting values for tomorrow's doctors.J Gen Intern Med.2010;25(12):1330–1336.
- ,,,,.Medical students' professionalism narratives: a window on the informal and hidden curriculum.Acad Med.2010;85(1):124–133.
- ,,,,,.Interpreting values conflicts experienced by obstetrics‐gynecology clerkship students using reflective writing.Acad Med.2009;84(5):587–596.
- .The teaching of professionalism during residency: why it is failing and a suggestion to improve its success.Anesth Analg.2009;108(3):948–954.
- ,.What we don't know we are teaching: unveiling the hidden curriculum.Clin Orthop Relat Res.2006;449:20–27.
- .Definitions of professionalism: a search for meaning and identity.Clin Orthop Relat Res.2006;449:193–204.
- ,,, et al.Third‐year medical students' participation in and perceptions of unprofessional behaviors.Acad Med.2007;82:S35–S39.
- .Beyond curriculum reform: confronting medicine's hidden curriculum.Acad Med.1998;73:403–407.
- .Physicians' “disruptive” behavior: consequences for medical quality and safety.Am J Med Qual.2008;23:165–167.
- Accreditation Council for Graduate Medical Education. Common Program Requirements: General Competencies. Available at: http://www.acgme.org/acwebsite/home/common_program_requirements_07012011.pdf. Accessed December 19,2011.
- Liaison Committee on Medical Education. Functions and Structure of a Medical School. Available at: http://www.lcme.org/functions2010jun.pdf.. Accessed June 30,2010.
- ,,,,.Residents' perceptions of their own professionalism and the professionalism of their learning environment.J Grad Med Educ.2009;1:208–215.
- ,,,.Unprofessional behavior in medical school is associated with subsequent disciplinary action by a state medical board.Acad Med.2004;79:244–249.
- ,,, et al.Disciplinary action by medical boards and prior behavior in medical school.N Engl J Med.2005;353:2673–2682.
- ,.A survey of the impact of disruptive behaviors and communication defects on patient safety.Jt Comm J Qual Patient Saf.2008;34:464–471.
- ,.Managing disruptive physician behavior—impact on staff relationships and patient care.Neurology.2008;70:1564–1570.
- The Joint Commission.Behaviors that undermine a culture of safety. Sentinel Event Alert.2008. Available at: http://www.jointcommission.org/assets/1/18/SEA_40.PDF. Accessed April 28, 2012.
- ,,,,.Participation in and perceptions of unprofessional behaviors among incoming internal medicine interns.JAMA.2008;300:1132–1134.
- ,,, et al.Changes in perception of and participation in unprofessional behaviors during internship.Acad Med.2010;85:S76–S80.
- .Reflections: the hospitalist movement a decade later.J Hosp Med.2006;1:248–252.
- Society of Hospital Medicine, 2007–2008 Bi‐Annual Survey.2008. Available at: http://www.medscape.org/viewarticle/578134. Accessed April 28, 2012.
- ,,, et al.Reforming internal medicine residency training. A report from the Society of General Internal Medicine's Task Force for Residency Reform.J Gen Intern Med.2005;20:1165–1172.
- Society of Hospital Medicine.The Core Competencies in Hospital Medicine: a framework for curriculum development by the Society of Hospital Medicine.J Hosp Med.2006;1(suppl 1):2–5.
- ,,.Can patients tell when they are unwanted? “Turfing” in residency training.Patient Educ Couns.2005;56:104–111.
- ,.Best practices in exploratory factor analysis: four recommendations for getting the most from your analysis.Pract Assess Res Eval.2005;10:1–9.
- Principal Components and Factor Analysis. StatSoft Electronic Statistics Textbook. Available at: http://www.statsoft.com/textbook/principal‐components‐factor‐analysis/. Accessed December 30,2011.
- ,,, et al.Health industry practices that create conflicts of interest: a policy proposal for academic medical centers.JAMA.2006;295(4):429–433.
Copyright © 2012 Society of Hospital Medicine