User login
Mentoring at a Community Hospital
The literature focusing on physician mentoring is limited principally to programs at academic medical centers.[1, 2, 3, 4, 5] Traditionally, physicians at academic medical centers who are engaged in research have one or more such advisors. However, many clinical faculties are not engaged in research. Further, little has been written about mentoring initiatives among physicians in full‐time clinical practice.[6] Such initiatives have been suggested as one way of reducing physician stress and improving professional satisfaction, issues of great concern among practicing physicians, particularly hospitalists and primary care physicians.[7]
A mentoring program was initiated at the Western Connecticut Health Network (WCHN) in January 2012. WCHN is a healthcare system comprised of the Danbury and New Milford Hospitals, with 371 licensed beds and a network of salaried primary care and specialty physicians. At Danbury, residency programs are in place in all specialties, and medical students from the University of Vermont rotate through the major clinical specialties.
This article describes the mentoring program at WCHN and gives a preliminary assessment of its value based on a survey of the participants after the first year of the program.
PROGRAM DESCRIPTION
Although the mentoring program was offered to all physicians of the WCHN, the principal groups of interest were the salaried primary care physicians (n=46) and the hospitalists (n=24). The program is a formal system of mentorship and career support, whose goal is to maximize the potential and career satisfaction of each member of the medical staff.
Eight senior physicians from the Departments of Medicine and Surgery served as mentors in their free time. They were selected based on their high regard as members of the medical staff who reflected the attributes of satisfactory mentorsgood listeners who are supportive, nonjudgmental, practical, and enthusiastic.[8] They received informal training through meetings with the program consultant (corresponding author) who had previously established mentoring programs at Massachusetts General Hospital, Boston, Massachusetts and the University of Rochester Medical Center, Rochester, New York.
Mentees were principally hospitalists and primary care physicians in full‐time clinical practice. Practice experiences varied from 2 or 3 to 20 years or more. All hospitalists and some primary care physicians were engaged in teaching residents and/or medical students. Mentees were asked to complete a 1‐page form indicating their goals for the coming year, what issues they would like to discuss with a mentor, and which mentor they wish to meet with. The sessions were scheduled during free time of both mentor and mentee, held in a quiet setting, were confidential, and lasted an hour or more. At the end of each session, mentee and mentor agreed on what was discussed and what next steps each had responsibility for. The mentor subsequently wrote up a summary of the meeting and reviewed it with the mentee for accuracy. Ongoing contacts were in person, phone, or e‐mail initiated either by the mentor or the mentee. Examples of next steps included helping a mentee obtain further training, observe and comment on the mentee's teaching skills, sponsor the mentee for advancement to fellowship in his/her specialty society, or assist the mentee in the preparation of an article for publication. Frequency of meetings varied from a single session on a self‐limited issue to multiple sessions throughout the year.
At the end of the first year of the program, the participants were surveyed by e‐mail about their perceptions of the program. The survey was a structured instrument asking them to indicate what the principal issue or issues were that led them to seek a mentor, whether they felt the mentoring program had been helpful, if so in what way, and if not why not.
SURVEY RESULTS
Twenty‐seven of the 39 participants responded to the survey (69%). Hospitalists were the most likely to participate in the mentoring program (18 of 24) and to respond to the survey. Career planning (52%), balance among personal and professional life (43%), and leadership development (38%) were the most common reasons given for meeting with a mentor. Twenty percent of mentees had no agenda. They simply wanted to talk. Fifteen percent had a specific project in mind about which they needed advice and counsel. All but one survey respondent felt the mentoring program met their expectations by setting goals (62%), planning next steps in their career (60%), gaining new insights (52%), completing a long‐deferred goal (30%), reducing stress (19%), and improving self‐confidence (19%).
Without exception, mentees indicated that their mentors met the criteria used to define a good mentor.[8]
DISCUSSION
One marker of the program's success is that all but 1 of the respondents felt the mentoring sessions met their expectations. Planning next career steps was a principle interest among the hospitalist group. This is not surprising given that many hospitalists are recent graduates of training programs, and their long‐term career plans may not be well defined. The mentoring program helped 3 hospitalists obtain fellowship training. About 1 in 5 mentees indicated that a reduction in stress was an outcome of their mentoring sessions. Recent studies of physician burnout have shown that physicians of first contact are at greatest risk of burnout.[9] Two‐thirds of the physicians participating in the mentoring program fell into this category. In a recent survey of physicians from all specialties across the country, mentoring was suggested as 1 of a number of strategies that organizations could provide to reduce stress and burnout.[7]
Important lessons learned over the first year of the program were that (1) mentees should have protected time to participate; (2) mentor and mentee should be in touch no less often than every 3 to 6 months, even if there is not an ongoing issue they are working on; and (3) substantive improvements in the program resulted from frequent (eg, every 2 months) meetings of the mentors.
In conclusion, although the survey sample in our study was small, the findings suggest directions and strategies for similar hospitals and health systems. Health systems that seek to improve the professional satisfaction of their physicians should be interested in this description of the physician mentoring program at the WCHN and its perceived value by the participants.
Disclosures
Disclosures: Dr. Griner received a consulting fee from the Western Connecticut Health System for his role in developing the mentoring program and participating in the writing of the article. The authors report no conflicts of interest.
- . . . . Support‐challenge‐vision: a model for faculty mentoring. Med Teach. 1998;20:595–597.
- , , , . A descriptive cross‐sectional study of formal mentoring for faculty. Fam Med. 1996;28:434–438.
- Advisor, teacher, role model, friend: on being a mentor to students in science and engineering. Washington, DC: National Academy Press; 1997. Available at: http://www.nap.edu/readingroom/books/mentor. Accessed 5/13/2013.
- , , , . Helping medical school faculty realize their dreams: an innovative, collaborative, mentoring program. Acad Med. 2002;77:377–384.
- , , , . A needs assessment of medical school faculty: caring for the caretakers. J Contin Educ Health Prof. 2003;23:21–29.
- , . Personal and rofessional learning plans—an evaluation of mentoring in general practice. Educ Gen Pract. 1998;9:261–263.
- . Burnout in health care providers. Integr Med. 2013;12:22–24.
- , , . Defining the ideal qualities of mentorship. Am J Med. 2011;124:453–458.
- , , , et al. Burnout and satisfaction with work‐life balance among US physicians relative to the general US population. Arch Intern Med. 2012;172:1377–1385.
The literature focusing on physician mentoring is limited principally to programs at academic medical centers.[1, 2, 3, 4, 5] Traditionally, physicians at academic medical centers who are engaged in research have one or more such advisors. However, many clinical faculties are not engaged in research. Further, little has been written about mentoring initiatives among physicians in full‐time clinical practice.[6] Such initiatives have been suggested as one way of reducing physician stress and improving professional satisfaction, issues of great concern among practicing physicians, particularly hospitalists and primary care physicians.[7]
A mentoring program was initiated at the Western Connecticut Health Network (WCHN) in January 2012. WCHN is a healthcare system comprised of the Danbury and New Milford Hospitals, with 371 licensed beds and a network of salaried primary care and specialty physicians. At Danbury, residency programs are in place in all specialties, and medical students from the University of Vermont rotate through the major clinical specialties.
This article describes the mentoring program at WCHN and gives a preliminary assessment of its value based on a survey of the participants after the first year of the program.
PROGRAM DESCRIPTION
Although the mentoring program was offered to all physicians of the WCHN, the principal groups of interest were the salaried primary care physicians (n=46) and the hospitalists (n=24). The program is a formal system of mentorship and career support, whose goal is to maximize the potential and career satisfaction of each member of the medical staff.
Eight senior physicians from the Departments of Medicine and Surgery served as mentors in their free time. They were selected based on their high regard as members of the medical staff who reflected the attributes of satisfactory mentorsgood listeners who are supportive, nonjudgmental, practical, and enthusiastic.[8] They received informal training through meetings with the program consultant (corresponding author) who had previously established mentoring programs at Massachusetts General Hospital, Boston, Massachusetts and the University of Rochester Medical Center, Rochester, New York.
Mentees were principally hospitalists and primary care physicians in full‐time clinical practice. Practice experiences varied from 2 or 3 to 20 years or more. All hospitalists and some primary care physicians were engaged in teaching residents and/or medical students. Mentees were asked to complete a 1‐page form indicating their goals for the coming year, what issues they would like to discuss with a mentor, and which mentor they wish to meet with. The sessions were scheduled during free time of both mentor and mentee, held in a quiet setting, were confidential, and lasted an hour or more. At the end of each session, mentee and mentor agreed on what was discussed and what next steps each had responsibility for. The mentor subsequently wrote up a summary of the meeting and reviewed it with the mentee for accuracy. Ongoing contacts were in person, phone, or e‐mail initiated either by the mentor or the mentee. Examples of next steps included helping a mentee obtain further training, observe and comment on the mentee's teaching skills, sponsor the mentee for advancement to fellowship in his/her specialty society, or assist the mentee in the preparation of an article for publication. Frequency of meetings varied from a single session on a self‐limited issue to multiple sessions throughout the year.
At the end of the first year of the program, the participants were surveyed by e‐mail about their perceptions of the program. The survey was a structured instrument asking them to indicate what the principal issue or issues were that led them to seek a mentor, whether they felt the mentoring program had been helpful, if so in what way, and if not why not.
SURVEY RESULTS
Twenty‐seven of the 39 participants responded to the survey (69%). Hospitalists were the most likely to participate in the mentoring program (18 of 24) and to respond to the survey. Career planning (52%), balance among personal and professional life (43%), and leadership development (38%) were the most common reasons given for meeting with a mentor. Twenty percent of mentees had no agenda. They simply wanted to talk. Fifteen percent had a specific project in mind about which they needed advice and counsel. All but one survey respondent felt the mentoring program met their expectations by setting goals (62%), planning next steps in their career (60%), gaining new insights (52%), completing a long‐deferred goal (30%), reducing stress (19%), and improving self‐confidence (19%).
Without exception, mentees indicated that their mentors met the criteria used to define a good mentor.[8]
DISCUSSION
One marker of the program's success is that all but 1 of the respondents felt the mentoring sessions met their expectations. Planning next career steps was a principle interest among the hospitalist group. This is not surprising given that many hospitalists are recent graduates of training programs, and their long‐term career plans may not be well defined. The mentoring program helped 3 hospitalists obtain fellowship training. About 1 in 5 mentees indicated that a reduction in stress was an outcome of their mentoring sessions. Recent studies of physician burnout have shown that physicians of first contact are at greatest risk of burnout.[9] Two‐thirds of the physicians participating in the mentoring program fell into this category. In a recent survey of physicians from all specialties across the country, mentoring was suggested as 1 of a number of strategies that organizations could provide to reduce stress and burnout.[7]
Important lessons learned over the first year of the program were that (1) mentees should have protected time to participate; (2) mentor and mentee should be in touch no less often than every 3 to 6 months, even if there is not an ongoing issue they are working on; and (3) substantive improvements in the program resulted from frequent (eg, every 2 months) meetings of the mentors.
In conclusion, although the survey sample in our study was small, the findings suggest directions and strategies for similar hospitals and health systems. Health systems that seek to improve the professional satisfaction of their physicians should be interested in this description of the physician mentoring program at the WCHN and its perceived value by the participants.
Disclosures
Disclosures: Dr. Griner received a consulting fee from the Western Connecticut Health System for his role in developing the mentoring program and participating in the writing of the article. The authors report no conflicts of interest.
- . . . . Support‐challenge‐vision: a model for faculty mentoring. Med Teach. 1998;20:595–597.
- , , , . A descriptive cross‐sectional study of formal mentoring for faculty. Fam Med. 1996;28:434–438.
- Advisor, teacher, role model, friend: on being a mentor to students in science and engineering. Washington, DC: National Academy Press; 1997. Available at: http://www.nap.edu/readingroom/books/mentor. Accessed 5/13/2013.
- , , , . Helping medical school faculty realize their dreams: an innovative, collaborative, mentoring program. Acad Med. 2002;77:377–384.
- , , , . A needs assessment of medical school faculty: caring for the caretakers. J Contin Educ Health Prof. 2003;23:21–29.
- , . Personal and rofessional learning plans—an evaluation of mentoring in general practice. Educ Gen Pract. 1998;9:261–263.
- . Burnout in health care providers. Integr Med. 2013;12:22–24.
- , , . Defining the ideal qualities of mentorship. Am J Med. 2011;124:453–458.
- , , , et al. Burnout and satisfaction with work‐life balance among US physicians relative to the general US population. Arch Intern Med. 2012;172:1377–1385.
Hospitalist Sign‐out
Hospital medicine is a main component of healthcare in the United States and is growing.[1] In 1995, 9% of inpatient care performed by general internists to Medicare patients was provided by hospitalists; by 2006, this had increased to 37%.[2] The estimated 30,000 practicing hospitalists account for 19% of all practicing general internists[2, 3, 4] and have had a major impact on the treatment of inpatients at US hospitals.[5] Other specialties are adopting the hospital‐based physician model.[6, 7] The hospitalist model does have unique challenges. One notable aspect of hospitalist care, which is frequently shift based, is the transfer of care among providers at shift change.
The Society of Hospital Medicine recognizes patient handoffs/sign‐outs as a core competency for hospitalists,[8] but there is little literature evaluating hospitalist sign‐out quality.[9] A systematic review in 2009 found no studies of hospitalist handoffs.[8] Furthermore, early work suggests that hospitalist handoffs are not consistently effective.[10] In a recent survey, 13% of hospitalists reported they had received an incomplete handoff, and 16% of hospitalists reported at least 1 near‐miss attributed to incomplete communication.[11] Last, hospitalists perform no better than housestaff on evaluations of sign‐out quality.[12]
Cross‐coverage situations, in which sign‐out is key, have been shown to place patients at risk.[13, 14] One study showed 7.1 problems related to sign‐out per 100 patient‐days.[15] Failure during sign‐out can ultimately threaten patient safety.[16] Therefore, evaluating the quality of hospitalist sign‐outs by assessing how well the sign‐out prepares the night team for overnight events is necessary to improve hospitalist sign‐outs and ultimately increase patient safety.
METHODS
Study Setting
The study took place at YaleNew Haven Hospital (YNHH), the primary teaching affiliate for the Yale School of Medicine, in New Haven, Connecticut. YNHH is a 966‐bed, urban, academic medical center. The Hospitalist Service is a nonteaching service composed of 56.1 full‐time‐equivalent (FTE) attending physicians and 26.8 FTE midlevel providers. In fiscal year 2012, the YNHH Hospitalist Service cared for 13,764 discharges, or approximately 70% of general medical discharges. Similar patients are cared for by both hospitalists and housestaff. Patients on the hospitalist service are assigned an attending physician as well as a midlevel provider during the daytime. Between the departure of the day team and the arrival of the night team, typically a 2‐hour window, a skeleton crew covers the entire service and admits patients. The same skeleton crew coverage plan exists in the approximately 2.5‐hour morning gap between the departure of the night team and arrival of the day team. Overnight, care is generally provided by attending hospitalist physicians alone. Clinical fellows and internal medicine residents occasionally fill the night hospitalist role.
Sign‐out Procedure
The YNHH Hospitalist Service uses a written sign‐out[17] created via template built into the electronic health record (EHR), Sunrise Clinical Manager (version 5.5; Allscripts, Chicago, IL) and is the major mechanism for shift‐to‐shift information transfer. A free text summary of the patient's medical course and condition is created by the provider preparing the sign‐out, as is a separate list of to do items. The free text box is titled History (general hospital course, new events of the day, overall clinical condition). A representative narrative example is, 87 y/o gentleman PMHx AF on coumadin, diastolic CHF (EF 40%), NIDDM2, first degree AV block, GIB in setting of supratherapeutic INR, depression, COPD p/w worsening low back pain in setting of L1 compression frx of? age. HD stable. An option exists to include a medication list pulled from the active orders in the EHR when the sign‐out report is printed. The sign‐out is typically created by the hospitalist attending on the day of admission and then updated daily by the mid‐level provider under the supervision of the attending physician, in accordance with internal standards set by the service. Formal sign‐out training is included as part of orientation for new hires, and ongoing sign‐out education is provided, as needed, by a physician assistant charged with continuous quality improvement for the entire service. The service maintains an expectation for the entire team to provide accurate and updated sign‐out at every shift change. Attending hospitalists or mid‐level providers update the sign‐out on weekends. Because the day team has generally left the hospital prior to the arrival of the night team, verbal sign‐out occurs rarely. Should a verbal sign‐out be given to the night team, it will be provided by the daytime team directly to the night team either via telephone or the day team member staying in the hospital until arrival of the night team.
Participants
All full‐time and regularly scheduled part‐time attending physicians on the YNHH hospitalist night team were eligible to participate. We excluded temporary physicians on service, including clinical fellows and resident moonlighters. Hospitalists could not participate more than once. Written informed consent was obtained of all hospitalists at the start of their shift.
Data Collection
Hospitalists who consented were provided a single pocket card during their shift. For every inquiry that involved a patient that the hospitalist was covering, the hospitalist recorded who originated the inquiry, the clinical significance, the sufficiency of written sign‐out, which information was used other than the written sign‐out, and information regarding the anticipation of the event by the daytime team (Figure 1).

Data were collected on 6 days and distributed from April 30, 2012 through June 12, 2012. Dates were chosen based on staffing to maximize the number of eligible physicians each night and included both weekdays and weekend days. The written sign‐out for the entire service was printed for each night data collection took place.
Main Predictors
Our main predictor variables were characteristics of the inquiry (topic area, clinical importance of the inquiry as assessed by the hospitalist), characteristics of the patient (days since admission), and characteristics of the written sign‐out (whether it included any anticipatory guidance and a composite quality score). We identified elements of the composite quality score based on prior research and expert recommendations.[8, 18, 19, 20] To create the composite quality score, we gave 1 point for each of the following elements: diagnosis or presenting symptoms, general hospital course (a description of any event occurring during hospitalization but prior to date of data collection), current clinical condition (a description of objective data, symptoms, or stability/trajectory in the last 24 hours), and whether the sign‐out had been updated within the last 24 hours. The composite score could range from 0 to 4.
Main Outcome Measures
Our primary outcome measure was the quality and utility of the written‐only sign‐out as defined via a subjective assessment of sufficiency by the covering physician (ie, whether the written sign‐out was adequate to answer the query without seeking any supplemental information). For this outcome, we excluded inquiries for which hospitalists had determined a sign‐out was not necessary to address the inquiry or event.
Statistical Analysis
Data analysis was conducted using SAS 9.2 (SAS Institute, Cary, NC). We used a cutoff of P<0.05 for statistical significance; all tests were 2‐tailed. We assessed characteristics of overnight inquiries using descriptive statistics and determined the association of the main predictors with sufficient sign‐out using 2 tests. We constructed a multivariate logistic regression model using a priori‐determined clinically relevant predictors to test predictors of sign‐out sufficiency. The study was approved by the Human Investigation Committee of Yale University.
RESULTS
Hospitalists recorded 124 inquiries about 96 patients. Altogether, 15 of 19 (79%) eligible hospitalists returned surveys. Of the 96 patients, we obtained the written sign‐out for 68 (71%). The remainder were new patients for whom the sign‐out had not yet been prepared, or patients who had not yet been assigned to the hospitalist service at the time the sign‐out report was printed.
Hospitalists referenced the sign‐out for 89 (74%) inquiries, and the sign‐out was considered sufficient to respond to 27 (30%) of these inquiries (ie, the sign‐out was adequate to answer the inquiry without any supplemental information). Hospitalists physically saw the patient for 14 (12%) inquiries. Nurses were the originator for most inquiries (102 [82%]). The most common inquiry topics were medications (55 [45%]), plan of care (26 [21%]) and clinical changes (26 [21%]). Ninety‐five (77%) inquiries were considered to be somewhat or very clinically important by the hospitalist (Table 1).
| Inquiry originator, No. (% of 124) | |
| Nurse | 102 (82) |
| Patient | 13 (10) |
| Consultant | 6 (5) |
| Respiratory therapy | 3 (2) |
| Inquiry subject, No. (% of 122) | |
| Medication | 55 (45) |
| Plan of care | 26 (21) |
| Clinical change | 26 (21) |
| Order reconciliation | 15 (12) |
| Missing | 2 |
| Clinical importance of inquiry, No. (% of 123) | |
| Very | 33 (27) |
| Somewhat | 62 (50) |
| Not at all | 28 (23) |
| Missing | 1 |
| Sufficiency of sign‐out alone in answering inquiry, No. (% of 121) | |
| Yes | 27 (22) |
| No | 62 (51) |
| Sign‐out not necessary for inquiry | 32 (26) |
| Missing | 3 |
| Days since admission, No. (% of 124) | |
| Less than 2 | 69 (44.4) |
| 2 or more | 55 (55.6) |
| Reference(s) used when sign‐out insufficient, No. (% of 62) | |
| Physician notes | 37 (60) |
| Nurse | 11 (18) |
| Labs/studies | 10 (16) |
| Orders | 9 (15) |
| Patient | 7 (11) |
| Other | 7 (11) |
| Was the event predicted by the primary team? No. (% of 119) | |
| Yes | 17 (14) |
| No | 102 (86) |
| Missing | 5 |
| If no, could this event have been predicted, No. (% of 102) | |
| Yes | 47 (46) |
| No | 55 (54) |
| Of all events that could have been predicted, how many were predicted? No. (% of 64) | |
| Predicted | 17 (27) |
| Not predicted | 47 (73) |
| Did you physically see the patient? No. (% of 117) | |
| Yes | 14 (12) |
| No | 103 (88) |
| Missing | 7 |
| Composite score, No. (% of 68) | |
| 0 or 1 | 0 (0) |
| 2 | 3 (4) |
| 3 | 31 (46) |
| 4 | 34 (50) |
| Anticipatory guidance/to‐do tasks, No. (% of 96) | |
| 0 | 69(72) |
| 1 | 21 (22) |
| 2 or more | 6 (6) |
No written sign‐outs had a composite score of 0 or 1; 3 (4%) had a composite score of 2; 31 (46%) had a composite score of 3; and 34 (50%) had a composite score of 4. Seventy‐two percent of written sign‐outs included neither anticipatory guidance nor tasks, 21% had 1 anticipatory guidance item or task, and 6% had 2 or more anticipatory guidance items and/or tasks.
The primary team caring for a patient did not predict 102 (86%) inquiries, and hospitalists rated 47 (46%) of those unpredicted events as possible for the primary team to predict. Five responses to this question were incomplete and excluded. Of the 64 events predicted by the primary team or rated as predictable by the night hospitalists, 17 (27%) were predicted by the primary team (Table 1).
Sign‐out was considered sufficient in isolation to answer the majority of order reconciliation inquiries (5 [71%]), but was less effective at helping to answer inquiries about clinical change (7 [29%]), medications (10 [28%]), and plan of care (5 [24%]) (P=0.001). (Table 2) Ninety‐five events were rated as either very or somewhat clinically important, but this did not affect the likelihood of sign‐out being sufficient in isolation relative to the not at all clinically important group. Specifically, 33% of sign‐outs were rated sufficient in the very important group, 19% in the somewhat important group, and 50% in the not at all group (P=0.059).
| Predictor | Number of inquiries (%) for which sign‐out was sufficient in isolationb | p value | |
|---|---|---|---|
| |||
| Question topic | 0.001 | ||
| Order reconciliation (oxygen/telemetry) | 5/7 (71) | ||
| Clinical change (vitals, symptoms, labs) | 7/24 (29) | ||
| Medicationa (with clinical question) | 10/36 (28) | ||
| Plan of care (discharge, goals of care, procedure) | 5/21 (24) | ||
| Clinically important | 0.059 | ||
| Not at all | 8 (50) | ||
| Somewhat | 8 (19) | ||
| Very | 10 (33) | ||
| Days since admission | 0.015 | ||
| Less than 2 days | 21 (40) | ||
| 2 or more days | 6 (16) | ||
| Anticipatory guidance and tasks | 0.006 | ||
| 2 or more | 3 (60) | ||
| 1 | 3 (14) | ||
| 0 | 21 (34) | ||
| Composite score | 0.144 | ||
| <4 | 5 (15) | ||
| 4 | 10 (29) | ||
Sign‐out was considered sufficient in isolation more frequently for inquiries about patients admitted <2 days prior to data collection than for inquiries about patients admitted more than 2 days prior to data collection (21 [40%] vs 6 [16%], respectively) (P=0.015) (Table 2).
Sign‐outs with 2 or more anticipatory guidance items were considered sufficient in isolation more often than sign‐outs with 1 or fewer anticipatory guidance item (60% for 2 or more, 14% for 1, 34% for 0; P=0.006) (Table 2). The composite score was grouped into 2 categoriesscore <4 and score=4with no statistical difference in sign‐out sufficiency between the 2 groups (P=0.22) (Table 2).
In multivariable analysis, no predictor variable was significantly associated with sufficient sign‐out (Table 3).
| Adjusted OR (95% CI) | p value | ||
|---|---|---|---|
| Question topic | 0.58 | ||
| Order reconciliation (oxygen/telemetry) | Reference | ||
| Clinical change (vitals, symptoms, labs) | 0.29 (0.01 6.70) | ||
| Medication (+/‐ vitals or symptoms) | 0.17 (0.01 3.83) | ||
| Plan of care (discharge, goals of care, IV, CPAP, procedure) | 0.15 (0.01 3.37) | ||
| Clinically important | 0.85 | ||
| Not at All | Reference | ||
| Somewhat | 0.69 (0.12 4.04) | ||
| Very | 0.57 (0.08 3.88) | ||
| Days since admission | 0.332 (0.09 1.19) | 0.074 | |
| Anticipatory guidance and tasks | 0.26 | ||
| 2 or more | Reference | ||
| 1 | 0.13 (0.01 1.51) | ||
| 0 | 0.21 (0.02 2.11) | ||
| Composite Score | 0.22 | ||
| <4 | Reference | ||
| 4 | 2.2 (0.62 7.77) |
DISCUSSION
In this study of written sign‐out among hospitalists and physician‐extenders on a hospitalist service, we found that the sign‐out was used to answer three‐quarters of overnight inquiries, despite the advanced level of training (completion of all postgraduate medical education) of the covering clinicians and the presence of a robust EHR. The effectiveness of the written sign‐out, however, was not as consistently high as its use. Overall, the sign‐out was sufficient to answer less than a third of inquiries in which it was referenced. Thus, although most studies of sign‐out quality have focused on trainees, our results make it clear that hospitalists also rely on sign‐out, and its effectiveness can be improved.
There are few studies of attending‐level sign‐outs. Hinami et al. found that nearly 1 in 5 hospitalists was uncertain of the care plan after assuming care of a new set of patients, despite having received a handoff from the departing hospitalist.[11] Handoffs between emergency physicians and hospitalists have repeatedly been noted to have content omissions and to contribute to adverse events.[7, 12, 21, 22] Ilan et al. videotaped attending handoffs in the intensive care unit and found that they did not follow any of 3 commonly recommended structures; however, this study did not assess the effectiveness of the handoffs.[23] Williams et al. found that the transfer of patient information among surgical team members, including attending surgeons, was suboptimal, and these problems were commonly related to decreased surgeon familiarity with a particular patient, a theme common to hospital medicine, and a contributor to adverse events and decreased efficiency.[24]
This study extends the literature in several ways. By studying overnight events, we generate a comprehensive view of the information sources hospitalists use to care for patients overnight. Interestingly, our results were similar to the overnight information‐gathering habits of trainees in a study of pediatric trainees.[25] Furthermore, by linking each inquiry to the accompanying written sign‐out, we are able to analyze which characteristics of a written sign‐out are associated with sign‐out effectiveness, and we are able to describe the utility of written sign‐out to answer different types of clinical scenarios.
Our data show that hospitalists rely heavily on written sign‐out to care for patients overnight, with the physician note being the most‐utilized secondary reference used by covering physicians. The written sign‐out was most useful for order clarification compared to other topics, and the patient was only seen for 12% of inquiries. Most notable, however, was the suggestion that sign‐outs with more anticipatory guidance were more likely to be effective for overnight care, as were sign‐outs created earlier in the hospital course. Future efforts to improve the utility of the written sign‐out might focus on these items, whether through training or audit/feedback.
The use of electronic handoff tools has been shown to increase the ease of use, efficiency, and perceptions of patient safety and quality in several studies.[3, 26, 27] This study relied on an electronic tool as the only means of information transfer during sign‐out. Without the confounding effect of verbal information transfer, we are better able to understand the efficacy of the written component alone. Nonetheless, most expert opinion statements as well as The Joint Commission include a recommendation for verbal and written components to handoff communication.[8, 20, 28, 29, 30] It is possible that sign‐outs would more often have been rated sufficient if the handoff process had reliably included verbal handoff. Future studies are warranted to compare written‐only to written‐plus‐verbal sign‐out, to determine the added benefit of verbal communication. With a robust EHR, it is also an open question whether sign‐out needs to be sufficient to answer overnight inquiries or whether it would be acceptable or even preferable to have overnight staff consistently review the EHR directly, especially as the physician notes are the most common nonsign‐out reference used. Nonetheless, the fact that hospitalists rely heavily on written sign‐out despite the availability of other information sources suggests that hospitalists find specific benefit in written sign‐out.
Limitations of this study include the relatively small sample size, the limited collection time period, and the single‐site nature. The YNHH Hospitalist Service uses only written documents to sign out, so the external validity to programs that use verbal sign‐out is limited. The written‐only nature, however, removes the variable of the discussion at time of sign‐out, improving the purity of the written sign‐out assessment. We did not assess workload, which might have affected sign‐out quality. The interpretation of the composite score is limited, due to little variation in scoring in our sample, as well as lack of validation in other studies. An additional limitation is that sign‐outs are not entirely drafted by the hospitalist attendings. Hospitalists draft the initial sign‐out document, but it is updated on subsequent days by the mid‐level provider under the direction of the hospitalist attending. It is therefore possible that sign‐outs maintained directly by hospitalists would have been of different quality. In this regard it is interesting to note that in a different study of verbal sign‐out we were not able to detect a difference in quality among hospitalists, trainees, and midlevels.[12] Last, hindsight bias may be present, as the covering physician's perspective of the event includes more information than available to the provider creating the sign‐out document.
Overall, we found that attending hospitalists rely heavily on written sign‐out documents to address overnight inquiries, but those sign‐outs are not reliably effective. Future work to better understand the roles of written and verbal components in sign‐out is needed to help improve the safety of overnight care.
Disclosures
Disclosures: Dr. Horwitz is supported by the National Institute on Aging (K08 AG038336) and by the American Federation for Aging Research through the Paul B. Beeson Career Development Award Program. Dr. Horwitz is also a Pepper Scholar with support from the Claude D. Pepper Older Americans Independence Center at Yale University School of Medicine (#P30AG021342 NIH/NIA). Dr. Fogerty had full access to all of the data in the study and takes responsibility for the integrity of the data and the accuracy of the data analysis. The authors do not have conflicts of interest to report. Dr. Schoenfeld was a medical student at the Yale University School of Medicine, New Haven, Connecticut at the time of the study. She is now a resident at Massachusetts General Hospital in Boston, Massachusetts.
- , , , . The status of hospital medicine groups in the United States. J Hosp Med. 2006;1(2):75–80.
- , , , . Growth in the care of older patients by hospitalists in the United States. N Engl J Med. 2009;360(11):1102–1112.
- , , , et al. The Veterans Affairs shift change physician‐to‐physician handoff project. Jt Comm J Qual Patient Saf. 2010;36(2):62–71.
- , . The evolution and future of hospital medicine. Mt Sinai J Med. 2008;75(5):418–423.
- . The hospitalist movement—time to move on. N Engl J Med. 2007;357(25):2627–2629.
- , , . Invited article: is it time for neurohospitalists? Neurology. 2008;70(15):1282–1288.
- , , , . Survey of obstetric and gynecologic hospitalists and laborists. Am J Obstet Gynecol. 2010;203(2):177.e171–e174.
- , , , , , . Hospitalist handoffs: a systematic review and task force recommendations. J Hosp Med. 2009;4(7):433–440.
- , , , , . Core competencies in hospital medicine: development and methodology. J Hosp Med. 2006;1(1):48–56.
- , , , , . Gaining efficiency and satisfaction in the handoff process. J Hosp Med. 2010;5(9):547–552.
- , , , . Understanding communication during hospitalist service changes: a mixed methods study. J Hosp Med. 2009;4(9):535–540.
- , , , et al. Development of a handoff evaluation tool for shift‐to‐shift physician handoffs: the handoff CEX. J Hosp Med. 2013;8(4):191–200.
- , , , , . Does housestaff discontinuity of care increase the risk for preventable adverse events? Ann Intern Med. 1994;121(11):866–872.
- , , , et al. Effect of short call admission on length of stay and quality of care for acute decompensated heart failure. Circulation. 2008;117(20):2637–2644.
- , , , , . Consequences of inadequate sign‐out for patient care. Arch Intern Med. 2008;168(16):1755–1760.
- , , , , . Communication failures in patient sign‐out and suggestions for improvement: a critical incident analysis. Qual Saf Health Care. 2005;14(6):401–407.
- , , , et al. An institution‐wide handoff task force to standardise and improve physician handoffs. BMJ Qual Saf. 2012;21(10):863–871.
- , , , , . What are covering doctors told about their patients? Analysis of sign‐out among internal medicine house staff. Qual Saf Health Care. 2009;18(4):248–255.
- , , , . Transfers of patient care between house staff on internal medicine wards: a national survey. Arch Intern Med. 2006;166(11):1173–1177.
- , , , . A theoretical framework and competency‐based approach to improving handoffs. Qual Saf Health Care. 2008;17(1):11–14.
- , , . Communicating in the “gray zone”: perceptions about emergency physician hospitalist handoffs and patient safety. Acad Emerg Med. 2007;14(10):884–894.
- , , , , , . Dropping the baton: a qualitative analysis of failures during the transition from emergency department to inpatient care. Ann Emerg Med. 2009;53(6):701–710.e704.
- , , , , , . Handover patterns: an observational study of critical care physicians. BMC Health Serv Res. 2012;12:11.
- , , , et al. Surgeon information transfer and communication: factors affecting quality and efficiency of inpatient care. Ann Surg. 2007;245(2):159–169.
- , , , , . Answering questions on call: Pediatric resident physicians' use of handoffs and other resources. J Hosp Med. 2013;8:328–333.
- , , , , . A randomized, controlled trial evaluating the impact of a computerized rounding and sign‐out system on continuity of care and resident work hours. J Am Coll Surg. 2005;200(4):538–545.
- , , , et al. Resident sign‐out and patient hand‐offs: opportunities for improvement. Teach Learn Med. 2011;23(2):105–111.
- , . A model for building a standardized hand‐off protocol. Jt Comm J Qual Patient Saf. 2006;32(11):646–655.
- , , , et al. The patient handoff: a comprehensive curricular blueprint for resident education to improve continuity of care. Acad Med. 2012;87(4):411–418.
- The Joint Commission. 2013 Comprehensive Accreditation Manuals. Oak Brook, IL: The Joint Commission; 2012.
Hospital medicine is a main component of healthcare in the United States and is growing.[1] In 1995, 9% of inpatient care performed by general internists to Medicare patients was provided by hospitalists; by 2006, this had increased to 37%.[2] The estimated 30,000 practicing hospitalists account for 19% of all practicing general internists[2, 3, 4] and have had a major impact on the treatment of inpatients at US hospitals.[5] Other specialties are adopting the hospital‐based physician model.[6, 7] The hospitalist model does have unique challenges. One notable aspect of hospitalist care, which is frequently shift based, is the transfer of care among providers at shift change.
The Society of Hospital Medicine recognizes patient handoffs/sign‐outs as a core competency for hospitalists,[8] but there is little literature evaluating hospitalist sign‐out quality.[9] A systematic review in 2009 found no studies of hospitalist handoffs.[8] Furthermore, early work suggests that hospitalist handoffs are not consistently effective.[10] In a recent survey, 13% of hospitalists reported they had received an incomplete handoff, and 16% of hospitalists reported at least 1 near‐miss attributed to incomplete communication.[11] Last, hospitalists perform no better than housestaff on evaluations of sign‐out quality.[12]
Cross‐coverage situations, in which sign‐out is key, have been shown to place patients at risk.[13, 14] One study showed 7.1 problems related to sign‐out per 100 patient‐days.[15] Failure during sign‐out can ultimately threaten patient safety.[16] Therefore, evaluating the quality of hospitalist sign‐outs by assessing how well the sign‐out prepares the night team for overnight events is necessary to improve hospitalist sign‐outs and ultimately increase patient safety.
METHODS
Study Setting
The study took place at YaleNew Haven Hospital (YNHH), the primary teaching affiliate for the Yale School of Medicine, in New Haven, Connecticut. YNHH is a 966‐bed, urban, academic medical center. The Hospitalist Service is a nonteaching service composed of 56.1 full‐time‐equivalent (FTE) attending physicians and 26.8 FTE midlevel providers. In fiscal year 2012, the YNHH Hospitalist Service cared for 13,764 discharges, or approximately 70% of general medical discharges. Similar patients are cared for by both hospitalists and housestaff. Patients on the hospitalist service are assigned an attending physician as well as a midlevel provider during the daytime. Between the departure of the day team and the arrival of the night team, typically a 2‐hour window, a skeleton crew covers the entire service and admits patients. The same skeleton crew coverage plan exists in the approximately 2.5‐hour morning gap between the departure of the night team and arrival of the day team. Overnight, care is generally provided by attending hospitalist physicians alone. Clinical fellows and internal medicine residents occasionally fill the night hospitalist role.
Sign‐out Procedure
The YNHH Hospitalist Service uses a written sign‐out[17] created via template built into the electronic health record (EHR), Sunrise Clinical Manager (version 5.5; Allscripts, Chicago, IL) and is the major mechanism for shift‐to‐shift information transfer. A free text summary of the patient's medical course and condition is created by the provider preparing the sign‐out, as is a separate list of to do items. The free text box is titled History (general hospital course, new events of the day, overall clinical condition). A representative narrative example is, 87 y/o gentleman PMHx AF on coumadin, diastolic CHF (EF 40%), NIDDM2, first degree AV block, GIB in setting of supratherapeutic INR, depression, COPD p/w worsening low back pain in setting of L1 compression frx of? age. HD stable. An option exists to include a medication list pulled from the active orders in the EHR when the sign‐out report is printed. The sign‐out is typically created by the hospitalist attending on the day of admission and then updated daily by the mid‐level provider under the supervision of the attending physician, in accordance with internal standards set by the service. Formal sign‐out training is included as part of orientation for new hires, and ongoing sign‐out education is provided, as needed, by a physician assistant charged with continuous quality improvement for the entire service. The service maintains an expectation for the entire team to provide accurate and updated sign‐out at every shift change. Attending hospitalists or mid‐level providers update the sign‐out on weekends. Because the day team has generally left the hospital prior to the arrival of the night team, verbal sign‐out occurs rarely. Should a verbal sign‐out be given to the night team, it will be provided by the daytime team directly to the night team either via telephone or the day team member staying in the hospital until arrival of the night team.
Participants
All full‐time and regularly scheduled part‐time attending physicians on the YNHH hospitalist night team were eligible to participate. We excluded temporary physicians on service, including clinical fellows and resident moonlighters. Hospitalists could not participate more than once. Written informed consent was obtained of all hospitalists at the start of their shift.
Data Collection
Hospitalists who consented were provided a single pocket card during their shift. For every inquiry that involved a patient that the hospitalist was covering, the hospitalist recorded who originated the inquiry, the clinical significance, the sufficiency of written sign‐out, which information was used other than the written sign‐out, and information regarding the anticipation of the event by the daytime team (Figure 1).
Data were collected on 6 days and distributed from April 30, 2012 through June 12, 2012. Dates were chosen based on staffing to maximize the number of eligible physicians each night and included both weekdays and weekend days. The written sign‐out for the entire service was printed for each night data collection took place.
Main Predictors
Our main predictor variables were characteristics of the inquiry (topic area, clinical importance of the inquiry as assessed by the hospitalist), characteristics of the patient (days since admission), and characteristics of the written sign‐out (whether it included any anticipatory guidance and a composite quality score). We identified elements of the composite quality score based on prior research and expert recommendations.[8, 18, 19, 20] To create the composite quality score, we gave 1 point for each of the following elements: diagnosis or presenting symptoms, general hospital course (a description of any event occurring during hospitalization but prior to date of data collection), current clinical condition (a description of objective data, symptoms, or stability/trajectory in the last 24 hours), and whether the sign‐out had been updated within the last 24 hours. The composite score could range from 0 to 4.
Main Outcome Measures
Our primary outcome measure was the quality and utility of the written‐only sign‐out as defined via a subjective assessment of sufficiency by the covering physician (ie, whether the written sign‐out was adequate to answer the query without seeking any supplemental information). For this outcome, we excluded inquiries for which hospitalists had determined a sign‐out was not necessary to address the inquiry or event.
Statistical Analysis
Data analysis was conducted using SAS 9.2 (SAS Institute, Cary, NC). We used a cutoff of P<0.05 for statistical significance; all tests were 2‐tailed. We assessed characteristics of overnight inquiries using descriptive statistics and determined the association of the main predictors with sufficient sign‐out using 2 tests. We constructed a multivariate logistic regression model using a priori‐determined clinically relevant predictors to test predictors of sign‐out sufficiency. The study was approved by the Human Investigation Committee of Yale University.
RESULTS
Hospitalists recorded 124 inquiries about 96 patients. Altogether, 15 of 19 (79%) eligible hospitalists returned surveys. Of the 96 patients, we obtained the written sign‐out for 68 (71%). The remainder were new patients for whom the sign‐out had not yet been prepared, or patients who had not yet been assigned to the hospitalist service at the time the sign‐out report was printed.
Hospitalists referenced the sign‐out for 89 (74%) inquiries, and the sign‐out was considered sufficient to respond to 27 (30%) of these inquiries (ie, the sign‐out was adequate to answer the inquiry without any supplemental information). Hospitalists physically saw the patient for 14 (12%) inquiries. Nurses were the originator for most inquiries (102 [82%]). The most common inquiry topics were medications (55 [45%]), plan of care (26 [21%]) and clinical changes (26 [21%]). Ninety‐five (77%) inquiries were considered to be somewhat or very clinically important by the hospitalist (Table 1).
| Inquiry originator, No. (% of 124) | |
| Nurse | 102 (82) |
| Patient | 13 (10) |
| Consultant | 6 (5) |
| Respiratory therapy | 3 (2) |
| Inquiry subject, No. (% of 122) | |
| Medication | 55 (45) |
| Plan of care | 26 (21) |
| Clinical change | 26 (21) |
| Order reconciliation | 15 (12) |
| Missing | 2 |
| Clinical importance of inquiry, No. (% of 123) | |
| Very | 33 (27) |
| Somewhat | 62 (50) |
| Not at all | 28 (23) |
| Missing | 1 |
| Sufficiency of sign‐out alone in answering inquiry, No. (% of 121) | |
| Yes | 27 (22) |
| No | 62 (51) |
| Sign‐out not necessary for inquiry | 32 (26) |
| Missing | 3 |
| Days since admission, No. (% of 124) | |
| Less than 2 | 69 (44.4) |
| 2 or more | 55 (55.6) |
| Reference(s) used when sign‐out insufficient, No. (% of 62) | |
| Physician notes | 37 (60) |
| Nurse | 11 (18) |
| Labs/studies | 10 (16) |
| Orders | 9 (15) |
| Patient | 7 (11) |
| Other | 7 (11) |
| Was the event predicted by the primary team? No. (% of 119) | |
| Yes | 17 (14) |
| No | 102 (86) |
| Missing | 5 |
| If no, could this event have been predicted, No. (% of 102) | |
| Yes | 47 (46) |
| No | 55 (54) |
| Of all events that could have been predicted, how many were predicted? No. (% of 64) | |
| Predicted | 17 (27) |
| Not predicted | 47 (73) |
| Did you physically see the patient? No. (% of 117) | |
| Yes | 14 (12) |
| No | 103 (88) |
| Missing | 7 |
| Composite score, No. (% of 68) | |
| 0 or 1 | 0 (0) |
| 2 | 3 (4) |
| 3 | 31 (46) |
| 4 | 34 (50) |
| Anticipatory guidance/to‐do tasks, No. (% of 96) | |
| 0 | 69(72) |
| 1 | 21 (22) |
| 2 or more | 6 (6) |
No written sign‐outs had a composite score of 0 or 1; 3 (4%) had a composite score of 2; 31 (46%) had a composite score of 3; and 34 (50%) had a composite score of 4. Seventy‐two percent of written sign‐outs included neither anticipatory guidance nor tasks, 21% had 1 anticipatory guidance item or task, and 6% had 2 or more anticipatory guidance items and/or tasks.
The primary team caring for a patient did not predict 102 (86%) inquiries, and hospitalists rated 47 (46%) of those unpredicted events as possible for the primary team to predict. Five responses to this question were incomplete and excluded. Of the 64 events predicted by the primary team or rated as predictable by the night hospitalists, 17 (27%) were predicted by the primary team (Table 1).
Sign‐out was considered sufficient in isolation to answer the majority of order reconciliation inquiries (5 [71%]), but was less effective at helping to answer inquiries about clinical change (7 [29%]), medications (10 [28%]), and plan of care (5 [24%]) (P=0.001). (Table 2) Ninety‐five events were rated as either very or somewhat clinically important, but this did not affect the likelihood of sign‐out being sufficient in isolation relative to the not at all clinically important group. Specifically, 33% of sign‐outs were rated sufficient in the very important group, 19% in the somewhat important group, and 50% in the not at all group (P=0.059).
| Predictor | Number of inquiries (%) for which sign‐out was sufficient in isolationb | p value | |
|---|---|---|---|
| |||
| Question topic | 0.001 | ||
| Order reconciliation (oxygen/telemetry) | 5/7 (71) | ||
| Clinical change (vitals, symptoms, labs) | 7/24 (29) | ||
| Medicationa (with clinical question) | 10/36 (28) | ||
| Plan of care (discharge, goals of care, procedure) | 5/21 (24) | ||
| Clinically important | 0.059 | ||
| Not at all | 8 (50) | ||
| Somewhat | 8 (19) | ||
| Very | 10 (33) | ||
| Days since admission | 0.015 | ||
| Less than 2 days | 21 (40) | ||
| 2 or more days | 6 (16) | ||
| Anticipatory guidance and tasks | 0.006 | ||
| 2 or more | 3 (60) | ||
| 1 | 3 (14) | ||
| 0 | 21 (34) | ||
| Composite score | 0.144 | ||
| <4 | 5 (15) | ||
| 4 | 10 (29) | ||
Sign‐out was considered sufficient in isolation more frequently for inquiries about patients admitted <2 days prior to data collection than for inquiries about patients admitted more than 2 days prior to data collection (21 [40%] vs 6 [16%], respectively) (P=0.015) (Table 2).
Sign‐outs with 2 or more anticipatory guidance items were considered sufficient in isolation more often than sign‐outs with 1 or fewer anticipatory guidance item (60% for 2 or more, 14% for 1, 34% for 0; P=0.006) (Table 2). The composite score was grouped into 2 categoriesscore <4 and score=4with no statistical difference in sign‐out sufficiency between the 2 groups (P=0.22) (Table 2).
In multivariable analysis, no predictor variable was significantly associated with sufficient sign‐out (Table 3).
| Adjusted OR (95% CI) | p value | ||
|---|---|---|---|
| Question topic | 0.58 | ||
| Order reconciliation (oxygen/telemetry) | Reference | ||
| Clinical change (vitals, symptoms, labs) | 0.29 (0.01 6.70) | ||
| Medication (+/‐ vitals or symptoms) | 0.17 (0.01 3.83) | ||
| Plan of care (discharge, goals of care, IV, CPAP, procedure) | 0.15 (0.01 3.37) | ||
| Clinically important | 0.85 | ||
| Not at All | Reference | ||
| Somewhat | 0.69 (0.12 4.04) | ||
| Very | 0.57 (0.08 3.88) | ||
| Days since admission | 0.332 (0.09 1.19) | 0.074 | |
| Anticipatory guidance and tasks | 0.26 | ||
| 2 or more | Reference | ||
| 1 | 0.13 (0.01 1.51) | ||
| 0 | 0.21 (0.02 2.11) | ||
| Composite Score | 0.22 | ||
| <4 | Reference | ||
| 4 | 2.2 (0.62 7.77) |
DISCUSSION
In this study of written sign‐out among hospitalists and physician‐extenders on a hospitalist service, we found that the sign‐out was used to answer three‐quarters of overnight inquiries, despite the advanced level of training (completion of all postgraduate medical education) of the covering clinicians and the presence of a robust EHR. The effectiveness of the written sign‐out, however, was not as consistently high as its use. Overall, the sign‐out was sufficient to answer less than a third of inquiries in which it was referenced. Thus, although most studies of sign‐out quality have focused on trainees, our results make it clear that hospitalists also rely on sign‐out, and its effectiveness can be improved.
There are few studies of attending‐level sign‐outs. Hinami et al. found that nearly 1 in 5 hospitalists was uncertain of the care plan after assuming care of a new set of patients, despite having received a handoff from the departing hospitalist.[11] Handoffs between emergency physicians and hospitalists have repeatedly been noted to have content omissions and to contribute to adverse events.[7, 12, 21, 22] Ilan et al. videotaped attending handoffs in the intensive care unit and found that they did not follow any of 3 commonly recommended structures; however, this study did not assess the effectiveness of the handoffs.[23] Williams et al. found that the transfer of patient information among surgical team members, including attending surgeons, was suboptimal, and these problems were commonly related to decreased surgeon familiarity with a particular patient, a theme common to hospital medicine, and a contributor to adverse events and decreased efficiency.[24]
This study extends the literature in several ways. By studying overnight events, we generate a comprehensive view of the information sources hospitalists use to care for patients overnight. Interestingly, our results were similar to the overnight information‐gathering habits of trainees in a study of pediatric trainees.[25] Furthermore, by linking each inquiry to the accompanying written sign‐out, we are able to analyze which characteristics of a written sign‐out are associated with sign‐out effectiveness, and we are able to describe the utility of written sign‐out to answer different types of clinical scenarios.
Our data show that hospitalists rely heavily on written sign‐out to care for patients overnight, with the physician note being the most‐utilized secondary reference used by covering physicians. The written sign‐out was most useful for order clarification compared to other topics, and the patient was only seen for 12% of inquiries. Most notable, however, was the suggestion that sign‐outs with more anticipatory guidance were more likely to be effective for overnight care, as were sign‐outs created earlier in the hospital course. Future efforts to improve the utility of the written sign‐out might focus on these items, whether through training or audit/feedback.
The use of electronic handoff tools has been shown to increase the ease of use, efficiency, and perceptions of patient safety and quality in several studies.[3, 26, 27] This study relied on an electronic tool as the only means of information transfer during sign‐out. Without the confounding effect of verbal information transfer, we are better able to understand the efficacy of the written component alone. Nonetheless, most expert opinion statements as well as The Joint Commission include a recommendation for verbal and written components to handoff communication.[8, 20, 28, 29, 30] It is possible that sign‐outs would more often have been rated sufficient if the handoff process had reliably included verbal handoff. Future studies are warranted to compare written‐only to written‐plus‐verbal sign‐out, to determine the added benefit of verbal communication. With a robust EHR, it is also an open question whether sign‐out needs to be sufficient to answer overnight inquiries or whether it would be acceptable or even preferable to have overnight staff consistently review the EHR directly, especially as the physician notes are the most common nonsign‐out reference used. Nonetheless, the fact that hospitalists rely heavily on written sign‐out despite the availability of other information sources suggests that hospitalists find specific benefit in written sign‐out.
Limitations of this study include the relatively small sample size, the limited collection time period, and the single‐site nature. The YNHH Hospitalist Service uses only written documents to sign out, so the external validity to programs that use verbal sign‐out is limited. The written‐only nature, however, removes the variable of the discussion at time of sign‐out, improving the purity of the written sign‐out assessment. We did not assess workload, which might have affected sign‐out quality. The interpretation of the composite score is limited, due to little variation in scoring in our sample, as well as lack of validation in other studies. An additional limitation is that sign‐outs are not entirely drafted by the hospitalist attendings. Hospitalists draft the initial sign‐out document, but it is updated on subsequent days by the mid‐level provider under the direction of the hospitalist attending. It is therefore possible that sign‐outs maintained directly by hospitalists would have been of different quality. In this regard it is interesting to note that in a different study of verbal sign‐out we were not able to detect a difference in quality among hospitalists, trainees, and midlevels.[12] Last, hindsight bias may be present, as the covering physician's perspective of the event includes more information than available to the provider creating the sign‐out document.
Overall, we found that attending hospitalists rely heavily on written sign‐out documents to address overnight inquiries, but those sign‐outs are not reliably effective. Future work to better understand the roles of written and verbal components in sign‐out is needed to help improve the safety of overnight care.
Disclosures
Disclosures: Dr. Horwitz is supported by the National Institute on Aging (K08 AG038336) and by the American Federation for Aging Research through the Paul B. Beeson Career Development Award Program. Dr. Horwitz is also a Pepper Scholar with support from the Claude D. Pepper Older Americans Independence Center at Yale University School of Medicine (#P30AG021342 NIH/NIA). Dr. Fogerty had full access to all of the data in the study and takes responsibility for the integrity of the data and the accuracy of the data analysis. The authors do not have conflicts of interest to report. Dr. Schoenfeld was a medical student at the Yale University School of Medicine, New Haven, Connecticut at the time of the study. She is now a resident at Massachusetts General Hospital in Boston, Massachusetts.
- , , , . The status of hospital medicine groups in the United States. J Hosp Med. 2006;1(2):75–80.
- , , , . Growth in the care of older patients by hospitalists in the United States. N Engl J Med. 2009;360(11):1102–1112.
- , , , et al. The Veterans Affairs shift change physician‐to‐physician handoff project. Jt Comm J Qual Patient Saf. 2010;36(2):62–71.
- , . The evolution and future of hospital medicine. Mt Sinai J Med. 2008;75(5):418–423.
- . The hospitalist movement—time to move on. N Engl J Med. 2007;357(25):2627–2629.
- , , . Invited article: is it time for neurohospitalists? Neurology. 2008;70(15):1282–1288.
- , , , . Survey of obstetric and gynecologic hospitalists and laborists. Am J Obstet Gynecol. 2010;203(2):177.e171–e174.
- , , , , , . Hospitalist handoffs: a systematic review and task force recommendations. J Hosp Med. 2009;4(7):433–440.
- , , , , . Core competencies in hospital medicine: development and methodology. J Hosp Med. 2006;1(1):48–56.
- , , , , . Gaining efficiency and satisfaction in the handoff process. J Hosp Med. 2010;5(9):547–552.
- , , , . Understanding communication during hospitalist service changes: a mixed methods study. J Hosp Med. 2009;4(9):535–540.
- , , , et al. Development of a handoff evaluation tool for shift‐to‐shift physician handoffs: the handoff CEX. J Hosp Med. 2013;8(4):191–200.
- , , , , . Does housestaff discontinuity of care increase the risk for preventable adverse events? Ann Intern Med. 1994;121(11):866–872.
- , , , et al. Effect of short call admission on length of stay and quality of care for acute decompensated heart failure. Circulation. 2008;117(20):2637–2644.
- , , , , . Consequences of inadequate sign‐out for patient care. Arch Intern Med. 2008;168(16):1755–1760.
- , , , , . Communication failures in patient sign‐out and suggestions for improvement: a critical incident analysis. Qual Saf Health Care. 2005;14(6):401–407.
- , , , et al. An institution‐wide handoff task force to standardise and improve physician handoffs. BMJ Qual Saf. 2012;21(10):863–871.
- , , , , . What are covering doctors told about their patients? Analysis of sign‐out among internal medicine house staff. Qual Saf Health Care. 2009;18(4):248–255.
- , , , . Transfers of patient care between house staff on internal medicine wards: a national survey. Arch Intern Med. 2006;166(11):1173–1177.
- , , , . A theoretical framework and competency‐based approach to improving handoffs. Qual Saf Health Care. 2008;17(1):11–14.
- , , . Communicating in the “gray zone”: perceptions about emergency physician hospitalist handoffs and patient safety. Acad Emerg Med. 2007;14(10):884–894.
- , , , , , . Dropping the baton: a qualitative analysis of failures during the transition from emergency department to inpatient care. Ann Emerg Med. 2009;53(6):701–710.e704.
- , , , , , . Handover patterns: an observational study of critical care physicians. BMC Health Serv Res. 2012;12:11.
- , , , et al. Surgeon information transfer and communication: factors affecting quality and efficiency of inpatient care. Ann Surg. 2007;245(2):159–169.
- , , , , . Answering questions on call: Pediatric resident physicians' use of handoffs and other resources. J Hosp Med. 2013;8:328–333.
- , , , , . A randomized, controlled trial evaluating the impact of a computerized rounding and sign‐out system on continuity of care and resident work hours. J Am Coll Surg. 2005;200(4):538–545.
- , , , et al. Resident sign‐out and patient hand‐offs: opportunities for improvement. Teach Learn Med. 2011;23(2):105–111.
- , . A model for building a standardized hand‐off protocol. Jt Comm J Qual Patient Saf. 2006;32(11):646–655.
- , , , et al. The patient handoff: a comprehensive curricular blueprint for resident education to improve continuity of care. Acad Med. 2012;87(4):411–418.
- The Joint Commission. 2013 Comprehensive Accreditation Manuals. Oak Brook, IL: The Joint Commission; 2012.
© 2013 Society of Hospital Medicine
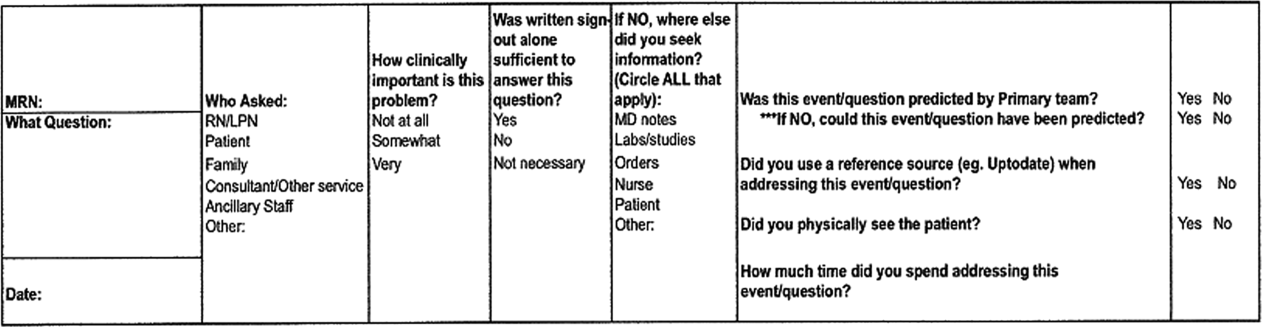
Stearic acid
Stearic acid, a waxlike fatty acid also known as octadecanoic acid, is an important component of stratum corneum lipids. Stearic acid is also found in cocoa butter, shea butter, and other vegetable fats, as well as animal tallow. As an FDA-approved ingredient in several cosmetic products, it is used as a surfactant and emulsifying agent for fragrance and as the base for other fatty acid ingredients that are synthesized into emollients and lubricants. Stearic acid is used most often to thicken and retain the shape of soaps (indirectly, through saponification of triglycerides composed of stearic acid esters), and it is also used in shampoos, shaving creams, and detergents.
There is limited evidence for the potential of exogenously produced stearic acid to play a significant role as a topical dermatologic therapeutic agent. Stearic acid is thought to be associated with behenyltrimethylammonium chloride through salt bridges, and the combination is believed to have the capacity to build bilayer vesicles with the aid of hinokitiol (beta-thujaplicin), a natural monoterpenoid found in the wood of trees in the Cupressaceae family that has been shown to exert topical inhibitory activity against Chlamydia trachomatis (Antimicrob. Agents Chemother. 2005;49:2519-21). These vesicles, used to enhance the skin permeation of hinokitiol, were tested in hairless mice and appear to have the potential to promote hair growth (Drug Dev. Ind. Pharm. 2010;36:556-62).
In 2000, Khalil et al. studied the effects of cream formulations on chemically induced burns in mice based on reports that the ingredients, docosanol or stearic acid, were associated with antiviral and anti-inflammatory activity. Burns were engendered by painting murine abdomens with a chloroform solution of phenol. Investigators then topically applied the test formulations 0.5, 3, and 6 hours after injury. They found that the docosanol- and stearic acid–containing creams significantly mitigated the severity and progression of skin lesions compared with untreated sites, yielding, respectively, 76% and 57% declines in mean lesion scores (Contact Dermatitis 2000;43:79-81).
In 2001, Fluhr et al. studied the effects of the free fatty acid pool on stratum corneum (SC) acidification and function by topically applying two phospholipase inhibitors – bromphenacylbromide and 1-hexadecyl-3-trifluoroethylglycero-sn-2-phosphomethanol – for 3 days to murine skin. This raised skin pH and yielded permeability barrier abnormality, altered SC integrity, and reduced SC cohesion. All malfunctions were normalized, including SC pH, with the coapplication of either palmitic, stearic, or linoleic acids along with the inhibiting agents (J. Invest. Dermatol. 2001;117:44-51).
In 2010, Mukherjee et al. evaluated a recently marketed mild, moisturizing body wash containing stearic acid and emollient soybean oil to ascertain the location and amount of stearic acid deposited in the SC after in vivo usage of the product. They conducted clinical cleansing studies for 1 and 5 consecutive days using the soybean product or petroleum jelly. The deuterated variant of stearic acid replaced the free stearic acid in the soybean formulation. The researchers detected deuterated stearic acid in all 10 consecutive layers of SC, with a total stearic acid level measured at 0.33 mcg/cm2 after five washes with the soybean oil product. They concluded that the estimated total fatty acid delivered to the skin from cleansing, probably incorporated into the SC lipid phase, is comparable to the fatty acid amount in an SC layer (J. Cosmet. Dermatol. 2010;9:202-10).
Stearic acid is incorporated into several over-the-counter products, including formulations by Aveda (Green Science Firming Face Cream), Yves Rocher (Les Plaisirs Nature), Kiss My Face (with alpha hydroxy acid), Valeant Pharmaceuticals’ Kinerase line (including Clear Skin Regulating Mask), Buster’s Skin Care for Men (peptide complex organic face moisturizer), and Dermalogica (Soothing Shaving Cream with Daily Defense Block), among others.
Conclusion
While stearic acid is an important component in stratum corneum lipids and a widely used ingredient in skin care products, there is a dearth of data on its significance, if any, in the topical dermatologic armamentarium beyond its primary activity as a surfactant and emulsifying agent. Specifically, it remains to be seen whether stearic acid can be replenished in the stratum corneum through topical treatment. Much more research is needed in this area to assess the potential of stearic acid as a therapeutic agent.
Dr. Baumann is chief executive officer of the Baumann Cosmetic & Research Institute in Miami Beach. She founded the cosmetic dermatology center at the University of Miami in 1997. Dr. Baumann wrote the textbook "Cosmetic Dermatology: Principles and Practice" (McGraw-Hill, April 2009), and a book for consumers, "The Skin Type Solution" (Bantam, 2006). She has contributed to the Cosmeceutical Critique column in Skin & Allergy News since January 2001 and joined the editorial advisory board in 2004. She has received funding for clinical grants from Allergan, Aveeno, Avon Products, Galderma, Mary Kay, Medicis Pharmaceuticals, Neutrogena, Philosophy, Stiefel, Topix Pharmaceuticals, and Unilever. E-mail [email protected] to contact Dr. Baumann or to suggest topics for a future column.

A stepwise approach to managing eclampsia and other hypertensive emergencies
CASE: MISSED PREECLAMPSIA
At her first prenatal visit at 14 weeks’ gestation, a 41-year-old woman (G2P1) presents with a dichorionic twin gestation, blood pressure (BP) of 105/68 mm Hg, and a body mass index (BMI) of 40 kg/m2. The pregnancy was achieved through in vitro fertilization. Ten years earlier, the patient’s first pregnancy was complicated by preeclampsia, requiring preterm delivery at 33 weeks’ gestation.
By 28 weeks’ gestation, the patient has gained 26 lb. Her BP is 120/70 mm Hg, with no proteinuria detected by urine dipstick. By 30 weeks, she has gained an additional 8 lb, her BP is 142/84 mm Hg, and no proteinuria is detected. At 32 weeks, her BP is 140/92 mm Hg, she has gained another 8 lb, and no proteinuria is present. She also reports new-onset headaches that do not respond to over-the-counter analgesics. She is sent to the obstetric triage area for BP monitoring, blood testing for preeclampsia and nonstress test fetal monitoring.
During the 2-hour observation period, the patient continues to report headaches, and swelling of her face and hands is present. Her systolic BP values range from 132 to 152 mm Hg, and diastolic values range from 80 to 96 mm Hg. No proteinuria is detected, blood testing results for preeclampsia (complete blood count, liver enzymes, serum creatinine, and uric acid) are normal, and the nonstress tests are reactive in both fetuses.
The patient is given a diagnosis of gestational hypertension, along with a prescription for oral labetalol 200 mg daily and two tablets of acetaminophen with codeine for the headaches (to be taken every 6 hours as needed). She is sent home with instructions to return to her physician’s office in 1 week.
Two days later, she wakes in the middle of the night with a severe headache, blurred vision, and vomiting. Her husband calls the obstetrician’s answering service and is instructed to call 911 immediately. While waiting for an ambulance, the patient experiences a grand mal eclamptic convulsion. A second convulsion occurs during her transfer to the ED.
This scenario could have been avoided.
The obstetrician in this case was negligent for failing to recognize preeclampsia in a patient who had two clear risk factors for it: multifetal gestation and a history of early-onset (<37 weeks) preeclampsia in an earlier pregnancy (other risk factors are listed in TABLE 1).
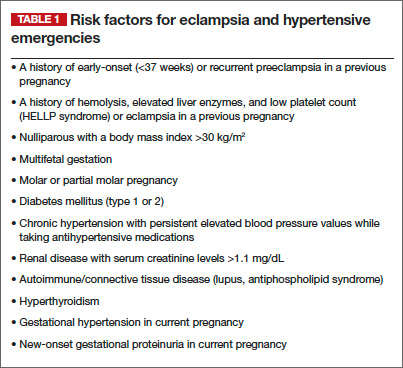
As a result, the patient developed eclampsia, a serious condition that can lead to grave maternal complications (TABLE 2), including death. It also can cause fetal complications, including growth restriction, hypoxia, acidosis, preterm birth, long-term developmental deficits, and death.1,2
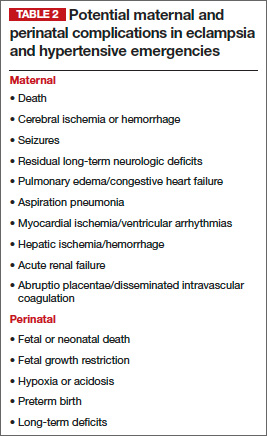
The obstetrician in this case also overlooked published evidence indicating that, in the setting of hypertension and headaches, as many as 20% to 30% of pregnant women whose tests for proteinuria show a negative or trace result via dipstick will develop eclampsia.3 Instead of initiating outpatient administration of oral antihypertensive agents, the obstetrician should have hospitalized this patient for at least 48 hours, with steroid administration, to determine whether outpatient management was feasible.
Related article: 10 practical, evidence-based recommendations to improve outcomes in women who have eclampsia Baha Sibai, MD (November 2011)
Defining eclampsia
Eclampsia is marked by the onset of convulsions (during pregnancy or postpartum) in association with gestational hypertension alone, proteinuria, preeclampsia, or superimposed preeclampsia. Although it is rare, eclampsia is potentially life-threatening. For that reason, obstetricians, anesthesiologists, ED physicians, neurologists, and critical-care physicians should be well versed in its diagnosis and management. In this article, I focus on management.
A few preliminary points
Eclampsia can develop any time during the antenatal period (>16 weeks’ gestation), during labor and delivery, and as long as 6 weeks after delivery. Therefore, we should be vigilant for preeclampsia whenever a pregnant patient visits our office, as well as when she makes unscheduled visits to the ED or obstetric triage area or is hospitalized.
Early recognition of women at high risk for preeclampsia and eclampsia may allow for prompt intervention, including early hospitalization for close observation prior to delivery and postpartum.1,2,4–10
Hospitalization of high-risk women allows for use of antihypertensive agents to treat severe BP, administration of magnesium sulfate to prevent convulsions, and timely delivery of the infant. It also allows for intensive maternal support during and after an eclamptic seizure.
Hospitalization is essential for women who exhibit features that suggest severe disease. More specifically, the presence of gestational hypertension with any of the following features is an indication for immediate hospitalization for evaluation and management:
- persistent severe hypertension (systolic
BP ≥160 mm Hg or diastolic BP ≥110 mm Hg) for at least 1 hour - gestational hypertension requiring oral antihypertensive therapy
- progressive and excessive weight gain (≥20 lb prior to 28 weeks’ gestation)
- generalized swelling (edema of hands or face)
- new-onset or persistent headaches despite analgesics
- persistent visual changes (blurred vision, scotomata, photophobia, double vision)
- shortness of breath, dyspnea, orthopnea, or tightness in the chest
- persistent retrosternal chest pain, severe epigastric or right upper quadrant pain
- persistent nausea, vomiting, malaise
- altered mental state, confusion, numbness, tingling, or motor weakness
- platelet count below 100 3 103 µL
- aspartate aminotransferase (AST), alanine aminotransferase (ALT), or lactic acid dehydrogenase (LDH) levels more than twice the upper limit of normal
- serum creatinine level >1.1 mg/dL
- suspected abruptio placentae.
A stepwise approach to eclampsia
Eclampsia is an obstetric emergency. Inadequate preparation for it or an inappropriate response to maternal and fetal conditions during and after an eclamptic convulsion can be detrimental to the mother and fetus. All obstetric units should have up-to-date protocols in place and should conduct mandatory drills to prepare nursing staff, obstetric providers, and anesthesia staff working in these units to manage eclampsia.
Step 1: Let the seizure run its course
During a seizure, resist the impulse to administer anticonvulsive drugs, including intravenous (IV) magnesium sulfate, because most eclamptic convulsions are self-limiting. Also abstain from administering medications such as IV phenytoin, diazepam, or midazolam, as these drugs are less effective than magnesium sulfate, and some can suppress the laryngeal reflex, increasing the risk of aspiration.
If the patient develops status epilepticus, initiate muscle paralysis and intubate her.
Step 2: Support the maternal condition
It is vital to support maternal respiratory and cardiovascular functions to prevent hypoxia, acidosis, and cardiorespiratory arrest.
Begin by establishing airway patency and maternal oxygenation during and after the convulsion. Administer oxygen via a face mask, with or without a reservoir, at a rate of 8 to 10 L/min.
During the apneic period (see “Profile of an eclamptic seizure” on page 46), the patient will develop hypoxia. Use pulse oximetry to monitor oxygen saturation, with the goal of keeping it above 94%. Arterial blood gas analysis is required if oxygen saturation remains below 92% or if pulmonary edema or aspiration is suspected.
If the patient develops recurrent seizures, status epilepticus, florid alveolar pulmonary edema, or respiratory arrest, intubate her immediately.
Step 3: Prevent maternal injury and aspiration
Secure the side rails of the patient’s bed by elevating them to prevent a fall, and make sure they are padded to prevent trauma during convulsions and afterward, when some women become combative and agitated. Position the patient in a lateral decubitus position to minimize aspiration of oral secretions. If any secretions or vomitus are present, remove them via suction.
Step 4: After the convulsion, give magnesium sulfate
Magnesium is the drug of choice for seizure prophylaxis in women with preeclampsia and severe symptoms, and to prevent recurrent seizures in women with eclampsia.
In the latter group, once the eclamptic convulsion has ended, give a loading dose of IV magnesium (6 g/100 mL over 20 minutes), followed by a continuous infusion of 2 g/h for at least 24 hours. If the patient develops a second seizure during the maintenance infusion, administer another bolus of magnesium (2 g/100 mL over 3–5 minutes).
Step 5: Treat severe hypertension
If severe hypertension persists for 60 minutes or longer, it can lead to injury of the brain, heart, and kidneys. To avoid these complications, it is essential to reduce BP to a safe range and maintain that level without compromising cerebral perfusion pressure and uteroplacental blood flow (which already may be reduced in some patients).
The goal of antihypertensive therapy is to keep systolic BP between 140 and 155 mm Hg and diastolic values between 90 and 105 mm Hg.9 Several agents are available for the treatment of severe hypertension during pregnancy and postpartum. The most commonly used IV medications for this purpose are labetalol and hydralazine. Another option is oral, rapidly acting
nifedipine.
Several randomized trials have compared efficacy and side effects between IV bolus injections of hydralazine; IV labetalol; and oral, rapidly acting nifedipine. In general, the findings of these studies suggest that either IV hydralazine or labetalol or oral nifedipine can be used to treat severe hypertension in pregnancy, as long as the provider is familiar with the dose to be used, the expected onset of action, and potential side effects (TABLE 3).
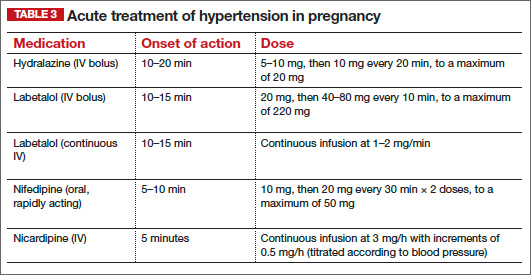
Women who develop generalized swelling or hemoconcentration (hematocrit ≥40%), or both, usually experience markedly reduced plasma volume. For this reason, these women will benefit from treatment with labetalol. If this is ineffective, then add IV hydralazine. However, delay administration of a rapidly acting vasodilator such as hydralazine to prevent an excessive hypotensive response and a secondary reduction in tissue perfusion and uteroplacental blood flow. Rather, administer a bolus infusion of 250 to 500 mL of isotonic saline before giving a vasodilator.
Additional details about the use of antihypertensive drugs are given in the section on other hypertensive emergencies below.
Step 6: Evaluate the patient for complications
Pulmonary edema can develop in patients with eclampsia or another hypertensive emergency. Suspect it if the patient has respiratory symptoms in association with tachypnea, tachycardia, or sustained oxygen saturation values below 93%, as well as when the patient exhibits basal rales during auscultation of the lungs. Treatment involves the administration of oxygen and IV furosemide (20–40 mg push), repeated as needed.
Some women with eclampsia may develop severe cerebral edema, hemorrhage, or both. The edema can be vasogenic or cytotoxic, leading to increased intracerebral pressure. Suspect edema or hemorrhage if the patient remains unresponsive, continues to experience convulsions despite therapy, or exhibits sensory or motor neurologic deficits. In such cases, neuroimaging is indicated, and the patient should be managed in consultation with neurology or neurosurgery.
Step 7: Begin the process of induction and delivery
Once the patient has been stabilized—and not before—initiate the induction process. Be aware that during and after the convulsion, changes in fetal heart rate (FHR) and uterine monitoring will usually be evident:
- prolonged deceleration or bradycardia (3–10 minutes)
- compensatory tachycardia, decreased beat-to-beat variability
- transient recurrent decelerations
- increased uterine tone and greater frequency of uterine activity.
These changes in FHR and uterine activity usually last 3 to 15 minutes. For this reason, it is important to avoid rushing the patient for cesarean delivery, as FHR and uterine activity are likely to return to normal after maternal resuscitation and stabilization. If not, consider other causes, such as abruptio placentae.
Eclampsia itself is not an indication for cesarean delivery. The selection of mode of delivery should be based on the presence or absence of labor, the cervical Bishop score, fetal gestational age, fetal presentation, and overall fetal condition.
Choosing an anesthetic
Regional analgesia/anesthesia is the method of choice for most women with eclampsia. However, regional anesthesia is to be avoided in the presence of disseminated intravascular coagulation or thrombocytopenia (the threshold platelet count is usually less than 75 x 103 µL. In such a case, IV analgesia can be used during labor, and general anesthesia may be appropriate for cesarean delivery. Both spinal and epidural analgesia and anesthesia are appropriate for women with eclampsia.
How to manage other hypertensive emergencies
A hypertensive emergency during pregnancy or postpartum involves acute-onset, persistent (>15 minutes), severe systolic BP (≥160 mm Hg) or severe diastolic BP (≥110 mm Hg), or both. The first step in such an emergency is to ensure the accurate measurement of BP using standard techniques.
Patients with acute-onset, persistent, severe BP should be hospitalized promptly for evaluation and treatment to prevent organ damage. Once such a patient is hospitalized, BP should be recorded every 15 minutes, with continuous FHR monitoring to ensure fetal viability.
Related article: Failure to diagnose preeclampsia and more (Medical Verdicts, February 2013)
The timing of initiation of antihypertensive medications, as well as determination of the type of medication best suited for the patient, should be based on:
- systolic and diastolic BP levels
- maternal clinical and laboratory findings
- presence of associated symptoms
- preexisting medical comorbidities
- whether the patient is antepartum or postpartum.
For example, a sustained BP level of 200/120 mm Hg requires therapy after 15 minutes, whereas observation may be suitable for as long as 60 minutes for a sustained BP of 160/72 mm Hg during labor.
Rapid reduction of systolic BP can lead to marked reductions in uteroplacental blood flow and a nonreassuring FHR tracing. Moreover, a rapid reduction of severe systolic BP in patients who have constricted plasma volume can reduce perfusion to the kidney, brain, and placenta. However, sustained BP of 165/100 mm Hg in association with central nervous system signs or symptoms, congestive heart failure, thrombocytopenia, or postpartum status requires therapy within 1 hour.
In general, it is difficult to obtain accurate BP recordings using noninvasive electronic instruments during labor because of the effects of labor on systolic BP and the lack of standardized methods for positioning of the arm cuff and the patient.
For these reasons, the decision about when to start acute antihypertensive therapy, based on systolic or diastolic BP, or both, should be individualized. And the choice of antihypertensive agent should be based on maternal clinical findings.
Choosing an antihypertensive agent
Because both hydralazine and nifedipine are associated with tachycardia, avoid them in patients with a heart rate above 110 bpm, using labetalol instead.10
In patients with bradycardia (heart rate <60 bpm), asthma, or congestive heart failure, however, labetalol should be avoided. In these populations, hydralazine or nifedipine is the drug of choice. Nifedipine is associated with improved renal blood flow and a resultant increase in urine output, making it preferable for patients with decreased urine output or severe postpartum hypertension.10
One theoretical concern is that the combined use of nifedipine and magnesium sulfate can cause excessive hypotension and neuromuscular blockage. As a result, some experts recommend that nifedipine be avoided in patients receiving magnesium sulfate. However, a recent review of this subject concluded that combined use of these drugs does not increase the risks of excessive hypotension and neuromuscular blockage in patients with severe hypertension or preeclampsia.
The initial dose of labetalol, when it is your chosen agent, is 20 mg IV, with BP measured 10 minutes later. If the target BP threshold is not achieved, administer 40 mg, 80 mg, and 80 mg at 10-minute intervals, as needed, again measuring BP 10 minutes after every dose. If, after a maximum dose of 240 mg, the desired BP threshold still has not been reached, give 5 to 10 mg IV hydralazine and measure BP 20 minutes later. If the target BP threshold still has not been achieved, it is essential to obtain consultation on the need for continuous infusion of labetalol, nicardipine, or sodium nitroprusside.
The initial dose of hydralazine, when it is your chosen agent, is 5 to 10 mg IV, with BP measured 20 minutes later. If needed, give another 10 mg and measure BP after another 20-minute interval. After a maximum dose of hydralazine 20 mg, switch to IV labetalol, using the regimen described above for labetalol, if the BP threshold still has not been achieved.
Nitroglycerin may be helpful in carefully selected patients
This drug is an arterial—but mostly venous—dilator. It is administered via IV infusion at an initial rate of 5 µg/min, with the rate gradually increased every 3 to 5 minutes (titrated to BP) to a maximum dose of 100 µg/min. It is the drug of choice in any hypertensive emergency associated with pulmonary edema and for control of hypertension associated with tracheal manipulation during intubation and extubation with general anesthesia.
Nitroglycerin is contraindicated in hypertensive encephalopathy because it increases cerebral blood flow and intracranial pressure. This drug should be administered only under the supervision of an experienced obstetric intensivist.
Sodium nitroprusside: Only in an ICU
This agent causes arterial and venous relaxation by interfering with the influx and intracellular activation of calcium. It is the drug of choice in hypertensive encephalopathy because it controls both afterload (vascular resistance) and preload (fluid status). It should be used only in the setting of intensive care.
The recommended dose is IV infusion at a rate of 0.25 to 5.00 µg/kg/min. Sodium nitroprusside has an immediate onset of action and may continue to exert an effect 3 to 5 minutes after discontinuation. Any hypotension caused by the drug should subside within minutes after discontinuation of the drip, due to the drug’s short half-life.
Nitroprusside is metabolized into thiocyanate and excreted in the urine. Cyanide can accumulate with large doses (>10 µg/kg/min) or prolonged administration (>48 hours), or if the patient has renal insufficiency or decreased hepatic metabolism. Signs of toxicity include anorexia, disorientation, headache, fatigue, restlessness, tinnitus, delirium, hallucinations, nausea, vomiting, and metabolic acidosis. When infused at a rate of less than 2 µg/kg/min, however, cyanide toxicity is unlikely.
As is the case with nitroglycerin, this drug should be administered only under the supervision of an experienced obstetric intensivist.
Case: Resolved
Upon arrival at the ED, the patient exhibits shallow, rapid breathing and foaming from the mouth. She is placed in a lateral decubitus position, an oral airway is established, and all secretions are suctioned. Oxygen is administered via face mask at a rate of 8 L/min. Her initial oxygen saturation level is 92%. IV access is secured, and a loading dose of magnesium sulfate 6 g is given over 20 minutes. Oxygen saturation increases to 94% to 96%. Auscultation of both lungs is normal.
The patient remains in a postictal state for about 15 minutes, but then orients to name, place, and time. FHR monitoring of both fetuses reveals a normal baseline with moderate variability, as well as variable decelerations in the presenting twin.
A maintenance dose of magnesium sulfate is initiated at a rate of 2 g/h, with the BP level recorded every 15 minutes. Systolic values remain between 170 and 180 mm Hg, and diastolic values between 108 and 112 mm Hg for 60 minutes. The obstetrician administers IV labetalol (20 mg) over 2 minutes. About 15 minutes later, the BP level is 154/100 mm Hg, with values remaining in the range of 150 to 156 mm Hg systolic and 92 to 104 mm Hg diastolic.
Ultrasonography reveals that the presenting twin is in a breech position, with estimated fetal weight below the 10th percentile and oligohydramnios. As a result, the obstetrician elects to proceed to cesarean delivery. The twins are delivered by cesarean section using spinal anesthesia. Although the infants are premature, there are no complications.Profile of an eclamptic seizure
Witnessing an eclamptic convulsion can be a frightening experience for nurses and medical providers. The convulsion usually lasts 60 to 90 seconds and occurs in two phases:
- Phase 1 (15–25 seconds) involves facial twitching, rolling of the eyes, and stiffening of the body, with generalized muscular contractions.
- Phase 2 (20–50 seconds) involves alternate contraction and relaxation of the muscles of the body in rapid succession, starting in the face and spreading throughout the body. Foaming at the mouth also occurs, and the patient may bite her tongue if it isn’t protected.
Apnea develops during and immediately after the convulsion, lasting about 120 seconds. A period of hyperventilation follows to compensate for the respiratory acidosis during the apneic period.
A postictal state follows the convulsion, and the patient usually remembers nothing of the episode. Some patients also become restless, combative, and agitated, requiring sedation. Aspiration is possible during or after the convulsion.
We want to hear from you! Tell us what you think.
- Sibai BM. Diagnosis, prevention, and management of eclampsia. Obstet Gynecol. 2005;105(2):402–410.
- Sibai BM. Diagnosis and management of gestational hypertension and preeclampsia. Obstet Gynecol. 2003;102(1):182–192.
- Meyer NL, Mercer BM, Friedman SA, Sibai BM. Urinary dipstick protein: a poor predictor of absent or severe proteinuria. Am J Obstet Gynecol. 1994;170(1 Pt 1):137–141.
- Knight M; UK Obstetric Surveillance System (UKOSS). Eclampsia in the United Kingdom 2005. BJOG. 2007;114(9):1072–1078.
- ACOG Practice Bulletin #33: Diagnosis and management of preeclampsia and eclampsia. Obstet Gynecol. 2002;99:159–167.
- Sibai BM, Stella CL. Diagnosis and management of atypical preeclampsia–eclampsia. Am J Obstet Gynecol. 2009;200(5):481.e1–e7.
- Sibai BM. Etiology and management of postpartum hypertension-preeclampsia. Am J Obstet Gynecol. 2012;206(6):470–475.
- ACOG Committee Opinion #514: Emergent therapy for acute-onset, severe hypertension with preeclampsia or eclampsia. Obstet Gynecol. 2011;118:1465–1468.
- Liu S, Joseph KS, Liston RM, et al. Incidence, risk factors, and associated complications of eclampsia. Obstet Gynecol. 2011;118(5):987–994.
- Raheem IA, Saaid R, Omar Sz, Tan PC. Oral nifedipine versus intravenous labetalol for acute blood pressure control in hypertensive emergencies of pregnancy: a randomized trial. BJOG. 2012;119(1):78–85.

Baha M. Sibai, MD
Dr. Sibai is Professor and Director of the Maternal-Fetal Medicine Fellowshp Program in the Department of Obstetrics, Gynecology, and Reproductive Sciences at the University of Texas at Houston.
Dr. Sibai reports no financial relationships relevant to this article.
Baha M. Sibai, MD
Dr. Sibai is Professor and Director of the Maternal-Fetal Medicine Fellowshp Program in the Department of Obstetrics, Gynecology, and Reproductive Sciences at the University of Texas at Houston.
Dr. Sibai reports no financial relationships relevant to this article.
Baha M. Sibai, MD
Dr. Sibai is Professor and Director of the Maternal-Fetal Medicine Fellowshp Program in the Department of Obstetrics, Gynecology, and Reproductive Sciences at the University of Texas at Houston.
Dr. Sibai reports no financial relationships relevant to this article.
CASE: MISSED PREECLAMPSIA
At her first prenatal visit at 14 weeks’ gestation, a 41-year-old woman (G2P1) presents with a dichorionic twin gestation, blood pressure (BP) of 105/68 mm Hg, and a body mass index (BMI) of 40 kg/m2. The pregnancy was achieved through in vitro fertilization. Ten years earlier, the patient’s first pregnancy was complicated by preeclampsia, requiring preterm delivery at 33 weeks’ gestation.
By 28 weeks’ gestation, the patient has gained 26 lb. Her BP is 120/70 mm Hg, with no proteinuria detected by urine dipstick. By 30 weeks, she has gained an additional 8 lb, her BP is 142/84 mm Hg, and no proteinuria is detected. At 32 weeks, her BP is 140/92 mm Hg, she has gained another 8 lb, and no proteinuria is present. She also reports new-onset headaches that do not respond to over-the-counter analgesics. She is sent to the obstetric triage area for BP monitoring, blood testing for preeclampsia and nonstress test fetal monitoring.
During the 2-hour observation period, the patient continues to report headaches, and swelling of her face and hands is present. Her systolic BP values range from 132 to 152 mm Hg, and diastolic values range from 80 to 96 mm Hg. No proteinuria is detected, blood testing results for preeclampsia (complete blood count, liver enzymes, serum creatinine, and uric acid) are normal, and the nonstress tests are reactive in both fetuses.
The patient is given a diagnosis of gestational hypertension, along with a prescription for oral labetalol 200 mg daily and two tablets of acetaminophen with codeine for the headaches (to be taken every 6 hours as needed). She is sent home with instructions to return to her physician’s office in 1 week.
Two days later, she wakes in the middle of the night with a severe headache, blurred vision, and vomiting. Her husband calls the obstetrician’s answering service and is instructed to call 911 immediately. While waiting for an ambulance, the patient experiences a grand mal eclamptic convulsion. A second convulsion occurs during her transfer to the ED.
This scenario could have been avoided.
The obstetrician in this case was negligent for failing to recognize preeclampsia in a patient who had two clear risk factors for it: multifetal gestation and a history of early-onset (<37 weeks) preeclampsia in an earlier pregnancy (other risk factors are listed in TABLE 1).
As a result, the patient developed eclampsia, a serious condition that can lead to grave maternal complications (TABLE 2), including death. It also can cause fetal complications, including growth restriction, hypoxia, acidosis, preterm birth, long-term developmental deficits, and death.1,2
The obstetrician in this case also overlooked published evidence indicating that, in the setting of hypertension and headaches, as many as 20% to 30% of pregnant women whose tests for proteinuria show a negative or trace result via dipstick will develop eclampsia.3 Instead of initiating outpatient administration of oral antihypertensive agents, the obstetrician should have hospitalized this patient for at least 48 hours, with steroid administration, to determine whether outpatient management was feasible.
Related article: 10 practical, evidence-based recommendations to improve outcomes in women who have eclampsia Baha Sibai, MD (November 2011)
Defining eclampsia
Eclampsia is marked by the onset of convulsions (during pregnancy or postpartum) in association with gestational hypertension alone, proteinuria, preeclampsia, or superimposed preeclampsia. Although it is rare, eclampsia is potentially life-threatening. For that reason, obstetricians, anesthesiologists, ED physicians, neurologists, and critical-care physicians should be well versed in its diagnosis and management. In this article, I focus on management.
A few preliminary points
Eclampsia can develop any time during the antenatal period (>16 weeks’ gestation), during labor and delivery, and as long as 6 weeks after delivery. Therefore, we should be vigilant for preeclampsia whenever a pregnant patient visits our office, as well as when she makes unscheduled visits to the ED or obstetric triage area or is hospitalized.
Early recognition of women at high risk for preeclampsia and eclampsia may allow for prompt intervention, including early hospitalization for close observation prior to delivery and postpartum.1,2,4–10
Hospitalization of high-risk women allows for use of antihypertensive agents to treat severe BP, administration of magnesium sulfate to prevent convulsions, and timely delivery of the infant. It also allows for intensive maternal support during and after an eclamptic seizure.
Hospitalization is essential for women who exhibit features that suggest severe disease. More specifically, the presence of gestational hypertension with any of the following features is an indication for immediate hospitalization for evaluation and management:
- persistent severe hypertension (systolic
BP ≥160 mm Hg or diastolic BP ≥110 mm Hg) for at least 1 hour - gestational hypertension requiring oral antihypertensive therapy
- progressive and excessive weight gain (≥20 lb prior to 28 weeks’ gestation)
- generalized swelling (edema of hands or face)
- new-onset or persistent headaches despite analgesics
- persistent visual changes (blurred vision, scotomata, photophobia, double vision)
- shortness of breath, dyspnea, orthopnea, or tightness in the chest
- persistent retrosternal chest pain, severe epigastric or right upper quadrant pain
- persistent nausea, vomiting, malaise
- altered mental state, confusion, numbness, tingling, or motor weakness
- platelet count below 100 3 103 µL
- aspartate aminotransferase (AST), alanine aminotransferase (ALT), or lactic acid dehydrogenase (LDH) levels more than twice the upper limit of normal
- serum creatinine level >1.1 mg/dL
- suspected abruptio placentae.
A stepwise approach to eclampsia
Eclampsia is an obstetric emergency. Inadequate preparation for it or an inappropriate response to maternal and fetal conditions during and after an eclamptic convulsion can be detrimental to the mother and fetus. All obstetric units should have up-to-date protocols in place and should conduct mandatory drills to prepare nursing staff, obstetric providers, and anesthesia staff working in these units to manage eclampsia.
Step 1: Let the seizure run its course
During a seizure, resist the impulse to administer anticonvulsive drugs, including intravenous (IV) magnesium sulfate, because most eclamptic convulsions are self-limiting. Also abstain from administering medications such as IV phenytoin, diazepam, or midazolam, as these drugs are less effective than magnesium sulfate, and some can suppress the laryngeal reflex, increasing the risk of aspiration.
If the patient develops status epilepticus, initiate muscle paralysis and intubate her.
Step 2: Support the maternal condition
It is vital to support maternal respiratory and cardiovascular functions to prevent hypoxia, acidosis, and cardiorespiratory arrest.
Begin by establishing airway patency and maternal oxygenation during and after the convulsion. Administer oxygen via a face mask, with or without a reservoir, at a rate of 8 to 10 L/min.
During the apneic period (see “Profile of an eclamptic seizure” on page 46), the patient will develop hypoxia. Use pulse oximetry to monitor oxygen saturation, with the goal of keeping it above 94%. Arterial blood gas analysis is required if oxygen saturation remains below 92% or if pulmonary edema or aspiration is suspected.
If the patient develops recurrent seizures, status epilepticus, florid alveolar pulmonary edema, or respiratory arrest, intubate her immediately.
Step 3: Prevent maternal injury and aspiration
Secure the side rails of the patient’s bed by elevating them to prevent a fall, and make sure they are padded to prevent trauma during convulsions and afterward, when some women become combative and agitated. Position the patient in a lateral decubitus position to minimize aspiration of oral secretions. If any secretions or vomitus are present, remove them via suction.
Step 4: After the convulsion, give magnesium sulfate
Magnesium is the drug of choice for seizure prophylaxis in women with preeclampsia and severe symptoms, and to prevent recurrent seizures in women with eclampsia.
In the latter group, once the eclamptic convulsion has ended, give a loading dose of IV magnesium (6 g/100 mL over 20 minutes), followed by a continuous infusion of 2 g/h for at least 24 hours. If the patient develops a second seizure during the maintenance infusion, administer another bolus of magnesium (2 g/100 mL over 3–5 minutes).
Step 5: Treat severe hypertension
If severe hypertension persists for 60 minutes or longer, it can lead to injury of the brain, heart, and kidneys. To avoid these complications, it is essential to reduce BP to a safe range and maintain that level without compromising cerebral perfusion pressure and uteroplacental blood flow (which already may be reduced in some patients).
The goal of antihypertensive therapy is to keep systolic BP between 140 and 155 mm Hg and diastolic values between 90 and 105 mm Hg.9 Several agents are available for the treatment of severe hypertension during pregnancy and postpartum. The most commonly used IV medications for this purpose are labetalol and hydralazine. Another option is oral, rapidly acting
nifedipine.
Several randomized trials have compared efficacy and side effects between IV bolus injections of hydralazine; IV labetalol; and oral, rapidly acting nifedipine. In general, the findings of these studies suggest that either IV hydralazine or labetalol or oral nifedipine can be used to treat severe hypertension in pregnancy, as long as the provider is familiar with the dose to be used, the expected onset of action, and potential side effects (TABLE 3).
Women who develop generalized swelling or hemoconcentration (hematocrit ≥40%), or both, usually experience markedly reduced plasma volume. For this reason, these women will benefit from treatment with labetalol. If this is ineffective, then add IV hydralazine. However, delay administration of a rapidly acting vasodilator such as hydralazine to prevent an excessive hypotensive response and a secondary reduction in tissue perfusion and uteroplacental blood flow. Rather, administer a bolus infusion of 250 to 500 mL of isotonic saline before giving a vasodilator.
Additional details about the use of antihypertensive drugs are given in the section on other hypertensive emergencies below.
Step 6: Evaluate the patient for complications
Pulmonary edema can develop in patients with eclampsia or another hypertensive emergency. Suspect it if the patient has respiratory symptoms in association with tachypnea, tachycardia, or sustained oxygen saturation values below 93%, as well as when the patient exhibits basal rales during auscultation of the lungs. Treatment involves the administration of oxygen and IV furosemide (20–40 mg push), repeated as needed.
Some women with eclampsia may develop severe cerebral edema, hemorrhage, or both. The edema can be vasogenic or cytotoxic, leading to increased intracerebral pressure. Suspect edema or hemorrhage if the patient remains unresponsive, continues to experience convulsions despite therapy, or exhibits sensory or motor neurologic deficits. In such cases, neuroimaging is indicated, and the patient should be managed in consultation with neurology or neurosurgery.
Step 7: Begin the process of induction and delivery
Once the patient has been stabilized—and not before—initiate the induction process. Be aware that during and after the convulsion, changes in fetal heart rate (FHR) and uterine monitoring will usually be evident:
- prolonged deceleration or bradycardia (3–10 minutes)
- compensatory tachycardia, decreased beat-to-beat variability
- transient recurrent decelerations
- increased uterine tone and greater frequency of uterine activity.
These changes in FHR and uterine activity usually last 3 to 15 minutes. For this reason, it is important to avoid rushing the patient for cesarean delivery, as FHR and uterine activity are likely to return to normal after maternal resuscitation and stabilization. If not, consider other causes, such as abruptio placentae.
Eclampsia itself is not an indication for cesarean delivery. The selection of mode of delivery should be based on the presence or absence of labor, the cervical Bishop score, fetal gestational age, fetal presentation, and overall fetal condition.
Choosing an anesthetic
Regional analgesia/anesthesia is the method of choice for most women with eclampsia. However, regional anesthesia is to be avoided in the presence of disseminated intravascular coagulation or thrombocytopenia (the threshold platelet count is usually less than 75 x 103 µL. In such a case, IV analgesia can be used during labor, and general anesthesia may be appropriate for cesarean delivery. Both spinal and epidural analgesia and anesthesia are appropriate for women with eclampsia.
How to manage other hypertensive emergencies
A hypertensive emergency during pregnancy or postpartum involves acute-onset, persistent (>15 minutes), severe systolic BP (≥160 mm Hg) or severe diastolic BP (≥110 mm Hg), or both. The first step in such an emergency is to ensure the accurate measurement of BP using standard techniques.
Patients with acute-onset, persistent, severe BP should be hospitalized promptly for evaluation and treatment to prevent organ damage. Once such a patient is hospitalized, BP should be recorded every 15 minutes, with continuous FHR monitoring to ensure fetal viability.
Related article: Failure to diagnose preeclampsia and more (Medical Verdicts, February 2013)
The timing of initiation of antihypertensive medications, as well as determination of the type of medication best suited for the patient, should be based on:
- systolic and diastolic BP levels
- maternal clinical and laboratory findings
- presence of associated symptoms
- preexisting medical comorbidities
- whether the patient is antepartum or postpartum.
For example, a sustained BP level of 200/120 mm Hg requires therapy after 15 minutes, whereas observation may be suitable for as long as 60 minutes for a sustained BP of 160/72 mm Hg during labor.
Rapid reduction of systolic BP can lead to marked reductions in uteroplacental blood flow and a nonreassuring FHR tracing. Moreover, a rapid reduction of severe systolic BP in patients who have constricted plasma volume can reduce perfusion to the kidney, brain, and placenta. However, sustained BP of 165/100 mm Hg in association with central nervous system signs or symptoms, congestive heart failure, thrombocytopenia, or postpartum status requires therapy within 1 hour.
In general, it is difficult to obtain accurate BP recordings using noninvasive electronic instruments during labor because of the effects of labor on systolic BP and the lack of standardized methods for positioning of the arm cuff and the patient.
For these reasons, the decision about when to start acute antihypertensive therapy, based on systolic or diastolic BP, or both, should be individualized. And the choice of antihypertensive agent should be based on maternal clinical findings.
Choosing an antihypertensive agent
Because both hydralazine and nifedipine are associated with tachycardia, avoid them in patients with a heart rate above 110 bpm, using labetalol instead.10
In patients with bradycardia (heart rate <60 bpm), asthma, or congestive heart failure, however, labetalol should be avoided. In these populations, hydralazine or nifedipine is the drug of choice. Nifedipine is associated with improved renal blood flow and a resultant increase in urine output, making it preferable for patients with decreased urine output or severe postpartum hypertension.10
One theoretical concern is that the combined use of nifedipine and magnesium sulfate can cause excessive hypotension and neuromuscular blockage. As a result, some experts recommend that nifedipine be avoided in patients receiving magnesium sulfate. However, a recent review of this subject concluded that combined use of these drugs does not increase the risks of excessive hypotension and neuromuscular blockage in patients with severe hypertension or preeclampsia.
The initial dose of labetalol, when it is your chosen agent, is 20 mg IV, with BP measured 10 minutes later. If the target BP threshold is not achieved, administer 40 mg, 80 mg, and 80 mg at 10-minute intervals, as needed, again measuring BP 10 minutes after every dose. If, after a maximum dose of 240 mg, the desired BP threshold still has not been reached, give 5 to 10 mg IV hydralazine and measure BP 20 minutes later. If the target BP threshold still has not been achieved, it is essential to obtain consultation on the need for continuous infusion of labetalol, nicardipine, or sodium nitroprusside.
The initial dose of hydralazine, when it is your chosen agent, is 5 to 10 mg IV, with BP measured 20 minutes later. If needed, give another 10 mg and measure BP after another 20-minute interval. After a maximum dose of hydralazine 20 mg, switch to IV labetalol, using the regimen described above for labetalol, if the BP threshold still has not been achieved.
Nitroglycerin may be helpful in carefully selected patients
This drug is an arterial—but mostly venous—dilator. It is administered via IV infusion at an initial rate of 5 µg/min, with the rate gradually increased every 3 to 5 minutes (titrated to BP) to a maximum dose of 100 µg/min. It is the drug of choice in any hypertensive emergency associated with pulmonary edema and for control of hypertension associated with tracheal manipulation during intubation and extubation with general anesthesia.
Nitroglycerin is contraindicated in hypertensive encephalopathy because it increases cerebral blood flow and intracranial pressure. This drug should be administered only under the supervision of an experienced obstetric intensivist.
Sodium nitroprusside: Only in an ICU
This agent causes arterial and venous relaxation by interfering with the influx and intracellular activation of calcium. It is the drug of choice in hypertensive encephalopathy because it controls both afterload (vascular resistance) and preload (fluid status). It should be used only in the setting of intensive care.
The recommended dose is IV infusion at a rate of 0.25 to 5.00 µg/kg/min. Sodium nitroprusside has an immediate onset of action and may continue to exert an effect 3 to 5 minutes after discontinuation. Any hypotension caused by the drug should subside within minutes after discontinuation of the drip, due to the drug’s short half-life.
Nitroprusside is metabolized into thiocyanate and excreted in the urine. Cyanide can accumulate with large doses (>10 µg/kg/min) or prolonged administration (>48 hours), or if the patient has renal insufficiency or decreased hepatic metabolism. Signs of toxicity include anorexia, disorientation, headache, fatigue, restlessness, tinnitus, delirium, hallucinations, nausea, vomiting, and metabolic acidosis. When infused at a rate of less than 2 µg/kg/min, however, cyanide toxicity is unlikely.
As is the case with nitroglycerin, this drug should be administered only under the supervision of an experienced obstetric intensivist.
Case: Resolved
Upon arrival at the ED, the patient exhibits shallow, rapid breathing and foaming from the mouth. She is placed in a lateral decubitus position, an oral airway is established, and all secretions are suctioned. Oxygen is administered via face mask at a rate of 8 L/min. Her initial oxygen saturation level is 92%. IV access is secured, and a loading dose of magnesium sulfate 6 g is given over 20 minutes. Oxygen saturation increases to 94% to 96%. Auscultation of both lungs is normal.
The patient remains in a postictal state for about 15 minutes, but then orients to name, place, and time. FHR monitoring of both fetuses reveals a normal baseline with moderate variability, as well as variable decelerations in the presenting twin.
A maintenance dose of magnesium sulfate is initiated at a rate of 2 g/h, with the BP level recorded every 15 minutes. Systolic values remain between 170 and 180 mm Hg, and diastolic values between 108 and 112 mm Hg for 60 minutes. The obstetrician administers IV labetalol (20 mg) over 2 minutes. About 15 minutes later, the BP level is 154/100 mm Hg, with values remaining in the range of 150 to 156 mm Hg systolic and 92 to 104 mm Hg diastolic.
Ultrasonography reveals that the presenting twin is in a breech position, with estimated fetal weight below the 10th percentile and oligohydramnios. As a result, the obstetrician elects to proceed to cesarean delivery. The twins are delivered by cesarean section using spinal anesthesia. Although the infants are premature, there are no complications.Profile of an eclamptic seizure
Witnessing an eclamptic convulsion can be a frightening experience for nurses and medical providers. The convulsion usually lasts 60 to 90 seconds and occurs in two phases:
- Phase 1 (15–25 seconds) involves facial twitching, rolling of the eyes, and stiffening of the body, with generalized muscular contractions.
- Phase 2 (20–50 seconds) involves alternate contraction and relaxation of the muscles of the body in rapid succession, starting in the face and spreading throughout the body. Foaming at the mouth also occurs, and the patient may bite her tongue if it isn’t protected.
Apnea develops during and immediately after the convulsion, lasting about 120 seconds. A period of hyperventilation follows to compensate for the respiratory acidosis during the apneic period.
A postictal state follows the convulsion, and the patient usually remembers nothing of the episode. Some patients also become restless, combative, and agitated, requiring sedation. Aspiration is possible during or after the convulsion.
We want to hear from you! Tell us what you think.
- Sibai BM. Diagnosis, prevention, and management of eclampsia. Obstet Gynecol. 2005;105(2):402–410.
- Sibai BM. Diagnosis and management of gestational hypertension and preeclampsia. Obstet Gynecol. 2003;102(1):182–192.
- Meyer NL, Mercer BM, Friedman SA, Sibai BM. Urinary dipstick protein: a poor predictor of absent or severe proteinuria. Am J Obstet Gynecol. 1994;170(1 Pt 1):137–141.
- Knight M; UK Obstetric Surveillance System (UKOSS). Eclampsia in the United Kingdom 2005. BJOG. 2007;114(9):1072–1078.
- ACOG Practice Bulletin #33: Diagnosis and management of preeclampsia and eclampsia. Obstet Gynecol. 2002;99:159–167.
- Sibai BM, Stella CL. Diagnosis and management of atypical preeclampsia–eclampsia. Am J Obstet Gynecol. 2009;200(5):481.e1–e7.
- Sibai BM. Etiology and management of postpartum hypertension-preeclampsia. Am J Obstet Gynecol. 2012;206(6):470–475.
- ACOG Committee Opinion #514: Emergent therapy for acute-onset, severe hypertension with preeclampsia or eclampsia. Obstet Gynecol. 2011;118:1465–1468.
- Liu S, Joseph KS, Liston RM, et al. Incidence, risk factors, and associated complications of eclampsia. Obstet Gynecol. 2011;118(5):987–994.
- Raheem IA, Saaid R, Omar Sz, Tan PC. Oral nifedipine versus intravenous labetalol for acute blood pressure control in hypertensive emergencies of pregnancy: a randomized trial. BJOG. 2012;119(1):78–85.
Etiquette‐Based Medicine Among Interns
Patient‐centered communication may impact several aspects of the patientdoctor relationship including patient disclosure of illness‐related information, patient satisfaction, anxiety, and compliance with medical recommendations.[1, 2, 3, 4] Etiquette‐based medicine, a term coined by Kahn, involves simple patient‐centered communication strategies that convey professionalism and respect to patients.[5] Studies have confirmed that patients prefer physicians who practice etiquette‐based medicine behaviors, including sitting down and introducing one's self.[6, 7, 8, 9] Performance of etiquette‐based medicine is associated with higher Press Ganey patient satisfaction scores. However, these easy‐to‐practice behaviors may not be modeled commonly in the inpatient setting.[10] We sought to understand whether etiquette‐based communication behaviors are practiced by trainees on inpatient medicine rotations.
METHODS
Design
This was a prospective study incorporating direct observation of intern interactions with patients during January 2012 at 2 internal medicine residency programs in Baltimore Maryland, Johns Hopkins Hospital (JHH) and the University of Maryland Medical Center (UMMC). We then surveyed participants from JHH in June 2012 to assess perceptions of their practice of etiquette‐based communication.
Participants and Setting
We observed a convenience sample of 29 internal medicine interns from the 2 institutions. We sought to observe interns over an equal number of hours at both sites and to sample shifts in proportion to the amount of time interns spend on each of these shifts. All interns who were asked to participate in the study agreed and comprised a total of 27% of the 108 interns in the 2 programs. The institutional review board at Johns Hopkins School of Medicine approved the study; the University of Maryland institutional review board deemed it not human subjects research. All observed interns provided informed consent to be observed during 1 to 4 inpatient shifts.
Observers
Twenty‐two undergraduate university students served as the observers for the study and were trained to collect data with the iPod Touch (Apple, Cupertino, CA) without interrupting patient care. We then tested the observers to ensure 85% concordance rate with the researchers in mock observation. Four hours of quality assurance were completed at both institutions during the study. Congruence between observer and research team member was >85% for each hour of observation.
Observation
Observers recorded intern activities on the iPod Touch spreadsheet application. The application allowed for real‐time data entry and direct export of results. The primary dependent variables for this study were 5 behaviors that were assessed each time an intern went into a patient's room. The 5 observed behaviors included (1) introducing one's self, (2) introducing one's role on the medical team, (3) touching the patient, (4) sitting down, and (5) asking the patient at least 1 open‐ended question. These behaviors were chosen for observation because they are central to Kahn's framework of etiquette‐based medicine, applicable to each inpatient encounter, and readily observed by trained nonmedical observers. These behaviors are defined in Table 1. Use of open‐ended questions was observed as a more general form of Kahn's recommendation to ask how the patient is feeling. Interns were not aware of which behaviors were being evaluated.
| Behavior | Definition |
|---|---|
| Introduced self | Providing a name |
| Introduced role | Uses term doctor, resident, intern, or medical team |
| Sat down | Sitting on the bed, in a chair, or crouching if no chair was available during at least part of the encounter |
| Touched the patient | Any form of physical contact that occurred at least once during the encounter including shaking a patient's hand, touching a patient on the shoulder, or performing any part of the physical exam |
| Asked open‐ended question | Asked the patient any question that required more than a yes/no answer |
Each time an observed intern entered a patient room, the observer recorded whether or not each of the 5 behaviors was performed, coded as a dichotomous variable. Although data collection was anonymous, observers recorded the team, hospital site, gender of the intern, and whether the intern was admitting new patients during the shift.
Survey
Following the observational portion of the study, participants at JHH completed a cross‐sectional, anonymous survey that asked them to estimate how frequently they currently performed each of the behaviors observed in this study. Response options included the following categories: 20%, 20% to 40%, 40% to 60%, 60% to 80%, or 80% to 100%.
Data Analysis
We determined the percent of patient visits during which each behavior was performed. Data were analyzed using Student t and [2] tests evaluating differences by hospital, intern gender, type of shift, and time of day. To account for correlation within subjects and observers, we performed multilevel logistic regression analysis adjusted for clustering at the intern and observer levels. For the survey analysis, the mean of the response category was used as the basis for comparison. All quantitative analyses were performed in Excel 2010 (Microsoft Corp., Redmond, WA) and Stata/IC version 11 (StataCorp, College Station, TX).
RESULTS
A total of 732 inpatient encounters were observed during 118 intern shifts. Interns were observed for a mean of 25 patient encounters each (range, 361; standard deviation [SD] 17). Overall, interns introduced themselves 40% of the time and stated their role 37% of the time (Table 2). Interns touched patients on 65% of visits, sat down with patients during 9% of visits, and asked open‐ended questions on 75% of visits. Interns performed all 5 of the behaviors during 4% of the total encounters. The percentage of the 5 behaviors performed by each intern during all observed visits ranged from 24% to 100%, with a mean of 51% (SD 17%) per intern.
| Total Encounters, N (%) | Introduced Self (%) | Introduced Role (%) | Touched Patient (%) | Sat Down (%) | Open‐Ended Question (%) | |
|---|---|---|---|---|---|---|
| ||||||
| Overall | 732 | 40 | 37 | 65 | 9 | 75 |
| JHH | 373 (51) | 35ab | 29ab | 62a | 10 | 70a |
| UMMC | 359 (49) | 45 | 44 | 69 | 8 | 81 |
| Male | 284 (39) | 39 | 35 | 64 | 9 | 74 |
| Female | 448 (61) | 41 | 38 | 67 | 10 | 76 |
| Day shift | 551 (75) | 37a | 34a | 65 | 9 | 77 |
| Night shift | 181 (25) | 48 | 45 | 67 | 12 | 71 |
| Admitting shift | 377 (52) | 46a | 42a | 63 | 10 | 75 |
| Nonadmitting shift | 355 (48) | 34 | 30 | 69 | 9 | 76 |
During night shifts as compared to day shifts, interns were more likely to introduce themselves (48% vs 37%, P=0.01) and their role (45% vs 34%, P0.01). During shifts in which they admitted patients as compared to coverage shifts, interns were more likely to introduce themselves (46% vs 34%, P0.01) and their role (42% vs 30%, P0.01). Interns at UMMC as compared to JHH interns were more likely to introduce themselves (45% vs 35%, P0.01) and describe their role to patients (44% vs 29%, P0.01). Interns at UMMC were also more likely to ask open‐ended questions (81% vs 70%, P0.01) and to touch patients (69% vs 62%, P=0.04). Performance of these behaviors did not vary significantly by gender, time of day, or shift. After adjustment for clustering at the observer and intern levels, differences by institution persisted in the rate of introducing oneself and one's role.
We performed a sensitivity analysis examining the first patient encounters of the day, and found that interns were somewhat more likely to introduce themselves (50% vs 40%, P=0.03) but were not significantly more likely to introduce their role, sit down, ask open‐ended questions, or touch the patient.
Nine of the 10 interns at JHH who participated in the study completed the survey (response rate=90%). Interns estimated introducing themselves and their role and sitting with patients significantly more frequently than was observed (80% vs 40%, P0.01; 80% vs 37%, P0.01; and 58% vs 9%, P0.01, respectively) (Figure 1).

DISCUSSION
The interns we observed in 2 urban academic internal medicine residency programs did not routinely practice etiquette‐based communication. Interns surveyed tended to overestimate their performance of these behaviors. These behaviors are simple to perform and are each associated with improved patient experiences of hospital care. Tackett et al. recently demonstrated that interns are not alone. Hospitalist physicians do not universally practice etiquette‐based medicine, even though these behaviors correlate with patient satisfaction scores.[10]
Introducing oneself to patients may improve patient satisfaction and acceptance of trainee involvement in care.[6] However, only 10% of hospitalized patients in 1 study correctly identified a physician on their inpatient team, demonstrating the need for introductions during each and every inpatient encounter.[11] The interns we observed introduced themselves to patients in only 40% of encounters. During admitting shifts, when the first encounter with a patient likely took place, interns introduced themselves during 46% of encounters.
A comforting touch has been shown to reduce anxiety levels among patients and improve compliance with treatment regimens, but the interns did not touch patients in one‐third of visits, including during admitting shifts. Sixty‐six percent of patients consider a physician's touch comforting, and 58% believe it to be healing.[8]
A randomized trial found that most patients preferred a sitting physician, and believed that practitioners who sat were more compassionate and spent more time with them.[9] Unfortunately, interns sat down with patients in fewer than 10% of encounters.
We do not know why interns do not engage in these simple behaviors, but it is not surprising given that their role models, including hospitalist physicians, do not practice them universally.[10] Personality differences, medical school experiences, and hospital factors such as patient volume and complexity may explain variability in performance.
Importantly, we know that habits learned in residency tend to be retained when physicians enter independent practice.[12] If we want attending physicians to practice etiquette‐based communication, then it must be role modeled, taught, and evaluated during residency by clinical educators and hospitalist physicians. The gap between intern perceptions and actual practice of these behaviors provides a window of opportunity for education and feedback in bedside communication. Attending physicians rate communication skills as 1 of the top values they seek to pass on to house officers.[13] Curricula on communication skills improve physician attitudes and beliefs about the importance of good communication as well as long‐term performance of communication skills.[14]
Our study had several limitations. First, all 732 patient encounters were assessed, regardless of whether the intern had seen the patient previously. This differed slightly from Kahn's assertion that these behaviors be performed at least on the first encounter with the patient. We believe that the need for common courtesy does not diminish after the first visit, and although certain behaviors may not be indicated on 100% of visits, our sensitivity analysis indicated performance of these behaviors was not likely even on the first visit of the day.
Second, our observations were limited to medicine interns at 2 programs in Baltimore during a single month, limiting generalizability. A convenience sample of interns was chosen for recruitment based on rotation on a general medicine rotation during the study month. We observed interns over the course of several shifts and throughout various positions in the call cycle.
Third, in any observational study, the Hawthorne effect is a potential limitation. We attempted to limit this bias by collecting information anonymously and not indicating to the interns which aspects of the patient encounter were being recorded.
Fourth, we defined the behaviors broadly in an attempt to measure the outcomes conservatively and maximize inter‐rater reliability. For instance, we did not differentiate in data collection between comforting touch and physical examination. Because chairs may not be readily available in all patient rooms, we included sitting on the patient's bed or crouching next to the bed as sitting with the patient. Use of open‐ended questions was observed as a more general form of Kahn's recommendation to ask how the patient is feeling.
Fifth, our poststudy survey was conducted 6 months after the observations were performed, used an ordinal rather than continuous response scale, and was limited to only 1 of the 2 programs and 9 of the 29 participants. Given this small sample size, generalizability of the results is limited. Additionally, intern practice of etiquette‐based communication may have improved between the observations and survey that took place 6 months later.
As hospital admissions are a time of vulnerability for patients, physicians can take a basic etiquette‐based communication approach to comfort patients and help them feel more secure. We found that even though interns believed they were practicing Kahn's recommended etiquette‐based communication, only a minority actually were. Curricula on communication styles or environmental changes, such as providing chairs in patient rooms or photographs identifying members of the medical team, may encourage performance of these behaviors.[15]
Acknowledgments
The authors acknowledge Dr. Lisa Cooper, MD, MPH, and Dr. Mary Catherine Beach, MD, MPH, who provided tremendous help in editing. The authors also thank Kevin Wang, whose assistance with observer hiring, training, and management was essential.
Disclosures: The Osler Center for Clinical Excellence at Johns Hopkins and the Johns Hopkins Hospitalist Scholars Fund provided stipends for our observers as well as transportation and logistical costs of the study. The authors report no conflicts of interest.
- , , . Physician‐patient communication in the primary care office: a systematic review. J Am Board Fam Pract. 2002;15:25–38.
- , . Physicians' nonverbal rapport building and patients' talk about the subjective component of illness. Hum Commun Res. 2001;27:299–311.
- , , , , . Can 40 seconds of compassion reduce patient anxiety? J Clin Oncol. 1999;17:371–379.
- , , , . House staff nonverbal communication skills and patient satisfaction. J Gen Intern Med. 2003;18:170–174.
- . Etiquette‐based medicine. N Engl J Med. 2008;358:1988–1989.
- , , . Patient satisfaction associated with correct identification of physician's photographs. Mayo Clin Proc. 2001;76:604–608.
- . Effective physician‐patient communication and health outcomes: a review. CMAJ. 1995;152:1423–1433.
- , , , . Patients' attitudes to comforting touch in family practice. Can Fam Physician. 2000;46:2411–2416.
- , , , et al. Impact of physician sitting versus standing during inpatient oncology consultations: patients' preference and perception of compassion and duration. A randomized controlled trial. J Pain Symptom Manage. 2005;29:489–497.
- , , , , . Appraising the practice of etiquette‐based medicine in the inpatient setting. J Gen Intern Med. 2013;28(7):908–913.
- , , , , , . Ability of hospitalized patients to identify their in‐hospital physicians. Arch Intern Med. 2009;169:199–201.
- , , . The content of internal medicine residency training and its relevance to the practice of medicine. J Gen Intern Med. 1989;4:304–308.
- , . Which values to attending physicians try to pass on to house officers? Med Educ. 2001;35:941–945.
- , , , , , . Relationship of resident characteristics, attitudes, prior training, and clinical knowledge to communication skills performance. Med Educ. 2006;40:18–25.
- , , , . PHACES (Photographs of academic clinicians and their educational status): a tool to improve delivery of family‐centered care. Acad Pediatr. 2010;10:138–145.
Patient‐centered communication may impact several aspects of the patientdoctor relationship including patient disclosure of illness‐related information, patient satisfaction, anxiety, and compliance with medical recommendations.[1, 2, 3, 4] Etiquette‐based medicine, a term coined by Kahn, involves simple patient‐centered communication strategies that convey professionalism and respect to patients.[5] Studies have confirmed that patients prefer physicians who practice etiquette‐based medicine behaviors, including sitting down and introducing one's self.[6, 7, 8, 9] Performance of etiquette‐based medicine is associated with higher Press Ganey patient satisfaction scores. However, these easy‐to‐practice behaviors may not be modeled commonly in the inpatient setting.[10] We sought to understand whether etiquette‐based communication behaviors are practiced by trainees on inpatient medicine rotations.
METHODS
Design
This was a prospective study incorporating direct observation of intern interactions with patients during January 2012 at 2 internal medicine residency programs in Baltimore Maryland, Johns Hopkins Hospital (JHH) and the University of Maryland Medical Center (UMMC). We then surveyed participants from JHH in June 2012 to assess perceptions of their practice of etiquette‐based communication.
Participants and Setting
We observed a convenience sample of 29 internal medicine interns from the 2 institutions. We sought to observe interns over an equal number of hours at both sites and to sample shifts in proportion to the amount of time interns spend on each of these shifts. All interns who were asked to participate in the study agreed and comprised a total of 27% of the 108 interns in the 2 programs. The institutional review board at Johns Hopkins School of Medicine approved the study; the University of Maryland institutional review board deemed it not human subjects research. All observed interns provided informed consent to be observed during 1 to 4 inpatient shifts.
Observers
Twenty‐two undergraduate university students served as the observers for the study and were trained to collect data with the iPod Touch (Apple, Cupertino, CA) without interrupting patient care. We then tested the observers to ensure 85% concordance rate with the researchers in mock observation. Four hours of quality assurance were completed at both institutions during the study. Congruence between observer and research team member was >85% for each hour of observation.
Observation
Observers recorded intern activities on the iPod Touch spreadsheet application. The application allowed for real‐time data entry and direct export of results. The primary dependent variables for this study were 5 behaviors that were assessed each time an intern went into a patient's room. The 5 observed behaviors included (1) introducing one's self, (2) introducing one's role on the medical team, (3) touching the patient, (4) sitting down, and (5) asking the patient at least 1 open‐ended question. These behaviors were chosen for observation because they are central to Kahn's framework of etiquette‐based medicine, applicable to each inpatient encounter, and readily observed by trained nonmedical observers. These behaviors are defined in Table 1. Use of open‐ended questions was observed as a more general form of Kahn's recommendation to ask how the patient is feeling. Interns were not aware of which behaviors were being evaluated.
| Behavior | Definition |
|---|---|
| Introduced self | Providing a name |
| Introduced role | Uses term doctor, resident, intern, or medical team |
| Sat down | Sitting on the bed, in a chair, or crouching if no chair was available during at least part of the encounter |
| Touched the patient | Any form of physical contact that occurred at least once during the encounter including shaking a patient's hand, touching a patient on the shoulder, or performing any part of the physical exam |
| Asked open‐ended question | Asked the patient any question that required more than a yes/no answer |
Each time an observed intern entered a patient room, the observer recorded whether or not each of the 5 behaviors was performed, coded as a dichotomous variable. Although data collection was anonymous, observers recorded the team, hospital site, gender of the intern, and whether the intern was admitting new patients during the shift.
Survey
Following the observational portion of the study, participants at JHH completed a cross‐sectional, anonymous survey that asked them to estimate how frequently they currently performed each of the behaviors observed in this study. Response options included the following categories: 20%, 20% to 40%, 40% to 60%, 60% to 80%, or 80% to 100%.
Data Analysis
We determined the percent of patient visits during which each behavior was performed. Data were analyzed using Student t and [2] tests evaluating differences by hospital, intern gender, type of shift, and time of day. To account for correlation within subjects and observers, we performed multilevel logistic regression analysis adjusted for clustering at the intern and observer levels. For the survey analysis, the mean of the response category was used as the basis for comparison. All quantitative analyses were performed in Excel 2010 (Microsoft Corp., Redmond, WA) and Stata/IC version 11 (StataCorp, College Station, TX).
RESULTS
A total of 732 inpatient encounters were observed during 118 intern shifts. Interns were observed for a mean of 25 patient encounters each (range, 361; standard deviation [SD] 17). Overall, interns introduced themselves 40% of the time and stated their role 37% of the time (Table 2). Interns touched patients on 65% of visits, sat down with patients during 9% of visits, and asked open‐ended questions on 75% of visits. Interns performed all 5 of the behaviors during 4% of the total encounters. The percentage of the 5 behaviors performed by each intern during all observed visits ranged from 24% to 100%, with a mean of 51% (SD 17%) per intern.
| Total Encounters, N (%) | Introduced Self (%) | Introduced Role (%) | Touched Patient (%) | Sat Down (%) | Open‐Ended Question (%) | |
|---|---|---|---|---|---|---|
| ||||||
| Overall | 732 | 40 | 37 | 65 | 9 | 75 |
| JHH | 373 (51) | 35ab | 29ab | 62a | 10 | 70a |
| UMMC | 359 (49) | 45 | 44 | 69 | 8 | 81 |
| Male | 284 (39) | 39 | 35 | 64 | 9 | 74 |
| Female | 448 (61) | 41 | 38 | 67 | 10 | 76 |
| Day shift | 551 (75) | 37a | 34a | 65 | 9 | 77 |
| Night shift | 181 (25) | 48 | 45 | 67 | 12 | 71 |
| Admitting shift | 377 (52) | 46a | 42a | 63 | 10 | 75 |
| Nonadmitting shift | 355 (48) | 34 | 30 | 69 | 9 | 76 |
During night shifts as compared to day shifts, interns were more likely to introduce themselves (48% vs 37%, P=0.01) and their role (45% vs 34%, P0.01). During shifts in which they admitted patients as compared to coverage shifts, interns were more likely to introduce themselves (46% vs 34%, P0.01) and their role (42% vs 30%, P0.01). Interns at UMMC as compared to JHH interns were more likely to introduce themselves (45% vs 35%, P0.01) and describe their role to patients (44% vs 29%, P0.01). Interns at UMMC were also more likely to ask open‐ended questions (81% vs 70%, P0.01) and to touch patients (69% vs 62%, P=0.04). Performance of these behaviors did not vary significantly by gender, time of day, or shift. After adjustment for clustering at the observer and intern levels, differences by institution persisted in the rate of introducing oneself and one's role.
We performed a sensitivity analysis examining the first patient encounters of the day, and found that interns were somewhat more likely to introduce themselves (50% vs 40%, P=0.03) but were not significantly more likely to introduce their role, sit down, ask open‐ended questions, or touch the patient.
Nine of the 10 interns at JHH who participated in the study completed the survey (response rate=90%). Interns estimated introducing themselves and their role and sitting with patients significantly more frequently than was observed (80% vs 40%, P0.01; 80% vs 37%, P0.01; and 58% vs 9%, P0.01, respectively) (Figure 1).
DISCUSSION
The interns we observed in 2 urban academic internal medicine residency programs did not routinely practice etiquette‐based communication. Interns surveyed tended to overestimate their performance of these behaviors. These behaviors are simple to perform and are each associated with improved patient experiences of hospital care. Tackett et al. recently demonstrated that interns are not alone. Hospitalist physicians do not universally practice etiquette‐based medicine, even though these behaviors correlate with patient satisfaction scores.[10]
Introducing oneself to patients may improve patient satisfaction and acceptance of trainee involvement in care.[6] However, only 10% of hospitalized patients in 1 study correctly identified a physician on their inpatient team, demonstrating the need for introductions during each and every inpatient encounter.[11] The interns we observed introduced themselves to patients in only 40% of encounters. During admitting shifts, when the first encounter with a patient likely took place, interns introduced themselves during 46% of encounters.
A comforting touch has been shown to reduce anxiety levels among patients and improve compliance with treatment regimens, but the interns did not touch patients in one‐third of visits, including during admitting shifts. Sixty‐six percent of patients consider a physician's touch comforting, and 58% believe it to be healing.[8]
A randomized trial found that most patients preferred a sitting physician, and believed that practitioners who sat were more compassionate and spent more time with them.[9] Unfortunately, interns sat down with patients in fewer than 10% of encounters.
We do not know why interns do not engage in these simple behaviors, but it is not surprising given that their role models, including hospitalist physicians, do not practice them universally.[10] Personality differences, medical school experiences, and hospital factors such as patient volume and complexity may explain variability in performance.
Importantly, we know that habits learned in residency tend to be retained when physicians enter independent practice.[12] If we want attending physicians to practice etiquette‐based communication, then it must be role modeled, taught, and evaluated during residency by clinical educators and hospitalist physicians. The gap between intern perceptions and actual practice of these behaviors provides a window of opportunity for education and feedback in bedside communication. Attending physicians rate communication skills as 1 of the top values they seek to pass on to house officers.[13] Curricula on communication skills improve physician attitudes and beliefs about the importance of good communication as well as long‐term performance of communication skills.[14]
Our study had several limitations. First, all 732 patient encounters were assessed, regardless of whether the intern had seen the patient previously. This differed slightly from Kahn's assertion that these behaviors be performed at least on the first encounter with the patient. We believe that the need for common courtesy does not diminish after the first visit, and although certain behaviors may not be indicated on 100% of visits, our sensitivity analysis indicated performance of these behaviors was not likely even on the first visit of the day.
Second, our observations were limited to medicine interns at 2 programs in Baltimore during a single month, limiting generalizability. A convenience sample of interns was chosen for recruitment based on rotation on a general medicine rotation during the study month. We observed interns over the course of several shifts and throughout various positions in the call cycle.
Third, in any observational study, the Hawthorne effect is a potential limitation. We attempted to limit this bias by collecting information anonymously and not indicating to the interns which aspects of the patient encounter were being recorded.
Fourth, we defined the behaviors broadly in an attempt to measure the outcomes conservatively and maximize inter‐rater reliability. For instance, we did not differentiate in data collection between comforting touch and physical examination. Because chairs may not be readily available in all patient rooms, we included sitting on the patient's bed or crouching next to the bed as sitting with the patient. Use of open‐ended questions was observed as a more general form of Kahn's recommendation to ask how the patient is feeling.
Fifth, our poststudy survey was conducted 6 months after the observations were performed, used an ordinal rather than continuous response scale, and was limited to only 1 of the 2 programs and 9 of the 29 participants. Given this small sample size, generalizability of the results is limited. Additionally, intern practice of etiquette‐based communication may have improved between the observations and survey that took place 6 months later.
As hospital admissions are a time of vulnerability for patients, physicians can take a basic etiquette‐based communication approach to comfort patients and help them feel more secure. We found that even though interns believed they were practicing Kahn's recommended etiquette‐based communication, only a minority actually were. Curricula on communication styles or environmental changes, such as providing chairs in patient rooms or photographs identifying members of the medical team, may encourage performance of these behaviors.[15]
Acknowledgments
The authors acknowledge Dr. Lisa Cooper, MD, MPH, and Dr. Mary Catherine Beach, MD, MPH, who provided tremendous help in editing. The authors also thank Kevin Wang, whose assistance with observer hiring, training, and management was essential.
Disclosures: The Osler Center for Clinical Excellence at Johns Hopkins and the Johns Hopkins Hospitalist Scholars Fund provided stipends for our observers as well as transportation and logistical costs of the study. The authors report no conflicts of interest.
- , , . Physician‐patient communication in the primary care office: a systematic review. J Am Board Fam Pract. 2002;15:25–38.
- , . Physicians' nonverbal rapport building and patients' talk about the subjective component of illness. Hum Commun Res. 2001;27:299–311.
- , , , , . Can 40 seconds of compassion reduce patient anxiety? J Clin Oncol. 1999;17:371–379.
- , , , . House staff nonverbal communication skills and patient satisfaction. J Gen Intern Med. 2003;18:170–174.
- . Etiquette‐based medicine. N Engl J Med. 2008;358:1988–1989.
- , , . Patient satisfaction associated with correct identification of physician's photographs. Mayo Clin Proc. 2001;76:604–608.
- . Effective physician‐patient communication and health outcomes: a review. CMAJ. 1995;152:1423–1433.
- , , , . Patients' attitudes to comforting touch in family practice. Can Fam Physician. 2000;46:2411–2416.
- , , , et al. Impact of physician sitting versus standing during inpatient oncology consultations: patients' preference and perception of compassion and duration. A randomized controlled trial. J Pain Symptom Manage. 2005;29:489–497.
- , , , , . Appraising the practice of etiquette‐based medicine in the inpatient setting. J Gen Intern Med. 2013;28(7):908–913.
- , , , , , . Ability of hospitalized patients to identify their in‐hospital physicians. Arch Intern Med. 2009;169:199–201.
- , , . The content of internal medicine residency training and its relevance to the practice of medicine. J Gen Intern Med. 1989;4:304–308.
- , . Which values to attending physicians try to pass on to house officers? Med Educ. 2001;35:941–945.
- , , , , , . Relationship of resident characteristics, attitudes, prior training, and clinical knowledge to communication skills performance. Med Educ. 2006;40:18–25.
- , , , . PHACES (Photographs of academic clinicians and their educational status): a tool to improve delivery of family‐centered care. Acad Pediatr. 2010;10:138–145.
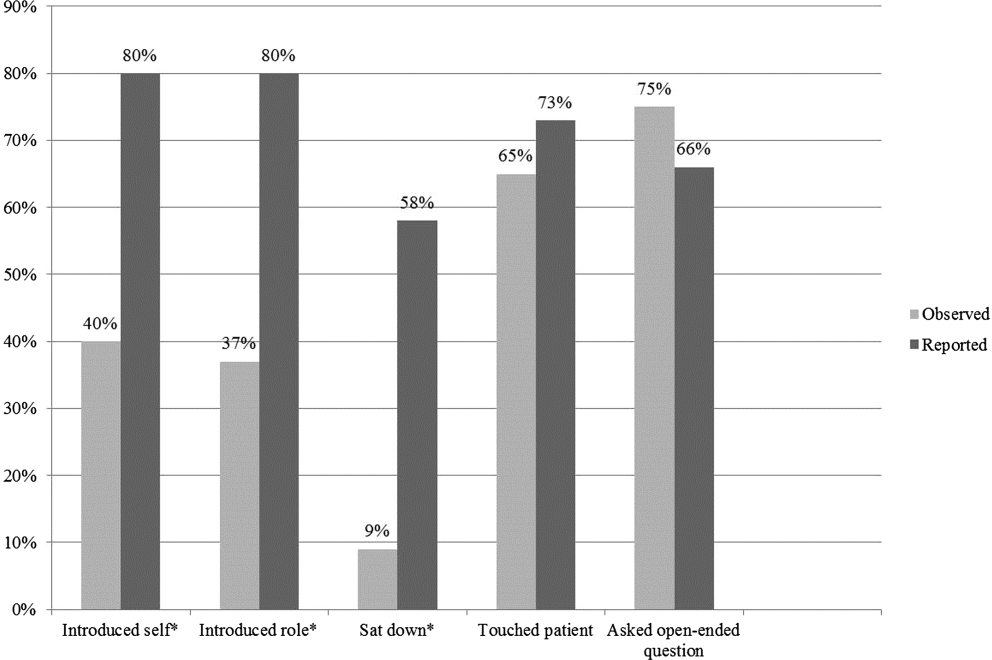
Pediatric to Adult‐Care Transitions
Over the last 40 years, innovations in medical care have dramatically improved the survival rates of children born with chronic illness or disabling health conditions; more than 90% are now expected to live beyond age 20 years, with approximately 500,000 reaching age 18 years every year.[1] The subset of these children with complex chronic disease use significant inpatient resources, accounting for 19.2% of pediatric inpatients, 48.9% of total pediatric hospital days, and 53.2% of pediatric hospital charges.[2, 3] This trend for high inpatient utilization and cost continues as the population ages, posing a potentially significant burden on pediatric hospitals.[4, 5] To reserve their specialized services for children, many pediatric hospitals impose age cutoffs for inpatient care; a national survey showed that 67% to 75% of patients over age 18 years with 4 specific chronic conditions (congenital heart disease [CHD], cystic fibrosis [CF], sickle cell disease [SCD], and spina bifida) were admitted to adult‐centered hospitals, as opposed to those providing exclusively pediatric or mixed services.[6] Admission rates for some conditions are growing faster in adults than in children, possibly due to increasing comorbidities with age.[7]
Although outpatient general internists indicated agreement that young adults with chronic diseases of childhood onset (CDoCO) should receive adult‐centered care, a majority did not feel comfortable providing it, or indicated a subspecialist should serve as the primary care provider.[8] Internal medicine residents also cite discomfort both with inpatient and outpatient management of patients with childhood onset illnesses and developmental disabilities.[9]
Due to their practice focus and the high inpatient utilization of this transitioning population, hospitalists will increasingly care for these adults. Academic hospitalists play an important role in medical education on the wards and can facilitate internal medicine residents learning about these patients. To date, no needs assessment has been completed regarding adult‐centered hospitalist perspectives regarding this population. This exploratory survey was designed to investigate adult hospitalist comfort level and concerns in caring for adults with CDoCO to guide potential educational interventions and improve care for this vulnerable population.
METHODS
Participants
We developed a survey for adult‐centered hospitalists to investigate comfort level with caring for adults with CDoCO and barriers to care that could be targets of educational and policy intervention. It was piloted with a small group of internal medicine (IM)‐trained and combined medicinepediatrics (MP)‐trained hospitalists for feedback regarding question clarity. The on‐line survey was emailed during July/August 2012 to the Society of Hospital Medicine (SHM) membership, which consisted of 11,218 hospital‐based providers and staff, of whom 61.7% identify as IM, 2.9% MP, 7.9% family medicine (FM), 3.4% pediatrics, and 24.1% other/no information. The survey was approved by our institutional review board, and was voluntary and anonymous with consent implied by participation; it was reintroduced twice to maximize response rates.
Survey
To gauge comfort level and support for hospitalists caring for adults with CDoCO, hospitalists rated their agreement with the statements I feel comfortable caring for adults with CDoCO and If I have a disease‐specific question on an adult with a CDoCO, I know who to call on a 4‐point Likert scale. They rated 14 potential barriers related to caring for this population on a 4‐point Likert scale as having no impact on ability to provide care to having great impact on care. The barriers were categorized into 3 areas: medical competence, care coordination, and psychosocial issues. Potential barriers were adapted from an outpatient survey of general internists and tailored for inpatient practice.[10] Respondents estimated the number of adults with CDoCO they had cared for in the prior 6‐month period and how often this population had a primary care provider.
RESULTS
Of the email requests delivered, 2713 were opened during the initial wave and 2535 during the second wave. A total of 179 respondents completed the survey.
Demographics
The specialty distribution represents similar proportion of IM‐ but higher FM‐ and MP‐trained providers than the general SHM membership. Two percent noted primary pediatric training; these responses were excluded given the survey focus on providers with some adult‐centered training. Just over 60% identified their primary practice as community‐based, with the remainder in academic practice (Table 1).
| Demographic | No. of Respondents (%)a |
|---|---|
| |
| Gender | |
| Male | 71 (40) |
| Female | 106 (60) |
| Residency training | |
| Internal medicine | 122 (68) |
| Family medicine | 30 (17) |
| Medicine‐pediatrics | 22 (12) |
| Pediatrics | 2 (1) |
| Provider type | |
| Physician | 176 (98) |
| NP/PA | 3 (2) |
| Practice type | |
| Academic | 68 (39) |
| Community | 107 (61) |
| Fellowship | |
| Yes | 30 (17) |
| No | 147 (83) |
| Years in practice | |
| 6 or less | 90 (50) |
| 7 or more | 89 (50) |
| Nearest pediatric hospital | |
| At site of practice | 87 (49) |
| 20 miles away | 58 (33) |
| >20 miles away | 32 (18) |
| Unsure | 1 (1) |
Experience, Comfort Level, and Support
Nearly 60% of all respondents saw 5 or more adults with CDoCO over a 6‐month period, with 16% of IM respondents, 31% of MP respondents, and 23% of FM respondents seeing more than 15 patients. Among IM respondents, 40% reported that they did not feel comfortable caring for this population, compared to 5% of MP and 14% of FM respondents; overall 20% of respondents strongly agreed they were comfortable caring for these patients. Respondents with 6 or less years in practice reported less discomfort (25%) than those practicing 7 years or more (40%). Community‐based providers reported high exposure, with 59% seeing more than 15 patients in 6 months, but similar discomfort levels, with 38% not feeling comfortable providing care. Additionally, 30% of all respondents did not know who to contact with a disease‐specific question.
Barriers to Care
Among IM providers, lack of familiarity with the literature, lack of training in CDoCO, coordinating with multiple specialists, and lack of training in adolescent development and behavior ranked as the most significant barriers to care (Table 2). Difficulty finding outpatient providers was also noted as a concern by all respondents, and 44% reported that these patients had an identified primary care provider less than half of the time.
| Statement | Average Likert(IM Only) | Average Likert (Overall) | Category |
|---|---|---|---|
| |||
| Lack of familiarity with the latest literature on specific illnesses | 2.82 | 2.67 | MC |
| Lack of training in CDoCO | 2.64 | 2.45 | MC |
| Difficulty meeting psychosocial needs of young adults with CDoCO | 2.53 | 2.46 | PS |
| Lack of training in adolescent development and behavior | 2.53 | 2.26 | MC |
| Difficulty coordinating with multiple specialists to manage complex problem | 2.52 | 2.47 | MC/CC |
| Difficulty finding outpatient providers to follow up | 2.50 | 2.50 | CC |
| Expectations for significant time/attention needed for proper care | 2.41 | 2.36 | PS |
| Lack of patients'/families' familiarity with adult healthcare systems | 2.40 | 2.37 | CC |
| Lack of physician and patients'/families' familiarity with available outpatient providers to follow up | 2.40 | 2.45 | CC |
| Difficulty assessing patient readiness to assume responsibility for medical plan | 2.38 | 2.20 | PS |
| Difficulty coordinating transitions from pediatric caregivers | 2.37 | 2.40 | CC |
| Difficulty balancing family involvement and patient independence/privacy | 2.36 | 2.27 | PS |
| Difficulty facing severe disability in young patients | 2.18 | 2.02 | PS |
| Reluctance of pediatricians to let go of their patients | 1.68 | 1.73 | CC |
Whereas the majority of respondents cited meeting psychosocial needs as impacting their ability to provide care, additional questions addressing specific psychosocial tasks were not highly ranked.
DISCUSSION
In keeping with the increasing survival of children with chronic disease, a majority of hospitalists participating in adult‐centered settings were caring for adults with CDoCO. Despite their responsibility for these patients, a large proportion of both IM‐trained and community‐based providers in all specialties did not feel comfortable caring for them. These results correlate with an outpatient survey that showed less than a third of IM providers felt comfortable caring for specific CDoCO (CHD, SCD, CF).[8] The increased comfort of FM and MP hospitalists is consistent with their additional training in pediatric disease and development; however, a majority of hospitalists continue to be IM trained, highlighting the need for intervention for these providers. Increased comfort among providers closer to residency may reflect increased exposure to this growing population during training or fledgling educational initiatives.
Among IM providers, medical competence in adolescent development, behavior, and disease‐specific issues emerged as major concerns, likely compounded by insufficient subspecialty access. Outpatient internists similarly report insufficient training as a top barrier, although clinic‐based issues, such as lack of appointment time and reimbursement, were also highly rated.[10, 11] This survey indicates that educational initiatives should include hospitalists and highlights access to a medical knowledge base and disease‐specific support. Although specific training in all conditions would be out of the scope for most busy practitioners, targeting common conditions and issues, such as developmental disability and supportive devices, would be high yield. Extending educational interventions into trainee education has been postulated and well received by IM residents, who favor a multidimensional curricula in which hospitalists can play an important part.[12]
IM providers cited identifying partnering providers, both subspecialists and outpatient providers, to support ongoing care as a secondary theme. An outpatient survey of pediatric and IM providers showed at least half felt identifying an adult‐centered primary care provider would be difficult and care coordination inadequate; poor outpatient subspecialty access for common conditions was less prevalent.[11] The discomfort of outpatient IM providers may be limiting; however, early identification of need, improved coordination throughout inpatient stay, and discharge planning could ease this transition for all providers. Care coordination support staff would benefit from familiarizing themselves with this population's needs, which are different from typical adult inpatients. Even though meeting psychosocial needs was a highly rated barrier, clarifying questions about those needs did not show a pattern in this or prior outpatient surveys, limiting targeted interventions.
Engaging the community of adult‐centered providers is key to providing appropriate health care services that continue uninterrupted as the individual moves from adolescence to adulthood as charged by a joint consensus statement on transition of patients with CDoCO.[13] Overall comfort level is likely affected by the interaction between insufficient knowledge base on CDoCO and perception of insufficient subspecialty support or unclear outpatient follow‐up. Future directions should center on curricular development surrounding high‐yield CDoCO topics and improved inpatient care coordination.
Limitations
This survey is limited by the low response rate, raising the possibility that responses may not be fully representative of the national sample. Low response rate was likely due in part to email alert fatigue, as the number of survey requests opened represented a significant drop from those delivered. Poor response may also be due to low recognition for this population, another indicator that education and increased awareness are needed. Although decreased responses by providers who are comfortable with this population could also play a role, the correlation between our survey findings and those of prior outpatient surveys support our findings.
CONCLUSIONS
The steadily growing population of adults with CDoCO and their high inpatient utilization have lead to increased care by adult‐centered hospitalists, many of whom do not feel comfortable caring for them. Educational initiatives aimed at increasing the medical knowledge base for common issues, training in adolescent development, increased care coordination, and access to address psychosocial issues would improve hospitalist comfort and patient care for this vulnerable population.
- , . Health care transition: destinations unknown. Pediatrics. 2002;110:1307–1314.
- , , , et al. Trends in resource utilization by children with neurological impairment in the United States inpatient health care system: a repeat cross‐sectional study. PLoS Med. 2012;9(1):e1001158.
- , , , et al Effect of hospital‐based comprehensive care clinic on health costs for Medicaid‐insured medically complex children. Arch Pediatr Adolesc Med. 2011;165(5):392–398.
- , , , , . Acute care utilization and rehospitalizations for sickle cell disease. JAMA. 2010;303(13):1288–1294.
- , , , . Adult survivors of pediatric illness: the impact on pediatric hospitals. Pediatrics. 2002;110(3):583–589.
- , , , . Inpatient health care use among adult survivors of chronic childhood illnesses in the United States. Arch Pediatr Adolesc Med. 2006;160:1054–1060.
- , , , , . The changing demographics of congenital heart disease hospitalizations in the United States, 1998 through 2010. JAMA. 2013;309(10):984–986.
- , , , , , . Comfort of general internists and general pediatricians in providing care for young adults with chronic illnesses of childhood. J Gen Intern Med. 2008;23(10):1621–1627.
- , . Residency training in transition of youth with childhood‐onset chronic disease. Pediatrics. 2010;126:S190–S193.
- , , , . Transition from pediatric to adult care: internist's perspectives. Pediatrics. 2009;123:417–423.
- , , , , , . Physician views on barriers to primary care for young adults with childhood‐onset chronic disease. Pediatrics. 2010;125:e748.
- . Resident preferences for a curriculum in health care transitions for young adults. South Med J. 2012;105(9):462–466.
- American Academy of Pediatrics, American Academy of Family Physicians, American College of Physicians–American Society of Internal Medicine. A consensus statement on health care transitions for young adults with special health care needs. Pediatrics. 2002;110(6 pt 2):1304–1306.
Over the last 40 years, innovations in medical care have dramatically improved the survival rates of children born with chronic illness or disabling health conditions; more than 90% are now expected to live beyond age 20 years, with approximately 500,000 reaching age 18 years every year.[1] The subset of these children with complex chronic disease use significant inpatient resources, accounting for 19.2% of pediatric inpatients, 48.9% of total pediatric hospital days, and 53.2% of pediatric hospital charges.[2, 3] This trend for high inpatient utilization and cost continues as the population ages, posing a potentially significant burden on pediatric hospitals.[4, 5] To reserve their specialized services for children, many pediatric hospitals impose age cutoffs for inpatient care; a national survey showed that 67% to 75% of patients over age 18 years with 4 specific chronic conditions (congenital heart disease [CHD], cystic fibrosis [CF], sickle cell disease [SCD], and spina bifida) were admitted to adult‐centered hospitals, as opposed to those providing exclusively pediatric or mixed services.[6] Admission rates for some conditions are growing faster in adults than in children, possibly due to increasing comorbidities with age.[7]
Although outpatient general internists indicated agreement that young adults with chronic diseases of childhood onset (CDoCO) should receive adult‐centered care, a majority did not feel comfortable providing it, or indicated a subspecialist should serve as the primary care provider.[8] Internal medicine residents also cite discomfort both with inpatient and outpatient management of patients with childhood onset illnesses and developmental disabilities.[9]
Due to their practice focus and the high inpatient utilization of this transitioning population, hospitalists will increasingly care for these adults. Academic hospitalists play an important role in medical education on the wards and can facilitate internal medicine residents learning about these patients. To date, no needs assessment has been completed regarding adult‐centered hospitalist perspectives regarding this population. This exploratory survey was designed to investigate adult hospitalist comfort level and concerns in caring for adults with CDoCO to guide potential educational interventions and improve care for this vulnerable population.
METHODS
Participants
We developed a survey for adult‐centered hospitalists to investigate comfort level with caring for adults with CDoCO and barriers to care that could be targets of educational and policy intervention. It was piloted with a small group of internal medicine (IM)‐trained and combined medicinepediatrics (MP)‐trained hospitalists for feedback regarding question clarity. The on‐line survey was emailed during July/August 2012 to the Society of Hospital Medicine (SHM) membership, which consisted of 11,218 hospital‐based providers and staff, of whom 61.7% identify as IM, 2.9% MP, 7.9% family medicine (FM), 3.4% pediatrics, and 24.1% other/no information. The survey was approved by our institutional review board, and was voluntary and anonymous with consent implied by participation; it was reintroduced twice to maximize response rates.
Survey
To gauge comfort level and support for hospitalists caring for adults with CDoCO, hospitalists rated their agreement with the statements I feel comfortable caring for adults with CDoCO and If I have a disease‐specific question on an adult with a CDoCO, I know who to call on a 4‐point Likert scale. They rated 14 potential barriers related to caring for this population on a 4‐point Likert scale as having no impact on ability to provide care to having great impact on care. The barriers were categorized into 3 areas: medical competence, care coordination, and psychosocial issues. Potential barriers were adapted from an outpatient survey of general internists and tailored for inpatient practice.[10] Respondents estimated the number of adults with CDoCO they had cared for in the prior 6‐month period and how often this population had a primary care provider.
RESULTS
Of the email requests delivered, 2713 were opened during the initial wave and 2535 during the second wave. A total of 179 respondents completed the survey.
Demographics
The specialty distribution represents similar proportion of IM‐ but higher FM‐ and MP‐trained providers than the general SHM membership. Two percent noted primary pediatric training; these responses were excluded given the survey focus on providers with some adult‐centered training. Just over 60% identified their primary practice as community‐based, with the remainder in academic practice (Table 1).
| Demographic | No. of Respondents (%)a |
|---|---|
| |
| Gender | |
| Male | 71 (40) |
| Female | 106 (60) |
| Residency training | |
| Internal medicine | 122 (68) |
| Family medicine | 30 (17) |
| Medicine‐pediatrics | 22 (12) |
| Pediatrics | 2 (1) |
| Provider type | |
| Physician | 176 (98) |
| NP/PA | 3 (2) |
| Practice type | |
| Academic | 68 (39) |
| Community | 107 (61) |
| Fellowship | |
| Yes | 30 (17) |
| No | 147 (83) |
| Years in practice | |
| 6 or less | 90 (50) |
| 7 or more | 89 (50) |
| Nearest pediatric hospital | |
| At site of practice | 87 (49) |
| 20 miles away | 58 (33) |
| >20 miles away | 32 (18) |
| Unsure | 1 (1) |
Experience, Comfort Level, and Support
Nearly 60% of all respondents saw 5 or more adults with CDoCO over a 6‐month period, with 16% of IM respondents, 31% of MP respondents, and 23% of FM respondents seeing more than 15 patients. Among IM respondents, 40% reported that they did not feel comfortable caring for this population, compared to 5% of MP and 14% of FM respondents; overall 20% of respondents strongly agreed they were comfortable caring for these patients. Respondents with 6 or less years in practice reported less discomfort (25%) than those practicing 7 years or more (40%). Community‐based providers reported high exposure, with 59% seeing more than 15 patients in 6 months, but similar discomfort levels, with 38% not feeling comfortable providing care. Additionally, 30% of all respondents did not know who to contact with a disease‐specific question.
Barriers to Care
Among IM providers, lack of familiarity with the literature, lack of training in CDoCO, coordinating with multiple specialists, and lack of training in adolescent development and behavior ranked as the most significant barriers to care (Table 2). Difficulty finding outpatient providers was also noted as a concern by all respondents, and 44% reported that these patients had an identified primary care provider less than half of the time.
| Statement | Average Likert(IM Only) | Average Likert (Overall) | Category |
|---|---|---|---|
| |||
| Lack of familiarity with the latest literature on specific illnesses | 2.82 | 2.67 | MC |
| Lack of training in CDoCO | 2.64 | 2.45 | MC |
| Difficulty meeting psychosocial needs of young adults with CDoCO | 2.53 | 2.46 | PS |
| Lack of training in adolescent development and behavior | 2.53 | 2.26 | MC |
| Difficulty coordinating with multiple specialists to manage complex problem | 2.52 | 2.47 | MC/CC |
| Difficulty finding outpatient providers to follow up | 2.50 | 2.50 | CC |
| Expectations for significant time/attention needed for proper care | 2.41 | 2.36 | PS |
| Lack of patients'/families' familiarity with adult healthcare systems | 2.40 | 2.37 | CC |
| Lack of physician and patients'/families' familiarity with available outpatient providers to follow up | 2.40 | 2.45 | CC |
| Difficulty assessing patient readiness to assume responsibility for medical plan | 2.38 | 2.20 | PS |
| Difficulty coordinating transitions from pediatric caregivers | 2.37 | 2.40 | CC |
| Difficulty balancing family involvement and patient independence/privacy | 2.36 | 2.27 | PS |
| Difficulty facing severe disability in young patients | 2.18 | 2.02 | PS |
| Reluctance of pediatricians to let go of their patients | 1.68 | 1.73 | CC |
Whereas the majority of respondents cited meeting psychosocial needs as impacting their ability to provide care, additional questions addressing specific psychosocial tasks were not highly ranked.
DISCUSSION
In keeping with the increasing survival of children with chronic disease, a majority of hospitalists participating in adult‐centered settings were caring for adults with CDoCO. Despite their responsibility for these patients, a large proportion of both IM‐trained and community‐based providers in all specialties did not feel comfortable caring for them. These results correlate with an outpatient survey that showed less than a third of IM providers felt comfortable caring for specific CDoCO (CHD, SCD, CF).[8] The increased comfort of FM and MP hospitalists is consistent with their additional training in pediatric disease and development; however, a majority of hospitalists continue to be IM trained, highlighting the need for intervention for these providers. Increased comfort among providers closer to residency may reflect increased exposure to this growing population during training or fledgling educational initiatives.
Among IM providers, medical competence in adolescent development, behavior, and disease‐specific issues emerged as major concerns, likely compounded by insufficient subspecialty access. Outpatient internists similarly report insufficient training as a top barrier, although clinic‐based issues, such as lack of appointment time and reimbursement, were also highly rated.[10, 11] This survey indicates that educational initiatives should include hospitalists and highlights access to a medical knowledge base and disease‐specific support. Although specific training in all conditions would be out of the scope for most busy practitioners, targeting common conditions and issues, such as developmental disability and supportive devices, would be high yield. Extending educational interventions into trainee education has been postulated and well received by IM residents, who favor a multidimensional curricula in which hospitalists can play an important part.[12]
IM providers cited identifying partnering providers, both subspecialists and outpatient providers, to support ongoing care as a secondary theme. An outpatient survey of pediatric and IM providers showed at least half felt identifying an adult‐centered primary care provider would be difficult and care coordination inadequate; poor outpatient subspecialty access for common conditions was less prevalent.[11] The discomfort of outpatient IM providers may be limiting; however, early identification of need, improved coordination throughout inpatient stay, and discharge planning could ease this transition for all providers. Care coordination support staff would benefit from familiarizing themselves with this population's needs, which are different from typical adult inpatients. Even though meeting psychosocial needs was a highly rated barrier, clarifying questions about those needs did not show a pattern in this or prior outpatient surveys, limiting targeted interventions.
Engaging the community of adult‐centered providers is key to providing appropriate health care services that continue uninterrupted as the individual moves from adolescence to adulthood as charged by a joint consensus statement on transition of patients with CDoCO.[13] Overall comfort level is likely affected by the interaction between insufficient knowledge base on CDoCO and perception of insufficient subspecialty support or unclear outpatient follow‐up. Future directions should center on curricular development surrounding high‐yield CDoCO topics and improved inpatient care coordination.
Limitations
This survey is limited by the low response rate, raising the possibility that responses may not be fully representative of the national sample. Low response rate was likely due in part to email alert fatigue, as the number of survey requests opened represented a significant drop from those delivered. Poor response may also be due to low recognition for this population, another indicator that education and increased awareness are needed. Although decreased responses by providers who are comfortable with this population could also play a role, the correlation between our survey findings and those of prior outpatient surveys support our findings.
CONCLUSIONS
The steadily growing population of adults with CDoCO and their high inpatient utilization have lead to increased care by adult‐centered hospitalists, many of whom do not feel comfortable caring for them. Educational initiatives aimed at increasing the medical knowledge base for common issues, training in adolescent development, increased care coordination, and access to address psychosocial issues would improve hospitalist comfort and patient care for this vulnerable population.
- , . Health care transition: destinations unknown. Pediatrics. 2002;110:1307–1314.
- , , , et al. Trends in resource utilization by children with neurological impairment in the United States inpatient health care system: a repeat cross‐sectional study. PLoS Med. 2012;9(1):e1001158.
- , , , et al Effect of hospital‐based comprehensive care clinic on health costs for Medicaid‐insured medically complex children. Arch Pediatr Adolesc Med. 2011;165(5):392–398.
- , , , , . Acute care utilization and rehospitalizations for sickle cell disease. JAMA. 2010;303(13):1288–1294.
- , , , . Adult survivors of pediatric illness: the impact on pediatric hospitals. Pediatrics. 2002;110(3):583–589.
- , , , . Inpatient health care use among adult survivors of chronic childhood illnesses in the United States. Arch Pediatr Adolesc Med. 2006;160:1054–1060.
- , , , , . The changing demographics of congenital heart disease hospitalizations in the United States, 1998 through 2010. JAMA. 2013;309(10):984–986.
- , , , , , . Comfort of general internists and general pediatricians in providing care for young adults with chronic illnesses of childhood. J Gen Intern Med. 2008;23(10):1621–1627.
- , . Residency training in transition of youth with childhood‐onset chronic disease. Pediatrics. 2010;126:S190–S193.
- , , , . Transition from pediatric to adult care: internist's perspectives. Pediatrics. 2009;123:417–423.
- , , , , , . Physician views on barriers to primary care for young adults with childhood‐onset chronic disease. Pediatrics. 2010;125:e748.
- . Resident preferences for a curriculum in health care transitions for young adults. South Med J. 2012;105(9):462–466.
- American Academy of Pediatrics, American Academy of Family Physicians, American College of Physicians–American Society of Internal Medicine. A consensus statement on health care transitions for young adults with special health care needs. Pediatrics. 2002;110(6 pt 2):1304–1306.
Patient Care Circle and Care Transitions
The focus on care transitions and readmissions is expanding beyond the development of risk scores based on objective clinical data to quality improvement interventions involving the key stakeholders in the process, namely the patients and their multidisciplinary providers.[1, 2] The Institute for Healthcare Improvement's State Action on Avoidable Rehospitalizations initiative promotes formulating a specific transition plan and developing multidisciplinary management strategies for all patients.[3] The Transition of Care Consensus Policy Statement developed by a coalition including the American College of Physicians and Society of Hospital Medicine emphasizes accountability, communication, and involvement of the patient and family members in plans of care.[4] Yet, interventions to reduce readmissions and improve the quality and safety of care transitions remain only modestly and inconsistently effective.
Successful interventions are those that are combined and coordinated, and shared across the hospital and community settings.[5] In this study, we sought to understand the issues leading to readmissions and barriers as perceived by patients, family members, physicians, nurses, and social workers. We compared and contrasted the perspectives by discipline and used this information to design a descriptive framework of a multidisciplinary, collaborative, and coordinated support network integral to effective care transitions, which we term a Patient Care Circle (PCC) (Figure 1).

METHODS
Study Design
We recruited a purposive sample of general medicine patients with same‐site 30‐day readmissions, and those directly involved in their care, to participate in interviews and focus groups to investigate explanations for unplanned readmissions (Table 1). We sought subjects' perspectives based on extrapolations from previous research that identified multiple stakeholders involved in the care transitions process,[1, 2, 5, 6, 7, 8] and our own professional experience with patient readmissions.
| Role | No. (%) | No. Interviewed | No. in Focus Group | |
|---|---|---|---|---|
| ||||
| Patient | 12 | NA | ||
| Male | 10 (90.9) | |||
| Average age, y, range | 3172 | |||
| Insurance | ||||
| Medicare | 5 (41.7) | |||
| Medicaid | 1 (8.3) | |||
| Medicare/Medicaid | 2 (16.7) | |||
| Private | 4 (33.3) | |||
| Race | ||||
| White | 8 (66.7) | |||
| Black | 2 (16.7) | |||
| Other | 2 (16.7) | |||
| Has PMD | 9 (75.0) | |||
| Has home caregiver (family or aide) | 10 (90.9) | |||
| Physician | ||||
| Hospitalista | 9b | |||
| Index | 10 | |||
| Readmit | 9 | |||
| Primary care physician | 5 | NA | ||
| Other provider | ||||
| RN | ||||
| Inpatient staff | 5 | 7 | ||
| Visiting home | NA | 6 | ||
| Social work | NA | 6 | ||
| Other caregivers | ||||
| Family | 2 | NA | ||
| Home aides | 0 | NA | ||
| Total | 43 | 28 | ||
Site Selection
All interviews and focus groups were conducted at New YorkPresbyterian/Weill Cornell Medical Center (NYP/WC), a large urban academic medical center in New York City serving a racially and socioeconomically diverse population. The institutional review boards at Weill Cornell Medical College and Hunter College approved this study.
Data Collection Tools
We developed semistructured interview and focus group guides (see Supporting Information, Appendixes 17, in the online version of this article) by reviewing published literature[8, 9, 10, 11, 12] and readmission pilot data that identified challenges associated with hospital discharges. Interviews were patient specific, and providers involved directly in their care were asked to consider reasons for the patients' readmissions and whether they could have been prevented. Provider interview guides were modified from the patient interview script and tailored toward their role in the patient's care.
One focus group guide was used for all sessions, allowing us to compare and contrast emerging themes across disciplines. Participants were asked to discuss perceived causes for readmissions and barriers to improvement.
All questions were open‐ended to gain insight into participants' beliefs regarding the causes of readmissions and to limit researcher bias. We iteratively reviewed and modified the guides to ensure the questions were effectively worded.
Recruiting
Using a centralized clinical database, we identified patients aged 18 years and older for interviews, who were readmitted within 30 days to NYP/WC between May 2011 and May 2012, and had an attending hospitalist during the initial and readmission visits. We confirmed patients' English fluency and cognitive ability by contacting their attending physician. Patients provided written consent prior to interview.
For interviews, we asked patients to identify their outpatient physicians and providers; inpatient hospitalists and providers were identified from the patients' charts. For focus groups, we recruited volunteers among all division hospitalists and solicited volunteer inpatient nursing, social work, and homecare nursing participants through organizational liaisons (Table 1).
Data Collection
We interviewed patients in person at their bedside. We interviewed physicians and other caregivers in person or by telephone during the course of the patient's readmission. We conducted 4 discipline‐specific 90‐minute focus groups for hospitalists, inpatient staff nurses, homecare nurses, and hospital social workers. Patient interviews and focus groups were audio‐recorded and transcribed using a professional service.
Data Analysis
We analyzed 47 transcripts (43 interviews, 4 focus groups) during research group meetings using grounded theory[13] to generate overarching themes felt to influence readmissions through iterative reviewing of transcripts. We attributed codes to salient text and documented recurring topics that emerged. Two researchers independently assessed responses from the patient‐specific interviews for variability among the various disciplines. We ended our data collection after we ceased to find new topics from participants (thematic saturation).[14]
Three researchers, in consultation with the larger team, coded the 4 focus group transcripts to generate a codebook with definitions and examples of recurring concepts. They then coded the 43 interview transcripts using the codebook. The entire team met regularly to address questions and potential discrepancies.
We achieved greater trustworthiness of the analysis by using multiple modes of triangulation, a qualitative method that relies on points of comparison and contrast.[15] We achieved methodological triangulation by using both interviews and focus groups, and achieved internal triangulation by having researchers in the clinical, social, and behavioral sciences routinely critique the evolving codebook.
RESULTS
We recruited 43 interview and 28 focus group participants (Table 1). From our transcript analysis, we generated 22 codes and categorized them into 5 themes embodying the issues pertinent to readmissions from the perspective of the stakeholders: (1) teamwork, (2) health systems navigation and management, (3) illness severity and health needs, (4) psychosocial stability; and (5) medications (Table 2).
We applied these codes and themes to build a descriptive framework depicting what we believed is the essential foundation for successful care transitions, a collaborative unified patient‐centered network to address complex healthcare‐related issues across disciplines and across settings (Figure 1). Our model illustrates the interplay between the various physician and care‐provider roles as well as the relationship of the structure of the care circle to each theme.
Care Circle Theme
Teamwork
Comprehensive, effective collaboration and communication among members of the PCC were required for the circle to function successfully and establish safe ongoing patient care across settings. Teamwork required a shared purpose and aligned incentives among all stakeholders to work as a unified patient‐centered network.
Dysfunctional teamwork led to fragmented care. Hospitalists and patients cited difficulties coordinating in‐hospital management plans with multiple consulting subspecialists. Social workers ascribed 1 potential cause for unplanned readmissions to insufficient feedback from homecare agencies regarding patients following hospital discharge:
I wouldn't mind hearing [from the home agencies][the patient] won't let me in the door' patient's doing well' or patient's still not compliant.' If we don't knowthen we can't address it [until] they come back in [to the hospital].
Meanwhile, accurate handoff of information affected the care provided by homecare nurses:
We go into assess [the patient at home] and we see something totally different than what wason a piece of paper.
Patient‐Centered Themes
Four patient‐centered themes were identified that posed challenges in the transitions process and required the support and teamwork of the PCC to deal with effectually.
Health Systems Navigation and Management
The complexities of the healthcare system in the hospital and in the community presented challenges for patients with greater needs. Meeting higher levels of patient care needs was difficult in a system where prioritizing competing responsibilities was a recurrent issue. Inpatient nurses shared:
Educat[ing] people and empower[ing] them about their health. [I]t's kind of lostwhen we have so many [tasks] that we're responsible for, the patient gets lost in all of these things. For patients requiring ongoing sub‐acute care, limited weekend and holiday hospital and skilled nursing facility personnel added to the difficulty of arranging discharges and executing care plans.
Social workers noted:
[S]ometimes people are ready for discharge and there's noprimary care physician [willing to follow them].
Obtaining additional support following discharge was another concern for patients with homecare needs:
With the Medicaid changeshomecare is going to be less [than] what's provided [now]. So they're going into a lesssafe environment. [Social worker]
Illness Severity and Health Needs
The ability to cope with disease and related stressors depended on complexity of illness, level of health literacy, and underlying psychiatric issues overlapping with the theme of psychosocial stability. Early identification and mitigation of potential postdischarge complications required PCC collaboration.
All groups agreed that patients with chronic complex comorbidities often warranted frequent access to the inpatient setting regardless of outpatient medical care:
I'm not surprised [my patient was readmitted] becausealmost anything that goes wrong leads her to the hospital. Her readmission is not avoidable because of the severity of her illness. [Primary care physician]
With patients living longer with terminal illness, several groups voiced concern regarding the frequency of hospitalizations:
People [go] into hospice in the last week of their life as opposed to in the last six months of their life.The doctor has to bring this up [I] can't do it. [Homecare nurse]
Another prevalent issue was the emotional stress that accompanies acute or exacerbations of illness. One patient shared,
I also have a four‐year‐old son. Obviously, I'm not able to care for him as much as I was. My wifehas been diagnosed with leukemia.
Psychosocial Stability
Discharge from the hospital often requires psychosocial adjustment, which may be overlooked, underestimated, or dismissed by patients and providers.
[One patient] was very visually impaired. Lives by himself. But he's youngso he wanted to go home [not] a nursing home. He got home. He got up in the middle of the night. [P]ut the wound vac[uum] on the counter [and it] fell. It broke. It started beeping. He panicked, couldn't get in touch with any of the visiting nurses because it was 2:00 a.m. And he [was readmitted], and now is saying he wants to go to sub‐acute, because he can't handle it at home. [Social worker]
Engaging patients who seemed capable of participating in their own care was often frustrating for providers:
It's depressing because you're trying to help somebody [but] they don't want to help themselves and you know you'll see them right back [in the hospital] again. [Inpatient nurse]
Social support and socioeconomic factors also impacted patients' and families' ability to cope and adjust to the community after discharge. One family member commented that he and his wife have always cared for the patient together but now he cares for her alone and must hire a private duty aide to assist.
Medications
The degree to which obtaining, understanding, and taking medications exists as an impediment to safe transitions was patient specific and dependent on all of the patient‐centered themes above. Recognition and effective intervention required a multitiered, multidisciplinary approach. Homecare nurses reflected:
Discharge planning doesn't ensure that there is someone that can go to the pharmacy to get [medications] until the [visiting] nurse comes in and sets something up.
Methods used for medication education were not always effective in reaching the patient:
I shouldn't really say that they didn't [discuss medication side effects] because I was in a lot of pain. I really don't recall somebody giving me specific [information on] side effects on the medication. [Patient]
DISCUSSION
We categorized our findings into5 principle themes that influence care transitions: teamwork, systems navigation and management, illness severity, and health needs, psychosocial stability, and medications. Many of these themes have been targeted in the literature for interventions to reduce readmissions and improve care transitions. An overarching theme of our study was the importance of the Patient Care Circle, a support system required to implement and execute comprehensive patient‐centered plans for safe and effective transitions across all settings.
Collectively, our themes emphasized that communication and comprehensive planning between all members of the PCC were instrumental to the circle's ability to address issues pertaining to the patient‐centered themes: systems navigation and management, illness severity and health needs, psychosocial stability, and medications. The strength of the bonds and collaboration within the PCC were directly dependent on the success of teamwork.
The interplay between the 4 patient‐centered themes and the degree to which they affect readmissions were variable and patient dependent. Complexities of the healthcare system and issues surrounding medications became more apparent with worsening disease severity and psychosocial instability. Complicated patients requiring more multidisciplinary interaction highlighted limitations of dispersed teams and staffing ratios. Patients faced with insurance restrictions, difficulties attending appointments, and obtaining medications required pooling the efforts of multiple PCC members to help them. Thus, these themes emphasized not only the importance of teamwork required for care coordination, but also guided the membership of the PCC to meet the patient's specific needs across the inpatient and outpatient settings.
When participants were asked to identify modifiable reasons for readmissions, the overwhelming collective response was inadequate communication and collaboration among PCC members. Clear role assignments and delegation of responsibility were also necessary to avoid gaps in care. Significant barriers to improvement included limited resources and inability to maintain the integrity of the support network needed for safe transitions.
Finally, we compared and contrasted the perceptions of the different disciplines on the factors contributing to each patient's readmission. Over all, there was substantial overlap. However, each perspective added additional layers of information allowing for a more comprehensive understanding of the problem. This demonstrated the utility of multidisciplinary patient‐centered interviews to examine readmissions and elucidate areas for intervention.
Several disciplines were not included in interviews or focus groups but were identified by our study participants as integral to a comprehensive Patient Care Circle. These include emergency medicine physicians, inpatient and outpatient pharmacists, and outpatient social workers. Some disciplines were not included due to challenges identifying discrete providers and with arranging interviews or focus groups. As their roles were mentioned several times in multiple forums, we have included them in our descriptive framework.
We designed this study with the hope of completing a full complement of patient‐specific interviews that included all stakeholders for 4 male and 4 female patients. For several reasons, we were unable to do so including challenges contacting providers and family members, and coordinating the timing of interviews with patient visits. Further, our focus on English‐speaking patients admitted to general medicine teams may limit generalizability to other vulnerable patient groups. Nevertheless, we believe we succeeded in interviewing a representative sample and obtained thematic saturation with the information obtained from our interviews and focus groups.
Last, the focus of this project was to obtain the perspectives of a full spectrum of stakeholders in the care transitions process to gain a better understanding of the reasons for readmissions. Although we did ask study participants to identify areas that may have been modifiable, we did not expand the discussion to include potential interventions, which will be the next step in our study.
CONCLUSION
Our article describes 5 main themes derived from the perspectives of multiple stakeholders involved in the care transitions process. An overarching theme was the importance of a multidisciplinary, coordinated collaborative care circle to ensure safe patient‐centered care in all settings.
The results of this study can be used by researchers and applied by care providers to improve the care transitions process. Researchers can build on our model by studying methods and interventions to improve the function of the care circle and design guidelines to create a more effective and integrated network. Institutions can adapt our methodology and tools to identify the needs of their own patient population and optimize membership in the PCC accordingly.
We feel that improving the structure and function of the care circle is necessary prior to designing interventions targeting the patient‐centered themes. Strengthening the teamwork of the PCC is fundamental to improving the quality of care transitions and reducing preventable readmissions.
Acknowledgments
The authors thank the patients, family members, social workers, nurses, and physicians who participated in their study. The authors are grateful to their research assistants for their assistance with conducting interviews, focus groups, and data collection.
Disclosures: This study was supported by the Weill Cornell Clinical and Translational Science Center: UL1 RR024996. Dr. Press is supported in part through funds provided to him as a Nanette Laitman Clinical Scholar in Public Health at the Weill Cornell Medical College. An earlier version of the article was presented as a poster at the Society of Hospital Medicine annual conference in San Diego, California in 2012.
- , , , et al. Factors contributing to all‐cause 30‐day readmissions: a structured case series across 18 hospitals. Med Care. 2012;50:599–605.
- , , , , , . Perceptions of readmitted patients on the transition from hospital to home. J Hosp Med. 2012;7(9):709–712.
- Institute for Healthcare Improvement.State Action on Avoidable Rehospitalizations (STAAR) initiative. Available at: http://www.ihi.org/offerings/Initiatives/STAAR/Pages/Improvement.aspx. Accessed January 28, 2013.
- , , , et al. Transition of Care Consensus Policy Statement, American College of Physicians–Society of General Internal Medicine–Society of Hospital Medicine–American Geriatric Society–American College of Emergency Physicians–Society of Academic Emergency Medicine. J Gen Intern Med. 2009;24(8):971–976.
- , , , . Moving beyond readmission penalties: creating an ideal process to improve transitional care. J Hosp Med. 2013;8(2):102–109.
- , , , , . Interventions to reduce 30‐day rehospitalization: a systematic review. Ann Intern Med. 2011;155:520–528.
- , , , . Promoting effective transitions of care at hospital discharge: a review of key issues for hospitalists. J Hosp Med. 2008;2:314–323.
- , , , , . How‐to guide: improving transitions from the hospital to community settings to reduce avoidable rehospitalizations. Cambridge, MA: Institute for Healthcare Improvement; June 2012. Available at: www.IHI.org. Accessed December 31, 2012.
- BOOSTing care transitions. Philadelphia, PA: Society of Hospital Medicine; 2008. Available at: http://www.hospitalmedicine.org/ResourceRoomRedesign/RR_CareTransitions/CT_Home.cfm. Accessed October 20, 2012.
- , , . Predictive validity of a questionnaire that identifies older persons at risk for hospital admission. J Am Geriatr Soc. 1995;43(4):374–377.
- . The care transitions program: healthcare services for improving quality and safety during care hand‐offs. Denver, CO: Care Transitions Program; 2007. Available at: http://www.caretransitions.org. Accessed October 22, 2012.
- , , , , . Did I do as best as the system would let me? Healthcare professional views on hospital to home care transitions. J Gen Intern Med. 2012;27(12):1649–1656.
- , . The Discovery of Grounded Theory: Strategies for Qualitative Research. Chicago, IL: Aldine; 1967.
- . The significance of saturation. Qual Health Res. 1995;5(2):147–149.
- . Understanding reliability and validity in qualitative research. Qual Rep. 2003;8(4):597–607.
The focus on care transitions and readmissions is expanding beyond the development of risk scores based on objective clinical data to quality improvement interventions involving the key stakeholders in the process, namely the patients and their multidisciplinary providers.[1, 2] The Institute for Healthcare Improvement's State Action on Avoidable Rehospitalizations initiative promotes formulating a specific transition plan and developing multidisciplinary management strategies for all patients.[3] The Transition of Care Consensus Policy Statement developed by a coalition including the American College of Physicians and Society of Hospital Medicine emphasizes accountability, communication, and involvement of the patient and family members in plans of care.[4] Yet, interventions to reduce readmissions and improve the quality and safety of care transitions remain only modestly and inconsistently effective.
Successful interventions are those that are combined and coordinated, and shared across the hospital and community settings.[5] In this study, we sought to understand the issues leading to readmissions and barriers as perceived by patients, family members, physicians, nurses, and social workers. We compared and contrasted the perspectives by discipline and used this information to design a descriptive framework of a multidisciplinary, collaborative, and coordinated support network integral to effective care transitions, which we term a Patient Care Circle (PCC) (Figure 1).
METHODS
Study Design
We recruited a purposive sample of general medicine patients with same‐site 30‐day readmissions, and those directly involved in their care, to participate in interviews and focus groups to investigate explanations for unplanned readmissions (Table 1). We sought subjects' perspectives based on extrapolations from previous research that identified multiple stakeholders involved in the care transitions process,[1, 2, 5, 6, 7, 8] and our own professional experience with patient readmissions.
| Role | No. (%) | No. Interviewed | No. in Focus Group | |
|---|---|---|---|---|
| ||||
| Patient | 12 | NA | ||
| Male | 10 (90.9) | |||
| Average age, y, range | 3172 | |||
| Insurance | ||||
| Medicare | 5 (41.7) | |||
| Medicaid | 1 (8.3) | |||
| Medicare/Medicaid | 2 (16.7) | |||
| Private | 4 (33.3) | |||
| Race | ||||
| White | 8 (66.7) | |||
| Black | 2 (16.7) | |||
| Other | 2 (16.7) | |||
| Has PMD | 9 (75.0) | |||
| Has home caregiver (family or aide) | 10 (90.9) | |||
| Physician | ||||
| Hospitalista | 9b | |||
| Index | 10 | |||
| Readmit | 9 | |||
| Primary care physician | 5 | NA | ||
| Other provider | ||||
| RN | ||||
| Inpatient staff | 5 | 7 | ||
| Visiting home | NA | 6 | ||
| Social work | NA | 6 | ||
| Other caregivers | ||||
| Family | 2 | NA | ||
| Home aides | 0 | NA | ||
| Total | 43 | 28 | ||
Site Selection
All interviews and focus groups were conducted at New YorkPresbyterian/Weill Cornell Medical Center (NYP/WC), a large urban academic medical center in New York City serving a racially and socioeconomically diverse population. The institutional review boards at Weill Cornell Medical College and Hunter College approved this study.
Data Collection Tools
We developed semistructured interview and focus group guides (see Supporting Information, Appendixes 17, in the online version of this article) by reviewing published literature[8, 9, 10, 11, 12] and readmission pilot data that identified challenges associated with hospital discharges. Interviews were patient specific, and providers involved directly in their care were asked to consider reasons for the patients' readmissions and whether they could have been prevented. Provider interview guides were modified from the patient interview script and tailored toward their role in the patient's care.
One focus group guide was used for all sessions, allowing us to compare and contrast emerging themes across disciplines. Participants were asked to discuss perceived causes for readmissions and barriers to improvement.
All questions were open‐ended to gain insight into participants' beliefs regarding the causes of readmissions and to limit researcher bias. We iteratively reviewed and modified the guides to ensure the questions were effectively worded.
Recruiting
Using a centralized clinical database, we identified patients aged 18 years and older for interviews, who were readmitted within 30 days to NYP/WC between May 2011 and May 2012, and had an attending hospitalist during the initial and readmission visits. We confirmed patients' English fluency and cognitive ability by contacting their attending physician. Patients provided written consent prior to interview.
For interviews, we asked patients to identify their outpatient physicians and providers; inpatient hospitalists and providers were identified from the patients' charts. For focus groups, we recruited volunteers among all division hospitalists and solicited volunteer inpatient nursing, social work, and homecare nursing participants through organizational liaisons (Table 1).
Data Collection
We interviewed patients in person at their bedside. We interviewed physicians and other caregivers in person or by telephone during the course of the patient's readmission. We conducted 4 discipline‐specific 90‐minute focus groups for hospitalists, inpatient staff nurses, homecare nurses, and hospital social workers. Patient interviews and focus groups were audio‐recorded and transcribed using a professional service.
Data Analysis
We analyzed 47 transcripts (43 interviews, 4 focus groups) during research group meetings using grounded theory[13] to generate overarching themes felt to influence readmissions through iterative reviewing of transcripts. We attributed codes to salient text and documented recurring topics that emerged. Two researchers independently assessed responses from the patient‐specific interviews for variability among the various disciplines. We ended our data collection after we ceased to find new topics from participants (thematic saturation).[14]
Three researchers, in consultation with the larger team, coded the 4 focus group transcripts to generate a codebook with definitions and examples of recurring concepts. They then coded the 43 interview transcripts using the codebook. The entire team met regularly to address questions and potential discrepancies.
We achieved greater trustworthiness of the analysis by using multiple modes of triangulation, a qualitative method that relies on points of comparison and contrast.[15] We achieved methodological triangulation by using both interviews and focus groups, and achieved internal triangulation by having researchers in the clinical, social, and behavioral sciences routinely critique the evolving codebook.
RESULTS
We recruited 43 interview and 28 focus group participants (Table 1). From our transcript analysis, we generated 22 codes and categorized them into 5 themes embodying the issues pertinent to readmissions from the perspective of the stakeholders: (1) teamwork, (2) health systems navigation and management, (3) illness severity and health needs, (4) psychosocial stability; and (5) medications (Table 2).
We applied these codes and themes to build a descriptive framework depicting what we believed is the essential foundation for successful care transitions, a collaborative unified patient‐centered network to address complex healthcare‐related issues across disciplines and across settings (Figure 1). Our model illustrates the interplay between the various physician and care‐provider roles as well as the relationship of the structure of the care circle to each theme.
Care Circle Theme
Teamwork
Comprehensive, effective collaboration and communication among members of the PCC were required for the circle to function successfully and establish safe ongoing patient care across settings. Teamwork required a shared purpose and aligned incentives among all stakeholders to work as a unified patient‐centered network.
Dysfunctional teamwork led to fragmented care. Hospitalists and patients cited difficulties coordinating in‐hospital management plans with multiple consulting subspecialists. Social workers ascribed 1 potential cause for unplanned readmissions to insufficient feedback from homecare agencies regarding patients following hospital discharge:
I wouldn't mind hearing [from the home agencies][the patient] won't let me in the door' patient's doing well' or patient's still not compliant.' If we don't knowthen we can't address it [until] they come back in [to the hospital].
Meanwhile, accurate handoff of information affected the care provided by homecare nurses:
We go into assess [the patient at home] and we see something totally different than what wason a piece of paper.
Patient‐Centered Themes
Four patient‐centered themes were identified that posed challenges in the transitions process and required the support and teamwork of the PCC to deal with effectually.
Health Systems Navigation and Management
The complexities of the healthcare system in the hospital and in the community presented challenges for patients with greater needs. Meeting higher levels of patient care needs was difficult in a system where prioritizing competing responsibilities was a recurrent issue. Inpatient nurses shared:
Educat[ing] people and empower[ing] them about their health. [I]t's kind of lostwhen we have so many [tasks] that we're responsible for, the patient gets lost in all of these things. For patients requiring ongoing sub‐acute care, limited weekend and holiday hospital and skilled nursing facility personnel added to the difficulty of arranging discharges and executing care plans.
Social workers noted:
[S]ometimes people are ready for discharge and there's noprimary care physician [willing to follow them].
Obtaining additional support following discharge was another concern for patients with homecare needs:
With the Medicaid changeshomecare is going to be less [than] what's provided [now]. So they're going into a lesssafe environment. [Social worker]
Illness Severity and Health Needs
The ability to cope with disease and related stressors depended on complexity of illness, level of health literacy, and underlying psychiatric issues overlapping with the theme of psychosocial stability. Early identification and mitigation of potential postdischarge complications required PCC collaboration.
All groups agreed that patients with chronic complex comorbidities often warranted frequent access to the inpatient setting regardless of outpatient medical care:
I'm not surprised [my patient was readmitted] becausealmost anything that goes wrong leads her to the hospital. Her readmission is not avoidable because of the severity of her illness. [Primary care physician]
With patients living longer with terminal illness, several groups voiced concern regarding the frequency of hospitalizations:
People [go] into hospice in the last week of their life as opposed to in the last six months of their life.The doctor has to bring this up [I] can't do it. [Homecare nurse]
Another prevalent issue was the emotional stress that accompanies acute or exacerbations of illness. One patient shared,
I also have a four‐year‐old son. Obviously, I'm not able to care for him as much as I was. My wifehas been diagnosed with leukemia.
Psychosocial Stability
Discharge from the hospital often requires psychosocial adjustment, which may be overlooked, underestimated, or dismissed by patients and providers.
[One patient] was very visually impaired. Lives by himself. But he's youngso he wanted to go home [not] a nursing home. He got home. He got up in the middle of the night. [P]ut the wound vac[uum] on the counter [and it] fell. It broke. It started beeping. He panicked, couldn't get in touch with any of the visiting nurses because it was 2:00 a.m. And he [was readmitted], and now is saying he wants to go to sub‐acute, because he can't handle it at home. [Social worker]
Engaging patients who seemed capable of participating in their own care was often frustrating for providers:
It's depressing because you're trying to help somebody [but] they don't want to help themselves and you know you'll see them right back [in the hospital] again. [Inpatient nurse]
Social support and socioeconomic factors also impacted patients' and families' ability to cope and adjust to the community after discharge. One family member commented that he and his wife have always cared for the patient together but now he cares for her alone and must hire a private duty aide to assist.
Medications
The degree to which obtaining, understanding, and taking medications exists as an impediment to safe transitions was patient specific and dependent on all of the patient‐centered themes above. Recognition and effective intervention required a multitiered, multidisciplinary approach. Homecare nurses reflected:
Discharge planning doesn't ensure that there is someone that can go to the pharmacy to get [medications] until the [visiting] nurse comes in and sets something up.
Methods used for medication education were not always effective in reaching the patient:
I shouldn't really say that they didn't [discuss medication side effects] because I was in a lot of pain. I really don't recall somebody giving me specific [information on] side effects on the medication. [Patient]
DISCUSSION
We categorized our findings into5 principle themes that influence care transitions: teamwork, systems navigation and management, illness severity, and health needs, psychosocial stability, and medications. Many of these themes have been targeted in the literature for interventions to reduce readmissions and improve care transitions. An overarching theme of our study was the importance of the Patient Care Circle, a support system required to implement and execute comprehensive patient‐centered plans for safe and effective transitions across all settings.
Collectively, our themes emphasized that communication and comprehensive planning between all members of the PCC were instrumental to the circle's ability to address issues pertaining to the patient‐centered themes: systems navigation and management, illness severity and health needs, psychosocial stability, and medications. The strength of the bonds and collaboration within the PCC were directly dependent on the success of teamwork.
The interplay between the 4 patient‐centered themes and the degree to which they affect readmissions were variable and patient dependent. Complexities of the healthcare system and issues surrounding medications became more apparent with worsening disease severity and psychosocial instability. Complicated patients requiring more multidisciplinary interaction highlighted limitations of dispersed teams and staffing ratios. Patients faced with insurance restrictions, difficulties attending appointments, and obtaining medications required pooling the efforts of multiple PCC members to help them. Thus, these themes emphasized not only the importance of teamwork required for care coordination, but also guided the membership of the PCC to meet the patient's specific needs across the inpatient and outpatient settings.
When participants were asked to identify modifiable reasons for readmissions, the overwhelming collective response was inadequate communication and collaboration among PCC members. Clear role assignments and delegation of responsibility were also necessary to avoid gaps in care. Significant barriers to improvement included limited resources and inability to maintain the integrity of the support network needed for safe transitions.
Finally, we compared and contrasted the perceptions of the different disciplines on the factors contributing to each patient's readmission. Over all, there was substantial overlap. However, each perspective added additional layers of information allowing for a more comprehensive understanding of the problem. This demonstrated the utility of multidisciplinary patient‐centered interviews to examine readmissions and elucidate areas for intervention.
Several disciplines were not included in interviews or focus groups but were identified by our study participants as integral to a comprehensive Patient Care Circle. These include emergency medicine physicians, inpatient and outpatient pharmacists, and outpatient social workers. Some disciplines were not included due to challenges identifying discrete providers and with arranging interviews or focus groups. As their roles were mentioned several times in multiple forums, we have included them in our descriptive framework.
We designed this study with the hope of completing a full complement of patient‐specific interviews that included all stakeholders for 4 male and 4 female patients. For several reasons, we were unable to do so including challenges contacting providers and family members, and coordinating the timing of interviews with patient visits. Further, our focus on English‐speaking patients admitted to general medicine teams may limit generalizability to other vulnerable patient groups. Nevertheless, we believe we succeeded in interviewing a representative sample and obtained thematic saturation with the information obtained from our interviews and focus groups.
Last, the focus of this project was to obtain the perspectives of a full spectrum of stakeholders in the care transitions process to gain a better understanding of the reasons for readmissions. Although we did ask study participants to identify areas that may have been modifiable, we did not expand the discussion to include potential interventions, which will be the next step in our study.
CONCLUSION
Our article describes 5 main themes derived from the perspectives of multiple stakeholders involved in the care transitions process. An overarching theme was the importance of a multidisciplinary, coordinated collaborative care circle to ensure safe patient‐centered care in all settings.
The results of this study can be used by researchers and applied by care providers to improve the care transitions process. Researchers can build on our model by studying methods and interventions to improve the function of the care circle and design guidelines to create a more effective and integrated network. Institutions can adapt our methodology and tools to identify the needs of their own patient population and optimize membership in the PCC accordingly.
We feel that improving the structure and function of the care circle is necessary prior to designing interventions targeting the patient‐centered themes. Strengthening the teamwork of the PCC is fundamental to improving the quality of care transitions and reducing preventable readmissions.
Acknowledgments
The authors thank the patients, family members, social workers, nurses, and physicians who participated in their study. The authors are grateful to their research assistants for their assistance with conducting interviews, focus groups, and data collection.
Disclosures: This study was supported by the Weill Cornell Clinical and Translational Science Center: UL1 RR024996. Dr. Press is supported in part through funds provided to him as a Nanette Laitman Clinical Scholar in Public Health at the Weill Cornell Medical College. An earlier version of the article was presented as a poster at the Society of Hospital Medicine annual conference in San Diego, California in 2012.
- , , , et al. Factors contributing to all‐cause 30‐day readmissions: a structured case series across 18 hospitals. Med Care. 2012;50:599–605.
- , , , , , . Perceptions of readmitted patients on the transition from hospital to home. J Hosp Med. 2012;7(9):709–712.
- Institute for Healthcare Improvement.State Action on Avoidable Rehospitalizations (STAAR) initiative. Available at: http://www.ihi.org/offerings/Initiatives/STAAR/Pages/Improvement.aspx. Accessed January 28, 2013.
- , , , et al. Transition of Care Consensus Policy Statement, American College of Physicians–Society of General Internal Medicine–Society of Hospital Medicine–American Geriatric Society–American College of Emergency Physicians–Society of Academic Emergency Medicine. J Gen Intern Med. 2009;24(8):971–976.
- , , , . Moving beyond readmission penalties: creating an ideal process to improve transitional care. J Hosp Med. 2013;8(2):102–109.
- , , , , . Interventions to reduce 30‐day rehospitalization: a systematic review. Ann Intern Med. 2011;155:520–528.
- , , , . Promoting effective transitions of care at hospital discharge: a review of key issues for hospitalists. J Hosp Med. 2008;2:314–323.
- , , , , . How‐to guide: improving transitions from the hospital to community settings to reduce avoidable rehospitalizations. Cambridge, MA: Institute for Healthcare Improvement; June 2012. Available at: www.IHI.org. Accessed December 31, 2012.
- BOOSTing care transitions. Philadelphia, PA: Society of Hospital Medicine; 2008. Available at: http://www.hospitalmedicine.org/ResourceRoomRedesign/RR_CareTransitions/CT_Home.cfm. Accessed October 20, 2012.
- , , . Predictive validity of a questionnaire that identifies older persons at risk for hospital admission. J Am Geriatr Soc. 1995;43(4):374–377.
- . The care transitions program: healthcare services for improving quality and safety during care hand‐offs. Denver, CO: Care Transitions Program; 2007. Available at: http://www.caretransitions.org. Accessed October 22, 2012.
- , , , , . Did I do as best as the system would let me? Healthcare professional views on hospital to home care transitions. J Gen Intern Med. 2012;27(12):1649–1656.
- , . The Discovery of Grounded Theory: Strategies for Qualitative Research. Chicago, IL: Aldine; 1967.
- . The significance of saturation. Qual Health Res. 1995;5(2):147–149.
- . Understanding reliability and validity in qualitative research. Qual Rep. 2003;8(4):597–607.
© 2013 Society of Hospital Medicine
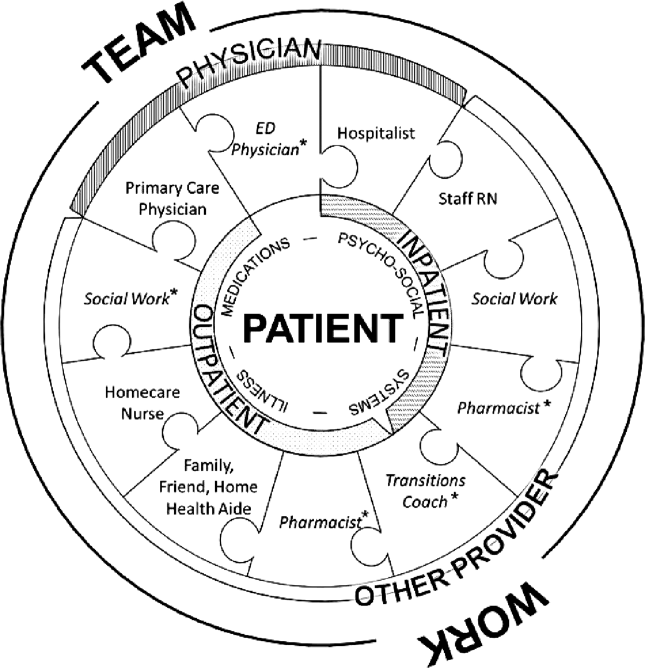
Periprocedural Use of Blood Products
Although inpatient blood product transfusion is common, many uses have not been subject to rigorous clinical study, and great practice variations exist. Of particular interest to the hospitalist is the use of red blood cells (RBCs), plasma, and platelets prior to an invasive procedure to correct anemia or a perceived bleeding risk. When considering blood product use in this context, the hospitalist faces 2 questions. First, what are the risks of anemia, thrombocytopenia, or abnormal coagulation tests? Second, what is the evidence that administration of the blood product in question improves outcomes such as bleeding and mortality? We address these questions in this review of the data supporting the use of RBCs, platelets, and plasma prior to invasive procedures.
RED BLOOD CELLS
Anemia is the most common hematologic concern in the perioperative setting. In 2009, approximately 15 million units of RBCs were transfused in the United States, 40% to 70% of which were given in the perioperative setting.[1, 2]
Risks of Periprocedural Anemia
The best evidence regarding the risks of perioperative anemia comes from studies in patients who declined blood transfusions. A retrospective cohort study of 1958 consecutive surgical patients who refused transfusions due to religious reasons showed an increase in 30‐day mortality as preoperative hemoglobin values fell, especially for those with preoperative hemoglobin concentrations 6 g/dL.[3] For patients with underlying cardiovascular disease, the risk of death was greatest when the preoperative hemoglobin value was 10 g/dL. Subsequent analysis showed that mortality rose with postoperative hemoglobin levels 7 g/dL, with a sharp rise in morbidity (myocardial infarction [MI], congestive heart failure [CHF], arrhythmia, and infection) and mortality in those with postoperative hemoglobin of 5 to 6 g/dL.[4] These results are consistent with studies of healthy volunteers who underwent acute isovolumic hemoglobin reduction, demonstrating clinical changes when hemoglobin values fell to 5 to 7 g/dL.[5, 6, 7, 8]
Several large, retrospective cohort studies have evaluated anemia and perioperative morbidity and mortality. A 2007 study analyzed data from over 310,000 predominantly male patients over age 65 years undergoing major noncardiac surgery.[9] Even mild degrees of preoperative anemia were associated with increased 30‐day mortality and cardiovascular morbidity (cardiac arrest or Q‐wave MI), with a monotonic rise in mortality (3.5%35.4%) and cardiac events (1.8%14.6%) when the hematocrit was 39%. Utilizing data from the American College of Surgeons' National Surgical Quality Improvement Program database, a 2011 study evaluated over 227,000 patients who underwent major noncardiac surgery.[10] Again, even mild anemia (hematocrit 29%39%) was independently associated with an increase in 30‐day composite morbidity, including MI, stroke, pneumonia, acute renal failure, wound infection, sepsis (13.27%), and mortality (3.52%).
Does RBC Transfusion Improve Outcomes?
Although the evidence argues that perioperative anemia is associated with poor surgical outcomes, it is not clear whether RBC transfusion in the perioperative setting improves these outcomes. Furthermore, the optimal perioperative hemoglobin level remains controversial. Importantly, most periprocedural trials were not sufficiently powered to assess differences in clinical outcomes.[11]
Several noteworthy randomized controlled trials (RCTs) comprise the bulk of the evidence regarding transfusion thresholds and are summarized in Table 1. The Transfusion Requirements in Critical Care (TRICC) was a landmark trial that randomized patients to a restrictive or a liberal transfusion strategy and demonstrated a trend toward lower 30‐day mortality in the restrictive group.[12] In addition, the restrictive transfusion group had lower rates of myocardial infarction and pulmonary edema. A subsequent subanalysis found no difference in mortality in patients with underlying cardiovascular disease.[13]
| Study/Year | No. of Patients | Brief Description | Transfusion Strategy | Outcomes (Restrictive Versus Liberal) |
|---|---|---|---|---|
| ||||
| Herbert et al. (TRICC)/1999[12] | 838 | Normovolemic patients admitted to ICU with Hg 9 g/dL within 72 hours of admission. | Restrictive: Hg maintained 79 g/dL. Liberal: Hg maintained 1012 g/dL. | 30‐day mortality (18.7% vs 23.3%, P=0.11). Pulmonary edema (5.3% vs 10.7%, P0.01) and MI (0.7% vs 2.9%, P=0.02) rates while in the ICU. |
| Carson et al. (FOCUS)/2011[14] | 2016 | Patients undergoing surgery for hip fracture with a history of cardiovascular disease or cardiovascular risk factors. | Restrictive: transfused for Hg 8 g/dL or symptomatic anemia. Liberal: transfused to maintain Hg >10 g/dL. | Primary outcome of death or the inability to walk 10 feet across the room without human assistance at 60 days (34.7% vs 35.2%, P=0.9). Composite of in‐hospital ACS or death (5.2% vs. 4.3%). The frequencies of in‐hospital clinical events and adverse events did not differ significantly between groups. |
| Hajjar et al. (TRACS)/2010[15] | 502 | Patients admitted to ICU for elective cardiac surgery with cardiopulmonary bypass. | Restrictive: transfused to maintain Hct 24%. Liberal: transfused to maintain Hct 30%. | Composite end point of 30‐day all‐cause mortality+severe in‐hospital morbidity (cardiogenic shock, ARDS, or AKI requiring renal replacement therapy) (11% vs 10%, P=0.85). |
| Bracey et al./1999[16] | 428 | Patients undergoing first‐time elective coronary surgical revascularization. | Restrictive: postoperative transfusion for Hg 8 g/dL or predetermined clinical conditions requiring RBC transfusion (ie, hemodynamic instability). | Hospital mortality (1.4% vs 2.7%, P=0.3). |
| Liberal: transfusion at discretion of physician with institutional guidelines recommending postoperative transfusion for Hg 9 g/dL. | No differences in morbidity (including pulmonary complications, renal failure, and MI), duration of mechanical ventilation, and length of hospital stay (7.52.9 days vs 7.94.9 days). | |||
| Villanueva et al./2013[17] | 921 | Severe upper GI bleeding, gastroscopy within 6 hours. | Restrictive: transfused if Hg 7 g/dL. Liberal: transfused if Hg 9 g/dL. | Survival at 6 weeks (95% vs 91%, P=0.02). |
| Rebleeding (10% vs 16%, P=0.01). Adverse event rate including transfusion reactions, ACS, AKI, pulmonary complications, infection, and stroke or TIA (40% vs 48%, P=0.02). | ||||
| Carson et al. (MINT)/2013[18] | 110 | Pilot study in patients with Hg 10 g/dL and either ACS or stable angina undergoing cardiac catheterization. | Restrictive: transfused if Hg 8 g/dL or symptomatic anemia. Liberal: transfused to raise Hg 10 g/dL. | Composite primary outcome of all cause mortality+MI+unscheduled coronary revascularization within 30 days (25.5% vs 10.9%, P=0.054). Death at 30 days (13% vs 1.8%, P=0.032). |
| Cooper et al. (CRIT)/2011[19] | 45 | Pilot study in patients with acute MI (chest pain and positive cardiac biomarker) and Hct 30% within 72 hours of symptom onset. | Restrictive: transfused to maintain Hct 24%27%. | The primary composite outcome (in‐hospital death, recurrent MI, or new or worsening CHF) (13% vs 38%, P=0.046). |
| Liberal: transfused to maintain Hct 30% to 33%. | ||||
The largest RCT of transfusion thresholds, the Transfusion Trigger Trial for Functional Outcomes in Cardiovascular Patients Undergoing Surgical Hip Fracture Repair (FOCUS), randomized patients undergoing surgery for hip fracture with a history of cardiovascular disease or cardiovascular risk factors to a restrictive or liberal transfusion strategy.[14] The primary outcome of death or the inability to walk 10 feet across the room without human assistance at 60 days was similar in both the liberal and restrictive group, and the composite rate of acute coronary syndrome and in‐hospital death, stroke, CHF, venous thromboembolism, and the frequencies of other in‐hospital events or lengths of stay did not differ between the groups.
Several RCTs have examined the effect of transfusion practice on patients undergoing elective cardiac surgery. The Transfusion Requirements After Cardiac Surgery (TRACS) study did not show a difference in the primary composite outcome of 30‐day all‐cause mortality and in‐hospital morbidity between the restrictive and liberal transfusion groups.[15] A second cardiac surgery trial also found no difference in mortality or morbidity outcomes when comparing a restrictive versus liberal transfusion threshold.[16]
A recent RBC transfusion trial evaluated transfusion thresholds in patients with severe upper gastrointestinal bleeding.[17] All patients underwent gastroscopy within 6 hours of hospital admission and were randomly allocated to a restrictive or liberal transfusion threshold. The restrictive group had a significantly higher survival at 6 weeks when compared to the liberal group, as well as lower rates of adverse events such as further bleeding, acute coronary syndrome, transfusion reactions, and pulmonary edema.
Finally, the Myocardial Ischemia and Transfusion (MINT) pilot trial evaluated 110 patients with hemoglobin concentration l10 g/dL admitted for ST‐segment elevation MI, nonST‐segment elevation MI, unstable angina, or stable coronary disease undergoing a cardiac catheterization.[18] The composite end point of death, MI, and unscheduled revascularizations within 30 days was higher in the restrictive group when compared to the liberal group, and 30‐day mortality was less frequent in liberal strategy compared to restrictive strategy. Given the small study size and the fact that patients in the restrictive group were significantly older than those in the liberal group, the results of this study must be interpreted carefully. The results of this trial contrast an earlier RCT of 45 patients admitted with acute MI, which showed higher rates of in‐hospital death, recurrent MI, or CHF in the liberal transfusion group versus the restrictive group.[19] Clearly, there is insufficient evidence to define transfusion threshold in acute coronary syndrome, and further study is needed in this area.
A recent meta‐analysis of 19 RCTs through February 2011 compared restrictive versus liberal transfusion strategies.[11] Although not all of these studies looked at periprocedural RBC transfusion, employment of a restrictive strategy saved an average of 1.19 units of blood per patient transfused without a difference in 30‐day mortality. This meta‐analysis also showed that in‐hospital mortality was 23% lower in patients assigned to a restrictive strategy, and there were no differences in cardiac events or strokes between restrictive and liberal strategies.
Encompassing the latest evidence, the AABB (formerly, the American Association of Blood Banks) guidelines recommend a restrictive transfusion strategy utilizing a transfusion threshold of 7 to 8 g/dL in stable hospitalized patients.[20] The AABB also recommends a restrictive strategy for patients with underlying cardiovascular disease, advocating for a transfusion threshold of 8 g/dL or less, or for symptoms of anemia. No transfusion recommendations were provided for acute coronary syndrome.
PLASMA
In the United States, approximately 4 million units of frozen plasma (FP) were transfused in 2006, and recent data demonstrate that relative to RBCs, the number of FP units transfused in the United States is higher than in other countries with advanced medical care.[1, 21, 22] Many transfusions are given prior to a procedure to correct perceived bleeding risk.
Risks of Periprocedural Coagulopathy
Laboratory measures of coagulation such as prothrombin time (PT)/emnternational normalized ratio (INR) are frequently used to guide transfusion of FP. A 3‐month audit at Massachusetts General Hospital found approximately one‐third of all FP units used outside of the operating room were requested before a procedure because of an elevated INR.[23] However, PT and activated partial thromboplastin time were never validated in nonbleeding patients, and INR was never validated for use in non‐vitamin K antagonist settings.[24, 25]
A recent systematic review assessed whether abnormalities in preprocedure coagulation tests correlate with increased risk of bleeding.[26] Analysis of 24 observational studies and 1 RCT included nearly 2000 procedures performed on patients with abnormal coagulation studies and concluded that there is not sufficient data to support PT and INR as predictors of bleeding risk. One study examining how well INR can be used to predict the degree of deficiency of a given factor found that blood samples with an INR as high as 1.9 contained factor levels adequate to support hemostasis.[27]
Furthermore, there is surprisingly little evidence to support the ability of FP to correct an abnormal INR. Given that the INR of FP can be as high as 1.3, transfusion will have little effect on minimally elevated INRs. This point is highlighted by a prospective study evaluating the effectiveness of transfusing FP to correct an increased INR in patients with a mildly prolonged PT (13.1 to 17 seconds). Of 121 patients studied, 1% normalized their INR, and only 15% demonstrated improvement at least halfway to normal.[28] There was no correlation between plasma dose and change in INR. Additionally, a study attempting to quantify the relationship between change in INR and the pretransfusion INR observed that a reliable significant change in INR is only likely when the INR is >1.7.[29]
Does FP Transfusion Improve Outcomes?
Most clinical uses of FP are not supported by evidence from RCTs. A 2012 systematic review examining the clinical effectiveness of FP included RCT data from 1964 to 2011.[30] In terms of periprocedural FP administration, this review included studies of FP in cardiac surgery and revealed a lack of evidence to support the effectiveness of FP to prevent bleeding. Notably, this review did not examine the use of FP prior to percutaneous procedures.
Despite the paucity of evidence to guide FP transfusions, in 2010 the AABB published practice guidelines to assist practitioners in the use of FP.[22, 31] In terms of periprocedural FP administration, these practice guidelines questioned the use of FP in surgical or trauma patients without massive bleeding, as only 6 studies were available for analysis. The panel could not recommend for or against the use of FP in surgical patients, although meta‐analysis showed that FP transfusion was associated with a trend toward increased risk of death. No studies of nonsurgical invasive procedures met review inclusion criteria. Given the potential for harm and the lack of data with regard to use of FP prior to nonsurgical invasive procedures, hospitalists should view the use of FP prior to a procedure with caution.
The Society of Interventional Radiology (SIR) recently published consensus guidelines for periprocedural management of coagulation status and hemostasis risk in percutaneous‐guided interventions.[32] Acknowledging the lack of data regarding periprocedural management of patients with abnormal coagulation parameters, this society's Standards of Practice Committee recommends that in the absence of warfarin treatment or liver disease, preprocedure INR testing should be conducted only prior to procedures with moderate to high bleeding risk.[32] Notably, low bleeding risk procedures include thoracentesis, paracentesis, drainage catheter exchange, and dialysis access interventions. This recommendation is consistent with observational studies of paracentesis and thoracentesis, which have failed to show increased bleeding risk in patients with an elevated INR. The largest of these studies retrospectively examined 608 patient procedures and found no significant difference in hemoglobin drop or average hemoglobin among patients with normal PT compared to patients with prolonged PT who underwent either a paracentesis or thoracentesis.[33]
In patients scheduled to undergo moderate or high bleeding risk procedures, these guidelines recommend that the INR be corrected to 1.5, although this recommendation was derived by Delphi consensus of expert practitioners due to lack of available data.[32] Central venous catheter insertion highlights the discrepancy between SIR recommendations and review of the available, albeit limited, data. A study of 580 patients with an INR >1.5 found that only 1 patient had a major bleeding event due to accidental puncture of the carotid artery.[34] Along with several others, this study is cited as evidence that central venous catheterization can be performed safely in patients with coagulation abnormalities.[32] However, because of the observational nature of these data, SIR guidelines categorize central venous catheterization as a moderate risk procedure, and as such recommend a preprocedure INR check and correction of INR to 1.5.[32] There are no prospective studies looking at what INR it is safe to perform endoscopic interventions.[35] Additionally, there are no studies looking at the effect of preprocedure FP administration on endoscopic outcomes.
PLATELETS
Over 10 million units of platelets are transfused in the United States annually.[1] Severe thrombocytopenia is thought to confer increased bleeding risk, and allogenic platelet transfusions are commonly given to thrombocytopenic patients as supportive care.[36] Given that recommendations on platelet transfusion thresholds are largely derived from studies looking at patients with hematological malignancies, there is concern about using these data to inform transfusion thresholds in other patient populations. Despite this limitation, we examine the evidence for an optimum platelet transfusion threshold and review available practice guidelines for the perioperative setting.
Risks of Thrombocytopenia and When to Transfuse
Hemostasis depends on an adequate number of functional platelets along with an intact coagulation system. Circulating platelets likely contribute to hemostasis via an endothelial supportive function by plugging gaps in the endothelium of blood vessels.[36] Early observational studies of clinically stable patients with chronic thrombocytopenia showed that significant spontaneous bleeding through an intact vascular system typically occurred with a platelet count below 5,000 platelets/L.[37, 38] Despite this, a platelet count of 20,000/L was adopted as a transfusion threshold and used for over 25 years.[36]
Beginning in the late 1990s, RCTs comparing a prophylactic transfusion trigger of 10,000 platelets/L to 20,000 platelets/L showed no difference in hemorrhagic risks or RBC transfusion requirements.[39, 40, 41, 42] The American Society of Clinical Oncology and the British Committee for Standards in Haematology (BCSH) now recommend a prophylactic platelet transfusion trigger of 10,000/L for all patients with chronic thrombocytopenia due to hypoproliferative causes.[43] A 2012 Cochrane review of 13 RCTs examining prophylactic platelet transfusion for prevention of bleeding in patients with hematological disorders did not find evidence to change this recommendation, but did question the strength of the data showing bleeding risk equivalency between 10,000/L and 20,000/L.[44]
In addition to studies examining platelet transfusion thresholds, various studies have questioned whether platelet transfusions should be given prophylactically before bleeding onset or as treatment afterward. Two early small RCTs and several observational studies examining prophylactic versus therapeutic platelet transfusion failed to show increased risk of bleeding or mortality in patients with leukemia who were transfused only after bleeding had begun.[45, 46] However, a recent RCT of 600 patients undergoing chemotherapy or stem cell transplantation showed that patients who were not given prophylactic platelet transfusions had more days with bleeding and shorter time to first bleeding episode compared to patients given prophylactic platelet transfusion for a platelet count below 10,000/L.[47] This study supports continued use of prophylactic platelet transfusions to prevent bleeding. Based on this recent trial and the 2012 Cochrane review, prophylactic platelet transfusion for a platelet count lower than 10,000/L is currently the standard of care for patients with chronic thrombocytopenia due to a hypoproliferative cause.
Perioperative Platelet Transfusion Practice Guidelines
It is unknown at what platelet count the risk of surgical bleeding increases, and there are no definitive studies to guide the use of prophylactic platelet transfusions for patients prior to procedures. Given this paucity of data, we are left to review consensus expert opinion and the nonrandomized studies that inform them.
Prior to surgical procedures, prophylactic platelet transfusion is rarely required for platelet counts >100,000/L and is usually required for a platelet count 50,000/L.[48] For platelet counts in the range of 50,000/L to 100,000/L, guidelines from the American Society of Anesthesiologists and the Royal College of Physicians state that platelet transfusion should be based on the extent of surgery, the risk and ability to control bleeding, the rate of bleeding with regard to trauma, the presence of platelet dysfunction, and other coagulation abnormalities.[48] Recognizing the inability to easily control bleeding during neurosurgical procedures and the potential for significant adverse outcomes with intracranial bleeding, experts recommend that neurosurgical patients have platelet counts maintained >100,000/L.[43]
For bedside and minimally invasive procedures, various thresholds are considered standard of care without rigorous supporting data. For example, based solely on interpretation of case reports, a platelet count of 80,000/L has been proposed by the American Red Cross, the French Society of Anesthesiology, and the BCSH for epidural anesthesia in patients with thrombocytopenia due to idiopathic thrombocytopenia.[49] For endoscopic procedures, the American Society for Gastrointestinal Endoscopy recommends a platelet count of 50,000/L for therapeutic procedures and 20,000/L for low‐risk diagnostic procedures.[35]
Procedures such as lumbar puncture, central venous catheterization, paracentesis, and thoracentesis have also not been well studied in the setting of thrombocytopenia. Based on case reports and case series, lumbar puncture is thought to require a platelet count of 10,000 to 20,000/L in patients with marrow failure but 50,000/L in patients without hematologic malignancies.[49, 50, 51] In terms of central venous catheter placement, a recent retrospective analysis included 193 adult leukemic patients who received 604 central venous catheter placements at 1 institution.[52] This study showed that only platelet counts below 20,000/L were associated with a higher risk of nonsevere bleeding. These results are consistent with several earlier observational studies reporting a very low risk of bleeding in patients with thrombocytopenia requiring central venous catheterization.[53, 54] With regard to paracentesis and thoracentesis, a study of 391 patients who underwent paracentesis and 207 patients who underwent thoracentesis did not demonstrate bleeding with platelet counts of 50,000/L to 100,000/L.[33] However, no specific platelet transfusion threshold was identified by this retrospective single‐institution study.
SUMMARY
We summarize our recommendations in Table 2, recognizing that evidence is limited and many of these recommendations are based on expert opinion. The limited evidence highlights opportunity for hospitalist‐driven research in periprocedural blood product transfusion.
|
| RBC transfusion |
| Transfusion threshold of Hg 78 g/dL or symptomatic anemia in most hemodynamically stable hospitalized patients. |
| Transfusion threshold of Hg 8 g/dL or for symptomatic anemia in patients with underlying CV disease. |
| Optimal transfusion threshold is unknown in patients with acute coronary syndrome. |
| Frozen plasma transfusion |
| Insufficient evidence to support routine INR testing for low‐risk procedures in the absence of warfarin treatment or liver disease. |
| Transfusion may be considered prior to procedures with moderate to high bleeding risk when INR >1.5. |
| Insufficient evidence to guide transfusion practice prior to endoscopic procedures. |
| Platelet transfusion |
| Transfusion threshold of 20,000/L for low bleeding risk procedures, including central venous catheters. |
| Transfusion threshold of 50,000100,000/L for moderate bleeding risk procedures. |
| Transfusion threshold of 100,000/L for neurosurgical procedures. |
| Transfusion threshold of 50,000/L for therapeutic endoscopy and 20,000/L for low‐risk diagnostic endoscopy. |
ACKNOWLEDGEMENTS
Disclosures: Dr. Carson reports grants from the National Institutes of Health (NIH) during the conduct of the study, personal fees from Cerus Corporation, grants from Amgen, and grants from the NIH outside the submitted work.
- , , , . Report of the US Department of Health and Human Services. The 2009 national blood collection and utilization survey report. Washington, DC: US Department of Health and Human Services, Office of the Assistant Secretary for Health; 2011.
- , , , , . Where does blood go? Prospective observational study of red cell transfusion in north England. BMJ. 2002;325(7368):803.
- , , , et al. Effect of anaemia and cardiovascular disease on surgical mortality and morbidity. Lancet. 1996;348(9034):1055–1060.
- , , , . Mortality and morbidity in patients with very low postoperative Hb levels who decline blood transfusion. Transfusion. 2002;42(7):812–818.
- , , , et al. Human cardiovascular and metabolic response to acute, severe isovolemic anemia. JAMA. 1998;279(3):217–221.
- , , , et al. Electrocardiographic ST‐segment changes during acute, severe isovolemic hemodilution in humans. Anesthesiology. 2000;93(4):1004–1010.
- , , , et al. Acute severe isovolemic anemia impairs cognitive function and memory in humans. Anesthesiology. 2000;92(6):1646–1652.
- , , , , , . Fatigue during acute isovolemic anemia in healthy, resting humans. Transfusion. 2000;40(4):457–460.
- , , , et al. Preoperative hematocrit levels and postoperative outcomes in older patients undergoing noncardiac surgery. JAMA. 2007;297(22):2481–2488.
- , , , et al. Preoperative anaemia and postoperative outcomes in non‐cardiac surgery: a retrospective cohort study. Lancet. 2011;378(9800):1396–1407.
- , , . Transfusion thresholds and other strategies for guiding allogeneic red blood cell transfusion. Cochrane Database Syst Rev. 2012;4:CD002042.
- , , , et al. A multicenter, randomized, controlled clinical trial of transfusion requirements in critical care. Transfusion Requirements in Critical Care Investigators, Canadian Critical Care Trials Group. N Engl J Med. 1999;340(6):409–417.
- , , , et al. Is a low transfusion threshold safe in critically ill patients with cardiovascular diseases? Crit Care Med. 2001;29(2):227–234.
- , , , et al. Liberal or restrictive transfusion in high‐risk patients after hip surgery. N Engl J Med. 2011;365(26):2453–2462.
- , , , et al. Transfusion requirements after cardiac surgery: the TRACS randomized controlled trial. JAMA. 2010;304(14):1559–1567.
- , , , et al. Lowering the hemoglobin threshold for transfusion in coronary artery bypass procedures: effect on patient outcome. Transfusion. 1999;39(10):1070–1077.
- , , , et al. Transfusion strategies for acute upper gastrointestinal bleeding. N Engl J Med. 2013;368(1):11–21.
- , , , et al. Liberal versus restrictive transfusion thresholds for patients with symptomatic coronary artery disease. Am Heart J. 2013;165(6):964–971.
- , , , et al. Conservative versus liberal red cell transfusion in acute myocardial infarction (the CRIT Randomized Pilot Study). Am J Cardiol. 2011;108(8):1108–1111.
- , , , et al. Red blood cell transfusion: a clinical practice guideline from the AABB. Ann Intern Med. 2012;157(1):49–58.
- , . Is fresh frozen plasma overtransfused in the United States? Transfusion. 2004;44(11):1674–1675.
- , , , et al. The effect of plasma transfusion on morbidity and mortality: a systematic review and meta‐analysis. Transfusion. 2010;50(6):1370–1383.
- , . Why do physicians request fresh frozen plasma? Transfusion. 2004;44(9):1393–1394.
- . Predicting hemorrhage using preoperative coagulation screening assays. Curr Hematol Rep. 2004;3(5):324–330.
- , . Plasma transfusion for bedside, radiologically guided, and operating room invasive procedures. Transfusion. 2012;52(suppl 1):20S–29S.
- , ; Transfusion Medicine/Hemostasis Clinical Trials Network. Paucity of studies to support that abnormal coagulation test results predict bleeding in the setting of invasive procedures: an evidence‐based review. Transfusion. 2005;45(9):1413–1425.
- . Interpretation of the international normalised ratio in patients with liver disease. Lancet. 2002;359(9300):47–48.
- , , . Effect of fresh‐frozen plasma transfusion on prothrombin time and bleeding in patients with mild coagulation abnormalities. Transfusion. 2006;46(8):1279–1285.
- , . Toward rational fresh frozen plasma transfusion: The effect of plasma transfusion on coagulation test results. Am J Clin Pathol. 2006;126(1):133–139.
- , , , , . Is fresh‐frozen plasma clinically effective? An update of a systematic review of randomized controlled trials. Transfusion. 2012;52(8):1673–1686; quiz 1673.
- , , , et al. Evidence‐based practice guidelines for plasma transfusion. Transfusion. 2010;50(6):1227–1239.
- , , , et al. Consensus guidelines for periprocedural management of coagulation status and hemostasis risk in percutaneous image‐guided interventions. J Vasc Interv Radiol. 2012;23(6):727–736.
- , . Lack of increased bleeding after paracentesis and thoracentesis in patients with mild coagulation abnormalities. Transfusion. 1991;31(2):164–171.
- , . Central venous cannulation in patients with liver disease and coagulopathy—a prospective audit. Intensive Care Med. 1999;25(5):481–485.
- ASGE Standards of Practice Committee; , , , et al. Management of antithrombotic agents for endoscopic procedures. Gastrointest Endosc. 2009;70(6):1060–1070.
- , , , . New strategies for the optimal use of platelet transfusions. Hematology Am Soc Hematol Educ Program. 2008:198–204.
- , . Thrombocytopenia: mechanisms and management of defects in platelet production. Clin Haematol. 1978;7(3):523–539.
- , , . The quantitative relation between platelet count and hemorrhage in patients with acute leukemia. N Engl J Med. 1962;266:905–909.
- , , , et al. The threshold for prophylactic platelet transfusions in adults with acute myeloid leukemia. Gruppo Italiano Malattie Ematologiche Maligne dell'Adulto. N Engl J Med. 1997;337(26):1870–1875.
- , , , , , . Randomized study of prophylactic platelet transfusion threshold during induction therapy for adult acute leukemia: 10,000/microL versus 20,000/microL. J Clin Oncol. 1997;15(3):1143–1149.
- , , , et al. Safety and cost effectiveness of a 10 x 10(9)/L trigger for prophylactic platelet transfusions compared with the traditional 20 x 10(9)/L trigger: a prospective comparative trial in 105 patients with acute myeloid leukemia. Blood. 1998;91(10):3601–3606.
- , , , et al. A prospective randomized trial of prophylactic platelet transfusion and bleeding incidence in hematopoietic stem cell transplant recipients: 10,000/L versus 20,000/microL trigger. Biol Blood Marrow Transplant. 2002;8(10):569–576.
- . Evidence‐based platelet transfusion guidelines. Hematology Am Soc Hematol Educ Program. 2007:172–178.
- , , , et al. Prophylactic platelet transfusion for prevention of bleeding in patients with haematological disorders after chemotherapy and stem cell transplantation. Cochrane Database Syst Rev. 2012;5:CD004269.
- , , , et al. Indications for platelet transfusion in children with acute leukemia. Am J Hematol. 1982;12(4):347–356.
- , , , , . Platelet prophylaxis in acute non‐lymphoblastic leukaemia. Lancet. 1978;1(8058):267.
- , , , et al. A no‐prophylaxis platelet‐transfusion strategy for hematologic cancers. N Engl J Med. 2013;368(19):1771–1780.
- , . Transfusion in the operating room and the intensive care unit: current practice and future directions. Int Anesthesiol Clin. 2000;38(4):149–169.
- , , . The risk of spinal haematoma following neuraxial anaesthesia or lumbar puncture in thrombocytopenic individuals. Br J Haematol. 2010;148(1):15–25.
- , . Personal practice: how we manage the risk of bleeding and thrombosis in children and young adults with acute lymphoblastic leukaemia. Br J Haematol. 2011;152(5):505–511.
- , , , , . Safety of lumbar puncture for adults with acute leukemia and restrictive prophylactic platelet transfusion. Ann Hematol. 2003;82(9):570–573.
- , , , , . Optimal preprocedural platelet transfusion threshold for central venous catheter insertions in patients with thrombocytopenia. Transfusion. 2011;51(11):2269–2276.
- , , . Central venous catheter placement in patients with disorders of hemostasis. Chest. 1996;110(1):185–188.
- , , , , , . Central venous catheterization in patients with coagulopathy. Arch Surg. 1992;127(3):273–275.
Although inpatient blood product transfusion is common, many uses have not been subject to rigorous clinical study, and great practice variations exist. Of particular interest to the hospitalist is the use of red blood cells (RBCs), plasma, and platelets prior to an invasive procedure to correct anemia or a perceived bleeding risk. When considering blood product use in this context, the hospitalist faces 2 questions. First, what are the risks of anemia, thrombocytopenia, or abnormal coagulation tests? Second, what is the evidence that administration of the blood product in question improves outcomes such as bleeding and mortality? We address these questions in this review of the data supporting the use of RBCs, platelets, and plasma prior to invasive procedures.
RED BLOOD CELLS
Anemia is the most common hematologic concern in the perioperative setting. In 2009, approximately 15 million units of RBCs were transfused in the United States, 40% to 70% of which were given in the perioperative setting.[1, 2]
Risks of Periprocedural Anemia
The best evidence regarding the risks of perioperative anemia comes from studies in patients who declined blood transfusions. A retrospective cohort study of 1958 consecutive surgical patients who refused transfusions due to religious reasons showed an increase in 30‐day mortality as preoperative hemoglobin values fell, especially for those with preoperative hemoglobin concentrations 6 g/dL.[3] For patients with underlying cardiovascular disease, the risk of death was greatest when the preoperative hemoglobin value was 10 g/dL. Subsequent analysis showed that mortality rose with postoperative hemoglobin levels 7 g/dL, with a sharp rise in morbidity (myocardial infarction [MI], congestive heart failure [CHF], arrhythmia, and infection) and mortality in those with postoperative hemoglobin of 5 to 6 g/dL.[4] These results are consistent with studies of healthy volunteers who underwent acute isovolumic hemoglobin reduction, demonstrating clinical changes when hemoglobin values fell to 5 to 7 g/dL.[5, 6, 7, 8]
Several large, retrospective cohort studies have evaluated anemia and perioperative morbidity and mortality. A 2007 study analyzed data from over 310,000 predominantly male patients over age 65 years undergoing major noncardiac surgery.[9] Even mild degrees of preoperative anemia were associated with increased 30‐day mortality and cardiovascular morbidity (cardiac arrest or Q‐wave MI), with a monotonic rise in mortality (3.5%35.4%) and cardiac events (1.8%14.6%) when the hematocrit was 39%. Utilizing data from the American College of Surgeons' National Surgical Quality Improvement Program database, a 2011 study evaluated over 227,000 patients who underwent major noncardiac surgery.[10] Again, even mild anemia (hematocrit 29%39%) was independently associated with an increase in 30‐day composite morbidity, including MI, stroke, pneumonia, acute renal failure, wound infection, sepsis (13.27%), and mortality (3.52%).
Does RBC Transfusion Improve Outcomes?
Although the evidence argues that perioperative anemia is associated with poor surgical outcomes, it is not clear whether RBC transfusion in the perioperative setting improves these outcomes. Furthermore, the optimal perioperative hemoglobin level remains controversial. Importantly, most periprocedural trials were not sufficiently powered to assess differences in clinical outcomes.[11]
Several noteworthy randomized controlled trials (RCTs) comprise the bulk of the evidence regarding transfusion thresholds and are summarized in Table 1. The Transfusion Requirements in Critical Care (TRICC) was a landmark trial that randomized patients to a restrictive or a liberal transfusion strategy and demonstrated a trend toward lower 30‐day mortality in the restrictive group.[12] In addition, the restrictive transfusion group had lower rates of myocardial infarction and pulmonary edema. A subsequent subanalysis found no difference in mortality in patients with underlying cardiovascular disease.[13]
| Study/Year | No. of Patients | Brief Description | Transfusion Strategy | Outcomes (Restrictive Versus Liberal) |
|---|---|---|---|---|
| ||||
| Herbert et al. (TRICC)/1999[12] | 838 | Normovolemic patients admitted to ICU with Hg 9 g/dL within 72 hours of admission. | Restrictive: Hg maintained 79 g/dL. Liberal: Hg maintained 1012 g/dL. | 30‐day mortality (18.7% vs 23.3%, P=0.11). Pulmonary edema (5.3% vs 10.7%, P0.01) and MI (0.7% vs 2.9%, P=0.02) rates while in the ICU. |
| Carson et al. (FOCUS)/2011[14] | 2016 | Patients undergoing surgery for hip fracture with a history of cardiovascular disease or cardiovascular risk factors. | Restrictive: transfused for Hg 8 g/dL or symptomatic anemia. Liberal: transfused to maintain Hg >10 g/dL. | Primary outcome of death or the inability to walk 10 feet across the room without human assistance at 60 days (34.7% vs 35.2%, P=0.9). Composite of in‐hospital ACS or death (5.2% vs. 4.3%). The frequencies of in‐hospital clinical events and adverse events did not differ significantly between groups. |
| Hajjar et al. (TRACS)/2010[15] | 502 | Patients admitted to ICU for elective cardiac surgery with cardiopulmonary bypass. | Restrictive: transfused to maintain Hct 24%. Liberal: transfused to maintain Hct 30%. | Composite end point of 30‐day all‐cause mortality+severe in‐hospital morbidity (cardiogenic shock, ARDS, or AKI requiring renal replacement therapy) (11% vs 10%, P=0.85). |
| Bracey et al./1999[16] | 428 | Patients undergoing first‐time elective coronary surgical revascularization. | Restrictive: postoperative transfusion for Hg 8 g/dL or predetermined clinical conditions requiring RBC transfusion (ie, hemodynamic instability). | Hospital mortality (1.4% vs 2.7%, P=0.3). |
| Liberal: transfusion at discretion of physician with institutional guidelines recommending postoperative transfusion for Hg 9 g/dL. | No differences in morbidity (including pulmonary complications, renal failure, and MI), duration of mechanical ventilation, and length of hospital stay (7.52.9 days vs 7.94.9 days). | |||
| Villanueva et al./2013[17] | 921 | Severe upper GI bleeding, gastroscopy within 6 hours. | Restrictive: transfused if Hg 7 g/dL. Liberal: transfused if Hg 9 g/dL. | Survival at 6 weeks (95% vs 91%, P=0.02). |
| Rebleeding (10% vs 16%, P=0.01). Adverse event rate including transfusion reactions, ACS, AKI, pulmonary complications, infection, and stroke or TIA (40% vs 48%, P=0.02). | ||||
| Carson et al. (MINT)/2013[18] | 110 | Pilot study in patients with Hg 10 g/dL and either ACS or stable angina undergoing cardiac catheterization. | Restrictive: transfused if Hg 8 g/dL or symptomatic anemia. Liberal: transfused to raise Hg 10 g/dL. | Composite primary outcome of all cause mortality+MI+unscheduled coronary revascularization within 30 days (25.5% vs 10.9%, P=0.054). Death at 30 days (13% vs 1.8%, P=0.032). |
| Cooper et al. (CRIT)/2011[19] | 45 | Pilot study in patients with acute MI (chest pain and positive cardiac biomarker) and Hct 30% within 72 hours of symptom onset. | Restrictive: transfused to maintain Hct 24%27%. | The primary composite outcome (in‐hospital death, recurrent MI, or new or worsening CHF) (13% vs 38%, P=0.046). |
| Liberal: transfused to maintain Hct 30% to 33%. | ||||
The largest RCT of transfusion thresholds, the Transfusion Trigger Trial for Functional Outcomes in Cardiovascular Patients Undergoing Surgical Hip Fracture Repair (FOCUS), randomized patients undergoing surgery for hip fracture with a history of cardiovascular disease or cardiovascular risk factors to a restrictive or liberal transfusion strategy.[14] The primary outcome of death or the inability to walk 10 feet across the room without human assistance at 60 days was similar in both the liberal and restrictive group, and the composite rate of acute coronary syndrome and in‐hospital death, stroke, CHF, venous thromboembolism, and the frequencies of other in‐hospital events or lengths of stay did not differ between the groups.
Several RCTs have examined the effect of transfusion practice on patients undergoing elective cardiac surgery. The Transfusion Requirements After Cardiac Surgery (TRACS) study did not show a difference in the primary composite outcome of 30‐day all‐cause mortality and in‐hospital morbidity between the restrictive and liberal transfusion groups.[15] A second cardiac surgery trial also found no difference in mortality or morbidity outcomes when comparing a restrictive versus liberal transfusion threshold.[16]
A recent RBC transfusion trial evaluated transfusion thresholds in patients with severe upper gastrointestinal bleeding.[17] All patients underwent gastroscopy within 6 hours of hospital admission and were randomly allocated to a restrictive or liberal transfusion threshold. The restrictive group had a significantly higher survival at 6 weeks when compared to the liberal group, as well as lower rates of adverse events such as further bleeding, acute coronary syndrome, transfusion reactions, and pulmonary edema.
Finally, the Myocardial Ischemia and Transfusion (MINT) pilot trial evaluated 110 patients with hemoglobin concentration l10 g/dL admitted for ST‐segment elevation MI, nonST‐segment elevation MI, unstable angina, or stable coronary disease undergoing a cardiac catheterization.[18] The composite end point of death, MI, and unscheduled revascularizations within 30 days was higher in the restrictive group when compared to the liberal group, and 30‐day mortality was less frequent in liberal strategy compared to restrictive strategy. Given the small study size and the fact that patients in the restrictive group were significantly older than those in the liberal group, the results of this study must be interpreted carefully. The results of this trial contrast an earlier RCT of 45 patients admitted with acute MI, which showed higher rates of in‐hospital death, recurrent MI, or CHF in the liberal transfusion group versus the restrictive group.[19] Clearly, there is insufficient evidence to define transfusion threshold in acute coronary syndrome, and further study is needed in this area.
A recent meta‐analysis of 19 RCTs through February 2011 compared restrictive versus liberal transfusion strategies.[11] Although not all of these studies looked at periprocedural RBC transfusion, employment of a restrictive strategy saved an average of 1.19 units of blood per patient transfused without a difference in 30‐day mortality. This meta‐analysis also showed that in‐hospital mortality was 23% lower in patients assigned to a restrictive strategy, and there were no differences in cardiac events or strokes between restrictive and liberal strategies.
Encompassing the latest evidence, the AABB (formerly, the American Association of Blood Banks) guidelines recommend a restrictive transfusion strategy utilizing a transfusion threshold of 7 to 8 g/dL in stable hospitalized patients.[20] The AABB also recommends a restrictive strategy for patients with underlying cardiovascular disease, advocating for a transfusion threshold of 8 g/dL or less, or for symptoms of anemia. No transfusion recommendations were provided for acute coronary syndrome.
PLASMA
In the United States, approximately 4 million units of frozen plasma (FP) were transfused in 2006, and recent data demonstrate that relative to RBCs, the number of FP units transfused in the United States is higher than in other countries with advanced medical care.[1, 21, 22] Many transfusions are given prior to a procedure to correct perceived bleeding risk.
Risks of Periprocedural Coagulopathy
Laboratory measures of coagulation such as prothrombin time (PT)/emnternational normalized ratio (INR) are frequently used to guide transfusion of FP. A 3‐month audit at Massachusetts General Hospital found approximately one‐third of all FP units used outside of the operating room were requested before a procedure because of an elevated INR.[23] However, PT and activated partial thromboplastin time were never validated in nonbleeding patients, and INR was never validated for use in non‐vitamin K antagonist settings.[24, 25]
A recent systematic review assessed whether abnormalities in preprocedure coagulation tests correlate with increased risk of bleeding.[26] Analysis of 24 observational studies and 1 RCT included nearly 2000 procedures performed on patients with abnormal coagulation studies and concluded that there is not sufficient data to support PT and INR as predictors of bleeding risk. One study examining how well INR can be used to predict the degree of deficiency of a given factor found that blood samples with an INR as high as 1.9 contained factor levels adequate to support hemostasis.[27]
Furthermore, there is surprisingly little evidence to support the ability of FP to correct an abnormal INR. Given that the INR of FP can be as high as 1.3, transfusion will have little effect on minimally elevated INRs. This point is highlighted by a prospective study evaluating the effectiveness of transfusing FP to correct an increased INR in patients with a mildly prolonged PT (13.1 to 17 seconds). Of 121 patients studied, 1% normalized their INR, and only 15% demonstrated improvement at least halfway to normal.[28] There was no correlation between plasma dose and change in INR. Additionally, a study attempting to quantify the relationship between change in INR and the pretransfusion INR observed that a reliable significant change in INR is only likely when the INR is >1.7.[29]
Does FP Transfusion Improve Outcomes?
Most clinical uses of FP are not supported by evidence from RCTs. A 2012 systematic review examining the clinical effectiveness of FP included RCT data from 1964 to 2011.[30] In terms of periprocedural FP administration, this review included studies of FP in cardiac surgery and revealed a lack of evidence to support the effectiveness of FP to prevent bleeding. Notably, this review did not examine the use of FP prior to percutaneous procedures.
Despite the paucity of evidence to guide FP transfusions, in 2010 the AABB published practice guidelines to assist practitioners in the use of FP.[22, 31] In terms of periprocedural FP administration, these practice guidelines questioned the use of FP in surgical or trauma patients without massive bleeding, as only 6 studies were available for analysis. The panel could not recommend for or against the use of FP in surgical patients, although meta‐analysis showed that FP transfusion was associated with a trend toward increased risk of death. No studies of nonsurgical invasive procedures met review inclusion criteria. Given the potential for harm and the lack of data with regard to use of FP prior to nonsurgical invasive procedures, hospitalists should view the use of FP prior to a procedure with caution.
The Society of Interventional Radiology (SIR) recently published consensus guidelines for periprocedural management of coagulation status and hemostasis risk in percutaneous‐guided interventions.[32] Acknowledging the lack of data regarding periprocedural management of patients with abnormal coagulation parameters, this society's Standards of Practice Committee recommends that in the absence of warfarin treatment or liver disease, preprocedure INR testing should be conducted only prior to procedures with moderate to high bleeding risk.[32] Notably, low bleeding risk procedures include thoracentesis, paracentesis, drainage catheter exchange, and dialysis access interventions. This recommendation is consistent with observational studies of paracentesis and thoracentesis, which have failed to show increased bleeding risk in patients with an elevated INR. The largest of these studies retrospectively examined 608 patient procedures and found no significant difference in hemoglobin drop or average hemoglobin among patients with normal PT compared to patients with prolonged PT who underwent either a paracentesis or thoracentesis.[33]
In patients scheduled to undergo moderate or high bleeding risk procedures, these guidelines recommend that the INR be corrected to 1.5, although this recommendation was derived by Delphi consensus of expert practitioners due to lack of available data.[32] Central venous catheter insertion highlights the discrepancy between SIR recommendations and review of the available, albeit limited, data. A study of 580 patients with an INR >1.5 found that only 1 patient had a major bleeding event due to accidental puncture of the carotid artery.[34] Along with several others, this study is cited as evidence that central venous catheterization can be performed safely in patients with coagulation abnormalities.[32] However, because of the observational nature of these data, SIR guidelines categorize central venous catheterization as a moderate risk procedure, and as such recommend a preprocedure INR check and correction of INR to 1.5.[32] There are no prospective studies looking at what INR it is safe to perform endoscopic interventions.[35] Additionally, there are no studies looking at the effect of preprocedure FP administration on endoscopic outcomes.
PLATELETS
Over 10 million units of platelets are transfused in the United States annually.[1] Severe thrombocytopenia is thought to confer increased bleeding risk, and allogenic platelet transfusions are commonly given to thrombocytopenic patients as supportive care.[36] Given that recommendations on platelet transfusion thresholds are largely derived from studies looking at patients with hematological malignancies, there is concern about using these data to inform transfusion thresholds in other patient populations. Despite this limitation, we examine the evidence for an optimum platelet transfusion threshold and review available practice guidelines for the perioperative setting.
Risks of Thrombocytopenia and When to Transfuse
Hemostasis depends on an adequate number of functional platelets along with an intact coagulation system. Circulating platelets likely contribute to hemostasis via an endothelial supportive function by plugging gaps in the endothelium of blood vessels.[36] Early observational studies of clinically stable patients with chronic thrombocytopenia showed that significant spontaneous bleeding through an intact vascular system typically occurred with a platelet count below 5,000 platelets/L.[37, 38] Despite this, a platelet count of 20,000/L was adopted as a transfusion threshold and used for over 25 years.[36]
Beginning in the late 1990s, RCTs comparing a prophylactic transfusion trigger of 10,000 platelets/L to 20,000 platelets/L showed no difference in hemorrhagic risks or RBC transfusion requirements.[39, 40, 41, 42] The American Society of Clinical Oncology and the British Committee for Standards in Haematology (BCSH) now recommend a prophylactic platelet transfusion trigger of 10,000/L for all patients with chronic thrombocytopenia due to hypoproliferative causes.[43] A 2012 Cochrane review of 13 RCTs examining prophylactic platelet transfusion for prevention of bleeding in patients with hematological disorders did not find evidence to change this recommendation, but did question the strength of the data showing bleeding risk equivalency between 10,000/L and 20,000/L.[44]
In addition to studies examining platelet transfusion thresholds, various studies have questioned whether platelet transfusions should be given prophylactically before bleeding onset or as treatment afterward. Two early small RCTs and several observational studies examining prophylactic versus therapeutic platelet transfusion failed to show increased risk of bleeding or mortality in patients with leukemia who were transfused only after bleeding had begun.[45, 46] However, a recent RCT of 600 patients undergoing chemotherapy or stem cell transplantation showed that patients who were not given prophylactic platelet transfusions had more days with bleeding and shorter time to first bleeding episode compared to patients given prophylactic platelet transfusion for a platelet count below 10,000/L.[47] This study supports continued use of prophylactic platelet transfusions to prevent bleeding. Based on this recent trial and the 2012 Cochrane review, prophylactic platelet transfusion for a platelet count lower than 10,000/L is currently the standard of care for patients with chronic thrombocytopenia due to a hypoproliferative cause.
Perioperative Platelet Transfusion Practice Guidelines
It is unknown at what platelet count the risk of surgical bleeding increases, and there are no definitive studies to guide the use of prophylactic platelet transfusions for patients prior to procedures. Given this paucity of data, we are left to review consensus expert opinion and the nonrandomized studies that inform them.
Prior to surgical procedures, prophylactic platelet transfusion is rarely required for platelet counts >100,000/L and is usually required for a platelet count 50,000/L.[48] For platelet counts in the range of 50,000/L to 100,000/L, guidelines from the American Society of Anesthesiologists and the Royal College of Physicians state that platelet transfusion should be based on the extent of surgery, the risk and ability to control bleeding, the rate of bleeding with regard to trauma, the presence of platelet dysfunction, and other coagulation abnormalities.[48] Recognizing the inability to easily control bleeding during neurosurgical procedures and the potential for significant adverse outcomes with intracranial bleeding, experts recommend that neurosurgical patients have platelet counts maintained >100,000/L.[43]
For bedside and minimally invasive procedures, various thresholds are considered standard of care without rigorous supporting data. For example, based solely on interpretation of case reports, a platelet count of 80,000/L has been proposed by the American Red Cross, the French Society of Anesthesiology, and the BCSH for epidural anesthesia in patients with thrombocytopenia due to idiopathic thrombocytopenia.[49] For endoscopic procedures, the American Society for Gastrointestinal Endoscopy recommends a platelet count of 50,000/L for therapeutic procedures and 20,000/L for low‐risk diagnostic procedures.[35]
Procedures such as lumbar puncture, central venous catheterization, paracentesis, and thoracentesis have also not been well studied in the setting of thrombocytopenia. Based on case reports and case series, lumbar puncture is thought to require a platelet count of 10,000 to 20,000/L in patients with marrow failure but 50,000/L in patients without hematologic malignancies.[49, 50, 51] In terms of central venous catheter placement, a recent retrospective analysis included 193 adult leukemic patients who received 604 central venous catheter placements at 1 institution.[52] This study showed that only platelet counts below 20,000/L were associated with a higher risk of nonsevere bleeding. These results are consistent with several earlier observational studies reporting a very low risk of bleeding in patients with thrombocytopenia requiring central venous catheterization.[53, 54] With regard to paracentesis and thoracentesis, a study of 391 patients who underwent paracentesis and 207 patients who underwent thoracentesis did not demonstrate bleeding with platelet counts of 50,000/L to 100,000/L.[33] However, no specific platelet transfusion threshold was identified by this retrospective single‐institution study.
SUMMARY
We summarize our recommendations in Table 2, recognizing that evidence is limited and many of these recommendations are based on expert opinion. The limited evidence highlights opportunity for hospitalist‐driven research in periprocedural blood product transfusion.
|
| RBC transfusion |
| Transfusion threshold of Hg 78 g/dL or symptomatic anemia in most hemodynamically stable hospitalized patients. |
| Transfusion threshold of Hg 8 g/dL or for symptomatic anemia in patients with underlying CV disease. |
| Optimal transfusion threshold is unknown in patients with acute coronary syndrome. |
| Frozen plasma transfusion |
| Insufficient evidence to support routine INR testing for low‐risk procedures in the absence of warfarin treatment or liver disease. |
| Transfusion may be considered prior to procedures with moderate to high bleeding risk when INR >1.5. |
| Insufficient evidence to guide transfusion practice prior to endoscopic procedures. |
| Platelet transfusion |
| Transfusion threshold of 20,000/L for low bleeding risk procedures, including central venous catheters. |
| Transfusion threshold of 50,000100,000/L for moderate bleeding risk procedures. |
| Transfusion threshold of 100,000/L for neurosurgical procedures. |
| Transfusion threshold of 50,000/L for therapeutic endoscopy and 20,000/L for low‐risk diagnostic endoscopy. |
ACKNOWLEDGEMENTS
Disclosures: Dr. Carson reports grants from the National Institutes of Health (NIH) during the conduct of the study, personal fees from Cerus Corporation, grants from Amgen, and grants from the NIH outside the submitted work.
- , , , . Report of the US Department of Health and Human Services. The 2009 national blood collection and utilization survey report. Washington, DC: US Department of Health and Human Services, Office of the Assistant Secretary for Health; 2011.
- , , , , . Where does blood go? Prospective observational study of red cell transfusion in north England. BMJ. 2002;325(7368):803.
- , , , et al. Effect of anaemia and cardiovascular disease on surgical mortality and morbidity. Lancet. 1996;348(9034):1055–1060.
- , , , . Mortality and morbidity in patients with very low postoperative Hb levels who decline blood transfusion. Transfusion. 2002;42(7):812–818.
- , , , et al. Human cardiovascular and metabolic response to acute, severe isovolemic anemia. JAMA. 1998;279(3):217–221.
- , , , et al. Electrocardiographic ST‐segment changes during acute, severe isovolemic hemodilution in humans. Anesthesiology. 2000;93(4):1004–1010.
- , , , et al. Acute severe isovolemic anemia impairs cognitive function and memory in humans. Anesthesiology. 2000;92(6):1646–1652.
- , , , , , . Fatigue during acute isovolemic anemia in healthy, resting humans. Transfusion. 2000;40(4):457–460.
- , , , et al. Preoperative hematocrit levels and postoperative outcomes in older patients undergoing noncardiac surgery. JAMA. 2007;297(22):2481–2488.
- , , , et al. Preoperative anaemia and postoperative outcomes in non‐cardiac surgery: a retrospective cohort study. Lancet. 2011;378(9800):1396–1407.
- , , . Transfusion thresholds and other strategies for guiding allogeneic red blood cell transfusion. Cochrane Database Syst Rev. 2012;4:CD002042.
- , , , et al. A multicenter, randomized, controlled clinical trial of transfusion requirements in critical care. Transfusion Requirements in Critical Care Investigators, Canadian Critical Care Trials Group. N Engl J Med. 1999;340(6):409–417.
- , , , et al. Is a low transfusion threshold safe in critically ill patients with cardiovascular diseases? Crit Care Med. 2001;29(2):227–234.
- , , , et al. Liberal or restrictive transfusion in high‐risk patients after hip surgery. N Engl J Med. 2011;365(26):2453–2462.
- , , , et al. Transfusion requirements after cardiac surgery: the TRACS randomized controlled trial. JAMA. 2010;304(14):1559–1567.
- , , , et al. Lowering the hemoglobin threshold for transfusion in coronary artery bypass procedures: effect on patient outcome. Transfusion. 1999;39(10):1070–1077.
- , , , et al. Transfusion strategies for acute upper gastrointestinal bleeding. N Engl J Med. 2013;368(1):11–21.
- , , , et al. Liberal versus restrictive transfusion thresholds for patients with symptomatic coronary artery disease. Am Heart J. 2013;165(6):964–971.
- , , , et al. Conservative versus liberal red cell transfusion in acute myocardial infarction (the CRIT Randomized Pilot Study). Am J Cardiol. 2011;108(8):1108–1111.
- , , , et al. Red blood cell transfusion: a clinical practice guideline from the AABB. Ann Intern Med. 2012;157(1):49–58.
- , . Is fresh frozen plasma overtransfused in the United States? Transfusion. 2004;44(11):1674–1675.
- , , , et al. The effect of plasma transfusion on morbidity and mortality: a systematic review and meta‐analysis. Transfusion. 2010;50(6):1370–1383.
- , . Why do physicians request fresh frozen plasma? Transfusion. 2004;44(9):1393–1394.
- . Predicting hemorrhage using preoperative coagulation screening assays. Curr Hematol Rep. 2004;3(5):324–330.
- , . Plasma transfusion for bedside, radiologically guided, and operating room invasive procedures. Transfusion. 2012;52(suppl 1):20S–29S.
- , ; Transfusion Medicine/Hemostasis Clinical Trials Network. Paucity of studies to support that abnormal coagulation test results predict bleeding in the setting of invasive procedures: an evidence‐based review. Transfusion. 2005;45(9):1413–1425.
- . Interpretation of the international normalised ratio in patients with liver disease. Lancet. 2002;359(9300):47–48.
- , , . Effect of fresh‐frozen plasma transfusion on prothrombin time and bleeding in patients with mild coagulation abnormalities. Transfusion. 2006;46(8):1279–1285.
- , . Toward rational fresh frozen plasma transfusion: The effect of plasma transfusion on coagulation test results. Am J Clin Pathol. 2006;126(1):133–139.
- , , , , . Is fresh‐frozen plasma clinically effective? An update of a systematic review of randomized controlled trials. Transfusion. 2012;52(8):1673–1686; quiz 1673.
- , , , et al. Evidence‐based practice guidelines for plasma transfusion. Transfusion. 2010;50(6):1227–1239.
- , , , et al. Consensus guidelines for periprocedural management of coagulation status and hemostasis risk in percutaneous image‐guided interventions. J Vasc Interv Radiol. 2012;23(6):727–736.
- , . Lack of increased bleeding after paracentesis and thoracentesis in patients with mild coagulation abnormalities. Transfusion. 1991;31(2):164–171.
- , . Central venous cannulation in patients with liver disease and coagulopathy—a prospective audit. Intensive Care Med. 1999;25(5):481–485.
- ASGE Standards of Practice Committee; , , , et al. Management of antithrombotic agents for endoscopic procedures. Gastrointest Endosc. 2009;70(6):1060–1070.
- , , , . New strategies for the optimal use of platelet transfusions. Hematology Am Soc Hematol Educ Program. 2008:198–204.
- , . Thrombocytopenia: mechanisms and management of defects in platelet production. Clin Haematol. 1978;7(3):523–539.
- , , . The quantitative relation between platelet count and hemorrhage in patients with acute leukemia. N Engl J Med. 1962;266:905–909.
- , , , et al. The threshold for prophylactic platelet transfusions in adults with acute myeloid leukemia. Gruppo Italiano Malattie Ematologiche Maligne dell'Adulto. N Engl J Med. 1997;337(26):1870–1875.
- , , , , , . Randomized study of prophylactic platelet transfusion threshold during induction therapy for adult acute leukemia: 10,000/microL versus 20,000/microL. J Clin Oncol. 1997;15(3):1143–1149.
- , , , et al. Safety and cost effectiveness of a 10 x 10(9)/L trigger for prophylactic platelet transfusions compared with the traditional 20 x 10(9)/L trigger: a prospective comparative trial in 105 patients with acute myeloid leukemia. Blood. 1998;91(10):3601–3606.
- , , , et al. A prospective randomized trial of prophylactic platelet transfusion and bleeding incidence in hematopoietic stem cell transplant recipients: 10,000/L versus 20,000/microL trigger. Biol Blood Marrow Transplant. 2002;8(10):569–576.
- . Evidence‐based platelet transfusion guidelines. Hematology Am Soc Hematol Educ Program. 2007:172–178.
- , , , et al. Prophylactic platelet transfusion for prevention of bleeding in patients with haematological disorders after chemotherapy and stem cell transplantation. Cochrane Database Syst Rev. 2012;5:CD004269.
- , , , et al. Indications for platelet transfusion in children with acute leukemia. Am J Hematol. 1982;12(4):347–356.
- , , , , . Platelet prophylaxis in acute non‐lymphoblastic leukaemia. Lancet. 1978;1(8058):267.
- , , , et al. A no‐prophylaxis platelet‐transfusion strategy for hematologic cancers. N Engl J Med. 2013;368(19):1771–1780.
- , . Transfusion in the operating room and the intensive care unit: current practice and future directions. Int Anesthesiol Clin. 2000;38(4):149–169.
- , , . The risk of spinal haematoma following neuraxial anaesthesia or lumbar puncture in thrombocytopenic individuals. Br J Haematol. 2010;148(1):15–25.
- , . Personal practice: how we manage the risk of bleeding and thrombosis in children and young adults with acute lymphoblastic leukaemia. Br J Haematol. 2011;152(5):505–511.
- , , , , . Safety of lumbar puncture for adults with acute leukemia and restrictive prophylactic platelet transfusion. Ann Hematol. 2003;82(9):570–573.
- , , , , . Optimal preprocedural platelet transfusion threshold for central venous catheter insertions in patients with thrombocytopenia. Transfusion. 2011;51(11):2269–2276.
- , , . Central venous catheter placement in patients with disorders of hemostasis. Chest. 1996;110(1):185–188.
- , , , , , . Central venous catheterization in patients with coagulopathy. Arch Surg. 1992;127(3):273–275.
CDC Report Confirms Hospitalists’ Role in Fight against Antibiotic-Resistant Pathogens
Describing the enormity of the problem of antibiotic resistance and warning of the “potentially catastrophic consequences of inaction,” the Centers for Disease Control and Prevention (CDC) announced in September that more than 2 million people a year are sickened by infections that are resistant to treatment with antibiotics.
Moreover, the CDC says 23,000 people die as a result.
The report is a call to action for hospitalists, who are in a position to participate in efforts to prevent infections and control their spread once they’re discovered, says Jean Patel, PhD, deputy director of the office of antimicrobial resistance at the CDC. She also says the medical community cannot expect that new treatments will become available to fight all of these new infections.

—Robert Orenstein, DO, infectious disease expert, Mayo Clinic, Rochester, Minn.
“All of the drugs also are going to have some gaps in their range of activity” Dr. Patel explains. “For that reason, we’re sounding the alarm that it’s important to pay attention to infection control and antibiotic stewardship practices.”
The report, “Antibiotic Resistance Threats to the United States, 2013” creates three categories of antibiotic-resistant pathogens. In the “urgent” tier are Clostridium difficile, which the CDC estimates is responsible for 250,000 infections a year and 14,000 deaths; carbapenem-resistant Enterobacteriaceae, estimated to be responsible for 9,000 infections a year and 600 deaths; and Neisseria gonorrhoeae, at 246,000 infections.
These bacteria are considered an “immediate public health threat that requires urgent and aggressive action.”
Twelve pathogens in the second category, described as “a serious concern,” require “prompt and sustained action to ensure the problem does not grow.” Of particular interest to hospitalists in this group, Dr. Patel says, is methicillin-resistant Staphylococcus aureus (MRSA). The CDC estimates that more than 80,000 severe MRSA infections and more than 11,000 deaths occur in the U.S. every year.
MRSA was not ranked as an “urgent” threat only because the number of infections is decreasing, and because there are antibiotics that still work on MRSA.
Another infection that should be on hospitalists’ radar is Streptococcus pneumoniae. A new vaccine is helping to decrease the number of these infections, but hospitalists should be vigilant about infections that could escape the vaccine and become resistant, Dr. Patel says.
Ketino Kobaidze, MD, assistant professor at the Emory University School of Medicine in Atlanta and a member of the antimicrobial stewardship and infectious disease control committees at Emory University Hospital Midtown, says the most important thing for hospitalists “is to follow up with whatever you’re ordering and notice right away what happens with these tests. If it’s positive or negative, redirect your care.”
Robert Orenstein, DO, an infectious disease expert at Mayo Clinic, praises the report and says hospitalists have a key role to play. “We need to educate them and build systems that target antimicrobials to the infecting agents and limit their use,” he says. TH
Tom Collins is a freelance writer in South Florida.
Describing the enormity of the problem of antibiotic resistance and warning of the “potentially catastrophic consequences of inaction,” the Centers for Disease Control and Prevention (CDC) announced in September that more than 2 million people a year are sickened by infections that are resistant to treatment with antibiotics.
Moreover, the CDC says 23,000 people die as a result.
The report is a call to action for hospitalists, who are in a position to participate in efforts to prevent infections and control their spread once they’re discovered, says Jean Patel, PhD, deputy director of the office of antimicrobial resistance at the CDC. She also says the medical community cannot expect that new treatments will become available to fight all of these new infections.
—Robert Orenstein, DO, infectious disease expert, Mayo Clinic, Rochester, Minn.
“All of the drugs also are going to have some gaps in their range of activity” Dr. Patel explains. “For that reason, we’re sounding the alarm that it’s important to pay attention to infection control and antibiotic stewardship practices.”
The report, “Antibiotic Resistance Threats to the United States, 2013” creates three categories of antibiotic-resistant pathogens. In the “urgent” tier are Clostridium difficile, which the CDC estimates is responsible for 250,000 infections a year and 14,000 deaths; carbapenem-resistant Enterobacteriaceae, estimated to be responsible for 9,000 infections a year and 600 deaths; and Neisseria gonorrhoeae, at 246,000 infections.
These bacteria are considered an “immediate public health threat that requires urgent and aggressive action.”
Twelve pathogens in the second category, described as “a serious concern,” require “prompt and sustained action to ensure the problem does not grow.” Of particular interest to hospitalists in this group, Dr. Patel says, is methicillin-resistant Staphylococcus aureus (MRSA). The CDC estimates that more than 80,000 severe MRSA infections and more than 11,000 deaths occur in the U.S. every year.
MRSA was not ranked as an “urgent” threat only because the number of infections is decreasing, and because there are antibiotics that still work on MRSA.
Another infection that should be on hospitalists’ radar is Streptococcus pneumoniae. A new vaccine is helping to decrease the number of these infections, but hospitalists should be vigilant about infections that could escape the vaccine and become resistant, Dr. Patel says.
Ketino Kobaidze, MD, assistant professor at the Emory University School of Medicine in Atlanta and a member of the antimicrobial stewardship and infectious disease control committees at Emory University Hospital Midtown, says the most important thing for hospitalists “is to follow up with whatever you’re ordering and notice right away what happens with these tests. If it’s positive or negative, redirect your care.”
Robert Orenstein, DO, an infectious disease expert at Mayo Clinic, praises the report and says hospitalists have a key role to play. “We need to educate them and build systems that target antimicrobials to the infecting agents and limit their use,” he says. TH
Tom Collins is a freelance writer in South Florida.
CDC Recommends Four “Core Actions” to Fight Antimicrobial Resistance
1. Prevent infections.
This might be the most obvious way to fight antibiotic-resistance—if there’s no infection, there is no need to worry about one that can’t be treated. Hospitalists can help prevent infection by quickly and effectively treating those who are infected to prevent the spread, washing hands, and promoting effective cleaning habits.
2. Tracking.
The CDC has programs to gather information on antibiotic-resistant infections, causes of infections, and risk factors for infections. With this information, hospitalists can stay aware of the threats. They can also help by remaining vigilant about signs of new resistance and helping to get that information to the CDC.
The CDC is now working on a new module that will collect antimicrobial-susceptibility data that’s generated in hospital labs, Dr. Patel says.
“This will be compiled in a national database and then made available to state and local public health departments that could track anti-microbial resistance trends in their own state,” she says. “We hope those data will then be used to identify new trends in anti-microbial resistance and used to strategize how to prevent resistance from being transmitted locally.”
3. Antibiotic stewardship.
The CDC says prescribing antibiotics only when necessary and tailoring treatment as narrowly as possible might be the most important step in fighting antimicrobial resistance. The CDC estimates that up to half of antibiotic use in humans is unnecessary.
The CDC is working to capture data on antibiotic use in healthcare settings, which will be used for benchmarking antibiotic use among different institutions and regions.
“I think this additional information will really help healthcare institutions measure how well antibiotics are being used in their institutions and make appropriate adjustments,” Dr. Patel says.
4. New drugs and diagnostic tests.
New antibiotics will be needed because, while resistance can be slowed, it cannot be stopped. However, the number of New Drug Application approvals for antibiotics has fallen drastically—nearly 20 from 1980 to 1984, but fewer than five from 2005 to 2012, according to the CDC report. TH