User login
Analysis reveals effects of sponsorship on animal studies

A new analysis indicates that animal studies not funded by industry produce favorable results more often than animal studies that are industry-funded.
In other words, published reports of non-industry-sponsored studies were more likely to contain data suggesting a drug was effective.
However, reports of industry-funded studies were more likely to contain favorable conclusions, even though data were less favorable.
Investigators recounted these findings in PLOS Biology.
They analyzed 63 studies in which statins were tested in animal models. Forty-two of the studies had quantitative results and disclosed sponsorship.
Among these studies, industry-sponsored research was less likely to measure a benefit for the statins in slowing or preventing arterial disease. Favorable results were reported in 47% (9/19) of the industry-sponsored studies and 72% (18/25) of the studies not sponsored by industry.
“The interests of the pharmaceutical industry might be best served by underestimating efficacy prior to clinical trials and overestimating efficacy in clinical trials,” said study author Lisa Bero, PhD, of the University of California, San Francisco.
“By underestimating efficacy in preclinical studies, the pharmaceutical industry could reduce the money spent on clinical trials that did not lead to marketable products. Because demonstrating drug efficacy in human studies is linked to drug company profits, drug companies may have more incentive to publish favorable efficacy findings of human drug studies than animal studies.”
However, Dr Bero and her colleagues also found that favorable conclusions were more likely in industry-sponsored studies, even when data were less favorable. Study authors drew favorable conclusions in 94.7% (18/19) of industry-sponsored studies and 75% (21/28) of studies not funded by industry.
Other key findings of this analysis were that methodological problems were common in both types of studies, and harmful side effects were not investigated.
“Not a single animal study we looked at assessed adverse events following the statin intervention,” Dr Bero said. “As toxicity data from animal studies must be submitted to drug regulatory authorities before a compound can proceed to testing in humans, it is surprising that so little data on harm appear in the published scientific literature.”
The investigators also noted that about half of the studies analyzed were randomized, and about half were blinded. Inclusion and exclusion criteria were often not included in the published reports, and many studies failed to account properly for changes in the assigned treatment arm that occurred during the course of treatment.
Most of the studies in this analysis were conducted in rabbits and mice. To gauge atherosclerosis, targeted by statins, investigators quantified qualities such as the number of damaged blood vessels, blood-vessel diameter, plaque severity, blockage to coronary and other arteries, and plaque rupture. ![]()
TNFRII may play key role in CTCL, speaker says
SAN FRANCISCO—Researchers have found evidence to suggest that tumor necrosis factor receptor II (TNFRII) may be an important driver of cutaneous T-cell lymphomas (CTCLs).
The team discovered that a mutation in this receptor—TNFRII T377I—is present in patients with mycosis fungoides (MF) and those with Sézary syndrome (SS).
And previous research showed that the region encoding TNFRII on chromosome 1 is sometimes amplified in MF and SS patients.
So if, as these factors suggest, TNFRII does play a key role in CTCL, a number of currently available drugs—including proteasome inhibitors and MEK inhibitors—may be effective treatment options.
Alexander Ungewickell, MD, PhD, of Stanford University in California, discussed this possibility and the research supporting it at the 6th Annual T-cell Lymphoma Forum.
A novel mutation
Dr Ungewickell and his colleagues began this research by conducting transcriptome sequencing on samples from 3 patients with SS (Lee et al, Blood 2012). This revealed about 500 genes that were upregulated and about 500 that were downregulated in SS cells.
And pathway enrichment analysis showed that molecular mechanisms of cancer were the most significantly altered pathways. But the researchers also observed PI3 kinase signaling, T-cell receptor signaling, regulation of IL-2, and CD8 signaling.
To better understand the basis for these transcriptional changes, the team performed whole-exome sequencing in 11 CTCL-normal pairs. They uncovered an average of 46 mutations per exome, as well as pathways similar to those observed in the transcriptional analysis.
The researchers then used this information to generate a 245-gene capture reagent. And they used that to perform ultra-deep targeted resequencing on 83 samples from CTCL patients.
“Two things that stood out right away were that TNFRSF1B and KRAS had recurrent point mutations that suggested an activating phenotype,” Dr Ungewickell said. “It’s already known that KRAS is mutated in many human cancers, including CTCL. TNFRSF1B encodes TNFRII and was not previously associated with any malignancies.”
“We also found a smattering of other genes that were mutated, [but] we were most interested in the TNFRII mutation because of the novelty of the finding and also the potential for therapeutic intervention.”
Driving disease
Dr Ungewickell noted that TNFRII is expressed in CD4 and CD8 T lymphocytes but relatively few other cell types. TNFRII is activated by membrane-bound TNFα, which mediates the signal through TRAF proteins and CIAP proteins to activate the NF-κB-inducing kinase (NIK).
This activates the I kappa B kinase (IKK) complex to phosphorylate p100. When phosphorylated, it is processed in the proteasome and translocates to the nucleus. There, it interacts with RelB to mediate transcription that tends to cause T-cell activation and proliferation.
TNFRII also binds to TRAF2 and induces its degradation. The recurrent mutation the researchers identified in TNFRII (T377I) is in the TRAF2 regulatory domain in an evolutionarily conserved residue.
The ultra-deep targeted resequencing of 83 CTCL samples showed 4 mutations at that locus, all of which were acquired in the lymphoma.
This suggests TNFRII is important in CTCL. And the researchers hypothesized that, if that’s the case, TNFRII might be overexpressed in SS cells. So they looked at their transcriptome data and found TNFRII to be overexpressed in all 3 patients.
“Interestingly, the region that encodes TNFRII on chromosome 1 is also amplified in 1 of the 4 commonly used CTCL cell lines, suggesting that amplification may be another way of activating this pathway,” Dr Ungewickell said.
“And we were very interested by a study published by van Doorn et al a few years ago [Blood 2009], which showed that that region of chromosome 1 p36 is, in fact, amplified in 45% of cases of MF and 15% of cases of Sézary syndrome.”
“So we are currently doing FISH studies to confirm that this receptor is actually amplified in as many as half of cases of MF, suggesting that maybe, between mutation and amplification, this is an important driver of CTCL.”
Therapeutic possibilities
The researchers also thought that, if TNFRII is an important driver of CTCL, there would be some kind of transcriptional mark on the lymphoma cells. So they performed gene set enrichment analyses on 24 CTCL samples that had undergone 3-seq.
By comparing tumors expressing high levels of TNFRII and those expressing low levels of TNFRII, the team identified an expression signature that corresponds to the receptor’s known effects on RNA levels in T cells.
When they searched publicly available datasets, the researchers found this signature in 63 cases of MF (Shin et al, Blood 2007). And results of control experiments suggested the signature is specific to CTCL.
“If TNFRII is more active [in CTCL] and the mutation that we found is a hyperactivating mutation, we would expect this pathway to show increased activity downstream; namely, you would expect more processing of p100 to p52,” Dr Ungewickell said.
To investigate this possibility, the researchers generated Jurkat cells expressing empty vector, wild-type TNFRII, or mutant TNFRII and looked at NF-κB processing. They did see an increase in processing with the mutant receptor, compared to the wild-type receptor or empty vector.
“We also found, somewhat surprisingly, increases in phospho-ERK with the mutant receptor, as well as phospho-MEK,” Dr Ungewickell said.
“And to our knowledge, the RAS/MAP kinase pathway has not previously been linked to TNFRII signaling, suggesting that there is some kind of direct or indirect cross-talk between these pathways. We think it’s very interesting, since there are KRAS mutations that activate the RAS/MAP kinase pathway in a subset of these cases, suggesting some kind of synergy.”
Introducing the mutant receptor into primary CD4+ T cells had an effect similar to that observed in the Jurkat cells. The researchers did western blotting for NF-kB processing, and they saw an increase in p100 to p52 processing.
“This is a preliminary experiment, but we’re actually quite excited about this, since Jurkat cells have many abnormalities, due to the fact that they’re a leukemia line, and primary T cells will have the rest of the genome intact,” Dr Ungewickell said.
Now, he and his colleagues are conducting several studies to identify the changes that occur in primary T cells when mutant TNFRII is expressed. They also want to see if they can recapitulate CTCL and identify the transcriptional signature they previously found in patient biopsies and cells.
Lastly, the researchers are performing functional assays to evaluate proliferation, apoptosis, and pharmacological information, with the goal of identifying therapies that might be effective in patients with TNFRII mutation or amplification.
“Patients who have increased TNFRII signaling might respond to proteasome inhibitors, since p100 and p52 processing requires the proteasome,” Dr Ungewickell said. “And given that cross-talk with the RAS/MAP kinase signaling, as well as the KRAS mutations, we also think . . . that MEK inhibitors might be effective in the treatment of CTCL.” ![]()
Book review: Textbook is informative, comprehensive resource

Edited by Alan Michelson, MD
The textbook marketplace is crowded with many titles pertinent to the topic of hemostasis and thrombosis, and the field is becoming increasingly complex, with the addition of new antiplatelet medications and novel, target-specific therapeutic agents.
It has become incumbent for hematologists and oncologist-hematologists who care for or consult on patients with any disease process involving platelets to understand the pathophysiology and rationale of treatment of these disorders.
This third edition of Platelets is again an aggregation of the most prominent physicians, physician-scientists, and basic researchers in platelet biology and clinical hemostasis.
Very much an encyclopedia of platelet biology, Platelets is an informative tome that will serve as a comprehensive resource for the busy clinician, the academic hematologist preparing for lectures on platelet physiology and hemostasis, the basic scientist preparing a research grant, the house officer trying to understand treatment algorithms, the blood banker who runs a busy transfusion service, and the clinical pathologist who supervises a coagulation laboratory.
The foreword chapter by Dr Barry Coller sets the tone for the book, with a thoughtful, interesting, and easily readable overview of the platelet in health and disease.
Over the next 63 chapters and more than 1300 pages, the platelet is examined as an active organ that expresses mRNAs from one-quarter to one-third of the human genome; contains a highly adaptive proteome responsive to external signals of both healthy and pathological processes; and can then participate directly and indirectly as modulators of hemostasis, inflammation, immunology, atherogenesis, angiogenesis, carcinogenesis, etc.
The chapters on laboratory measurements of platelet function and interpretation thereof are very useful and provide practical information for the clinician and clinical laboratorian. The review of the new antiplatelet aggregating agents succinctly and comprehensively describes their pharmacology and their appropriate placement in therapeutic algorithms of many disease processes.
Similarly, the chapters on thrombopoietin and autoimmune thrombocytopenia provide critical insight on the appropriate use of and the potential complications associated with use of the new thrombopoietic agonists.
Finally, the chapters that concentrate on the blood banking aspects of platelet therapy and platelet disorders are particularly well-written and understandable. The chapters on the pathogenesis, diagnosis, and treatment of neonatal alloimmune thrombocytopenia and post-transfusion purpura are very helpful, and I found myself consulting them in my clinical practice, even as I was preparing this review on Platelets.
In summary, Platelets fills an important niche on the bookshelf of any academic hematologist. The user- friendly online access to the figures contained in the textbook will be especially useful for teaching purposes. Notwithstanding its considerable size and weight, this encyclopedia of the platelet contains critical information for physicians, educators, students, and research scientists.
Craig M. Kessler, MD, MACP
Lombardi Comprehensive Cancer Center
Georgetown University School of Medicine, Washington, DC ![]()
Vasovagal syncope, or something far worse?
Vasovagal syncope, or something far worse?
A 48-YEAR-OLD WOMAN with a history of syncopal events was brought to the emergency department (ED) by her daughter, following an episode in which the mother lost consciousness and vomited while driving. (The daughter was able to get the car safely to the shoulder of the road.) The episode occurred after the woman had eaten, and followed a week in which she’d experienced several episodes in which her left arm and chin briefly went numb. In fact, she experienced another chin/arm numbing episode while in the ED. The ED physician gave her a diagnosis of vasovagal syncope, instructed her to follow up with her primary care physician, and included “rule out transient ischemic attack (TIA)” on the discharge note.
The primary care physician subsequently established a differential diagnosis of “vasovagal vs hypoglycemia vs both or neurocardiogenic syncope” and referred the patient to an electrophysiologist, who concluded that she’d had a vasovagal syncope episode triggered by a gastrointestinal cause.
The patient continued to have arm/chin numbness but was unconcerned because her physicians didn’t seem worried. Months later, she sought treatment for low back pain, for which her primary care physician prescribed celecoxib; her numbness was not discussed with her physician. The next day, she suffered a stroke from an occluded right carotid artery. She had hemiparesis with little to no movement of her left shoulder, elbow, hand, hip, and ankle.
PLAINTIFF’S CLAIM The numbness and fainting were TIAs and an ultrasound should have been performed, which would have revealed the carotid artery occlusion and helped avoid the stroke.
THE DEFENSE The events the plaintiff experienced were not TIAs and there was no way to show whether, or to what degree, the carotid artery was occluded before the stroke. The plaintiff should have reported the continuing symptoms. Given that the patient had a long history of syncopal events—and a history of smoking—the diagnosis was reasonable.
VERDICT $1.6 million Wisconsin verdict.
COMMENT I think the lesson here is that physicians need to take focal neurological findings seriously and continue the evaluation until one has a reasonably certain diagnosis. The cause of this patient’s recurrent arm and chin numbness should have been pursued.
Failure to take full sexual history has devastating consequences
A MAN WITH A HISTORY OF ABNORMAL BLOOD TEST RESULTS sought treatment in the emergency department for extreme leg pain. He was given a diagnosis of sepsis and renal failure. A positive human immunodeficiency virus (HIV) test led to a diagnosis of acquired immunodeficiency syndrome (AIDS). The patient had been seeing his primary care physician for 10 years, but the doctor never asked about his sexual history. The patient survived, but suffers from AIDS-related kidney disease and must undergo peritoneal dialysis for the rest of his life.
PLAINTIFF’S CLAIM The physician should have tested for HIV much sooner to prevent the loss of kidney function. The physician’s questions were not specific enough to obtain proper information on whether the patient was having unprotected sex, if he had multiple partners, and what gender his partners were.
THE DEFENSE No information about the defense is available.
VERDICT $5.2 million Illinois verdict.
COMMENT I’m not sure the jury got this one right. Nonetheless, the Centers for Disease Control and Prevention now recommends HIV screening for all adults so it is worthwhile to offer it to all patients and to document refusal if a patient doesn’t want to be tested.
Inhibitor appears active in relapsed/refractory TCLs
SAN FRANCISCO—Preliminary results of a phase 1 trial suggest the PI3K-delta/gamma inhibitor IPI-145 is active in patients with relapsed or refractory T-cell lymphomas.
Among 26 evaluable patients, 9 experienced partial responses to treatment with IPI-145, and 1 achieved a complete response, for an overall response rate (ORR) of 38%.
The drug also appeared to be well-tolerated, although 30% of patients did experience treatment-related severe adverse events.
Steven Horwitz, MD, of Memorial Sloan-Kettering Cancer Center in New York, and his colleagues presented these results in a poster at the 6th Annual T-cell Lymphoma Forum, which took place January 23-25.
The study was sponsored by Infinity Pharmaceuticals, Inc., the company developing IPI-145.
Patient and treatment characteristics
The trial included 30 patients with peripheral T-cell lymphoma (PTCL) or cutaneous T-cell lymphoma (CTCL). Of the 17 CTCL patients, 16 had mycosis fungoides or Sezary syndrome, and 1 had primary cutaneous anaplastic large-cell lymphoma (ALCL).
Of the 13 patients with PTCL, 3 had angioimmunoblastic T-cell lymphoma (AITL), 3 had subcutaneous panniculitis-like T-cell lymphoma (SPTCL), 3 had PTCL-not otherwise specified, 2 had ALCL, 1 had enteropathy-associated T-cell lymphoma (EATL), and 1 had NK T-cell lymphoma (NKTL).
The patients had advanced disease, with a median of 5 prior systemic therapies (range, 1-11) and a median of 1 month from their last therapy to the first dose on study (range, 0.2-12).
Patients received IPI-145 in escalating doses, from 25 mg to 100 mg twice daily (n=10) and in an expansion cohort at 75 mg twice daily (n=20). All 30 patients were evaluable for the safety analysis, but only 26 were evaluable for clinical activity.
Response by disease type
The ORR for all 26 patients was 38% (1 complete and 9 partial responses).
Among the 11 evaluable PTCL patients, the ORR was 55%. One patient had a complete response, and 5 had partial responses.
Of the 15 evaluable CTCL patients, 4 had partial responses, for an ORR of 27%. In addition, 7 CTCL patients had stable disease.
The median time to response was 1.9 months (range, 1.5-2.7) for patients with PTCL and 2.4 months (range, 1.7-3.8) for patients with CTCL.
Four patients with PTCL and 3 patients with CTCL remain on treatment.
Adverse events
IPI-145 was generally well-tolerated, according to the researchers.
The most common adverse events of any grade were an increases in ALT/AST (47%), fatigue (37%), pyrexia (33%), diarrhea (30%), cough (27%), headache (27%), nausea (27%), rash (23%), increases in alkaline phosphatase (20%), increases in blood creatinine (17%), and weight loss (17%).
Grade 3 side effects included increased ALT/AST (33%), rash (13%), and fatigue (10%). One patient (3%) had grade 4 ALT/AST increases.
Forty percent of patients had severe adverse events, and 30% were treatment-related. Among CTCL patients, the severe events included ALT/AST increases (n=1), pneumonitis (n=1), HSV pneumonitis (n=1), lung infection (n=1), pyrexia (n=1), and staphylococcal sepsis (n=1).
Among PTCL patients, severe events included diarrhea (n=2), pneumonia (n=2), vomiting (n=2), cellulitis (n=1), colitis (n=1), dehydration (n=1), hypotension (n=1), pneumonia cytomegaloviral (n=1), pyrexia (n=1), and rash (macular papular; n=1).
Six CTCL patients and 3 PTCL patients discontinued treatment due to adverse events.
Pharmacodynamics
The data showed that treatment with IPI-145 led to decreases in serum levels of cytokines and chemokines known to play important roles in lymphocyte trafficking and function.
The researchers said this further supports the rationale that inhibiting PI3K-delta and PI3K-gamma has the potential to provide a therapeutic benefit for T-cell lymphomas and other hematologic malignancies.
For more details on this research, see the poster on Infinity’s website: http://www.infi.com/product-candidates-publications.asp. ![]()
Physical activity may cut death risk in male cancer survivors

Credit: Jason E. Miller
Physical activity may reduce the risk of mortality in male cancer survivors, according to research published in the Journal of Physical Activity & Health.
In a study of more than 1000 male cancer survivors, participants who were most active—expending more than 12,600 kilojoules per week in physical activity—cut their risk of death roughly in half.
This was in comparison to the least active cancer survivors—those who burned fewer than 2100 kilojoules per week.
Kathleen Y. Wolin, PhD, of Loyola University Chicago Stritch School of Medicine, and her colleagues conducted this research using data from the Harvard Alumni Health Study, an ongoing study of men who entered Harvard as undergraduates between 1916 and 1950.
The researchers looked at 1021 men, with an average age of 71, who had been diagnosed with cancers.
In 1988, the men completed questionnaires reporting their physical activities, including walking, stair-climbing, and participation in sports and recreational activities. Their physical activities were updated in 1993, and researchers followed the men until 2008.
In all, 777 of the men died—337 from cancer, 190 from cardiovascular disease, 228 from other causes, and 22 from unknown causes.
Compared with men who expended fewer than 2100 kilojoules per week in physical activity, men who expended more than 12,600 kilojoules per week were 48% less likely to die of any cause during the follow-up period. (Expending 12,600 kilojoules can be achieved with about 6 to 8 hours of moderate-intensity physical activity.)
This finding was adjusted for age, smoking habits, body mass index, early parental mortality, and dietary variables.
When the researchers tried to adjust for cancer severity and treatment, they were only able to collect data for 70 men. But the results were not very different from the prior analysis. The most active men were 49% less likely to die of any cause than the least active men.
The team also decided to analyze men who were diagnosed with cancer at least 5 years before baseline (n=421). And among these men, the most active were 52% less likely than the least active to die.
Similarly, among men diagnosed at least 10 years before baseline (n=262), the most active cancer survivors were 63% less likely to die of any cause than the least active survivors.
The researchers also obtained similar results when they assessed mortality from cancer and cardiovascular disease. The most physically active cancer survivors were 38% less likely to die of cancer and 49% less likely to die of cardiovascular disease during follow-up. ![]()
Technique could improve assessment of MM patients

the WB-DWI scans
Photo courtesy of the
Institute of Cancer Research
A novel imaging technique could improve care for patients with multiple myeloma (MM) and reduce physicians’ reliance on bone marrow biopsies, according to researchers.
The group found that whole-body, diffusion-weighted imaging (WB-DWI) scans accurately showed the spread of MM throughout patients’ bone marrow.
And, most of the time, doctors were able to accurately determine which patients were responding to treatment by consulting the scans.
The investigators reported these results in Radiology.
They first performed WB-DWI on 8 healthy volunteers and 7 patients with MM, to assess the repeatability of quantitative apparent diffusion coefficient (ADC) estimates. ADC records how restricted water movement is within tissues.
The researchers found that ADC measurement was highly repeatable. The mean coefficient of variation was 3.8% in healthy volunteers and 2.8% in MM patients.
The team also performed pre-treatment WB-DWI scans on an additional 34 MM patients. Twenty-six of these patients had a post-treatment scan as well.
Physicians trained in imaging could pinpoint the exact sites of MM with WB-DWI, as the scans could show MM in nearly all bones. The skull remained difficult to image, however, partly because of the frequency of metal dental implants and fillings.
“This is the first time we’ve been able to obtain information from all the bones in the entire body for myeloma in 1 scan without having to rely on individual bone X-rays,” said study author Nandita deSouza, MD, of The Royal Marsden NHS Foundation Trust in the UK. “It enables us to measure the involvement of individual bones and follow their response to treatment.”
In 86% of cases, doctors were able to correctly identify whether patients responded to treatment. The physicians identified non-responders 80% of the time.
The investigators also assessed the visible changes on these scans using ADC. Changes in ADC correctly identified treatment response for 24 of 25 MM patients.
The mean ADC increased in 95% of responding patients and decreased in all non-responders (P=0.002). A 3.3% increase in ADC allowed the researchers to identify responding patients with 90% sensitivity and 100% specificity. An 8% increase in ADC yielded 70% sensitivity and 100% specificity.
The investigators said WB-DWI was suitable for more patients than conventional tests. For example, 7 patients had bone marrow biopsies, but their samples were inadequate for analysis.
“The scan is better than blood tests, which don’t tell us in which bones the cancer is located,” Dr deSouza said. “It also reduces the need for uncomfortable biopsies, which don’t reveal the extent or severity of the disease.”
The researchers did note that this study was conducted in a small number of patients. So the team plans to test the technology in more patients and refine the technique. ![]()
Sentinel Hospitalization
As hospitalists now care for expanding numbers of America's aging patients, many of whom have chronic, debilitating illnesses or are near the end of life, there is a burgeoning need for innovative approaches to optimize quality of care and control costs, especially in the last year of life.[1, 2] In the inaugural issue of the Journal of Hospital Medicine, an overview of how hospitalists and palliative care specialists can work hand‐in‐hand to care for these seriously ill, hospitalized patients was presented.[3, 4] This perspective highlighted a symbiotic and mutually beneficial relationship between the 2 specialties based on their shared values, missions, and complementary strengths.[3, 4] Since then, a number of collaborative ventures offering palliative care for seriously ill, hospitalized patients have been developed and examined in a variety of settings.[4, 5, 6]
A key collaborative undertaking for hospitalists and palliative care specialists is the appreciation of the unique trajectory of each chronic illness toward the end of life. For example, patients with cancer or neurodegenerative disease tend to have relatively stable functional status until the final months of rapid deterioration. On the other hand, the courses of patients with chronic obstructive pulmonary disease (COPD), congestive heart failure (CHF), end‐stage renal disease, and human immunodeficiency virus/acquired immunodeficiency syndrome tend to be punctuated by episodes of acute exacerbation with often nearly complete return to previous status. Finally, dementia usually follows a slow course of gradual decline leading to death.[7] Ideally, active management of symptoms and discussion of prognosis and goals of care should happen in the early stages of these chronic illnesses, yet most often they are left until an acute hospitalization late in the disease course. The following case illustrates the point.
CASE 1
Mrs. M is an 89‐year‐old woman with Alzheimer's dementia diagnosed 7 years ago who has been cared for at home by family members. She is admitted to the hospital for urinary tract infection and volume depletion. She is bedbound, cachectic, and has a stage III decubitus ulcer. Her daughter describes a 6‐month history of feeding problems, 20‐lb weight loss, and 2 recent hospitalizations for aspiration pneumonia. She improves somewhat with hydration and intravenous antibiotics, and the physical therapist recommends rehabilitation. Mrs. M does not have decision‐making capacity, and her long‐time family physician has not inquired about care preferences or goals. The hospitalist team meets with family members to discuss the trajectory and prognosis of advanced dementia, and recommends against artificial nutrition and hydration, and for initiation of palliative care service at a skilled nursing facility.
In this example, the hospitalist team recognizes the advent of frequent infections and diminished oral intake in advanced dementia as signals of increased morbidity and mortality warranting palliative care intervention.[8] This, we suggest, represents a sentinel hospitalization, a hospitalization in the disease course that heralds a need to reassess prognosis, treatment options and intensity, and goals of care. Hospitalists are well positioned to recognize such transition points in the disease course by considering the patient's recent history of illness, to offer an impartial overview of illness progression, and to optimize patient care using principles of palliative care. Additionally, hospitalists have advantages of geographic convenience, readily available consultants, systemic support, and a detachment from the longitudinal patient‐physician relationship, which may enable more accurate medical prognostication.[9]
There are many ways to identify a sentinel hospitalization. For example, hospitalists can use the surprise question, Would you be surprised if the patient died within 12 months? on admission for the majority of cancer and dialysis patients. The answer No predicts a 3.5‐ to 7‐fold increase in 1‐year mortality.[10, 11] In a powerful predictive model for 1‐year mortality using readily available clinical, laboratory, and functional characteristics, medical inpatients in the highest quartiles have 1‐year mortality exceeding 60%.[12] Recently, several more complicated prognostic models have been derived and validated in large cohorts of medical inpatients, which predict short‐term (30‐day) and long‐term (0.5‐1 year) mortality with great accuracy.[13, 14] There are also many disease‐specific prognostic features (eg, diagnosis of metastatic disease with poor performance status or high symptom burden, progression of chronic kidney disease with consideration of hemodialysis, additional stroke in multi‐infarct dementia, and frequent exacerbation of severe COPD or severe CHF).[15, 16, 17, 18, 19, 20, 21] Finally, frequent readmissions and prolonged hospital or intensive care unit stay can also be used.[17, 19] These criteria are summarized in Table 1 with time frames.
| Common Criteria | Time Frame | References |
|---|---|---|
| ||
| No to the surprise question: Would you be surprised if the patient died in 12 months? | 1 year | [10, 11] |
| Newly diagnosed metastatic solid cancer | Various | [17] |
| Metastatic solid cancer admitted for uncontrolled symptoms | Various | [17] |
| Progressive CKD with consideration for hemodialysis | 1 year | [17, 18] |
| GOLD stage IV COPD with frequent exacerbation | Various | [20] |
| NYHAstage IV CHF with frequent exacerbation | 12 years | [21] |
| Advanced dementia with frequent UTI, aspiration PNA, and feeding problem | 12 years | [8] |
| Overall prognosis of high mortality using available indices | 30 days1 year | [12, 13, 14] |
| More than 3 admissions in last 6 months | 6 months | [17, 19] |
| Prolonged ICU stay (>7 days) | Weeks | [17, 19] |
Once a sentinel hospitalization is identified, hospitalists, with input from the patient's primary care physician and subspecialists, can then develop a comprehensive strategy to evaluate current disease management, to educate patient and family accordingly, and to actively integrate palliative care services as appropriate. The next challenge facing the care team is how to deliver the necessary palliative care since it is unnecessary and improper to ask for palliative care specialist consultation for every sentinel hospitalization. We believe that the best approach is for hospitalists to be the primary deliverers of basic palliative care in the hospital while consulting palliative care specialists for refractory symptoms and complex scenarios.[22] According to this generalist‐specialist palliative care model, physicians of all specialties should define and master a basic palliative care skill set for their patients. For hospitalists, the relevant skill set includes assessing and treating pain and other symptoms such as dyspnea, nausea and vomiting, and constipation, estimating prognosis, and initiating goals of care discussions.[22] The following case illustrates this point.
CASE 2
Ms S, a 21‐year‐old Hispanic woman with advanced, recurrent head and neck cancer, status post multiple surgeries, chemotherapy, and radiation therapy, is admitted to the hospitalist service for aspiration pneumonia, which responds to antibiotics rapidly. However, her cancer‐related somatic and neuropathic pain soon becomes refractory to opioids prescribed by the hospitalist team. She also develops significant dyspnea, xerostomia, depression, anxiety, and existential suffering. With the help of the interdisciplinary palliative care team, her pain is relieved by a patient‐controlled analgesia pump and methadone. A palliative care social worker and chaplain visit her and her family daily to address their distress. Eventually, the care team is able to provide a stable medical regimen for symptom control and to use it across the entire care continuum.
In this example, the hospitalist team, with the support of palliative care specialists, provided basic palliative care and longitudinal integration of palliative practices into the patient's overall treatment scheme. Hospitalists, given their scope of practice and sheer volume of patients, are well positioned to rapidly gain competencies in symptom management, empathic communication, and interdisciplinary teamwork.[23, 24] Hospitalists may benefit from innovative and collaborative palliative care education using interactive online modules, case simulation, communication workshops, and observed evaluation and feedback.[25] Several modes of collaboration between hospital medicine and palliative care have been developed including implementation of palliative care consult triggers on admission, palliative care participation in hospitalist interdisciplinary rounds, and disease specific, integrated management programs.[17, 26] These collaborations are particularly important, as the quality of inpatient care at the end of life is still suboptimal and more appropriate use of palliative care will be beneficial.[27] Recently, some hospitals have developed specialized inpatient palliative care units, combining intensive palliation with inpatient medical surgical level of care, as well as providing hospice care. Staffed by palliative care specialists or hospitalists, they provide efficient, cost‐saving care to patients with advanced chronic illness or terminal disease in need of intensive symptom management.[28] Finally, there is mounting evidence supporting the clinical effectiveness of palliative care in diverse specialties such as oncology, pulmonary and critical care, and nephrology.[29] For example, in the setting of metastatic non‐small cell lung cancer, early initiation of palliative care has been shown to improve symptom control and quality of life, reduce chemotherapy use at the end of life, and interestingly, prolong median survival by almost 3 months.[30] This has led to a position statement from American Society of Clinical Oncology encouraging early integration of palliative care into standard oncologic care for advanced disease.[31]
Recognizing a sentinel hospitalization allows palliative care to be integrated at transitions of care and carried forward. For patients with chronic debilitating illnesses who are approaching the end of life, appropriate care transitions will ensure that their short‐ and long‐term care matches their goals of care, assure timely clinical follow‐ups, and help reduce hospital readmission and healthcare resource utilization.[32] Importantly, timely and compassionate communication is a key to the success of both hospital medicine and palliative care. Many patients with life‐limiting diseases prefer to receive prognostic information and to discuss goals of care.[33] How this information is integrated and communicated through the care continuum is crucial, especially in the era of duty hour limits and frequent handoffs. The information exchange needs to facilitate active participation of primary care physicians who may not be involved in hospital care. Some of the innovative strategies for communication and transfer of palliative care information, such as prognosis, goals of care, family meeting consensus, and symptom control interventions, include a palliative care checklist in the electronic health record, incorporation of prognostic and family meeting information in the discharge summary, and links to the national Physician Orders for Life‐Sustaining Treatment advanced care planning program.[34] Of note, a pilot program in the United Kingdom adopting an electronic palliative care summary has reduced after‐hour emergency room visits and hospital readmissions.[35] The following case illustrates this point.
CASE 3
Mrs. K, an 82‐year‐old Russian‐speaking woman with newly diagnosed metastatic pancreatic cancer, is admitted for worsening obstructive jaundice and a second opinion about treatment. A biliary stent is placed and her jaundice slowly improves. The patient and family have requested chemotherapy. However, the oncologist determines that she would only qualify for a phase I trial given her poor performance status. The hospitalist team requests the help of the palliative care consult team to manage her severe pain, depression, and to provide support to the family. After several family meetings, the patient and family choose not to pursue chemotherapy. Given the lack of adequate support at home, she is discharged to a skilled nursing facility for short‐term rehabilitation with plans to transition to the in‐house hospice program. The hospitalist, palliative care attending physician, and the medical director of the rehabilitation facility have a 3‐way phone conference to confirm the plans of care and to ensure a smooth care transition.
In this case, the hospitalist team recognizes that this is a sentinel hospitalization for Mrs. K that requires extensive palliative care intervention. Often, transitioning to skilled nursing facilities (SNF) is the default pathway for patients needing hospice/palliative care, especially when patients and families are not yet ready to discuss prognosis realistically or to accept hospice, or there is not enough support available at home. A recent large cohort study showed that 30% of patients in their last 6‐month of life had used, and nearly 10% of such patients had died, under Medicare's posthospitalization SNF benefit.[36] Although the worsening disease trajectory may not be apparent at hospital discharge, it is more likely that the financial and practical limitation of the Medicare Hospice Benefit accounts for this observation, which includes limited home health aid hours, lack of coverage for room and board, and lower payments to SNFs.[36] Hospitalists can help address the issue of discharge location for patients needing palliative care. Sometimes this requires extensive communication before and after discharge to help enhance the transition from a rehabilitation facility to hospice/palliative care. Appropriately integrated palliative care at the time of care transitions, in the form of hospice or longitudinal home‐based palliative care rather than just routine clinic follow‐up, has the potential to reduce 30‐day readmission for chronically ill, elderly patients and for patients near the end of life.[37, 38] It is critical that national policy, suitable reimbursement, and financial incentives support this practice. A demonstration project, Better Outcomes by Optimizing Safe Transitions (BOOST), organized by the Society of Hospital Medicine, integrates palliative care evaluation into a comprehensive discharge assessment tool. This intervention has been shown to reduce readmissions to acute care hospitals.[39]
In this article, we define a sentinel hospitalization and suggest that its recognition provides an important opportunity for hospitalists to actively integrate palliative care into patients' chronic disease management programs, with inputs from patients, their families, their primary physicians and subspecialists, as well as palliative care specialists. We also recognize that within nonsentinel hospitalizations, there are important opportunities to discuss prognosis, goals of care, and advanced care planning. This approach allows the fresh eyes of hospitalists to assess the patient's current health status and prognosis, to communicate these relevant clinical issues with the patient and family, and to encourage discussions about goals of care and advanced care planning during the sentinel hospitalization. It also provides a structured vehicle for soliciting the patient's (and family's) perspectives and documenting them in the medical record. A compilation of sample items to guide discussion can be found in Table 2. Hospitalists, equipped with basic palliative care skills and supported by hospital‐ and community‐based palliative care teams, can thrive in this unique position of optimizing the quality of care for these patients.[40] Almost 20 years ago, the field of palliative care rose to national prominence on the findings of the SUPPORT (Study to Understand Prognoses and Preferences for Outcomes and Risks of Treatments) study, which investigated the suboptimal end‐of‐life experiences of hospitalized adult patients.[41] Since then, the fields of both hospital medicine and palliative care have grown, yet the best is still to come for their collaborative excellence, mutual education, and shared care innovation at the forefront of medicine.
| Patient/family understanding of disease process and treatment outcomes |
| Patient/family understanding of disease prognosis |
| Availability of alternative treatment options including palliative/hospice care |
| Patient/family wishes/goals of care |
| Advanced‐care planning including limitations of care |
| Inventory of symptoms (frequency, severity, modifying factors, timing, and treatments) |
| Social and financial stress |
| Emotional and existential stress |
| Social support system and caregivers |
| Living arrangements |
Disclosure: Nothing to report.
- , , , , , , et al. Evolving practice of hospital medicine and its impact on hospital throughput and efficiencies. J Hosp Med. 2012;7:649–654.
- , , , . Medicare beneficiaries' costs of care in the last year of life. Health Affairs. 2001;20:188–195.
- . Palliative care in hospitals. J Hosp Med. 2006;1:21–28.
- . Palliative care and hospitalists: a partnership for hope. J Hosp Med. 2006;1:5–6.
- , . Palliative care and the hospitalist: an opportunity for cross‐fertilization. Am J Med. 2001;111:10s–14s.
- , . Palliative care. Ann Intern Med. 2012;156:ITC2‐1, TC2‐2–15; quiz TC2‐16.
- , , , , . Patterns of functional decline at the end of life. JAMA. 2003;289:2387–2392.
- , , , et al. The clinical course of advanced dementia. N Engl J Med. 2009;361:1529–1538.
- , . Extent and determinants of error in doctor's prognoses in terminally ill patients: prospective cohort study. BMJ. 2000;320:469–472.
- , , , et al. Prognostic significance of the “surprise” question in cancer patients. J Palliat Med. 2010;13:837–840.
- , , , et al. Utility of the “surprise” question to identify dialysis patients with high mortality. Clin J Am Soc Nephrol. 2008;3:1379–1384.
- , , , et al. Development and validation of a prognostic index for 1‐year mortality in older adults after hospitalization. JAMA. 2001;285:2987–2994.
- , , , , . Mortality predictions on admission as a context for organizing care activities. J Hosp Med. 2013,8:229–235.
- , , , , . Caring about prognosis: a validation study of the CARING criteria to identify hospitalized patients at high risk for death at 1 year. J Hosp Med. 2013,8:696–701.
- , , , , , , et al. Meta‐analysis of survival prediction with palliative performance scale. J Palliat Care. 2007;23:245–254.
- , , , , . Prognostic indices for older adults: a systemic review. JAMA. 2012;307:182–192.
- , . Identifying patients in need of a palliative care assessment in the hospital setting. J Palliat Med. 2011;14:17–23.
- , , , , , . Functional status of elderly adults before and after initiation of dialysis. N Engl J Med. 2009;361:1539–1547.
- , , . Top 10 things palliative care clinicians wished everyone knew about palliative care. Mayo Clin Proc. 2013;88:859–865.
- . Palliative and end‐of‐life care for patients with severe COPD. Eur Respir J. 2008;32:796–803.
- . Palliative care in congestive heart failure. J Am Coll Cardiol. 2009;54:386–396.
- , . Generalist plus specialist palliative care—creating a more sustainable model. N Engl J Med. 2013;368:1173–1175.
- , , , , , . Common myths about caring for patients with terminal illness: opportunities to improve care in the hospital setting. J Hosp Med. 2007;2:357–365.
- , , , . Opportunity lost: end‐of‐life discussions in cancer patients who die in the hospital. J Hosp Med. 2013;8:334–340.
- , , . Palliative medicine physician education in the United States: a historical review. J Palliat Med. 2013;16:230–236.
- , . Hospitalization as an opportunity to integrate palliative care in heart failure management. Curr Opin Support Palliat Care. 2009;3:247–251.
- , , , et al. The quality of care provided to hospitalized patients at the end of life. Arch Intern Med. 2010;170:1057–1063.
- , , , , , . Outcomes of the acute palliative care unit in an academic medical center [published online ahead of print May 10, 2013]. Am J Hosp Palliat Care. doi: 10.1177/1049909113489164.
- , , , , , . Update in hospital palliative care. J Hosp Med. 2013;12:715–720.
- , , , et al. Early palliative care for patients with metastatic non‐small‐cell lung cancer. N Engl J Med. 2010;363:733–742.
- , , , . Early integration of palliative care services with standard oncology care for patients with advanced cancer. CA Cancer J Clin. 2013;63:349–363.
- , , , et al. A reengineered hospital discharge program to decrease rehospitalization: a randomized trial. Ann Intern Med. 2009;150:178–187.
- , , , , , . “Knowing is better”: preferences of diverse older adults for discussion prognosis. J Gen Intern Med. 2012;27:568–575.
- , , . POLST, an improvement over traditional advanced directives. Cleve Clin J Med. 2012;79:457–464.
- , , , . Use of a structured palliative care summary in patients with established cancer is associated with reduced hospital admissions by out‐of‐hours general practitioners in Grampian [published online ahead of print January 3, 2013]. BMJ Support Palliat Care. doi:10.1136/bmjspcare‐2012‐000371.
- , , , , , . Use of the Medicare posthospitalization skilled nursing benefit in the last 6 months of life. Arch Intern Med. 2012;172:1573–1579.
- , , , et al. Increased satisfaction with care and lower costs: results of a randomized trial of in‐home palliative care. J Am Geriatr Soc. 2007;55:993–1000.
- , , . 30‐day readmissions among seriously ill older adults. J Palliat Med. 2012;15:1–6.
- , , , et al. Project BOOST: effectiveness of a multihospital effort to reduce rehospitalization. J Hosp Med. 2013;8:421–427.
- . Ensuring safe, quality care for hospitalized people with advanced illness, a core obligation for hospitalists. J Hosp Med. 2007;2:355–356.
- The SUPPORT Principal Investigators. A controlled trial to improve care for seriously ill hospitalized patients: the Study to Understand Prognoses and Preferences for Outcomes and Risks of Treatments (SUPPORT). JAMA. 1995;274:1591–1598.
As hospitalists now care for expanding numbers of America's aging patients, many of whom have chronic, debilitating illnesses or are near the end of life, there is a burgeoning need for innovative approaches to optimize quality of care and control costs, especially in the last year of life.[1, 2] In the inaugural issue of the Journal of Hospital Medicine, an overview of how hospitalists and palliative care specialists can work hand‐in‐hand to care for these seriously ill, hospitalized patients was presented.[3, 4] This perspective highlighted a symbiotic and mutually beneficial relationship between the 2 specialties based on their shared values, missions, and complementary strengths.[3, 4] Since then, a number of collaborative ventures offering palliative care for seriously ill, hospitalized patients have been developed and examined in a variety of settings.[4, 5, 6]
A key collaborative undertaking for hospitalists and palliative care specialists is the appreciation of the unique trajectory of each chronic illness toward the end of life. For example, patients with cancer or neurodegenerative disease tend to have relatively stable functional status until the final months of rapid deterioration. On the other hand, the courses of patients with chronic obstructive pulmonary disease (COPD), congestive heart failure (CHF), end‐stage renal disease, and human immunodeficiency virus/acquired immunodeficiency syndrome tend to be punctuated by episodes of acute exacerbation with often nearly complete return to previous status. Finally, dementia usually follows a slow course of gradual decline leading to death.[7] Ideally, active management of symptoms and discussion of prognosis and goals of care should happen in the early stages of these chronic illnesses, yet most often they are left until an acute hospitalization late in the disease course. The following case illustrates the point.
CASE 1
Mrs. M is an 89‐year‐old woman with Alzheimer's dementia diagnosed 7 years ago who has been cared for at home by family members. She is admitted to the hospital for urinary tract infection and volume depletion. She is bedbound, cachectic, and has a stage III decubitus ulcer. Her daughter describes a 6‐month history of feeding problems, 20‐lb weight loss, and 2 recent hospitalizations for aspiration pneumonia. She improves somewhat with hydration and intravenous antibiotics, and the physical therapist recommends rehabilitation. Mrs. M does not have decision‐making capacity, and her long‐time family physician has not inquired about care preferences or goals. The hospitalist team meets with family members to discuss the trajectory and prognosis of advanced dementia, and recommends against artificial nutrition and hydration, and for initiation of palliative care service at a skilled nursing facility.
In this example, the hospitalist team recognizes the advent of frequent infections and diminished oral intake in advanced dementia as signals of increased morbidity and mortality warranting palliative care intervention.[8] This, we suggest, represents a sentinel hospitalization, a hospitalization in the disease course that heralds a need to reassess prognosis, treatment options and intensity, and goals of care. Hospitalists are well positioned to recognize such transition points in the disease course by considering the patient's recent history of illness, to offer an impartial overview of illness progression, and to optimize patient care using principles of palliative care. Additionally, hospitalists have advantages of geographic convenience, readily available consultants, systemic support, and a detachment from the longitudinal patient‐physician relationship, which may enable more accurate medical prognostication.[9]
There are many ways to identify a sentinel hospitalization. For example, hospitalists can use the surprise question, Would you be surprised if the patient died within 12 months? on admission for the majority of cancer and dialysis patients. The answer No predicts a 3.5‐ to 7‐fold increase in 1‐year mortality.[10, 11] In a powerful predictive model for 1‐year mortality using readily available clinical, laboratory, and functional characteristics, medical inpatients in the highest quartiles have 1‐year mortality exceeding 60%.[12] Recently, several more complicated prognostic models have been derived and validated in large cohorts of medical inpatients, which predict short‐term (30‐day) and long‐term (0.5‐1 year) mortality with great accuracy.[13, 14] There are also many disease‐specific prognostic features (eg, diagnosis of metastatic disease with poor performance status or high symptom burden, progression of chronic kidney disease with consideration of hemodialysis, additional stroke in multi‐infarct dementia, and frequent exacerbation of severe COPD or severe CHF).[15, 16, 17, 18, 19, 20, 21] Finally, frequent readmissions and prolonged hospital or intensive care unit stay can also be used.[17, 19] These criteria are summarized in Table 1 with time frames.
| Common Criteria | Time Frame | References |
|---|---|---|
| ||
| No to the surprise question: Would you be surprised if the patient died in 12 months? | 1 year | [10, 11] |
| Newly diagnosed metastatic solid cancer | Various | [17] |
| Metastatic solid cancer admitted for uncontrolled symptoms | Various | [17] |
| Progressive CKD with consideration for hemodialysis | 1 year | [17, 18] |
| GOLD stage IV COPD with frequent exacerbation | Various | [20] |
| NYHAstage IV CHF with frequent exacerbation | 12 years | [21] |
| Advanced dementia with frequent UTI, aspiration PNA, and feeding problem | 12 years | [8] |
| Overall prognosis of high mortality using available indices | 30 days1 year | [12, 13, 14] |
| More than 3 admissions in last 6 months | 6 months | [17, 19] |
| Prolonged ICU stay (>7 days) | Weeks | [17, 19] |
Once a sentinel hospitalization is identified, hospitalists, with input from the patient's primary care physician and subspecialists, can then develop a comprehensive strategy to evaluate current disease management, to educate patient and family accordingly, and to actively integrate palliative care services as appropriate. The next challenge facing the care team is how to deliver the necessary palliative care since it is unnecessary and improper to ask for palliative care specialist consultation for every sentinel hospitalization. We believe that the best approach is for hospitalists to be the primary deliverers of basic palliative care in the hospital while consulting palliative care specialists for refractory symptoms and complex scenarios.[22] According to this generalist‐specialist palliative care model, physicians of all specialties should define and master a basic palliative care skill set for their patients. For hospitalists, the relevant skill set includes assessing and treating pain and other symptoms such as dyspnea, nausea and vomiting, and constipation, estimating prognosis, and initiating goals of care discussions.[22] The following case illustrates this point.
CASE 2
Ms S, a 21‐year‐old Hispanic woman with advanced, recurrent head and neck cancer, status post multiple surgeries, chemotherapy, and radiation therapy, is admitted to the hospitalist service for aspiration pneumonia, which responds to antibiotics rapidly. However, her cancer‐related somatic and neuropathic pain soon becomes refractory to opioids prescribed by the hospitalist team. She also develops significant dyspnea, xerostomia, depression, anxiety, and existential suffering. With the help of the interdisciplinary palliative care team, her pain is relieved by a patient‐controlled analgesia pump and methadone. A palliative care social worker and chaplain visit her and her family daily to address their distress. Eventually, the care team is able to provide a stable medical regimen for symptom control and to use it across the entire care continuum.
In this example, the hospitalist team, with the support of palliative care specialists, provided basic palliative care and longitudinal integration of palliative practices into the patient's overall treatment scheme. Hospitalists, given their scope of practice and sheer volume of patients, are well positioned to rapidly gain competencies in symptom management, empathic communication, and interdisciplinary teamwork.[23, 24] Hospitalists may benefit from innovative and collaborative palliative care education using interactive online modules, case simulation, communication workshops, and observed evaluation and feedback.[25] Several modes of collaboration between hospital medicine and palliative care have been developed including implementation of palliative care consult triggers on admission, palliative care participation in hospitalist interdisciplinary rounds, and disease specific, integrated management programs.[17, 26] These collaborations are particularly important, as the quality of inpatient care at the end of life is still suboptimal and more appropriate use of palliative care will be beneficial.[27] Recently, some hospitals have developed specialized inpatient palliative care units, combining intensive palliation with inpatient medical surgical level of care, as well as providing hospice care. Staffed by palliative care specialists or hospitalists, they provide efficient, cost‐saving care to patients with advanced chronic illness or terminal disease in need of intensive symptom management.[28] Finally, there is mounting evidence supporting the clinical effectiveness of palliative care in diverse specialties such as oncology, pulmonary and critical care, and nephrology.[29] For example, in the setting of metastatic non‐small cell lung cancer, early initiation of palliative care has been shown to improve symptom control and quality of life, reduce chemotherapy use at the end of life, and interestingly, prolong median survival by almost 3 months.[30] This has led to a position statement from American Society of Clinical Oncology encouraging early integration of palliative care into standard oncologic care for advanced disease.[31]
Recognizing a sentinel hospitalization allows palliative care to be integrated at transitions of care and carried forward. For patients with chronic debilitating illnesses who are approaching the end of life, appropriate care transitions will ensure that their short‐ and long‐term care matches their goals of care, assure timely clinical follow‐ups, and help reduce hospital readmission and healthcare resource utilization.[32] Importantly, timely and compassionate communication is a key to the success of both hospital medicine and palliative care. Many patients with life‐limiting diseases prefer to receive prognostic information and to discuss goals of care.[33] How this information is integrated and communicated through the care continuum is crucial, especially in the era of duty hour limits and frequent handoffs. The information exchange needs to facilitate active participation of primary care physicians who may not be involved in hospital care. Some of the innovative strategies for communication and transfer of palliative care information, such as prognosis, goals of care, family meeting consensus, and symptom control interventions, include a palliative care checklist in the electronic health record, incorporation of prognostic and family meeting information in the discharge summary, and links to the national Physician Orders for Life‐Sustaining Treatment advanced care planning program.[34] Of note, a pilot program in the United Kingdom adopting an electronic palliative care summary has reduced after‐hour emergency room visits and hospital readmissions.[35] The following case illustrates this point.
CASE 3
Mrs. K, an 82‐year‐old Russian‐speaking woman with newly diagnosed metastatic pancreatic cancer, is admitted for worsening obstructive jaundice and a second opinion about treatment. A biliary stent is placed and her jaundice slowly improves. The patient and family have requested chemotherapy. However, the oncologist determines that she would only qualify for a phase I trial given her poor performance status. The hospitalist team requests the help of the palliative care consult team to manage her severe pain, depression, and to provide support to the family. After several family meetings, the patient and family choose not to pursue chemotherapy. Given the lack of adequate support at home, she is discharged to a skilled nursing facility for short‐term rehabilitation with plans to transition to the in‐house hospice program. The hospitalist, palliative care attending physician, and the medical director of the rehabilitation facility have a 3‐way phone conference to confirm the plans of care and to ensure a smooth care transition.
In this case, the hospitalist team recognizes that this is a sentinel hospitalization for Mrs. K that requires extensive palliative care intervention. Often, transitioning to skilled nursing facilities (SNF) is the default pathway for patients needing hospice/palliative care, especially when patients and families are not yet ready to discuss prognosis realistically or to accept hospice, or there is not enough support available at home. A recent large cohort study showed that 30% of patients in their last 6‐month of life had used, and nearly 10% of such patients had died, under Medicare's posthospitalization SNF benefit.[36] Although the worsening disease trajectory may not be apparent at hospital discharge, it is more likely that the financial and practical limitation of the Medicare Hospice Benefit accounts for this observation, which includes limited home health aid hours, lack of coverage for room and board, and lower payments to SNFs.[36] Hospitalists can help address the issue of discharge location for patients needing palliative care. Sometimes this requires extensive communication before and after discharge to help enhance the transition from a rehabilitation facility to hospice/palliative care. Appropriately integrated palliative care at the time of care transitions, in the form of hospice or longitudinal home‐based palliative care rather than just routine clinic follow‐up, has the potential to reduce 30‐day readmission for chronically ill, elderly patients and for patients near the end of life.[37, 38] It is critical that national policy, suitable reimbursement, and financial incentives support this practice. A demonstration project, Better Outcomes by Optimizing Safe Transitions (BOOST), organized by the Society of Hospital Medicine, integrates palliative care evaluation into a comprehensive discharge assessment tool. This intervention has been shown to reduce readmissions to acute care hospitals.[39]
In this article, we define a sentinel hospitalization and suggest that its recognition provides an important opportunity for hospitalists to actively integrate palliative care into patients' chronic disease management programs, with inputs from patients, their families, their primary physicians and subspecialists, as well as palliative care specialists. We also recognize that within nonsentinel hospitalizations, there are important opportunities to discuss prognosis, goals of care, and advanced care planning. This approach allows the fresh eyes of hospitalists to assess the patient's current health status and prognosis, to communicate these relevant clinical issues with the patient and family, and to encourage discussions about goals of care and advanced care planning during the sentinel hospitalization. It also provides a structured vehicle for soliciting the patient's (and family's) perspectives and documenting them in the medical record. A compilation of sample items to guide discussion can be found in Table 2. Hospitalists, equipped with basic palliative care skills and supported by hospital‐ and community‐based palliative care teams, can thrive in this unique position of optimizing the quality of care for these patients.[40] Almost 20 years ago, the field of palliative care rose to national prominence on the findings of the SUPPORT (Study to Understand Prognoses and Preferences for Outcomes and Risks of Treatments) study, which investigated the suboptimal end‐of‐life experiences of hospitalized adult patients.[41] Since then, the fields of both hospital medicine and palliative care have grown, yet the best is still to come for their collaborative excellence, mutual education, and shared care innovation at the forefront of medicine.
| Patient/family understanding of disease process and treatment outcomes |
| Patient/family understanding of disease prognosis |
| Availability of alternative treatment options including palliative/hospice care |
| Patient/family wishes/goals of care |
| Advanced‐care planning including limitations of care |
| Inventory of symptoms (frequency, severity, modifying factors, timing, and treatments) |
| Social and financial stress |
| Emotional and existential stress |
| Social support system and caregivers |
| Living arrangements |
Disclosure: Nothing to report.
- , , , , , , et al. Evolving practice of hospital medicine and its impact on hospital throughput and efficiencies. J Hosp Med. 2012;7:649–654.
- , , , . Medicare beneficiaries' costs of care in the last year of life. Health Affairs. 2001;20:188–195.
- . Palliative care in hospitals. J Hosp Med. 2006;1:21–28.
- . Palliative care and hospitalists: a partnership for hope. J Hosp Med. 2006;1:5–6.
- , . Palliative care and the hospitalist: an opportunity for cross‐fertilization. Am J Med. 2001;111:10s–14s.
- , . Palliative care. Ann Intern Med. 2012;156:ITC2‐1, TC2‐2–15; quiz TC2‐16.
- , , , , . Patterns of functional decline at the end of life. JAMA. 2003;289:2387–2392.
- , , , et al. The clinical course of advanced dementia. N Engl J Med. 2009;361:1529–1538.
- , . Extent and determinants of error in doctor's prognoses in terminally ill patients: prospective cohort study. BMJ. 2000;320:469–472.
- , , , et al. Prognostic significance of the “surprise” question in cancer patients. J Palliat Med. 2010;13:837–840.
- , , , et al. Utility of the “surprise” question to identify dialysis patients with high mortality. Clin J Am Soc Nephrol. 2008;3:1379–1384.
- , , , et al. Development and validation of a prognostic index for 1‐year mortality in older adults after hospitalization. JAMA. 2001;285:2987–2994.
- , , , , . Mortality predictions on admission as a context for organizing care activities. J Hosp Med. 2013,8:229–235.
- , , , , . Caring about prognosis: a validation study of the CARING criteria to identify hospitalized patients at high risk for death at 1 year. J Hosp Med. 2013,8:696–701.
- , , , , , , et al. Meta‐analysis of survival prediction with palliative performance scale. J Palliat Care. 2007;23:245–254.
- , , , , . Prognostic indices for older adults: a systemic review. JAMA. 2012;307:182–192.
- , . Identifying patients in need of a palliative care assessment in the hospital setting. J Palliat Med. 2011;14:17–23.
- , , , , , . Functional status of elderly adults before and after initiation of dialysis. N Engl J Med. 2009;361:1539–1547.
- , , . Top 10 things palliative care clinicians wished everyone knew about palliative care. Mayo Clin Proc. 2013;88:859–865.
- . Palliative and end‐of‐life care for patients with severe COPD. Eur Respir J. 2008;32:796–803.
- . Palliative care in congestive heart failure. J Am Coll Cardiol. 2009;54:386–396.
- , . Generalist plus specialist palliative care—creating a more sustainable model. N Engl J Med. 2013;368:1173–1175.
- , , , , , . Common myths about caring for patients with terminal illness: opportunities to improve care in the hospital setting. J Hosp Med. 2007;2:357–365.
- , , , . Opportunity lost: end‐of‐life discussions in cancer patients who die in the hospital. J Hosp Med. 2013;8:334–340.
- , , . Palliative medicine physician education in the United States: a historical review. J Palliat Med. 2013;16:230–236.
- , . Hospitalization as an opportunity to integrate palliative care in heart failure management. Curr Opin Support Palliat Care. 2009;3:247–251.
- , , , et al. The quality of care provided to hospitalized patients at the end of life. Arch Intern Med. 2010;170:1057–1063.
- , , , , , . Outcomes of the acute palliative care unit in an academic medical center [published online ahead of print May 10, 2013]. Am J Hosp Palliat Care. doi: 10.1177/1049909113489164.
- , , , , , . Update in hospital palliative care. J Hosp Med. 2013;12:715–720.
- , , , et al. Early palliative care for patients with metastatic non‐small‐cell lung cancer. N Engl J Med. 2010;363:733–742.
- , , , . Early integration of palliative care services with standard oncology care for patients with advanced cancer. CA Cancer J Clin. 2013;63:349–363.
- , , , et al. A reengineered hospital discharge program to decrease rehospitalization: a randomized trial. Ann Intern Med. 2009;150:178–187.
- , , , , , . “Knowing is better”: preferences of diverse older adults for discussion prognosis. J Gen Intern Med. 2012;27:568–575.
- , , . POLST, an improvement over traditional advanced directives. Cleve Clin J Med. 2012;79:457–464.
- , , , . Use of a structured palliative care summary in patients with established cancer is associated with reduced hospital admissions by out‐of‐hours general practitioners in Grampian [published online ahead of print January 3, 2013]. BMJ Support Palliat Care. doi:10.1136/bmjspcare‐2012‐000371.
- , , , , , . Use of the Medicare posthospitalization skilled nursing benefit in the last 6 months of life. Arch Intern Med. 2012;172:1573–1579.
- , , , et al. Increased satisfaction with care and lower costs: results of a randomized trial of in‐home palliative care. J Am Geriatr Soc. 2007;55:993–1000.
- , , . 30‐day readmissions among seriously ill older adults. J Palliat Med. 2012;15:1–6.
- , , , et al. Project BOOST: effectiveness of a multihospital effort to reduce rehospitalization. J Hosp Med. 2013;8:421–427.
- . Ensuring safe, quality care for hospitalized people with advanced illness, a core obligation for hospitalists. J Hosp Med. 2007;2:355–356.
- The SUPPORT Principal Investigators. A controlled trial to improve care for seriously ill hospitalized patients: the Study to Understand Prognoses and Preferences for Outcomes and Risks of Treatments (SUPPORT). JAMA. 1995;274:1591–1598.
Inpatient Questionnaire for Frail Elders
Patient‐reported quality of care is currently an important outcome measure. Ideally, quality of care is assessed by measuring patient's experiences rather than patient satisfaction, as most patients are satisfied with the care they receive, even if the quality is poor.[1] Within the study of the CareWell in Hospital (CWH) program[2]which aims to improve quality of care for frail inpatients age 70 yearswe aimed to assess experiences using a questionnaire to determine the quality of hospital care from the perspective of elderly inpatients. This questionnaire should specifically address whether individualized, integrated care is delivered, with an emphasis on autonomy and maintaining patient independence as well as integrating well‐being into hospital care, all of which are aims of the CWH program. In this, it follows the perspective of integrated care as enabling the achievement of common goals and optimal care results from the patients' view: Care should be sensitive to the characteristics and needs of individual patients.[3]
In the Netherlands, a patient questionnaire to measure experiences with hospital care was carefully developed (partially based on the Consumer Assessment of Healthcare Providers and Systems) and is used to obtain information for national benchmarking: the Consumer Quality Index (CQI).[4] However, we considered this questionnaire containing 78 core questions as well as the time between discharge and measurement (often several months) too long for frail elderly patients, as they have complex, multidisciplinary needs and may have difficulty communicating their needs and reporting their experienced quality of care.
Here, we report on the development and validation of a questionnaire that is based on the CQI and can be used to measure the quality of individualized and integrated hospital care as experienced by inpatients age 70 years.
METHODS
Development
The predefined criteria for the questionnaire were that it should be brief, thereby reducing the burden placed on frail elderly persons; cover the aims of CWH; and measure experiences rather than satisfaction.
Ten categories were initially formulated to match CWH's goals of autonomy, independence, well‐being, individualized care, communication, coordination of care, continuity of care, patient safety, and competence of physicians and nurses. Items from the CQI questionnaire database[5] were selected for each category. Ten members of a panel representing the elderly target group were invited to select the 3 most important questions in each category (first Delphi round). This panel is an important party within a regional network of care and well‐being organizations and involved in discussing the various regional care and/or well‐being projects when it concerns their content and value for elderly persons. They represent elderly persons through their position in elderly‐care or informal care organizations or from personal experiences. During a second Delphi round, they determined whether the individual items of the concept questionnaire were clearly stated, comprehensible to frail elderly patients, represent quality of care, have appropriate answer categories, and so forth. The final questionnaire was edited to match the reading level of a 12‐year‐old and approved by the panel in a face‐to‐face meeting. By this process, content validity was ensured.[6]
Data Collection
The final questionnaire was mailed to both frail and nonfrail medical and surgical inpatients who were included in the CWH before‐after study (January 2011 to July 2012) 1 week after their discharge, by a research assistant (see Supporting Information, Appendix A, in the online version of this article for a description of the study and CWH program).
Patients in the CWH study who returned the questionnaire during the postimplementation measurement period were asked to participate in the test‐retest reliability study until a predetermined sample size of 75 was reached (March 2012 to November 2012). The target interval between returning the first and second questionnaire was 2 to 14 days.[7]
In addition, patients admitted to the geriatrics departmentand therefore assumed to be frailreceived the questionnaire upon discharge (February 2012 to April 2013). The geriatrics department administered the questionnaire anonymously for evaluation and quality‐improvement purposes, as part of usual care. The secretary included the questionnaire in all patient files, and a nurse provided the questionnaire to patients together with other important discharge documents. This questionnaire also included a question regarding goal attainment, as this reflects whether what is important to the most frail elderly patients was accomplished.
Validation and Analysis
Data were analyzed using the statistical software program SPSS version 18.0 (SPSS Inc., Chicago, IL.).
Data
Characteristics of (non)responders, levels of missing data, and measurement range were assessed using descriptive statistics.
Reliability
Internal consistency was assessed by calculating Cronbach's for all available questionnaires with complete data. The answer categories were recoded to a 010 scale; 10 represents the highest quality of care. Test‐retest reliability[6] was assessed by calculating Cohen's for individual questions and intraclass correlation (ICC) for the questionnaire's mean score.
Validity
The following hypotheses were tested in order to assess construct validity: lower scores for female patients[8] and for patients who rate their health lower,[9] and with higher education[8, 9]; higher scores for patients who had an elective admission[8] and whose treatment goals were achieved (own reasoning). Finally, whether patients answered the questionnaire independently or with help should not affect scores (own reasoning). The Spearman was calculated for nonparametric and ordinal data.
In addition, we performed a Kruskal‐Wallis analysis to test the hypothesis that patients admitted to different departments have different scores. Second, we used the Mann‐Whitney U test to detect differences before and after implementation of the CWH program.
For all these analyses, only questionnaires with complete data were included.
RESULTS
Development
The selected answers within the categories communication and competence of nurses and physicians by the panel overlapped with questions from the other 8 categories; thus, the final questionnaire contains 8 core questions (Table 1) (see Supporting Information, Appendix B, in the online version of this article).
| Question |
|---|
|
| 1. Were you informed sufficiently by your doctor regarding the various options for treating your health problems? |
| 2. Were you able to indicate which treatment and/or care you preferred? |
| 3. During your hospital stay, could you co‐decide what was important to your care? |
| 4. During your hospital stay, were you supported in keeping busy and finding social contacts and activities? |
| 5. Did you know to whom you can go within the hospital with questions, problems, or complaints? |
| 6. Before discharge, did you talk with a member of the hospital staff regarding the care you would need after discharge? |
| 7. Did a member of the hospital staff inform the key people and/or care providers of your discharge from the hospital? |
| 8. During your hospital stay, did you experience 1 or more of the following events? |
| Did you fall? |
| Did you become confused? |
| Did you develop pressure ulcers? |
| Did medication errors occur? |
| Did you develop a urinary tract infection? |
| Did you develop a wound infection? |
| Did you experience complications with your surgery and/or treatment? |
Data Collection
Figure 1 shows a flowchart of the questionnaires.

Table 2 presents data of responders compared with nonresponders who were included in the CWH study (N = 293). Patients were age 70 years and admitted 48 hours. Patients responded 14.8 11.3 days after discharge (n = 265). Response rate was 75.8%. From 18 responders no baseline characteristics were available, as only the questionnaire was collected from them to reach n = 75 for test‐retest purposes.
| No. | Responders | No. | Nonresponders | P Value | |
|---|---|---|---|---|---|
| |||||
| Age, y SD | 275 | 76.9 5.2 | 88 | 77.3 5.5 | 0.701 |
| Male sex, n (%) | 275 | 156 (56.7) | 88 | 52 (59.1) | 0.696 |
| CIRS‐G, score SD | 274 | 12.8 5.0 | 88 | 13.9 5.0 | 0.071 |
| MMSE admission, score SD | 264 | 26.7 3.7 | 82 | 25.1 4.8 | 0.001 |
| MMSE discharge, score SD | 230 | 26.9 3.7 | 66 | 25.8 4.4 | 0.026 |
| Length of stay, days SD | 275 | 8.2 7.4 | 88 | 9.6 9.7 | 0.322 |
| Department, surgical (%) | 275 | 170 (61.8) | 88 | 56 (63.6) | 0.759 |
| Admission type, n (%) | 275 | 88 | 0.343 | ||
| Emergency | 82 (29.8) | 22 (25.0) | |||
| Elective | 138 (50.2) | 52 (59.1) | |||
| From other hospital or other department | 55 (20.0) | 14 (15.9) | |||
| Marital status, alone (%) | 273 | 187 (68.5) | 84 | 50 (59.5) | 0.128 |
| Discharge destination, n (%) | 275 | 88 | 0.000 | ||
| Home | 197 (71.6) | 54 (61.4) | |||
| Other hospital | 69 (25.1) | 20 (22.7) | |||
| Care facility | 9 (3.3) | 14 (15.9) | |||
| Readmission, n (%) | 275 | 38 (13.8) | 88 | 7 (8.0) | 0.146 |
| Readmission 1 mo, n (%) | 275 | 28 (10.2) | 88 | 14 (15.9) | 0.144 |
| Death 3 mo following discharge, n (%) | 274 | 9 (3.3) | 86 | 5 (5.8) | 0.233 |
| Received CWH intervention | 149 | 43 (28.9) | 33 | 15 (45.5) | 0.064 |
Patients in the geriatrics department responded in 10.5 15.0 days (n = 111). Mean length of stay was 9.0 7.2 days (n = 116). Data regarding other baseline characteristics and response rate were unavailable due to privacy concerns.
Data Characteristics
Table 3 summarizes data of all 470 questionnaires. Response rates to the answer options ranged from 3.8% to 66.8%. Missing data among the questions ranged from 1.7% within question 8 to 7.0% within question 4. Upon combining the answer categories I don't know and missing, 7/8 questions had >10% missing data; the questions 2 and 3 had the highest percentage of missing data due to the I don't know answer option. The reasons stated by the respondents for why they could not answer these questions included cognitive disabilities; the perception that, because there was only one option (eg, in case of emergency admissions), the question did not apply to them; and/or that the patients preferred not to co‐decide because they felt that the physician knows best and can decide what is best.
| Data (n = 470) | Test‐Retest (n = 78) | |||
|---|---|---|---|---|
| No. | % | No. | ||
| ||||
| Sufficiently informed regarding treatment options | 65 | 0.278 | ||
| Not at all | 23 | 4.9 | ||
| Sometimes | 90 | 19.1 | ||
| Often | 115 | 24.5 | ||
| Every time | 191 | 40.6 | ||
| Don't know | 29 | 6.2 | ||
| Missing | 21 | 4.7 | ||
| Treatment and care preferences discussed | 59 | 0.415 | ||
| Not at all | 89 | 18.9 | ||
| Sometimes | 78 | 16.6 | ||
| Often | 61 | 13.0 | ||
| Every time | 111 | 23.6 | ||
| Don't know | 103 | 21.9 | ||
| Missing | 28 | 6.0 | ||
| Co‐decide regarding important issues | 56 | 0.295 | ||
| Not at all | 75 | 16.0 | ||
| Sometimes | 86 | 18.3 | ||
| Often | 67 | 14.3 | ||
| Every time | 112 | 23.8 | ||
| Don't know | 98 | 20.9 | ||
| Missing | 32 | 6.8 | ||
| Supported in finding (social) activities | 73 | 0.533 | ||
| Not at all | 72 | 15.3 | ||
| A little | 66 | 14.0 | ||
| Good | 109 | 23.2 | ||
| Very good | 36 | 7.7 | ||
| Not applicable | 130 | 27.7 | ||
| Don't know | 24 | 5.1 | ||
| Missing | 33 | 7.0 | ||
| Knows relevant person for questions, problems, complaints | 77 | 0.652 | ||
| Yes | 279 | 59.4 | ||
| No | 107 | 22.8 | ||
| Don't know | 67 | 14.3 | ||
| Missing | 17 | 3.6 | ||
| Discussed postdischarge care needs | 75 | 0.574 | ||
| Yes, sufficient | 311 | 66.2 | ||
| Yes, but insufficient | 26 | 5.5 | ||
| No | 99 | 20.3 | ||
| I don't know/I don't remember | 18 | 3.8 | ||
| Missing | 19 | 4.0 | ||
| Hospital informed other important people/providers of discharge | 69 | 0.405 | ||
| No | 45 | 9.6 | ||
| Some were informed | 54 | 11.5 | ||
| Yes | 314 | 66.8 | ||
| Don't know | 38 | 8.1 | ||
| Missing | 19 | 4.0 | ||
| Adverse events during hospital admission | DK | MIS | 78 | 0.816 |
| Fall, confusion, pressure ulcer, medication error, bladder infection, wound infection, complication of surgery/treatment | Max 9.1% | Max 4.3% | ||
| Sum | Mean | No. | ICC | |
| Mean score on the total questionnaire, complete cases (n = 222) | 51.9 18.3 | 6.5 2.3 | 39 | 0.745 |
Reliability
Of the 470 questionnaires, 222 (47.2%) had complete data and were used to analyze internal consistency. Cronbach's for the 8‐item questionnaire was 0.70 (good internal consistency).
Seventy‐eight questionnaires were available to measure test‐retest reliability. The interval between test‐retest was 8.7 4.8 days; 94.7% was returned within the targeted 14 days. Thirty‐eight patients had complete data for both measurements: ICC on the mean score of the questionnaire was 0.75 (95% confidence interval [CI]: 0.56‐0.86), which indicates good test‐retest reliability (Table 3). Including patients with incomplete data (1 to 2 missing items) yielded an ICC >0.70. Among the individual questions, Cohen's ranged from 0.28 to 0.82.
Validity
The mean questionnaire score was significantly correlated with goals achieved while hospitalized (Table 4).
| Variable | Response | No.a | Score SD | Correlation |
|---|---|---|---|---|
| ||||
| Sex | M | 114 | 6.3 2.3 | 0.080 |
| F | 108 | 6.7 2.3 | ||
| Health status | Excellent | 1 | 0.071 | |
| Very good | 5 | 7.9 2.0 | ||
| Good | 52 | 6.7 2.4 | ||
| Fair | 120 | 6.5 2.2 | ||
| Poor | 28 | 6.2 2.1 | ||
| Education level | 6 grades primary school | 4 | 4.9 1.2 | 0.068 |
| Primary school | 19 | 6.4 2.5 | ||
| Higher than primary school | 6 | 7.6 1.2 | ||
| Practical training | 27 | 6.0 2.2 | ||
| Secondary vocational training | 41 | 6.1 2.5 | ||
| Pre‐university education | 2 | 7.2 4.0 | ||
| University/higher education | 20 | 6.8 2.2 | ||
| Admission type | Emergency | 31 | 6.5 2.6 | 0.015 |
| Elective | 61 | 6.6 2.0 | ||
| Goal of admission achieved | Yes | 33 | 7.6 1.7 | 0.319b |
| Partially | 24 | 6.6 2.1 | ||
| No | 6 | 4.7 2.8 | ||
| Respondent | Patient only | 117 | 6.7 2.2 | 0.063 |
| Patient with help | 59 | 5.9 2.3 | ||
| Other person | 41 | 6.7 2.4 | ||
Mean scores did not differ significantly between departments (geriatrics: 6.8 2.2, n = 88; cardiothoracic surgery and lung diseases: 6.5 2.4, n = 54; internal medicine: 6.3 2.5, n = 30; general surgery: 6.0 2.2, n = 50; P = 0.234).
In addition, mean scores did not differ significantly before (6.5 2.2, n = 53) and after (6.1 2.4, n = 67) implementation of the CWH study (P = 0.320).
DISCUSSION
The CareWell in Hospital patient questionnaire is a brief 8‐item questionnaire to assess the experiences of elderly patients regarding integrated hospital care. It showed good internal consistency and test‐retest reliability, and low responsiveness. Here we discuss some issues related to the preset criteria of the questionnaire.
First, a panel representing the elderly target population was used to develop the questionnaire in order to ensure content validity, which was confirmed by good internal consistency. Yet, with respect to individualized, integrated care for frail elderly patients, we recommend including a question regarding the involvement of informal caregivers during the hospital stay, as they are important partners in healthcare.[10]
Second, the questionnaire was kept short because it should not be a burden and feasible for frail patients to complete. Nonetheless, some of the questions had a high nonresponse rate, and many patients answered I don't know, particularly to the questions 2 and 3. It does not necessarily mean that these questions are poor in quality; it could also indicate that offering individualized care is not yet embedded in the culture of elderly patients and care professionals, such that patients consider such questions to be irrelevant.[11, 12] Nevertheless, we suggest to further explore the feasibility of the questionnaire and potential additional methods for the most frail elderly,[13] who might have been excluded from the CWH study sample at this point (Table 2).
Third, the questionnaire measures experiences rather than satisfaction. Patient‐satisfaction scores are generally tightly correlated with the age, sex, education level, health status, and the person completing the questionnaire.[8] In our study, the correlation did not reach statistical significance. Nevertheless, the achievement of preset goals was correlated significantly with mean CWH scores (Table 4). These findings may indicate that individualized care experiences can indeed be assessed better using this questionnaire. Test‐retest reliability also supports validity, as we expectedand, indeed, sawhigher reliability among the more objective questions (eg, question 8). The most valuing question is question 1, which also had the lowest reliability; the word sufficiently should perhaps be removed in the next version in order to increase its reliability and objectivity.
Finally, scores did not differ between before and after implementation of the CWH program, which suggests either that the questionnaire is unable to detect change or that the program was not sufficiently effective to invoke change yet. The latter option seems plausible, as changes in the provision of individualized care were ongoing. In addition, the items on which favorable differences can be seen for CWH are in fact the items that could be most directly influenced by the CWH interventionists, questions 4, 6, and 7 (see Supporting Information, Appendix C, in the online version of this article). Lastly, we performed an extra analysis concerning the discriminating property of the questionnaire in a subgroup of frail elderly patients; we do see a significant difference in scores between the frail patients in the geriatrics department and the frail patients who received the CWH intervention: 6.8 (n = 88) vs 4.8 (n = 13) for complete data, respectively, P = 0.013; and 6.8 (n = 155) vs 5.7 (n = 37) for incomplete data (2 items missing), P = 0.017 (Mann‐Whitney U test). This may indicate that the questionnaire can measure differences in quality of care for specifically the frail elderly patients between departments. However, these issuesincluding validity and reliability characteristics per specific patient subgroupwarrant further research using a larger sample.
CONCLUSIONS
In conclusion, the CareWell in Hospital patient questionnaire is a feasible and reliable tool for assessing experiences of frail elderly inpatients in the provision of individualized, integrated care. To improve the questionnaire, we recommend to add a question regarding the participation of informal caregivers during the hospital stay, investigate the response rate to questions regarding participation and shared decision‐making, and study responsiveness issues further.
Acknowledgements
The authors thank Gerda van Straaten, Anne Kuijpers, and Thijs Cauven for their support with data collection. We thank all members of the ZOWEL Study Group and the panel representing the elderly target group.
Disclosures: The work was made possible by grant 60‐6190‐098‐272 and grant 60‐61900‐98‐129 of the National Programme for Elderly Care, coordinated and sponsored by ZonMw, The Netherlands, Organization of Health Research and Development. The authors report no conflicts of interest.
- , , . Patient Experience of Health Care Performance. Adelaide, Australia: Primary Health Care Research November 2009. Available at: http://dspace.flinders.edu.au/jspui/bitstream/2328/26594/1/PIR NOV 09 Full.pdf.
- , , , . Hospital Elder Life Program integrated in Dutch hospital care: a pilot study. J Am Geriatr Soc. 2013;61(4):641–642.
- , . Integrated care: meaning, logic, applications, and implications—a discussion paper. Int J Integr Care. 2002;2:e12.
- , , , . CQ‐index Ziekenhuisopname: meetinstrumentontwikkeling. Kwaliteit van de zorg tijdens ziekenhuisopnames vanuit het perspectief van patiënten. De ontwikkeling van het instrument, de psychometrische eigenschappen en het discriminerend vermogen [in Dutch]. Utrecht, The Netherlands: NIVEL (Netherlands Institute for Health Services Research), 2009.
- Centrum Klantervaring Zorg.CQI vragenbank (CQI questionnaire database). Available at: http://nvl002.nivel.nl/CQI. Accessed May–June 2010.
- , , , et al. Quality criteria were proposed for measurement properties of health status questionnaires. J Clin Epidemiol. 2007;60(1):34–42.
- , . Health Measurement Scales: A Practical Guide to Their Development and Use. 4th ed. Oxford, UK: Oxford University Press; 2008:182–183.
- , , , . Assessing patient satisfaction: implications for South Australian public hospitals. Aust Health Rev. 2005;29(4):439–446.
- , , , , . Patient satisfaction revisited: a multilevel approach. Soc Sci Med. 2009;69(1):68–75.
- , , , et al. Relatives' perspective on the quality of geriatric care and rehabilitation—development and testing of a questionnaire. Scand J Caring Sci. 2008;22(4):590–595.
- , , , . Are elderly people with co‐morbidities involved adequately in medical decision making when hospitalised? A cross‐sectional survey. BMC Geriatr. 2011;11:46.
- , , , , . Preferences of acutely ill patients for participation in medical decision‐making. Qual Saf Health Care. 2008;17(2):97–100.
- , . Experience of general hospital care in older patients with cognitive impairment: are we measuring the most vulnerable patients' experience? BMJ Qual Saf. 2013;doi:10.1136/bmjqs‐2013‐001961.
- , . A Manual of Guidelines for Scoring the Cumulative Illness Rating Scale for Geriatrics (CIRS‐G). Pittsburgh, PA: University of Pittsburgh School of Medicine, Department of Geriatric Psychiatry; 1991.
Patient‐reported quality of care is currently an important outcome measure. Ideally, quality of care is assessed by measuring patient's experiences rather than patient satisfaction, as most patients are satisfied with the care they receive, even if the quality is poor.[1] Within the study of the CareWell in Hospital (CWH) program[2]which aims to improve quality of care for frail inpatients age 70 yearswe aimed to assess experiences using a questionnaire to determine the quality of hospital care from the perspective of elderly inpatients. This questionnaire should specifically address whether individualized, integrated care is delivered, with an emphasis on autonomy and maintaining patient independence as well as integrating well‐being into hospital care, all of which are aims of the CWH program. In this, it follows the perspective of integrated care as enabling the achievement of common goals and optimal care results from the patients' view: Care should be sensitive to the characteristics and needs of individual patients.[3]
In the Netherlands, a patient questionnaire to measure experiences with hospital care was carefully developed (partially based on the Consumer Assessment of Healthcare Providers and Systems) and is used to obtain information for national benchmarking: the Consumer Quality Index (CQI).[4] However, we considered this questionnaire containing 78 core questions as well as the time between discharge and measurement (often several months) too long for frail elderly patients, as they have complex, multidisciplinary needs and may have difficulty communicating their needs and reporting their experienced quality of care.
Here, we report on the development and validation of a questionnaire that is based on the CQI and can be used to measure the quality of individualized and integrated hospital care as experienced by inpatients age 70 years.
METHODS
Development
The predefined criteria for the questionnaire were that it should be brief, thereby reducing the burden placed on frail elderly persons; cover the aims of CWH; and measure experiences rather than satisfaction.
Ten categories were initially formulated to match CWH's goals of autonomy, independence, well‐being, individualized care, communication, coordination of care, continuity of care, patient safety, and competence of physicians and nurses. Items from the CQI questionnaire database[5] were selected for each category. Ten members of a panel representing the elderly target group were invited to select the 3 most important questions in each category (first Delphi round). This panel is an important party within a regional network of care and well‐being organizations and involved in discussing the various regional care and/or well‐being projects when it concerns their content and value for elderly persons. They represent elderly persons through their position in elderly‐care or informal care organizations or from personal experiences. During a second Delphi round, they determined whether the individual items of the concept questionnaire were clearly stated, comprehensible to frail elderly patients, represent quality of care, have appropriate answer categories, and so forth. The final questionnaire was edited to match the reading level of a 12‐year‐old and approved by the panel in a face‐to‐face meeting. By this process, content validity was ensured.[6]
Data Collection
The final questionnaire was mailed to both frail and nonfrail medical and surgical inpatients who were included in the CWH before‐after study (January 2011 to July 2012) 1 week after their discharge, by a research assistant (see Supporting Information, Appendix A, in the online version of this article for a description of the study and CWH program).
Patients in the CWH study who returned the questionnaire during the postimplementation measurement period were asked to participate in the test‐retest reliability study until a predetermined sample size of 75 was reached (March 2012 to November 2012). The target interval between returning the first and second questionnaire was 2 to 14 days.[7]
In addition, patients admitted to the geriatrics departmentand therefore assumed to be frailreceived the questionnaire upon discharge (February 2012 to April 2013). The geriatrics department administered the questionnaire anonymously for evaluation and quality‐improvement purposes, as part of usual care. The secretary included the questionnaire in all patient files, and a nurse provided the questionnaire to patients together with other important discharge documents. This questionnaire also included a question regarding goal attainment, as this reflects whether what is important to the most frail elderly patients was accomplished.
Validation and Analysis
Data were analyzed using the statistical software program SPSS version 18.0 (SPSS Inc., Chicago, IL.).
Data
Characteristics of (non)responders, levels of missing data, and measurement range were assessed using descriptive statistics.
Reliability
Internal consistency was assessed by calculating Cronbach's for all available questionnaires with complete data. The answer categories were recoded to a 010 scale; 10 represents the highest quality of care. Test‐retest reliability[6] was assessed by calculating Cohen's for individual questions and intraclass correlation (ICC) for the questionnaire's mean score.
Validity
The following hypotheses were tested in order to assess construct validity: lower scores for female patients[8] and for patients who rate their health lower,[9] and with higher education[8, 9]; higher scores for patients who had an elective admission[8] and whose treatment goals were achieved (own reasoning). Finally, whether patients answered the questionnaire independently or with help should not affect scores (own reasoning). The Spearman was calculated for nonparametric and ordinal data.
In addition, we performed a Kruskal‐Wallis analysis to test the hypothesis that patients admitted to different departments have different scores. Second, we used the Mann‐Whitney U test to detect differences before and after implementation of the CWH program.
For all these analyses, only questionnaires with complete data were included.
RESULTS
Development
The selected answers within the categories communication and competence of nurses and physicians by the panel overlapped with questions from the other 8 categories; thus, the final questionnaire contains 8 core questions (Table 1) (see Supporting Information, Appendix B, in the online version of this article).
| Question |
|---|
|
| 1. Were you informed sufficiently by your doctor regarding the various options for treating your health problems? |
| 2. Were you able to indicate which treatment and/or care you preferred? |
| 3. During your hospital stay, could you co‐decide what was important to your care? |
| 4. During your hospital stay, were you supported in keeping busy and finding social contacts and activities? |
| 5. Did you know to whom you can go within the hospital with questions, problems, or complaints? |
| 6. Before discharge, did you talk with a member of the hospital staff regarding the care you would need after discharge? |
| 7. Did a member of the hospital staff inform the key people and/or care providers of your discharge from the hospital? |
| 8. During your hospital stay, did you experience 1 or more of the following events? |
| Did you fall? |
| Did you become confused? |
| Did you develop pressure ulcers? |
| Did medication errors occur? |
| Did you develop a urinary tract infection? |
| Did you develop a wound infection? |
| Did you experience complications with your surgery and/or treatment? |
Data Collection
Figure 1 shows a flowchart of the questionnaires.
Table 2 presents data of responders compared with nonresponders who were included in the CWH study (N = 293). Patients were age 70 years and admitted 48 hours. Patients responded 14.8 11.3 days after discharge (n = 265). Response rate was 75.8%. From 18 responders no baseline characteristics were available, as only the questionnaire was collected from them to reach n = 75 for test‐retest purposes.
| No. | Responders | No. | Nonresponders | P Value | |
|---|---|---|---|---|---|
| |||||
| Age, y SD | 275 | 76.9 5.2 | 88 | 77.3 5.5 | 0.701 |
| Male sex, n (%) | 275 | 156 (56.7) | 88 | 52 (59.1) | 0.696 |
| CIRS‐G, score SD | 274 | 12.8 5.0 | 88 | 13.9 5.0 | 0.071 |
| MMSE admission, score SD | 264 | 26.7 3.7 | 82 | 25.1 4.8 | 0.001 |
| MMSE discharge, score SD | 230 | 26.9 3.7 | 66 | 25.8 4.4 | 0.026 |
| Length of stay, days SD | 275 | 8.2 7.4 | 88 | 9.6 9.7 | 0.322 |
| Department, surgical (%) | 275 | 170 (61.8) | 88 | 56 (63.6) | 0.759 |
| Admission type, n (%) | 275 | 88 | 0.343 | ||
| Emergency | 82 (29.8) | 22 (25.0) | |||
| Elective | 138 (50.2) | 52 (59.1) | |||
| From other hospital or other department | 55 (20.0) | 14 (15.9) | |||
| Marital status, alone (%) | 273 | 187 (68.5) | 84 | 50 (59.5) | 0.128 |
| Discharge destination, n (%) | 275 | 88 | 0.000 | ||
| Home | 197 (71.6) | 54 (61.4) | |||
| Other hospital | 69 (25.1) | 20 (22.7) | |||
| Care facility | 9 (3.3) | 14 (15.9) | |||
| Readmission, n (%) | 275 | 38 (13.8) | 88 | 7 (8.0) | 0.146 |
| Readmission 1 mo, n (%) | 275 | 28 (10.2) | 88 | 14 (15.9) | 0.144 |
| Death 3 mo following discharge, n (%) | 274 | 9 (3.3) | 86 | 5 (5.8) | 0.233 |
| Received CWH intervention | 149 | 43 (28.9) | 33 | 15 (45.5) | 0.064 |
Patients in the geriatrics department responded in 10.5 15.0 days (n = 111). Mean length of stay was 9.0 7.2 days (n = 116). Data regarding other baseline characteristics and response rate were unavailable due to privacy concerns.
Data Characteristics
Table 3 summarizes data of all 470 questionnaires. Response rates to the answer options ranged from 3.8% to 66.8%. Missing data among the questions ranged from 1.7% within question 8 to 7.0% within question 4. Upon combining the answer categories I don't know and missing, 7/8 questions had >10% missing data; the questions 2 and 3 had the highest percentage of missing data due to the I don't know answer option. The reasons stated by the respondents for why they could not answer these questions included cognitive disabilities; the perception that, because there was only one option (eg, in case of emergency admissions), the question did not apply to them; and/or that the patients preferred not to co‐decide because they felt that the physician knows best and can decide what is best.
| Data (n = 470) | Test‐Retest (n = 78) | |||
|---|---|---|---|---|
| No. | % | No. | ||
| ||||
| Sufficiently informed regarding treatment options | 65 | 0.278 | ||
| Not at all | 23 | 4.9 | ||
| Sometimes | 90 | 19.1 | ||
| Often | 115 | 24.5 | ||
| Every time | 191 | 40.6 | ||
| Don't know | 29 | 6.2 | ||
| Missing | 21 | 4.7 | ||
| Treatment and care preferences discussed | 59 | 0.415 | ||
| Not at all | 89 | 18.9 | ||
| Sometimes | 78 | 16.6 | ||
| Often | 61 | 13.0 | ||
| Every time | 111 | 23.6 | ||
| Don't know | 103 | 21.9 | ||
| Missing | 28 | 6.0 | ||
| Co‐decide regarding important issues | 56 | 0.295 | ||
| Not at all | 75 | 16.0 | ||
| Sometimes | 86 | 18.3 | ||
| Often | 67 | 14.3 | ||
| Every time | 112 | 23.8 | ||
| Don't know | 98 | 20.9 | ||
| Missing | 32 | 6.8 | ||
| Supported in finding (social) activities | 73 | 0.533 | ||
| Not at all | 72 | 15.3 | ||
| A little | 66 | 14.0 | ||
| Good | 109 | 23.2 | ||
| Very good | 36 | 7.7 | ||
| Not applicable | 130 | 27.7 | ||
| Don't know | 24 | 5.1 | ||
| Missing | 33 | 7.0 | ||
| Knows relevant person for questions, problems, complaints | 77 | 0.652 | ||
| Yes | 279 | 59.4 | ||
| No | 107 | 22.8 | ||
| Don't know | 67 | 14.3 | ||
| Missing | 17 | 3.6 | ||
| Discussed postdischarge care needs | 75 | 0.574 | ||
| Yes, sufficient | 311 | 66.2 | ||
| Yes, but insufficient | 26 | 5.5 | ||
| No | 99 | 20.3 | ||
| I don't know/I don't remember | 18 | 3.8 | ||
| Missing | 19 | 4.0 | ||
| Hospital informed other important people/providers of discharge | 69 | 0.405 | ||
| No | 45 | 9.6 | ||
| Some were informed | 54 | 11.5 | ||
| Yes | 314 | 66.8 | ||
| Don't know | 38 | 8.1 | ||
| Missing | 19 | 4.0 | ||
| Adverse events during hospital admission | DK | MIS | 78 | 0.816 |
| Fall, confusion, pressure ulcer, medication error, bladder infection, wound infection, complication of surgery/treatment | Max 9.1% | Max 4.3% | ||
| Sum | Mean | No. | ICC | |
| Mean score on the total questionnaire, complete cases (n = 222) | 51.9 18.3 | 6.5 2.3 | 39 | 0.745 |
Reliability
Of the 470 questionnaires, 222 (47.2%) had complete data and were used to analyze internal consistency. Cronbach's for the 8‐item questionnaire was 0.70 (good internal consistency).
Seventy‐eight questionnaires were available to measure test‐retest reliability. The interval between test‐retest was 8.7 4.8 days; 94.7% was returned within the targeted 14 days. Thirty‐eight patients had complete data for both measurements: ICC on the mean score of the questionnaire was 0.75 (95% confidence interval [CI]: 0.56‐0.86), which indicates good test‐retest reliability (Table 3). Including patients with incomplete data (1 to 2 missing items) yielded an ICC >0.70. Among the individual questions, Cohen's ranged from 0.28 to 0.82.
Validity
The mean questionnaire score was significantly correlated with goals achieved while hospitalized (Table 4).
| Variable | Response | No.a | Score SD | Correlation |
|---|---|---|---|---|
| ||||
| Sex | M | 114 | 6.3 2.3 | 0.080 |
| F | 108 | 6.7 2.3 | ||
| Health status | Excellent | 1 | 0.071 | |
| Very good | 5 | 7.9 2.0 | ||
| Good | 52 | 6.7 2.4 | ||
| Fair | 120 | 6.5 2.2 | ||
| Poor | 28 | 6.2 2.1 | ||
| Education level | 6 grades primary school | 4 | 4.9 1.2 | 0.068 |
| Primary school | 19 | 6.4 2.5 | ||
| Higher than primary school | 6 | 7.6 1.2 | ||
| Practical training | 27 | 6.0 2.2 | ||
| Secondary vocational training | 41 | 6.1 2.5 | ||
| Pre‐university education | 2 | 7.2 4.0 | ||
| University/higher education | 20 | 6.8 2.2 | ||
| Admission type | Emergency | 31 | 6.5 2.6 | 0.015 |
| Elective | 61 | 6.6 2.0 | ||
| Goal of admission achieved | Yes | 33 | 7.6 1.7 | 0.319b |
| Partially | 24 | 6.6 2.1 | ||
| No | 6 | 4.7 2.8 | ||
| Respondent | Patient only | 117 | 6.7 2.2 | 0.063 |
| Patient with help | 59 | 5.9 2.3 | ||
| Other person | 41 | 6.7 2.4 | ||
Mean scores did not differ significantly between departments (geriatrics: 6.8 2.2, n = 88; cardiothoracic surgery and lung diseases: 6.5 2.4, n = 54; internal medicine: 6.3 2.5, n = 30; general surgery: 6.0 2.2, n = 50; P = 0.234).
In addition, mean scores did not differ significantly before (6.5 2.2, n = 53) and after (6.1 2.4, n = 67) implementation of the CWH study (P = 0.320).
DISCUSSION
The CareWell in Hospital patient questionnaire is a brief 8‐item questionnaire to assess the experiences of elderly patients regarding integrated hospital care. It showed good internal consistency and test‐retest reliability, and low responsiveness. Here we discuss some issues related to the preset criteria of the questionnaire.
First, a panel representing the elderly target population was used to develop the questionnaire in order to ensure content validity, which was confirmed by good internal consistency. Yet, with respect to individualized, integrated care for frail elderly patients, we recommend including a question regarding the involvement of informal caregivers during the hospital stay, as they are important partners in healthcare.[10]
Second, the questionnaire was kept short because it should not be a burden and feasible for frail patients to complete. Nonetheless, some of the questions had a high nonresponse rate, and many patients answered I don't know, particularly to the questions 2 and 3. It does not necessarily mean that these questions are poor in quality; it could also indicate that offering individualized care is not yet embedded in the culture of elderly patients and care professionals, such that patients consider such questions to be irrelevant.[11, 12] Nevertheless, we suggest to further explore the feasibility of the questionnaire and potential additional methods for the most frail elderly,[13] who might have been excluded from the CWH study sample at this point (Table 2).
Third, the questionnaire measures experiences rather than satisfaction. Patient‐satisfaction scores are generally tightly correlated with the age, sex, education level, health status, and the person completing the questionnaire.[8] In our study, the correlation did not reach statistical significance. Nevertheless, the achievement of preset goals was correlated significantly with mean CWH scores (Table 4). These findings may indicate that individualized care experiences can indeed be assessed better using this questionnaire. Test‐retest reliability also supports validity, as we expectedand, indeed, sawhigher reliability among the more objective questions (eg, question 8). The most valuing question is question 1, which also had the lowest reliability; the word sufficiently should perhaps be removed in the next version in order to increase its reliability and objectivity.
Finally, scores did not differ between before and after implementation of the CWH program, which suggests either that the questionnaire is unable to detect change or that the program was not sufficiently effective to invoke change yet. The latter option seems plausible, as changes in the provision of individualized care were ongoing. In addition, the items on which favorable differences can be seen for CWH are in fact the items that could be most directly influenced by the CWH interventionists, questions 4, 6, and 7 (see Supporting Information, Appendix C, in the online version of this article). Lastly, we performed an extra analysis concerning the discriminating property of the questionnaire in a subgroup of frail elderly patients; we do see a significant difference in scores between the frail patients in the geriatrics department and the frail patients who received the CWH intervention: 6.8 (n = 88) vs 4.8 (n = 13) for complete data, respectively, P = 0.013; and 6.8 (n = 155) vs 5.7 (n = 37) for incomplete data (2 items missing), P = 0.017 (Mann‐Whitney U test). This may indicate that the questionnaire can measure differences in quality of care for specifically the frail elderly patients between departments. However, these issuesincluding validity and reliability characteristics per specific patient subgroupwarrant further research using a larger sample.
CONCLUSIONS
In conclusion, the CareWell in Hospital patient questionnaire is a feasible and reliable tool for assessing experiences of frail elderly inpatients in the provision of individualized, integrated care. To improve the questionnaire, we recommend to add a question regarding the participation of informal caregivers during the hospital stay, investigate the response rate to questions regarding participation and shared decision‐making, and study responsiveness issues further.
Acknowledgements
The authors thank Gerda van Straaten, Anne Kuijpers, and Thijs Cauven for their support with data collection. We thank all members of the ZOWEL Study Group and the panel representing the elderly target group.
Disclosures: The work was made possible by grant 60‐6190‐098‐272 and grant 60‐61900‐98‐129 of the National Programme for Elderly Care, coordinated and sponsored by ZonMw, The Netherlands, Organization of Health Research and Development. The authors report no conflicts of interest.
- , , . Patient Experience of Health Care Performance. Adelaide, Australia: Primary Health Care Research November 2009. Available at: http://dspace.flinders.edu.au/jspui/bitstream/2328/26594/1/PIR NOV 09 Full.pdf.
- , , , . Hospital Elder Life Program integrated in Dutch hospital care: a pilot study. J Am Geriatr Soc. 2013;61(4):641–642.
- , . Integrated care: meaning, logic, applications, and implications—a discussion paper. Int J Integr Care. 2002;2:e12.
- , , , . CQ‐index Ziekenhuisopname: meetinstrumentontwikkeling. Kwaliteit van de zorg tijdens ziekenhuisopnames vanuit het perspectief van patiënten. De ontwikkeling van het instrument, de psychometrische eigenschappen en het discriminerend vermogen [in Dutch]. Utrecht, The Netherlands: NIVEL (Netherlands Institute for Health Services Research), 2009.
- Centrum Klantervaring Zorg.CQI vragenbank (CQI questionnaire database). Available at: http://nvl002.nivel.nl/CQI. Accessed May–June 2010.
- , , , et al. Quality criteria were proposed for measurement properties of health status questionnaires. J Clin Epidemiol. 2007;60(1):34–42.
- , . Health Measurement Scales: A Practical Guide to Their Development and Use. 4th ed. Oxford, UK: Oxford University Press; 2008:182–183.
- , , , . Assessing patient satisfaction: implications for South Australian public hospitals. Aust Health Rev. 2005;29(4):439–446.
- , , , , . Patient satisfaction revisited: a multilevel approach. Soc Sci Med. 2009;69(1):68–75.
- , , , et al. Relatives' perspective on the quality of geriatric care and rehabilitation—development and testing of a questionnaire. Scand J Caring Sci. 2008;22(4):590–595.
- , , , . Are elderly people with co‐morbidities involved adequately in medical decision making when hospitalised? A cross‐sectional survey. BMC Geriatr. 2011;11:46.
- , , , , . Preferences of acutely ill patients for participation in medical decision‐making. Qual Saf Health Care. 2008;17(2):97–100.
- , . Experience of general hospital care in older patients with cognitive impairment: are we measuring the most vulnerable patients' experience? BMJ Qual Saf. 2013;doi:10.1136/bmjqs‐2013‐001961.
- , . A Manual of Guidelines for Scoring the Cumulative Illness Rating Scale for Geriatrics (CIRS‐G). Pittsburgh, PA: University of Pittsburgh School of Medicine, Department of Geriatric Psychiatry; 1991.
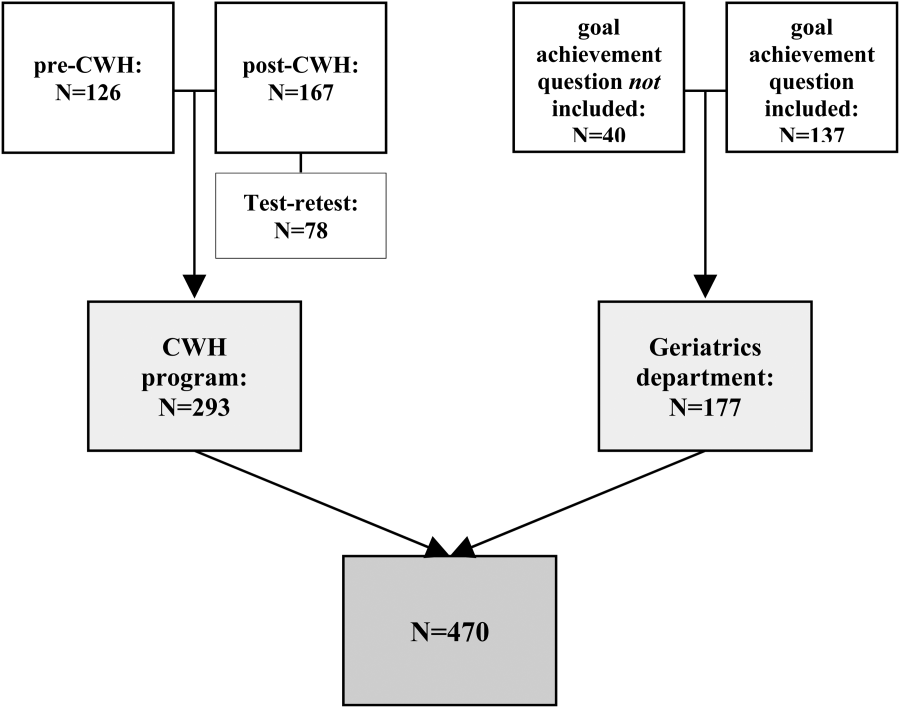
Cooling the resuscitated sudden dead
In the last 30 years, there have been immense advances in the treatment and prevention of sudden cardiac arrest, including beta-blocker therapy and automatic implantable cardiac defibrillators.
In addition, communities have organized emergency medical systems (EMS) designed to provide early cardiac care for the prevention and treatment of cardiac arrest occurring outside the hospital (OHCA). One of the great frustrations of physicians working in the EMS environment is the successful cardiac resuscitation for the patient who is left with severe neurological impairment or brain death. It is clear that resuscitation of the brain is very time dependent. Complete interruption of blood flow to the brain leads to the loss of consciousness within seconds and death of vulnerable neurons in several brain regions occurs within minutes, whereas 20-40 minutes of ischemia is required to kill cardiac myocytes.
To improve survival and prevent the neurological sequelae of OHCA, total body hypothermia is advised based on animal laboratory experiments and a few small clinical studies carried out in a total of 179 OHCA patients (N. Engl. J. Med. 2002;346:557-63 and 549-56).
Both studies show both a neurological and survival benefit – particularly in patients resuscitated from ventricular fibrillation – in comatose patients in whom resuscitation was achieved within 5-10 minutes after witnessed cardiac arrest when cooled to 32-34 degrees Celsius within 60 minutes of collapse. These studies led to the recommendation by the International Liaison Committee on Resuscitation (Circulation 2004;110;3385-97) that cooling to 32-34 degrees Celsius for 12-24 hours should be used in unconscious patients with OHCA with VF and possibly non-VF arrests.
These recommendations were supported by the AHA Guideline Committee (Circulation 2010;122:S768-86) As a result, cooling comatose OHCA patients after resuscitation is widely used in emergency departments in the United States and Europe with the use of a variety of devices and techniques including large volume saline, external cooling devices, intravenous catheter devices, and intranasal devices. When hypothermia was initially recommended, a number of questions were unanswered and remain unanswered despite multiple publications and wide clinical experience in the succeeding 12 years. Some of those questions include the timing, duration, and intensity of cooling, the preferable technique of cooling, and risk and benefits of the different cooling techniques.
In the United States, pressure infusion of 2 liters of ice cold saline is the usual initial method of cooling to 32-34 degrees Celsius followed by 12-36 hours with surface cooling.
Investigators in Seattle randomized OHCA patients prior to hypothermia or standard therapy with both VF and non-VF rhythms before hospitalization to improve the previous reported benefit when initiated in hospital (JAMA 2014;311;45-52).
The initiation of prehospital therapy achieved cooling 1 hour earlier than in previous hospitalization studies. The result in 1,359 OHCAs over a 5-year period raises important questions about the benefit of hypothermia. The researchers failed to find any benefit in regard to neurological outcomes or mortality. In VF OHCA, they observed a survival rate to hospital discharge of 62.7 % (intervention group) and 64.3% (controls). In the patients without VF, those rates were 19.2 and 16.3, respectively.
Neurological outcomes were also similar for patients with VF at 57.5% (intervention group) and 61.9% (controls), respectively. The non-VF rates were 14.4% (intervention) and 13.4 % (controls). Hypothermia was associated with significant adverse events, including pulmonary edema and increased use of diuretics.
These observations are contrary to previous observations and should provide an opportunity to reevaluate hypothermia for OHCA. These patients represent a series of complex metabolic issues that deserve careful research to provide answers to some of the outstanding issues. The recent studies provide an environment of equipoise where we can step back and revaluate this complex procedure in randomized control trials.
Dr. Goldstein, medical editor of Cardiology News, is professor of medicine at Wayne State University and division head emeritus of cardiovascular medicine at Henry Ford Hospital, both in Detroit. He is on data safety monitoring committees for the National Institutes of Health and several pharmaceutical companies.