User login
Predictions for 2014
Are you prepared to manage the infectious disease challenges you’ll be facing in 2014? Here are my Top 5 predictions for what lies ahead in infectious diseases for the next year with pearls to help you in your practice. The first addresses a series of concerns around influenza. Others target diagnoses you might not have encountered or considered in the past. The last will hopefully improve HPV vaccination rates in your practice.
1. Expect an especially busy influenza season and the possibility that you may encounter patients with life-threatening influenza. We’ve already detected influenza in over 1,000 children at my institution, almost all 2009 pandemic H1N1 influenza A viruses, which is consistent with the national data from the Centers for Disease Control and Prevention. We are really just a month into influenza season, and we are seeing a significant number of children admitted to our pediatric intensive care unit with life-threatening disease presentations, and we’ve also seen unusual influenza complications. Talk to your ID colleagues about the potential for intravenous zanamivir in critically ill children who do not respond to oseltamivir. While pulmonary complications of influenza are most common, unusual presentations you may encounter include influenza encephalopathy (altered mental status, seizures, and mutism) and bacterial superinfection (when fever recurs or recrudesces after initial improvement, often 3-5 days into the course, think Staphylococcus aureus or Group A streptococcal disease). The CDC is alerting practitioners to the potential for increased morbidity and mortality in young/middle aged adults so the parents of your patients are at increased risk this year.

• False-negative testing can happen if the sensitivity of the rapid test is low, but a false-negative test can occur if the specimen is collected late in the clinical course. (This is especially true in the adult population in which testing may be negative at just 4-5 days into the course of disease.)
• Recognize that all hospitalized children should be treated with oseltamivir, as well as children who are immunocompromised; have chronic cardiopulmonary conditions, including hemodynamically significant heart disease and asthma; renal disease; metabolic disease, including diabetes; pregnant teens; morbidly obese patients; patients with neuromuscular/neurodevelopmental conditions (especially those with difficulty controlling airway secretions); and children under 2 years of age.
• I predict you may be hearing about oseltamivir shortages, but for now this relates to the sporadic difficulty in finding the oseltamivir suspension, in part, because of the lack of early season availability of this product at retail pharmacies, many of which are just getting in their stock. Prescribe the suspension for children aged younger than 1 year and be explicit about the mL dosage that should be dispensed. For children over 1 year of age, capsules can be opened and placed in pudding for those who cannot swallow capsules. Lexicomp Online offers guidelines for easy use of 30-mg, 45-mg and 75-mg capsules for different weight categories. If the suspension is necessary for an infant and is not available, the drug can be compounded by your pharmacy using capsules. You may find some pharmacies are reluctant to compound, so be prepared to contact your local children’s hospital for help. And keep offering vaccine throughout the season to healthy patients!
2. Most practitioners are aware of the importance of methicillin-resistant S. aureus (MRSA) as a pathogen that causes bacteremia and musculoskeletal and pulmonary disease in otherwise healthy children. I suspect there is less awareness that, in many locales, methicillin-sensitive S. aureus (MSSA) is being seen just as often, if not slightly more often than MRSA, as a bloodstream pathogen. The inclusion of vancomycin (which covers MRSA) with cefepime should be considered for empiric coverage in the otherwise healthy child with suspected sepsis. Cefepime is a fourth-generation cephalosporin with good gram-negative and gram-positive coverage and also has bactericidal activity against MSSA strains. Clindamycin should be considered as an adjunct to vancomycin and cefepime in those with toxin-mediated disease/toxic shock syndrome. Of course, modification of the empiric regimen should follow identification of the specific pathogen and the site(s) of infection.
3. E. coli remains the most common cause of urinary tract infections in children, but infections caused by multiple drug resistant (MDR) Escherichia coli strains are increasingly being seen. Consider infection caused by extended spectrum beta-lactamase–producing organisms in children with underlying renal anomalies, especially if they have been previously exposed to third-generation cephalosporins. Most strains are also resistant to fluoroquinolones, trimethoprim-sulfamethoxazole, and aminoglycosides as well as to non–carbapenem beta-lactams. Speaking of antibiotic resistance, look for many hospital microbiology laboratories to begin using advanced molecular detection methodology to more quickly identify bacterial and fungal isolates; such methods could reduce the time of identification from over 24 hours with conventional techniques to less than one hour. The use of newer systems to identify microbes and confirm susceptibility testing has the potential to transform care and improve outcomes.
4. Consider the diagnosis of human parechovirus (HPeV) infection in young febrile infants with sepsis/meningitis presentation but negative bacterial cultures. Detection of HPeV by polymerase chain reaction testing in serum or cerebrospinal fluid is diagnostic. Exclusion of herpes simplex virus and enterovirus disease is key, as similar clinical presentations may be seen. HPeV infections are more commonly noted in late spring and early summer in contrast to enteroviral infections, which tend to occur from July to September.
5. The strength of your vaccine recommendation continues to be the most important factor affecting the parental decision to vaccinate a child. Nowhere is this more obvious than with human papillomavirus vaccine (HPV), where practitioners often simply offer the vaccine rather than recommend it. In terms of teenage vaccines, when practitioners recommend Tdap (tetanus, diphtheria, and pertussis vaccine) and meningococcal conjugate vaccine as standard for their patients ("Today your child will receive whooping cough vaccine and the meningitis vaccine."), vaccine uptake is very high. But when it comes to the HPV vaccine, some practitioners feel they first must establish whether the parents are aware of HPV vaccine; then discuss their questions regarding the safety of the vaccine; and finally, explain that the vaccine prevents cancer. Some practitioners offer the option of "thinking about" the vaccine for the next visit, but in such cases, the patient generally leaves without receiving the vaccine. Add HPV vaccine into your standard teen vaccine recommendation and make it a goal to get the first vaccine initiated in all eligible patients. The three-dose HPV vaccine schedule is still recommended, but I predict that simplification of the schedule may occur as early as 2014 in the United States. We’ll keep you posted.
Dr. Jackson is director of the division of infectious disease and associate director of the infectious disease fellowship program at the University of Missouri, Kansas City.
Are you prepared to manage the infectious disease challenges you’ll be facing in 2014? Here are my Top 5 predictions for what lies ahead in infectious diseases for the next year with pearls to help you in your practice. The first addresses a series of concerns around influenza. Others target diagnoses you might not have encountered or considered in the past. The last will hopefully improve HPV vaccination rates in your practice.
1. Expect an especially busy influenza season and the possibility that you may encounter patients with life-threatening influenza. We’ve already detected influenza in over 1,000 children at my institution, almost all 2009 pandemic H1N1 influenza A viruses, which is consistent with the national data from the Centers for Disease Control and Prevention. We are really just a month into influenza season, and we are seeing a significant number of children admitted to our pediatric intensive care unit with life-threatening disease presentations, and we’ve also seen unusual influenza complications. Talk to your ID colleagues about the potential for intravenous zanamivir in critically ill children who do not respond to oseltamivir. While pulmonary complications of influenza are most common, unusual presentations you may encounter include influenza encephalopathy (altered mental status, seizures, and mutism) and bacterial superinfection (when fever recurs or recrudesces after initial improvement, often 3-5 days into the course, think Staphylococcus aureus or Group A streptococcal disease). The CDC is alerting practitioners to the potential for increased morbidity and mortality in young/middle aged adults so the parents of your patients are at increased risk this year.
• False-negative testing can happen if the sensitivity of the rapid test is low, but a false-negative test can occur if the specimen is collected late in the clinical course. (This is especially true in the adult population in which testing may be negative at just 4-5 days into the course of disease.)
• Recognize that all hospitalized children should be treated with oseltamivir, as well as children who are immunocompromised; have chronic cardiopulmonary conditions, including hemodynamically significant heart disease and asthma; renal disease; metabolic disease, including diabetes; pregnant teens; morbidly obese patients; patients with neuromuscular/neurodevelopmental conditions (especially those with difficulty controlling airway secretions); and children under 2 years of age.
• I predict you may be hearing about oseltamivir shortages, but for now this relates to the sporadic difficulty in finding the oseltamivir suspension, in part, because of the lack of early season availability of this product at retail pharmacies, many of which are just getting in their stock. Prescribe the suspension for children aged younger than 1 year and be explicit about the mL dosage that should be dispensed. For children over 1 year of age, capsules can be opened and placed in pudding for those who cannot swallow capsules. Lexicomp Online offers guidelines for easy use of 30-mg, 45-mg and 75-mg capsules for different weight categories. If the suspension is necessary for an infant and is not available, the drug can be compounded by your pharmacy using capsules. You may find some pharmacies are reluctant to compound, so be prepared to contact your local children’s hospital for help. And keep offering vaccine throughout the season to healthy patients!
2. Most practitioners are aware of the importance of methicillin-resistant S. aureus (MRSA) as a pathogen that causes bacteremia and musculoskeletal and pulmonary disease in otherwise healthy children. I suspect there is less awareness that, in many locales, methicillin-sensitive S. aureus (MSSA) is being seen just as often, if not slightly more often than MRSA, as a bloodstream pathogen. The inclusion of vancomycin (which covers MRSA) with cefepime should be considered for empiric coverage in the otherwise healthy child with suspected sepsis. Cefepime is a fourth-generation cephalosporin with good gram-negative and gram-positive coverage and also has bactericidal activity against MSSA strains. Clindamycin should be considered as an adjunct to vancomycin and cefepime in those with toxin-mediated disease/toxic shock syndrome. Of course, modification of the empiric regimen should follow identification of the specific pathogen and the site(s) of infection.
3. E. coli remains the most common cause of urinary tract infections in children, but infections caused by multiple drug resistant (MDR) Escherichia coli strains are increasingly being seen. Consider infection caused by extended spectrum beta-lactamase–producing organisms in children with underlying renal anomalies, especially if they have been previously exposed to third-generation cephalosporins. Most strains are also resistant to fluoroquinolones, trimethoprim-sulfamethoxazole, and aminoglycosides as well as to non–carbapenem beta-lactams. Speaking of antibiotic resistance, look for many hospital microbiology laboratories to begin using advanced molecular detection methodology to more quickly identify bacterial and fungal isolates; such methods could reduce the time of identification from over 24 hours with conventional techniques to less than one hour. The use of newer systems to identify microbes and confirm susceptibility testing has the potential to transform care and improve outcomes.
4. Consider the diagnosis of human parechovirus (HPeV) infection in young febrile infants with sepsis/meningitis presentation but negative bacterial cultures. Detection of HPeV by polymerase chain reaction testing in serum or cerebrospinal fluid is diagnostic. Exclusion of herpes simplex virus and enterovirus disease is key, as similar clinical presentations may be seen. HPeV infections are more commonly noted in late spring and early summer in contrast to enteroviral infections, which tend to occur from July to September.
5. The strength of your vaccine recommendation continues to be the most important factor affecting the parental decision to vaccinate a child. Nowhere is this more obvious than with human papillomavirus vaccine (HPV), where practitioners often simply offer the vaccine rather than recommend it. In terms of teenage vaccines, when practitioners recommend Tdap (tetanus, diphtheria, and pertussis vaccine) and meningococcal conjugate vaccine as standard for their patients ("Today your child will receive whooping cough vaccine and the meningitis vaccine."), vaccine uptake is very high. But when it comes to the HPV vaccine, some practitioners feel they first must establish whether the parents are aware of HPV vaccine; then discuss their questions regarding the safety of the vaccine; and finally, explain that the vaccine prevents cancer. Some practitioners offer the option of "thinking about" the vaccine for the next visit, but in such cases, the patient generally leaves without receiving the vaccine. Add HPV vaccine into your standard teen vaccine recommendation and make it a goal to get the first vaccine initiated in all eligible patients. The three-dose HPV vaccine schedule is still recommended, but I predict that simplification of the schedule may occur as early as 2014 in the United States. We’ll keep you posted.
Dr. Jackson is director of the division of infectious disease and associate director of the infectious disease fellowship program at the University of Missouri, Kansas City.
Random acts of readiness in unpredictable times
My little girl had outgrown most of her Sunday dresses, so I recently took her to the mall down the street in my quiet, award-winning family-friendly city, just miles outside of Baltimore. She stocked up on a few frilly dresses, then played for a while at the indoor playground. On our way out, we stopped and bought frozen yogurt and greeted friends we knew as they walked by – a typical, uneventful day in Columbia, Md.
Just a few days later, a seemingly ordinary young man entered the mall through the same door I had used, and strolled around unnoticed, lost in a sea of eager shoppers. The rest is history. He entered a store, rifle in hand, and shot and killed two young employees, viciously robbing them, and their loved ones of decades of precious hopes, dreams, and memories. This nightmare occurred right around the time my granddaughter arrived at the Columbia Mall to begin her shift at a children’s clothing store. Fortunately, she was not injured, at least not physically.
The week before, I was saddened to learn that a teaching assistant at my alma mater, Purdue University, ruthlessly slaughtered a fellow student.
Then, I learned that a college student a couple of hours away in Pennsylvania was arrested for possession of weapons of mass destruction.
When will the madness end? It won’t. People seem to be getting more cruel and violent with each passing day.
Whether a mall in the suburbs, a marathon, a movie theater, or a university campus, the number of senseless acts of violence are skyrocketing and, one day, some of us may be called upon to provide emergency care, when we least expect it. Sure, we function well in a hospital environment when the code team, anesthesiologist, and surgeon can be summoned in a matter of seconds, but how many of us are prepared to meet the challenges of a catastrophe in our communities, in our schools, and in our social settings?
If faced with a catastrophic situation, our medical instincts would likely kick in, and we would do whatever is needed to help those in need – stabilize the spine or control the bleeding in trauma victims – but what if we are not sure what to do? What if the 911 operators are overwhelmed by terrified callers fearing for their lives?
The Centers for Disease Control maintains an Emergency Operations Center that can assist health care providers with emergency patient care: 770-488-7100. The CDC’s Clinician Outreach Communication Activity (COCA) works to ensure that clinicians have the up-to-date information they need about emerging health threats. It has posted "Emergency Preparedness: Understanding Physicians’ Concerns and Readiness to Respond," a very informative page full of resources to learn about a variety of scenarios and what we can do. (Some COCA information sessions qualify for continuing education credits.)
Local poison control centers may be of benefit in certain emergency situations as well. The National Capital Poison Center help line – 800-222-1222 – is the telephone number for every poison center in the United States.
This time, the chaos was in my backyard. Next month, God forbid, it may be in yours. No one expects unforeseen emergencies to happen, but knowing where to turn may just make a seemingly impossible situation a little more doable.
Dr. Hester is a hospitalist with Baltimore-Washington Medical Center who has a passion for empowering patients to partner in their health care. She is the creator of the Patient Whiz, a patient-engagement app for iOS.
Yes, give more patients statins
The question of whether or not to give more healthy patients statin drugs is one of considerable interest to the public and much debate in both the medical community and the lay press.
In Nov. 12, 2013, the American College of Cardiology and the American Heart Association (ACC/AHA) released their long-awaited new guideline on the treatment of blood cholesterol to reduce the risk of adult atherosclerosis.
This guideline, among other recommendations, guided physicians to expand the number of patients being treated with statin drugs. This ACC/AHA guideline was greeted with many objections in both the medical community and the lay press. Most notable was a Nov. 14 New York Times Op Ed by two respected experts, Dr. John Abramson and Dr. Rita Redberg, entitled "Don’t Give More Patients Statins."

Other New York Times articles by Gina Kolata on Nov. 18 and 26 (citing Dr. Paul Ridker, Dr. Nancy Cook, and others) expressed similar reservations about the ACC/AHA guideline recommendation to broaden statin administration. Thus, this guideline and its recommendations are controversial and of great interest and importance to physicians and the public.
The Op Ed by Dr. Abramson and Dr. Redberg makes the case that the recent ACC/AHA cholesterol guideline is incorrect to advocate expansion of statin usage to more patients because such expansion "will benefit the pharmaceutical industry more than anyone else." They state that the guideline’s authors were not "free of conflicts of interest." In addition, they claim that "18% or more" of statin recipients "experience side effects" and that the increase in statin administration will largely be in "healthy people" who do not benefit and who would be better served by an improved diet and lifestyle.
While the latter is true for everyone, Dr. Abramson and Dr. Redberg convey the wrong message. Statins are the miracle drug of our era. They have proven repeatedly and dramatically to lower the disabling and common consequences of arteriosclerosis – most prominently heart attacks, strokes, and deaths in patients at risk. Statins avoid these vascular catastrophes not only by lowering bad blood lipids but also by a number of other beneficial effects that stabilize arterial plaques.
They have minimal side effects, most of which are benign. In several controlled studies, the patients who did not receive statins had an incidence of "side effects" equal to those who received them. Serious side effects are rare and manageable. Moreover, healthy patients are healthy only until they get sick. Many individuals over 40 take a daily aspirin. Statins are far more effective than aspirin in preventing heart attacks and strokes which often occur unexpectedly in previously "healthy people."
Clearly it would be worthwhile for such healthy people to take a daily statin pill with few side effects if it would lower their risk of such vascular catastrophes and premature death. In contrast to what is implied in the Abramson–Redberg Op Ed, these drugs are an easy way for people to live longer and live better, and statins cannot be replaced with a healthy life style and diet – although combining the latter with statins is a good thing.
Lastly, regarding the comments about the pharmaceutical industry benefitting and guideline authors’ conflicts of interest, both are less important than patient benefit, which has been demonstrated dramatically and consistently in many controlled statin trials. Moreover, most statins are now generic so the cost for obtaining these miraculous drugs need not be prohibitive, and the guideline’s authors are experts who are eminently qualified to write them.
More patients should be on statin medication.
Dr. Veith is professor of vascular surgery, Langone New York University Medical Center and The Cleveland Clinic. He is an associate medical editor for VASCULAR SPECIALIST. He has no financial conflicts of interest.
The ideas and opinions expressed in VASCULAR SPECIALIST do not necessarily reflect those of the Society or Publisher.
The question of whether or not to give more healthy patients statin drugs is one of considerable interest to the public and much debate in both the medical community and the lay press.
In Nov. 12, 2013, the American College of Cardiology and the American Heart Association (ACC/AHA) released their long-awaited new guideline on the treatment of blood cholesterol to reduce the risk of adult atherosclerosis.
This guideline, among other recommendations, guided physicians to expand the number of patients being treated with statin drugs. This ACC/AHA guideline was greeted with many objections in both the medical community and the lay press. Most notable was a Nov. 14 New York Times Op Ed by two respected experts, Dr. John Abramson and Dr. Rita Redberg, entitled "Don’t Give More Patients Statins."
Other New York Times articles by Gina Kolata on Nov. 18 and 26 (citing Dr. Paul Ridker, Dr. Nancy Cook, and others) expressed similar reservations about the ACC/AHA guideline recommendation to broaden statin administration. Thus, this guideline and its recommendations are controversial and of great interest and importance to physicians and the public.
The Op Ed by Dr. Abramson and Dr. Redberg makes the case that the recent ACC/AHA cholesterol guideline is incorrect to advocate expansion of statin usage to more patients because such expansion "will benefit the pharmaceutical industry more than anyone else." They state that the guideline’s authors were not "free of conflicts of interest." In addition, they claim that "18% or more" of statin recipients "experience side effects" and that the increase in statin administration will largely be in "healthy people" who do not benefit and who would be better served by an improved diet and lifestyle.
While the latter is true for everyone, Dr. Abramson and Dr. Redberg convey the wrong message. Statins are the miracle drug of our era. They have proven repeatedly and dramatically to lower the disabling and common consequences of arteriosclerosis – most prominently heart attacks, strokes, and deaths in patients at risk. Statins avoid these vascular catastrophes not only by lowering bad blood lipids but also by a number of other beneficial effects that stabilize arterial plaques.
They have minimal side effects, most of which are benign. In several controlled studies, the patients who did not receive statins had an incidence of "side effects" equal to those who received them. Serious side effects are rare and manageable. Moreover, healthy patients are healthy only until they get sick. Many individuals over 40 take a daily aspirin. Statins are far more effective than aspirin in preventing heart attacks and strokes which often occur unexpectedly in previously "healthy people."
Clearly it would be worthwhile for such healthy people to take a daily statin pill with few side effects if it would lower their risk of such vascular catastrophes and premature death. In contrast to what is implied in the Abramson–Redberg Op Ed, these drugs are an easy way for people to live longer and live better, and statins cannot be replaced with a healthy life style and diet – although combining the latter with statins is a good thing.
Lastly, regarding the comments about the pharmaceutical industry benefitting and guideline authors’ conflicts of interest, both are less important than patient benefit, which has been demonstrated dramatically and consistently in many controlled statin trials. Moreover, most statins are now generic so the cost for obtaining these miraculous drugs need not be prohibitive, and the guideline’s authors are experts who are eminently qualified to write them.
More patients should be on statin medication.
Dr. Veith is professor of vascular surgery, Langone New York University Medical Center and The Cleveland Clinic. He is an associate medical editor for VASCULAR SPECIALIST. He has no financial conflicts of interest.
The ideas and opinions expressed in VASCULAR SPECIALIST do not necessarily reflect those of the Society or Publisher.
Hyperprolactinemia: Causes and Treatments
A 31-year-old woman is referred by her Ob-Gyn for elevated prolactin. She initially presented with a three-month history of amenorrhea, a negative home pregnancy test, and 100% compliance with condom use. She denies hirsutism and acne but admits to thin milky nipple discharge upon squeezing (but not spontaneous).
Two weeks ago, her Ob-Gyn ordered labs; results were negative for serum beta human chorionic gonadotropin and within normal ranges for thyroid-stimulating hormone (TSH), luteinizing hormone, follicle-stimulating hormone, estradiol, free and total testosterone, dehydroepiandrosterone sulfate (DHEAs), complete chemistry panel, and complete blood count. Her serum prolactin level was 110 ng/mL (normal, 3 to 27 ng/mL).
Q: How is prolactin physiologically regulated?
The primary role of prolactin, which is produced by lactotroph cells in the anterior pituitary gland, is to stimulate lactation and breast development. Prolactin is regulated by dopamine (also known as prolactin inhibitory hormone), which is secreted from the hypothalamus via an inhibitory pathway unique to the hypothalamus-pituitary hormone system. Dopamine essentially suppresses prolactin.
Other hormones can have a stimulatory effect on the anterior pituitary gland and thus increase prolactin levels. Estrogen can induce lactotroph hyperplasia and elevated prolactin; however, this is only clinically relevant in the context of estrogen surge during pregnancy. (Estrogen therapy, such as oral contraception or hormone replacement therapy, on the other hand, is targeted to “normal” estrogen levels.) Thyrotropin-releasing hormone (TRH) from the hypothalamus also stimulates the anterior pituitary gland, so patients with inadequately treated or untreated primary hypothyroidism will have mildly elevated prolactin.
Neurogenic stimuli of the chest wall, through nipple suckling or varicella zoster infection (shingles), can also increase prolactin secretion. And since prolactin is eliminated by the liver (75%) and the kidney (25%), significant liver disease and/or renal insufficiency can raise prolactin levels, due to decreased clearance.
What are the possible etiologies for elevated prolactin? See answer on the next page...
Q: What are the possible etiologies for elevated prolactin?
The causes of hyperprolactinemia fall into three categories: physiologic, pharmacologic, and pathologic.2 The table provides examples from each category.
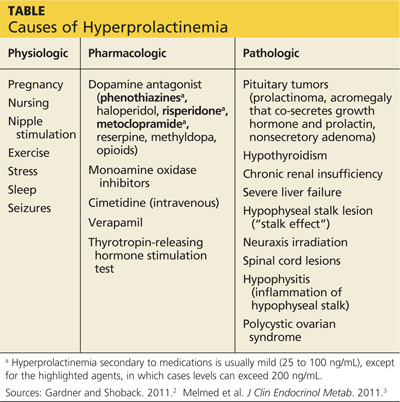
A nonsecretory pituitary adenoma or any lesion in the brain that would disrupt the hypophyseal stalk may interfere with dopamine’s inhibitory control and thereby increase prolactin. This is called the stalk effect. It is important to note that not all MRI-proven pituitary adenomas are prolactin secreting, even in the presence of hyperprolactinemia. According to an autopsy series, about 12% of the general population had pituitary microadenoma.3
There is rough correlation between prolactinoma size and level of prolactin. Large nonsecretory pituitary adenomas have prolactin levels less than 150 ng/mL. Microprolactinomas (< 1 cm) are usually in the range of 100 to 250 ng/mL, while macroprolactinomas (> 1 cm) are generally
≥ 250 ng/mL. If the tumor is very large and invades the cavernous sinus, prolactin can measure in the 1,000s.3
Polycystic ovarian syndrome (PCOS) is a common disorder affecting women of reproductive age and the most common cause of underlying ovulatory problems. Patients with PCOS can have mildly elevated prolactin; the exact mechanism of hyperprolactinemia in PCOS is unknown. One theory is that constant high levels of estrogen experienced in PCOS would stimulate prolactin production. It is important to rule out other causes of hyperprolactinemia before making the diagnosis of PCOS.
What is the clinical significance of elevated prolactin? Why do we have to work up and treat it? See answer on the next page...
Q: What is the clinical significance of elevated prolactin? Why do we have to work up and treat it?
By physiologic mechanisms not completely understood, hyperprolactinemia can interrupt the gonadal axis, leading to hypogonadism. In women, it can cause irregular menstrual cycles, oligomenorrhea, amenorrhea, and infertility. In men, it can lower testosterone levels. Long-term effects include declining bone mineral density due to insufficient estrogen in women or testosterone in men.
With macroadenoma, the size of the tumor can have a mass effect such as headache and visual defect by compressing the optic chiasm (bitemporal hemianopsia), which may lead to permanent vision loss if left untreated. Referral to an ophthalmologist may be necessary for formal visual field examination.
How is hyperprolactinemia treated? See answer on the next page...
Q: How is hyperprolactinemia treated?
There are three options for treatment: medication, surgery, and radiation.
Dopamine agonists (bromocriptine, cabergoline) are effective in normalizing prolactin and reducing the size of the tumor in the majority of cases. However, some patients may require long-term treatment. Bromocriptine has been used since the late 1970s, but, due to better tolerance and less frequent dosing, cabergoline is the preferred agent.3
Transsphenoidal surgery is indicated for patients who are intolerant to medication, who have a medication-resistant tumor or significant mass effect, or who prefer definitive treatment. Women of childbearing age with a macroadenoma might consider surgery due to the risk for tumor expansion during pregnancy (estrogen effect) and risk for pituitary apoplexy (hemorrhage or infarct of the pituitary gland). Surgical risk is usually low with a neurosurgeon who has extensive experience.
Radiation can be considered for large tumors that are resistant to medication. It can be used as adjunctive therapy to surgery, since reducing the size of the tumor can make the surgical field smaller. In some medication-resistant tumors, radiation can raise sensitivity to medication.
What does follow-up entail? See next page for answer...
Q: What does follow-up entail?
Once medication is initiated or dosage is adjusted, have the patient follow up in one month and recheck the prolactin level to assess responsiveness to medication (as well as medication adherence). When a therapeutic prolactin level is achieved, recheck the prolactin and have the patient follow up at three and six months and then every six months thereafter.3
MRI of the pituitary gland should be performed at baseline, then in six months to assess tumor response to medication, and then at 12 and 24 months.3 If tumor regression has stabilized or if the tumor has shrunk to a nondetectable size, consider discontinuing the dopamine agonist. If medication is discontinued, recheck prolactin every three months for the first year; if it remains in normal reference range, simply check serum prolactin annually.3
See next page for summary.
See next page for references.
REFERENCES
1. Jameson JL. Harrison’s Endocrinology. 18th ed. China: McGraw-Hill; 2010.
2. Gardner D, Shoback D. Greenspan’s Basic & Clinical Endocrinology. 9th ed. China: McGraw-Hill; 2011.
3. Melmed S, Casanueva FF, Hoffman AR, et al. Diagnosis and treatment of hyperprolactinemia: an Endocrine Society Clinical Practice Guideline. J Clin Endocrinol Metab. 2011;96(2):273-288.
A 31-year-old woman is referred by her Ob-Gyn for elevated prolactin. She initially presented with a three-month history of amenorrhea, a negative home pregnancy test, and 100% compliance with condom use. She denies hirsutism and acne but admits to thin milky nipple discharge upon squeezing (but not spontaneous).
Two weeks ago, her Ob-Gyn ordered labs; results were negative for serum beta human chorionic gonadotropin and within normal ranges for thyroid-stimulating hormone (TSH), luteinizing hormone, follicle-stimulating hormone, estradiol, free and total testosterone, dehydroepiandrosterone sulfate (DHEAs), complete chemistry panel, and complete blood count. Her serum prolactin level was 110 ng/mL (normal, 3 to 27 ng/mL).
Q: How is prolactin physiologically regulated?
The primary role of prolactin, which is produced by lactotroph cells in the anterior pituitary gland, is to stimulate lactation and breast development. Prolactin is regulated by dopamine (also known as prolactin inhibitory hormone), which is secreted from the hypothalamus via an inhibitory pathway unique to the hypothalamus-pituitary hormone system. Dopamine essentially suppresses prolactin.
Other hormones can have a stimulatory effect on the anterior pituitary gland and thus increase prolactin levels. Estrogen can induce lactotroph hyperplasia and elevated prolactin; however, this is only clinically relevant in the context of estrogen surge during pregnancy. (Estrogen therapy, such as oral contraception or hormone replacement therapy, on the other hand, is targeted to “normal” estrogen levels.) Thyrotropin-releasing hormone (TRH) from the hypothalamus also stimulates the anterior pituitary gland, so patients with inadequately treated or untreated primary hypothyroidism will have mildly elevated prolactin.
Neurogenic stimuli of the chest wall, through nipple suckling or varicella zoster infection (shingles), can also increase prolactin secretion. And since prolactin is eliminated by the liver (75%) and the kidney (25%), significant liver disease and/or renal insufficiency can raise prolactin levels, due to decreased clearance.
What are the possible etiologies for elevated prolactin? See answer on the next page...
Q: What are the possible etiologies for elevated prolactin?
The causes of hyperprolactinemia fall into three categories: physiologic, pharmacologic, and pathologic.2 The table provides examples from each category.
A nonsecretory pituitary adenoma or any lesion in the brain that would disrupt the hypophyseal stalk may interfere with dopamine’s inhibitory control and thereby increase prolactin. This is called the stalk effect. It is important to note that not all MRI-proven pituitary adenomas are prolactin secreting, even in the presence of hyperprolactinemia. According to an autopsy series, about 12% of the general population had pituitary microadenoma.3
There is rough correlation between prolactinoma size and level of prolactin. Large nonsecretory pituitary adenomas have prolactin levels less than 150 ng/mL. Microprolactinomas (< 1 cm) are usually in the range of 100 to 250 ng/mL, while macroprolactinomas (> 1 cm) are generally
≥ 250 ng/mL. If the tumor is very large and invades the cavernous sinus, prolactin can measure in the 1,000s.3
Polycystic ovarian syndrome (PCOS) is a common disorder affecting women of reproductive age and the most common cause of underlying ovulatory problems. Patients with PCOS can have mildly elevated prolactin; the exact mechanism of hyperprolactinemia in PCOS is unknown. One theory is that constant high levels of estrogen experienced in PCOS would stimulate prolactin production. It is important to rule out other causes of hyperprolactinemia before making the diagnosis of PCOS.
What is the clinical significance of elevated prolactin? Why do we have to work up and treat it? See answer on the next page...
Q: What is the clinical significance of elevated prolactin? Why do we have to work up and treat it?
By physiologic mechanisms not completely understood, hyperprolactinemia can interrupt the gonadal axis, leading to hypogonadism. In women, it can cause irregular menstrual cycles, oligomenorrhea, amenorrhea, and infertility. In men, it can lower testosterone levels. Long-term effects include declining bone mineral density due to insufficient estrogen in women or testosterone in men.
With macroadenoma, the size of the tumor can have a mass effect such as headache and visual defect by compressing the optic chiasm (bitemporal hemianopsia), which may lead to permanent vision loss if left untreated. Referral to an ophthalmologist may be necessary for formal visual field examination.
How is hyperprolactinemia treated? See answer on the next page...
Q: How is hyperprolactinemia treated?
There are three options for treatment: medication, surgery, and radiation.
Dopamine agonists (bromocriptine, cabergoline) are effective in normalizing prolactin and reducing the size of the tumor in the majority of cases. However, some patients may require long-term treatment. Bromocriptine has been used since the late 1970s, but, due to better tolerance and less frequent dosing, cabergoline is the preferred agent.3
Transsphenoidal surgery is indicated for patients who are intolerant to medication, who have a medication-resistant tumor or significant mass effect, or who prefer definitive treatment. Women of childbearing age with a macroadenoma might consider surgery due to the risk for tumor expansion during pregnancy (estrogen effect) and risk for pituitary apoplexy (hemorrhage or infarct of the pituitary gland). Surgical risk is usually low with a neurosurgeon who has extensive experience.
Radiation can be considered for large tumors that are resistant to medication. It can be used as adjunctive therapy to surgery, since reducing the size of the tumor can make the surgical field smaller. In some medication-resistant tumors, radiation can raise sensitivity to medication.
What does follow-up entail? See next page for answer...
Q: What does follow-up entail?
Once medication is initiated or dosage is adjusted, have the patient follow up in one month and recheck the prolactin level to assess responsiveness to medication (as well as medication adherence). When a therapeutic prolactin level is achieved, recheck the prolactin and have the patient follow up at three and six months and then every six months thereafter.3
MRI of the pituitary gland should be performed at baseline, then in six months to assess tumor response to medication, and then at 12 and 24 months.3 If tumor regression has stabilized or if the tumor has shrunk to a nondetectable size, consider discontinuing the dopamine agonist. If medication is discontinued, recheck prolactin every three months for the first year; if it remains in normal reference range, simply check serum prolactin annually.3
See next page for summary.
See next page for references.
REFERENCES
1. Jameson JL. Harrison’s Endocrinology. 18th ed. China: McGraw-Hill; 2010.
2. Gardner D, Shoback D. Greenspan’s Basic & Clinical Endocrinology. 9th ed. China: McGraw-Hill; 2011.
3. Melmed S, Casanueva FF, Hoffman AR, et al. Diagnosis and treatment of hyperprolactinemia: an Endocrine Society Clinical Practice Guideline. J Clin Endocrinol Metab. 2011;96(2):273-288.
What Caused Patient’s Palpitations?
ANSWER
This ECG shows atrial flutter with 2:1 atrioventricular conduction. Additionally, ST depressions are seen in the anterior leads.
Typical sinus node P waves are absent, and atrial conduction at a rate of 310 beats/min is indicated by the sawtooth pattern in leads II and aVF. The ventricular rate is half that of the atrial rate (hence the 2:1 ratio). The ST depressions seen in the anterior leads, thought to be rate related, resolved upon cardioversion to terminate the atrial flutter.
Atrial flutter is uncommon in patients with structurally normal hearts and occurs far less frequently than atrial fibrillation. The etiology of this man’s arrhythmia may be due to pericarditis, based on his history and physical examination.
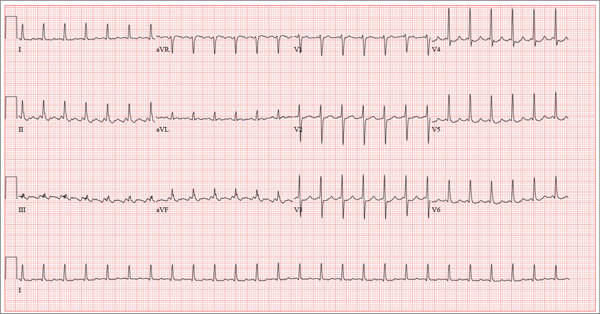
A 52-year-old man developed acute-onset palpitations, shortness of breath, and lightheadedness while sitting at his desk at work. He noticed his heart rate was rapid and asked a coworker to take his pulse for confirmation. He did not experience chest pain, syncope, or near syncope, but if he stood up and tried to walk, he very quickly became fatigued. His coworker tried to call 911; however, the patient asked to be driven to the urgent care center six blocks from their office instead. The patient’s heart rate and symptoms did not change en route. There is no previous history of heart disease. Although the patient works in an office, he is very active. He played hockey in high school and college and continues to play in an amateur league as well as coaching a youth group at the local ice rink. He is also an active member of a local bicycling club and recently completed a 150-mile recreational ride. He has no history of hypertension, diabetes, or pulmonary disease. Surgical history is remarkable for a medial meniscus repair of his right knee and a laparoscopic cholecystectomy, both performed more than 10 years ago. He works as a certified public accountant, does not smoke, and drinks one or two glasses of wine in the evening with meals. He is married and has two adult children. He denies using recreational drugs or herbal medicines. The only medication he uses is ibuprofen as needed for musculoskeletal aches and pains associated with his active lifestyle. He has no known drug allergies, and his immunizations are current. The review of systems is positive for a recent viral upper respiratory illness. He reports having vague, nonspecific substernal chest discomfort, but no pain, at the time of his illness. Symptoms have resolved. There are no other complaints. On arrival, the patient appears anxious and in mild distress, but without pain. Vital signs include a heart rate of 160 beats/min; blood pressure, 100/64 mm Hg; respiratory rate, 18 breaths/min-1; and temperature, 98.4°F. The HEENT exam is unremarkable except for corrective lenses. The chest is clear in all lung fields. There is no jugular venous distention, and carotid upstrokes are brisk. The cardiac exam reveals a regular rhythm at a rate of 150 beats/min with no murmurs or gallops; however, a rub is noted. The abdomen is soft and nontender with no organomegaly. Well-healed scars from his laparoscopic ports are present. The lower extremities show no evidence of edema. Peripheral pulses are strong and equal in both upper and lower extremities, and the neurologic exam is normal. Laboratory studies including a metabolic panel, complete blood count, and cardiac enzymes all yield normal results. An ECG reveals the following: a ventricular rate of 155 beats/min; PR interval, not measured; QRS duration, 78 ms; QT/QTc interval, 272/437 ms; P axis, unmeasurable; R axis, 34°; and T axis, –50°. What is your interpretation of this ECG?

Man Seeks Treatment for Periodic “Eruptions”
The correct answer is benign familial pemphigus (choice “b”). Also known as Hailey-Hailey disease, this is an unusual autosomally inherited blistering disease.
Benign familial pemphigus (BFP) is often mistaken for bacterial infection, such as pyoderma (choice “a”) or impetigo (choice “c”). Although it can become secondarily infected, its origins are entirely different.
Contact dermatitis (choice “d”) in its more severe forms can present in a similar manner. However, it would have shown entirely different changes (acute inflammation and spongiosis) on biopsy.
See next page for the discussion...
DISCUSSION
In 1939, two dermatologist-brothers in Georgia saw a patient with this previously unreported condition. They uncovered the family history and worked out the histologic basis, which they then described in the literature. They named the condition benign familial pemphigus, but it is now more commonly known as Hailey-Hailey disease in their honor.
Pemphigus vulgaris (PV), a serious blistering disease, was more common and far more feared at the time of the Hailey brothers’ discovery. Nearly 100% of PV patients died from the condition in that pre-steroid, pre-antibiotic era (most from secondary bacterial infection).
Fortunately, BFP is more benign, though it shares some features with PV. Both are said to be Nikolsky-positive, meaning the initial blisters can be extended with digital pressure. But BFP, unlike PV, does not involve deposition of immunoglobulins (IgA in the case of PV), nor is it accompanied by circulating auto-antibodies. BFP patients typically have no systemic symptoms, whereas in those with PV, the oral mucosae are often affected.
Herpes simplex virus, which was the primary care provider’s initial suspected diagnosis, can cause somewhat similar outbreaks, even in this area. However, it was effectively ruled out by the lack of response to treatment and by the biopsy results.
Although BFP is an inherited condition, it demonstrates variable penetrance, as in our case. It is rare enough that diagnosis is almost invariably delayed while other diagnoses are considered and treated. The actual “lesion” of BFP is still debated, but appears to involve the quality and quantity of desmosomes (microscopic structures that act as connecting fibers between layers of tissue) breaking down, often because of heat and friction, eventuating in blistering. This theory is bolstered by considerable research and by the fact that most cases present in intertriginous areas, such as the neck, axillae, and groin. Appearing episodically, it typically begins in the third to fourth decade of life, tending to diminish with age.
Biopsy is often necessary to confirm the diagnosis of BFP, with the sample best taken from perilesional skin to avoid separation of friable sample fragments. Additional specimens can be taken for special handling (Michel’s media) to detect immunoglobulins that might be seen in other blistering diseases.
See next page for treatment...
TREATMENT
BFP can be treated empirically with application of a soothing solution of aluminum acetate, or more specifically with topical corticosteroids (class III to IV) and topical antibiotics (eg, clindamycin 2% solution), plus/minus oral minocycline, which has potent anti-inflammatory as well as antimicrobial effects.
Difficult cases should be referred to dermatology, which has a number of treatments at its disposal. This includes diaminodiphenyl sulfone (dapsone), systemic glucocorticoids, methotrexate, systemic retinoids, and even local injection of botulinum toxin to decrease local hidrosis.
This patient is responding well to a regimen of oral minocycline 100 mg bid, topical clindamycin 2% bid application, and topical tacrolimus.

For three months, a 38-year-old man has been trying to resolve an “eruption” on his neck. The rash burns and itches, though only mildly, and produces clear fluid. His primary care provider initially prescribed acyclovir, then valacyclovir; neither helped. Subsequent courses of oral antibiotics (cephalexin 500 mg qid for three weeks, then ciprofloxacin 500 mg bid for two weeks) also had no beneficial effect. There is no family history of similar outbreaks. The patient, however, has had several of these eruptions—on the face as well as the neck—since his 20s. They typically last two to four weeks, then disappear completely for months or years. The eruptions tend to occur in the summer. He denies any history of cold sores and does not recall any premonitory symptoms prior to this eruption. He further denies any history of atopy or immunosuppression. His health is otherwise excellent, and he is taking no prescription medications. The denuded area measures about 8 x 4 cm, from his nuchal scalp down to the C6 area of the posterior neck. Discrete ruptured vesicles are seen on the periphery of the site. A layer of peeling skin, resembling wet toilet tissue, covers the partially denuded central portion, at the base of which is distinctly erythematous underlying raw tissue. There is no erythema surrounding the lesion, and no nodes are palpable in the area. A 4-mm punch biopsy is performed, with a sample taken from the periphery of the lesion and submitted for routine handling. It shows a hyperplastic epithelium, as well as intradermal and suprabasilar acantholysis extending focally into the spinous layer.

Stimulants for kids with ADHD—how to proceed safely
› Complete a thorough, cardiac-focused history and physical examination before starting stimulants for attention deficit hyperactivity disorder (ADHD) in a child or adolescent. C
› Avoid using stimulants in children or adolescents with comorbid conditions associated with sudden cardiac death, including hypertrophic cardiomyopathy, long QT interval syndrome, and preexcitation syndromes such as Wolff-Parkinson-White syndrome. C
› Monitor all children and adolescents who are taking stimulants for tachycardia, hypertension, palpitations, and chest pain. C
Strength of recommendation (SOR)
A Good-quality patient-oriented evidence
B Inconsistent or limited-quality patient-oriented evidence
C Consensus, usual practice, opinion, disease-oriented evidence, case series
CASE › A young patient has been struggling in school. His worried mother, having had several conferences with the child’s teachers, brings him to the family physician (FP), where he is given a diagnosis of attention deficit hyperactivity disorder (ADHD). The FP considers prescribing a stimulant medication, but first plans on conducting a more thorough family history and exam. She also debates the merits of ordering an electrocardiogram (EKG) to screen for conditions that could lead to sudden cardiac death.
If you were caring for this patient, how would you proceed?
That’s a good question, given the debate that has surrounded this subject since the US Food and Drug Administration (FDA) first learned of 25 cases of sudden death that were linked to stimulant medications.1 The majority of the cases, which were reported to the FDA’s Adverse Event Reporting System between 1999 and 2003, involved amphetamines or methylphenidate in patients under the age of 19.1 In 2008, the American Heart Association (AHA) issued a scientific statement advocating that physicians perform a proper family history and physical exam that includes blood pressure (BP) and an EKG before prescribing a stimulant for children and adolescents.2 The inclusion of EKG screening was intended to increase the likelihood of identifying patients with potentially life-threatening conditions that could lead to sudden cardiac death (SCD).2
Not everyone, however, agreed.
Later that year, the American Academy of Pediatrics (AAP) challenged the routine use of EKGs in this screening process, citing a lack of evidence between stimulant use and the induction of potentially lethal arrhythmias.3 And in 2011, the European Guideline Group also concluded that there was no evidence to suggest an incremental benefit for routine EKG assessment of ADHD patients before initiation of medication.4
Underscoring the uncertainty surrounding the subject are the findings of a 2012 survey of 525 randomly selected US pediatricians.5 Nearly a quarter of the respondents expressed concerns over the risk for SCD in children receiving stimulants for ADHD, and a slightly higher number—30%—worried that the risks for legal liability were high enough to warrant cardiac assessment.5
So how should the prudent FP proceed? In this review, we will describe how to thoroughly screen children and adolescents for their risk of SCD before prescribing stimulants for ADHD. We’ll also summarize what the evidence tells us about whether—and when—you should order an EKG. But first, a word about the pharmacology of stimulants.
How stimulants might increase SCD risk
Stimulants have been used to treat ADHD for more than 40 years6 and are a first-line of therapy for children with ADHD. Stimulants increase attention span by releasing dopamine and norepinephrine at synapses in the frontal cortex, brain stem, and midbrain.
The effect on heart rate and BP. In clinical trials with small samples sizes, children and adolescents receiving stimulants to treat ADHD experienced a minimal rise in heart rate and BP. As measured by 24-hour ambulatory BP monitoring, 13 subjects in a double-blind, randomized, placebo/stimulant crossover trial had slightly elevated total diastolic BP (69.7 vs 65.8 mm Hg; P=.02), waking diastolic BP (75.5 vs 72.3 mm Hg; P=.03), and total heart rate (85.5 vs 79.9 beats per minutes [bpm]; P=.004) while receiving stimulants.7 Other investigators noted similar findings among 17 boys ages 7 to 11 years.8
Whether prolonged childhood exposure to stimulants increases the risk for developing hypertension or tachycardia is unknown. A 10-year follow-up study of 579 children between the ages of 7 to 9 years found stimulants had no effect on systolic or diastolic BP.9 Stimulants use did, however, lead to a higher heart rate (84.2±12.4 vs 79.1±12.0 bpm) during treatment.9 No stimulant-related QT interval changes—which some have proposed might explain SCD in ADHD patients—have been reported in pediatric patients.10 Researchers have noted small increases in mean QTc intervals in adults treated with stimulants for ADHD, but none were >480 msec.11
Steps you should always take before prescribing a stimulant
Before prescribing stimulants to children or adolescents with ADHD, complete an in-depth cardiac history and physical examination, as recommended by the AHA and AAP (TABLE),2,3 to identify conditions that increase the likelihood of SCD, such as hypertrophic cardiomyopathy (HCM), long QT interval syndrome (LQTS), and preexcitation syndromes such as Wolff-Parkinson-White syndrome (WPW).
Confirm, for instance, that your patient has a normal heart rate, rhythm, and BP, and no pathological murmurs. In a survey of families with a child or young adult who had sudden cardiac arrest, 72% reported the patient had at least one cardiovascular symptom within 19 to 71 months of SCD, and 27% reported having a family member with a history of SCD before age 50.12 For patients with no such complaints or family history, the news is good. Two large studies found that in the absence of any suspected or overt cardiac disease, children with ADHD who were receiving stimulant therapy had no increased risk of SCD.13,14
What about patients with this common heart problem? Physicians face a dilemma when a stimulant is needed and the patient has a common acyanotic congenital heart lesion, such as a small atrial or ventricular septal defect, which is considered nonlethal. Based on limited data, there is no evidence that the risk of SCD is higher when these patients take stimulants.15
Should you order that EKG—or not?
Currently, the AHA still favors an EKG, though in a correction to its original statement, it adjusted the language to say that EKG could be “useful,” in addition to an in-depth cardiac history and physical examination.16
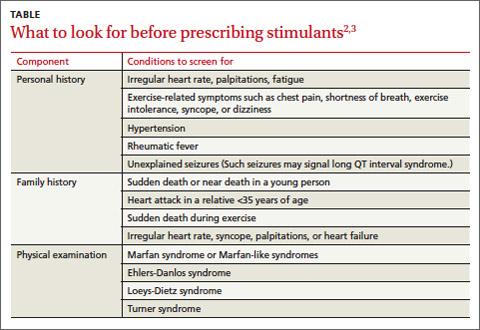
Opposition to routine EKG screening in these patients stems from the procedure’s extremely low yield and relatively high false positive findings, which may result in higher financial and psychological burdens for patients and families. Thomas et al17 reported that at a single center, the number of EKGs ordered with an indication of “stimulant medication screening” quadrupled during 2009, the year after the AHA published its recommendations. Of 372 patients referred for EKG, 24 (6.4%) had abnormal findings and 18 were referred for further evaluation, but none were found to have cardiac disease. ADHD therapy was delayed in 6 patients because of the EKG.
In a similar evaluation of 1470 ADHD patients ages 21 years and younger, Mahle et al18 noted that 119 patients (8.1%) had an abnormal EKG, 78 of whom (65%) were already receiving stimulants. Five patients had cardiac disease, including 2 who had a preexcitation syndrome. Overall, the positive predictive value was low (4.2%).18 Other research, including a study lead by one of this article’s authors (SKM), has found similar increases in the number of EKGs ordered for patients with ADHD.19
Cost vs benefit. In the Mahle et al18 study described above, the mean cost of EKG screening, including further testing for patients with abnormal initial results, was $58 per child. The mean cost to identify a true-positive result was $17,162.18
In 2012, Leslie et al20 used simulation models to estimate the societal cost of routine EKG screening to prevent SCD in children with ADHD. Their findings: The cost would be high relative to its health benefits—approximately $91,000 to $204,000 per life year saved. Furthermore, these researchers found that ordering an EKG to screen for 3 common cardiac conditions linked to SCD (HCM, WPW, and LQTS) would add <2 days to a patient’s projected life expectancy.20
Our recommendations
We believe stimulants can safely be used in the treatment of children and adolescents with ADHD, given the evidence that suggests a low risk of SCD. That said, it is prudent to avoid prescribing stimulants for children who have an underlying condition that may deteriorate secondary to increased blood pressure or heart rate.
We agree with the current AHA and AAP recommendations that physicians should obtain an in-depth cardiac history and physical examination, with emphasis on screening for cardiac disorders that may put a child at risk for SCD, such as HCM, LQTS, and preexcitation syndromes. For instance, a history of a family member with palpitations should prompt an EKG, which may reveal familial preexcitation syndrome. Similarly, an EKG is in order if you suspect LQTS based on a parent’s description of a family member’s death after hearing a loud noise, such as fireworks.
It often takes active probing to uncover a history of sudden death in the family that a parent may not consider relevant. For example, one of the authors (SKM) cared for a 6-year-old boy who presented with a history of syncope after his hand got caught in a door jam. On further probing, his mother revealed that her father had died at age 30 while he was taking astemizole, an allergy drug known to prolong the QT interval. Subsequent EKGs revealed that both the boy and his mother had LQTS.
For patients already taking stimulants, we recommend monitoring BP and heart rate and ordering an EKG only if the patient exhibits cardiac symptoms or there are concerns based on follow-up history and physical examination. Should a patient develop palpitations while taking a therapeutic dose of stimulants, a detailed history of the onset and duration of symptoms is important. For example, tachycardia that has a gradual onset and occurs with exercise is suggestive of physiological sinus tachycardia. In our judgment, most patients who experience symptoms that suggest sinus tachycardia simply require downward readjustment of their medication or a switch to a nonstimulant.
However, if the patient or family history prompts you to suspect other arrhythmias such as ectopic beats or supraventricular tachycardia, immediate assessment either in an emergency department or in the physician’s office may be required, because obtaining an EKG during symptoms is crucial for the diagnosis. Similarly, unexplained exercise intolerance or the onset of chest pain associated with exercise, dizziness, syncope, seizures, or dyspnea requires immediate cardiovascular assessment.
And finally, whether your patient has just started taking medication for his or her ADHD or has been on the medication for some time, it’s important to periodically reassess the need to continue the stimulant therapy; ADHD symptoms may decrease during mid- to late adolescence and into adulthood.21
CASE › The FP completed a thorough physical exam and found no evidence of any conditions that would increase the likelihood of SCD in the young patient. There was no history of SCD in the boy’s family, either. Based on these findings, the FP opted to forgo an EKG. She prescribed lisdexamfetamine, starting with 20 mg/d (the lowest dose available) and then monitored his course by telephone. Eventually, 30 mg was found to be an effective dose. At a 6-week follow-up visit, the boy’s ADHD symptoms were substantially reduced, without any adverse effects—cardiac or otherwise.
CORRESPONDENCE
Sudhir Ken Mehta, Cleveland Clinic Children’s Hospital, 9500 Euclid Avenue, Cleveland, OH 44111; [email protected]
1. Safety review: Follow up review of AERS search identifying cases of sudden death occurring with drugs used for the treatment of Attention Deficit Hyperactivity Disorder (ADHD). US Food and Drug Administration Web site. Available at: http://www.fda.gov/ohrms/dockets/ac/06/briefing/2006-4210b_07_01_safetyreview.pdf. Accessed January 17, 2014.
2. Vetter VL, Elia J, Erickson C, et al. Cardiovascular monitoring of children and adolescents with heart disease receiving medications for attention deficit/hyperactivity disorder: a scientific statement from the American Heart Association Council on Cardiovascular Disease in the Young Congenital Cardiac Defects Committee and the Council on Cardiovascular Nursing. Circulation. 2008;117:2407-2423.
3. Perrin JM, Friedman RA, Knilans TK; Black Box Working Group; Section on Cardiology and Cardiac Surgery. Cardiovascular monitoring and stimulant drugs for attention-deficit/hyperactivity disorder. Pediatrics. 2008;122:451-453.
4. Graham J, Banaschewski T, Buitelaar J, et al; European Guidelines Group. European guidelines on managing adverse effects of medication for ADHD. Eur Child Adolesc Psychiatry. 2011;20:17-37.
5. Leslie LK, Rodday AM, Saunders TS, et al. Cardiac screening prior to stimulant treatment of ADHD: a survey of US-based pediatricians. Pediatrics. 2012;129:222-230.
6. Conners CK. Symposium: behavior modification by drugs. II. Psychological effects of stimulant drugs in children with minimal brain dysfunction. Pediatrics. 1972;49:702-708.
7. Samuels JA, Franco K, Wan F, et al. Effect of stimulants on 24-h ambulatory blood pressure in children with ADHD: a double-blind, randomized, cross-over trial. Pediatr Nephrol. 2006;21:92-95.
8. Stowe CD, Gardner SF, Gist CC, et al. 24-hour ambulatory blood pressure monitoring in male children receiving stimulant therapy. Ann Pharmacother. 2002;36:1142-1149.
9. Vitiello B, Elliott GR, Swanson JM, et al. Blood pressure and heart rate over 10 years in the multimodal treatment study of children with ADHD. Am J Psychiatry. 2012;169:167-177.
10. Hammerness P, Wilens T, Mick E, et al. Cardiovascular effects of longer-term, high-dose OROS methylphenidate in adolescents with attention deficit hyperactivity disorder. J Pediatr. 2009;155:84-89,89.e1.
11. Weisler RH, Biederman J, Spencer TJ, et al. Long-term cardiovascular effects of mixed amphetamine salts extended release in adults with ADHD. CNS Spectr. 2005;10(suppl 20):35-43.
12. Drezner JA, Fudge J, Harmon KG, et al. Warning symptoms and family history in children and young adults with sudden cardiac arrest. J Am Board Fam Med. 2012;25:408-415.
13. Cooper WO, Habel LA, Sox CM, et al. ADHD drugs and serious cardiovascular events in children and young adults. N Engl J Med. 2011;365:1896-1904.
14. Schelleman H, Bilker WB, Strom BL, et al. Cardiovascular events and death in children exposed and unexposed to ADHD agents. Pediatrics. 2011;127:1102-1110.
15. Winterstein AG, Gerhard T, Kubilis P, et al. Cardiovascular safety of central nervous system stimulants in children and adolescents: population based cohort study. BMJ. 2012;345:e4627.
16. Vetter VL, Elia J, Erickson C, et al. Cardiovascular monitoring of children and adolescents with heart disease receiving medications for attention deficit/hyperactivity disorder: a scientific statement from the American Heart Association Council on Cardiovascular Disease in the Young Congenital Cardiac Defects Committee and the Council on Cardiovascular Nursing [published correction appears in Circulation. 2009;120:e55-e59]. Circulation. 2008;117:2407-2423.
17. Thomas PE, Carlo WF, Decker JA, et al. Impact of the American Heart Association scientific statement on screening electrocardiograms and stimulant medications. Arch Pediatr Adolesc Med. 2011;165:166-170.
18. Mahle WT, Hebson C, Strieper MJ. Electrocardiographic screening in children with attention-deficit hyperactivity disorder. Am J Cardiol. 2009;104:1296-1299.
19. Mehta SK, Richards N, Jacobs I. Children and adolescents with attention deficit hyperactivity disorder in a pediatric cardiology office. Cardiol Young. 2010;20(suppl 3):167.
20. Leslie LK, Cohen JT, Newburger JW, et al. Costs and benefits of targeted screening for causes of sudden cardiac death in children and adolescents. Circulation. 2012;125:2621-2629.
21. Mannuzza S, Klein RG, Bessler A, et al. Adult psychiatric status of hyperactive boys grown up. Am J Psychiatry. 1998;155:493-488.
› Complete a thorough, cardiac-focused history and physical examination before starting stimulants for attention deficit hyperactivity disorder (ADHD) in a child or adolescent. C
› Avoid using stimulants in children or adolescents with comorbid conditions associated with sudden cardiac death, including hypertrophic cardiomyopathy, long QT interval syndrome, and preexcitation syndromes such as Wolff-Parkinson-White syndrome. C
› Monitor all children and adolescents who are taking stimulants for tachycardia, hypertension, palpitations, and chest pain. C
Strength of recommendation (SOR)
A Good-quality patient-oriented evidence
B Inconsistent or limited-quality patient-oriented evidence
C Consensus, usual practice, opinion, disease-oriented evidence, case series
CASE › A young patient has been struggling in school. His worried mother, having had several conferences with the child’s teachers, brings him to the family physician (FP), where he is given a diagnosis of attention deficit hyperactivity disorder (ADHD). The FP considers prescribing a stimulant medication, but first plans on conducting a more thorough family history and exam. She also debates the merits of ordering an electrocardiogram (EKG) to screen for conditions that could lead to sudden cardiac death.
If you were caring for this patient, how would you proceed?
That’s a good question, given the debate that has surrounded this subject since the US Food and Drug Administration (FDA) first learned of 25 cases of sudden death that were linked to stimulant medications.1 The majority of the cases, which were reported to the FDA’s Adverse Event Reporting System between 1999 and 2003, involved amphetamines or methylphenidate in patients under the age of 19.1 In 2008, the American Heart Association (AHA) issued a scientific statement advocating that physicians perform a proper family history and physical exam that includes blood pressure (BP) and an EKG before prescribing a stimulant for children and adolescents.2 The inclusion of EKG screening was intended to increase the likelihood of identifying patients with potentially life-threatening conditions that could lead to sudden cardiac death (SCD).2
Not everyone, however, agreed.
Later that year, the American Academy of Pediatrics (AAP) challenged the routine use of EKGs in this screening process, citing a lack of evidence between stimulant use and the induction of potentially lethal arrhythmias.3 And in 2011, the European Guideline Group also concluded that there was no evidence to suggest an incremental benefit for routine EKG assessment of ADHD patients before initiation of medication.4
Underscoring the uncertainty surrounding the subject are the findings of a 2012 survey of 525 randomly selected US pediatricians.5 Nearly a quarter of the respondents expressed concerns over the risk for SCD in children receiving stimulants for ADHD, and a slightly higher number—30%—worried that the risks for legal liability were high enough to warrant cardiac assessment.5
So how should the prudent FP proceed? In this review, we will describe how to thoroughly screen children and adolescents for their risk of SCD before prescribing stimulants for ADHD. We’ll also summarize what the evidence tells us about whether—and when—you should order an EKG. But first, a word about the pharmacology of stimulants.
How stimulants might increase SCD risk
Stimulants have been used to treat ADHD for more than 40 years6 and are a first-line of therapy for children with ADHD. Stimulants increase attention span by releasing dopamine and norepinephrine at synapses in the frontal cortex, brain stem, and midbrain.
The effect on heart rate and BP. In clinical trials with small samples sizes, children and adolescents receiving stimulants to treat ADHD experienced a minimal rise in heart rate and BP. As measured by 24-hour ambulatory BP monitoring, 13 subjects in a double-blind, randomized, placebo/stimulant crossover trial had slightly elevated total diastolic BP (69.7 vs 65.8 mm Hg; P=.02), waking diastolic BP (75.5 vs 72.3 mm Hg; P=.03), and total heart rate (85.5 vs 79.9 beats per minutes [bpm]; P=.004) while receiving stimulants.7 Other investigators noted similar findings among 17 boys ages 7 to 11 years.8
Whether prolonged childhood exposure to stimulants increases the risk for developing hypertension or tachycardia is unknown. A 10-year follow-up study of 579 children between the ages of 7 to 9 years found stimulants had no effect on systolic or diastolic BP.9 Stimulants use did, however, lead to a higher heart rate (84.2±12.4 vs 79.1±12.0 bpm) during treatment.9 No stimulant-related QT interval changes—which some have proposed might explain SCD in ADHD patients—have been reported in pediatric patients.10 Researchers have noted small increases in mean QTc intervals in adults treated with stimulants for ADHD, but none were >480 msec.11
Steps you should always take before prescribing a stimulant
Before prescribing stimulants to children or adolescents with ADHD, complete an in-depth cardiac history and physical examination, as recommended by the AHA and AAP (TABLE),2,3 to identify conditions that increase the likelihood of SCD, such as hypertrophic cardiomyopathy (HCM), long QT interval syndrome (LQTS), and preexcitation syndromes such as Wolff-Parkinson-White syndrome (WPW).
Confirm, for instance, that your patient has a normal heart rate, rhythm, and BP, and no pathological murmurs. In a survey of families with a child or young adult who had sudden cardiac arrest, 72% reported the patient had at least one cardiovascular symptom within 19 to 71 months of SCD, and 27% reported having a family member with a history of SCD before age 50.12 For patients with no such complaints or family history, the news is good. Two large studies found that in the absence of any suspected or overt cardiac disease, children with ADHD who were receiving stimulant therapy had no increased risk of SCD.13,14
What about patients with this common heart problem? Physicians face a dilemma when a stimulant is needed and the patient has a common acyanotic congenital heart lesion, such as a small atrial or ventricular septal defect, which is considered nonlethal. Based on limited data, there is no evidence that the risk of SCD is higher when these patients take stimulants.15
Should you order that EKG—or not?
Currently, the AHA still favors an EKG, though in a correction to its original statement, it adjusted the language to say that EKG could be “useful,” in addition to an in-depth cardiac history and physical examination.16
Opposition to routine EKG screening in these patients stems from the procedure’s extremely low yield and relatively high false positive findings, which may result in higher financial and psychological burdens for patients and families. Thomas et al17 reported that at a single center, the number of EKGs ordered with an indication of “stimulant medication screening” quadrupled during 2009, the year after the AHA published its recommendations. Of 372 patients referred for EKG, 24 (6.4%) had abnormal findings and 18 were referred for further evaluation, but none were found to have cardiac disease. ADHD therapy was delayed in 6 patients because of the EKG.
In a similar evaluation of 1470 ADHD patients ages 21 years and younger, Mahle et al18 noted that 119 patients (8.1%) had an abnormal EKG, 78 of whom (65%) were already receiving stimulants. Five patients had cardiac disease, including 2 who had a preexcitation syndrome. Overall, the positive predictive value was low (4.2%).18 Other research, including a study lead by one of this article’s authors (SKM), has found similar increases in the number of EKGs ordered for patients with ADHD.19
Cost vs benefit. In the Mahle et al18 study described above, the mean cost of EKG screening, including further testing for patients with abnormal initial results, was $58 per child. The mean cost to identify a true-positive result was $17,162.18
In 2012, Leslie et al20 used simulation models to estimate the societal cost of routine EKG screening to prevent SCD in children with ADHD. Their findings: The cost would be high relative to its health benefits—approximately $91,000 to $204,000 per life year saved. Furthermore, these researchers found that ordering an EKG to screen for 3 common cardiac conditions linked to SCD (HCM, WPW, and LQTS) would add <2 days to a patient’s projected life expectancy.20
Our recommendations
We believe stimulants can safely be used in the treatment of children and adolescents with ADHD, given the evidence that suggests a low risk of SCD. That said, it is prudent to avoid prescribing stimulants for children who have an underlying condition that may deteriorate secondary to increased blood pressure or heart rate.
We agree with the current AHA and AAP recommendations that physicians should obtain an in-depth cardiac history and physical examination, with emphasis on screening for cardiac disorders that may put a child at risk for SCD, such as HCM, LQTS, and preexcitation syndromes. For instance, a history of a family member with palpitations should prompt an EKG, which may reveal familial preexcitation syndrome. Similarly, an EKG is in order if you suspect LQTS based on a parent’s description of a family member’s death after hearing a loud noise, such as fireworks.
It often takes active probing to uncover a history of sudden death in the family that a parent may not consider relevant. For example, one of the authors (SKM) cared for a 6-year-old boy who presented with a history of syncope after his hand got caught in a door jam. On further probing, his mother revealed that her father had died at age 30 while he was taking astemizole, an allergy drug known to prolong the QT interval. Subsequent EKGs revealed that both the boy and his mother had LQTS.
For patients already taking stimulants, we recommend monitoring BP and heart rate and ordering an EKG only if the patient exhibits cardiac symptoms or there are concerns based on follow-up history and physical examination. Should a patient develop palpitations while taking a therapeutic dose of stimulants, a detailed history of the onset and duration of symptoms is important. For example, tachycardia that has a gradual onset and occurs with exercise is suggestive of physiological sinus tachycardia. In our judgment, most patients who experience symptoms that suggest sinus tachycardia simply require downward readjustment of their medication or a switch to a nonstimulant.
However, if the patient or family history prompts you to suspect other arrhythmias such as ectopic beats or supraventricular tachycardia, immediate assessment either in an emergency department or in the physician’s office may be required, because obtaining an EKG during symptoms is crucial for the diagnosis. Similarly, unexplained exercise intolerance or the onset of chest pain associated with exercise, dizziness, syncope, seizures, or dyspnea requires immediate cardiovascular assessment.
And finally, whether your patient has just started taking medication for his or her ADHD or has been on the medication for some time, it’s important to periodically reassess the need to continue the stimulant therapy; ADHD symptoms may decrease during mid- to late adolescence and into adulthood.21
CASE › The FP completed a thorough physical exam and found no evidence of any conditions that would increase the likelihood of SCD in the young patient. There was no history of SCD in the boy’s family, either. Based on these findings, the FP opted to forgo an EKG. She prescribed lisdexamfetamine, starting with 20 mg/d (the lowest dose available) and then monitored his course by telephone. Eventually, 30 mg was found to be an effective dose. At a 6-week follow-up visit, the boy’s ADHD symptoms were substantially reduced, without any adverse effects—cardiac or otherwise.
CORRESPONDENCE
Sudhir Ken Mehta, Cleveland Clinic Children’s Hospital, 9500 Euclid Avenue, Cleveland, OH 44111; [email protected]
1. Safety review: Follow up review of AERS search identifying cases of sudden death occurring with drugs used for the treatment of Attention Deficit Hyperactivity Disorder (ADHD). US Food and Drug Administration Web site. Available at: http://www.fda.gov/ohrms/dockets/ac/06/briefing/2006-4210b_07_01_safetyreview.pdf. Accessed January 17, 2014.
2. Vetter VL, Elia J, Erickson C, et al. Cardiovascular monitoring of children and adolescents with heart disease receiving medications for attention deficit/hyperactivity disorder: a scientific statement from the American Heart Association Council on Cardiovascular Disease in the Young Congenital Cardiac Defects Committee and the Council on Cardiovascular Nursing. Circulation. 2008;117:2407-2423.
3. Perrin JM, Friedman RA, Knilans TK; Black Box Working Group; Section on Cardiology and Cardiac Surgery. Cardiovascular monitoring and stimulant drugs for attention-deficit/hyperactivity disorder. Pediatrics. 2008;122:451-453.
4. Graham J, Banaschewski T, Buitelaar J, et al; European Guidelines Group. European guidelines on managing adverse effects of medication for ADHD. Eur Child Adolesc Psychiatry. 2011;20:17-37.
5. Leslie LK, Rodday AM, Saunders TS, et al. Cardiac screening prior to stimulant treatment of ADHD: a survey of US-based pediatricians. Pediatrics. 2012;129:222-230.
6. Conners CK. Symposium: behavior modification by drugs. II. Psychological effects of stimulant drugs in children with minimal brain dysfunction. Pediatrics. 1972;49:702-708.
7. Samuels JA, Franco K, Wan F, et al. Effect of stimulants on 24-h ambulatory blood pressure in children with ADHD: a double-blind, randomized, cross-over trial. Pediatr Nephrol. 2006;21:92-95.
8. Stowe CD, Gardner SF, Gist CC, et al. 24-hour ambulatory blood pressure monitoring in male children receiving stimulant therapy. Ann Pharmacother. 2002;36:1142-1149.
9. Vitiello B, Elliott GR, Swanson JM, et al. Blood pressure and heart rate over 10 years in the multimodal treatment study of children with ADHD. Am J Psychiatry. 2012;169:167-177.
10. Hammerness P, Wilens T, Mick E, et al. Cardiovascular effects of longer-term, high-dose OROS methylphenidate in adolescents with attention deficit hyperactivity disorder. J Pediatr. 2009;155:84-89,89.e1.
11. Weisler RH, Biederman J, Spencer TJ, et al. Long-term cardiovascular effects of mixed amphetamine salts extended release in adults with ADHD. CNS Spectr. 2005;10(suppl 20):35-43.
12. Drezner JA, Fudge J, Harmon KG, et al. Warning symptoms and family history in children and young adults with sudden cardiac arrest. J Am Board Fam Med. 2012;25:408-415.
13. Cooper WO, Habel LA, Sox CM, et al. ADHD drugs and serious cardiovascular events in children and young adults. N Engl J Med. 2011;365:1896-1904.
14. Schelleman H, Bilker WB, Strom BL, et al. Cardiovascular events and death in children exposed and unexposed to ADHD agents. Pediatrics. 2011;127:1102-1110.
15. Winterstein AG, Gerhard T, Kubilis P, et al. Cardiovascular safety of central nervous system stimulants in children and adolescents: population based cohort study. BMJ. 2012;345:e4627.
16. Vetter VL, Elia J, Erickson C, et al. Cardiovascular monitoring of children and adolescents with heart disease receiving medications for attention deficit/hyperactivity disorder: a scientific statement from the American Heart Association Council on Cardiovascular Disease in the Young Congenital Cardiac Defects Committee and the Council on Cardiovascular Nursing [published correction appears in Circulation. 2009;120:e55-e59]. Circulation. 2008;117:2407-2423.
17. Thomas PE, Carlo WF, Decker JA, et al. Impact of the American Heart Association scientific statement on screening electrocardiograms and stimulant medications. Arch Pediatr Adolesc Med. 2011;165:166-170.
18. Mahle WT, Hebson C, Strieper MJ. Electrocardiographic screening in children with attention-deficit hyperactivity disorder. Am J Cardiol. 2009;104:1296-1299.
19. Mehta SK, Richards N, Jacobs I. Children and adolescents with attention deficit hyperactivity disorder in a pediatric cardiology office. Cardiol Young. 2010;20(suppl 3):167.
20. Leslie LK, Cohen JT, Newburger JW, et al. Costs and benefits of targeted screening for causes of sudden cardiac death in children and adolescents. Circulation. 2012;125:2621-2629.
21. Mannuzza S, Klein RG, Bessler A, et al. Adult psychiatric status of hyperactive boys grown up. Am J Psychiatry. 1998;155:493-488.

Urodynamic testing: Who needs it, and key pointers for a successful outcome
More than 300 attendees heard Dr. Mickey Karram address urodynamics and cystoscopy at the annual Pelvic Anatomy and Gynecologic Surgery Symposium (PAGS) in Las Vegas, December 12-14, 2013. Here, a key topic from his presentation.

Dr. Karram is Professor of OB/GYN and Urology, University of Cincinnati School of Medicine, and Director, Urogynecology, The Christ Hospital, Cincinnati, Ohio. He also is Course Director of the Pelvic Anatomy and Gynecologic Surgery Symposium (PAGS) and the Female Urology and Urogynecology Symposium (FUUS), both co-sponsored by OBG Management.
FUUS 2014: June 14-16, Aria, Las Vegas
Click here for more info.
More than 300 attendees heard Dr. Mickey Karram address urodynamics and cystoscopy at the annual Pelvic Anatomy and Gynecologic Surgery Symposium (PAGS) in Las Vegas, December 12-14, 2013. Here, a key topic from his presentation.
Dr. Karram is Professor of OB/GYN and Urology, University of Cincinnati School of Medicine, and Director, Urogynecology, The Christ Hospital, Cincinnati, Ohio. He also is Course Director of the Pelvic Anatomy and Gynecologic Surgery Symposium (PAGS) and the Female Urology and Urogynecology Symposium (FUUS), both co-sponsored by OBG Management.
FUUS 2014: June 14-16, Aria, Las Vegas
Click here for more info.
Malaria screening program unsuccessful
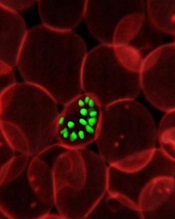
blood cell; Credit: St Jude
Children’s Research Hospital
A school-based, intermittent screening and treatment program for malaria did not confer any benefits for children living in an area of low-to-moderate malaria transmission.
The program, which was implemented at schools in Kenya, did not significantly reduce the incidence of malaria infection or the prevalence of anemia.
Katherine Halliday, of the London School of Hygiene & Tropical Medicine in the UK, and her colleagues reported these results in PLOS Medicine.
The study included 5233 children, ages 5 to 20, studying at 101 government schools located on the south coast of Kenya. Fifty-one of the schools were randomized to the intermittent screening and treatment program.
Over 24 months, children in these schools underwent screening for malaria parasites once each term (a total of 5 times). And those who tested positive for malaria parasitemia (whether symptomatic or asymptomatic) received 6 cycles of treatment with the anti-malarial drug artemether-lumefantrine.
Eighty-four percent of the children were screened at 4 or more rounds, and 66.8% were screened at all 5 rounds. By the fifth round, 20% of children had been lost due to death, withdrawal, or migration.
The percentage of children who were positive for malaria at each screening ranged from 14.8% to 19.2%, and there was no distinct trend over time. Overall, 99.1% of the positive results led to treatment, and 92.6% of these were recorded as receiving the fully supervised, 6-dose treatment regimen.
The investigators followed a majority of the children in each group for an additional 24 months after the intervention ended. And the team found that the intervention had no significant impact on the prevalence of Plasmodium falciparum infection at 12 months or 24 months.
At 12 months, the prevalence of P falciparum (adjusted for age, sex, and stratification effects) was 10.7% in the intervention group and 14.3% in the control group (P=0.131). At 24 months, the prevalence of P falciparum was 11.8% in the intervention group and 8.5% in the control group (P=0.124).
Similarly, there was no significant difference between the 2 groups with regard to anemia.
At 12 months, the prevalence of anemia was 38.5% among controls and 40.1% in the intervention group (P=0.621). At 24 months, the prevalence was 39.5% among controls and 41.5% in the intervention group (P=0.953).
The investigators also evaluated education-related outcomes at 9 months and 24 months of follow-up. They found no significant difference between the study groups with regard to classroom attention.
However, younger children in the intervention group did not score as well as controls in spelling or arithmetic tests.
The team said this may be a chance finding, or it may indicate that apprehension about the finger prick needed for the diagnostic test had a negative effect on the children’s performance during educational tests.
In closing, the investigators said there are a number of possible reasons why this screening and treatment intervention proved unsuccesful.
These include geographical heterogeneity in transmission, a rapid rate of reinfection following treatment, the variable reliability of the diagnostic tests used, and the relative contribution of malaria to the etiology of anemia in this setting.
In a related perspective article, Lorenz von Seidlein, MD, PhD, of the Menzies School of Health Research in Casuarina, Australia, discusses these possibilities in more detail, as well as the wider issues involved in failure of screening and treating as a malaria elimination strategy. ![]()
Mouse model provides new insight into AML

Studies have suggested that mutations in isocitrate dehydrogenase-1 and 2 (IDH1 and IDH2) are present in approximately 20% of all acute myeloid leukemias (AMLs), and this implies that mutant IDH proteins are attractive drug targets.
With this in mind, a group of scientists generated a transgenic mouse model of the most common IDH2 mutation in human AML.
Experiments conducted with this model revealed that mutant IDH2 contributes to leukemia initiation and is required for the maintenance of leukemic cells in a living organism.
The researchers said these findings, published in Cell Stem Cell, confirm a potent oncogenic role for IDH2 and support its relevance as a therapeutic target for AML.
Furthermore, the model can be used to evaluate the pharmacological efficacy of IDH2 inhibitors, either alone or in combination with other compounds.
“The real hope is that we would one day be able to treat IDH2-mutant leukemia patients with a drug that targets this genetic abnormality,” said senior study author Pier Paolo Pandolfi, MD, PhD, of Beth Israel Deaconess Medical Center (BIDMC) in Boston.
He and his colleagues knew that IDH1 and IDH2 proteins are critical enzymes in the TCA cycle, which is centrally important to many biochemical pathways. Mutated forms of these proteins gain a novel ability to produce 2-hydroxyglutarate (2HG), a metabolite that has been shown to accumulate at high levels in cancer patients.
“Our goal was to generate an animal model of mutant IDH that was both inducible and reversible,” said Markus Reschke, PhD, also of BIDMC.
“This enabled us to address an important unanswered question: Does inhibition of mutant IDH proteins in active disease have an effect on tumor maintenance or progression in a living organism?”
The researchers studied 2 different models: a retroviral transduction model and a genetically engineered model in which IDH mice were crossed with mice harboring other leukemia-relevant mutations.
In the first model, the IDH mutation was combined with the oncogenes HoxA9 and Meis1a, 2 downstream targets of numerous pathways that are deregulated in AML.
The results showed evidence of differentiation within 2 weeks of genetic deinduction of mutant IDH. And 2 weeks later, 6 of 8 animals showed complete remission with elimination of any detectable leukemic cells.
The researchers said these results were both surprising and encouraging, demonstrating a situation in which IDH mutation occurs as an early event, and leukemic transformation occurs as a result of subsequent genetic hits.
“The retroviral model enabled us to observe that mutant IDH2 is essential for the maintenance of HoxA9/Meis1a-induced AML,” said Lev Kats, PhD, of BIDMC. “But this was still a surrogate model. This isn’t what happens in human patients, per se.”
The researchers therefore went on to develop a transgenic model that more closely recapitulates the genetics of human AML.
“By crossing the mutant IDH2 animals with other leukemia-relevant mutations, including mutations in the FMS-like tyrosine kinase 3 [FLT3], we observed that compound-mutant animals developed acute leukemias,” Dr Reschke said. “This exciting finding told us that mutant IDH2 contributes to leukemia initiation in vivo.”
As with the retroviral transduction model, genetic deinduction of mutant IDH2 in the context of a cooperating FLT3 mutation resulted in reduced proliferation and/or differentiation of leukemic cells, further demonstrating that mutant IDH2 expression is required for leukemia maintenance.
“This model has validated mutant IDH proteins as very strong candidates for continued development of targeted anticancer therapeutics,” Dr Pandolfi said. “The model will also be of paramount importance to study mechanisms of resistance to treatment that may occur.” ![]()