User login
Stigma is a family affair
Each year, 60 million Americans experience mental illness. Across the United States, each year, regardless of race, age, religion, or economic status, mental illness affects the lives of one in four adults and one in 10 children. This means that someone in every family has mental illness.
Most of our patients probably don’t tell anyone that they or one of their family members has mental illness They probably are doing what most of us do: Pretend it’s not there. Why? Because the stigma of mental illness is pervasive and destructive. What can we do to decrease the stigma?

The word stigma is derived from Greek and means "to mark the body." The bearer of the mark, or the stigma, is avoided and shunned. This practice has continued through the ages. In medieval times, if a person had a mental illness, he or she was thought to be possessed by demons and viewed as weak. Today, people with mental illness are viewed as menacing, deviant, unpredictable, incompetent, or even dangerous. It is entirely reasonable then, that we would want to avoid the stigma of mental illness. However, this prejudice against mental illness must be challenged.
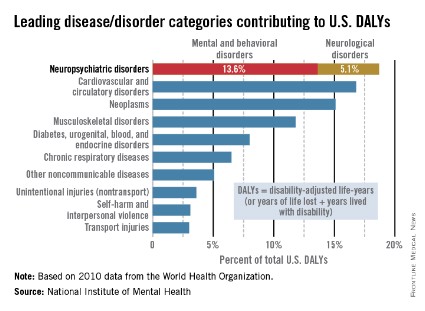
Mental illness accounts for increased morbidity and mortality as well as lifetime disability. The World Health Organization (WHO) estimates that neuropsychiatric disorders are the leading cause of disability in the United States, followed by cardiovascular and circulatory diseases, and neoplasms. The neuropsychiatric disorders category, which includes mental and behavioral disorders, accounts for 13.6% of total U.S. disability-adjusted life years (DALYs). Neurological disorders account for 5.1% of total U.S. DALYs.
Impact on the family
Not only does stigma affect individuals, it affects family members as well. Family members suffer from SBA, or stigma by association (Brit. J. Psych. 2002;181:494-8), also known as courtesy stigma (Social. Psychiatry Psychiatr. Epidemiol. 2003;38:593-602). Families share stigma because families share a genetic heritage. Families share stigma by assuming responsibility for their family members’ behaviors. Families share stigma because they are seen as having common motivations (J. Pers. Soc. Psychol. 2012;102:224-41).
SBA causes psychological distress in family members (Rehabil. Psychol. 2013;58:73-80; J. Nerv. Ment. Dis. 1987;175:4-11; Br. J. Psychiatry 2002;181:494-8; and Schizophr. Bull. 1998;24:115-126).
Psychological complaints, such as brooding, inner unrest, and irritability, and physical complaints, such as insomnia, fatigue, and neck and shoulder pain, have been attributed to the psychological distress of SBA. Family members may avoid social interactions and conceal their relationship to the family member who is mentally ill (Acad. Psychiatry 2008;32:87-91). They might psychologically distance themselves from a relative with mental illness.
SBA varies by disease type, family role, and age. The greatest SBA is associated with drug dependence. These family members are blamed for the illness, held responsible for relapse, and viewed as incompetent. In the study of Patrick W. Corrigan, Psy.D., (J. Fam. Psychol. 2006;20:239-46), family members report feelings of "contamination" and shame. Severe depression or panic and phobias engender less stigma. More educated people are less likely to report feelings of stigma.
According to Dr. Corrigan, SBA varies by family role: Parents are blamed for causing the child’s mental illness, siblings are blamed for not ensuring that relatives with mental illness adhere to treatment plans, and children are fearful of being "contaminated" with the mental illness of their parent. The closer the relationship, the less the stigma is perceived as defining the person. Family closeness can reduce stigma (The Gerontologist 2012;52:89-97). Regarding age, a British study showed that the highest stigma is reported in the 16- to 19-year-old age group (Br. J. Psychiatry 2000;177:4-7).
Psychiatry as a profession has not helped diminish stigma. It is not uncommon to hear psychiatrists assign blame to parents or spouses. Psychiatrists often believe that the family has a role in the patient’s illness. How many spouses have been told they are "codependent" with the implication that they have somehow "caused the illness"? What can we do diminish stigma?
Fighting stigma
Fighting stigma means confronting stigma (Advances in Psychiatric Treatment 2000;6:65-72). Most efforts worldwide have begun with the idea of educating people about mental illness. These efforts, focused on promoting mental illness as a biological illness, have had limited success and in some situations actually increased stigma (Acta Psychiatr. Scand. 2012; 125:440-52). The answer may lie in targeted education: specific facts for specific groups.
For example, young couples with children become less fearful after education targeted specifically for them (Br. J. Psychiatry 1996;168:191-8). Antistigma campaigns are common throughout the world. The websites of most professional psychiatric organizations, such as the American Psychiatric Association, the Royal College of Psychiatrists, and the College of Psychiatrists of Ireland, provide information about antistigma campaigns. Organizations often partner with mental health charities. Antistigma efforts also focus on publishing articles about stigma as the Lancet did in a series a few years ago (1998;352:1048). It is unclear whether these efforts reduce stigma. Dr. Corrigan suggests that meeting people who have mental illness weakens the tendency to link mental illness and violence (Psychiatric Rehabilitation Skills 2002;6: 312-34).
The current consensus is that antistigma campaigns should focus on the competence of people with mental illness. In this vein, the Scottish Mental Health Arts & Film Festival highlights the contributions that people with mental illness make to society. The festival, which began in 2007, also sponsors a contest for films that depict people with mental illness in realistic, holistic ways. In 2013, the festival drew 12,000 attendees and sparked 120 newspaper articles that emphasized the fact that people with mental illness are generally active, useful members of society.
Meanwhile, a Canadian antistigma campaign tells the stories of people with mental illness and provides evidence of the competence of these people. The APA’s public service video series, "A Healthy Minds Minute," features celebrities and prominent figures calling for equal access to quality care, and insurance coverage for people with mental illness and substance use disorders.
What do we do to reduce stigma? Psychiatrists such as William Beardslee have written about their personal experience of a family member with mental illness. A member of the Association of Family Psychiatrists, Julie Totten, lost her brother to suicide and in response, she developed an organization called Families for Depression Awareness, which is devoted to reducing the stigma of mental illness. For me, it is my personal campaign to say: "One in four means that someone in everyone’s family has mental illness."
What more can we do?
• Speak up when you hear or see stigma.
• Stress the normalcy of people who have mental illness.
• Come out of the closet on behalf of yourself or a family member.
• Include people who acknowledge they suffer from mental illness in antistigma campaigns.
• Discuss the role of stigma with patients and their families. Ask "How has stigma affected you as a family? In what ways has your family helped reduce the stigma of your mental illness?"
• Encourage attendance at support groups, such as NAMI (the National Alliance on Mental Illness).
• Embrace your family member or yourself: Look for personal qualities that wipe out stigma.
• Don’t allow people to stigmatize patients: It might be your family member they are talking about.
• Talk positively about respecting our patients.
• Start a conversation to reduce stigma.
• Remember that fighting stigma means confronting stigma.
Dr. Heru is an associate professor of psychiatry at the University of Colorado at Denver, Aurora. She has been a member of the Association of Family Psychiatrists since 2002 and currently serves as the organization’s treasurer. She is the author of a new book, "Working With Families in Medical Settings" (New York: Routledge, 2013).
Each year, 60 million Americans experience mental illness. Across the United States, each year, regardless of race, age, religion, or economic status, mental illness affects the lives of one in four adults and one in 10 children. This means that someone in every family has mental illness.
Most of our patients probably don’t tell anyone that they or one of their family members has mental illness They probably are doing what most of us do: Pretend it’s not there. Why? Because the stigma of mental illness is pervasive and destructive. What can we do to decrease the stigma?
The word stigma is derived from Greek and means "to mark the body." The bearer of the mark, or the stigma, is avoided and shunned. This practice has continued through the ages. In medieval times, if a person had a mental illness, he or she was thought to be possessed by demons and viewed as weak. Today, people with mental illness are viewed as menacing, deviant, unpredictable, incompetent, or even dangerous. It is entirely reasonable then, that we would want to avoid the stigma of mental illness. However, this prejudice against mental illness must be challenged.
Mental illness accounts for increased morbidity and mortality as well as lifetime disability. The World Health Organization (WHO) estimates that neuropsychiatric disorders are the leading cause of disability in the United States, followed by cardiovascular and circulatory diseases, and neoplasms. The neuropsychiatric disorders category, which includes mental and behavioral disorders, accounts for 13.6% of total U.S. disability-adjusted life years (DALYs). Neurological disorders account for 5.1% of total U.S. DALYs.
Impact on the family
Not only does stigma affect individuals, it affects family members as well. Family members suffer from SBA, or stigma by association (Brit. J. Psych. 2002;181:494-8), also known as courtesy stigma (Social. Psychiatry Psychiatr. Epidemiol. 2003;38:593-602). Families share stigma because families share a genetic heritage. Families share stigma by assuming responsibility for their family members’ behaviors. Families share stigma because they are seen as having common motivations (J. Pers. Soc. Psychol. 2012;102:224-41).
SBA causes psychological distress in family members (Rehabil. Psychol. 2013;58:73-80; J. Nerv. Ment. Dis. 1987;175:4-11; Br. J. Psychiatry 2002;181:494-8; and Schizophr. Bull. 1998;24:115-126).
Psychological complaints, such as brooding, inner unrest, and irritability, and physical complaints, such as insomnia, fatigue, and neck and shoulder pain, have been attributed to the psychological distress of SBA. Family members may avoid social interactions and conceal their relationship to the family member who is mentally ill (Acad. Psychiatry 2008;32:87-91). They might psychologically distance themselves from a relative with mental illness.
SBA varies by disease type, family role, and age. The greatest SBA is associated with drug dependence. These family members are blamed for the illness, held responsible for relapse, and viewed as incompetent. In the study of Patrick W. Corrigan, Psy.D., (J. Fam. Psychol. 2006;20:239-46), family members report feelings of "contamination" and shame. Severe depression or panic and phobias engender less stigma. More educated people are less likely to report feelings of stigma.
According to Dr. Corrigan, SBA varies by family role: Parents are blamed for causing the child’s mental illness, siblings are blamed for not ensuring that relatives with mental illness adhere to treatment plans, and children are fearful of being "contaminated" with the mental illness of their parent. The closer the relationship, the less the stigma is perceived as defining the person. Family closeness can reduce stigma (The Gerontologist 2012;52:89-97). Regarding age, a British study showed that the highest stigma is reported in the 16- to 19-year-old age group (Br. J. Psychiatry 2000;177:4-7).
Psychiatry as a profession has not helped diminish stigma. It is not uncommon to hear psychiatrists assign blame to parents or spouses. Psychiatrists often believe that the family has a role in the patient’s illness. How many spouses have been told they are "codependent" with the implication that they have somehow "caused the illness"? What can we do diminish stigma?
Fighting stigma
Fighting stigma means confronting stigma (Advances in Psychiatric Treatment 2000;6:65-72). Most efforts worldwide have begun with the idea of educating people about mental illness. These efforts, focused on promoting mental illness as a biological illness, have had limited success and in some situations actually increased stigma (Acta Psychiatr. Scand. 2012; 125:440-52). The answer may lie in targeted education: specific facts for specific groups.
For example, young couples with children become less fearful after education targeted specifically for them (Br. J. Psychiatry 1996;168:191-8). Antistigma campaigns are common throughout the world. The websites of most professional psychiatric organizations, such as the American Psychiatric Association, the Royal College of Psychiatrists, and the College of Psychiatrists of Ireland, provide information about antistigma campaigns. Organizations often partner with mental health charities. Antistigma efforts also focus on publishing articles about stigma as the Lancet did in a series a few years ago (1998;352:1048). It is unclear whether these efforts reduce stigma. Dr. Corrigan suggests that meeting people who have mental illness weakens the tendency to link mental illness and violence (Psychiatric Rehabilitation Skills 2002;6: 312-34).
The current consensus is that antistigma campaigns should focus on the competence of people with mental illness. In this vein, the Scottish Mental Health Arts & Film Festival highlights the contributions that people with mental illness make to society. The festival, which began in 2007, also sponsors a contest for films that depict people with mental illness in realistic, holistic ways. In 2013, the festival drew 12,000 attendees and sparked 120 newspaper articles that emphasized the fact that people with mental illness are generally active, useful members of society.
Meanwhile, a Canadian antistigma campaign tells the stories of people with mental illness and provides evidence of the competence of these people. The APA’s public service video series, "A Healthy Minds Minute," features celebrities and prominent figures calling for equal access to quality care, and insurance coverage for people with mental illness and substance use disorders.
What do we do to reduce stigma? Psychiatrists such as William Beardslee have written about their personal experience of a family member with mental illness. A member of the Association of Family Psychiatrists, Julie Totten, lost her brother to suicide and in response, she developed an organization called Families for Depression Awareness, which is devoted to reducing the stigma of mental illness. For me, it is my personal campaign to say: "One in four means that someone in everyone’s family has mental illness."
What more can we do?
• Speak up when you hear or see stigma.
• Stress the normalcy of people who have mental illness.
• Come out of the closet on behalf of yourself or a family member.
• Include people who acknowledge they suffer from mental illness in antistigma campaigns.
• Discuss the role of stigma with patients and their families. Ask "How has stigma affected you as a family? In what ways has your family helped reduce the stigma of your mental illness?"
• Encourage attendance at support groups, such as NAMI (the National Alliance on Mental Illness).
• Embrace your family member or yourself: Look for personal qualities that wipe out stigma.
• Don’t allow people to stigmatize patients: It might be your family member they are talking about.
• Talk positively about respecting our patients.
• Start a conversation to reduce stigma.
• Remember that fighting stigma means confronting stigma.
Dr. Heru is an associate professor of psychiatry at the University of Colorado at Denver, Aurora. She has been a member of the Association of Family Psychiatrists since 2002 and currently serves as the organization’s treasurer. She is the author of a new book, "Working With Families in Medical Settings" (New York: Routledge, 2013).
Monosomal karyotype, high prognostic risk score predicted transplantation failure
Monosomal karyotype and high prognostic risk according to the revised International Prognostic Scoring System are independent predictors of relapse and mortality in patients with myelodysplastic syndrome or oligoblastic acute myeloid leukemia who undergo allogeneic hematopoietic stem cell transplantation, according to findings from the GITMO (Gruppo Italiano Trapianto di Midollo Osseo) registry.
Treatment failure after allogeneic hematopoietic stem cell transplantation may be from transplant complications or relapse. To understand the predictors of failure, investigators studied outcomes in 519 patients with myelodysplastic syndrome or oligoblastic acute myeloid leukemia who underwent hematopoietic stem cell transplantation between 2000 and 2011.
Those with monosomal karyotype had a 49% relapse rate and a 10% 5-year overall survival rate; both rates were significantly worse, compared with patients without monosomal karyotype (P less than .001 for each). Those considered high or very-high risk based on the International Prognostic Scoring System (IPSS-R), had 39% and 23% 5-year overall survival, respectively, and 23% and 39% relapse rates, respectively (P less than .001 in all cases vs. patients not at high or very-high risk), Dr. Matteo G. Della Porta of Fondazione IRCCS Policlinico San Matteo, Pavia, Italy and colleagues reported on behalf of the GITMO.
Age of 50 years or older and high hematopoietic cell transplantation-comorbidity index scores were independent predictors of nonrelapse mortality (P = .02; P = .017, respectively), they found (Blood 2014 [doi:10.1182/blood-2013-12-542720]).
Accounting for various combinations of patients’ ages, IPSS-R category, monosomal karyotype, and high hematopoietic cell transplantation–comorbidity index, the 5-year probability of survival after allogeneic hematopoietic stem cell transplantation ranged from 0 to 94%. The analyses performed reinforce the concept that allogenic hematopoietic stem cell transplantation – the only potentially curative treatment for MDS – "offers optimal eradication of myelodysplastic hematopoiesis when the procedure is performed before MDS patients progress to advanced disease stages," the investigators concluded.
The investigators reported having no disclosures.
FROM BLOOD
Major finding: Patients with a monosomal karyotype had a 49% relapse rate and a 10% 5-year overall survival rate, and those considered high or very-high risk based on the IPSS-R, had 39% and 23% 5-year overall survival, respectively, and 23% and 39% relapse rates, respectively.
Data source: An analysis of GITMO registry data.
Disclosures: The investigators reported having no disclosures.
Cell-cycle inhibitor entinostat appeared to block azacitidine action
Coadministration with entinostat – a cell-cycle inhibitor – appears to decrease hematologic responsiveness to azacitidine treatment for high-risk myelodysplastic syndrome, according to data from an open-label, phase II randomized trial.
An earlier, phase I pilot study had suggested that the combination was effective and tolerable, however this phase II study in 149 patients (97 patients with myelodysplastic syndrome and 52 patients with acute myeloid leukemia) showed a lower overall hematologic response and lower median overall survival in the combination arm, compared with the azacitidine-only arm, said Dr. Thomas Prebet, who was at the Sidney Kimmel Comprehensive Cancer Center at Johns Hopkins University, Baltimore, when the work was done, but is now at Institut Paoli Calmettes, Marseille, France, and his colleagues.
They also performed genome-wide methylation studies on 99 specimens, finding that while demethylation in the combination arm was trending toward overall demethylation, it was significantly reduced, compared with the single agent arm, suggesting the entinostat was actually blocking the action of the azacitidine (J. Clin. Oncol. 2014 March 24 [doi:10.1200/JCO.2013.50.3102]).
The authors did note that the lower-dose, 10-day schedule of azacitidine, which was developed specifically for this phase II trial, appeared to double the rate of hematologic normalization, compared with that observed in a previous study using the standard 7-day schedule, suggesting that the longer schedule was more effective.
Some authors reported being consultants for and/or receiving research funding from various pharmaceutical companies. The study was partly supported by grants from the Leukemia and Lymphoma Society of America and Fulbright Franco-American Commission/Foundation.
FROM THE JOURNAL OF CLINICAL ONCOLOGY
Major finding: The addition of cell-cycle inhibitor entinostat to a 10-day schedule of treatment with azacitidine led to a lower overall hematologic response and lower median overall survival in the patients with high-risk myelodysplastic syndromes, compared with treatment with azacitidine alone.
Data source: An open-label, phase II randomized trial in 149 patients (97 patients with myelodysplastic syndrome and 52 patients with acute myeloid leukemia).
Disclosures: Some authors reported being consultants for and/or receiving research funding from various pharmaceutical companies. The study was partly supported by grants from the Leukemia and Lymphoma Society of America and Fulbright Franco-American Commission/Foundation.
EC approves SC formulation of rituximab

The European Commission (EC) has approved a subcutaneous (SC) formulation of rituximab (MabThera) to treat patients with follicular lymphoma or diffuse large B-cell lymphoma.
This formulation allows for 5-minute administration, a significant decrease over the 2.5-hour infusion time required to administer intravenous (IV) rituximab.
The drug’s maker, Roche, plans to begin launching SC rituximab in a number of European markets this year.
The EC’s approval of this formulation was primarily based on data from the SABRINA trial, which was recently published in The Lancet Oncology and funded by Roche.
In this phase 3 trial, researchers compared 3-week cycles of fixed-dose, SC rituximab to IV rituximab. They enrolled 127 patients with previously untreated, grade 1-3a, CD20-positive follicular lymphoma.
Patients were randomized to receive IV rituximab (375 mg/m2) or SC rituximab (1400 mg). After randomization, they received 1 induction dose of IV rituximab in cycle 1 and then their allocated treatment for cycles 2 through 8. Patients with a complete or partial response continued their treatment as maintenance every 8 weeks.
The study’s primary endpoint was the ratio of observed rituximab serum trough concentrations (Ctrough) between the 2 groups at cycle 7.
Pharmacokinetic data were available for 75% of patients (48/64) in the IV arm and 86% of the patients (54/63) in the SC arm.
An analysis of these data suggested SC rituximab was non-inferior to the IV formulation. The geometric mean Ctrough was 83.13 μg/mL in the IV arm and 134.58 μg/mL in the SC arm (ratio, 1.62).
The rate of adverse events was similar between the 2 arms, occurring in 88% (57/65) of patients in the IV arm and 92% (57/62) of patients in the SC arm. Grade 3 or higher adverse events occurred in 46% (n=30) and 47% (n=29) of patients, respectively.
The most common grade 3 or higher adverse event in both arms was neutropenia. It occurred in 22% (n=14) of patients in the IV arm and 26% (n=16) in the SC arm.
Adverse events related to administration were mostly grade 1-2. And they occurred more often in the SC arm than in the IV arm, in 50% (n=31) and 32% (n=21) of patients, respectively.
The researchers said these results suggest the SC formulation of rituximab is non-inferior to the IV formulation and poses no new safety concerns. ![]()
ALL cells don’t survive SSC culture method

Results of a pilot study suggest safe transplantation of spermatogonial stem cells (SSCs) may be possible, potentially bringing us one step closer to ensuring fertility preservation in young boys with cancer.
Investigators found they could culture a large amount of SSCs using testicular tissue from boys with acute lymphoblastic leukemia (ALL).
And the ALL cells did not survive the culture process.
The researchers reported these results in Fertility and Sterility.
“Our study addressed an important safety issue—whether cancer cells that might be present in testicular tissue samples can survive the process to replicate the sperm-producing stem cells,” said study author Hooman Sadri-Ardekani, MD, PhD, of Wake Forest Baptist Medical Center in Winston-Salem, North Carolina.
“This is an important consideration because of the potential to re-introduce cancer into the patient. The research, which involved one of the most common childhood cancers, shows that the cancer cells were eliminated. Based on these findings, we recommend that all boys with cancer be offered the option of storing testicular tissue for possible future clinical use.”
Previous research had shown that up to 30% of boys with ALL had cancer cells in their testicular tissue. In several studies, researchers attempted to eliminate cancer cells from biopsy tissue, but the results varied.
So Dr Sadri-Ardekani and his colleagues decided to investigate whether cancer cells would survive the protocol they had developed to reproduce SSCs from a small tissue biopsy.
This process multiplies the original SSCs by 18,000-fold so there are enough cells to transplant back into the patient when he reaches adulthood.
The investigators tested the method using samples from 3 ALL patients. The team cultured the ALL cells alone and at various concentrations in combination with testicular cells.
The ALL cells cultured alone did not survive beyond 14 days. But the testicular cells cultured in parallel survived and continue to proliferate well after 8 weeks.
At 10 to 16 days, the ALL cells cultured in combination had begun to die off. The cells were undetectable in cultures from 2 of the patients that had an initial ALL concentration of 0.04%, 0.4%, or 4%.
At 20 to 26 days, ALL cells were undetectable in all cultures, even those with an initial concentration of 40% ALL cells.
“This pilot study showed that the culture system not only allowed for efficient propagation of sperm stem cells but also eliminated ALL cells,” Dr Sadri-Ardekani said.
SSC transplants have not yet been attempted in humans, but they have been performed successfully in several species of animals, including monkeys.
Dr Sadri-Ardekani noted that before we can perform SSC transplants in patients, additional research is needed, particularly, research investigating whether other types of leukemia cells will also be eliminated in the cell-propagation process. ![]()
CDC reports more cases of Heartland virus disease

Credit: CDC
Health officials have reported 6 new cases of Heartland virus disease—5 in Missouri and 1 in Tennessee.
These cases, discovered in 2012 and 2013, add to the 2 cases discovered in 2009 and are described in the Centers for Disease Control and Prevention (CDC) Morbidity and Mortality Weekly Report.
The Heartland virus was first reported in 2 farmers in northwestern Missouri who were hospitalized in 2009 with what was thought to be ehrlichiosis, a tick-borne disease.
However, the patients failed to improve with treatment, and testing failed to confirm ehlrlichiosis.
Working with state and local partners, the CDC eventually identified the cause of the men’s illness: a previously unknown phlebovirus, now dubbed the Heartland virus.
Although we do not know for certain how patients are infected with the virus, research has suggested that ticks, namely lone star ticks, transmit it.
Ongoing investigations have uncovered 6 more cases of Heartland virus disease. All of the patients were white men older than 50 years of age. Five of them reported tick bites in the days or weeks before they fell ill.
Their symptoms started in May to September and included fever, fatigue, loss of appetite, headache, nausea, and muscle pain. The patients also had leukopenia and thrombocytopenia.
Four of the 6 patients were hospitalized. And 1 man, who suffered from other health conditions, died. It is not known if the Heartland virus was the cause of death or how much it contributed to his death.
The CDC has been working with the Missouri and Tennessee state health departments and other federal agencies to advance our understanding of Heartland virus disease by learning more about the patients who were infected, their illness, and their exposure to ticks.
The CDC aims to determine the symptoms and severity of the disease, where it is found, how people are being infected, and how to prevent infections.
CDC studies to date have shown that the Heartland virus is carried by lone star ticks, which are primarily found in the southeastern and eastern US.
Researchers hope additional studies can confirm whether ticks can spread the virus and reveal which other insects or animals may be involved in the transmission cycle. The CDC is also looking for the Heartland virus in other parts of the country to understand how widely it may be distributed.
“During the past 2 years, CDC has worked closely with state health departments, hospitals, and many experts from universities and other federal agencies to learn more about Heartland virus,” said Roger Nasci, PhD, chief of the CDC’s Arboviral Diseases Branch.
“By gathering information about the disease Heartland virus causes, and about how it’s spread to people, we hope to better understand the potential impact on the public’s health and how we can help protect people from this virus.”
The CDC developed the blood tests used to confirm the new cases of Heartland virus disease. CDC teams are working to further validate these tests and develop additional tests. The researchers hope to develop a diagnostic test that public health laboratories could use to test for the virus.
There is no specific treatment or vaccine for Heartland virus disease. However, supportive therapies such as intravenous fluids and fever reducers can relieve some symptoms of Heartland disease.
To reduce the risk of Heartland and other vector-borne diseases, the CDC recommends:
- Avoiding wooded and bushy areas with high grass and leaf litter
- Using insect repellent when outdoors
- Using products that contain permethrin on clothing
- Conducting a full-body tick check after spending time outdoors
- Bathing as soon as possible after coming indoors to wash off and more easily find any ticks
- Examining gear and pets, as ticks can “ride” into the home and attach to a person later.
For more information on the Heartland virus, visit the CDC website. ![]()
FDA approves factor for hemophilia B

The US Food and Drug Administration (FDA) has approved a recombinant factor IX Fc fusion protein (rFIXFc, Alprolix) for use in adults and children with hemophilia B.
The product is intended to help control, prevent, or reduce the frequency of bleeding episodes that can occur day-to-day in patients with hemophilia B, as well as manage bleeding in patients undergoing surgery.
rFIXFc is made by fusing factor IX to the Fc portion of the IgG1 protein. Scientists believe this enables the product to use a naturally occurring pathway to prolong the time the therapy remains in the body.
The FDA’s approval is the second worldwide approval of rFIXFc. The product was recently authorized for use in Canada.
Researchers evaluated the safety, efficacy, and pharmacokinetics of rFIXFc in the phase 3 B-LONG study, which was funded by the product’s developers, Biogen Idec and Sobi.
Investigators tested rFIXFc in 123 males with hemophilia B who were at least 12 years of age. The patients were assigned to 1 of 4 treatment arms: weekly prophylaxis, individualized-interval prophylaxis, on-demand treatment to control bleeding, and perioperative management.
The overall median annualized bleeding rates were 2.95 for the weekly prophylaxis arm, 1.38 for the individualized-interval prophylaxis arm, and 17.69 in the on-demand treatment arm.
The overall median dosing interval with individualized-interval prophylaxis was 12.5 days. During the last 6 months of the study, the median dosing interval was 13.8 days.
Of the patients who received rFIXFc for perioperative management, 85.7% required a single injection of the product to maintain hemostasis during their operation. The median dose was 90.9 IU/kg per injection.
Most patients required 1 to 2 injections of the product the day before and the day of surgery. And most required 2 to 3 injections from days 1 to 3 after surgery.
The most common adverse events associated with rFIXFc (an incidence of ≥ 5% in a pooled analysis of treatment arms 1, 2, and 3) were nasopharyngitis, influenza, arthralgia, upper respiratory tract infection, hypertension, and headache.
The results of this study were released by Biogen Idec and Sobi in September 2012, presented at ISTH 2013, and published in NEJM in December 2013. ![]()
Novel anticoagulants get nod in new AF guidelines
New guidelines for managing patients with nonvalvular atrial fibrillation recommend dabigatran, rivaroxaban, and apixaban, as well as warfarin, and call on physicians to use a more comprehensive stroke risk calculator.
"I think physicians are still learning how to use the newer anticoagulants, and this is something that will require time," said Dr. Craig T. January, chair of the AF guidelines committee, assembled by the American College of Cardiology, the American Heart Association, and the Heart Rhythm Society.
The guidelines, published in Circulation and in the Journal of the American College of Cardiology, focus on nonvalvular AF and feature a detailed dosing chart organized by anticoagulant type and renal function, which is impaired in up to 20% of those with AF.
"The goal was to create a straightforward chart on how to use these drugs," said Dr. January, a clinician/scientist with the University of Wisconsin School of Medicine and Public Health, Madison.

Dabigatran (Pradaxa) and rivaroxaban (Xarelto) are not recommended for AF patients with nonvalvular disease and end-stage kidney disease, either on or off dialysis, because of a lack of evidence from clinical trials regarding the balance of risks and benefits.
No recommendation was made for apixaban (Eliquis) in patients with severe or end-stage renal impairment, because of a lack of published data, although a recent secondary analysis of the ARISTOTLE (Apixaban for the Prevention of Stroke in Subjects With Atrial Fibrillation) trial suggests the direct factor Xa inhibitor provides the greatest reduction in major bleeding in patients with impaired renal function compared with warfarin (Eur. Heart J. 2012;33:2821-30).
The guidelines advise clinicians to evaluate renal function prior to initiating any of the direct thrombin or factor Xa inhibitors, and to reevaluate at least annually and when clinically indicated.
Previously, warfarin (Coumadin) was the only recommended anticoagulant in the 2006 guidelines. It’s admittedly cheaper, but the guidelines note that the novel anticoagulants eliminate dietary limitations and the need for repeated international normalized ratio (INR) monitoring, and have more predictable pharmacological profiles and fewer drug-drug interactions.
The oral agents have revolutionized the treatment of AF since entering the market in the past few years, but by no means replace warfarin.
For patients with nonvalvular AF who are well controlled and satisfied with warfarin therapy, the guidelines say, "It is not necessary to change to one of the newer agents," Dr. January observed.
Warfarin should also be used for valvular AF to manage patients with a mechanical heart valve or hemodynamically significant mitral stenosis because these populations were excluded from all three major trials – RE-LY (Randomized Evaluation of Long Term Anticoagulant Therapy With Dabigatran Etexilate), ROCKET-AF (An Efficacy and Safety Study of Rivaroxaban With Warfarin for the Prevention of Stroke and Non-Central Nervous System Systemic Embolism in Patients With Non-Valvular Atrial Fibrillation), and ARISTOTLE – that led to the approval of the newer anticoagulants.
Dabigatran is specifically not recommended for patients with a mechanical valve because of the potential for harm, which was recently recognized by the Food and Drug Administration.
The document includes a section on dose interruption and bridging therapy, which in part reflects the fact that the new oral agents carry a black box warning from the FDA because discontinuation can increase the risk of thromboembolism. In addition, reversal agents are in development, but they are not currently available should immediate reversal be needed.
The new recommendations will elicit discussion, but are not expected to be controversial like the updated cholesterol management guidelines recently released by the American College of Cardiology and the American Heart Association, Dr. January said.
Another noteworthy change is the diminished use of aspirin in preventing stroke. "Most of the published data have shown that aspirin is not as effective as full anticoagulation and that aspirin itself in many trials has little benefit. This was a point of a lot of discussion in the committee," he said.
To calculate stroke risk, the guidelines recommend that clinicians use the CHA2DS2-VASc (Congestive heart failure, Hypertension, Age 75 or older (doubled), Diabetes mellitus, Prior Stroke or TIA or thromboembolism (doubled), Vascular disease, Age 65 to 74 years, Sex category female) calculator because it has a broader score range (0 to 9) and includes a larger number of risk factors than the older CHADS2 score.
"What the CHA2DS2-VASc provides is better discrimination for patients at the lower end of risk," Dr. January said. "I think there was uniform agreement in the committee that the CHA2DS2-VASc was the preferred risk calculator and that we should move on from the CHADS2 score.
"The CHA2DS2-VASc score is an interesting score because, depending on how you implement it, women can never have a score of zero," he added. "In fact, there are data out of Europe in the last year that the risk of stroke in women [with AF] is really quite low for those under 65."
As with the 2006 guidelines, the new document emphasizes an increased role for using radiofrequency ablation in the treatment of AF. This reflects the continued evolution of the technology as an AF therapy, Dr. January said. As a result, RF ablation will be increasingly used for AF treatment, particularly in symptomatic patients.
The work of the writing committee was supported exclusively by the American College of Cardiology, the American Heart Association, and the Heart Rhythm Society without commercial support. Dr. January and his coauthors reported no relevant industry relationships.
New guidelines for managing patients with nonvalvular atrial fibrillation recommend dabigatran, rivaroxaban, and apixaban, as well as warfarin, and call on physicians to use a more comprehensive stroke risk calculator.
"I think physicians are still learning how to use the newer anticoagulants, and this is something that will require time," said Dr. Craig T. January, chair of the AF guidelines committee, assembled by the American College of Cardiology, the American Heart Association, and the Heart Rhythm Society.
The guidelines, published in Circulation and in the Journal of the American College of Cardiology, focus on nonvalvular AF and feature a detailed dosing chart organized by anticoagulant type and renal function, which is impaired in up to 20% of those with AF.
"The goal was to create a straightforward chart on how to use these drugs," said Dr. January, a clinician/scientist with the University of Wisconsin School of Medicine and Public Health, Madison.
Dabigatran (Pradaxa) and rivaroxaban (Xarelto) are not recommended for AF patients with nonvalvular disease and end-stage kidney disease, either on or off dialysis, because of a lack of evidence from clinical trials regarding the balance of risks and benefits.
No recommendation was made for apixaban (Eliquis) in patients with severe or end-stage renal impairment, because of a lack of published data, although a recent secondary analysis of the ARISTOTLE (Apixaban for the Prevention of Stroke in Subjects With Atrial Fibrillation) trial suggests the direct factor Xa inhibitor provides the greatest reduction in major bleeding in patients with impaired renal function compared with warfarin (Eur. Heart J. 2012;33:2821-30).
The guidelines advise clinicians to evaluate renal function prior to initiating any of the direct thrombin or factor Xa inhibitors, and to reevaluate at least annually and when clinically indicated.
Previously, warfarin (Coumadin) was the only recommended anticoagulant in the 2006 guidelines. It’s admittedly cheaper, but the guidelines note that the novel anticoagulants eliminate dietary limitations and the need for repeated international normalized ratio (INR) monitoring, and have more predictable pharmacological profiles and fewer drug-drug interactions.
The oral agents have revolutionized the treatment of AF since entering the market in the past few years, but by no means replace warfarin.
For patients with nonvalvular AF who are well controlled and satisfied with warfarin therapy, the guidelines say, "It is not necessary to change to one of the newer agents," Dr. January observed.
Warfarin should also be used for valvular AF to manage patients with a mechanical heart valve or hemodynamically significant mitral stenosis because these populations were excluded from all three major trials – RE-LY (Randomized Evaluation of Long Term Anticoagulant Therapy With Dabigatran Etexilate), ROCKET-AF (An Efficacy and Safety Study of Rivaroxaban With Warfarin for the Prevention of Stroke and Non-Central Nervous System Systemic Embolism in Patients With Non-Valvular Atrial Fibrillation), and ARISTOTLE – that led to the approval of the newer anticoagulants.
Dabigatran is specifically not recommended for patients with a mechanical valve because of the potential for harm, which was recently recognized by the Food and Drug Administration.
The document includes a section on dose interruption and bridging therapy, which in part reflects the fact that the new oral agents carry a black box warning from the FDA because discontinuation can increase the risk of thromboembolism. In addition, reversal agents are in development, but they are not currently available should immediate reversal be needed.
The new recommendations will elicit discussion, but are not expected to be controversial like the updated cholesterol management guidelines recently released by the American College of Cardiology and the American Heart Association, Dr. January said.
Another noteworthy change is the diminished use of aspirin in preventing stroke. "Most of the published data have shown that aspirin is not as effective as full anticoagulation and that aspirin itself in many trials has little benefit. This was a point of a lot of discussion in the committee," he said.
To calculate stroke risk, the guidelines recommend that clinicians use the CHA2DS2-VASc (Congestive heart failure, Hypertension, Age 75 or older (doubled), Diabetes mellitus, Prior Stroke or TIA or thromboembolism (doubled), Vascular disease, Age 65 to 74 years, Sex category female) calculator because it has a broader score range (0 to 9) and includes a larger number of risk factors than the older CHADS2 score.
"What the CHA2DS2-VASc provides is better discrimination for patients at the lower end of risk," Dr. January said. "I think there was uniform agreement in the committee that the CHA2DS2-VASc was the preferred risk calculator and that we should move on from the CHADS2 score.
"The CHA2DS2-VASc score is an interesting score because, depending on how you implement it, women can never have a score of zero," he added. "In fact, there are data out of Europe in the last year that the risk of stroke in women [with AF] is really quite low for those under 65."
As with the 2006 guidelines, the new document emphasizes an increased role for using radiofrequency ablation in the treatment of AF. This reflects the continued evolution of the technology as an AF therapy, Dr. January said. As a result, RF ablation will be increasingly used for AF treatment, particularly in symptomatic patients.
The work of the writing committee was supported exclusively by the American College of Cardiology, the American Heart Association, and the Heart Rhythm Society without commercial support. Dr. January and his coauthors reported no relevant industry relationships.
FROM CIRCULATION
Data source: Expert opinion.
Disclosures: The work of the writing committee was supported exclusively by the ACC, AHA, and HRS without commercial support. Dr. January and his coauthors reported no relevant industry relationships.

Anatomy for the laparoscopic surgeon
CASE: OBESE PATIENT REQUESTS TOTAL LAPAROSCOPIC HYSTERECTOMY
A 45-year-old woman (G2P2), who delivered both children by cesarean section, schedules an office visit for a complaint of abnormal uterine bleeding. She is obese, with a body mass index (BMI) of 35 kg/m2, and has an enlarged uterus of approximately 14 weeks’ size with minimal descensus. An earlier trial of hormone therapy failed to provide relief. After you counsel her extensively about her treatment options, she elects to undergo total laparoscopic hysterectomy.
What anatomy would you review to help ensure the procedure’s success?
Although the vaginal route is preferred for hysterectomy, total laparoscopic hysterectomy is another minimally invasive option that offers lower morbidity and a shorter hospital stay than the abdominal approach.1 Perhaps more than any other variable, the key to safe, efficient, and effective laparoscopic surgery is a comprehensive knowledge of anatomy. For example, a thorough understanding of the anatomy of the anterior abdominal wall is critical to laparoscopic entry.2,3 Also, pelvic anatomy visualized two-dimensionally under magnification during traditional laparoscopy can look very different than it does during conventional surgery, due to the effects of the pneumoperitoneum, steep Trendelenburg position, and/or the use of uterine manipulators.3
The abdominal cavity is traditionally divided into nine regions. Regardless of the quadrants chosen for laparoscopic access, thorough knowledge of the relevant surface anatomy increases patient safety during surgery (FIGURE 1).
PRIMARY PORT PLACEMENT
Primary port placement, including insertion of the Veress needle, accounts for approximately 40% of laparoscopic complications.4 To help minimize complications, surgeons should ensure that the operating table remains level during placement. As the patient is moved into the Trendelenburg position, the great vessels are more in line with the 45-degree angle that most surgeons use when placing their Veress needle and primary trocar, which can lead to an increased risk of injury. Thus, proper positioning in relationship to anatomy is critical to successful laparoscopic surgery.
Veress or closed technique
Most gynecologists employ the closed method or Veress needle approach to establish pneumoperitoneum.5,6 an initial intraperitoneal pressure below 10 mm Hg, regardless of a woman’s body habitus, height, or age, indicates correct placement of the Veress needle.7,8 Vilos and colleagues demonstrated that Veress intraperitoneal pressure correlates positively with a woman’s weight and BMI and correlates negatively with her parity.8
Hasson or open technique
During the Hasson or open technique, many surgeons use the umbilical ring to gain entry into the abdominal cavity.9 Many view the umbilical ring as a window into the anterior abdominal wall, through which access to the peritoneal cavity can be achieved, but it can also be a site of hernia development.10 The shape of the umbilical ring can vary, appearing round or oval, but it also can be obliterated, slitted, or covered completely by a connecting band, which can result in more difficult laparoscopic entry.10
Palmer’s point
In the 1940s, the French gynecologist Raoul Palmer advocated placing the laparoscope at a point in the left midclavicular line, approximately 3 cm caudal to the costal margin, because visceral-parietal adhesions rarely were found there. Gynecologists still favor this entry site when intra-abdominal adhesions are likely, especially in patients with a history of significant adhesions or multiple previous pelvic surgeries.11 In a study published by Agarwala and colleagues, which included 504 patients with intra-abdominal adhesions, left upper quadrant entry was found to be safe with a complication rate as low as 0.39%.12
If supraumbilical or left upper quadrant port sites are used, the surface anatomy of the spleen and stomach become relevant. The portion of the stomach that is in contact with the abdominal wall is represented roughly by a triangular area extending between the tip of the 10th left costal cartilage, the tip of the ninth right cartilage, and the end of the eighth left costal cartilage.13 The size and shape of the stomach differs by position. Some authors recommend emptying the stomach using a nasogastric or oral gastric tube prior to port insertion to avoid injury.12
The spleen can be mapped using the 10th rib as representing its long axis; vertically, the spleen is situated between the upper border of the ninth and lower border of the 11th ribs.13 In patients without splenic enlargement, the spleen should not be found below the rib cage.
Related article: Tips and techniques for robot-assisted laparoscopic myomectomy Arnold P. Advincula, MD, and Bich-Van Tran, MD (Surgical Technique, August 2013)
CASE CONTINUED
On the day of surgery, your patient is brought to the operating room. you use the Veress needle for insufflation. Your opening pressure is 5 mm Hg. You know that an opening pressure of less than 10 mm Hg indicates proper placement, so you continue on to place a 10-mm port. After inserting the primary umbilical port through the umbilicus, you decide to insert secondary ports through lower quadrants. Upon insertion, you note active bleeding at one of the secondary port sites.
How do you proceed?
VASCULAR ANATOMY OF THE ANTERIOR ABDOMINAL WALL
Understanding anterior abdominal wall anatomy and the course of the deep inferior and superficial epigastric vessels is essential to the safe placement of secondary laparoscopic ports. epigastric vessels are the most commonly injured vessels during laparoscopic surgery.14,15 The inferior epigastric vessels originate at the external iliac, immediately above the inguinal ligament. They course medially to the round ligament and travel beneath the lateral third of the rectus abdominis muscle. Using anterior abdominal wall landmarks, the inferior epigastric artery can be identified midway between the anterior superior iliac spine and the pubic symphysis as it travels toward the umbilicus. The inferior epigastric artery also serves as the lateral boundary of Hesselbach’s triangle; the other two boundaries are the lateral edge of the rectus abdominis and the medial aspect of the inguinal ligament (FIGURE 2).13
As the inferior epigastric vessels course cranially, the distance from the midline
decreases. the average distance from the midline at the pubis is approximately
7.5 cm. At the umbilicus, it is approximately 4.6 cm.16,17 The most efficient way to identify laparoscopically the inferior epigastric vessel is to first identify the round ligament. This can be done using a uterine manipulator to deviate the uterus to the contralateral side. Then observe the course of the inferior epigastric vessel just medial to the entry of the round ligament into the inguinal canal. The laparoscopic surgeon can then follow the course of the inferior epigastric vessels to determine the safest location for placement of secondary ports. Transillumination can identify the superficial epigastric vessels, which course within the subcutaneous tissue of the anterior abdominal wall, although it doesn’t identify the deep inferior epigastric vessels that are beneath the lateral third of the rectus muscle. The superficial epigastric vessels follow a course similar to that of the deep inferior epigastric vessels, however, and can serve as a surrogate to guide safe placement of accessory ports.17
Landmarks of the anterior abdominal wall during laparoscopic visualization can also guide placement of secondary ports. The median umbilical fold, which is the peritoneal covering of the umbilical ligament/urachus, travels between the bladder and umbilicus in the midline anterior abdominal wall. Immediately lateral is the medial umbilical fold, which is the peritoneal covering of the obliterated umbilical artery, a branch of the superior vesical artery that comes off the anterior trunk of the internal iliac artery.2 The lateral umbilical folds are lateral to the medial umbilical fold and are the peritoneal covering of the deep inferior epigastric vessels. Identification of these anterior abdominal wall landmarks can assist the surgeon in placing lateral ports so as to avoid injury to these vessels.
Related article: How to avoid major vessel injury during gynecologic laparoscopy Michael Baggish, MD (Surgical Technique, August 2012)
MAJOR RETROPERITONEAL VESSELS
Although major retroperitoneal vessel injury is uncommon, occurring in only 0.3% to 1.0% of laparoscopic surgeries, it has the potential to be catastrophic.18 Therefore, an understanding of the surface anatomy of the major vessels is essential for midline port placement.
The abdominal aorta begins about 4 cm above the transpyloric line and extends to
2 cm inferior and to the left of the umbilicus, or, more accurately, to a point 2 cm left of the middle line on a line that passes through the highest points of the iliac crests. The point of termination of the abdominal aorta corresponds to the level of the fourth lumbar vertebra; a line drawn from it to a point midway between the anterior superior iliac spine and the symphysis pubis indicates the common and external iliac arteries. The common iliac is represented by the upper third of this line and the external iliac, by the remaining two-thirds.13
Related article: How to avoid intestinal and urinary tract injuries during gynecologic laparoscopy Michael Baggish, MD (Surgical Technique, October 2012)
OBESITY AND LAPAROSCOPIC SURGERY
Over two-thirds of the US adult population is now classified as overweight or obese.19 Research has shown that, compared with abdominal hysterectomy, laparoscopic surgery entails a shorter hospital stay, less blood loss, and fewer abdominal wall and wound infections, which are important advantages for this particular population.20
Laparoscopic entry can be particularly challenging in the obese patient. A study by Hurd and colleagues showed that the mean umbilical location was 2.4 cm caudal to the bifurcation of the aorta in the overweight population and 2.9 cm caudal in the obese population.21 Because the bifurcation of the aorta is more cephalad to the umbilicus in overweight and obese patients, the laparoscopic surgeon can introduce the Veress needle at a steeper angle and more perpendicular to the abdominal wall than for a thinner patient (FIGURE 3).
RELEVANT NERVES OF THE ANTERIOR ABDOMINAL WALL
The iliohypogastric and ilioinguinal nerves are also at risk for injury with laterally placed trocars through direct trauma or nerve entrapment. These nerves emerge from the T12 to L1 and L1 to L2 regions, respectively, and course through the muscles of the anterior abdominal wall. Specifically, the iliohypogastric nerve penetrates the fascia of the internal oblique muscle, and the ilioinguinal nerve penetrates the fascia of the transverse abdominus muscle.22 Fascial closure at lateral port sites can also increase the risk of injury to those nerves (FIGURE 4).23
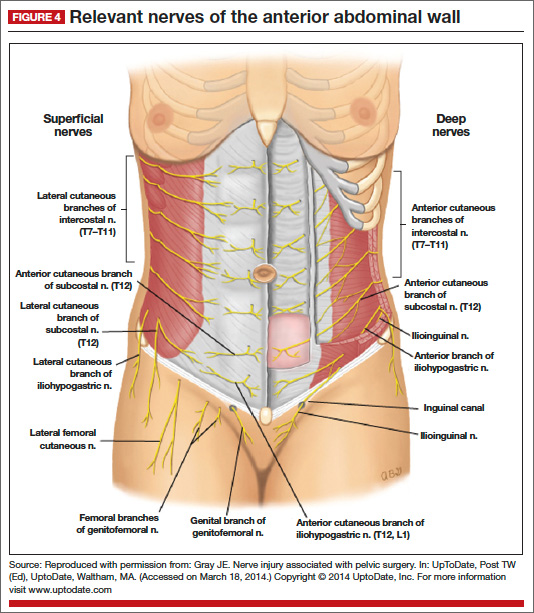
CASE CONTINUED
As you continue your case, you have had to replace your right lower quadrant port several times. During the last insertion, you notice that you have an enlarging abdominal wall hematoma. You suspect that you have injured the inferior epigastric vessel.
How should it be repaired?
HOW TO PREVENT AND REPAIR INJURED DEEP INFERIOR EPIGASTRIC VESSELS
A thorough knowledge of anatomy is the most effective way to prevent these types of injuries. The use of bladeless radially expanding trocars and smooth conical-tip trocars that push the vessels away may result in fewer port-site bleeding complications and injuries than large pyramidal or cutting trocars.24–26 It is important to inspect all ports sites at the end of any laparoscopic procedure because the port itself can tamponade an injured anterior abdominal wall vessel and obscure an injury.
If an injury occurs, leave the trocars in place until a plan for repair is devised. First, start by compressing the bleeding point by moving the cannula against it. Because there are two bleeding ends, the vessels must be sutured cephalad and caudad to the site of injury. The use of electrosurgical desiccation is usually less successful.25 In obese patients we prefer to suture-ligate the bleeder intracorporeally or use a laparoscopic port closure device. In thin and pediatric patients, percutaneous suture ligation can be done easily.
Another option to control bleeding at the cannula site is placement of a Foley catheter to tamponade the vessel using a large balloon placed on tension.27 If abdominal loop sutures are used to control bleeding, the sutures typically are left intact for 8 hours prior to removal.25 If identification of the bleeding point is difficult, percutaneous placement of a suture ligature over a roll of gauze or using a Foley catheter to tamponade the bleeder can be helpful.
CASE RESOLVED
A laparoscopic port closure device is used to suture ligate the bleeding vessel. Hemostasis is achieved and the laparoscopic hysterectomy is completed without further complications.
Tell us what you think!
Drop us a line and let us know what you think about this or other current articles, which topics you'd like to see covered in future issues, and what challenges you face in daily practice. Share your thoughts by sending a letter to [email protected]. Please include the city and state in which you practice. Stay in touch! Your feedback is important to us!
- AAGL position statement: Route of hysterectomy to treat benign uterine disease. J Minim Invasive Gynecol. 2011;18(1):1–3.
- Tokar B, Yucel F. Anatomical variations of medial umbilical ligament: clinical significance in laparoscopic exploration of children. Pediatr Surg Int. 2009;25(12):1077–1080.
- Nezhat CH, Nezhat F, Brill AI, Nezhat C. Normal variations of abdominal and pelvic anatomy evaluated at laparoscopy. Obstet Gynecol. 1999;94(2):238–242.
- Fuller J, Ashar BS, Carey-Corrado J. Trocar-associated injuries and fatalities: an analysis of 1,399 reports to the FDA. J Minim Invasive Gynecol. 2005;12(4):302–307.
- Jansen FW, Kolkman W, Bakkum EA, de Kroon CD, Trimbos-Kemper TC, Trimbos JB. Complications of laparoscopy: An inquiry about closed- versus open-entry technique. Am J Obstet Gynecol. 2004;190(3):634–638.
- Yuzpe AA. Pneumoperitoneum needle and trocar injuries in laparoscopy. A survey on possible contributing factors and prevention. J Reprod Med. 1990;35(5):485–490.
- Vilos GA, Vilos AG. Safe laparoscopic entry guided by Veress needle CO2 insufflation pressure. J Am Assoc Gynecol Laparosc. 2003;10(3):415–420.
- Vilos AG, Vilos GA, Abu-Rafea B, Hollett-Caines J, Al-Omran M. Effect of body habitus and parity on the initial Veress intraperitoneal CO2 insufflation pressure during laparoscopic access in women. J Minim Invasive Gynecol. 2006;13(2):108–113.
- Hasson HM. A modified instrument and method for laparoscopy. Am J Obstet Gynecol. 1971;110(6):886–887.
- Oh CS, Won HS, Kwon CH, Chung IH. Morphologic variations of the umbilical ring, umbilical ligaments and ligamentum teres hepatis. Yonsei Med J. 2008;49(6):1004–1007.
- Chandler JG, Corson SL, Way LW. Three spectra of laparoscopic entry access injuries. J Am Coll Surg. 2001;192(4):478–491.
- Agarwala N, Liu CY. Safe entry techniques during laparoscopy: left upper quadrant entry using the ninth intercostal space—a review of 918 procedures. J Minim Invasive Gynecol. 2005;12(1):55–61.
- Williams PL, Warwick R, eds. Gray’s anatomy. 36th ed. Philadelphia, PA: Churchill Livingstone; 1980.
- Hurd WW, Pearl ML, DeLancey JO, Quint EH, Garnett B, Bude RO. Laparoscopic injury of abdominal wall blood vessels: A report of three cases. Obstet Gynecol. 1993;82(4 Pt 2 Suppl):673–676.
- Lin P, Grow DR. Complications of laparoscopy. Strategies for prevention and cure. Obstet Gynecol Clin North Am. 1999;26(1):23–38, v.
- Saber AA, Meslemani AM, Davis R, Pimentel R. Safety zones for anterior abdominal wall entry during laparoscopy: A CT scan mapping of epigastric vessels. Ann Surg. 2004;239(2):182–185.
- Hurd WW, Bude RO, DeLancey JO, Newman JS. The location of abdominal wall blood vessels in relationship to abdominal landmarks apparent at laparoscopy. Am J Obstet Gynecol. 1994;171(3):642–646.
- Sandadi S, Johannigman JA, Wong VL, Blebea J, Altose MD, Hurd WW. Recognition and management of major vessel injury during laparoscopy. J minim invasive gynecol. 2010;17(6):692–702.
- Wang Y, Beydoun MA. The obesity epidemic in the United States—gender, age, socioeconomic, racial/ethnic, and geographic characteristics: A systematic review and meta-regression analysis. Epidemiol rev. 2007;29:6–28.
- Nieboer TE, Johnson N, Lethaby A, et al. Surgical approach to hysterectomy for benign gynaecological disease. Cochrane database syst rev. 2009;(3):CD003677.
- Hurd WW, Bude RO, DeLancey JO, Pearl ML. The relationship of the umbilicus to the aortic bifurcation: implications for laparoscopic technique. Obstet gynecol. 1992;80(1):48–51.
- Clarke-Pearson DL, Geller EJ. Complications of hysterectomy. Obstet gynecol. 2013;121(3):654–673.
- Shin JH, Howard FM. Abdominal wall nerve injury during laparoscopic gynecologic surgery: incidence, risk factors, and treatment outcomes. J minim invasive gynecol. 2012;19(4):448–453.
- Bhoyrul S, Payne J, Steffes B, Swanstrom L, Way LW. A randomized prospective study of radially expanding trocars in laparoscopic surgery. J gastrointest surg. 2000;4(4):392–397.
- Shirk GJ, Johns A, Redwine DB. Complications of laparoscopic surgery: How to avoid them and how to repair them. J minim invasive gynecol. 2006;13(4):352–361.
- Tews G, Arzt W, Bohaumilitzky T, Füreder R, Frölich H. Significant reduction of operational risk in laparoscopy through the use of a new blunt trocar. Surg gynecol obstet. 1991;173(1):67–68.
- Najmaldin A, Guillou P. A guide to laparoscopic surgery. 1st ed. Wiley-Blackwell; 1998.

Emad Mikhail, MD, is Assistant Professor, Department of Obstetrics and Gynecology, University of South Florida Morsani College of Medicine (MCM), Tampa, Florida.

Lauren Scott, MD, is Fellow, Division of Female Pelvic Medicine and Reconstructive Surgery, Department of Obstetrics and Gynecology, University of South Florida MCM.

Stuart Hart, MD, MS, is Associate Professor, Female Pelvic Medicine and Reconstructive Surgery, Director of the Tampa Bay Research and Innovation Center (TBRIC), and Director of the Center for the Advancement of Minimally Invasive Pelvic Surgery (CAMPS) at the Center for Advanced Medical Learning and Simulation (CAMLS), University of South Florida MCM.
Dr. Mikhail and Dr. Scott report no financial relationships relevant to this article. Dr. Hart reports being a speaker and consultant for Covidien, Boston Scientific, and Stryker and receiving research funding from Cooper Surgical.
Emad Mikhail, MD, is Assistant Professor, Department of Obstetrics and Gynecology, University of South Florida Morsani College of Medicine (MCM), Tampa, Florida.
Lauren Scott, MD, is Fellow, Division of Female Pelvic Medicine and Reconstructive Surgery, Department of Obstetrics and Gynecology, University of South Florida MCM.
Stuart Hart, MD, MS, is Associate Professor, Female Pelvic Medicine and Reconstructive Surgery, Director of the Tampa Bay Research and Innovation Center (TBRIC), and Director of the Center for the Advancement of Minimally Invasive Pelvic Surgery (CAMPS) at the Center for Advanced Medical Learning and Simulation (CAMLS), University of South Florida MCM.
Dr. Mikhail and Dr. Scott report no financial relationships relevant to this article. Dr. Hart reports being a speaker and consultant for Covidien, Boston Scientific, and Stryker and receiving research funding from Cooper Surgical.
CASE: OBESE PATIENT REQUESTS TOTAL LAPAROSCOPIC HYSTERECTOMY
A 45-year-old woman (G2P2), who delivered both children by cesarean section, schedules an office visit for a complaint of abnormal uterine bleeding. She is obese, with a body mass index (BMI) of 35 kg/m2, and has an enlarged uterus of approximately 14 weeks’ size with minimal descensus. An earlier trial of hormone therapy failed to provide relief. After you counsel her extensively about her treatment options, she elects to undergo total laparoscopic hysterectomy.
What anatomy would you review to help ensure the procedure’s success?
Although the vaginal route is preferred for hysterectomy, total laparoscopic hysterectomy is another minimally invasive option that offers lower morbidity and a shorter hospital stay than the abdominal approach.1 Perhaps more than any other variable, the key to safe, efficient, and effective laparoscopic surgery is a comprehensive knowledge of anatomy. For example, a thorough understanding of the anatomy of the anterior abdominal wall is critical to laparoscopic entry.2,3 Also, pelvic anatomy visualized two-dimensionally under magnification during traditional laparoscopy can look very different than it does during conventional surgery, due to the effects of the pneumoperitoneum, steep Trendelenburg position, and/or the use of uterine manipulators.3
The abdominal cavity is traditionally divided into nine regions. Regardless of the quadrants chosen for laparoscopic access, thorough knowledge of the relevant surface anatomy increases patient safety during surgery (FIGURE 1).
PRIMARY PORT PLACEMENT
Primary port placement, including insertion of the Veress needle, accounts for approximately 40% of laparoscopic complications.4 To help minimize complications, surgeons should ensure that the operating table remains level during placement. As the patient is moved into the Trendelenburg position, the great vessels are more in line with the 45-degree angle that most surgeons use when placing their Veress needle and primary trocar, which can lead to an increased risk of injury. Thus, proper positioning in relationship to anatomy is critical to successful laparoscopic surgery.
Veress or closed technique
Most gynecologists employ the closed method or Veress needle approach to establish pneumoperitoneum.5,6 an initial intraperitoneal pressure below 10 mm Hg, regardless of a woman’s body habitus, height, or age, indicates correct placement of the Veress needle.7,8 Vilos and colleagues demonstrated that Veress intraperitoneal pressure correlates positively with a woman’s weight and BMI and correlates negatively with her parity.8
Hasson or open technique
During the Hasson or open technique, many surgeons use the umbilical ring to gain entry into the abdominal cavity.9 Many view the umbilical ring as a window into the anterior abdominal wall, through which access to the peritoneal cavity can be achieved, but it can also be a site of hernia development.10 The shape of the umbilical ring can vary, appearing round or oval, but it also can be obliterated, slitted, or covered completely by a connecting band, which can result in more difficult laparoscopic entry.10
Palmer’s point
In the 1940s, the French gynecologist Raoul Palmer advocated placing the laparoscope at a point in the left midclavicular line, approximately 3 cm caudal to the costal margin, because visceral-parietal adhesions rarely were found there. Gynecologists still favor this entry site when intra-abdominal adhesions are likely, especially in patients with a history of significant adhesions or multiple previous pelvic surgeries.11 In a study published by Agarwala and colleagues, which included 504 patients with intra-abdominal adhesions, left upper quadrant entry was found to be safe with a complication rate as low as 0.39%.12
If supraumbilical or left upper quadrant port sites are used, the surface anatomy of the spleen and stomach become relevant. The portion of the stomach that is in contact with the abdominal wall is represented roughly by a triangular area extending between the tip of the 10th left costal cartilage, the tip of the ninth right cartilage, and the end of the eighth left costal cartilage.13 The size and shape of the stomach differs by position. Some authors recommend emptying the stomach using a nasogastric or oral gastric tube prior to port insertion to avoid injury.12
The spleen can be mapped using the 10th rib as representing its long axis; vertically, the spleen is situated between the upper border of the ninth and lower border of the 11th ribs.13 In patients without splenic enlargement, the spleen should not be found below the rib cage.
Related article: Tips and techniques for robot-assisted laparoscopic myomectomy Arnold P. Advincula, MD, and Bich-Van Tran, MD (Surgical Technique, August 2013)
CASE CONTINUED
On the day of surgery, your patient is brought to the operating room. you use the Veress needle for insufflation. Your opening pressure is 5 mm Hg. You know that an opening pressure of less than 10 mm Hg indicates proper placement, so you continue on to place a 10-mm port. After inserting the primary umbilical port through the umbilicus, you decide to insert secondary ports through lower quadrants. Upon insertion, you note active bleeding at one of the secondary port sites.
How do you proceed?
VASCULAR ANATOMY OF THE ANTERIOR ABDOMINAL WALL
Understanding anterior abdominal wall anatomy and the course of the deep inferior and superficial epigastric vessels is essential to the safe placement of secondary laparoscopic ports. epigastric vessels are the most commonly injured vessels during laparoscopic surgery.14,15 The inferior epigastric vessels originate at the external iliac, immediately above the inguinal ligament. They course medially to the round ligament and travel beneath the lateral third of the rectus abdominis muscle. Using anterior abdominal wall landmarks, the inferior epigastric artery can be identified midway between the anterior superior iliac spine and the pubic symphysis as it travels toward the umbilicus. The inferior epigastric artery also serves as the lateral boundary of Hesselbach’s triangle; the other two boundaries are the lateral edge of the rectus abdominis and the medial aspect of the inguinal ligament (FIGURE 2).13
As the inferior epigastric vessels course cranially, the distance from the midline
decreases. the average distance from the midline at the pubis is approximately
7.5 cm. At the umbilicus, it is approximately 4.6 cm.16,17 The most efficient way to identify laparoscopically the inferior epigastric vessel is to first identify the round ligament. This can be done using a uterine manipulator to deviate the uterus to the contralateral side. Then observe the course of the inferior epigastric vessel just medial to the entry of the round ligament into the inguinal canal. The laparoscopic surgeon can then follow the course of the inferior epigastric vessels to determine the safest location for placement of secondary ports. Transillumination can identify the superficial epigastric vessels, which course within the subcutaneous tissue of the anterior abdominal wall, although it doesn’t identify the deep inferior epigastric vessels that are beneath the lateral third of the rectus muscle. The superficial epigastric vessels follow a course similar to that of the deep inferior epigastric vessels, however, and can serve as a surrogate to guide safe placement of accessory ports.17
Landmarks of the anterior abdominal wall during laparoscopic visualization can also guide placement of secondary ports. The median umbilical fold, which is the peritoneal covering of the umbilical ligament/urachus, travels between the bladder and umbilicus in the midline anterior abdominal wall. Immediately lateral is the medial umbilical fold, which is the peritoneal covering of the obliterated umbilical artery, a branch of the superior vesical artery that comes off the anterior trunk of the internal iliac artery.2 The lateral umbilical folds are lateral to the medial umbilical fold and are the peritoneal covering of the deep inferior epigastric vessels. Identification of these anterior abdominal wall landmarks can assist the surgeon in placing lateral ports so as to avoid injury to these vessels.
Related article: How to avoid major vessel injury during gynecologic laparoscopy Michael Baggish, MD (Surgical Technique, August 2012)
MAJOR RETROPERITONEAL VESSELS
Although major retroperitoneal vessel injury is uncommon, occurring in only 0.3% to 1.0% of laparoscopic surgeries, it has the potential to be catastrophic.18 Therefore, an understanding of the surface anatomy of the major vessels is essential for midline port placement.
The abdominal aorta begins about 4 cm above the transpyloric line and extends to
2 cm inferior and to the left of the umbilicus, or, more accurately, to a point 2 cm left of the middle line on a line that passes through the highest points of the iliac crests. The point of termination of the abdominal aorta corresponds to the level of the fourth lumbar vertebra; a line drawn from it to a point midway between the anterior superior iliac spine and the symphysis pubis indicates the common and external iliac arteries. The common iliac is represented by the upper third of this line and the external iliac, by the remaining two-thirds.13
Related article: How to avoid intestinal and urinary tract injuries during gynecologic laparoscopy Michael Baggish, MD (Surgical Technique, October 2012)
OBESITY AND LAPAROSCOPIC SURGERY
Over two-thirds of the US adult population is now classified as overweight or obese.19 Research has shown that, compared with abdominal hysterectomy, laparoscopic surgery entails a shorter hospital stay, less blood loss, and fewer abdominal wall and wound infections, which are important advantages for this particular population.20
Laparoscopic entry can be particularly challenging in the obese patient. A study by Hurd and colleagues showed that the mean umbilical location was 2.4 cm caudal to the bifurcation of the aorta in the overweight population and 2.9 cm caudal in the obese population.21 Because the bifurcation of the aorta is more cephalad to the umbilicus in overweight and obese patients, the laparoscopic surgeon can introduce the Veress needle at a steeper angle and more perpendicular to the abdominal wall than for a thinner patient (FIGURE 3).
RELEVANT NERVES OF THE ANTERIOR ABDOMINAL WALL
The iliohypogastric and ilioinguinal nerves are also at risk for injury with laterally placed trocars through direct trauma or nerve entrapment. These nerves emerge from the T12 to L1 and L1 to L2 regions, respectively, and course through the muscles of the anterior abdominal wall. Specifically, the iliohypogastric nerve penetrates the fascia of the internal oblique muscle, and the ilioinguinal nerve penetrates the fascia of the transverse abdominus muscle.22 Fascial closure at lateral port sites can also increase the risk of injury to those nerves (FIGURE 4).23
CASE CONTINUED
As you continue your case, you have had to replace your right lower quadrant port several times. During the last insertion, you notice that you have an enlarging abdominal wall hematoma. You suspect that you have injured the inferior epigastric vessel.
How should it be repaired?
HOW TO PREVENT AND REPAIR INJURED DEEP INFERIOR EPIGASTRIC VESSELS
A thorough knowledge of anatomy is the most effective way to prevent these types of injuries. The use of bladeless radially expanding trocars and smooth conical-tip trocars that push the vessels away may result in fewer port-site bleeding complications and injuries than large pyramidal or cutting trocars.24–26 It is important to inspect all ports sites at the end of any laparoscopic procedure because the port itself can tamponade an injured anterior abdominal wall vessel and obscure an injury.
If an injury occurs, leave the trocars in place until a plan for repair is devised. First, start by compressing the bleeding point by moving the cannula against it. Because there are two bleeding ends, the vessels must be sutured cephalad and caudad to the site of injury. The use of electrosurgical desiccation is usually less successful.25 In obese patients we prefer to suture-ligate the bleeder intracorporeally or use a laparoscopic port closure device. In thin and pediatric patients, percutaneous suture ligation can be done easily.
Another option to control bleeding at the cannula site is placement of a Foley catheter to tamponade the vessel using a large balloon placed on tension.27 If abdominal loop sutures are used to control bleeding, the sutures typically are left intact for 8 hours prior to removal.25 If identification of the bleeding point is difficult, percutaneous placement of a suture ligature over a roll of gauze or using a Foley catheter to tamponade the bleeder can be helpful.
CASE RESOLVED
A laparoscopic port closure device is used to suture ligate the bleeding vessel. Hemostasis is achieved and the laparoscopic hysterectomy is completed without further complications.
Tell us what you think!
Drop us a line and let us know what you think about this or other current articles, which topics you'd like to see covered in future issues, and what challenges you face in daily practice. Share your thoughts by sending a letter to [email protected]. Please include the city and state in which you practice. Stay in touch! Your feedback is important to us!
- AAGL position statement: Route of hysterectomy to treat benign uterine disease. J Minim Invasive Gynecol. 2011;18(1):1–3.
- Tokar B, Yucel F. Anatomical variations of medial umbilical ligament: clinical significance in laparoscopic exploration of children. Pediatr Surg Int. 2009;25(12):1077–1080.
- Nezhat CH, Nezhat F, Brill AI, Nezhat C. Normal variations of abdominal and pelvic anatomy evaluated at laparoscopy. Obstet Gynecol. 1999;94(2):238–242.
- Fuller J, Ashar BS, Carey-Corrado J. Trocar-associated injuries and fatalities: an analysis of 1,399 reports to the FDA. J Minim Invasive Gynecol. 2005;12(4):302–307.
- Jansen FW, Kolkman W, Bakkum EA, de Kroon CD, Trimbos-Kemper TC, Trimbos JB. Complications of laparoscopy: An inquiry about closed- versus open-entry technique. Am J Obstet Gynecol. 2004;190(3):634–638.
- Yuzpe AA. Pneumoperitoneum needle and trocar injuries in laparoscopy. A survey on possible contributing factors and prevention. J Reprod Med. 1990;35(5):485–490.
- Vilos GA, Vilos AG. Safe laparoscopic entry guided by Veress needle CO2 insufflation pressure. J Am Assoc Gynecol Laparosc. 2003;10(3):415–420.
- Vilos AG, Vilos GA, Abu-Rafea B, Hollett-Caines J, Al-Omran M. Effect of body habitus and parity on the initial Veress intraperitoneal CO2 insufflation pressure during laparoscopic access in women. J Minim Invasive Gynecol. 2006;13(2):108–113.
- Hasson HM. A modified instrument and method for laparoscopy. Am J Obstet Gynecol. 1971;110(6):886–887.
- Oh CS, Won HS, Kwon CH, Chung IH. Morphologic variations of the umbilical ring, umbilical ligaments and ligamentum teres hepatis. Yonsei Med J. 2008;49(6):1004–1007.
- Chandler JG, Corson SL, Way LW. Three spectra of laparoscopic entry access injuries. J Am Coll Surg. 2001;192(4):478–491.
- Agarwala N, Liu CY. Safe entry techniques during laparoscopy: left upper quadrant entry using the ninth intercostal space—a review of 918 procedures. J Minim Invasive Gynecol. 2005;12(1):55–61.
- Williams PL, Warwick R, eds. Gray’s anatomy. 36th ed. Philadelphia, PA: Churchill Livingstone; 1980.
- Hurd WW, Pearl ML, DeLancey JO, Quint EH, Garnett B, Bude RO. Laparoscopic injury of abdominal wall blood vessels: A report of three cases. Obstet Gynecol. 1993;82(4 Pt 2 Suppl):673–676.
- Lin P, Grow DR. Complications of laparoscopy. Strategies for prevention and cure. Obstet Gynecol Clin North Am. 1999;26(1):23–38, v.
- Saber AA, Meslemani AM, Davis R, Pimentel R. Safety zones for anterior abdominal wall entry during laparoscopy: A CT scan mapping of epigastric vessels. Ann Surg. 2004;239(2):182–185.
- Hurd WW, Bude RO, DeLancey JO, Newman JS. The location of abdominal wall blood vessels in relationship to abdominal landmarks apparent at laparoscopy. Am J Obstet Gynecol. 1994;171(3):642–646.
- Sandadi S, Johannigman JA, Wong VL, Blebea J, Altose MD, Hurd WW. Recognition and management of major vessel injury during laparoscopy. J minim invasive gynecol. 2010;17(6):692–702.
- Wang Y, Beydoun MA. The obesity epidemic in the United States—gender, age, socioeconomic, racial/ethnic, and geographic characteristics: A systematic review and meta-regression analysis. Epidemiol rev. 2007;29:6–28.
- Nieboer TE, Johnson N, Lethaby A, et al. Surgical approach to hysterectomy for benign gynaecological disease. Cochrane database syst rev. 2009;(3):CD003677.
- Hurd WW, Bude RO, DeLancey JO, Pearl ML. The relationship of the umbilicus to the aortic bifurcation: implications for laparoscopic technique. Obstet gynecol. 1992;80(1):48–51.
- Clarke-Pearson DL, Geller EJ. Complications of hysterectomy. Obstet gynecol. 2013;121(3):654–673.
- Shin JH, Howard FM. Abdominal wall nerve injury during laparoscopic gynecologic surgery: incidence, risk factors, and treatment outcomes. J minim invasive gynecol. 2012;19(4):448–453.
- Bhoyrul S, Payne J, Steffes B, Swanstrom L, Way LW. A randomized prospective study of radially expanding trocars in laparoscopic surgery. J gastrointest surg. 2000;4(4):392–397.
- Shirk GJ, Johns A, Redwine DB. Complications of laparoscopic surgery: How to avoid them and how to repair them. J minim invasive gynecol. 2006;13(4):352–361.
- Tews G, Arzt W, Bohaumilitzky T, Füreder R, Frölich H. Significant reduction of operational risk in laparoscopy through the use of a new blunt trocar. Surg gynecol obstet. 1991;173(1):67–68.
- Najmaldin A, Guillou P. A guide to laparoscopic surgery. 1st ed. Wiley-Blackwell; 1998.
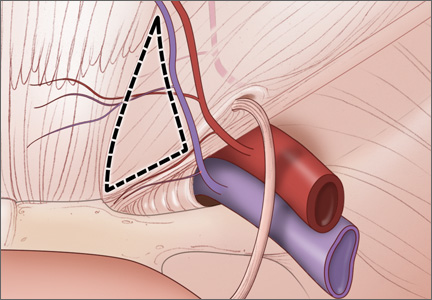
Elderly Woman Takes a Fall
ANSWER
The radiograph shows the lungs overall to be clear. There are some slight increased markings, perhaps suggestive of mild congestion, but no infiltrate or consolidation.
Of note is a small nodule within the middle portion of the left upper lobe that requires monitoring and further workup. Also, although it is incompletely imaged, there appears to be a fracture of the right humeral neck.
Additional imaging confirmed the fracture. Orthopedic consultation was obtained.
A 90-year-old woman is complaining of pain on the left side of her face, her chest wall, and right shoulder. Her family reports that she has fallen multiple times recently. On one occasion, there was brief loss of consciousness. History is significant for hypertension and osteoarthritis. Initial examination indicates she is awake, alert, oriented, and in no obvious distress. Vital signs are stable, and breath sounds are clear. There is tenderness on the left side of her face and decreased range of motion in her right shoulder, as well as localized tenderness. The hospitalist ordered a chest radiograph when the patient was admitted. What is your impression?
