User login
Inpatient Trainee Clinical Exposures
The clinical learning model in medical education, specifically in the third and fourth years of medical school and in residency and fellowship training, is driven by direct patient‐care experiences and complemented by mentorship and supervision provided by experienced physicians.[1] Despite the emphasis on experiential learning in medical school and graduate training, the ability of educators to quantify the clinical experiences of learners has been limited. Case logs, often self‐reported, are frequently required during educational rotations to attempt to measure clinical experience.[2] Logs have been utilized to document diagnoses, demographics, disease severity, procedures, and chief complaints.[3, 4, 5, 6] Unfortunately, self‐reported logs are vulnerable to delayed updates, misreported data, and unreliable data validation.[7, 8] Automated data collection has been shown to be more reliable than self‐reported logs.[8, 9]
The enhanced data mining methods now available allow educators to appraise learners' exposures during patient‐care interactions beyond just the diagnosis or chief complaint (eg, how many electrocardiograms do our learners evaluate during a cardiology rotation, how often do our learners gain experience prescribing a specific class of antibiotics, how many of the patients seen by our learners are diabetic). For example, a learner's interaction with a patient during an inpatient admission for community‐acquired pneumonia, at minimum, would include assessing of past medical history, reviewing outpatient medications and allergies, evaluating tests completed (chest x‐ray, complete blood count, blood cultures), prescribing antibiotics, and monitoring comorbidities. The lack of knowledge regarding the frequency and context of these exposures is a key gap in our understanding of the clinical experience of inpatient trainees. Additionally, there are no data on clinical exposures specific to team‐based inpatient learning. When a rotation is team‐based, the educational experience is not limited to the learner's assigned patients, and this arrangement allows for educational exposures from patients who are not the learner's primary assignments through experiences gained during team rounds, cross‐coverage assessments, and informal discussions of patient care.
In this study, we quantify the clinical exposures of learners on an acting internship (AI) rotation in internal medicine by utilizing the Veterans Affairs (VA) electronic medical records (EMR) as collected through the VA Veterans Integrated Service Network 10 Clinical Data Warehouse (CDW). The AI or subinternship is a medical school clinical rotation typically completed in the fourth year, where the learning experience is expected to mirror a 1‐month rotation of a first‐year resident.[10] The AI has historically been defined as an experiential curriculum, during which students assume many of the responsibilities and activities that they will manage as graduate medical trainees.[10, 11] The exposures of AI learners include primary diagnoses encountered, problem lists evaluated at the time of admission, medications prescribed, laboratory tests ordered, and radiologic imaging evaluated. We additionally explored the exposures of the AI learner's team to assess the experiences available through team‐based care.
METHODS
This study was completed at the Louis Stokes Veterans Affairs Medical Center (LSVAMC) in Cleveland, Ohio, which is an academic affiliate of the Case Western Reserve University School of Medicine. The study was approved by the LSVAMC institutional review board.
At the LSVAMC, the AI rotation in internal medicine is a 4‐week inpatient rotation for fourth‐year medical students, in which the student is assigned to an inpatient medical team consisting of an attending physician, a senior resident, and a combination of first‐year residents and acting interns. Compared to a first‐year resident, the acting intern is assigned approximately half of the number of admissions. The teams rounds as a group at least once per day. Acting interns are permitted to place orders and write notes in the EMR; all orders require a cosignature by a resident or attending physician to be released.
We identified students who rotated through the LSVAMC for an AI in internal medicine rotation from July 2008 to November 2011 from rotation records. Using the CDW, we queried student names and their rotation dates and analyzed the results using a Structured Query Language Query Analyzer. Each student's patient encounters during the rotation were identified. A patient encounter was defined as a patient for whom the student wrote at least 1 note titled either Medicine Admission Note or Medicine Inpatient Progress Note, on any of the dates during their AI rotation. We then counted the total number of notes written by each student during their rotation. A patient identifier is associated with each note. The number of distinct patient identifiers was also tallied to establish the total number of patients seen during the rotation by the individual student as the primary caregiver.
We associated each patient encounter with an inpatient admission profile that included patient admission and discharge dates, International Classification of Diseases, 9th Revision (ICD‐9) diagnosis codes, and admitting specialty. Primary diagnosis codes were queried for each admission and were counted for individual students and in aggregate. We tallied both the individual student and aggregate patient medications prescribed during the dates of admission and ordered to a patient location consistent with an acute medical ward (therefore excluding orders placed if a patient was transferred to an intensive care unit). Similar queries were completed for laboratory and radiological testing.
The VA EMR keeps an active problem list on each patient, and items are associated with an ICD‐9 code. To assemble the active problems available for evaluation by the student on the day of a patient's admission, we queried all problem list items added prior to, but not discontinued before, the day of admission. We then tallied the results for every patient seen by each individual student and in aggregate.
To assess the team exposures for each AI student, we queried all discharge summaries cosigned by the student's attending during the dates of the student's rotation. We assumed the student's team members wrote these discharge summaries. After excluding the student's patients, the resultant list represented the team patient exposures for each student. This list was also queried for the number of patients seen, primary diagnoses, medications, problems, labs, and radiology. The number of team admissions counted included all patients who spent at least 1 day on the team while the student was rotating. All other team exposure counts completed included only patients who were both admitted and discharged within the dates of the student's rotation.
RESULTS
An AI rotation is 4 weeks in duration. Students competed a total of 128 rotations from July 30, 2008 through November 21, 2011. We included all rotations during this time period in the analysis. Tables 1, 2, 3, 4, 5 report results in 4 categories. The Student category tallies the total number of specific exposures (diagnoses, problems, medications, lab values, or radiology tests) for all patients primarily assigned to a student. The Team category tallies the total number of exposures for all patients assigned to other members of the student's inpatient team. The Primary % category identifies the percentage of students who had at least 1 assigned patient with the evaluated clinical exposure. The All Patients % category identifies the percentage of students who had at least 1 student‐assigned patient or at least 1 team‐assigned patient with the evaluated clinical exposure.
| Diagnosis | Student | Team | Primary% | All Patients % |
|---|---|---|---|---|
| Obstructive chronic bronchitis, with acute exacerbation | 102 | 241 | 57% | 91% |
| Pneumonia, organism unspecified | 91 | 228 | 49% | 91% |
| Acute renal failure, unspecified | 73 | 170 | 46% | 83% |
| Urinary tract infection, site not specified | 69 | 149 | 43% | 87% |
| Congestive heart failure, unspecified | 65 | 114 | 41% | 68% |
| Alcohol withdrawal | 46 | 101 | 26% | 61% |
| Alcoholic cirrhosis of liver | 28 | 98 | 16% | 57% |
| Cellulitis and abscess of leg, except foot | 26 | 61 | 18% | 45% |
| Acute pancreatitis | 23 | 51 | 16% | 43% |
| Intestinal infection due to Clostridium difficile | 22 | 30 | 17% | 33% |
| Malignant neoplasm of bronchus and lung, unspecified | 22 | 38 | 16% | 35% |
| Acute on chronic diastolic heart failure | 22 | 45 | 16% | 39% |
| Encounter for antineoplastic chemotherapy | 21 | 96 | 15% | 48% |
| Dehydration | 19 | 78 | 13% | 46% |
| Anemia, unspecified | 19 | 36 | 13% | 30% |
| Pneumonitis due to inhalation of food or vomitus | 19 | 25 | 13% | 24% |
| Syncope and collapse | 16 | 38 | 13% | 39% |
| Other pulmonary embolism and infarction | 15 | 41 | 12% | 26% |
| Unspecified pleural effusion | 15 | 37 | 10% | 34% |
| Acute respiratory failure | 15 | 42 | 11% | 35% |
| Problem | Student | Team | Primary% | All Patients % |
|---|---|---|---|---|
| Hypertension | 1,665 | 3,280 | 100% | 100% |
| Tobacco use disorder | 1,350 | 2,759 | 100% | 100% |
| Unknown cause morbidity/mortality | 1,154 | 2,370 | 100% | 100% |
| Hyperlipidemia | 1,036 | 2,044 | 99% | 100% |
| Diabetes mellitus 2 without complication | 865 | 1,709 | 100% | 100% |
| Chronic airway obstruction | 600 | 1,132 | 100% | 100% |
| Esophageal reflux | 583 | 1,131 | 99% | 100% |
| Depressive disorder | 510 | 1,005 | 100% | 100% |
| Dermatophytosis of nail | 498 | 939 | 98% | 100% |
| Alcohol dependence | 441 | 966 | 97% | 100% |
| Chronic ischemic heart disease | 385 | 758 | 95% | 100% |
| Osteoarthritis | 383 | 791 | 96% | 100% |
| Lumbago | 357 | 692 | 97% | 100% |
| Current useanticoagulation | 342 | 629 | 94% | 100% |
| Anemia | 337 | 674 | 97% | 100% |
| Inhibited sex excitement | 317 | 610 | 91% | 100% |
| Congestive heart failure | 294 | 551 | 91% | 100% |
| Peripheral vascular disease | 288 | 529 | 88% | 99% |
| Sensorineural hearing loss | 280 | 535 | 88% | 99% |
| Post‐traumatic stress disorder | 274 | 528 | 91% | 100% |
| Pure hypercholesterolemia | 262 | 521 | 88% | 100% |
| Coronary atherosclerosis | 259 | 396 | 87% | 95% |
| Obesity | 246 | 509 | 89% | 99% |
| Atrial fibrillation | 236 | 469 | 85% | 100% |
| Gout | 216 | 389 | 85% | 100% |
| Medication | Student | Team | Primary% | All Patients % |
|---|---|---|---|---|
| Omeprazole | 1,372 | 2,981 | 99% | 100% |
| Heparin | 1,067 | 2,271 | 95% | 96% |
| Sodium chloride 0.9% | 925 | 2,036 | 99% | 100% |
| Aspirin | 844 | 1,782 | 98% | 100% |
| Potassium chloride | 707 | 1,387 | 99% | 100% |
| Metoprolol tartrate | 693 | 1,318 | 98% | 100% |
| Insulin regular | 692 | 1,518 | 99% | 100% |
| Acetaminophen | 669 | 1,351 | 98% | 100% |
| Simvastatin | 648 | 1,408 | 99% | 100% |
| Lisinopril | 582 | 1,309 | 98% | 100% |
| Furosemide | 577 | 1,186 | 98% | 100% |
| Docusate sodium | 541 | 1,127 | 98% | 100% |
| Vancomycin | 531 | 977 | 98% | 100% |
| Multivitamin | 478 | 1,074 | 96% | 100% |
| Piperacillin/tazobactam | 470 | 781 | 98% | 100% |
| Selected examples | ||||
| Prednisone | 305 | 613 | 93% | 100% |
| Insulin glargine | 244 | 492 | 81% | 98% |
| Spironolactone | 167 | 380 | 73% | 98% |
| Digoxin | 68 | 125 | 40% | 77% |
| Meropenem | 16 | 21 | 11% | 24% |
| Lab Test | Student | Team | Primary% | All Patients % |
|---|---|---|---|---|
| ||||
| Fingerstick glucose | 12,869 | 24,946 | 100% | 100% |
| Renal panel (serum sodium) | 7,728 | 14,504 | 100% | 100% |
| Complete blood count (blood hematocrit) | 7,372 | 14,188 | 100% | 100% |
| International normalized ratio | 3,725 | 6,259 | 100% | 100% |
| Liver function tests (serum SGOT) | 1,570 | 3,180 | 99% | 100% |
| Urinalysis (urine nitrite) | 789 | 1,537 | 100% | 100% |
| Arterial blood gas (arterial blood pH) | 767 | 704 | 78% | 99% |
| Hemoglobin A1C | 485 | 1,177 | 96% | 100% |
| Fractional excretion of sodium (urine creatinine) | 336 | 677 | 85% | 99% |
| Lactic acid | 195 | 314 | 65% | 96% |
| Ferritin | 193 | 413 | 74% | 99% |
| Thyroid‐stimulating hormone | 184 | 391 | 55% | 64% |
| Lipase | 157 | 317 | 58% | 91% |
| Hepatitis C antibody | 139 | 327 | 70% | 98% |
| Haptoglobin | 101 | 208 | 46% | 83% |
| B‐type natriuretic peptide | 98 | 212 | 48% | 87% |
| Cortisol | 70 | 119 | 34% | 60% |
| Rapid plasma reagin | 70 | 173 | 44% | 82% |
| Urine legionella antigen | 70 | 126 | 38% | 64% |
| D‐dimer | 59 | 111 | 34% | 72% |
| Digoxin | 45 | 69 | 18% | 39% |
| Paracentesis labs (peritoneal fluid total protein) | 34 | 47 | 16% | 34% |
| Thoracentesis labs (pleural fluid WBC count) | 33 | 42 | 20% | 38% |
| C‐reactive protein | 30 | 65 | 17% | 34% |
| Lumbar puncture labs (cerebrospinal fluid WBC count) | 22 | 57 | 11% | 27% |
| Arthrocentesis (synovial fluid WBC count) | 14 | 23 | 9% | 23% |
| Radiology Test | Student | Team | Primary% | All Patients % |
|---|---|---|---|---|
| ||||
| Chest,2 views,PA and lateral | 938 | 1,955 | 100% | 100% |
| Chest portable | 414 | 751 | 96% | 100% |
| CT head without contrast | 235 | 499 | 82% | 100% |
| CT abdomen with contrast | 218 | 365 | 59% | 71% |
| CT pelvis with contrast | 213 | 364 | 59% | 70% |
| CT chest with contrast | 163 | 351 | 75% | 99% |
| Ultrasound kidney, bilateral | 119 | 208 | 61% | 92% |
| Abdomen 1 view | 107 | 220 | 59% | 93% |
| Ultrasound liver | 100 | 183 | 48% | 82% |
| Modified barium swallow | 93 | 130 | 53% | 82% |
| PET scan | 93 | 181 | 49% | 79% |
| Selected examples | ||||
| Acute abdomen series | 85 | 177 | 48% | 81% |
| CT chest, PE protocol | 67 | 126 | 37% | 73% |
| MRI brain with andwithout contrast | 56 | 109 | 34% | 66% |
| Chest decubitus | 51 | 76 | 34% | 60% |
| Portable KUBfor Dobhoff placement | 42 | 62 | 30% | 48% |
| Ventilation/perfusion lung scan | 15 | 25 | 12% | 27% |
| Ultrasound thyroid | 8 | 16 | 5% | 17% |
Distinct Patients and Progress Notes
The mean number of progress notes written by a student was 67.2 (standard deviation [SD] 16.3). The mean number of distinct patients evaluated by a student during a rotation was 18.4 (SD 4.2). The mean number of team admissions per student rotation was 46.7 (SD 9.6) distinct patients.
Primary Diagnoses
A total of 2213 primary diagnoses were documented on patients assigned to students on AI rotations. A total of 5323 primary diagnoses were documented on patients assigned to other members of the team during the students' rotations. Therefore, the mean number of primary diagnoses seen by a student during a rotation was 58.9 (17.3 primary diagnoses for student‐assigned patients and 41.6 primary diagnoses for team patients). The students and teams encountered similar diagnoses (Table 1).
Problem List
Students and teams evaluated a total of 40,015 and 78,643 past medical problems, respectively. The mean number of problems seen by a student during a rotation was 927 (313 student, 614 team). Table 2 reports the most frequent problems assigned to primary student admissions. Students and teams evaluated similar problems. Hepatitis C (196 student, 410 team) was the only team problem that was in the team top 25 but not in the student top 25.
Medications
A total of 38,149 medications were prescribed to the students' primary patients. A total of 77,738 medications were prescribed to patients assigned to the rest of the team. The mean number of medication exposures for a student during a rotation was 905 (298 student, 607 team). The most frequently prescribed medications were similar between student and the team (Table 3). Team medications that were in the top 25 but not in the student top 25 included: hydralazine (300 student, 629 team), prednisone (305 student, 613 team), and oxycodone/acetaminophen (286 student, 608 team).
Labs
All laboratory tests with reported results were tallied. For common laboratory panels, single lab values (eg, serum hematocrit for a complete blood count) were selected as proxies to count the number of studies completed and evaluated. Table 4 shows a cross‐section of laboratory tests evaluated during AI rotations.
Radiology
A total of 6197 radiology tests were completed on patients assigned to students, whereas 11,761 radiology tests were completed on patients assigned to other team members. The mean number of radiology exposures for a student was 140 (48 student, 92 team). The most frequently seen radiology tests were similar between student and the team (Table 5).
DISCUSSION
As medical educators, we assume that the clinical training years allow learners to develop essential skills through their varied clinical experiences. Through exposure to direct patient care, to medical decision‐making scenarios, and to senior physician management practices, trainees build the knowledge base for independent practice. To ensure there is sufficient clinical exposure, data on what trainees are encountering may prove beneficial.
In this novel study, we quantified what learners encounter during a 1‐month team‐based inpatient rotation at a large teaching hospital. We effectively measured a number of aspects of internal medicine inpatient training that have been difficult to quantify in the past. The ability to extract learner‐specific data is becoming increasingly available in academic teaching hospitals. For example, VA medical centers have available a daily updated national data warehouse. The other steps necessary for using learner‐specific data include an understanding of the local inpatient processhow tests are ordered, what note titles are used by traineesas well as someone able to build the queries necessary for data extraction. Once built, data extraction should be able to continue as an automated process and used in real time by medical educators.
Our method of data collection has limitations. The orders placed on a learner's primary patients may not have been placed by the learner. For example, orders may have been placed by an overnight resident cross‐covering the learner's patients. We assumed that learners evaluated the results of all tests (or medication changes) that occurred at any time during their rotation, including cross‐cover periods or days off. In addition, our method for evaluating team exposure underestimates the number of team patients calculated for each learner by limiting the query only to patients whose hospital stay was completed before the student left the inpatient service. It is also difficult to know the how many of the exposures are realized by the learner. Differences in learner attention, contrasts in rounding styles, and varying presentation methods will affect the number of exposures truly attained by the learner. Finally, not all clinical exposures can be evaluated through review of an EMR. Clinical experiences, such as care coordination, patient education, and family counseling, cannot be easily extracted.
Data mining EMRs can enhance clinical medical education. Although our data collection was completed retrospectively, we could easily provide learner‐specific data in real time to ward attendings, chief residents, and program directors. This information could direct the development of teaching tools and individualization of curricula. Perhaps, even more importantly, it would also allow educators to define curricular gaps. Whether these gaps are due to the particular patient demographics of a medical center, the practice patterns and strengths of a particular institution, or career interests of a trainee, these gaps may skew the patient‐care experiences encountered by individual trainees. We can use these data to identify differences in clinical experience and then develop opportunities for learnersclinical, didactic, or simulatedto address deficiencies and provide well‐rounded clinical experiences.
Further investigation to better understand the relationship between direct patient‐care experience and clinical skill acquisition is needed. This information could help guide the development of standards on the number of exposures we expect our learners to have with different diagnostic or treatment modalities prior to independent practice. Using learner data to better understand the clinical experiences of our medical trainees, we can hopefully develop more precise and focused curricula to ensure we produce competent graduates.
Acknowledgments
This material is the result of work supported with resources and the use of facilities at the Louis Stokes Cleveland VA Medical Center. The views expressed in this article are those of the authors and do not necessarily reflect the position or policy of the Department of Veterans Affairs.
- Accreditation Council for Graduate Medical Education. Program requirements for graduate medical education in internal medicine. Available at: http://www.acgme.org/acgmeweb/Portals/0/PFAssets/2013-PR-FAQ-PIF/140_internal_medicine_07012013.pdf. Originally accessed December 18, 2012.
- , , . Residents make their lists and program directors check them twice: reviewing case logs. J Grad Med Educ. 2012;34:257–260.
- , , , et al. Quantifying internal medicine resident clinical experience using resident‐selected primary diagnosis codes. J Hosp Med. 2011;6(7):395–400.
- , , , et al. Documenting and comparing medical students' clinical experiences. JAMA. 2001;286:1035–1040.
- , , , , . Use of an electronic medical record to profile the continuity clinic experiences of primary care residents. Acad Med. 2005;80:390–394.
- , , . Using a Web‐based system to monitor practice profiles in primary care residency training. Can Fam Physician. 2011;57:1030–1037.
- , , . An automated electronic case log: using electronic information systems to assess training in emergency medicine. Acad Emergency Med. 2006;13:733–739.
- , , , , , . The design and implementation of an automated system for logging clinical experiences using an anesthesia information management system. Anesth Analg. 2011;112(2):422–429.
- , , , . Validation of an electronic system for recording medical student patient encounters. AMIA Annu Symp Proc. 2008;2008:510–514.
- . The structure and content of the medical subinternship: a national survey. J Gen Intern Med. 2001;16:550–553.
- , . Education for practice: the role of practical experience in undergraduate and general clinical training. Med Educ. 1989;23:189–195.
The clinical learning model in medical education, specifically in the third and fourth years of medical school and in residency and fellowship training, is driven by direct patient‐care experiences and complemented by mentorship and supervision provided by experienced physicians.[1] Despite the emphasis on experiential learning in medical school and graduate training, the ability of educators to quantify the clinical experiences of learners has been limited. Case logs, often self‐reported, are frequently required during educational rotations to attempt to measure clinical experience.[2] Logs have been utilized to document diagnoses, demographics, disease severity, procedures, and chief complaints.[3, 4, 5, 6] Unfortunately, self‐reported logs are vulnerable to delayed updates, misreported data, and unreliable data validation.[7, 8] Automated data collection has been shown to be more reliable than self‐reported logs.[8, 9]
The enhanced data mining methods now available allow educators to appraise learners' exposures during patient‐care interactions beyond just the diagnosis or chief complaint (eg, how many electrocardiograms do our learners evaluate during a cardiology rotation, how often do our learners gain experience prescribing a specific class of antibiotics, how many of the patients seen by our learners are diabetic). For example, a learner's interaction with a patient during an inpatient admission for community‐acquired pneumonia, at minimum, would include assessing of past medical history, reviewing outpatient medications and allergies, evaluating tests completed (chest x‐ray, complete blood count, blood cultures), prescribing antibiotics, and monitoring comorbidities. The lack of knowledge regarding the frequency and context of these exposures is a key gap in our understanding of the clinical experience of inpatient trainees. Additionally, there are no data on clinical exposures specific to team‐based inpatient learning. When a rotation is team‐based, the educational experience is not limited to the learner's assigned patients, and this arrangement allows for educational exposures from patients who are not the learner's primary assignments through experiences gained during team rounds, cross‐coverage assessments, and informal discussions of patient care.
In this study, we quantify the clinical exposures of learners on an acting internship (AI) rotation in internal medicine by utilizing the Veterans Affairs (VA) electronic medical records (EMR) as collected through the VA Veterans Integrated Service Network 10 Clinical Data Warehouse (CDW). The AI or subinternship is a medical school clinical rotation typically completed in the fourth year, where the learning experience is expected to mirror a 1‐month rotation of a first‐year resident.[10] The AI has historically been defined as an experiential curriculum, during which students assume many of the responsibilities and activities that they will manage as graduate medical trainees.[10, 11] The exposures of AI learners include primary diagnoses encountered, problem lists evaluated at the time of admission, medications prescribed, laboratory tests ordered, and radiologic imaging evaluated. We additionally explored the exposures of the AI learner's team to assess the experiences available through team‐based care.
METHODS
This study was completed at the Louis Stokes Veterans Affairs Medical Center (LSVAMC) in Cleveland, Ohio, which is an academic affiliate of the Case Western Reserve University School of Medicine. The study was approved by the LSVAMC institutional review board.
At the LSVAMC, the AI rotation in internal medicine is a 4‐week inpatient rotation for fourth‐year medical students, in which the student is assigned to an inpatient medical team consisting of an attending physician, a senior resident, and a combination of first‐year residents and acting interns. Compared to a first‐year resident, the acting intern is assigned approximately half of the number of admissions. The teams rounds as a group at least once per day. Acting interns are permitted to place orders and write notes in the EMR; all orders require a cosignature by a resident or attending physician to be released.
We identified students who rotated through the LSVAMC for an AI in internal medicine rotation from July 2008 to November 2011 from rotation records. Using the CDW, we queried student names and their rotation dates and analyzed the results using a Structured Query Language Query Analyzer. Each student's patient encounters during the rotation were identified. A patient encounter was defined as a patient for whom the student wrote at least 1 note titled either Medicine Admission Note or Medicine Inpatient Progress Note, on any of the dates during their AI rotation. We then counted the total number of notes written by each student during their rotation. A patient identifier is associated with each note. The number of distinct patient identifiers was also tallied to establish the total number of patients seen during the rotation by the individual student as the primary caregiver.
We associated each patient encounter with an inpatient admission profile that included patient admission and discharge dates, International Classification of Diseases, 9th Revision (ICD‐9) diagnosis codes, and admitting specialty. Primary diagnosis codes were queried for each admission and were counted for individual students and in aggregate. We tallied both the individual student and aggregate patient medications prescribed during the dates of admission and ordered to a patient location consistent with an acute medical ward (therefore excluding orders placed if a patient was transferred to an intensive care unit). Similar queries were completed for laboratory and radiological testing.
The VA EMR keeps an active problem list on each patient, and items are associated with an ICD‐9 code. To assemble the active problems available for evaluation by the student on the day of a patient's admission, we queried all problem list items added prior to, but not discontinued before, the day of admission. We then tallied the results for every patient seen by each individual student and in aggregate.
To assess the team exposures for each AI student, we queried all discharge summaries cosigned by the student's attending during the dates of the student's rotation. We assumed the student's team members wrote these discharge summaries. After excluding the student's patients, the resultant list represented the team patient exposures for each student. This list was also queried for the number of patients seen, primary diagnoses, medications, problems, labs, and radiology. The number of team admissions counted included all patients who spent at least 1 day on the team while the student was rotating. All other team exposure counts completed included only patients who were both admitted and discharged within the dates of the student's rotation.
RESULTS
An AI rotation is 4 weeks in duration. Students competed a total of 128 rotations from July 30, 2008 through November 21, 2011. We included all rotations during this time period in the analysis. Tables 1, 2, 3, 4, 5 report results in 4 categories. The Student category tallies the total number of specific exposures (diagnoses, problems, medications, lab values, or radiology tests) for all patients primarily assigned to a student. The Team category tallies the total number of exposures for all patients assigned to other members of the student's inpatient team. The Primary % category identifies the percentage of students who had at least 1 assigned patient with the evaluated clinical exposure. The All Patients % category identifies the percentage of students who had at least 1 student‐assigned patient or at least 1 team‐assigned patient with the evaluated clinical exposure.
| Diagnosis | Student | Team | Primary% | All Patients % |
|---|---|---|---|---|
| Obstructive chronic bronchitis, with acute exacerbation | 102 | 241 | 57% | 91% |
| Pneumonia, organism unspecified | 91 | 228 | 49% | 91% |
| Acute renal failure, unspecified | 73 | 170 | 46% | 83% |
| Urinary tract infection, site not specified | 69 | 149 | 43% | 87% |
| Congestive heart failure, unspecified | 65 | 114 | 41% | 68% |
| Alcohol withdrawal | 46 | 101 | 26% | 61% |
| Alcoholic cirrhosis of liver | 28 | 98 | 16% | 57% |
| Cellulitis and abscess of leg, except foot | 26 | 61 | 18% | 45% |
| Acute pancreatitis | 23 | 51 | 16% | 43% |
| Intestinal infection due to Clostridium difficile | 22 | 30 | 17% | 33% |
| Malignant neoplasm of bronchus and lung, unspecified | 22 | 38 | 16% | 35% |
| Acute on chronic diastolic heart failure | 22 | 45 | 16% | 39% |
| Encounter for antineoplastic chemotherapy | 21 | 96 | 15% | 48% |
| Dehydration | 19 | 78 | 13% | 46% |
| Anemia, unspecified | 19 | 36 | 13% | 30% |
| Pneumonitis due to inhalation of food or vomitus | 19 | 25 | 13% | 24% |
| Syncope and collapse | 16 | 38 | 13% | 39% |
| Other pulmonary embolism and infarction | 15 | 41 | 12% | 26% |
| Unspecified pleural effusion | 15 | 37 | 10% | 34% |
| Acute respiratory failure | 15 | 42 | 11% | 35% |
| Problem | Student | Team | Primary% | All Patients % |
|---|---|---|---|---|
| Hypertension | 1,665 | 3,280 | 100% | 100% |
| Tobacco use disorder | 1,350 | 2,759 | 100% | 100% |
| Unknown cause morbidity/mortality | 1,154 | 2,370 | 100% | 100% |
| Hyperlipidemia | 1,036 | 2,044 | 99% | 100% |
| Diabetes mellitus 2 without complication | 865 | 1,709 | 100% | 100% |
| Chronic airway obstruction | 600 | 1,132 | 100% | 100% |
| Esophageal reflux | 583 | 1,131 | 99% | 100% |
| Depressive disorder | 510 | 1,005 | 100% | 100% |
| Dermatophytosis of nail | 498 | 939 | 98% | 100% |
| Alcohol dependence | 441 | 966 | 97% | 100% |
| Chronic ischemic heart disease | 385 | 758 | 95% | 100% |
| Osteoarthritis | 383 | 791 | 96% | 100% |
| Lumbago | 357 | 692 | 97% | 100% |
| Current useanticoagulation | 342 | 629 | 94% | 100% |
| Anemia | 337 | 674 | 97% | 100% |
| Inhibited sex excitement | 317 | 610 | 91% | 100% |
| Congestive heart failure | 294 | 551 | 91% | 100% |
| Peripheral vascular disease | 288 | 529 | 88% | 99% |
| Sensorineural hearing loss | 280 | 535 | 88% | 99% |
| Post‐traumatic stress disorder | 274 | 528 | 91% | 100% |
| Pure hypercholesterolemia | 262 | 521 | 88% | 100% |
| Coronary atherosclerosis | 259 | 396 | 87% | 95% |
| Obesity | 246 | 509 | 89% | 99% |
| Atrial fibrillation | 236 | 469 | 85% | 100% |
| Gout | 216 | 389 | 85% | 100% |
| Medication | Student | Team | Primary% | All Patients % |
|---|---|---|---|---|
| Omeprazole | 1,372 | 2,981 | 99% | 100% |
| Heparin | 1,067 | 2,271 | 95% | 96% |
| Sodium chloride 0.9% | 925 | 2,036 | 99% | 100% |
| Aspirin | 844 | 1,782 | 98% | 100% |
| Potassium chloride | 707 | 1,387 | 99% | 100% |
| Metoprolol tartrate | 693 | 1,318 | 98% | 100% |
| Insulin regular | 692 | 1,518 | 99% | 100% |
| Acetaminophen | 669 | 1,351 | 98% | 100% |
| Simvastatin | 648 | 1,408 | 99% | 100% |
| Lisinopril | 582 | 1,309 | 98% | 100% |
| Furosemide | 577 | 1,186 | 98% | 100% |
| Docusate sodium | 541 | 1,127 | 98% | 100% |
| Vancomycin | 531 | 977 | 98% | 100% |
| Multivitamin | 478 | 1,074 | 96% | 100% |
| Piperacillin/tazobactam | 470 | 781 | 98% | 100% |
| Selected examples | ||||
| Prednisone | 305 | 613 | 93% | 100% |
| Insulin glargine | 244 | 492 | 81% | 98% |
| Spironolactone | 167 | 380 | 73% | 98% |
| Digoxin | 68 | 125 | 40% | 77% |
| Meropenem | 16 | 21 | 11% | 24% |
| Lab Test | Student | Team | Primary% | All Patients % |
|---|---|---|---|---|
| ||||
| Fingerstick glucose | 12,869 | 24,946 | 100% | 100% |
| Renal panel (serum sodium) | 7,728 | 14,504 | 100% | 100% |
| Complete blood count (blood hematocrit) | 7,372 | 14,188 | 100% | 100% |
| International normalized ratio | 3,725 | 6,259 | 100% | 100% |
| Liver function tests (serum SGOT) | 1,570 | 3,180 | 99% | 100% |
| Urinalysis (urine nitrite) | 789 | 1,537 | 100% | 100% |
| Arterial blood gas (arterial blood pH) | 767 | 704 | 78% | 99% |
| Hemoglobin A1C | 485 | 1,177 | 96% | 100% |
| Fractional excretion of sodium (urine creatinine) | 336 | 677 | 85% | 99% |
| Lactic acid | 195 | 314 | 65% | 96% |
| Ferritin | 193 | 413 | 74% | 99% |
| Thyroid‐stimulating hormone | 184 | 391 | 55% | 64% |
| Lipase | 157 | 317 | 58% | 91% |
| Hepatitis C antibody | 139 | 327 | 70% | 98% |
| Haptoglobin | 101 | 208 | 46% | 83% |
| B‐type natriuretic peptide | 98 | 212 | 48% | 87% |
| Cortisol | 70 | 119 | 34% | 60% |
| Rapid plasma reagin | 70 | 173 | 44% | 82% |
| Urine legionella antigen | 70 | 126 | 38% | 64% |
| D‐dimer | 59 | 111 | 34% | 72% |
| Digoxin | 45 | 69 | 18% | 39% |
| Paracentesis labs (peritoneal fluid total protein) | 34 | 47 | 16% | 34% |
| Thoracentesis labs (pleural fluid WBC count) | 33 | 42 | 20% | 38% |
| C‐reactive protein | 30 | 65 | 17% | 34% |
| Lumbar puncture labs (cerebrospinal fluid WBC count) | 22 | 57 | 11% | 27% |
| Arthrocentesis (synovial fluid WBC count) | 14 | 23 | 9% | 23% |
| Radiology Test | Student | Team | Primary% | All Patients % |
|---|---|---|---|---|
| ||||
| Chest,2 views,PA and lateral | 938 | 1,955 | 100% | 100% |
| Chest portable | 414 | 751 | 96% | 100% |
| CT head without contrast | 235 | 499 | 82% | 100% |
| CT abdomen with contrast | 218 | 365 | 59% | 71% |
| CT pelvis with contrast | 213 | 364 | 59% | 70% |
| CT chest with contrast | 163 | 351 | 75% | 99% |
| Ultrasound kidney, bilateral | 119 | 208 | 61% | 92% |
| Abdomen 1 view | 107 | 220 | 59% | 93% |
| Ultrasound liver | 100 | 183 | 48% | 82% |
| Modified barium swallow | 93 | 130 | 53% | 82% |
| PET scan | 93 | 181 | 49% | 79% |
| Selected examples | ||||
| Acute abdomen series | 85 | 177 | 48% | 81% |
| CT chest, PE protocol | 67 | 126 | 37% | 73% |
| MRI brain with andwithout contrast | 56 | 109 | 34% | 66% |
| Chest decubitus | 51 | 76 | 34% | 60% |
| Portable KUBfor Dobhoff placement | 42 | 62 | 30% | 48% |
| Ventilation/perfusion lung scan | 15 | 25 | 12% | 27% |
| Ultrasound thyroid | 8 | 16 | 5% | 17% |
Distinct Patients and Progress Notes
The mean number of progress notes written by a student was 67.2 (standard deviation [SD] 16.3). The mean number of distinct patients evaluated by a student during a rotation was 18.4 (SD 4.2). The mean number of team admissions per student rotation was 46.7 (SD 9.6) distinct patients.
Primary Diagnoses
A total of 2213 primary diagnoses were documented on patients assigned to students on AI rotations. A total of 5323 primary diagnoses were documented on patients assigned to other members of the team during the students' rotations. Therefore, the mean number of primary diagnoses seen by a student during a rotation was 58.9 (17.3 primary diagnoses for student‐assigned patients and 41.6 primary diagnoses for team patients). The students and teams encountered similar diagnoses (Table 1).
Problem List
Students and teams evaluated a total of 40,015 and 78,643 past medical problems, respectively. The mean number of problems seen by a student during a rotation was 927 (313 student, 614 team). Table 2 reports the most frequent problems assigned to primary student admissions. Students and teams evaluated similar problems. Hepatitis C (196 student, 410 team) was the only team problem that was in the team top 25 but not in the student top 25.
Medications
A total of 38,149 medications were prescribed to the students' primary patients. A total of 77,738 medications were prescribed to patients assigned to the rest of the team. The mean number of medication exposures for a student during a rotation was 905 (298 student, 607 team). The most frequently prescribed medications were similar between student and the team (Table 3). Team medications that were in the top 25 but not in the student top 25 included: hydralazine (300 student, 629 team), prednisone (305 student, 613 team), and oxycodone/acetaminophen (286 student, 608 team).
Labs
All laboratory tests with reported results were tallied. For common laboratory panels, single lab values (eg, serum hematocrit for a complete blood count) were selected as proxies to count the number of studies completed and evaluated. Table 4 shows a cross‐section of laboratory tests evaluated during AI rotations.
Radiology
A total of 6197 radiology tests were completed on patients assigned to students, whereas 11,761 radiology tests were completed on patients assigned to other team members. The mean number of radiology exposures for a student was 140 (48 student, 92 team). The most frequently seen radiology tests were similar between student and the team (Table 5).
DISCUSSION
As medical educators, we assume that the clinical training years allow learners to develop essential skills through their varied clinical experiences. Through exposure to direct patient care, to medical decision‐making scenarios, and to senior physician management practices, trainees build the knowledge base for independent practice. To ensure there is sufficient clinical exposure, data on what trainees are encountering may prove beneficial.
In this novel study, we quantified what learners encounter during a 1‐month team‐based inpatient rotation at a large teaching hospital. We effectively measured a number of aspects of internal medicine inpatient training that have been difficult to quantify in the past. The ability to extract learner‐specific data is becoming increasingly available in academic teaching hospitals. For example, VA medical centers have available a daily updated national data warehouse. The other steps necessary for using learner‐specific data include an understanding of the local inpatient processhow tests are ordered, what note titles are used by traineesas well as someone able to build the queries necessary for data extraction. Once built, data extraction should be able to continue as an automated process and used in real time by medical educators.
Our method of data collection has limitations. The orders placed on a learner's primary patients may not have been placed by the learner. For example, orders may have been placed by an overnight resident cross‐covering the learner's patients. We assumed that learners evaluated the results of all tests (or medication changes) that occurred at any time during their rotation, including cross‐cover periods or days off. In addition, our method for evaluating team exposure underestimates the number of team patients calculated for each learner by limiting the query only to patients whose hospital stay was completed before the student left the inpatient service. It is also difficult to know the how many of the exposures are realized by the learner. Differences in learner attention, contrasts in rounding styles, and varying presentation methods will affect the number of exposures truly attained by the learner. Finally, not all clinical exposures can be evaluated through review of an EMR. Clinical experiences, such as care coordination, patient education, and family counseling, cannot be easily extracted.
Data mining EMRs can enhance clinical medical education. Although our data collection was completed retrospectively, we could easily provide learner‐specific data in real time to ward attendings, chief residents, and program directors. This information could direct the development of teaching tools and individualization of curricula. Perhaps, even more importantly, it would also allow educators to define curricular gaps. Whether these gaps are due to the particular patient demographics of a medical center, the practice patterns and strengths of a particular institution, or career interests of a trainee, these gaps may skew the patient‐care experiences encountered by individual trainees. We can use these data to identify differences in clinical experience and then develop opportunities for learnersclinical, didactic, or simulatedto address deficiencies and provide well‐rounded clinical experiences.
Further investigation to better understand the relationship between direct patient‐care experience and clinical skill acquisition is needed. This information could help guide the development of standards on the number of exposures we expect our learners to have with different diagnostic or treatment modalities prior to independent practice. Using learner data to better understand the clinical experiences of our medical trainees, we can hopefully develop more precise and focused curricula to ensure we produce competent graduates.
Acknowledgments
This material is the result of work supported with resources and the use of facilities at the Louis Stokes Cleveland VA Medical Center. The views expressed in this article are those of the authors and do not necessarily reflect the position or policy of the Department of Veterans Affairs.
- Accreditation Council for Graduate Medical Education. Program requirements for graduate medical education in internal medicine. Available at: http://www.acgme.org/acgmeweb/Portals/0/PFAssets/2013-PR-FAQ-PIF/140_internal_medicine_07012013.pdf. Originally accessed December 18, 2012.
- , , . Residents make their lists and program directors check them twice: reviewing case logs. J Grad Med Educ. 2012;34:257–260.
- , , , et al. Quantifying internal medicine resident clinical experience using resident‐selected primary diagnosis codes. J Hosp Med. 2011;6(7):395–400.
- , , , et al. Documenting and comparing medical students' clinical experiences. JAMA. 2001;286:1035–1040.
- , , , , . Use of an electronic medical record to profile the continuity clinic experiences of primary care residents. Acad Med. 2005;80:390–394.
- , , . Using a Web‐based system to monitor practice profiles in primary care residency training. Can Fam Physician. 2011;57:1030–1037.
- , , . An automated electronic case log: using electronic information systems to assess training in emergency medicine. Acad Emergency Med. 2006;13:733–739.
- , , , , , . The design and implementation of an automated system for logging clinical experiences using an anesthesia information management system. Anesth Analg. 2011;112(2):422–429.
- , , , . Validation of an electronic system for recording medical student patient encounters. AMIA Annu Symp Proc. 2008;2008:510–514.
- . The structure and content of the medical subinternship: a national survey. J Gen Intern Med. 2001;16:550–553.
- , . Education for practice: the role of practical experience in undergraduate and general clinical training. Med Educ. 1989;23:189–195.
© 2014 Society of Hospital Medicine
Don't forget non-Alzheimer dementias
Dementia is not always due to Alzheimer disease. An accurate diagnosis is important, as the various causative conditions can differ in their course and treatment.
Dementia refers to cognitive impairment severe enough to interfere with the ability to independently perform activities of daily living. It can occur at any age but is most common after age 60. Some studies estimate that 13.9% of people age 71 and older have some form of dementia.1 The prevalence increases with age, ranging from 5% at age 70 to 79 to 37% at age 90 and older.1
Alzheimer disease accounts for about 60% to 80% of cases,2 or an estimated 4.7 million people age 65 and older in the United States, a number anticipated to climb to 13.8 million by 2050.3
Other types of dementia are less often considered and are challenging to recognize, although many have distinct characteristics. This article summarizes the features and management of the more common non-Alzheimer dementias:
- Vascular dementia
- Dementia with Lewy bodies
- Progressive supranuclear palsy
- Corticobasal degeneration
- Multiple system atrophy
- Parkinson disease dementia
- Frontotemporal dementia
- Primary progressive aphasia
- Normal-pressure hydrocephalus
- Rapidly progressive dementia (ie, Creutzfeld-Jakob disease, autoimmune disease).
VASCULAR DEMENTIA
After Alzheimer disease, vascular dementia is the most common dementia, accounting for about 20% to 30% of cases. Clinical criteria have not been widely accepted, although several have been published, including those in the Diagnostic and Statistical Manual of Mental Disorders (Fourth Edition) and the National Institute of Neurological and Communicative Diseases and Stroke-Association Internationale pour la Recherche et l’Enseignement en Neurosciences.
Risk factors for vascular dementia include cerebrovascular disease (hypertension, diabetes, hyperlipidemia) and coexisting conditions related to atherosclerosis (coronary artery disease, peripheral artery disease).
The Hachinski Ischemic Score is a good bedside tool to help differentiate Alzheimer dementia from vascular dementia.5
Sudden onset and stepwise decline
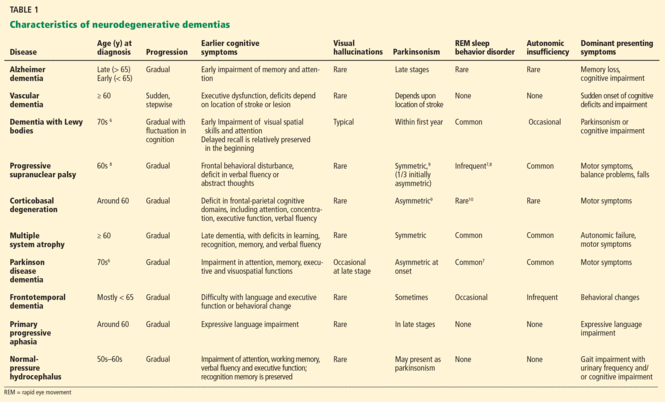
Vascular dementia often presents as a sudden and stepwise progression of cognitive deficits that stabilize and that are caused by vascular insults (Table 1).6–10 Some patients have continuous decline after a vascular event, indicating that Alzheimer dementia may also be present. Dementia is then defined as a mixed type.
Behavioral problems such as physical aggression, hallucinations, paranoia, and mood fluctuations are common.11
Deficits depend on vascular areas affected
Cognitive deficits are heterogeneous and are often related to the location of the vascular insult. Involvement of subcortical areas may result in executive dysfunction, slowed processing speed, and behavioral changes.12
Executive dysfunction may be identified using the Trail Making Test (Part B) or the Executive Interview (EXIT25). Office-based tools such as the Folstein Mini-Mental State Examination, the Montreal Cognitive Assessment, or the St. Louis University Mental Status Examination may also uncover these deficits.
Focal neurologic deficits may be found on clinical examination.
Structural neuroimaging may identify small strokes in areas of the brain affecting cognitive function or occlusion of a larger vessel associated with more profound neurologic deficits. Neuroimaging findings may not correlate with any significant decline noted by the patient, suggesting “silent” strokes.
Treat symptoms and manage risk factors
Although the US Food and Drug Administration (FDA) has not approved any pharmacotherapy for vascular dementia, commonly prescribed cognitive enhancers have demonstrated some benefit.13
Behavioral problems such as aggression can be disturbing to the patient and the caregiver. Nonpharmacologic methods (eg, redirection, rescheduling care activities to avoid conflict, avoiding issues that lead to agitation) should be tried first to address these problems.
Drug therapy may be used off-label for neuropsychiatric symptoms such as hallucinations, delusions, and combativeness, but clinical trials of these agents for this purpose have shown mixed results,14 and their use is often associated with significant risk.15 Antipsychotic drugs are associated with a risk of death and pneumonia when prescribed for dementia. Many also carry a risk of QT prolongation, which is particularly concerning for patients with coronary artery disease or rhythm disturbances.
The key to reducing further decline is to optimize management of vascular risk factors to reduce stroke risk.
DEMENTIA WITH LEWY BODIES
Dementia with Lewy bodies, the next most common neurodegenerative dementia in the elderly, is characterized by progressive loss of cognitive function, prominent visual hallucinations, and parkinsonism (Table 1).6 Disease progression usually occurs over years but can be more rapid than in Alzheimer disease.
Alpha-synucleinopathy results in dysfunction of synaptic vesicles in presynaptic terminals. Lewy bodies may be diffusely spread in cortical and subcortical areas (appearing as spherical masses).
Visual hallucinations are typical
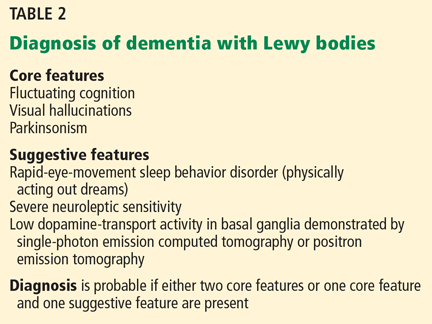
The McKeith criteria16 are the gold standard for diagnosing probable Lewy body dementia, based on clinical and imaging features (Table 2).
Visual hallucinations are usually well formed and detailed. They may initially be pleasant (eg, seeing children and little people) but may evolve to be accompanied by persecutory delusions.
Parkinsonism develops with or after dementia with Lewy bodies
Dementia with Lewy bodies and Parkinson disease dementia share many clinical and pathologic features; Parkinson dementia also is associated with cortical Lewy bodies.
Parkinsonian features include bradykinesia, masked facies, and rigidity. Resting tremor is less common.
The third report of the Dementia With Lewy Bodies Consortium recommends that the condition be diagnosed if dementia occurs before or concurrently with parkinsonism, and dementia with Parkinson disease should be diagnosed if dementia occurs in the context of well-established Parkinson disease.16 The development of dementia within 12 months of extrapyramidal signs suggests dementia with Lewy bodies.
Cognitive deficits fluctuate
Cognitive impairment in Lewy body dementia is characterized by progressive dementia with fluctuations in cognitive performance. Family members or caregivers may report that the patient can carry on a conversation one day and the next day be confused and inattentive. Compared with those with Alzheimer dementia, patients with Lewy body dementia have better delayed recall but more problems with executive functioning (planning) and visuospatial skills (following an unfamiliar route, copying a figure).
Specialized imaging provides clues
Dementia with Lewy bodies is associated with diffuse brain atrophy, with no established characteristic pattern on structural neuroimaging with computed tomography (CT) or magnetic resonance imaging (MRI).17 The contrast agent ioflupane iodine-123 injection (DaTscan) used with single-photon emission CT (SPECT) detects dopamine transporters, which are reduced in parkinsonian syndromes. The scan can also help differentiate between Alzheimer dementia and Lewy body dementia by detecting the loss of functional dopaminergic terminals in the striatum in Lewy body dementia. Alpha-synuclein imaging may become another useful diagnostic tool in the future.
Alzheimer medications may help in dementia with Lewy bodies
Medications with anticholinergic effects and dopamine agonists should be discontinued because of possible effects on cognitive function and parkinsonism. In one clinical trial,18 rivastigmine (Exelon) was found to help cognitive functioning as well as reduce psychotic symptoms in dementia with Lewy bodies, although a recent Cochrane review could not support the evidence for use of all cholinesterase inhibitors in Lewy body dementia.19 In another trial,20 memantine (Namenda) was found to improve global clinical status and behavioral symptoms of Lewy body dementia.
Treating hallucinations of dementia with Lewy bodies
Patients with dementia with Lewy bodies are extremely sensitive to the extrapyramidal side effects of neuroleptic drugs. Some evidence indicates that the atypical antipsychotic drug quetiapine (Seroquel) helps with prominent and disturbing psychotic features and is less likely to worsen parkinsonism than other antipsychotics.21 The best evidence is for clozapine (Clozaril) as a treatment for hallucinations in Parkinson dementia, but the possible side effect of agranulocytosis limits its clinical use. Other atypical antipsychotics such as risperidone (Risperdal) and olanzapine (Zyprexa) are not recommended.22
PROGRESSIVE SUPRANUCLEAR PALSY
Progressive supranuclear palsy is a sporadic atypical parkinsonian disorder with onset between age 50 and 70. Familial cases are infrequent.
Progressive supranuclear palsy presents as early postural instability, vertical supranuclear gaze palsy, and axial muscle rigidity in the first few years. Disease progression is gradual: one study of 50 patients found that the median time from onset to the first key motor impairment (unintelligible speech, no independent walking, inability to stand unassisted, wheelchair-bound, or recommendation for feeding tube placement) was 4 years.23
Histologically, progressive supranuclear palsy is characterized by accumulation of tau protein aggregates in the basal ganglia, brainstem, and cerebral cortex. The degenerative process involves dopaminergic, cholinergic, and gamma-aminobutyric acid (GABA)-ergic neurons.24
Gait and balance problems predominate early in progressive supranuclear palsy
The most commonly used diagnostic criteria are from the National Institute of Neurological Disorders and Stroke. The diagnosis of probable progressive supranuclear palsy requires vertical gaze palsy and falls or the tendency to fall within the first year of disease onset and exclusion of other causes.
The earliest symptom is usually gait and balance impairment.25 Falls (usually backward) and postural instability occur during the first year in 58% of patients.26 Instead of turning en bloc as in Parkinson disease, patients with progressive supranuclear palsy tend to pivot quickly. Patients may also have a coarse groaning voice and moaning. Insomnia has been reported, but rapid-eye-movement sleep behavior disorders are infrequent (unlike in Parkinson disease, multiple system atrophy, and Lewy body dementia).27
Apathy and extreme mood swings
Cognitive impairment is seen in 50% of patients in the early stage of progressive supranuclear palsy. It mostly involves the frontal lobe, including frontal behavioral disturbances (eg, apathy in 91% of patients26 or pseudobulbar affect and extreme emotional lability) and deficits in abstract thoughts or verbal fluency (to test this, patients are asked to say as many words as possible from a category in a given time). Ideomotor apraxia (inability to correctly imitate hand gestures and voluntarily pantomime tool use, such as pretending to brush hair) is rare, despite corticobasal degeneration.28
Vertical gaze palsy
The hallmark of progressive supranuclear palsy is vertical gaze palsy. Initially, this involves slowing of vertical saccades, followed by diminished vertical gaze and more characteristic downward gaze palsy. These findings may develop over 3 to 4 years. Vertical gaze palsy leads to spilling food and tripping while walking.
The gaze abnormality combined with rare blinking and facial dystonia form the classic facial expression of astonishment called “leonine facies.” The face is stiff and deeply furrowed, with a look of surprise.
Axial (especially neck) rigidity is more prominent than limb rigidity. Retrocollis (the head is drawn back) occurs in less than 25% of patients. Parkinsonian features such as bradykinesia affect nearly half of patients by the time of diagnosis.
Instead of the classic symptoms of progressive supranuclear palsy, about one-third of patients present with progressive supranuclear palsy-parkinsonism, which involves asymmetric parkinsonism that initially responds to levodopa.29
MRI shows ‘hummingbird sign’
Brain MRI shows atrophy of the brainstem, particularly the midbrain. Thinning of the superior part of the midbrain and dilation of the third ventricle (“hummingbird sign” on sagittal sections or “morning glory flower” on axial sections) support a diagnosis of progressive supranuclear palsy and differentiate it from Parkinson disease and other atypical parkinsonian disorders.30,31
Levodopa ineffective for supranuclear palsy
There is no treatment to slow progressive supranuclear palsy. Even in high doses, levodopa rarely alleviates parkinsonian features in a clinically meaningful way.26 Successful experimental biologic therapies have been studied in animal models.32 Davunetide is thought to help with neuronal integrity and cell survival through the stabilization of microtubules in preclinical studies, but it has not been used in clinical practice.33
CORTICOBASAL DEGENERATION
Corticobasal degeneration is a progressive, asymmetric movement disorder often manifesting initially with cognitive or behavioral impairment. It is associated with abnormality of the cytoskeleton protein tau. Onset is usually after age 60.
Asymmetric movement disorder with cognitive dysfunction
This diagnosis is clinical. Diagnostic criteria proposed in 2003 include the following core features34:
- Insidious onset and progressive course
- No identifiable cause
- Cortical dysfunction with at least one of the following: apraxia, alien limb phenomenon (one limb moves involuntarily with complex movements, eg, grabbing the other hand), cortical sensory loss, visual hemineglect, nonfluent aphasia
- Extrapyramidal dysfunction: focal rigidity unresponsive to levodopa, asymmetric dystonia.
An international consortium has developed more specific clinical research criteria for probable and possible corticobasal degeneration.35 In a series of 147 patients, the following clinical features were found: parkinsonism (100%), higher cortical dysfunction (93%), dyspraxia (82%), gait disorder (80%), unilateral limb dystonia (71%), tremor (55%), and dementia (25%).36
Behavioral problems commonly include depression; apathy, irritability, and agitation are also reported.37
Cognitive testing may reveal deficits in frontal-parietal cognitive domains including attention and concentration, executive function, verbal fluency, and visuospatial skills.38 Learning disabilities may be improved with verbal cueing (in contrast to Alzheimer disease). Patients may also have impaired graphesthesia (the ability to recognize writing on the skin only by the sensation of touch).39,40
Motor examination may reveal marked asymmetry. Hand, limb, speech, and gait apraxias are common. Gait is typically slow, with short steps and shuffling, and a wide-based or freezing gait. Arm swing may be absent on one side.
Asymmetric cortical atrophy
Early on, MRI may be normal. As the disease progresses, asymmetric cortical atrophy may be seen, especially in the posterior frontal and parietal lobes.
Levodopa ineffective in corticobasal degeneration
Corticobasal degeneration responds poorly to levodopa. Botulinum toxin has been used to help with dystonia and limb pain.
MULTIPLE SYSTEM ATROPHY
Multiple system atrophy is another atypical parkinsonian disorder, most often diagnosed in men over age 60. It is characterized by sporadic parkinsonism, cerebellar signs (involving balance and coordination), pyramidal tract dysfunction, and autonomic insufficiency in varying combinations. Two major subtypes are recognized, depending on whether the predominating presenting features are cerebellar signs or parkinsonism. In contrast to dementia with Lewy bodies, psychiatric symptoms are not a major feature, except possibly depression.41
Diagnosis requires a sporadic progressive disorder that has features of autonomic failure and poor response of parkinsonism or cerebellar ataxia to levodopa.42
Multiple system atrophy is usually not associated with dementia in the early stages, but patients develop deficits in learning, recognition, memory, and verbal fluency as the disease progresses.43 Rapid-eye-movement sleep behavior disorder has been reported in more than half of patients.44
A neurologic examination provides clues
Parkinsonian features are usually symmetric, in contrast to idiopathic Parkinson disease. These signs may include akinesia with rigidity, postural instability, hypokinetic speech, and tremor.
Cerebellar signs include nystagmus and dysarthria (speech disturbance), and gait and limb ataxia.
Pyramidal features include extensor plantar responses and hyperreflexia.
Autonomic dysfunction includes orthostatic hypotension, bladder and rectal atony, loss of sweating, urinary or fecal incontinence, and erectile dysfunction.
Electromyography may demonstrate decreased anal sphincter tone.
MRI shows atrophy of putamen and pons
Brain MRI may show atrophy of the putamen (hypointensity of the putamen with a hyperintense rim). Pons atrophy may also be present, revealing a “hot cross bun” sign in axial images. These combined findings have specificity above 90% but limited sensitivity. These signs are useful to distinguish multiple system atrophy from Parkinson dementia, but their absence does not exclude the diagnosis of multiple system atrophy.45,46
Multiple system atrophy typically responds poorly to levodopa
Levodopa may improve movement and rigidity, but many respond poorly to treatment or lose response after a few years. Fludrocortisone (Florinef) or vasoconstrictors such as midodrine (Orvaten, Proamatine) may help with orthostatic hypotension.47,48
PARKINSON DISEASE DEMENTIA
Dementia eventually develops in most patients with Parkinson disease. Older age and the akinetic rigid form of the disease are associated with higher risk. Diagnosis of idiopathic Parkinson disease before the development of dementia is essential for the diagnosis.
The Movement Disorder Society Task Force has developed new diagnostic criteria.49 Deficits must be present in at least two of the four core cognitive domains (attention, memory, executive, and visuospatial functions) and must be severe enough to affect daily functioning.
Behavioral symptoms such as affective changes, hallucinations, and apathy are common.
MRI shows characteristic brain atrophy in Parkinson disease dementia
MRI shows reduced gray matter volume in the frontal lobe in patients with Parkinson disease without dementia compared with controls. In Parkinson disease dementia, reduced volume extends to temporal, occipital, and subcortical areas. No significant volumetric differences have been observed in Parkinson dementia compared with dementia with Lewy bodies.50 A greater decrease of glucose metabolism has been found in the inferior parietal and occipital lobes in Parkinson disease dementia than in Parkinson disease without dementia.51
Rivastigmine effective for dementia
A Cochrane review supports the use of acetylcholinesterase inhibitors in patients with Parkinson disease dementia, with a positive impact on global assessment, cognitive function, behavioral disturbance, and activities of daily living rating scales.19 At this time, rivastigmine is the only FDA-approved cholinesterase inhibitor for treating Parkinson disease dementia. In clinical trials, memantine did not improve global clinical status or behavioral symptoms of dementia of Parkinson disease.51
FRONTOTEMPORAL DEMENTIA
Frontotemporal dementia frequently starts before age 65 and accounts for 20% to 50% of dementias in this age group.52 Recognition of the condition in older patients is also growing.53 Frontotemporal dementia encompasses a spectrum of dementias, including behavioral variant frontotemporal dementia, semantic dementia, and progressive nonfluent aphasia.54
Gradual onset of uncharacteristic behaviors
Accepted diagnostic criteria include core features of gradual onset, early decline in social and interpersonal conduct, early impairment of self-regulation, emotional blunting, and loss of insight. Many patients are diagnosed with psychiatric conditions. Changes reported by family and caregivers typically deviate substantially from the person’s usual behavior, such as impulsive and inappropriate behaviors or complete withdrawal and apathy.
Language sometimes affected in frontotemporal dementia
Language impairment may be present in some variants. Behavioral and language changes often accompany other forms of dementia (Alzheimer disease, vascular dementia, primary progressive aphasia), making diagnosis more challenging. Office-based testing often does not reveal any deficits, although the Frontal Behavioral Inventory may help.55 A referral to a clinical neuropsychologist may help identify and quantify cognitive impairments.
MRI shows frontotemporal lobes affected
Structural neuroimaging may not reveal abnormalities initially, but with progression, atrophy may be seen in the frontal and temporal lobes. Functional neuroimaging (positron emission tomography, brain SPECT, functional MRI) show hypometabolism in the same areas.
Treat symptoms
There are no specific FDA-approved therapies for frontotemporal dementia. Acetylcholinesterase inhibitors can help progressive nonfluent aphasia in some cases. Selective serotonin reuptake inhibitors may alleviate depressive symptoms, and low doses of atypical antipsychotic medications may help with impulsivity, disinhibition, and aggressive or disruptive behaviors.56
PRIMARY PROGRESSIVE APHASIA
Language impairment predominates
Primary progressive aphasia is a rare form of dementia in which symptoms typically develop around age 60. Pathology is varied. In a study of 60 patients with initial clinical symptoms of primary progressive aphasia, postmortem histology of brain tissue revealed various findings, including those consistent with Alzheimer pathology and motor neuron diseasetype inclusions.57
Patients typically present with expressive language problems as the primary deficit for the first 2 years of the disease, with preservation in other cognitive areas such as memory, visuospatial skills, and executive function.58 Office-based testing may overstate the severity of the dementia, given the dependence of performance on intact language.
It is important to distinguish primary progressive aphasia from other dementias that also affect language. In the frontal variant of frontotemporal dementia, the primary language problem is anomia (inability to name objects) or diminished speech output, which may be accompanied by behavioral problems. Semantic dementia affects word recognition as well as comprehension. In Alzheimer disease, language may be affected along with memory and other areas of cognitive function.
Imaging shows focal degeneration in the left hemisphere
Structural neuroimaging does not initially reveal any deficits, but later it may reveal atrophy in the frontal, perisylvian complex, and temporal areas of the left hemisphere, reflecting the focal nature of the degeneration.59 Functional neuroimaging (positron emission tomography, SPECT) may reveal hypometabolism or diminished blood flow in these areas prior to changes in structural neuroimaging.60
Other communication methods may help
There are no FDA-approved therapies for primary progressive aphasia. Off-label use of some agents (eg, selective serotonin reuptake inhibitors and small doses of antipsychotic medications) has been found useful in small trials.56 Patients may benefit from learning other forms of communication, such as using sign language, laminated cards with printed words or pictures, or artificial voice synthesizers, to express their needs.
NORMAL-PRESSURE HYDROCEPHALUS
Classic triad: Gait, cognition, incontinence
With the onset of symptoms in the sixth or seventh decade, normal-pressure hydrocephalus affects less than 1% of people age 65 and older. It represents up to 5% of dementias, although estimates are influenced by the varied criteria for diagnosis.61 It is characterized by the classic triad of gait impairment, cognitive impairment, and urinary frequency or incontinence.62
Symptoms progress over a period of years, with gait impairment often predominating. As this triad is common in the geriatric population, identifying other explanations is important. Gait impairment caused by spinal stenosis, peripheral neuropathy, or parkinsonism should be explored. Cognitive impairment could be due to depression, Alzheimer disease, or other forms of dementia. Urinary symptoms may be related to detrusor instability or an enlarged prostate.
Gait impairment initially manifests as slowing of gait, but progresses to difficulty with gait initiation. Gait tends to be wide-based (stance more than 1 foot wide).
Cognitive impairment is typically subcortical, manifested as slowed processing speed and impaired executive function. Recall and working memory may be impaired.
Enlarged ventricles seen on imaging in normal-pressure hydrocephalus
Structural neuroimaging reveals enlarged ventricles (Evan’s ratio > 0.358). This can be difficult to distinguish from ventriculomegaly due to cerebral atrophy; assessing the callosal angle on MRI may distinguish the two.63,64 Diagnosis of normal-pressure hydrocephalus can be confirmed using a cerebrospinal fluid infusion test to assess resistance of fluid to resorption.65
Treat with cerebrospinal fluid drainage
Specific tests should be performed to determine candidacy for surgery. These include a high-volume lumbar puncture (40 to 50 mL) or a trial of external lumbar drainage (10 mL per hour for 48 to 72 hours).65 Definitive treatment is surgical placement of a shunt to allow cerebrospinal fluid to drain into the atria or peritoneal cavity.
Surgery may improve gait, but cognitive symptoms often remain,66 and clinical decline may occur after the shunt is placed. Once gait dysfunction is resolved, other explanations for cognitive impairment or residual gait impairment should be considered. An underlying reason for progression of normal-pressure hydrocephalus symptoms after surgical intervention should be identified.67
RAPIDLY PROGRESSIVE DEMENTIAS
Rapidly progressive dementias are among the most challenging of dementing illnesses. They are characterized by a subacute course and an accelerated rate of decline, developing in less than 2 years. Evaluation should typically be more comprehensive than for other types of dementia. The main goal is to diagnose potentially treatable conditions, such as Hashimoto encephalopathy or paraneoplastic limbic encephalitis, and to distinguish these conditions from diseases with a very poor prognosis, such as Creutzfeldt-Jakob disease.
Creutzfeldt-Jakob disease
Creutzfeldt-Jakob disease is a fatal prion-related neurodegenerative illness. Sporadic disease is most common, but variant, familial, and iatrogenic types have been reported. The most common initial symptoms in sporadic disease are cognitive (39%), cerebellar (21%), behavioral (20%), constitutional (20%), sensory (11%), motor (9%), and visual (7%).68
Chronic neurodegenerative diseases can be misdiagnosed as Creutzfeldt-Jakob disease because of an atypical time course and multi-system neurologic findings.
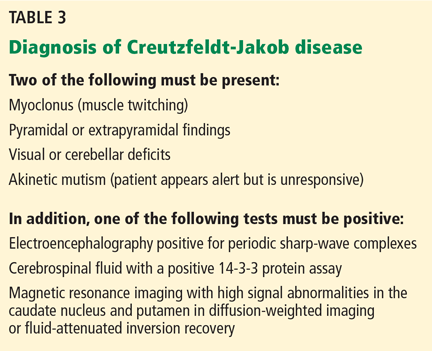
The US Centers for Disease Control and Prevention has adopted criteria for diagnosing probable Creutzfeldt-Jakob disease (Table 3). Routine investigations should also not suggest an alternative diagnosis.69
Autoimmune diseases
Autoimmune conditions may present as a rapidly progressive dementia, including Hashimoto encephalopathy and antibody-mediated limbic encephalitis, either associated with cancer (paraneoplastic) or without cancer (nonparaneoplastic).
Paraneoplastic limbic encephalitis is a group of inflammatory conditions involving antibodies produced within the cerebrospinal fluid and serum resulting in neurologic symptoms. These antibodies react against proteins expressed mostly by a tumor somewhere else in the body.70
Hashimoto encephalitis is a subacute to chronic encephalopathy that may present as dementia with abnormally high levels of thyroid antibodies. The symptoms can vary from confusion to psychosis. There are two main presentations: one involves a relapsing-remitting course with stroke-like episodes (27% of patients) and the second consists of insidious onset of seizures (66% of patients).
Diagnosis involves testing for elevated anti-thyroid peroxidase and thyroglobulin antibodies. MRI findings are nonspecific. Hashimoto encephalitis responds to treatment with corticosteroids, plasmapheresis, or immunosuppressive therapy.71
- Plassman BL, Langa KM, Fisher GG, et al. Prevalence of dementia in the United States: the aging, demographics, and memory study. Neuroepidemiology 2007; 29:125–132.
- Alzheimer’s Association. 2013 Alzheimer’s disease facts and figures. http://www.alz.org/downloads/facts_figures_2013.pdf. Accessed February 3, 2014.
- Hebert LE, Weuve J, Scherr PA, Evans DA. Alzheimer disease in the United States (2010-2050) estimated using the 2010 census. Neurology 2013; 80:1778–1783.
- Hou CE, Carlin D, Miller BL. Non-Alzheimer’s disease dementias: anatomic, clinical, and molecular correlates. Can J Psychiatry 2004; 49:164–171.
- Hachinski VC, Iliff LD, Zilhka E, et al. Cerebral blood flow in dementia. Arch Neurol 1975; 32:632–637.
- Fereshtehnejad SM, Religa D, Westman E, Aarsland D, Lökk J, Eriksdotter M. Demography, diagnostics, and medication in dementia with Lewy bodies and Parkinson’s disease with dementia: data from the Swedish Dementia Quality Registry (SveDem). Neuropsychiatr Dis Treat 2013; 9:927–935.
- Nomura T, Inoue Y, Takigawa H, Nakashima K. Comparison of REM sleep behaviour disorder variables between patients with progressive supranuclear palsy and those with Parkinson’s disease. Parkinsonism Relat Disord 2012; 18:394–396.
- Davis PH, Golbe LI, Duvoisin RC, Schoenberg BS. Risk factors for progrssive supranuclear palsy. Neurology 1988; 38:1546–1552.
- Tousi B, Schuele SU, Subramanian T. A 46-year-old woman with rigidity and frequent falls. Cleve Clin J Med 2005; 72:57–63.
- Cooper AD, Josephs KA. Photophobia, visual hallucinations, and REM sleep behavior disorder in progressive supranuclear palsy and corticobasal degeneration: a prospective study. Parkinsonism Relat Disord 2009; 15:59–61.
- Lyketsos CG, Lopez O, Jones B, Fitzpatrick AL, Breitner J, DeKosky S. Prevalence of neuropsychiatric symptoms in dementia and mild cognitive impairment: results from the cardiovascular health study0. JAMA 2002; 288:1475–1483.
- Knopman DS. Dementia and cerebrovascular disease. Mayo Clin Proc 2006; 81:223–230.
- Erkinjuntti T, Kurz A, Gauthier S, Bullock R, Lilienfeld S, Damaraju CV. Efficacy of galantamine in probable vascular dementia and Alzheimer’s disease combined with cerebrovascular disease: a randomised trial. Lancet 2002; 359:1283–1290.
- Sink KM, Holden KF, Yaffe K. Pharmacological treatment of neuropsychiatric symptoms of dementia: a review of the evidence. JAMA 2005; 293:596–608.
- Schneider LS, Dagerman K, Insel PS. Efficacy and adverse effects of atypical antipsychotics for dementia: meta-analysis of randomized, placebo-controlled trials. Am J Geriatr Psychiatry 2006; 14:191–210.
- McKeith IG, Dickson DW, Lowe J, et al; Consortium on DLB. Diagnosis and management of dementia with Lewy bodies: third report of the DLB Consortium. Neurology 2005; 65:1863–1872.
- Tartaglia MC, Rosen HJ, Miller BL. Neuroimaging in dementia. Neurotherapeutics 2011; 8:82–92.
- McKeith I, Del Ser T, Spano P, et al. Efficacy of rivastigmine in dementia with Lewy bodies: a randomised, double-blind, placebo-controlled international study. Lancet 2000; 356:2031–2036.
- Rolinski M, Fox C, Maidment I, McShane R. Cholinesterase inhibitors for dementia with Lewy bodies, Parkinson’s disease dementia and cognitive impairment in Parkinson’s disease. Cochrane Database Syst Rev 2012; 3:CD006504.
- Emre M, Tsolaki M, Bonucelli U, et al; on behalf of the 11018 Study Investigators. Memantine for patients with Parkinson’s disease dementia or dementia with Lewy bodies: a randomised, double-blind, placebo-controlled trial. Lancet Neurol 2010; 9:969–977.
- Kurlan R, Cummings J, Raman R, Thal L; Alzheimer’s Disease Cooperative Study Group. Quetiapine for agitation or psychosis in patients with dementia and parkinsonism. Neurology 2007; 68:1356–1363.
- Ballard C, Aarsland D, Francis P, Corbett A. Neuropsychiatric symptoms in patients with dementias associated with cortical Lewy bodies: pathophysiology, clinical features, and pharmacological management. Drugs Aging 2013; 30:603–611.
- Goetz CG, Leurgans S, Lang AE, Litvan I. Progression of gait, speech and swallowing deficits in progressive supranuclear palsy. Neurology 2003; 60:917–922.
- Kasashima S, Oda Y. Cholinergic neuronal loss in the basal forebrain and mesopontine tegmentum of progressive supranuclear palsy and corticobasal degeneration. Acta Neuropathol 2003; 105:117–124.
- Fahn S, Jankovic J, Hallett M, editors. Principles and Practice of Movement Disorders. 2nd ed. New York, NY: Elsevier/Saunders; 2011.
- Litvan I, Mangone CA, McKee A, et al. Natural history of progressive supranuclear palsy (Steele-Richardson-Olszewski syndrome) and clinical predictors of survival: a clinicopathological study. J Neurol Neurosurg Psychiatry 1996; 60:615–620.
- Boeve BF, Silber MH, Parisi JE, et al. Synucleinopathy pathology and REM sleep behavior disorder plus dementia or parkinsonism. Neurology 2003; 61:40–45.
- Pharr V, Uttl B, Stark M, Litvan I, Fantie B, Grafman J. Comparison of apraxia in corticobasal degeneration and progressive supranuclear palsy. Neurology 2001; 56:957–963.
- Williams DR, Lees AJ. What features improve the accuracy of the clinical diagnosis of progressive supranuclear palsy-parkinsonism (PSP-P)? Mov Disord 2010; 25:357–362.
- Wenning GK, Litvan I, Tolosa E. Milestones in atypical and secondary parkinsonisms. Mov Disord 2011; 26:1083–1095.
- Gallucci M, Limbucci N, Catalucci A, Caulo M. Neurodegenerative diseases. Radiol Clin North Am 2008; 46:799–817.
- Stamelou M, de Silva R, Arias-Carrión O, et al. Rational therapeutic approaches to progressive supranuclear palsy. Brain 2010; 133:1578–1590.
- Gold M, Lorenzl S, Stewart AJ, Morimoto BH, Williams DR, Gozes I. Critical appraisal of the role of davunetide in the treatment of progressive supranuclear palsy. Neuropsychiatr Dis Treat 2012; 8:85–93.
- Boeve BF, Lang AE, Litvan I. Corticobasal degeneration and its relationship to progressive supranuclear palsy and frontotemporal dementia. Ann Neurol 2003; 54(suppl 5):S15–S19.
- Armstrong MJ, Litvan I, Lang AE, et al. Criteria for the diagnosis of corticobasal degeneration. Neurology 2013; 80:496–503.
- Kompoliti K, Goetz CG, Boeve BF, et al. Clinical presentation and pharmacological therapy in corticobasal degeneration. Arch Neurol 1998; 55:957–961.
- Litvan I, Cummings JL, Mega M. Neuropsychiatric features of corticobasal degeneration. J Neurol Neurosurg Psychiatry 1998; 65:717–721.
- Pillon B, Blin J, Vidailhet M, et al. The neuropsychological pattern of corticobasal degeneration: comparison with progressive supranuclear palsy and Alzheimer’s disease. Neurology 1995; 45:1477–1483.
- Tang-Wai DF, Josephs KA, Boeve BF, Petersen RC, Parisi JE, Dickson DW. Coexistent Lewy body disease in a case of “visual variant of Alzheimer’s disease.” J Neurol Neurosurg Psychiatry 2003; 74:389.
- Tang-Wai DF, Josephs KA, Boeve BF, Dickson DW, Parisi JE, Petersen RC. Pathologically confirmed corticobasal degeneration presenting with visuospatial dysfunction. Neurology 2003; 61:1134–1135.
- Goto K, Ueki A, Shimode H, Shinjo H, Miwa C, Morita Y. Depression in multiple system atrophy: a case report. Psychiatry Clin Neurosci 2000; 54:507–511.
- Gilman S, Wenning GK, Low PA, et al. Second consensus statement on the diagnosis of multiple system atrophy. Neurology 2008; 71:670–676.
- Berent S, Giordani B, Gilman S, et al. Patterns of neuropsychological performance in multiple system atrophy compared to sporadic and hereditary olivopontocerebellar atrophy. Brain Cogn 2002; 50:194–206.
- Ghorayeb I, Yekhlef F, Chrysostome V, Balestre E, Bioulac B, Tison F. Sleep disorders and their determinants in multiple system atrophy. J Neurol Neurosurg Psychiatry 2002; 72:798–800.
- Schrag A, Kingsley D, Phatouros C, et al. Clinical usefulness of magnetic resonance imaging in multiple system atrophy. J Neurol Neurosurg Psychiatry 1998; 65:65–71.
- Massey LA, Micallef C, Paviour DC, et al. Conventional magnetic resonance imaging in confirmed progressive supranuclear palsy and multiple system atrophy. Mov Disord 2012; 27:1754–1762.
- Low PA, Gilden JL, Freeman R, Sheng KN, McElligott MA. Efficacy of midodrine vs placebo in neurogenic orthostatic hypotension. A randomized, double-blind multicenter study. Midodrine Study Group. JAMA 1997; 277:1046–1051.
- Mathias CJ, Kimber JR. Postural hypotension: causes, clinical features, investigation, and management. Annu Rev Med 1999; 50:317–336.
- Emre M, Aarsland D, Brown R, et al. Clinical diagnostic criteria for dementia associated with Parkinson’s disease. Mov Disord 2007; 22:1689–1707.
- Burton EJ, McKeith IG, Burn DJ, Williams ED, O’Brien JT. Cerebral atrophy in Parkinson’s disease with and without dementia: a comparison with Alzheimer’s disease, dementia with Lewy bodies and controls. Brain 2004; 127:791–800.
- Piert M, Koeppe RA, Giordani B, Minoshima S, Kuhl DE. Determination of regional rate constants from dynamic FDG-PET studies in Parkinson’s disease. J Nucl Med 1996; 37:1115–1122.
- Ratnavalli E, Brayne C, Dawson K, Hodges JR. The prevalence of frontotemporal dementia. Neurology 2002; 58:1615–1621.
- Baborie A, Griffiths TD, Jaros E, et al. Frontotemporal dementia in elderly individuals. Arch Neurol 2012; 69:1052–1960.
- Neary D, Snowden JS, Gustafson L, et al. Frontotemporal lobar degeneration: a consensus on clinical diagnostic criteria. Neurology 1998; 51:1546–1554.
- Kertesz A, Nadkarni N, Davidson W, Thomas AW. The Frontal Behavioral Inventory in the differential diagnosis of frontotemporal dementia. J Int Neuropsychol Soc 2000; 6:460–468.
- Mendez MF, Lauterbach EC, Sampson SM; ANPA Committee on Research. An evidence-based review of the psychopathology of frontotemporal dementia: a report of the ANPA Committee on Research. J Neuropsychiatry Clin Neurosci 2008; 20:130–149.
- Kertesz A, McMonagle P, Blair M, Davidson W, Munoz DG. The evolution and pathology of frontotemporal dementia. Brain 2005; 128:1996–2005.
- Mesulam MM. Primary progressive aphasia—a language-based dementia. N Engl J Med 2003; 349:1535–1542.
- Turner RS, Kenyon LC, Trojanowski JQ, Gonatas N, Grossman M. Clinical, neuroimaging, and pathologic features of progressive nonfluent aphasia. Ann Neurol 1996; 39:166–173.
- Abe K, Ukita H, Yanagihara T. Imaging in primary progressive aphasia. Neuroradiology 1997; 39:556–559.
- Trenkwalder C, Schwarz J, Gebhard J, et al. Starnberg trial on epidemiology of parkinsonism and hypertension in the elderly. Prevalence of Parkinson’s disease and related disorders assessed by a door-to-door survey of inhabitants older than 65 years. Arch Neurol 1995; 52:1017–1022.
- Hakim S, Adams RD. The special clinical problem of symptomatic hydrocephalus with normal cerebrospinal fluid pressure. Observations on cerebrospinal fluid hydrodynamics. J Neurol Sci 1965; 2:307–327.
- Vanneste JA. Diagnosis and management of normal-pressure hydrocephalus. J Neurol 2000; 247:5–14.
- Ishii K, Kanda T, Harada A, et al. Clinical impact of the callosal angle in the diagnosis of idiopathic normal pressure hydrocephalus. Eur Radiol 2008; 18:2678–2683.
- Marmarou A, Bergsneider M, Klinge P, Relkin N, Black PM. The value of supplemental prognostic tests for the preoperative assessment of idiopathic normal-pressure hydrocephalus. Neurosurgery 2005; 57(suppl 3):S17–S28.
- Bergsneider M, Miller C, Vespa PM, Hu X. Surgical management of adult hydrocephalus. Neurosurgery 2008; 62(suppl 2):643–659.
- Malm J, Graff-Radford NR, Ishikawa M, et al. Influence of comorbidities in idiopathic normal pressure hydrocephalus—research and clinical care. A report of the ISHCSF task force on comorbidities in INPH. Fluids Barriers CNS 2013; 10:22.
- Rabinovici GD, Wang PN, Levin J, et al. First symptom in sporadic Creutzfeldt-Jakob disease. Neurology 2006; 66:286–287.
- Zerr I, Kallenberg K, Summers DM, et al. Updated clinical diagnostic criteria for sporadic Creutzfeldt-Jakob disease. Brain 2009; 132:2659–2668.
- Dalmau J, Rosenfeld MR. Paraneoplastic syndromes of the CNS. Lancet Neurol 2008; 7:327–340.
- Chong JY, Rowland LP, Utiger RD. Hashimoto encephalopathy: syndrome or myth? Arch Neurol 2003; 60:164–171.
Dementia is not always due to Alzheimer disease. An accurate diagnosis is important, as the various causative conditions can differ in their course and treatment.
Dementia refers to cognitive impairment severe enough to interfere with the ability to independently perform activities of daily living. It can occur at any age but is most common after age 60. Some studies estimate that 13.9% of people age 71 and older have some form of dementia.1 The prevalence increases with age, ranging from 5% at age 70 to 79 to 37% at age 90 and older.1
Alzheimer disease accounts for about 60% to 80% of cases,2 or an estimated 4.7 million people age 65 and older in the United States, a number anticipated to climb to 13.8 million by 2050.3
Other types of dementia are less often considered and are challenging to recognize, although many have distinct characteristics. This article summarizes the features and management of the more common non-Alzheimer dementias:
- Vascular dementia
- Dementia with Lewy bodies
- Progressive supranuclear palsy
- Corticobasal degeneration
- Multiple system atrophy
- Parkinson disease dementia
- Frontotemporal dementia
- Primary progressive aphasia
- Normal-pressure hydrocephalus
- Rapidly progressive dementia (ie, Creutzfeld-Jakob disease, autoimmune disease).
VASCULAR DEMENTIA
After Alzheimer disease, vascular dementia is the most common dementia, accounting for about 20% to 30% of cases. Clinical criteria have not been widely accepted, although several have been published, including those in the Diagnostic and Statistical Manual of Mental Disorders (Fourth Edition) and the National Institute of Neurological and Communicative Diseases and Stroke-Association Internationale pour la Recherche et l’Enseignement en Neurosciences.
Risk factors for vascular dementia include cerebrovascular disease (hypertension, diabetes, hyperlipidemia) and coexisting conditions related to atherosclerosis (coronary artery disease, peripheral artery disease).
The Hachinski Ischemic Score is a good bedside tool to help differentiate Alzheimer dementia from vascular dementia.5
Sudden onset and stepwise decline
Vascular dementia often presents as a sudden and stepwise progression of cognitive deficits that stabilize and that are caused by vascular insults (Table 1).6–10 Some patients have continuous decline after a vascular event, indicating that Alzheimer dementia may also be present. Dementia is then defined as a mixed type.
Behavioral problems such as physical aggression, hallucinations, paranoia, and mood fluctuations are common.11
Deficits depend on vascular areas affected
Cognitive deficits are heterogeneous and are often related to the location of the vascular insult. Involvement of subcortical areas may result in executive dysfunction, slowed processing speed, and behavioral changes.12
Executive dysfunction may be identified using the Trail Making Test (Part B) or the Executive Interview (EXIT25). Office-based tools such as the Folstein Mini-Mental State Examination, the Montreal Cognitive Assessment, or the St. Louis University Mental Status Examination may also uncover these deficits.
Focal neurologic deficits may be found on clinical examination.
Structural neuroimaging may identify small strokes in areas of the brain affecting cognitive function or occlusion of a larger vessel associated with more profound neurologic deficits. Neuroimaging findings may not correlate with any significant decline noted by the patient, suggesting “silent” strokes.
Treat symptoms and manage risk factors
Although the US Food and Drug Administration (FDA) has not approved any pharmacotherapy for vascular dementia, commonly prescribed cognitive enhancers have demonstrated some benefit.13
Behavioral problems such as aggression can be disturbing to the patient and the caregiver. Nonpharmacologic methods (eg, redirection, rescheduling care activities to avoid conflict, avoiding issues that lead to agitation) should be tried first to address these problems.
Drug therapy may be used off-label for neuropsychiatric symptoms such as hallucinations, delusions, and combativeness, but clinical trials of these agents for this purpose have shown mixed results,14 and their use is often associated with significant risk.15 Antipsychotic drugs are associated with a risk of death and pneumonia when prescribed for dementia. Many also carry a risk of QT prolongation, which is particularly concerning for patients with coronary artery disease or rhythm disturbances.
The key to reducing further decline is to optimize management of vascular risk factors to reduce stroke risk.
DEMENTIA WITH LEWY BODIES
Dementia with Lewy bodies, the next most common neurodegenerative dementia in the elderly, is characterized by progressive loss of cognitive function, prominent visual hallucinations, and parkinsonism (Table 1).6 Disease progression usually occurs over years but can be more rapid than in Alzheimer disease.
Alpha-synucleinopathy results in dysfunction of synaptic vesicles in presynaptic terminals. Lewy bodies may be diffusely spread in cortical and subcortical areas (appearing as spherical masses).
Visual hallucinations are typical
The McKeith criteria16 are the gold standard for diagnosing probable Lewy body dementia, based on clinical and imaging features (Table 2).
Visual hallucinations are usually well formed and detailed. They may initially be pleasant (eg, seeing children and little people) but may evolve to be accompanied by persecutory delusions.
Parkinsonism develops with or after dementia with Lewy bodies
Dementia with Lewy bodies and Parkinson disease dementia share many clinical and pathologic features; Parkinson dementia also is associated with cortical Lewy bodies.
Parkinsonian features include bradykinesia, masked facies, and rigidity. Resting tremor is less common.
The third report of the Dementia With Lewy Bodies Consortium recommends that the condition be diagnosed if dementia occurs before or concurrently with parkinsonism, and dementia with Parkinson disease should be diagnosed if dementia occurs in the context of well-established Parkinson disease.16 The development of dementia within 12 months of extrapyramidal signs suggests dementia with Lewy bodies.
Cognitive deficits fluctuate
Cognitive impairment in Lewy body dementia is characterized by progressive dementia with fluctuations in cognitive performance. Family members or caregivers may report that the patient can carry on a conversation one day and the next day be confused and inattentive. Compared with those with Alzheimer dementia, patients with Lewy body dementia have better delayed recall but more problems with executive functioning (planning) and visuospatial skills (following an unfamiliar route, copying a figure).
Specialized imaging provides clues
Dementia with Lewy bodies is associated with diffuse brain atrophy, with no established characteristic pattern on structural neuroimaging with computed tomography (CT) or magnetic resonance imaging (MRI).17 The contrast agent ioflupane iodine-123 injection (DaTscan) used with single-photon emission CT (SPECT) detects dopamine transporters, which are reduced in parkinsonian syndromes. The scan can also help differentiate between Alzheimer dementia and Lewy body dementia by detecting the loss of functional dopaminergic terminals in the striatum in Lewy body dementia. Alpha-synuclein imaging may become another useful diagnostic tool in the future.
Alzheimer medications may help in dementia with Lewy bodies
Medications with anticholinergic effects and dopamine agonists should be discontinued because of possible effects on cognitive function and parkinsonism. In one clinical trial,18 rivastigmine (Exelon) was found to help cognitive functioning as well as reduce psychotic symptoms in dementia with Lewy bodies, although a recent Cochrane review could not support the evidence for use of all cholinesterase inhibitors in Lewy body dementia.19 In another trial,20 memantine (Namenda) was found to improve global clinical status and behavioral symptoms of Lewy body dementia.
Treating hallucinations of dementia with Lewy bodies
Patients with dementia with Lewy bodies are extremely sensitive to the extrapyramidal side effects of neuroleptic drugs. Some evidence indicates that the atypical antipsychotic drug quetiapine (Seroquel) helps with prominent and disturbing psychotic features and is less likely to worsen parkinsonism than other antipsychotics.21 The best evidence is for clozapine (Clozaril) as a treatment for hallucinations in Parkinson dementia, but the possible side effect of agranulocytosis limits its clinical use. Other atypical antipsychotics such as risperidone (Risperdal) and olanzapine (Zyprexa) are not recommended.22
PROGRESSIVE SUPRANUCLEAR PALSY
Progressive supranuclear palsy is a sporadic atypical parkinsonian disorder with onset between age 50 and 70. Familial cases are infrequent.
Progressive supranuclear palsy presents as early postural instability, vertical supranuclear gaze palsy, and axial muscle rigidity in the first few years. Disease progression is gradual: one study of 50 patients found that the median time from onset to the first key motor impairment (unintelligible speech, no independent walking, inability to stand unassisted, wheelchair-bound, or recommendation for feeding tube placement) was 4 years.23
Histologically, progressive supranuclear palsy is characterized by accumulation of tau protein aggregates in the basal ganglia, brainstem, and cerebral cortex. The degenerative process involves dopaminergic, cholinergic, and gamma-aminobutyric acid (GABA)-ergic neurons.24
Gait and balance problems predominate early in progressive supranuclear palsy
The most commonly used diagnostic criteria are from the National Institute of Neurological Disorders and Stroke. The diagnosis of probable progressive supranuclear palsy requires vertical gaze palsy and falls or the tendency to fall within the first year of disease onset and exclusion of other causes.
The earliest symptom is usually gait and balance impairment.25 Falls (usually backward) and postural instability occur during the first year in 58% of patients.26 Instead of turning en bloc as in Parkinson disease, patients with progressive supranuclear palsy tend to pivot quickly. Patients may also have a coarse groaning voice and moaning. Insomnia has been reported, but rapid-eye-movement sleep behavior disorders are infrequent (unlike in Parkinson disease, multiple system atrophy, and Lewy body dementia).27
Apathy and extreme mood swings
Cognitive impairment is seen in 50% of patients in the early stage of progressive supranuclear palsy. It mostly involves the frontal lobe, including frontal behavioral disturbances (eg, apathy in 91% of patients26 or pseudobulbar affect and extreme emotional lability) and deficits in abstract thoughts or verbal fluency (to test this, patients are asked to say as many words as possible from a category in a given time). Ideomotor apraxia (inability to correctly imitate hand gestures and voluntarily pantomime tool use, such as pretending to brush hair) is rare, despite corticobasal degeneration.28
Vertical gaze palsy
The hallmark of progressive supranuclear palsy is vertical gaze palsy. Initially, this involves slowing of vertical saccades, followed by diminished vertical gaze and more characteristic downward gaze palsy. These findings may develop over 3 to 4 years. Vertical gaze palsy leads to spilling food and tripping while walking.
The gaze abnormality combined with rare blinking and facial dystonia form the classic facial expression of astonishment called “leonine facies.” The face is stiff and deeply furrowed, with a look of surprise.
Axial (especially neck) rigidity is more prominent than limb rigidity. Retrocollis (the head is drawn back) occurs in less than 25% of patients. Parkinsonian features such as bradykinesia affect nearly half of patients by the time of diagnosis.
Instead of the classic symptoms of progressive supranuclear palsy, about one-third of patients present with progressive supranuclear palsy-parkinsonism, which involves asymmetric parkinsonism that initially responds to levodopa.29
MRI shows ‘hummingbird sign’
Brain MRI shows atrophy of the brainstem, particularly the midbrain. Thinning of the superior part of the midbrain and dilation of the third ventricle (“hummingbird sign” on sagittal sections or “morning glory flower” on axial sections) support a diagnosis of progressive supranuclear palsy and differentiate it from Parkinson disease and other atypical parkinsonian disorders.30,31
Levodopa ineffective for supranuclear palsy
There is no treatment to slow progressive supranuclear palsy. Even in high doses, levodopa rarely alleviates parkinsonian features in a clinically meaningful way.26 Successful experimental biologic therapies have been studied in animal models.32 Davunetide is thought to help with neuronal integrity and cell survival through the stabilization of microtubules in preclinical studies, but it has not been used in clinical practice.33
CORTICOBASAL DEGENERATION
Corticobasal degeneration is a progressive, asymmetric movement disorder often manifesting initially with cognitive or behavioral impairment. It is associated with abnormality of the cytoskeleton protein tau. Onset is usually after age 60.
Asymmetric movement disorder with cognitive dysfunction
This diagnosis is clinical. Diagnostic criteria proposed in 2003 include the following core features34:
- Insidious onset and progressive course
- No identifiable cause
- Cortical dysfunction with at least one of the following: apraxia, alien limb phenomenon (one limb moves involuntarily with complex movements, eg, grabbing the other hand), cortical sensory loss, visual hemineglect, nonfluent aphasia
- Extrapyramidal dysfunction: focal rigidity unresponsive to levodopa, asymmetric dystonia.
An international consortium has developed more specific clinical research criteria for probable and possible corticobasal degeneration.35 In a series of 147 patients, the following clinical features were found: parkinsonism (100%), higher cortical dysfunction (93%), dyspraxia (82%), gait disorder (80%), unilateral limb dystonia (71%), tremor (55%), and dementia (25%).36
Behavioral problems commonly include depression; apathy, irritability, and agitation are also reported.37
Cognitive testing may reveal deficits in frontal-parietal cognitive domains including attention and concentration, executive function, verbal fluency, and visuospatial skills.38 Learning disabilities may be improved with verbal cueing (in contrast to Alzheimer disease). Patients may also have impaired graphesthesia (the ability to recognize writing on the skin only by the sensation of touch).39,40
Motor examination may reveal marked asymmetry. Hand, limb, speech, and gait apraxias are common. Gait is typically slow, with short steps and shuffling, and a wide-based or freezing gait. Arm swing may be absent on one side.
Asymmetric cortical atrophy
Early on, MRI may be normal. As the disease progresses, asymmetric cortical atrophy may be seen, especially in the posterior frontal and parietal lobes.
Levodopa ineffective in corticobasal degeneration
Corticobasal degeneration responds poorly to levodopa. Botulinum toxin has been used to help with dystonia and limb pain.
MULTIPLE SYSTEM ATROPHY
Multiple system atrophy is another atypical parkinsonian disorder, most often diagnosed in men over age 60. It is characterized by sporadic parkinsonism, cerebellar signs (involving balance and coordination), pyramidal tract dysfunction, and autonomic insufficiency in varying combinations. Two major subtypes are recognized, depending on whether the predominating presenting features are cerebellar signs or parkinsonism. In contrast to dementia with Lewy bodies, psychiatric symptoms are not a major feature, except possibly depression.41
Diagnosis requires a sporadic progressive disorder that has features of autonomic failure and poor response of parkinsonism or cerebellar ataxia to levodopa.42
Multiple system atrophy is usually not associated with dementia in the early stages, but patients develop deficits in learning, recognition, memory, and verbal fluency as the disease progresses.43 Rapid-eye-movement sleep behavior disorder has been reported in more than half of patients.44
A neurologic examination provides clues
Parkinsonian features are usually symmetric, in contrast to idiopathic Parkinson disease. These signs may include akinesia with rigidity, postural instability, hypokinetic speech, and tremor.
Cerebellar signs include nystagmus and dysarthria (speech disturbance), and gait and limb ataxia.
Pyramidal features include extensor plantar responses and hyperreflexia.
Autonomic dysfunction includes orthostatic hypotension, bladder and rectal atony, loss of sweating, urinary or fecal incontinence, and erectile dysfunction.
Electromyography may demonstrate decreased anal sphincter tone.
MRI shows atrophy of putamen and pons
Brain MRI may show atrophy of the putamen (hypointensity of the putamen with a hyperintense rim). Pons atrophy may also be present, revealing a “hot cross bun” sign in axial images. These combined findings have specificity above 90% but limited sensitivity. These signs are useful to distinguish multiple system atrophy from Parkinson dementia, but their absence does not exclude the diagnosis of multiple system atrophy.45,46
Multiple system atrophy typically responds poorly to levodopa
Levodopa may improve movement and rigidity, but many respond poorly to treatment or lose response after a few years. Fludrocortisone (Florinef) or vasoconstrictors such as midodrine (Orvaten, Proamatine) may help with orthostatic hypotension.47,48
PARKINSON DISEASE DEMENTIA
Dementia eventually develops in most patients with Parkinson disease. Older age and the akinetic rigid form of the disease are associated with higher risk. Diagnosis of idiopathic Parkinson disease before the development of dementia is essential for the diagnosis.
The Movement Disorder Society Task Force has developed new diagnostic criteria.49 Deficits must be present in at least two of the four core cognitive domains (attention, memory, executive, and visuospatial functions) and must be severe enough to affect daily functioning.
Behavioral symptoms such as affective changes, hallucinations, and apathy are common.
MRI shows characteristic brain atrophy in Parkinson disease dementia
MRI shows reduced gray matter volume in the frontal lobe in patients with Parkinson disease without dementia compared with controls. In Parkinson disease dementia, reduced volume extends to temporal, occipital, and subcortical areas. No significant volumetric differences have been observed in Parkinson dementia compared with dementia with Lewy bodies.50 A greater decrease of glucose metabolism has been found in the inferior parietal and occipital lobes in Parkinson disease dementia than in Parkinson disease without dementia.51
Rivastigmine effective for dementia
A Cochrane review supports the use of acetylcholinesterase inhibitors in patients with Parkinson disease dementia, with a positive impact on global assessment, cognitive function, behavioral disturbance, and activities of daily living rating scales.19 At this time, rivastigmine is the only FDA-approved cholinesterase inhibitor for treating Parkinson disease dementia. In clinical trials, memantine did not improve global clinical status or behavioral symptoms of dementia of Parkinson disease.51
FRONTOTEMPORAL DEMENTIA
Frontotemporal dementia frequently starts before age 65 and accounts for 20% to 50% of dementias in this age group.52 Recognition of the condition in older patients is also growing.53 Frontotemporal dementia encompasses a spectrum of dementias, including behavioral variant frontotemporal dementia, semantic dementia, and progressive nonfluent aphasia.54
Gradual onset of uncharacteristic behaviors
Accepted diagnostic criteria include core features of gradual onset, early decline in social and interpersonal conduct, early impairment of self-regulation, emotional blunting, and loss of insight. Many patients are diagnosed with psychiatric conditions. Changes reported by family and caregivers typically deviate substantially from the person’s usual behavior, such as impulsive and inappropriate behaviors or complete withdrawal and apathy.
Language sometimes affected in frontotemporal dementia
Language impairment may be present in some variants. Behavioral and language changes often accompany other forms of dementia (Alzheimer disease, vascular dementia, primary progressive aphasia), making diagnosis more challenging. Office-based testing often does not reveal any deficits, although the Frontal Behavioral Inventory may help.55 A referral to a clinical neuropsychologist may help identify and quantify cognitive impairments.
MRI shows frontotemporal lobes affected
Structural neuroimaging may not reveal abnormalities initially, but with progression, atrophy may be seen in the frontal and temporal lobes. Functional neuroimaging (positron emission tomography, brain SPECT, functional MRI) show hypometabolism in the same areas.
Treat symptoms
There are no specific FDA-approved therapies for frontotemporal dementia. Acetylcholinesterase inhibitors can help progressive nonfluent aphasia in some cases. Selective serotonin reuptake inhibitors may alleviate depressive symptoms, and low doses of atypical antipsychotic medications may help with impulsivity, disinhibition, and aggressive or disruptive behaviors.56
PRIMARY PROGRESSIVE APHASIA
Language impairment predominates
Primary progressive aphasia is a rare form of dementia in which symptoms typically develop around age 60. Pathology is varied. In a study of 60 patients with initial clinical symptoms of primary progressive aphasia, postmortem histology of brain tissue revealed various findings, including those consistent with Alzheimer pathology and motor neuron diseasetype inclusions.57
Patients typically present with expressive language problems as the primary deficit for the first 2 years of the disease, with preservation in other cognitive areas such as memory, visuospatial skills, and executive function.58 Office-based testing may overstate the severity of the dementia, given the dependence of performance on intact language.
It is important to distinguish primary progressive aphasia from other dementias that also affect language. In the frontal variant of frontotemporal dementia, the primary language problem is anomia (inability to name objects) or diminished speech output, which may be accompanied by behavioral problems. Semantic dementia affects word recognition as well as comprehension. In Alzheimer disease, language may be affected along with memory and other areas of cognitive function.
Imaging shows focal degeneration in the left hemisphere
Structural neuroimaging does not initially reveal any deficits, but later it may reveal atrophy in the frontal, perisylvian complex, and temporal areas of the left hemisphere, reflecting the focal nature of the degeneration.59 Functional neuroimaging (positron emission tomography, SPECT) may reveal hypometabolism or diminished blood flow in these areas prior to changes in structural neuroimaging.60
Other communication methods may help
There are no FDA-approved therapies for primary progressive aphasia. Off-label use of some agents (eg, selective serotonin reuptake inhibitors and small doses of antipsychotic medications) has been found useful in small trials.56 Patients may benefit from learning other forms of communication, such as using sign language, laminated cards with printed words or pictures, or artificial voice synthesizers, to express their needs.
NORMAL-PRESSURE HYDROCEPHALUS
Classic triad: Gait, cognition, incontinence
With the onset of symptoms in the sixth or seventh decade, normal-pressure hydrocephalus affects less than 1% of people age 65 and older. It represents up to 5% of dementias, although estimates are influenced by the varied criteria for diagnosis.61 It is characterized by the classic triad of gait impairment, cognitive impairment, and urinary frequency or incontinence.62
Symptoms progress over a period of years, with gait impairment often predominating. As this triad is common in the geriatric population, identifying other explanations is important. Gait impairment caused by spinal stenosis, peripheral neuropathy, or parkinsonism should be explored. Cognitive impairment could be due to depression, Alzheimer disease, or other forms of dementia. Urinary symptoms may be related to detrusor instability or an enlarged prostate.
Gait impairment initially manifests as slowing of gait, but progresses to difficulty with gait initiation. Gait tends to be wide-based (stance more than 1 foot wide).
Cognitive impairment is typically subcortical, manifested as slowed processing speed and impaired executive function. Recall and working memory may be impaired.
Enlarged ventricles seen on imaging in normal-pressure hydrocephalus
Structural neuroimaging reveals enlarged ventricles (Evan’s ratio > 0.358). This can be difficult to distinguish from ventriculomegaly due to cerebral atrophy; assessing the callosal angle on MRI may distinguish the two.63,64 Diagnosis of normal-pressure hydrocephalus can be confirmed using a cerebrospinal fluid infusion test to assess resistance of fluid to resorption.65
Treat with cerebrospinal fluid drainage
Specific tests should be performed to determine candidacy for surgery. These include a high-volume lumbar puncture (40 to 50 mL) or a trial of external lumbar drainage (10 mL per hour for 48 to 72 hours).65 Definitive treatment is surgical placement of a shunt to allow cerebrospinal fluid to drain into the atria or peritoneal cavity.
Surgery may improve gait, but cognitive symptoms often remain,66 and clinical decline may occur after the shunt is placed. Once gait dysfunction is resolved, other explanations for cognitive impairment or residual gait impairment should be considered. An underlying reason for progression of normal-pressure hydrocephalus symptoms after surgical intervention should be identified.67
RAPIDLY PROGRESSIVE DEMENTIAS
Rapidly progressive dementias are among the most challenging of dementing illnesses. They are characterized by a subacute course and an accelerated rate of decline, developing in less than 2 years. Evaluation should typically be more comprehensive than for other types of dementia. The main goal is to diagnose potentially treatable conditions, such as Hashimoto encephalopathy or paraneoplastic limbic encephalitis, and to distinguish these conditions from diseases with a very poor prognosis, such as Creutzfeldt-Jakob disease.
Creutzfeldt-Jakob disease
Creutzfeldt-Jakob disease is a fatal prion-related neurodegenerative illness. Sporadic disease is most common, but variant, familial, and iatrogenic types have been reported. The most common initial symptoms in sporadic disease are cognitive (39%), cerebellar (21%), behavioral (20%), constitutional (20%), sensory (11%), motor (9%), and visual (7%).68
Chronic neurodegenerative diseases can be misdiagnosed as Creutzfeldt-Jakob disease because of an atypical time course and multi-system neurologic findings.
The US Centers for Disease Control and Prevention has adopted criteria for diagnosing probable Creutzfeldt-Jakob disease (Table 3). Routine investigations should also not suggest an alternative diagnosis.69
Autoimmune diseases
Autoimmune conditions may present as a rapidly progressive dementia, including Hashimoto encephalopathy and antibody-mediated limbic encephalitis, either associated with cancer (paraneoplastic) or without cancer (nonparaneoplastic).
Paraneoplastic limbic encephalitis is a group of inflammatory conditions involving antibodies produced within the cerebrospinal fluid and serum resulting in neurologic symptoms. These antibodies react against proteins expressed mostly by a tumor somewhere else in the body.70
Hashimoto encephalitis is a subacute to chronic encephalopathy that may present as dementia with abnormally high levels of thyroid antibodies. The symptoms can vary from confusion to psychosis. There are two main presentations: one involves a relapsing-remitting course with stroke-like episodes (27% of patients) and the second consists of insidious onset of seizures (66% of patients).
Diagnosis involves testing for elevated anti-thyroid peroxidase and thyroglobulin antibodies. MRI findings are nonspecific. Hashimoto encephalitis responds to treatment with corticosteroids, plasmapheresis, or immunosuppressive therapy.71
- Plassman BL, Langa KM, Fisher GG, et al. Prevalence of dementia in the United States: the aging, demographics, and memory study. Neuroepidemiology 2007; 29:125–132.
- Alzheimer’s Association. 2013 Alzheimer’s disease facts and figures. http://www.alz.org/downloads/facts_figures_2013.pdf. Accessed February 3, 2014.
- Hebert LE, Weuve J, Scherr PA, Evans DA. Alzheimer disease in the United States (2010-2050) estimated using the 2010 census. Neurology 2013; 80:1778–1783.
- Hou CE, Carlin D, Miller BL. Non-Alzheimer’s disease dementias: anatomic, clinical, and molecular correlates. Can J Psychiatry 2004; 49:164–171.
- Hachinski VC, Iliff LD, Zilhka E, et al. Cerebral blood flow in dementia. Arch Neurol 1975; 32:632–637.
- Fereshtehnejad SM, Religa D, Westman E, Aarsland D, Lökk J, Eriksdotter M. Demography, diagnostics, and medication in dementia with Lewy bodies and Parkinson’s disease with dementia: data from the Swedish Dementia Quality Registry (SveDem). Neuropsychiatr Dis Treat 2013; 9:927–935.
- Nomura T, Inoue Y, Takigawa H, Nakashima K. Comparison of REM sleep behaviour disorder variables between patients with progressive supranuclear palsy and those with Parkinson’s disease. Parkinsonism Relat Disord 2012; 18:394–396.
- Davis PH, Golbe LI, Duvoisin RC, Schoenberg BS. Risk factors for progrssive supranuclear palsy. Neurology 1988; 38:1546–1552.
- Tousi B, Schuele SU, Subramanian T. A 46-year-old woman with rigidity and frequent falls. Cleve Clin J Med 2005; 72:57–63.
- Cooper AD, Josephs KA. Photophobia, visual hallucinations, and REM sleep behavior disorder in progressive supranuclear palsy and corticobasal degeneration: a prospective study. Parkinsonism Relat Disord 2009; 15:59–61.
- Lyketsos CG, Lopez O, Jones B, Fitzpatrick AL, Breitner J, DeKosky S. Prevalence of neuropsychiatric symptoms in dementia and mild cognitive impairment: results from the cardiovascular health study0. JAMA 2002; 288:1475–1483.
- Knopman DS. Dementia and cerebrovascular disease. Mayo Clin Proc 2006; 81:223–230.
- Erkinjuntti T, Kurz A, Gauthier S, Bullock R, Lilienfeld S, Damaraju CV. Efficacy of galantamine in probable vascular dementia and Alzheimer’s disease combined with cerebrovascular disease: a randomised trial. Lancet 2002; 359:1283–1290.
- Sink KM, Holden KF, Yaffe K. Pharmacological treatment of neuropsychiatric symptoms of dementia: a review of the evidence. JAMA 2005; 293:596–608.
- Schneider LS, Dagerman K, Insel PS. Efficacy and adverse effects of atypical antipsychotics for dementia: meta-analysis of randomized, placebo-controlled trials. Am J Geriatr Psychiatry 2006; 14:191–210.
- McKeith IG, Dickson DW, Lowe J, et al; Consortium on DLB. Diagnosis and management of dementia with Lewy bodies: third report of the DLB Consortium. Neurology 2005; 65:1863–1872.
- Tartaglia MC, Rosen HJ, Miller BL. Neuroimaging in dementia. Neurotherapeutics 2011; 8:82–92.
- McKeith I, Del Ser T, Spano P, et al. Efficacy of rivastigmine in dementia with Lewy bodies: a randomised, double-blind, placebo-controlled international study. Lancet 2000; 356:2031–2036.
- Rolinski M, Fox C, Maidment I, McShane R. Cholinesterase inhibitors for dementia with Lewy bodies, Parkinson’s disease dementia and cognitive impairment in Parkinson’s disease. Cochrane Database Syst Rev 2012; 3:CD006504.
- Emre M, Tsolaki M, Bonucelli U, et al; on behalf of the 11018 Study Investigators. Memantine for patients with Parkinson’s disease dementia or dementia with Lewy bodies: a randomised, double-blind, placebo-controlled trial. Lancet Neurol 2010; 9:969–977.
- Kurlan R, Cummings J, Raman R, Thal L; Alzheimer’s Disease Cooperative Study Group. Quetiapine for agitation or psychosis in patients with dementia and parkinsonism. Neurology 2007; 68:1356–1363.
- Ballard C, Aarsland D, Francis P, Corbett A. Neuropsychiatric symptoms in patients with dementias associated with cortical Lewy bodies: pathophysiology, clinical features, and pharmacological management. Drugs Aging 2013; 30:603–611.
- Goetz CG, Leurgans S, Lang AE, Litvan I. Progression of gait, speech and swallowing deficits in progressive supranuclear palsy. Neurology 2003; 60:917–922.
- Kasashima S, Oda Y. Cholinergic neuronal loss in the basal forebrain and mesopontine tegmentum of progressive supranuclear palsy and corticobasal degeneration. Acta Neuropathol 2003; 105:117–124.
- Fahn S, Jankovic J, Hallett M, editors. Principles and Practice of Movement Disorders. 2nd ed. New York, NY: Elsevier/Saunders; 2011.
- Litvan I, Mangone CA, McKee A, et al. Natural history of progressive supranuclear palsy (Steele-Richardson-Olszewski syndrome) and clinical predictors of survival: a clinicopathological study. J Neurol Neurosurg Psychiatry 1996; 60:615–620.
- Boeve BF, Silber MH, Parisi JE, et al. Synucleinopathy pathology and REM sleep behavior disorder plus dementia or parkinsonism. Neurology 2003; 61:40–45.
- Pharr V, Uttl B, Stark M, Litvan I, Fantie B, Grafman J. Comparison of apraxia in corticobasal degeneration and progressive supranuclear palsy. Neurology 2001; 56:957–963.
- Williams DR, Lees AJ. What features improve the accuracy of the clinical diagnosis of progressive supranuclear palsy-parkinsonism (PSP-P)? Mov Disord 2010; 25:357–362.
- Wenning GK, Litvan I, Tolosa E. Milestones in atypical and secondary parkinsonisms. Mov Disord 2011; 26:1083–1095.
- Gallucci M, Limbucci N, Catalucci A, Caulo M. Neurodegenerative diseases. Radiol Clin North Am 2008; 46:799–817.
- Stamelou M, de Silva R, Arias-Carrión O, et al. Rational therapeutic approaches to progressive supranuclear palsy. Brain 2010; 133:1578–1590.
- Gold M, Lorenzl S, Stewart AJ, Morimoto BH, Williams DR, Gozes I. Critical appraisal of the role of davunetide in the treatment of progressive supranuclear palsy. Neuropsychiatr Dis Treat 2012; 8:85–93.
- Boeve BF, Lang AE, Litvan I. Corticobasal degeneration and its relationship to progressive supranuclear palsy and frontotemporal dementia. Ann Neurol 2003; 54(suppl 5):S15–S19.
- Armstrong MJ, Litvan I, Lang AE, et al. Criteria for the diagnosis of corticobasal degeneration. Neurology 2013; 80:496–503.
- Kompoliti K, Goetz CG, Boeve BF, et al. Clinical presentation and pharmacological therapy in corticobasal degeneration. Arch Neurol 1998; 55:957–961.
- Litvan I, Cummings JL, Mega M. Neuropsychiatric features of corticobasal degeneration. J Neurol Neurosurg Psychiatry 1998; 65:717–721.
- Pillon B, Blin J, Vidailhet M, et al. The neuropsychological pattern of corticobasal degeneration: comparison with progressive supranuclear palsy and Alzheimer’s disease. Neurology 1995; 45:1477–1483.
- Tang-Wai DF, Josephs KA, Boeve BF, Petersen RC, Parisi JE, Dickson DW. Coexistent Lewy body disease in a case of “visual variant of Alzheimer’s disease.” J Neurol Neurosurg Psychiatry 2003; 74:389.
- Tang-Wai DF, Josephs KA, Boeve BF, Dickson DW, Parisi JE, Petersen RC. Pathologically confirmed corticobasal degeneration presenting with visuospatial dysfunction. Neurology 2003; 61:1134–1135.
- Goto K, Ueki A, Shimode H, Shinjo H, Miwa C, Morita Y. Depression in multiple system atrophy: a case report. Psychiatry Clin Neurosci 2000; 54:507–511.
- Gilman S, Wenning GK, Low PA, et al. Second consensus statement on the diagnosis of multiple system atrophy. Neurology 2008; 71:670–676.
- Berent S, Giordani B, Gilman S, et al. Patterns of neuropsychological performance in multiple system atrophy compared to sporadic and hereditary olivopontocerebellar atrophy. Brain Cogn 2002; 50:194–206.
- Ghorayeb I, Yekhlef F, Chrysostome V, Balestre E, Bioulac B, Tison F. Sleep disorders and their determinants in multiple system atrophy. J Neurol Neurosurg Psychiatry 2002; 72:798–800.
- Schrag A, Kingsley D, Phatouros C, et al. Clinical usefulness of magnetic resonance imaging in multiple system atrophy. J Neurol Neurosurg Psychiatry 1998; 65:65–71.
- Massey LA, Micallef C, Paviour DC, et al. Conventional magnetic resonance imaging in confirmed progressive supranuclear palsy and multiple system atrophy. Mov Disord 2012; 27:1754–1762.
- Low PA, Gilden JL, Freeman R, Sheng KN, McElligott MA. Efficacy of midodrine vs placebo in neurogenic orthostatic hypotension. A randomized, double-blind multicenter study. Midodrine Study Group. JAMA 1997; 277:1046–1051.
- Mathias CJ, Kimber JR. Postural hypotension: causes, clinical features, investigation, and management. Annu Rev Med 1999; 50:317–336.
- Emre M, Aarsland D, Brown R, et al. Clinical diagnostic criteria for dementia associated with Parkinson’s disease. Mov Disord 2007; 22:1689–1707.
- Burton EJ, McKeith IG, Burn DJ, Williams ED, O’Brien JT. Cerebral atrophy in Parkinson’s disease with and without dementia: a comparison with Alzheimer’s disease, dementia with Lewy bodies and controls. Brain 2004; 127:791–800.
- Piert M, Koeppe RA, Giordani B, Minoshima S, Kuhl DE. Determination of regional rate constants from dynamic FDG-PET studies in Parkinson’s disease. J Nucl Med 1996; 37:1115–1122.
- Ratnavalli E, Brayne C, Dawson K, Hodges JR. The prevalence of frontotemporal dementia. Neurology 2002; 58:1615–1621.
- Baborie A, Griffiths TD, Jaros E, et al. Frontotemporal dementia in elderly individuals. Arch Neurol 2012; 69:1052–1960.
- Neary D, Snowden JS, Gustafson L, et al. Frontotemporal lobar degeneration: a consensus on clinical diagnostic criteria. Neurology 1998; 51:1546–1554.
- Kertesz A, Nadkarni N, Davidson W, Thomas AW. The Frontal Behavioral Inventory in the differential diagnosis of frontotemporal dementia. J Int Neuropsychol Soc 2000; 6:460–468.
- Mendez MF, Lauterbach EC, Sampson SM; ANPA Committee on Research. An evidence-based review of the psychopathology of frontotemporal dementia: a report of the ANPA Committee on Research. J Neuropsychiatry Clin Neurosci 2008; 20:130–149.
- Kertesz A, McMonagle P, Blair M, Davidson W, Munoz DG. The evolution and pathology of frontotemporal dementia. Brain 2005; 128:1996–2005.
- Mesulam MM. Primary progressive aphasia—a language-based dementia. N Engl J Med 2003; 349:1535–1542.
- Turner RS, Kenyon LC, Trojanowski JQ, Gonatas N, Grossman M. Clinical, neuroimaging, and pathologic features of progressive nonfluent aphasia. Ann Neurol 1996; 39:166–173.
- Abe K, Ukita H, Yanagihara T. Imaging in primary progressive aphasia. Neuroradiology 1997; 39:556–559.
- Trenkwalder C, Schwarz J, Gebhard J, et al. Starnberg trial on epidemiology of parkinsonism and hypertension in the elderly. Prevalence of Parkinson’s disease and related disorders assessed by a door-to-door survey of inhabitants older than 65 years. Arch Neurol 1995; 52:1017–1022.
- Hakim S, Adams RD. The special clinical problem of symptomatic hydrocephalus with normal cerebrospinal fluid pressure. Observations on cerebrospinal fluid hydrodynamics. J Neurol Sci 1965; 2:307–327.
- Vanneste JA. Diagnosis and management of normal-pressure hydrocephalus. J Neurol 2000; 247:5–14.
- Ishii K, Kanda T, Harada A, et al. Clinical impact of the callosal angle in the diagnosis of idiopathic normal pressure hydrocephalus. Eur Radiol 2008; 18:2678–2683.
- Marmarou A, Bergsneider M, Klinge P, Relkin N, Black PM. The value of supplemental prognostic tests for the preoperative assessment of idiopathic normal-pressure hydrocephalus. Neurosurgery 2005; 57(suppl 3):S17–S28.
- Bergsneider M, Miller C, Vespa PM, Hu X. Surgical management of adult hydrocephalus. Neurosurgery 2008; 62(suppl 2):643–659.
- Malm J, Graff-Radford NR, Ishikawa M, et al. Influence of comorbidities in idiopathic normal pressure hydrocephalus—research and clinical care. A report of the ISHCSF task force on comorbidities in INPH. Fluids Barriers CNS 2013; 10:22.
- Rabinovici GD, Wang PN, Levin J, et al. First symptom in sporadic Creutzfeldt-Jakob disease. Neurology 2006; 66:286–287.
- Zerr I, Kallenberg K, Summers DM, et al. Updated clinical diagnostic criteria for sporadic Creutzfeldt-Jakob disease. Brain 2009; 132:2659–2668.
- Dalmau J, Rosenfeld MR. Paraneoplastic syndromes of the CNS. Lancet Neurol 2008; 7:327–340.
- Chong JY, Rowland LP, Utiger RD. Hashimoto encephalopathy: syndrome or myth? Arch Neurol 2003; 60:164–171.
KEY POINTS
- Vascular dementia presents as a sudden, stepwise progression of cognitive deficits.
- Lewy body dementia often involves prominent visual hallucinations.
- Progressive supranuclear palsy starts with gait and balance problems caused by downward-gaze palsy.
- Many neurodegenerative conditions involve parkinsonism, but unlike Parkinson disease, they do not tend to respond well to levodopa, and dementia develops early.
- Corticobasal degeneration involves markedly asymmetric parkinsonism.
- Frontotemporal dementia involves dramatic behavior changes, including inappropriate impulsivity and complete apathy.
- Patients with rapidly progressive dementia should be evaluated for a treatable condition such as antibody-mediated encephalitis.
Managing acute coronary syndromes: Decades of progress
Most decisions for managing acute coronary syndromes can be based on ample data from large randomized trials with hard clinical end points, so there is little reason to provide care that is not evidence-based.
This article reviews some of the trials that provide guidance on diagnosing and managing acute coronary syndromes, including the timing of reperfusion and adjunctive therapies in different situations.
MOST ACUTE CORONARY SYNDROMES ARE NON-ST-ELEVATION CONDITIONS
Acute coronary syndromes range from unstable angina and non-ST-elevation myocardial infarction (NSTEMI) to ST-elevation MI (STEMI), reflecting a continuum of severity of coronary stenosis. The degree of coronary occlusion may ultimately determine whether a patient has unstable angina or MI with or without ST elevation.1
The substrate for all of these is vulnerable plaque. Angiographic studies have indicated that in many cases medium-size plaques (30%–40% stenosis) are more likely to rupture than larger, more obstructive ones. Moderate plaques may be vulnerable because they are less mature, with a large lipid core and a thin cap prone to rupture or erode, exposing the thrombogenic subendothelial components.2
Because the vulnerability of a coronary plaque may not correlate with the severity of stenosis before the plaque ruptures, stress tests and symptoms may not predict the risk of MI. The key role of thrombosis in the pathogenesis also highlights the importance of antithrombotic therapy in the acute phases of acute coronary syndromes, which can significantly reduce mortality and morbidity rates.
Perhaps because of the widespread use of aspirin and statins, most patients who currently present with an acute coronary syndrome have either unstable angina or NSTEMI: of about 1.57 million hospital admissions in 2004 for acute coronary syndromes, for example, only 330,000 (21%) were for STEMI.3
DIAGNOSING ACUTE CORONARY SYNDROME
Symptoms may not be classic
The classic symptoms of acute coronary syndromes are intense, oppressive chest pressure radiating to the left arm, but nearly any discomfort “between the nose and navel” (eg, including the jaw, arm, and epigastric and abdominal areas) may be an acute coronary syndrome. Associated symptoms may include chest heaviness or burning, radiation to the jaw, neck, shoulder, back, or arms, and dyspnea.
Particularly in older, female, postoperative, or diabetic patients, the presentation may be atypical or “silent,” including nausea or vomiting; breathlessness; sweating; arrhythmias; or light-headedness. Especially in these groups, symptoms may be mild or subtle, and acute coronary syndrome may manifest only as “not feeling well.”
The differential diagnosis of acute coronary syndromes is broad. Most important to immediately consider are pulmonary embolism and aortic dissection, as they are life-threatening and are treated differently from acute coronary syndromes. Otherwise, it is best to err on the side of caution and treat for an acute coronary syndrome until it is proven otherwise.
Electrocardiography is critical
Electrocardiography (ECG) gives valuable information about the location, extent, and prognosis of infarction, and it is critically important for distinguishing STEMI from NSTEMI, with ST elevation classically diagnostic of complete coronary occlusion. Q waves can occur early and do not necessarily signify completed infarction, as traditionally thought. ST depression or T inversion indicates that total coronary occlusion is unlikely unless they are in a pattern of circumflex infarct associated with an enlarging R wave in lead V1. An ST elevation in RV4 indicates right ventricular infarction.
The appearance on ECG may evolve over time, so a patient with atypical symptoms and a nonspecific electrocardiogram should be observed for 24 hours or until more specific criteria develop.
Biomarkers in NSTEMI
In MI, cardiac troponin levels begin to rise about 3 hours after the onset of chest pain, and elevations can last for up to 14 days. Levels can also be mildly elevated chronically in patients with renal dysfunction, so positive biomarker tests in that population should be interpreted cautiously.
For STEMI, the opportunity to reperfuse is lost if one waits for cardiac biomarkers to become elevated. But for NSTEMI, they are highly sensitive and specific for identifying patients at high risk and determining who should be treated aggressively. Patients who are biomarker-negative have a better prognosis than patients with identical symptoms and electrocardiograms who are biomarker-positive.
MI is currently defined as a rise in any biomarker (usually troponin) above the 99th percentile for a reference population, with at least one of the following:
- Ischemic symptoms
- New ST/T changes or left bundle branch block
- Pathologic Q waves
- Loss of myocardium or abnormal wall motion seen by imaging
- Intracoronary thrombus.
REPERFUSION FOR ACUTE STEMI
Because acute coronary syndromes have a common pathophysiology, for the most part, lessons from clinical trials in one syndrome are relevant to the others. However, important differences exist regarding the need for immediate reperfusion in STEMI, since in most cases these patients have total rather than partial occlusion.
Fibrinolysis has limitations
The standard of management for STEMI is immediate reperfusion. The goal is to interrupt the wave front of myocardial necrosis, salvage threatened myocardium, and ultimately improve survival.
Five placebo-controlled trials showed a 30% reduction in the death rate in patients who received fibrinolytic therapy within 6 to 12 hours of presentation.4
Patients with ST elevation or with new bundle branch block benefit most from fibrinolytic therapy. Those with ST depression, T inversion, or nonspecific changes on ECG do not benefit; they probably do not have complete coronary occlusion, so the prothrombotic or platelet-activating effects of fibrinolytic therapy may make them worse.5 Further, fibrinolytic therapy poses the risk of intracranial hemorrhage, which, although rare (occurring in up to 1% of cases depending on the drug regimen), is a devastating complication.
In general, absolute contraindications to fibrinolysis include intracranial abnormalities, hemorrhage, and head trauma. An important relative contraindication is uncontrolled blood pressure (> 180/110 mm Hg at any point during hospitalization, including during the immediate presentation). Studies show that even if blood pressure can be controlled, the risk of intracranial hemorrhage is substantially higher, although the risk may not outweigh the benefit of reperfusion, particularly for large infarctions when percutaneous coronary intervention (PCI) is not available as an alternative to fibrinolysis.
Prompt PCI is preferable to fibrinolysis
If PCI is available on site, there is nearly no role for fibrinolytic therapy. PCI is better than fibrinolytic therapy in terms of the degree of reperfusion, reocclusion, MI recurrence, and mortality rate, and it poses little or no risk of intracranial hemorrhage.6
For either fibrinolytic therapy or percutaneous therapy, “time is muscle”: the longer the ischemic time, the higher the mortality rate (relative risk = 1.075 for every 30 minutes of delay, P = .041).7
At centers that do not have PCI on site, studies (mainly from Europe) have shown that it is better to transport the patient for PCI than to give immediate fibrinolytic therapy.7,8 But because the centers studied tended to have short transport times (usually 40 minutes or less), it is uncertain whether the results are applicable throughout the United States.
The delay between symptom onset and presentation is also relevant. Reperfusion within the first 1 to 2 hours after the onset of symptoms provides the greatest degree of myocardial salvage and of reduction in the risk of death; the extent of benefit thereafter is substantially less. As a result, patients who present very early after symptom onset have the most to lose if their reperfusion is delayed by even a few more hours, whereas patients who have already experienced several hours of pain are affected less by additional delay.9 Thus, patients presenting within the “golden” 1 or 2 hours after symptoms begin should be considered for fibrinolytic therapy if transfer for PCI cannot be done expeditiously. It is important for hospitals without PCI available on site to have a system in place for rapid transport of patients when needed.
Guidelines advise that patients with STEMI should undergo PCI rather than receive fibrinolytic therapy as long as PCI is available within 90 minutes of first medical contact. Otherwise, fibrinolysis should be started within 30 minutes.10 For patients who present several hours after symptom onset, PCI may still be preferable even if the transport time is somewhat longer.
PCI after fibrinolytic therapy
In prior decades, PCI immediately after fibrinolytic therapy was associated with an increased risk of bleeding complications and reinfarction. That has changed with improvements in equipment and antithrombotic therapy.
Two large trials conclusively found that routinely transferring high-risk patients for PCI immediately after receiving fibrinolytic therapy (combined half-dose reteplase [Retavase] and abciximab [ReoPro]11 or full-dose tenecteplase [TNKase]12) resulted in much lower rates of ischemic end points without an increase in bleeding complications compared with transferring patients only for rescue PCI after fibrinolytic therapy.
Routine transfer is now the standard of care for high-risk patients after fibrinolytic therapy and probably is best for all patients after an MI.
MANAGING NSTEMI AND UNSTABLE ANGINA
For patients with NSTEMI, immediate reperfusion is usually not required, although initial triage for “early invasive” vs “initial conservative” management must be done early in the hospital course. Randomized trials have evaluated these two approaches, with most studies in the contemporary era reporting improved outcomes with an early invasive approach.
The TACTICS trial,13 the most important of these, enrolled more than 2,200 patients with unstable angina or NSTEMI and randomized them to an early invasive strategy or a conservative strategy. Overall, results were better with the early invasive strategy.
The ICTUS trial.14 Although several studies showed that an early invasive approach was better, the most recent study using the most modern practices—the ICTUS trial—did not find that it reduced death rates. Most patients eventually underwent angiography and revascularization, but not early on. However, all studies showed that rates of recurrent unstable angina and hospitalization were reduced by an early invasive approach, so revascularization does have a role in stabilizing the patient. But in situations of aggressive medical management with antithrombotic and other therapies, an early conservative approach may be an appropriate alternative for many patients.15
The selection of an invasive vs a conservative approach should include a consideration of risk, which can be estimated using a number of criteria, including the Thrombolysis in Myocardial Infarction (TIMI) or the GRACE risk score. When risk was stratified using the TIMI risk score,16 in the TACTICS trial, the higher the risk score, the more likely patients were to benefit from early revascularization.
When an invasive approach is chosen, it does not appear necessary to take patients to catheterization immediately (within 2–24 hours) compared with later during the hospital course.
The TIMACS trial,17 with more than 3,000 patients, tested the benefits of very early vs later revascularization for patients with NSTEMI and unstable angina. Early intervention did not significantly improve outcomes for the primary composite end point of death, MI, and stroke in the overall population enrolled in the trial, but when the secondary end point of refractory ischemia was added in, early intervention was found to be beneficial overall. Moreover, when stratified by risk, high-risk patients significantly benefited from early intervention for the primary end point.
Guidelines for NSTEMI and unstable angina continue to prefer an early invasive strategy, particularly for high-risk patients, although a conservative strategy is considered acceptable if patients receive intensive evidence-based medical therapy and remain clinically stable.18
ANTITHROMBOTIC THERAPIES
Once a revascularization strategy has been chosen, adjunctive therapies should be considered. The most important are the antithrombotic therapies.
Many drugs target platelet activity. Most important are the thromboxane inhibitor aspirin, the adenosine diphosphate (ADP) receptor antagonists clopidogrel (Plavix), prasugrel (Effient), and ticagrelor (Brilinta), and the glycoprotein (GP) IIb/IIIa antagonists abciximab and eptifibatide (Integrilin). Others, such as thrombin receptor antagonists, are under investigation.19
Aspirin for secondary prevention
Evidence is unequivocal for the benefit of aspirin therapy in patients with established or suspected vascular disease.
The ISIS-2 trial20 compared 35-day mortality rates in 16,000 patients with STEMI who were given aspirin, streptokinase, combined streptokinase and aspirin, or placebo. Mortality rates were reduced by aspirin compared with placebo by an extent similar to that achieved with streptokinase, with a further reduction when aspirin and streptokinase were given together.
Therefore, patients with STEMI should be given aspirin daily indefinitely unless they have true aspirin allergy. The dose is 165 to 325 mg initially and 75 to 162 mg daily thereafter.
For NSTEMI and even for secondary prevention in less-acute situations, a number of smaller trials also provide clear evidence of benefit from aspirin therapy.
The CURRENT-OASIS 7 trial21 showed that low maintenance dosages of aspirin (75–100 mg per day) resulted in the same incidence of ischemic end points (cardiovascular death, MI, or stroke) as higher dosages. Although rates of major bleeding events did not differ, a higher rate of gastrointestinal bleeding was evident at just 30 days in patients taking the higher doses. This large trial clearly established that there is no advantage to daily aspirin doses of more than 100 mg.
DUAL ANTIPLATELET THERAPY IS STANDARD
Standard practice now is to use aspirin plus another antiplatelet agent that acts by inhibiting either the ADP receptor (for which there is the most evidence) or the GP IIb/IIIa receptor (which is becoming less used). Dual therapy should begin early in patients with acute coronary syndrome.
Clopidogrel: Well studied with aspirin
The most commonly used ADP antagonist is clopidogrel, a thienopyridine. Much evidence exists for its benefit.
The CURE trial22 randomized more than 12,000 patients with NSTEMI or unstable angina to aspirin plus either clopidogrel or placebo. The incidence of the combined end point of MI, stroke, and cardiovascular death was 20% lower in the clopidogrel group than in the placebo group over 12 months of follow-up. The benefit of clopidogrel began to occur within the first 24 hours after randomization, with a 33% relative risk reduction in the combined end point of cardiovascular death, MI, stroke, and severe ischemia, demonstrating the importance of starting this agent early in the hospital course.
COMMIT23 found a benefit in adding clopidogrel to aspirin in patients with acute STEMI. Although it was only a 30-day trial, significant risk reduction was found in the dual-therapy group for combined death, stroke, or reinfarction. The results of this brief trial were less definitive, but the pathophysiology was similar to non-ST-elevation acute coronary syndromes, so it is reasonable to extrapolate the long-term findings to this setting.
The CURRENT-OASIS 7 trial21 randomized more than 25,000 patients to either clopidogrel in a double dosage (600 mg load, 150 mg/day for 6 days, then 75 mg/day) or standard dosage (300 mg load, 75 mg/day thereafter). Although no overall benefit was found for the higher dosage, a subgroup of more than 17,000 patients who underwent PCI after randomization had a lower risk of developing stent thrombosis. On the other hand, higher doses of clopidogrel caused more major bleeding events.
Ticagrelor and prasugrel: New alternatives to clopidogrel
The principal limitation of clopidogrel is its metabolism. It is a prodrug, ie, it is not active as taken and must be converted to its active state by cytochrome P450 enzymes in the liver. Patients who bear certain polymorphisms in the genes for these enzymes or who are taking other medications that affect this enzymatic pathway may derive less platelet inhibition from the drug, leading to considerable patient-to-patient variability in the degree of antiplatelet effect.
Alternatives to clopidogrel have been developed that inhibit platelets more intensely, are activated more rapidly, and have less interpatient variability. Available now are ticagrelor and prasugrel.24 Like clopidogrel, prasugrel is absorbed as an inactive prodrug, but it is efficiently metabolized by esterases to an active form, and then by a simpler step within the liver to its fully active metabolite.25 Ticagrelor is active as absorbed.26
Pharmacodynamically, the two drugs perform almost identically and much faster than clopidogrel, with equilibrium platelet inhibition reached in less than 1 hour. The degree of platelet inhibition is also more—sometimes twice as much—with the new drugs compared with clopidogrel, and the effect is much more consistent between patients.
Both clopidogrel and prasugrel permanently inhibit the platelet ADP receptor, and 3 to 7 days are therefore required for their antiplatelet effects to completely wear off. In contrast, ticagrelor is a reversible inhibitor and its effects wear off more rapidly. Despite achieving a much higher level of platelet inhibition than clopidogrel, ticagrelor’s activity falls below that of clopidogrel’s by 48 hours of discontinuing the drugs.
Trial of prasugrel vs clopidogrel
The TRITON-TIMI 38 trial27 enrolled more than 13,000 patients with acute coronary syndromes, randomized to receive, either prasugrel or clopidogrel, in addition to aspirin. The patients were all undergoing PCI, so the findings do not apply to patients treated medically with an early conservative approach. The study drug was given only after the decision was made to perform PCI in patients with non-ST-elevation acute coronary syndrome (but given immediately for patients with STEMI, because nearly all those patients undergo PCI).
Prasugrel was clearly beneficial, with a significant 20% lower rate of the combined end point of cardiovascular death, MI, and stroke at 15 months. However, bleeding risk was higher with prasugrel (2.4% vs 1.8%, hazard ratio 1.32, 95% confidence interval 1.02–1.68, P = .03). Looking at individual end points, the advantages of prasugrel were primarily in reducing rates of stent thrombosis and nonfatal MI. Death rates with the two drugs were equivalent, possibly because of the higher risk of bleeding with prasugrel. Bleeding in the prasugrel group was particularly increased in patients who underwent bypass surgery; more patients also needed transfusion.
Subgroup analysis showed that patients with a history of stroke or transient ischemic attack had higher rates of ischemic and bleeding events with prasugrel than with clopidogrel, leading to these being labeled as absolute contraindications to prasugrel. Patients over age 75 or who weighed less than 60 kg experienced excess bleeding risk that closely matched the reduction in ischemic event rates and thus did not have a net benefit with prasugrel.
Trial of ticagrelor vs clopidogrel
The PLATO trial28 included 18,000 patients, of whom 65% underwent revascularization and 35% were treated medically. The drug—clopidogrel or ticagrelor—was given in addition to aspirin at randomization (within 24 hours of symptom onset); this more closely follows clinical practice, in which dual antiplatelet therapy is started as soon as possible. This difference makes the PLATO study more relevant to practice for patients with non-ST-elevation acute coronary syndrome. Also, because they gave the drugs to all patients regardless of whether they were to undergo PCI, this study likely had a higher-risk population, which may be refected in the higher mortality rate at 30 days (5.9% in the clopidogrel group in the PLATO study vs 3.2% in the clopidogrel group in the TRITON study).
Another important difference between the trials testing prasugrel and ticagrelor is that patients who had already received a thienopyridine were excluded from the prasugrel trial but not from the ticagrelor trial. Nearly half the patients in the ticagrelor group were already taking clopidogrel. The clinical implication is that for patients who arrive from another facility and already have been given clopidogrel, it is safe to give ticagrelor. There is limited information about whether that is also true for prasugrel, although there is no known reason why the safety of adding prasugrel to clopidogrel should be different from that of ticagrelor.
The rate of ischemic events was 20% lower in the ticagrelor group than in the clopidogrel group, importantly including reductions in the incidence of death, MI, and stent thrombosis. There was no increase with ticagrelor compared with clopidogrel in bleeding associated with coronary artery bypass graft surgery, likely because of the more rapid washout of the ticagrelor effect, or in the need for blood transfusions. However, the rate of bleeding unrelated to coronary artery bypass was about 20% higher with ticagrelor.
In summary, more intense platelet inhibition reduces the risk of ischemic events, but, particularly for the irreversible inhibitor prasugrel, at the cost of a higher risk of bleeding. In general, the net benefit of these agents in preventing the irreversible complications of MI and (in the case of ticagrelor) death favor the use of the more intense ADP inhibitors in appropriate patients. Ticagrelor is indicated in patients with acute coronary syndromes undergoing invasive or conservative management; prasugrel is indicated in patients undergoing PCI, but contraindicated in patients with a previous stroke or transient ischemic event. Neither drug is indicated in patients undergoing elective PCI outside the setting of acute coronary syndromes, although these agents may be appropriate in patients with intolerance or allergy to clopidogrel.
Glycoprotein IIb/IIIa antagonists for select cases only
GP IIb/IIIa antagonists such as abciximab were previously used more commonly than they are today. Now, with routine pretreatment using thienopyridines, their role in acute coronary syndromes is less clear. They still play a role when routine dual antiplatelet therapy is not used, when prasugrel or ticagrelor is not used, and when heparin rather than an alternative antithrombin agent is used.
A meta-analysis29 of 3,755 patients showed a clear reduction in ischemic complications with abciximab as an adjunct to primary PCI for STEMI in patients treated with heparin.
Kastrati et al30 found that patients with non-ST-elevation acute coronary syndromes benefited from abciximab at the time of PCI with heparin, even though they had been routinely pretreated with clopidogrel. However, benefits were seen only in high-risk patients who had presented with elevated troponins.
On the other hand, the role of GP IIb/IIIa blockade for “upstream” medical management in patients with acute coronary syndromes has been eroded by several studies.
The ACUITY trial31 randomized more than 9,000 patients to receive either routine treatment with a GP IIb/IIIa inhibitor before angiography or deferred selective use in the catheterization laboratory only for patients undergoing PCI. No significant differences were found in rates of MI and death.
The Early ACS trial32 compared early routine eptifibatide vs delayed, provisional eptifibatide in 9,492 patients with acute coronary syndromes without ST elevation and who were assigned to an invasive strategy. The early-eptifibatide group received two boluses and an infusion of eptifibatide before angiography; the others received a placebo infusion, with provisional eptifibatide after angiography if the patient underwent PCI and was deemed at high risk. No significant difference in rates of death or MI were noted, and the early-eptifibatide group had significantly higher rates of bleeding and need for transfusion.
The FINESSE trial33 also discredited “facilitating” PCI by giving GP IIb/IIIa antagonists in patients with STEMI before arrival in the catheterization laboratory, with no benefit to giving abciximab ahead of time vs in the catheterization laboratory, and with an increased risk of bleeding complications.
These studies have helped narrow the use of GP IIb/IIIa inhibitors to the catheterization laboratory in conjunction with heparin anticoagulation (as compared with bivalirudin [Angiomax]; see below) and only in select or high-risk cases. These drugs are indicated in the medical phase of management only if patients cannot be stabilized by aspirin or ADP inhibition.
NEWER ANTITHROMBOTICS: ADVANTAGES UNCLEAR
The complex coagulation cascade has a number of components, but only a few are targeted by drugs that are approved and recommended: fondaparinux (Arixtra) and oral factor Xa inhibitors affect the prothrombinase complex (including factor X); bivalirudin and oral factor IIa inhibitors affect thrombin; and heparin and the low-molecular-weight heparins inhibit both targets.
Low-molecular-weight heparins
The SYNERGY trial34 randomized nearly 10,000 patients with non-ST-elevation acute coronary syndromes at high risk for ischemic cardiac complications managed with an invasive approach to either the low-molecular-weight heparin enoxaparin (Lovenox) or intravenous unfractionated heparin immediately after enrollment. Most patients underwent catheterization and revascularization. No clinical advantage was found for enoxaparin, and bleeding complications were increased.
The EXTRACT-TIMI 25 trial35 randomized more than 20,000 patients with STEMI who were about to undergo fibrinolysis to receive either enoxaparin throughout hospitalization (average of 8 days) or unfractionated heparin for at least 48 hours. The enoxaparin group had a lower rate of recurrent MI, but it was unclear if the difference was in part attributable to the longer therapy time. The enoxaparin group also had more bleeding.
Fondaparinux
The OASIS-5 trial36,37 compared enoxaparin and fondaparinux, an exclusive factor Xa inhibitor, in more than 20,000 patients with unstable angina or NSTEMI. Fondaparinux was associated with a lower risk of death and reinfarction as well as fewer bleeding events. However, the benefits were almost exclusively in patients treated medically. In those undergoing PCI within the first 8 days, no benefit was found, although there was still a significant reduction in major bleeding events. Catheter thrombosis was also increased in patients taking fondaparinux, but only in those who did not receive adequate unfractionated heparin treatment before PCI.
Bivalirudin superior at time of catheterization
The most significant advance in antithrombotic therapy for patients with acute coronary syndromes is bivalirudin. This drug has a clear role only in the catheterization laboratory, where patients can be switched to it from heparin, low-molecular-weight heparin, or fondaparinux.
Three trials38–40 evaluated the drug in a total of more than 20,000 patients receiving invasive management of coronary artery disease undergoing PCI for elective indications, NSTEMI, or STEMI.
Results were remarkably similar across the three trials. Patients who were treated with bivalirudin alone had the same rate of ischemic end points at 30 days as those receiving heparin plus a GP IIb/IIIa inhibitor, but bivalirudin was associated with a consistent and significant 40% to 50% lower bleeding risk. For the highest-risk patients, those with STEMI, the bivalirudin group also had a significantly lower risk of death at 1 year.41
OTHER DRUGS: EARLY TREATMENT NO LONGER ROUTINE
Most data for the use of therapies aside from antithrombotics are from studies of patients with STEMI, but findings can logically be extrapolated to those with non-ST-elevation acute coronary syndromes.
Beta-blockers: Cardiogenic shock a risk
For beta-blockers, many historical trials were done in stable coronary disease, but there are no large trials in the setting of NSTEMI or unstable angina, and only recently have there been large trials for STEMI. Before the availability of recent evidence, standard practice was to treat STEMI routinely with intravenous metoprolol (Lopressor) and then oral metoprolol.
When large studies were finally conducted, the results were sobering.
COMMIT.42 Nearly 46,000 patients with suspected acute MI were randomized to receive either metoprolol (up to 15 mg intravenously, then 200 mg by mouth daily until discharge or for up to 4 weeks in the hospital) or placebo. Surprisingly, although rates of reinfarction and ventricular fibrillation were lower with metoprolol, a higher risk of cardiogenic shock with early beta-blockade offset these benefits and the net mortality rate was not reduced. This study led to a reduction in the early use of beta-blockers in patients with STEMI.
The standard of care has now shifted from beta-blockers in everyone as early as possible after MI to being more cautious in patients with contraindications, including signs of heart failure or a low-output state, or even in those of advanced age or with borderline low blood pressure or a high heart rate. Patients who present late and therefore may have a larger infarct are also at higher risk.
Although the goal should be to ultimately discharge patients on beta-blocker therapy after an MI, there should be no rush to start one early.
Carvedilol now preferred after STEMI
The CAPRICORN trial43 randomized nearly 2,000 patients following MI with left ventricular dysfunction (an ejection fraction of 40% or below) to either placebo or the beta-blocker carvedilol (Coreg). Patients taking the drug had a clear reduction in rates of death and reinfarction, leading to this drug becoming the beta-blocker of choice in patients with ventricular dysfunction after STEMI.
Angiotensin-converting enzyme inhibitors: Early risk of cardiogenic shock
The use of angiotensin-converting enzyme (ACE) inhibitors after MI is also supported by several studies.44 Two very large studies, one of nearly 60,000 patients and one of nearly 20,000, showed a clear reduction in the mortality rate in those who received an ACE inhibitor. Most of the benefit was in patients with an ejection fraction of less than 40%. On the basis of these trials, ACE inhibitors are indicated for all patients for the first 30 days after MI and then indefinitely for those with left ventricular dysfunction. However, the trial in which an ACE inhibitor was given intravenously early on had to be stopped prematurely because of worse outcomes owing to cardiogenic shock.
These studies highlight again that for patients who are unstable in the first few days of an acute coronary syndrome, it is best to wait until their condition stabilizes and to start these therapies before hospital discharge.
Intensive statin therapy
In the last 20 years, unequivocal evidence has emerged to support the beneficial role of statins for secondary prevention in patients with established coronary artery disease. More-recent trials have also shown that intensive statin therapy (a high dose of a potent statin) improves outcomes better than lower doses.
The PROVE-IT TIMI 22 trial45 randomized patients after an acute coronary syndrome to receive either standard therapy (pravastatin [Pravachol] 40 mg) or intensive therapy (atorvastatin [Lipitor] 80 mg). The intensive-therapy group had a significantly lower rate of major cardiovascular events, and the difference persisted and grew over 30 months of follow-up.
A number of studies confirmed this and broadened the patient population to those with unstable or stable coronary disease. Regardless of the risk profile, the effects were consistent and showed that high-dose statins were better in preventing coronary death and MI.46
Guidelines are evolving toward recommendation of highest doses of statins independently of the target level of low-density lipoprotein cholesterol.
- Antman EM, Anbe DT, Armstrong PW, et al; American College of Cardiology; American Heart Association Task Force on Practice Guidelines; Canadian Cardiovascular Society. ACC/AHA guidelines for the management of patients with ST-elevation myocardial infarction. Circulation 2004; 110:e82–e292. Erratum in: Circulation 2005; 111:2013–2014.
- Davies MJ. The pathophysiology of acute coronary syndromes. Heart 2000; 83:361–366.
- Rosamond W, Flegal K, Friday G, et al; American Heart Association Statistics Committee and Stroke Statistics Subcommittee. Heart disease and stroke statistics–2007 update: a report from the American Heart Association Statistics Committee and Stroke Statistics Subcommittee. Circulation 2007; 115:e69–e171.
- Granger CB, Califf RM, Topol EJ. Thrombolytic therapy for acute myocardial infarction. A review. Drugs 1992; 44:293–325.
- Fibrinolytic Therapy Trialists’ (FTT) Collaborative Group. Indications for fibrinolytic therapy in suspected acute myocardial infarction: collaborative overview of early mortality and major morbidity results from all randomised trials of more than 1000 patients. Lancet 1994; 343:311–322.
- Keely EC, Boura JA, Grines CL. Primary angioplasty versus intravenous thrombolytic therapy for acute myocardial infarction: a quantitative review of 23 randomised trials. Lancet 2003; 361:13–20
- De Luca G, Suryapranata H, Ottervanger JP, Antman EM. Time delay to treatment and mortality in primary angioplasty for acute myocardial infarction: every minute of delay counts. Circulation 2004; 109:1223–1225.
- Dalby M, Bouzamondo A, Lechat P, Montalescot G. Transfer for primary angioplasty versus immediate thrombolysis in acute myocardial infarction: a meta-analysis. Circulation 2003; 108:1809–1814.
- Gersh BJ, Stone GW, White HD, Holmes DR Jr. Pharmacological facilitation of primary percutaneous coronary intervention for acute myocardial infarction: is the slope of the curve the shape of the future? JAMA 2005; 293:979–986.
- Antman EM, Hand M, Armstron PW, et al; Canadian Cardiovascular Society; American Academy of Family Physicians; American College of Cardiology; American Heart Association. 2007 focused update of the ACC/AHA 2004 guidelines for the management of patients with ST-elevation myocardial infarction: a report of the American College of Cardiology/American Heart Association Task Force on Practice Guidelines. J Am Coll Cardiol 2008; 51:210–247.
- Di Mario C, Dudek D, Piscione F, et al; CARESS-in-AMI (Combined Abciximab Reteplase Stent Study in Acute Myocardial Infarction) Investigators. Immediate angioplasty versus standard therapy with rescue angioplasty after thrombolysis in the Combined Abciximab REteplase Stent Study in Acute Myocardial Infarction (CARESS-in-AMI): an open, prospective, randomised, multicentre trial. Lancet 2008; 371:559–568.
- Cantor WJ, Fitchett D, Borgundvaag B, et al; TRANSFER-AMI Trial Investigators. Routine early angioplasty after fibrinolysis for acute myocardial infarction. N Engl J Med 2009; 360:2705–2718.
- Cannon CP, Weintraub WS, Demopoulos LA, et al; TACTICS (Treat Angina With Aggrastat and Determine Cost of Therapy With an Invasive or Conservative Strategy)–Thrombolysis in Myocardial Infarction 18 Investigators. Comparison of early invasive and conservative strategies in patients with unstable coronary syndromes treated with the glycoprotein IIb/IIIa inhibitor tirofiban. N Engl J Med 2001; 344:1879–1887.
- Damman P, Hirsch A, Windhausen F, Tijssen JG, de Winter RJ; ICTUS Investigators. 5-year clinical outcomes in the ICTUS (Invasive versus Conservative Treatment in Unstable coronary Syndromes) trial a randomized comparison of an early invasive versus selective invasive management in patients with non-ST-segment elevation acute coronary syndrome. J Am Coll Cardiol 2010; 55:858–864.
- Bavry AA, Kumbhani DJ, Rassi AN, Bhatt DL, Askari AT. Benefit of early invasive therapy in acute coronary syndromes: a meta-analysis of contemporary randomized clinical trials. J Am Coll Cardiol 2006; 48:1319–1325.
- Antman EM, Cohen M, Bernink PJ, et al. The TIMI risk score for unstable angina/non-ST elevation MI: a method for prognostication and therapeutic decision making. JAMA 2000; 284:835–842.
- Mehta SR, Granger CB, Boden WE, et al; TIMACS Investigators. Early versus delayed invasive intervention in acute coronary syndromes. N Engl J Med 2009; 360:2165–2175.
- Anderson JL, Adams CD, Antman EM, et al. ACC/AHA 2007 guidelines for the management of patients with unstable angina/non-ST-Elevation myocardial infarction. J Am Coll Cardiol 2007; 50:e1–e157.
- Yousef O, Bhatt DL. The evolution of antiplatelet therapy in cardiovascular disease. Nat Rev Cardiol 2011; 8:547–559.
- ISIS-2 (Second International Study of Infarct Survival) Collaborative Group. Randomised trial of intravenous streptokinase, oral aspirin, both, or neither among 17,187 cases of suspected acute myocardial infarction: ISIS-2. Lancet 1988; 2:349–360.
- CURRENT-OASIS 7 Investigators; Mehta SR, Bassand JP, Chrolavicius S, et al. Dose comparisons of clopidogrel and aspirin in acute coronary syndromes. N Engl J Med 2010; 363:930–942.
- Yusuf S, Mehta SR, Zhao F, et al; Clopidogrel in Unstable angina to prevent Recurrent Events Trial Investigators. Early and late effects of clopidogrel in patients with acute coronary syndromes. Circulation 2003; 107:966–972.
- Chen ZM, Jiang LX, Chen YP, et al; COMMIT (Clopidogrel and Metoprolol in Myocardial Infarction Trial) collaborative group. Addition of clopidogrel to aspirin in 45,852 patients with acute myocardial infarction: randomised placebo-controlled trial. Lancet 2005; 366:1607–1621.
- Schömig A. Ticagrelor—is there need for a new player in the antiplatelet-therapy field? N Engl J Med 2009; 361:1108–1111.
- Wiviott SD, Antman EM, Braunwald E. Prasugrel. Circulation 2010; 122:394–403.
- Gurbel PA, Bliden KP, Butler K, et al. Randomized double-blind assessment of the ONSET and OFFSET of the antiplatelet effects of ticagrelor versus clopidogrel in patients with stable coronary artery disease: the ONSET/OFFSET study. Circulation 2009; 120:2577–2585.
- Wiviott SD, Braunwald E, McCabe CH, et al; TRITON-TIMI 38 Investigators. Prasugrel versus clopidogrel in patients with acute coronary syndromes. N Engl J Med 2007; 357:2001–2015.
- Wallentin L, Becker RC, Budaj A, et al; PLATO Investigators. Ticagrelor versus clopidogrel in patients with acute coronary syndromes. N Engl J Med 2009; 361:1045–1057.
- de Queiroz Fernandes Araujo JO, Veloso HH, Braga De Paiva JM, Fiho MW, Vincenzo De Paola AA. Efficacy and safety of abciximab on acute myocardial infarction treated with percutaneous coronary interventions: a meta-analysis of randomized, controlled trials. Am Heart J 2004; 148:937–943.
- Kastrati A, Mehilli J, Neuman FJ, et al; Intracoronary Stenting and Antithrombotic: Regimen Rapid Early Action for Coronary Treatment 2 (ISAR-REACT 2) Trial Investigators. Abciximab in patients with acute coronary syndromes undergoing percutaneous coronary intervention after clopidogrel pretreatment: the ISAR-REACT 2 randomized trial. JAMA 2006; 295:1531–1538.
- Stone GW, Bertrand ME, Moses JW, et al; ACUITY Investigators. Routine upstream initiation vs deferred selective use of glycoprotein IIb/IIIa inhibitors in acute coronary syndromes: the ACUITY Timing trial. JAMA 2007; 297:591–602.
- Giugliano RP, White JA, Bode C, et al; Early ACS Investigators. Early vs delayed, provisional eptifibatide in acute coronary syndromes. N Engl J Med 2009; 360:2176–2190.
- Ellis SG, Tendera M, de Belder MA, et al; FINESSE Investigators. Facilitated PCI in patients with ST-elevation myocardial infarction. N Engl J Med 2008; 358:2205–2217.
- Fergusson JJ, Califf RM, Antman EM, et al; SYNERGY Trial Investigators. Enoxaparin vs unfractionated heparin in high-risk patients with non-ST-segment elevation acute coronary syndromes managed with an intended early invasive strategy: primary results of the SYNERGY randomized trial. JAMA 2004; 292:45–54.
- Antman EM, Morrow DA, McCabe CH; EXTRACT-TIMI 25 Investigators. Enoxaparin versus unfractionated heparin with fibrinolysis for ST-elevation myocardial infarction. N Engl J Med 2006; 354:1477–1488.
- The Fifth Organization to Assess Strategies in Acute Ischemic Syndromes Investigators. Comparison of fondaparinux and enoxaparin in acute coronary syndromes. N Engl J Med 2006; 354:1464–1476.
- Mehta SR, Granger CB, Eikelboom JW, et al. Efficacy and safety of fondaparinux versus enoxaparin in patients with acute coronary syndromes undergoing percutaneous coronary intervention: results from the OASIS-5 trial. J Am Coll Cardiol 2007; 50:1742–1751.
- Lincoff AM, Bittl JA, Harrington RA, et al; REPLACE-2 Investigators. Bivalirudin and provisional glycoprotein IIb/IIIa blockade compared with heparin and planned glycoprotein IIb/IIIa blockade during percutaneous coronary intervention: REPLACE-2 randomized trial. JAMA 2003; 289:853–863.
- Stone GW, McLaurin BT, Cox DA, et al; ACUITY Investigators. Bivalirudin for patients with acute coronary syndromes. N Engl J Med 2006; 355:2203–2216.
- Stone GW, Witzenbichler B, Guagliumi G, et al; HORIZONS-AMI Trial Investigators. Bivalirudin during primary PCI in acute myocardial infarction. N Engl J Med 2007; 358:2218–2230.
- Mehran R, Lansky AJ, Witzenbichler B, et al; HORIZONS-AMI Trial Investigators. Bivalirudin in patients undergoing primary angioplasty for acute myocardial infarction (HORIZONS-AMI): 1-year results of a randomised controlled trial. Lancet 2009; 374:1149–1159.
- Chen ZM, Pan HC, Chen YP, et al; COMMIT (Clopidogrel and Metoprolol in Myocardial Infarction Trial) Collaborative Group. Early intravenous then oral metoprolol in 45,852 patients with acute myocardial infarction: randomised placebo-controlled trial. Lancet 2005; 366:1622–1632.
- Dargie JH. Effect of carvedilol on outcome after myocardial infarction in patients with left-ventricular dysfunction: the CAPRICORN randomised trial. Lancet 2001; 357:1385–1390.
- Hennekens CH, Albert CM, Godfried SL, Gaziano JM, Buring JE. Adjunctive drug therapy of acute myocardial infarction—evidence from clinical trials. N Engl J Med 1996; 335:1660–1667.
- Cannon CP, Braunwald E, McCabe CH, et al; Pravastatin or Atorvastatin Evaluation and Infection Therapy–Thrombolysis in Myocardial Infarction 22 Investigators. Intensive versus moderate lipid lowering with statins after acute coronary syndromes. N Engl J Med 2004; 350:1495–1504.
- Cannon CP, Steinberg BA, Murphy SA, Mega JL, Braunwald E. Meta-analysis of cardiovascular outcomes trials comparing intensive versus moderate statin therapy. J Am Coll Cardiol 2006; 48:438–445.
Most decisions for managing acute coronary syndromes can be based on ample data from large randomized trials with hard clinical end points, so there is little reason to provide care that is not evidence-based.
This article reviews some of the trials that provide guidance on diagnosing and managing acute coronary syndromes, including the timing of reperfusion and adjunctive therapies in different situations.
MOST ACUTE CORONARY SYNDROMES ARE NON-ST-ELEVATION CONDITIONS
Acute coronary syndromes range from unstable angina and non-ST-elevation myocardial infarction (NSTEMI) to ST-elevation MI (STEMI), reflecting a continuum of severity of coronary stenosis. The degree of coronary occlusion may ultimately determine whether a patient has unstable angina or MI with or without ST elevation.1
The substrate for all of these is vulnerable plaque. Angiographic studies have indicated that in many cases medium-size plaques (30%–40% stenosis) are more likely to rupture than larger, more obstructive ones. Moderate plaques may be vulnerable because they are less mature, with a large lipid core and a thin cap prone to rupture or erode, exposing the thrombogenic subendothelial components.2
Because the vulnerability of a coronary plaque may not correlate with the severity of stenosis before the plaque ruptures, stress tests and symptoms may not predict the risk of MI. The key role of thrombosis in the pathogenesis also highlights the importance of antithrombotic therapy in the acute phases of acute coronary syndromes, which can significantly reduce mortality and morbidity rates.
Perhaps because of the widespread use of aspirin and statins, most patients who currently present with an acute coronary syndrome have either unstable angina or NSTEMI: of about 1.57 million hospital admissions in 2004 for acute coronary syndromes, for example, only 330,000 (21%) were for STEMI.3
DIAGNOSING ACUTE CORONARY SYNDROME
Symptoms may not be classic
The classic symptoms of acute coronary syndromes are intense, oppressive chest pressure radiating to the left arm, but nearly any discomfort “between the nose and navel” (eg, including the jaw, arm, and epigastric and abdominal areas) may be an acute coronary syndrome. Associated symptoms may include chest heaviness or burning, radiation to the jaw, neck, shoulder, back, or arms, and dyspnea.
Particularly in older, female, postoperative, or diabetic patients, the presentation may be atypical or “silent,” including nausea or vomiting; breathlessness; sweating; arrhythmias; or light-headedness. Especially in these groups, symptoms may be mild or subtle, and acute coronary syndrome may manifest only as “not feeling well.”
The differential diagnosis of acute coronary syndromes is broad. Most important to immediately consider are pulmonary embolism and aortic dissection, as they are life-threatening and are treated differently from acute coronary syndromes. Otherwise, it is best to err on the side of caution and treat for an acute coronary syndrome until it is proven otherwise.
Electrocardiography is critical
Electrocardiography (ECG) gives valuable information about the location, extent, and prognosis of infarction, and it is critically important for distinguishing STEMI from NSTEMI, with ST elevation classically diagnostic of complete coronary occlusion. Q waves can occur early and do not necessarily signify completed infarction, as traditionally thought. ST depression or T inversion indicates that total coronary occlusion is unlikely unless they are in a pattern of circumflex infarct associated with an enlarging R wave in lead V1. An ST elevation in RV4 indicates right ventricular infarction.
The appearance on ECG may evolve over time, so a patient with atypical symptoms and a nonspecific electrocardiogram should be observed for 24 hours or until more specific criteria develop.
Biomarkers in NSTEMI
In MI, cardiac troponin levels begin to rise about 3 hours after the onset of chest pain, and elevations can last for up to 14 days. Levels can also be mildly elevated chronically in patients with renal dysfunction, so positive biomarker tests in that population should be interpreted cautiously.
For STEMI, the opportunity to reperfuse is lost if one waits for cardiac biomarkers to become elevated. But for NSTEMI, they are highly sensitive and specific for identifying patients at high risk and determining who should be treated aggressively. Patients who are biomarker-negative have a better prognosis than patients with identical symptoms and electrocardiograms who are biomarker-positive.
MI is currently defined as a rise in any biomarker (usually troponin) above the 99th percentile for a reference population, with at least one of the following:
- Ischemic symptoms
- New ST/T changes or left bundle branch block
- Pathologic Q waves
- Loss of myocardium or abnormal wall motion seen by imaging
- Intracoronary thrombus.
REPERFUSION FOR ACUTE STEMI
Because acute coronary syndromes have a common pathophysiology, for the most part, lessons from clinical trials in one syndrome are relevant to the others. However, important differences exist regarding the need for immediate reperfusion in STEMI, since in most cases these patients have total rather than partial occlusion.
Fibrinolysis has limitations
The standard of management for STEMI is immediate reperfusion. The goal is to interrupt the wave front of myocardial necrosis, salvage threatened myocardium, and ultimately improve survival.
Five placebo-controlled trials showed a 30% reduction in the death rate in patients who received fibrinolytic therapy within 6 to 12 hours of presentation.4
Patients with ST elevation or with new bundle branch block benefit most from fibrinolytic therapy. Those with ST depression, T inversion, or nonspecific changes on ECG do not benefit; they probably do not have complete coronary occlusion, so the prothrombotic or platelet-activating effects of fibrinolytic therapy may make them worse.5 Further, fibrinolytic therapy poses the risk of intracranial hemorrhage, which, although rare (occurring in up to 1% of cases depending on the drug regimen), is a devastating complication.
In general, absolute contraindications to fibrinolysis include intracranial abnormalities, hemorrhage, and head trauma. An important relative contraindication is uncontrolled blood pressure (> 180/110 mm Hg at any point during hospitalization, including during the immediate presentation). Studies show that even if blood pressure can be controlled, the risk of intracranial hemorrhage is substantially higher, although the risk may not outweigh the benefit of reperfusion, particularly for large infarctions when percutaneous coronary intervention (PCI) is not available as an alternative to fibrinolysis.
Prompt PCI is preferable to fibrinolysis
If PCI is available on site, there is nearly no role for fibrinolytic therapy. PCI is better than fibrinolytic therapy in terms of the degree of reperfusion, reocclusion, MI recurrence, and mortality rate, and it poses little or no risk of intracranial hemorrhage.6
For either fibrinolytic therapy or percutaneous therapy, “time is muscle”: the longer the ischemic time, the higher the mortality rate (relative risk = 1.075 for every 30 minutes of delay, P = .041).7
At centers that do not have PCI on site, studies (mainly from Europe) have shown that it is better to transport the patient for PCI than to give immediate fibrinolytic therapy.7,8 But because the centers studied tended to have short transport times (usually 40 minutes or less), it is uncertain whether the results are applicable throughout the United States.
The delay between symptom onset and presentation is also relevant. Reperfusion within the first 1 to 2 hours after the onset of symptoms provides the greatest degree of myocardial salvage and of reduction in the risk of death; the extent of benefit thereafter is substantially less. As a result, patients who present very early after symptom onset have the most to lose if their reperfusion is delayed by even a few more hours, whereas patients who have already experienced several hours of pain are affected less by additional delay.9 Thus, patients presenting within the “golden” 1 or 2 hours after symptoms begin should be considered for fibrinolytic therapy if transfer for PCI cannot be done expeditiously. It is important for hospitals without PCI available on site to have a system in place for rapid transport of patients when needed.
Guidelines advise that patients with STEMI should undergo PCI rather than receive fibrinolytic therapy as long as PCI is available within 90 minutes of first medical contact. Otherwise, fibrinolysis should be started within 30 minutes.10 For patients who present several hours after symptom onset, PCI may still be preferable even if the transport time is somewhat longer.
PCI after fibrinolytic therapy
In prior decades, PCI immediately after fibrinolytic therapy was associated with an increased risk of bleeding complications and reinfarction. That has changed with improvements in equipment and antithrombotic therapy.
Two large trials conclusively found that routinely transferring high-risk patients for PCI immediately after receiving fibrinolytic therapy (combined half-dose reteplase [Retavase] and abciximab [ReoPro]11 or full-dose tenecteplase [TNKase]12) resulted in much lower rates of ischemic end points without an increase in bleeding complications compared with transferring patients only for rescue PCI after fibrinolytic therapy.
Routine transfer is now the standard of care for high-risk patients after fibrinolytic therapy and probably is best for all patients after an MI.
MANAGING NSTEMI AND UNSTABLE ANGINA
For patients with NSTEMI, immediate reperfusion is usually not required, although initial triage for “early invasive” vs “initial conservative” management must be done early in the hospital course. Randomized trials have evaluated these two approaches, with most studies in the contemporary era reporting improved outcomes with an early invasive approach.
The TACTICS trial,13 the most important of these, enrolled more than 2,200 patients with unstable angina or NSTEMI and randomized them to an early invasive strategy or a conservative strategy. Overall, results were better with the early invasive strategy.
The ICTUS trial.14 Although several studies showed that an early invasive approach was better, the most recent study using the most modern practices—the ICTUS trial—did not find that it reduced death rates. Most patients eventually underwent angiography and revascularization, but not early on. However, all studies showed that rates of recurrent unstable angina and hospitalization were reduced by an early invasive approach, so revascularization does have a role in stabilizing the patient. But in situations of aggressive medical management with antithrombotic and other therapies, an early conservative approach may be an appropriate alternative for many patients.15
The selection of an invasive vs a conservative approach should include a consideration of risk, which can be estimated using a number of criteria, including the Thrombolysis in Myocardial Infarction (TIMI) or the GRACE risk score. When risk was stratified using the TIMI risk score,16 in the TACTICS trial, the higher the risk score, the more likely patients were to benefit from early revascularization.
When an invasive approach is chosen, it does not appear necessary to take patients to catheterization immediately (within 2–24 hours) compared with later during the hospital course.
The TIMACS trial,17 with more than 3,000 patients, tested the benefits of very early vs later revascularization for patients with NSTEMI and unstable angina. Early intervention did not significantly improve outcomes for the primary composite end point of death, MI, and stroke in the overall population enrolled in the trial, but when the secondary end point of refractory ischemia was added in, early intervention was found to be beneficial overall. Moreover, when stratified by risk, high-risk patients significantly benefited from early intervention for the primary end point.
Guidelines for NSTEMI and unstable angina continue to prefer an early invasive strategy, particularly for high-risk patients, although a conservative strategy is considered acceptable if patients receive intensive evidence-based medical therapy and remain clinically stable.18
ANTITHROMBOTIC THERAPIES
Once a revascularization strategy has been chosen, adjunctive therapies should be considered. The most important are the antithrombotic therapies.
Many drugs target platelet activity. Most important are the thromboxane inhibitor aspirin, the adenosine diphosphate (ADP) receptor antagonists clopidogrel (Plavix), prasugrel (Effient), and ticagrelor (Brilinta), and the glycoprotein (GP) IIb/IIIa antagonists abciximab and eptifibatide (Integrilin). Others, such as thrombin receptor antagonists, are under investigation.19
Aspirin for secondary prevention
Evidence is unequivocal for the benefit of aspirin therapy in patients with established or suspected vascular disease.
The ISIS-2 trial20 compared 35-day mortality rates in 16,000 patients with STEMI who were given aspirin, streptokinase, combined streptokinase and aspirin, or placebo. Mortality rates were reduced by aspirin compared with placebo by an extent similar to that achieved with streptokinase, with a further reduction when aspirin and streptokinase were given together.
Therefore, patients with STEMI should be given aspirin daily indefinitely unless they have true aspirin allergy. The dose is 165 to 325 mg initially and 75 to 162 mg daily thereafter.
For NSTEMI and even for secondary prevention in less-acute situations, a number of smaller trials also provide clear evidence of benefit from aspirin therapy.
The CURRENT-OASIS 7 trial21 showed that low maintenance dosages of aspirin (75–100 mg per day) resulted in the same incidence of ischemic end points (cardiovascular death, MI, or stroke) as higher dosages. Although rates of major bleeding events did not differ, a higher rate of gastrointestinal bleeding was evident at just 30 days in patients taking the higher doses. This large trial clearly established that there is no advantage to daily aspirin doses of more than 100 mg.
DUAL ANTIPLATELET THERAPY IS STANDARD
Standard practice now is to use aspirin plus another antiplatelet agent that acts by inhibiting either the ADP receptor (for which there is the most evidence) or the GP IIb/IIIa receptor (which is becoming less used). Dual therapy should begin early in patients with acute coronary syndrome.
Clopidogrel: Well studied with aspirin
The most commonly used ADP antagonist is clopidogrel, a thienopyridine. Much evidence exists for its benefit.
The CURE trial22 randomized more than 12,000 patients with NSTEMI or unstable angina to aspirin plus either clopidogrel or placebo. The incidence of the combined end point of MI, stroke, and cardiovascular death was 20% lower in the clopidogrel group than in the placebo group over 12 months of follow-up. The benefit of clopidogrel began to occur within the first 24 hours after randomization, with a 33% relative risk reduction in the combined end point of cardiovascular death, MI, stroke, and severe ischemia, demonstrating the importance of starting this agent early in the hospital course.
COMMIT23 found a benefit in adding clopidogrel to aspirin in patients with acute STEMI. Although it was only a 30-day trial, significant risk reduction was found in the dual-therapy group for combined death, stroke, or reinfarction. The results of this brief trial were less definitive, but the pathophysiology was similar to non-ST-elevation acute coronary syndromes, so it is reasonable to extrapolate the long-term findings to this setting.
The CURRENT-OASIS 7 trial21 randomized more than 25,000 patients to either clopidogrel in a double dosage (600 mg load, 150 mg/day for 6 days, then 75 mg/day) or standard dosage (300 mg load, 75 mg/day thereafter). Although no overall benefit was found for the higher dosage, a subgroup of more than 17,000 patients who underwent PCI after randomization had a lower risk of developing stent thrombosis. On the other hand, higher doses of clopidogrel caused more major bleeding events.
Ticagrelor and prasugrel: New alternatives to clopidogrel
The principal limitation of clopidogrel is its metabolism. It is a prodrug, ie, it is not active as taken and must be converted to its active state by cytochrome P450 enzymes in the liver. Patients who bear certain polymorphisms in the genes for these enzymes or who are taking other medications that affect this enzymatic pathway may derive less platelet inhibition from the drug, leading to considerable patient-to-patient variability in the degree of antiplatelet effect.
Alternatives to clopidogrel have been developed that inhibit platelets more intensely, are activated more rapidly, and have less interpatient variability. Available now are ticagrelor and prasugrel.24 Like clopidogrel, prasugrel is absorbed as an inactive prodrug, but it is efficiently metabolized by esterases to an active form, and then by a simpler step within the liver to its fully active metabolite.25 Ticagrelor is active as absorbed.26
Pharmacodynamically, the two drugs perform almost identically and much faster than clopidogrel, with equilibrium platelet inhibition reached in less than 1 hour. The degree of platelet inhibition is also more—sometimes twice as much—with the new drugs compared with clopidogrel, and the effect is much more consistent between patients.
Both clopidogrel and prasugrel permanently inhibit the platelet ADP receptor, and 3 to 7 days are therefore required for their antiplatelet effects to completely wear off. In contrast, ticagrelor is a reversible inhibitor and its effects wear off more rapidly. Despite achieving a much higher level of platelet inhibition than clopidogrel, ticagrelor’s activity falls below that of clopidogrel’s by 48 hours of discontinuing the drugs.
Trial of prasugrel vs clopidogrel
The TRITON-TIMI 38 trial27 enrolled more than 13,000 patients with acute coronary syndromes, randomized to receive, either prasugrel or clopidogrel, in addition to aspirin. The patients were all undergoing PCI, so the findings do not apply to patients treated medically with an early conservative approach. The study drug was given only after the decision was made to perform PCI in patients with non-ST-elevation acute coronary syndrome (but given immediately for patients with STEMI, because nearly all those patients undergo PCI).
Prasugrel was clearly beneficial, with a significant 20% lower rate of the combined end point of cardiovascular death, MI, and stroke at 15 months. However, bleeding risk was higher with prasugrel (2.4% vs 1.8%, hazard ratio 1.32, 95% confidence interval 1.02–1.68, P = .03). Looking at individual end points, the advantages of prasugrel were primarily in reducing rates of stent thrombosis and nonfatal MI. Death rates with the two drugs were equivalent, possibly because of the higher risk of bleeding with prasugrel. Bleeding in the prasugrel group was particularly increased in patients who underwent bypass surgery; more patients also needed transfusion.
Subgroup analysis showed that patients with a history of stroke or transient ischemic attack had higher rates of ischemic and bleeding events with prasugrel than with clopidogrel, leading to these being labeled as absolute contraindications to prasugrel. Patients over age 75 or who weighed less than 60 kg experienced excess bleeding risk that closely matched the reduction in ischemic event rates and thus did not have a net benefit with prasugrel.
Trial of ticagrelor vs clopidogrel
The PLATO trial28 included 18,000 patients, of whom 65% underwent revascularization and 35% were treated medically. The drug—clopidogrel or ticagrelor—was given in addition to aspirin at randomization (within 24 hours of symptom onset); this more closely follows clinical practice, in which dual antiplatelet therapy is started as soon as possible. This difference makes the PLATO study more relevant to practice for patients with non-ST-elevation acute coronary syndrome. Also, because they gave the drugs to all patients regardless of whether they were to undergo PCI, this study likely had a higher-risk population, which may be refected in the higher mortality rate at 30 days (5.9% in the clopidogrel group in the PLATO study vs 3.2% in the clopidogrel group in the TRITON study).
Another important difference between the trials testing prasugrel and ticagrelor is that patients who had already received a thienopyridine were excluded from the prasugrel trial but not from the ticagrelor trial. Nearly half the patients in the ticagrelor group were already taking clopidogrel. The clinical implication is that for patients who arrive from another facility and already have been given clopidogrel, it is safe to give ticagrelor. There is limited information about whether that is also true for prasugrel, although there is no known reason why the safety of adding prasugrel to clopidogrel should be different from that of ticagrelor.
The rate of ischemic events was 20% lower in the ticagrelor group than in the clopidogrel group, importantly including reductions in the incidence of death, MI, and stent thrombosis. There was no increase with ticagrelor compared with clopidogrel in bleeding associated with coronary artery bypass graft surgery, likely because of the more rapid washout of the ticagrelor effect, or in the need for blood transfusions. However, the rate of bleeding unrelated to coronary artery bypass was about 20% higher with ticagrelor.
In summary, more intense platelet inhibition reduces the risk of ischemic events, but, particularly for the irreversible inhibitor prasugrel, at the cost of a higher risk of bleeding. In general, the net benefit of these agents in preventing the irreversible complications of MI and (in the case of ticagrelor) death favor the use of the more intense ADP inhibitors in appropriate patients. Ticagrelor is indicated in patients with acute coronary syndromes undergoing invasive or conservative management; prasugrel is indicated in patients undergoing PCI, but contraindicated in patients with a previous stroke or transient ischemic event. Neither drug is indicated in patients undergoing elective PCI outside the setting of acute coronary syndromes, although these agents may be appropriate in patients with intolerance or allergy to clopidogrel.
Glycoprotein IIb/IIIa antagonists for select cases only
GP IIb/IIIa antagonists such as abciximab were previously used more commonly than they are today. Now, with routine pretreatment using thienopyridines, their role in acute coronary syndromes is less clear. They still play a role when routine dual antiplatelet therapy is not used, when prasugrel or ticagrelor is not used, and when heparin rather than an alternative antithrombin agent is used.
A meta-analysis29 of 3,755 patients showed a clear reduction in ischemic complications with abciximab as an adjunct to primary PCI for STEMI in patients treated with heparin.
Kastrati et al30 found that patients with non-ST-elevation acute coronary syndromes benefited from abciximab at the time of PCI with heparin, even though they had been routinely pretreated with clopidogrel. However, benefits were seen only in high-risk patients who had presented with elevated troponins.
On the other hand, the role of GP IIb/IIIa blockade for “upstream” medical management in patients with acute coronary syndromes has been eroded by several studies.
The ACUITY trial31 randomized more than 9,000 patients to receive either routine treatment with a GP IIb/IIIa inhibitor before angiography or deferred selective use in the catheterization laboratory only for patients undergoing PCI. No significant differences were found in rates of MI and death.
The Early ACS trial32 compared early routine eptifibatide vs delayed, provisional eptifibatide in 9,492 patients with acute coronary syndromes without ST elevation and who were assigned to an invasive strategy. The early-eptifibatide group received two boluses and an infusion of eptifibatide before angiography; the others received a placebo infusion, with provisional eptifibatide after angiography if the patient underwent PCI and was deemed at high risk. No significant difference in rates of death or MI were noted, and the early-eptifibatide group had significantly higher rates of bleeding and need for transfusion.
The FINESSE trial33 also discredited “facilitating” PCI by giving GP IIb/IIIa antagonists in patients with STEMI before arrival in the catheterization laboratory, with no benefit to giving abciximab ahead of time vs in the catheterization laboratory, and with an increased risk of bleeding complications.
These studies have helped narrow the use of GP IIb/IIIa inhibitors to the catheterization laboratory in conjunction with heparin anticoagulation (as compared with bivalirudin [Angiomax]; see below) and only in select or high-risk cases. These drugs are indicated in the medical phase of management only if patients cannot be stabilized by aspirin or ADP inhibition.
NEWER ANTITHROMBOTICS: ADVANTAGES UNCLEAR
The complex coagulation cascade has a number of components, but only a few are targeted by drugs that are approved and recommended: fondaparinux (Arixtra) and oral factor Xa inhibitors affect the prothrombinase complex (including factor X); bivalirudin and oral factor IIa inhibitors affect thrombin; and heparin and the low-molecular-weight heparins inhibit both targets.
Low-molecular-weight heparins
The SYNERGY trial34 randomized nearly 10,000 patients with non-ST-elevation acute coronary syndromes at high risk for ischemic cardiac complications managed with an invasive approach to either the low-molecular-weight heparin enoxaparin (Lovenox) or intravenous unfractionated heparin immediately after enrollment. Most patients underwent catheterization and revascularization. No clinical advantage was found for enoxaparin, and bleeding complications were increased.
The EXTRACT-TIMI 25 trial35 randomized more than 20,000 patients with STEMI who were about to undergo fibrinolysis to receive either enoxaparin throughout hospitalization (average of 8 days) or unfractionated heparin for at least 48 hours. The enoxaparin group had a lower rate of recurrent MI, but it was unclear if the difference was in part attributable to the longer therapy time. The enoxaparin group also had more bleeding.
Fondaparinux
The OASIS-5 trial36,37 compared enoxaparin and fondaparinux, an exclusive factor Xa inhibitor, in more than 20,000 patients with unstable angina or NSTEMI. Fondaparinux was associated with a lower risk of death and reinfarction as well as fewer bleeding events. However, the benefits were almost exclusively in patients treated medically. In those undergoing PCI within the first 8 days, no benefit was found, although there was still a significant reduction in major bleeding events. Catheter thrombosis was also increased in patients taking fondaparinux, but only in those who did not receive adequate unfractionated heparin treatment before PCI.
Bivalirudin superior at time of catheterization
The most significant advance in antithrombotic therapy for patients with acute coronary syndromes is bivalirudin. This drug has a clear role only in the catheterization laboratory, where patients can be switched to it from heparin, low-molecular-weight heparin, or fondaparinux.
Three trials38–40 evaluated the drug in a total of more than 20,000 patients receiving invasive management of coronary artery disease undergoing PCI for elective indications, NSTEMI, or STEMI.
Results were remarkably similar across the three trials. Patients who were treated with bivalirudin alone had the same rate of ischemic end points at 30 days as those receiving heparin plus a GP IIb/IIIa inhibitor, but bivalirudin was associated with a consistent and significant 40% to 50% lower bleeding risk. For the highest-risk patients, those with STEMI, the bivalirudin group also had a significantly lower risk of death at 1 year.41
OTHER DRUGS: EARLY TREATMENT NO LONGER ROUTINE
Most data for the use of therapies aside from antithrombotics are from studies of patients with STEMI, but findings can logically be extrapolated to those with non-ST-elevation acute coronary syndromes.
Beta-blockers: Cardiogenic shock a risk
For beta-blockers, many historical trials were done in stable coronary disease, but there are no large trials in the setting of NSTEMI or unstable angina, and only recently have there been large trials for STEMI. Before the availability of recent evidence, standard practice was to treat STEMI routinely with intravenous metoprolol (Lopressor) and then oral metoprolol.
When large studies were finally conducted, the results were sobering.
COMMIT.42 Nearly 46,000 patients with suspected acute MI were randomized to receive either metoprolol (up to 15 mg intravenously, then 200 mg by mouth daily until discharge or for up to 4 weeks in the hospital) or placebo. Surprisingly, although rates of reinfarction and ventricular fibrillation were lower with metoprolol, a higher risk of cardiogenic shock with early beta-blockade offset these benefits and the net mortality rate was not reduced. This study led to a reduction in the early use of beta-blockers in patients with STEMI.
The standard of care has now shifted from beta-blockers in everyone as early as possible after MI to being more cautious in patients with contraindications, including signs of heart failure or a low-output state, or even in those of advanced age or with borderline low blood pressure or a high heart rate. Patients who present late and therefore may have a larger infarct are also at higher risk.
Although the goal should be to ultimately discharge patients on beta-blocker therapy after an MI, there should be no rush to start one early.
Carvedilol now preferred after STEMI
The CAPRICORN trial43 randomized nearly 2,000 patients following MI with left ventricular dysfunction (an ejection fraction of 40% or below) to either placebo or the beta-blocker carvedilol (Coreg). Patients taking the drug had a clear reduction in rates of death and reinfarction, leading to this drug becoming the beta-blocker of choice in patients with ventricular dysfunction after STEMI.
Angiotensin-converting enzyme inhibitors: Early risk of cardiogenic shock
The use of angiotensin-converting enzyme (ACE) inhibitors after MI is also supported by several studies.44 Two very large studies, one of nearly 60,000 patients and one of nearly 20,000, showed a clear reduction in the mortality rate in those who received an ACE inhibitor. Most of the benefit was in patients with an ejection fraction of less than 40%. On the basis of these trials, ACE inhibitors are indicated for all patients for the first 30 days after MI and then indefinitely for those with left ventricular dysfunction. However, the trial in which an ACE inhibitor was given intravenously early on had to be stopped prematurely because of worse outcomes owing to cardiogenic shock.
These studies highlight again that for patients who are unstable in the first few days of an acute coronary syndrome, it is best to wait until their condition stabilizes and to start these therapies before hospital discharge.
Intensive statin therapy
In the last 20 years, unequivocal evidence has emerged to support the beneficial role of statins for secondary prevention in patients with established coronary artery disease. More-recent trials have also shown that intensive statin therapy (a high dose of a potent statin) improves outcomes better than lower doses.
The PROVE-IT TIMI 22 trial45 randomized patients after an acute coronary syndrome to receive either standard therapy (pravastatin [Pravachol] 40 mg) or intensive therapy (atorvastatin [Lipitor] 80 mg). The intensive-therapy group had a significantly lower rate of major cardiovascular events, and the difference persisted and grew over 30 months of follow-up.
A number of studies confirmed this and broadened the patient population to those with unstable or stable coronary disease. Regardless of the risk profile, the effects were consistent and showed that high-dose statins were better in preventing coronary death and MI.46
Guidelines are evolving toward recommendation of highest doses of statins independently of the target level of low-density lipoprotein cholesterol.
- Antman EM, Anbe DT, Armstrong PW, et al; American College of Cardiology; American Heart Association Task Force on Practice Guidelines; Canadian Cardiovascular Society. ACC/AHA guidelines for the management of patients with ST-elevation myocardial infarction. Circulation 2004; 110:e82–e292. Erratum in: Circulation 2005; 111:2013–2014.
- Davies MJ. The pathophysiology of acute coronary syndromes. Heart 2000; 83:361–366.
- Rosamond W, Flegal K, Friday G, et al; American Heart Association Statistics Committee and Stroke Statistics Subcommittee. Heart disease and stroke statistics–2007 update: a report from the American Heart Association Statistics Committee and Stroke Statistics Subcommittee. Circulation 2007; 115:e69–e171.
- Granger CB, Califf RM, Topol EJ. Thrombolytic therapy for acute myocardial infarction. A review. Drugs 1992; 44:293–325.
- Fibrinolytic Therapy Trialists’ (FTT) Collaborative Group. Indications for fibrinolytic therapy in suspected acute myocardial infarction: collaborative overview of early mortality and major morbidity results from all randomised trials of more than 1000 patients. Lancet 1994; 343:311–322.
- Keely EC, Boura JA, Grines CL. Primary angioplasty versus intravenous thrombolytic therapy for acute myocardial infarction: a quantitative review of 23 randomised trials. Lancet 2003; 361:13–20
- De Luca G, Suryapranata H, Ottervanger JP, Antman EM. Time delay to treatment and mortality in primary angioplasty for acute myocardial infarction: every minute of delay counts. Circulation 2004; 109:1223–1225.
- Dalby M, Bouzamondo A, Lechat P, Montalescot G. Transfer for primary angioplasty versus immediate thrombolysis in acute myocardial infarction: a meta-analysis. Circulation 2003; 108:1809–1814.
- Gersh BJ, Stone GW, White HD, Holmes DR Jr. Pharmacological facilitation of primary percutaneous coronary intervention for acute myocardial infarction: is the slope of the curve the shape of the future? JAMA 2005; 293:979–986.
- Antman EM, Hand M, Armstron PW, et al; Canadian Cardiovascular Society; American Academy of Family Physicians; American College of Cardiology; American Heart Association. 2007 focused update of the ACC/AHA 2004 guidelines for the management of patients with ST-elevation myocardial infarction: a report of the American College of Cardiology/American Heart Association Task Force on Practice Guidelines. J Am Coll Cardiol 2008; 51:210–247.
- Di Mario C, Dudek D, Piscione F, et al; CARESS-in-AMI (Combined Abciximab Reteplase Stent Study in Acute Myocardial Infarction) Investigators. Immediate angioplasty versus standard therapy with rescue angioplasty after thrombolysis in the Combined Abciximab REteplase Stent Study in Acute Myocardial Infarction (CARESS-in-AMI): an open, prospective, randomised, multicentre trial. Lancet 2008; 371:559–568.
- Cantor WJ, Fitchett D, Borgundvaag B, et al; TRANSFER-AMI Trial Investigators. Routine early angioplasty after fibrinolysis for acute myocardial infarction. N Engl J Med 2009; 360:2705–2718.
- Cannon CP, Weintraub WS, Demopoulos LA, et al; TACTICS (Treat Angina With Aggrastat and Determine Cost of Therapy With an Invasive or Conservative Strategy)–Thrombolysis in Myocardial Infarction 18 Investigators. Comparison of early invasive and conservative strategies in patients with unstable coronary syndromes treated with the glycoprotein IIb/IIIa inhibitor tirofiban. N Engl J Med 2001; 344:1879–1887.
- Damman P, Hirsch A, Windhausen F, Tijssen JG, de Winter RJ; ICTUS Investigators. 5-year clinical outcomes in the ICTUS (Invasive versus Conservative Treatment in Unstable coronary Syndromes) trial a randomized comparison of an early invasive versus selective invasive management in patients with non-ST-segment elevation acute coronary syndrome. J Am Coll Cardiol 2010; 55:858–864.
- Bavry AA, Kumbhani DJ, Rassi AN, Bhatt DL, Askari AT. Benefit of early invasive therapy in acute coronary syndromes: a meta-analysis of contemporary randomized clinical trials. J Am Coll Cardiol 2006; 48:1319–1325.
- Antman EM, Cohen M, Bernink PJ, et al. The TIMI risk score for unstable angina/non-ST elevation MI: a method for prognostication and therapeutic decision making. JAMA 2000; 284:835–842.
- Mehta SR, Granger CB, Boden WE, et al; TIMACS Investigators. Early versus delayed invasive intervention in acute coronary syndromes. N Engl J Med 2009; 360:2165–2175.
- Anderson JL, Adams CD, Antman EM, et al. ACC/AHA 2007 guidelines for the management of patients with unstable angina/non-ST-Elevation myocardial infarction. J Am Coll Cardiol 2007; 50:e1–e157.
- Yousef O, Bhatt DL. The evolution of antiplatelet therapy in cardiovascular disease. Nat Rev Cardiol 2011; 8:547–559.
- ISIS-2 (Second International Study of Infarct Survival) Collaborative Group. Randomised trial of intravenous streptokinase, oral aspirin, both, or neither among 17,187 cases of suspected acute myocardial infarction: ISIS-2. Lancet 1988; 2:349–360.
- CURRENT-OASIS 7 Investigators; Mehta SR, Bassand JP, Chrolavicius S, et al. Dose comparisons of clopidogrel and aspirin in acute coronary syndromes. N Engl J Med 2010; 363:930–942.
- Yusuf S, Mehta SR, Zhao F, et al; Clopidogrel in Unstable angina to prevent Recurrent Events Trial Investigators. Early and late effects of clopidogrel in patients with acute coronary syndromes. Circulation 2003; 107:966–972.
- Chen ZM, Jiang LX, Chen YP, et al; COMMIT (Clopidogrel and Metoprolol in Myocardial Infarction Trial) collaborative group. Addition of clopidogrel to aspirin in 45,852 patients with acute myocardial infarction: randomised placebo-controlled trial. Lancet 2005; 366:1607–1621.
- Schömig A. Ticagrelor—is there need for a new player in the antiplatelet-therapy field? N Engl J Med 2009; 361:1108–1111.
- Wiviott SD, Antman EM, Braunwald E. Prasugrel. Circulation 2010; 122:394–403.
- Gurbel PA, Bliden KP, Butler K, et al. Randomized double-blind assessment of the ONSET and OFFSET of the antiplatelet effects of ticagrelor versus clopidogrel in patients with stable coronary artery disease: the ONSET/OFFSET study. Circulation 2009; 120:2577–2585.
- Wiviott SD, Braunwald E, McCabe CH, et al; TRITON-TIMI 38 Investigators. Prasugrel versus clopidogrel in patients with acute coronary syndromes. N Engl J Med 2007; 357:2001–2015.
- Wallentin L, Becker RC, Budaj A, et al; PLATO Investigators. Ticagrelor versus clopidogrel in patients with acute coronary syndromes. N Engl J Med 2009; 361:1045–1057.
- de Queiroz Fernandes Araujo JO, Veloso HH, Braga De Paiva JM, Fiho MW, Vincenzo De Paola AA. Efficacy and safety of abciximab on acute myocardial infarction treated with percutaneous coronary interventions: a meta-analysis of randomized, controlled trials. Am Heart J 2004; 148:937–943.
- Kastrati A, Mehilli J, Neuman FJ, et al; Intracoronary Stenting and Antithrombotic: Regimen Rapid Early Action for Coronary Treatment 2 (ISAR-REACT 2) Trial Investigators. Abciximab in patients with acute coronary syndromes undergoing percutaneous coronary intervention after clopidogrel pretreatment: the ISAR-REACT 2 randomized trial. JAMA 2006; 295:1531–1538.
- Stone GW, Bertrand ME, Moses JW, et al; ACUITY Investigators. Routine upstream initiation vs deferred selective use of glycoprotein IIb/IIIa inhibitors in acute coronary syndromes: the ACUITY Timing trial. JAMA 2007; 297:591–602.
- Giugliano RP, White JA, Bode C, et al; Early ACS Investigators. Early vs delayed, provisional eptifibatide in acute coronary syndromes. N Engl J Med 2009; 360:2176–2190.
- Ellis SG, Tendera M, de Belder MA, et al; FINESSE Investigators. Facilitated PCI in patients with ST-elevation myocardial infarction. N Engl J Med 2008; 358:2205–2217.
- Fergusson JJ, Califf RM, Antman EM, et al; SYNERGY Trial Investigators. Enoxaparin vs unfractionated heparin in high-risk patients with non-ST-segment elevation acute coronary syndromes managed with an intended early invasive strategy: primary results of the SYNERGY randomized trial. JAMA 2004; 292:45–54.
- Antman EM, Morrow DA, McCabe CH; EXTRACT-TIMI 25 Investigators. Enoxaparin versus unfractionated heparin with fibrinolysis for ST-elevation myocardial infarction. N Engl J Med 2006; 354:1477–1488.
- The Fifth Organization to Assess Strategies in Acute Ischemic Syndromes Investigators. Comparison of fondaparinux and enoxaparin in acute coronary syndromes. N Engl J Med 2006; 354:1464–1476.
- Mehta SR, Granger CB, Eikelboom JW, et al. Efficacy and safety of fondaparinux versus enoxaparin in patients with acute coronary syndromes undergoing percutaneous coronary intervention: results from the OASIS-5 trial. J Am Coll Cardiol 2007; 50:1742–1751.
- Lincoff AM, Bittl JA, Harrington RA, et al; REPLACE-2 Investigators. Bivalirudin and provisional glycoprotein IIb/IIIa blockade compared with heparin and planned glycoprotein IIb/IIIa blockade during percutaneous coronary intervention: REPLACE-2 randomized trial. JAMA 2003; 289:853–863.
- Stone GW, McLaurin BT, Cox DA, et al; ACUITY Investigators. Bivalirudin for patients with acute coronary syndromes. N Engl J Med 2006; 355:2203–2216.
- Stone GW, Witzenbichler B, Guagliumi G, et al; HORIZONS-AMI Trial Investigators. Bivalirudin during primary PCI in acute myocardial infarction. N Engl J Med 2007; 358:2218–2230.
- Mehran R, Lansky AJ, Witzenbichler B, et al; HORIZONS-AMI Trial Investigators. Bivalirudin in patients undergoing primary angioplasty for acute myocardial infarction (HORIZONS-AMI): 1-year results of a randomised controlled trial. Lancet 2009; 374:1149–1159.
- Chen ZM, Pan HC, Chen YP, et al; COMMIT (Clopidogrel and Metoprolol in Myocardial Infarction Trial) Collaborative Group. Early intravenous then oral metoprolol in 45,852 patients with acute myocardial infarction: randomised placebo-controlled trial. Lancet 2005; 366:1622–1632.
- Dargie JH. Effect of carvedilol on outcome after myocardial infarction in patients with left-ventricular dysfunction: the CAPRICORN randomised trial. Lancet 2001; 357:1385–1390.
- Hennekens CH, Albert CM, Godfried SL, Gaziano JM, Buring JE. Adjunctive drug therapy of acute myocardial infarction—evidence from clinical trials. N Engl J Med 1996; 335:1660–1667.
- Cannon CP, Braunwald E, McCabe CH, et al; Pravastatin or Atorvastatin Evaluation and Infection Therapy–Thrombolysis in Myocardial Infarction 22 Investigators. Intensive versus moderate lipid lowering with statins after acute coronary syndromes. N Engl J Med 2004; 350:1495–1504.
- Cannon CP, Steinberg BA, Murphy SA, Mega JL, Braunwald E. Meta-analysis of cardiovascular outcomes trials comparing intensive versus moderate statin therapy. J Am Coll Cardiol 2006; 48:438–445.
KEY POINTS
- For acute ST-elevation myocardial infarction, primary percutaneous coronary intervention is preferred over fibrinolytic therapy if it is available within 90 minutes of first medical contact.
- For non-ST-elevation acute coronary syndromes, either an early invasive or conservative strategy is recommended depending on patient risk and whether intensive medical therapy is available and appropriate.
- Daily aspirin therapy is indicated for all patients with acute coronary syndromes unless they have a true aspirin allergy.
- Adenosine diphosphate receptor inhibitors—clopidogrel, prasugrel, and ticagrelor—reduce ischemic events but increase bleeding risk and should be used only for patients with no history of stroke or transient ischemic attack.
The METEOR trial: No rush to repair a torn meniscus
Many patients who have osteoarthritis of the knee and a torn meniscus can defer having the meniscus repaired and undergo physical therapy instead. If a trial of physical therapy does not help, they can opt for surgery later.
This seems to be the take-home message from the recent Meniscal Tear in Osteoarthritis Research (METEOR) trial,1 which compared the efficacy of arthroscopic partial meniscectomy plus physical therapy vs physical therapy alone for patients with knee symptoms, a meniscal tear, and mild to moderate osteoarthritis of the knee.1
In brief, patients improved to a roughly similar degree with either approach, and although many patients assigned to physical therapy eventually underwent surgery anyway by 6 months, the delay did not adversely affect outcomes.
In this article, we review the background, design, and findings of the METEOR trial, and their implications for clinical practice.
SURGERY: HIGH VOLUME, BUT LITTLE EVIDENCE
Magnetic resonance imaging (MRI) often incidentally reveals meniscal lesions in middle-aged and older patients who have osteoarthritis and knee pain.2 Should these patients undergo arthroscopic meniscal repair? The decision is difficult, since it is hard to distinguish the symptoms of a meniscal tear from those of osteoarthritis.3
Current evidence suggests that, for symptomatic knee osteoarthritis by itself, arthroscopic surgery is no more effective than conservative management.4,5 But what about surgery for a torn meniscus in addition to osteoarthritis?
Osteoarthritis is the most common joint disease, accounting for many physician visits.6 More than 26 million Americans over age 25 have some form of it, and the prevalence of symptomatic, radiographically confirmed osteoarthritis of the knee was 12.1% in the third National Health and Nutrition Examination Survey.7
We used to consider osteoarthritis a “wear-and-tear” disease—thus the term “degenerative joint disease.” But today, we know that it is an active response to injury, involving inflammatory and metabolic pathways.8 Moreover, the risk of osteoarthritis and its progression seems to be higher in those who have had meniscal injury and total or arthroscopic partial meniscectomy.9,10
MRI is not commonly used in managing knee osteoarthritis, but it has been used diagnostically in patients with symptoms of a meniscal tear, such as clicking, locking, popping, giving way, and pain with pivoting or twisting. Traumatic meniscal tears (a longitudinal or radial tear pattern) most often occur in active younger people and often lead to meniscal surgery.11,12 In contrast, degenerative meniscal tears (horizontal, oblique, or complex tear pattern or meniscal maceration) tend to occur in older people,11,12 but how to manage them is not widely agreed upon.
Of note, most patients with osteoarthritis of the knee have torn, macerated, or heavily damaged menisci.13,14 Meniscal lesions are also common in middle-aged people in the general population, with a higher prevalence in people who are older, heavier, or female, or who have a family history of osteoarthritis.15
These abnormalities are only weakly associated with symptoms.2 However, when a patient has knee symptoms and a torn meniscus is detected on MRI, the tear is often assumed to be the source of the symptoms, and meniscal tears are the most common reason for arthroscopy.16
Since we have no way to prevent the progression of joint damage from osteoarthritis with drugs or by any other means, the goal is to alleviate the symptoms. Many patients report pain relief or functional improvement after arthroscopic surgery. But arthroscopic lavage or debridement for osteoarthritis has not been found to be better than conservative treatment or placebo in randomized controlled trials.4,5
In contrast, the current standard treatment for a symptomatic degenerative meniscal tear is arthroscopic partial meniscectomy. Nearly 500,000 of these procedures are performed annually in the United States.16 But based on the best evidence, arthroscopic partial meniscectomy does not result in better pain relief and functional improvement than does physical therapy alone in patients who have a torn meniscus and knee osteoarthritis.17,18
OVERVIEW OF THE METEOR TRIAL
The METEOR trial was a randomized controlled trial conducted at seven US tertiary referral centers. Its aim was to compare the short-term (6-month) and long-term (12-month) efficacy of arthroscopic partial meniscectomy and physical therapy in patients with symptomatic meniscal tear and osteoarthritis of the knee.19 It was supported by the National Institute of Arthritis and Musculoskeletal and Skin Diseases.1
Patients were age 45 and older
METEOR patients had to be at least 45 years old and have symptomatic meniscal tears and knee osteoarthritis detected on MRI or radiography.1
Osteoarthritis was defined broadly, given that it begins well before the appearance of radiographic evidence such as an osteophyte or joint-space narrowing.19 Patients with cartilage defects on MRI were also enrolled, as were patients with radiographically documented osteoarthritis.19
Patients were considered to have a symptomatic meniscal tear if they had had at least 4 weeks of symptoms (such as episodic pain and pain that was acute and localized to one spot on the knee, as well as typical mechanical pain suggesting a meniscal tear, such as clicking, catching, popping, giving way, or pain with pivoting or twisting) in addition to evidence of a meniscal tear on MRI.19
Patients were excluded if they had a chronically locked knee (a clear-cut indication for arthroscopic partial meniscectomy), advanced osteoarthritis (Kellgren-Lawrence grade 4), inflammatory arthritis, clinically symptomatic chondrocalcinosis, or bilateral symptomatic meniscal tears.19 Patients who had undergone surgery or injection of a viscosupplement in the index knee during the past 4 weeks were also excluded.19
Of 1,330 eligible patients, 351 (26.4%) were enrolled and randomly assigned in a 1:1 ratio to a treatment group by means of a secure program on the trial website.1,19 Of those who were eligible but did not enroll, 195 (14.6%) were not referred and 784 (58.9%) declined to participate. Of those who declined, more preferred surgery than physical therapy (36.1% vs 21%). No information is available on any differences in baseline characteristics between the enrolled patients and the eligible patients who declined.
Randomization was done in blocks of varying size within each site, stratified according to sex and the extent of osteoarthritis on baseline radiography. The extent of osteoarthritis was categorized either as Kellgren-Lawrence grade 0 (normal, no features of osteoarthritis) to grade 2 (definite osteoarthritis, a definite osteophyte without joint-space narrowing) or as Kellgren-Lawrence grade 3 (moderate osteoarthritis, < 50% joint-space narrowing).1,19 The two treatment groups were similar with respect to age, sex, race or ethnicity, baseline Kellgren-Lawrence grade, and baseline Western Ontario and McMaster Universities Arthritis Index (WOMAC) physical function score.1
The mean age of the participants was 58, and 85% were white. Sixty-three percent had Kellgren-Lawrence grade 0 to 2 osteoarthritis, and 27% had grade 3.1
Surgery plus physical therapy vs physical therapy alone
The surgery group underwent arthroscopic partial meniscectomy, which involved trimming the damaged meniscus back to a stable rim1,19 and trimming loose fragments of cartilage and bone.
After the procedure, patients were scheduled for physical therapy. Although there is no consensus on the need for or the effectiveness of postoperative physical therapy in this setting, the investigators believed that including it in both study groups would help to isolate the independent effects of surgery. The physical therapy regimen after surgery was similar to that provided in the nonoperative group.1,19
Physical therapy was designed to address inflammation, range of motion, muscle strength, muscle-length restriction, functional mobility, and proprioception and balance.1,19 There were three stages; criteria for advancing from one phase to the next included the level of self-reported pain, observed strength, range of knee motion, knee effusion, and functional mobility.1,18
The duration of participation varied depending on the pace of improvement. Generally, the program lasted about 6 weeks.1,19
Crossover and other therapies were allowed
Crossover from physical therapy alone to surgery was allowed during the trial if the patient and surgeon thought it was clinically indicated.
Participants in both groups were permitted to take acetaminophen and nonsteroidal anti-inflammatory drugs as needed. Intra-articular injections of glucocorticoids were also allowed during the trial.
OUTCOMES MEASURED
WOMAC physical function score
The primary outcome of the METEOR trial was the difference between the study groups in the change in WOMAC physical function score from baseline to 6 months, at which point participants were expected to have achieved maximum improvement.1,19 Questionnaires were also administered at 3 months to assess the early response to surgery or physical therapy and again at 12 months.
The complete WOMAC also measures pain and stiffness in addition to physical function, with separate subscales for each. The change in WOMAC score is one of the most widely endorsed outcome measures in assessing interventions in osteoarthritis or other conditions of the lower extremities.20 The METEOR trial authors considered the WOMAC scale to be highly valid and reliable, with a Cronbach alpha value of 0.97 (maximum value = 1; the higher the better).
No ceiling or floor effects were observed in the WOMAC physical function score in patients with osteoarthritis and a meniscal tear in a pilot study for METEOR.19
In the main METEOR study, WOMAC physical function was scored on a scale of 0 to 100, with a higher score indicating worse physical function.1 Changes in the score were also measured as a yes-or-no question, defined a priori as whether the score declined by at least 8 points, which is considered the minimal clinically important difference in osteoarthritis patients.1,19
KOOS and MOS SF-36 scores
Secondary outcomes were measured in several domains, including pain, generic functional status, quality of life, and health care utilization.1,19
The KOOS (Knee Injury and OA Outcome Scale) is specific for knee pain, being designed to evaluate short-term and long-term symptoms and function in patients with knee injury and associated problems.21 It has five subscales, which are scored separately: pain, other symptoms, activities of daily living, sport and recreation, and knee-related quality of life.21 Since the WOMAC pain scale showed a ceiling effect in the pilot study in patients undergoing surgery, the authors chose the KOOS pain scale as a pain measure.19 Scores were transformed to a 0–100 scale, with a higher score indicating more pain.1
The MOS SF-36 (Medical Outcomes Study 36-item short form) was used to measure general health status and function.1,19
STATISTICAL ANALYSIS: INTENTION-TO-TREAT AND AS-TREATED
The study was powered to detect a 10-point difference in WOMAC physical function scores at 6 months of follow-up between the operative and nonoperative groups, anticipating losses to follow-up and crossover, with preplanned subgroup (Kellgren–Lawrence grade 0–2 vs grade 3) analysis.1,19
The primary analysis used a modified intention-to-treat approach and was implemented with an analysis of covariance with changes in the WOMAC score from baseline to 6 months as the dependent variable, treatment as the independent variable of interest, and study site as a covariate. Other covariates, such as age, sex, and baseline Kellgren-Lawrence grade, were balanced across groups and were therefore not included in the analysis.1,19
Secondary analyses used an “as-treated” approach, ie, according to the treatment actually received.1,19 Secondary intention-to-treat analysis—using binary outcome measures in which treatment failure was defined as improvement in the WOMAC score of less than 8 points or crossing over to the other treatment—was also performed to estimate efficacy at the level of the patient rather than at the group level.1,19
BOTH GROUPS IMPROVED
In the intention-to-treat analyses at 6 months and 12 months after randomization, both groups improved, with no clinically important or statistically significant differences between the groups in functional status (WOMAC score, MOS SF-36 score) or pain (KOOS score).1 The mean improvement (decline) in the WOMAC score from baseline to 6 months was 20.9 points in the surgery group vs 18.5 points in the physical therapy group, a difference of 2.4 points (95% confidence interval [CI], −1.8 to 6.5).1
35% of physical therapy patients underwent surgery by 12 months
Of the 177 patients randomized to physical therapy alone, by 6 months 1 had died, 1 had undergone total knee replacement, 4 had withdrawn, and 2 were lost to follow-up. Of the 169 remaining, 51 (30%) had undergone arthroscopic partial meniscectomy. An additional 8 patients who were assigned to physical therapy crossed over to surgery between 6 and 12 months.1,19
Of the 174 patients randomized to surgery, by 6 months 1 had died, 3 had undergone total knee replacement, 7 had withdrawn, and 2 were ineligible. Of the 161 remaining, 9 (6%) had not undergone the procedure.
Other outcomes
Subgroup analysis based on the baseline radiographic grade (Kellgren-Lawrence grade 0 to 2 vs grade 3) did not show a difference between groups in functional improvement at 6 months (P = .13 for interaction).1
No statistically significant difference was noted in rates of overall or specific adverse events between the two groups over the first 12 months.1 Adverse events rated as mild or moderate in severity occurred in 15 participants in the surgery group and 13 participants in the physical therapy group.1 Long-term risks associated with these interventions are being assessed, and longitudinal assessment of imaging studies is planned to address this question but is not yet available.1,18
In the physical therapy group, 21 patients (12%) received intra-articular glucocorticoid injections, as did 9 patients (6%) in the surgery group.1,19
TRANSLATING THE METEOR RESULTS TO EVERYDAY PRACTICE
There are many challenges in designing surgical trials. Indeed, by one estimate,22 only about 40% of treatment questions involving surgical procedures can be evaluated by a randomized controlled trial.
Although the METEOR trial was not blinded, it was the first large, multicenter, randomized controlled trial to compare arthroscopic partial meniscectomy vs standardized physical therapy by using high-quality methodology such as careful sample-size calculation, balancing the groups according to known prognostic factors with block randomization, and intention-to-treat analysis. Moreover, the outcome measures were obtained from validated self-reporting questionnaires (WOMAC for function and KOOS for pain), reducing the possibility of observer bias.19 In addition, analyses were performed with the analysts blinded to the randomization assignment.
Limitations of the trial
A few limitations of the study are worth noting.
Patients age 45 or older with both symptomatic meniscal tear and osteoarthritis were the target population of this study. However, it is important to distinguish between the study population and the target population in a physician’s practice.
The investigators adopted broad definitions of osteoarthritis and symptoms of meniscal tear. Twenty-one percent of participants had normal findings on plain radiography, with cartilage defects visible only on MRI. Further, episodic pain or acute pain localized to a joint line was regarded as a symptom consistent with a torn meniscus.
In practice, arthroscopic partial meniscectomy is usually considered when a patient with a long history of tolerable osteoarthritis presents with a sudden onset of intolerable pain after a squatting or twisting injury.
In addition, the study population was predominantly white (85%), and the study was performed in tertiary referral academic medical centers. Therefore, the outcomes achieved with surgery or physical therapy may not translate to the community setting. Clinicians must be careful to account for these types of differences in extrapolating to patients in their own practice.
Potential enrollment bias
Although randomization is a rigorous method that eliminates selection bias in assigning individuals to study and control groups, selective enrollment could have created bias.1 As the authors mentioned, only 26% of eligible patients were enrolled, possibly reflecting patients’ or surgeons’ strong preferences for one treatment or the other. Because the study and control groups were hardly random samples of eligible populations, we must be careful in generalizing the efficacy of physical therapy.1
Crossover may have obscured the benefit of surgery
During the first 6 months, 30% of patients crossed over from physical therapy to surgery. High crossover rates in surgical trials are common, especially when comparing surgery with medical therapy.23 Given that most of the patients assigned to only physical therapy who crossed over to surgery did not have substantial improvement in functional status, it seems that crossover occurred by nonrandom factors, potentially biasing the study results. With the high degree of crossover from the nonoperative group to the surgical group, intention-to-treat analysis may have given an inflated estimate of the effect of physical therapy.
To account for crossovers, researchers defined a binary outcome a priori: patients were considered to have had a successful treatment response if they improved by at least 8 points on the WOMAC scale (a clinically important difference) and did not cross over from their assigned treatment. At 6 months, 67.1% of patients assigned to surgery showed a successful treatment response, compared with 43.8% of patients assigned to physical therapy alone (P = .001).1
In patients who crossed over, the last scores before crossover were carried over, and primary analysis of the WOMAC score at 6 months was repeated to estimate the effect of crossovers from the nonoperative to the surgery group. This exploratory analysis showed a 13.0-point improvement in WOMAC score at 6 months with physical therapy alone vs a 20.9-point improvement with surgery, suggesting that the similarity in outcomes between the two groups may be explained in part by additional improvements from surgery for those who crossed over from physical therapy alone.1
Implications for functional improvement
Lacking a comparison group that underwent a sham surgical procedure, one cannot conclude that surgery after crossover improved functional status in those patients. However, there was no significant difference in WOMAC physical function scores at 12 months between the 30% of patients in the physical therapy group who crossed over and underwent surgery during the first 6 months and patients initially assigned to surgery. This finding suggests that physical therapy can be recommended as a first-line therapy, although we must be cautious, given that the physical therapy group required more background therapy (eg, intra-articular glucocorticoid injections), and that this study was not powered to detect such differences at 12 months.
Also, a patient may need to get better quickly, to get back to work, for example. Although the data were not definitive, at 3 months the patients in the surgery group seemed to have better pain control and function than those in the physical therapy group. A cost-benefit analysis of physical therapy compared with surgery for short-term outcomes may be helpful before generalizing these findings.
SURGERY VS SHAM PROCEDURE: THE FIDELITY GROUP RESULTS
In a later publication from the Finnish Degenerative Meniscal Lesion Study (FIDELITY) Group,24 146 patients with symptoms consistent with degenerative meniscal tear but no knee osteoarthritis were randomized to undergo arthroscopic partial meniscectomy or a sham procedure. At 12 months, no differences were noted between the groups in terms of change of symptoms from baseline to 12 months.
The authors concluded that the outcomes with meniscectomy were no better than with a sham procedure.24
SURGERY FIRST, OR PHYSICAL THERAPY FIRST?
The use of knee arthroscopy has increased sharply in middle-aged patients in recent years. Indeed, this demographic group accounts for nearly half of the knee arthroscopic procedures performed for meniscal tears, although the increase may be due in part to issues with surgeons’ coding and insurance authorization.16
The METEOR trial showed that a structured physical therapy program can be as effective as surgery as a first-line therapy in many patients with symptomatic meniscal tears and mild to moderate osteoarthritis. These results should inform clinical practice in that most such patients need not be immediately referred for surgical intervention.
However, a subset of these patients may benefit from surgery rather than nonoperative therapy. Given the potential risks and public health implications of arthroscopic surgery for meniscal tears, further study is needed to better characterize these patients. A randomized sham-controlled trial is under way25 with the goal of assessing the efficacy of arthroscopic partial meniscectomy for medial meniscus tears in patients with or without knee osteoarthritis, and it is hoped this study will shed further light on this issue.
Based on the results of the METEOR trial, the physical therapy regimen that was used may be reasonable before referring patients with knee osteoarthritis and symptomatic meniscal tears for surgery.
- Katz JN, Brophy RH, Chaisson CE, et al. Surgery versus physical therapy for a meniscal tear and osteoarthritis. N Engl J Med 2013; 368:1675–1684.
- Englund M, Guermazi A, Gale D, et al. Incidental meniscal findings on knee MRI in middle-aged and elderly persons. N Engl J Med 2008; 359:1108–115.
- Englund M, Guermazi A, Lohmander SL. The role of the meniscus in knee osteoarthritis: a cause or consequence? Radiol Clin North Am 2009; 47:703–712.
- Moseley JB, O’Malley K, Petersen NJ, et al. A controlled trial of arthroscopic surgery for osteoarthritis of the knee. N Engl J Med 2002; 347:81–68.
- Kirkley A, Birmingham TB, Litchfield RB, et al. A randomized trial of arthroscopic surgery for osteoarthritis of the knee. N Engl J Med 2008; 359:1097–1107.
- Quintana JM, Escobar A, Arostegui I, et al. Prevalence of symptoms of knee or hip joints in older adults from the general population. Aging Clin Exp Res 2008; 20:329–336.
- Lawrence RC, Felson DT, Helmick CG, et al; National Arthritis Data Workgroup. Estimates of the prevalence of arthritis and other rheumatic conditions in the United States. Part II. Arthritis Rheum 2008; 58:26–35.
- Loeser RF, Goldring SR, Scanzello CR, Goldring MB. Osteoarthritis: a disease of the joint as an organ. Arthritis Rheum 2012; 64:1697–1707.
- Englund M, Lohmander LS. Risk factors for symptomatic knee osteoarthritis fifteen to twenty-two years after meniscectomy. Arthritis Rheum 2004; 50:2811–2819.
- Papalia R, Del Buono A, Osti L, Denaro V, Maffulli N. Meniscectomy as a risk factor for knee osteoarthritis: a systematic review. Br Med Bull 2011; 99:89–106.
- Englund M, Guermazi A, Roemer FW, et al. Meniscal tear in knees without surgery and the development of radiographic osteoarthritis among middle-aged and elderly persons: The Multicenter Osteoarthritis Study. Arthritis Rheum 2009; 60:831–839.
- Poehling GG, Ruch DS, Chabon SJ. The landscape of meniscal injuries. Clin Sports Med 1990; 9:539–549.
- Bhattacharyya T, Gale D, Dewire P, et al. The clinical importance of meniscal tears demonstrated by magnetic resonance imaging in osteoarthritis of the knee. J Bone Joint Surg Am 2003; 85-A:4–9.
- Sowers M, Karvonen-Gutierrez CA, Jacobson JA, Jiang Y, Yosef M. Associations of anatomical measures from MRI with radiographically defined knee osteoarthritis score, pain, and physical functioning. J Bone Joint Surg Am 2011; 93:241–251.
- Ding C, Martel-Pelletier J, Pelletier JP, et al. Meniscal tear as an osteoarthritis risk factor in a largely non-osteoarthritic cohort: a cross-sectional study. J Rheumatol 2007; 34:776–784.
- Kim S, Bosque J, Meehan JP, Jamali A, Marder R. Increase in outpatient knee arthroscopy in the United States: a comparison of National Surveys of Ambulatory Surgery, 1996 and 2006. J Bone Joint Surg Am 2011; 93:994–1000.
- Herrlin S, Hållander M, Wange P, Weidenhielm L, Werner S. Arthroscopic or conservative treatment of degenerative medial meniscal tears: a prospective randomised trial. Knee Surg Sports Traumatol Arthrosc 2007; 15:393–401.
- Herrlin SV, Wange PO, Lapidus G, Hållander M, Werner S, Weidenhielm L. Is arthroscopic surgery beneficial in treating non-traumatic, degenerative medial meniscal tears? A five year follow-up. Knee Surg Sports Traumatol Arthrosc 2013; 21:358–364.
- Katz JN, Chaisson CE, Cole B, et al. The MeTeOR trial (Meniscal Tear in Osteoarthritis Research): rationale and design features. Contemp Clin Trials 2012; 33:1189–1196.
- Bellamy N, Buchanan WW, Goldsmith CH, Campbell J, Stitt LW. Validation study of WOMAC: a health status instrument for measuring clinically important patient relevant outcomes to antirheumatic drug therapy in patients with osteoarthritis of the hip or knee. J Rheumatol 1988; 15:1833–1840.
- Roos EM, Lohmander LS. The Knee injury and Osteoarthritis Outcome Score (KOOS): from joint injury to osteoarthritis. Health Qual Life Outcomes 2003; 1:64.
- Solomon MJ, McLeod RS. Should we be performing more randomized controlled trials evaluating surgical operations? Surgery 1995; 118:459–467.
- Farrokhyar F, Karanicolas PJ, Thoma A, et al. Randomized controlled trials of surgical interventions. Ann Surg 2010; 251:409–416.
- Sihvonen R, Paavola M, Malmivaara A. Arthroscopic partial meniscectomy versus sham surgery for a degenerative meniscal tear. N Engl J Med 2013; 369:2515–2524.
- Hare KB, Lohmander LS, Christensen R, Roos EM. Arthroscopic partial meniscectomy in middle-aged patients with mild or no knee osteoarthritis: a protocol for a double-blind, randomized sham-controlled multicentre trial. BMC Musculoskelet Disord 2013; 14:71.
Many patients who have osteoarthritis of the knee and a torn meniscus can defer having the meniscus repaired and undergo physical therapy instead. If a trial of physical therapy does not help, they can opt for surgery later.
This seems to be the take-home message from the recent Meniscal Tear in Osteoarthritis Research (METEOR) trial,1 which compared the efficacy of arthroscopic partial meniscectomy plus physical therapy vs physical therapy alone for patients with knee symptoms, a meniscal tear, and mild to moderate osteoarthritis of the knee.1
In brief, patients improved to a roughly similar degree with either approach, and although many patients assigned to physical therapy eventually underwent surgery anyway by 6 months, the delay did not adversely affect outcomes.
In this article, we review the background, design, and findings of the METEOR trial, and their implications for clinical practice.
SURGERY: HIGH VOLUME, BUT LITTLE EVIDENCE
Magnetic resonance imaging (MRI) often incidentally reveals meniscal lesions in middle-aged and older patients who have osteoarthritis and knee pain.2 Should these patients undergo arthroscopic meniscal repair? The decision is difficult, since it is hard to distinguish the symptoms of a meniscal tear from those of osteoarthritis.3
Current evidence suggests that, for symptomatic knee osteoarthritis by itself, arthroscopic surgery is no more effective than conservative management.4,5 But what about surgery for a torn meniscus in addition to osteoarthritis?
Osteoarthritis is the most common joint disease, accounting for many physician visits.6 More than 26 million Americans over age 25 have some form of it, and the prevalence of symptomatic, radiographically confirmed osteoarthritis of the knee was 12.1% in the third National Health and Nutrition Examination Survey.7
We used to consider osteoarthritis a “wear-and-tear” disease—thus the term “degenerative joint disease.” But today, we know that it is an active response to injury, involving inflammatory and metabolic pathways.8 Moreover, the risk of osteoarthritis and its progression seems to be higher in those who have had meniscal injury and total or arthroscopic partial meniscectomy.9,10
MRI is not commonly used in managing knee osteoarthritis, but it has been used diagnostically in patients with symptoms of a meniscal tear, such as clicking, locking, popping, giving way, and pain with pivoting or twisting. Traumatic meniscal tears (a longitudinal or radial tear pattern) most often occur in active younger people and often lead to meniscal surgery.11,12 In contrast, degenerative meniscal tears (horizontal, oblique, or complex tear pattern or meniscal maceration) tend to occur in older people,11,12 but how to manage them is not widely agreed upon.
Of note, most patients with osteoarthritis of the knee have torn, macerated, or heavily damaged menisci.13,14 Meniscal lesions are also common in middle-aged people in the general population, with a higher prevalence in people who are older, heavier, or female, or who have a family history of osteoarthritis.15
These abnormalities are only weakly associated with symptoms.2 However, when a patient has knee symptoms and a torn meniscus is detected on MRI, the tear is often assumed to be the source of the symptoms, and meniscal tears are the most common reason for arthroscopy.16
Since we have no way to prevent the progression of joint damage from osteoarthritis with drugs or by any other means, the goal is to alleviate the symptoms. Many patients report pain relief or functional improvement after arthroscopic surgery. But arthroscopic lavage or debridement for osteoarthritis has not been found to be better than conservative treatment or placebo in randomized controlled trials.4,5
In contrast, the current standard treatment for a symptomatic degenerative meniscal tear is arthroscopic partial meniscectomy. Nearly 500,000 of these procedures are performed annually in the United States.16 But based on the best evidence, arthroscopic partial meniscectomy does not result in better pain relief and functional improvement than does physical therapy alone in patients who have a torn meniscus and knee osteoarthritis.17,18
OVERVIEW OF THE METEOR TRIAL
The METEOR trial was a randomized controlled trial conducted at seven US tertiary referral centers. Its aim was to compare the short-term (6-month) and long-term (12-month) efficacy of arthroscopic partial meniscectomy and physical therapy in patients with symptomatic meniscal tear and osteoarthritis of the knee.19 It was supported by the National Institute of Arthritis and Musculoskeletal and Skin Diseases.1
Patients were age 45 and older
METEOR patients had to be at least 45 years old and have symptomatic meniscal tears and knee osteoarthritis detected on MRI or radiography.1
Osteoarthritis was defined broadly, given that it begins well before the appearance of radiographic evidence such as an osteophyte or joint-space narrowing.19 Patients with cartilage defects on MRI were also enrolled, as were patients with radiographically documented osteoarthritis.19
Patients were considered to have a symptomatic meniscal tear if they had had at least 4 weeks of symptoms (such as episodic pain and pain that was acute and localized to one spot on the knee, as well as typical mechanical pain suggesting a meniscal tear, such as clicking, catching, popping, giving way, or pain with pivoting or twisting) in addition to evidence of a meniscal tear on MRI.19
Patients were excluded if they had a chronically locked knee (a clear-cut indication for arthroscopic partial meniscectomy), advanced osteoarthritis (Kellgren-Lawrence grade 4), inflammatory arthritis, clinically symptomatic chondrocalcinosis, or bilateral symptomatic meniscal tears.19 Patients who had undergone surgery or injection of a viscosupplement in the index knee during the past 4 weeks were also excluded.19
Of 1,330 eligible patients, 351 (26.4%) were enrolled and randomly assigned in a 1:1 ratio to a treatment group by means of a secure program on the trial website.1,19 Of those who were eligible but did not enroll, 195 (14.6%) were not referred and 784 (58.9%) declined to participate. Of those who declined, more preferred surgery than physical therapy (36.1% vs 21%). No information is available on any differences in baseline characteristics between the enrolled patients and the eligible patients who declined.
Randomization was done in blocks of varying size within each site, stratified according to sex and the extent of osteoarthritis on baseline radiography. The extent of osteoarthritis was categorized either as Kellgren-Lawrence grade 0 (normal, no features of osteoarthritis) to grade 2 (definite osteoarthritis, a definite osteophyte without joint-space narrowing) or as Kellgren-Lawrence grade 3 (moderate osteoarthritis, < 50% joint-space narrowing).1,19 The two treatment groups were similar with respect to age, sex, race or ethnicity, baseline Kellgren-Lawrence grade, and baseline Western Ontario and McMaster Universities Arthritis Index (WOMAC) physical function score.1
The mean age of the participants was 58, and 85% were white. Sixty-three percent had Kellgren-Lawrence grade 0 to 2 osteoarthritis, and 27% had grade 3.1
Surgery plus physical therapy vs physical therapy alone
The surgery group underwent arthroscopic partial meniscectomy, which involved trimming the damaged meniscus back to a stable rim1,19 and trimming loose fragments of cartilage and bone.
After the procedure, patients were scheduled for physical therapy. Although there is no consensus on the need for or the effectiveness of postoperative physical therapy in this setting, the investigators believed that including it in both study groups would help to isolate the independent effects of surgery. The physical therapy regimen after surgery was similar to that provided in the nonoperative group.1,19
Physical therapy was designed to address inflammation, range of motion, muscle strength, muscle-length restriction, functional mobility, and proprioception and balance.1,19 There were three stages; criteria for advancing from one phase to the next included the level of self-reported pain, observed strength, range of knee motion, knee effusion, and functional mobility.1,18
The duration of participation varied depending on the pace of improvement. Generally, the program lasted about 6 weeks.1,19
Crossover and other therapies were allowed
Crossover from physical therapy alone to surgery was allowed during the trial if the patient and surgeon thought it was clinically indicated.
Participants in both groups were permitted to take acetaminophen and nonsteroidal anti-inflammatory drugs as needed. Intra-articular injections of glucocorticoids were also allowed during the trial.
OUTCOMES MEASURED
WOMAC physical function score
The primary outcome of the METEOR trial was the difference between the study groups in the change in WOMAC physical function score from baseline to 6 months, at which point participants were expected to have achieved maximum improvement.1,19 Questionnaires were also administered at 3 months to assess the early response to surgery or physical therapy and again at 12 months.
The complete WOMAC also measures pain and stiffness in addition to physical function, with separate subscales for each. The change in WOMAC score is one of the most widely endorsed outcome measures in assessing interventions in osteoarthritis or other conditions of the lower extremities.20 The METEOR trial authors considered the WOMAC scale to be highly valid and reliable, with a Cronbach alpha value of 0.97 (maximum value = 1; the higher the better).
No ceiling or floor effects were observed in the WOMAC physical function score in patients with osteoarthritis and a meniscal tear in a pilot study for METEOR.19
In the main METEOR study, WOMAC physical function was scored on a scale of 0 to 100, with a higher score indicating worse physical function.1 Changes in the score were also measured as a yes-or-no question, defined a priori as whether the score declined by at least 8 points, which is considered the minimal clinically important difference in osteoarthritis patients.1,19
KOOS and MOS SF-36 scores
Secondary outcomes were measured in several domains, including pain, generic functional status, quality of life, and health care utilization.1,19
The KOOS (Knee Injury and OA Outcome Scale) is specific for knee pain, being designed to evaluate short-term and long-term symptoms and function in patients with knee injury and associated problems.21 It has five subscales, which are scored separately: pain, other symptoms, activities of daily living, sport and recreation, and knee-related quality of life.21 Since the WOMAC pain scale showed a ceiling effect in the pilot study in patients undergoing surgery, the authors chose the KOOS pain scale as a pain measure.19 Scores were transformed to a 0–100 scale, with a higher score indicating more pain.1
The MOS SF-36 (Medical Outcomes Study 36-item short form) was used to measure general health status and function.1,19
STATISTICAL ANALYSIS: INTENTION-TO-TREAT AND AS-TREATED
The study was powered to detect a 10-point difference in WOMAC physical function scores at 6 months of follow-up between the operative and nonoperative groups, anticipating losses to follow-up and crossover, with preplanned subgroup (Kellgren–Lawrence grade 0–2 vs grade 3) analysis.1,19
The primary analysis used a modified intention-to-treat approach and was implemented with an analysis of covariance with changes in the WOMAC score from baseline to 6 months as the dependent variable, treatment as the independent variable of interest, and study site as a covariate. Other covariates, such as age, sex, and baseline Kellgren-Lawrence grade, were balanced across groups and were therefore not included in the analysis.1,19
Secondary analyses used an “as-treated” approach, ie, according to the treatment actually received.1,19 Secondary intention-to-treat analysis—using binary outcome measures in which treatment failure was defined as improvement in the WOMAC score of less than 8 points or crossing over to the other treatment—was also performed to estimate efficacy at the level of the patient rather than at the group level.1,19
BOTH GROUPS IMPROVED
In the intention-to-treat analyses at 6 months and 12 months after randomization, both groups improved, with no clinically important or statistically significant differences between the groups in functional status (WOMAC score, MOS SF-36 score) or pain (KOOS score).1 The mean improvement (decline) in the WOMAC score from baseline to 6 months was 20.9 points in the surgery group vs 18.5 points in the physical therapy group, a difference of 2.4 points (95% confidence interval [CI], −1.8 to 6.5).1
35% of physical therapy patients underwent surgery by 12 months
Of the 177 patients randomized to physical therapy alone, by 6 months 1 had died, 1 had undergone total knee replacement, 4 had withdrawn, and 2 were lost to follow-up. Of the 169 remaining, 51 (30%) had undergone arthroscopic partial meniscectomy. An additional 8 patients who were assigned to physical therapy crossed over to surgery between 6 and 12 months.1,19
Of the 174 patients randomized to surgery, by 6 months 1 had died, 3 had undergone total knee replacement, 7 had withdrawn, and 2 were ineligible. Of the 161 remaining, 9 (6%) had not undergone the procedure.
Other outcomes
Subgroup analysis based on the baseline radiographic grade (Kellgren-Lawrence grade 0 to 2 vs grade 3) did not show a difference between groups in functional improvement at 6 months (P = .13 for interaction).1
No statistically significant difference was noted in rates of overall or specific adverse events between the two groups over the first 12 months.1 Adverse events rated as mild or moderate in severity occurred in 15 participants in the surgery group and 13 participants in the physical therapy group.1 Long-term risks associated with these interventions are being assessed, and longitudinal assessment of imaging studies is planned to address this question but is not yet available.1,18
In the physical therapy group, 21 patients (12%) received intra-articular glucocorticoid injections, as did 9 patients (6%) in the surgery group.1,19
TRANSLATING THE METEOR RESULTS TO EVERYDAY PRACTICE
There are many challenges in designing surgical trials. Indeed, by one estimate,22 only about 40% of treatment questions involving surgical procedures can be evaluated by a randomized controlled trial.
Although the METEOR trial was not blinded, it was the first large, multicenter, randomized controlled trial to compare arthroscopic partial meniscectomy vs standardized physical therapy by using high-quality methodology such as careful sample-size calculation, balancing the groups according to known prognostic factors with block randomization, and intention-to-treat analysis. Moreover, the outcome measures were obtained from validated self-reporting questionnaires (WOMAC for function and KOOS for pain), reducing the possibility of observer bias.19 In addition, analyses were performed with the analysts blinded to the randomization assignment.
Limitations of the trial
A few limitations of the study are worth noting.
Patients age 45 or older with both symptomatic meniscal tear and osteoarthritis were the target population of this study. However, it is important to distinguish between the study population and the target population in a physician’s practice.
The investigators adopted broad definitions of osteoarthritis and symptoms of meniscal tear. Twenty-one percent of participants had normal findings on plain radiography, with cartilage defects visible only on MRI. Further, episodic pain or acute pain localized to a joint line was regarded as a symptom consistent with a torn meniscus.
In practice, arthroscopic partial meniscectomy is usually considered when a patient with a long history of tolerable osteoarthritis presents with a sudden onset of intolerable pain after a squatting or twisting injury.
In addition, the study population was predominantly white (85%), and the study was performed in tertiary referral academic medical centers. Therefore, the outcomes achieved with surgery or physical therapy may not translate to the community setting. Clinicians must be careful to account for these types of differences in extrapolating to patients in their own practice.
Potential enrollment bias
Although randomization is a rigorous method that eliminates selection bias in assigning individuals to study and control groups, selective enrollment could have created bias.1 As the authors mentioned, only 26% of eligible patients were enrolled, possibly reflecting patients’ or surgeons’ strong preferences for one treatment or the other. Because the study and control groups were hardly random samples of eligible populations, we must be careful in generalizing the efficacy of physical therapy.1
Crossover may have obscured the benefit of surgery
During the first 6 months, 30% of patients crossed over from physical therapy to surgery. High crossover rates in surgical trials are common, especially when comparing surgery with medical therapy.23 Given that most of the patients assigned to only physical therapy who crossed over to surgery did not have substantial improvement in functional status, it seems that crossover occurred by nonrandom factors, potentially biasing the study results. With the high degree of crossover from the nonoperative group to the surgical group, intention-to-treat analysis may have given an inflated estimate of the effect of physical therapy.
To account for crossovers, researchers defined a binary outcome a priori: patients were considered to have had a successful treatment response if they improved by at least 8 points on the WOMAC scale (a clinically important difference) and did not cross over from their assigned treatment. At 6 months, 67.1% of patients assigned to surgery showed a successful treatment response, compared with 43.8% of patients assigned to physical therapy alone (P = .001).1
In patients who crossed over, the last scores before crossover were carried over, and primary analysis of the WOMAC score at 6 months was repeated to estimate the effect of crossovers from the nonoperative to the surgery group. This exploratory analysis showed a 13.0-point improvement in WOMAC score at 6 months with physical therapy alone vs a 20.9-point improvement with surgery, suggesting that the similarity in outcomes between the two groups may be explained in part by additional improvements from surgery for those who crossed over from physical therapy alone.1
Implications for functional improvement
Lacking a comparison group that underwent a sham surgical procedure, one cannot conclude that surgery after crossover improved functional status in those patients. However, there was no significant difference in WOMAC physical function scores at 12 months between the 30% of patients in the physical therapy group who crossed over and underwent surgery during the first 6 months and patients initially assigned to surgery. This finding suggests that physical therapy can be recommended as a first-line therapy, although we must be cautious, given that the physical therapy group required more background therapy (eg, intra-articular glucocorticoid injections), and that this study was not powered to detect such differences at 12 months.
Also, a patient may need to get better quickly, to get back to work, for example. Although the data were not definitive, at 3 months the patients in the surgery group seemed to have better pain control and function than those in the physical therapy group. A cost-benefit analysis of physical therapy compared with surgery for short-term outcomes may be helpful before generalizing these findings.
SURGERY VS SHAM PROCEDURE: THE FIDELITY GROUP RESULTS
In a later publication from the Finnish Degenerative Meniscal Lesion Study (FIDELITY) Group,24 146 patients with symptoms consistent with degenerative meniscal tear but no knee osteoarthritis were randomized to undergo arthroscopic partial meniscectomy or a sham procedure. At 12 months, no differences were noted between the groups in terms of change of symptoms from baseline to 12 months.
The authors concluded that the outcomes with meniscectomy were no better than with a sham procedure.24
SURGERY FIRST, OR PHYSICAL THERAPY FIRST?
The use of knee arthroscopy has increased sharply in middle-aged patients in recent years. Indeed, this demographic group accounts for nearly half of the knee arthroscopic procedures performed for meniscal tears, although the increase may be due in part to issues with surgeons’ coding and insurance authorization.16
The METEOR trial showed that a structured physical therapy program can be as effective as surgery as a first-line therapy in many patients with symptomatic meniscal tears and mild to moderate osteoarthritis. These results should inform clinical practice in that most such patients need not be immediately referred for surgical intervention.
However, a subset of these patients may benefit from surgery rather than nonoperative therapy. Given the potential risks and public health implications of arthroscopic surgery for meniscal tears, further study is needed to better characterize these patients. A randomized sham-controlled trial is under way25 with the goal of assessing the efficacy of arthroscopic partial meniscectomy for medial meniscus tears in patients with or without knee osteoarthritis, and it is hoped this study will shed further light on this issue.
Based on the results of the METEOR trial, the physical therapy regimen that was used may be reasonable before referring patients with knee osteoarthritis and symptomatic meniscal tears for surgery.
- Katz JN, Brophy RH, Chaisson CE, et al. Surgery versus physical therapy for a meniscal tear and osteoarthritis. N Engl J Med 2013; 368:1675–1684.
- Englund M, Guermazi A, Gale D, et al. Incidental meniscal findings on knee MRI in middle-aged and elderly persons. N Engl J Med 2008; 359:1108–115.
- Englund M, Guermazi A, Lohmander SL. The role of the meniscus in knee osteoarthritis: a cause or consequence? Radiol Clin North Am 2009; 47:703–712.
- Moseley JB, O’Malley K, Petersen NJ, et al. A controlled trial of arthroscopic surgery for osteoarthritis of the knee. N Engl J Med 2002; 347:81–68.
- Kirkley A, Birmingham TB, Litchfield RB, et al. A randomized trial of arthroscopic surgery for osteoarthritis of the knee. N Engl J Med 2008; 359:1097–1107.
- Quintana JM, Escobar A, Arostegui I, et al. Prevalence of symptoms of knee or hip joints in older adults from the general population. Aging Clin Exp Res 2008; 20:329–336.
- Lawrence RC, Felson DT, Helmick CG, et al; National Arthritis Data Workgroup. Estimates of the prevalence of arthritis and other rheumatic conditions in the United States. Part II. Arthritis Rheum 2008; 58:26–35.
- Loeser RF, Goldring SR, Scanzello CR, Goldring MB. Osteoarthritis: a disease of the joint as an organ. Arthritis Rheum 2012; 64:1697–1707.
- Englund M, Lohmander LS. Risk factors for symptomatic knee osteoarthritis fifteen to twenty-two years after meniscectomy. Arthritis Rheum 2004; 50:2811–2819.
- Papalia R, Del Buono A, Osti L, Denaro V, Maffulli N. Meniscectomy as a risk factor for knee osteoarthritis: a systematic review. Br Med Bull 2011; 99:89–106.
- Englund M, Guermazi A, Roemer FW, et al. Meniscal tear in knees without surgery and the development of radiographic osteoarthritis among middle-aged and elderly persons: The Multicenter Osteoarthritis Study. Arthritis Rheum 2009; 60:831–839.
- Poehling GG, Ruch DS, Chabon SJ. The landscape of meniscal injuries. Clin Sports Med 1990; 9:539–549.
- Bhattacharyya T, Gale D, Dewire P, et al. The clinical importance of meniscal tears demonstrated by magnetic resonance imaging in osteoarthritis of the knee. J Bone Joint Surg Am 2003; 85-A:4–9.
- Sowers M, Karvonen-Gutierrez CA, Jacobson JA, Jiang Y, Yosef M. Associations of anatomical measures from MRI with radiographically defined knee osteoarthritis score, pain, and physical functioning. J Bone Joint Surg Am 2011; 93:241–251.
- Ding C, Martel-Pelletier J, Pelletier JP, et al. Meniscal tear as an osteoarthritis risk factor in a largely non-osteoarthritic cohort: a cross-sectional study. J Rheumatol 2007; 34:776–784.
- Kim S, Bosque J, Meehan JP, Jamali A, Marder R. Increase in outpatient knee arthroscopy in the United States: a comparison of National Surveys of Ambulatory Surgery, 1996 and 2006. J Bone Joint Surg Am 2011; 93:994–1000.
- Herrlin S, Hållander M, Wange P, Weidenhielm L, Werner S. Arthroscopic or conservative treatment of degenerative medial meniscal tears: a prospective randomised trial. Knee Surg Sports Traumatol Arthrosc 2007; 15:393–401.
- Herrlin SV, Wange PO, Lapidus G, Hållander M, Werner S, Weidenhielm L. Is arthroscopic surgery beneficial in treating non-traumatic, degenerative medial meniscal tears? A five year follow-up. Knee Surg Sports Traumatol Arthrosc 2013; 21:358–364.
- Katz JN, Chaisson CE, Cole B, et al. The MeTeOR trial (Meniscal Tear in Osteoarthritis Research): rationale and design features. Contemp Clin Trials 2012; 33:1189–1196.
- Bellamy N, Buchanan WW, Goldsmith CH, Campbell J, Stitt LW. Validation study of WOMAC: a health status instrument for measuring clinically important patient relevant outcomes to antirheumatic drug therapy in patients with osteoarthritis of the hip or knee. J Rheumatol 1988; 15:1833–1840.
- Roos EM, Lohmander LS. The Knee injury and Osteoarthritis Outcome Score (KOOS): from joint injury to osteoarthritis. Health Qual Life Outcomes 2003; 1:64.
- Solomon MJ, McLeod RS. Should we be performing more randomized controlled trials evaluating surgical operations? Surgery 1995; 118:459–467.
- Farrokhyar F, Karanicolas PJ, Thoma A, et al. Randomized controlled trials of surgical interventions. Ann Surg 2010; 251:409–416.
- Sihvonen R, Paavola M, Malmivaara A. Arthroscopic partial meniscectomy versus sham surgery for a degenerative meniscal tear. N Engl J Med 2013; 369:2515–2524.
- Hare KB, Lohmander LS, Christensen R, Roos EM. Arthroscopic partial meniscectomy in middle-aged patients with mild or no knee osteoarthritis: a protocol for a double-blind, randomized sham-controlled multicentre trial. BMC Musculoskelet Disord 2013; 14:71.
KEY POINTS
- METEOR trial was a randomized controlled trial comparing the short-term and long-term efficacy of arthroscopic partial meniscectomy vs physical therapy in patients with a symptomatic meniscal tear and knee osteoarthritis.
- Both treatment groups in the METEOR trial received physical therapy in order to determine the incremental benefit of surgery and physical therapy compared with physical therapy alone.
- The trial investigators used specific definitions of osteoarthritis and symptoms of meniscal tear.
- Meniscectomy is often performed for patients with symptoms consistent with a meniscal tear and evidence of a meniscal tear on magnetic resonance imaging, but the benefits of this procedure are unclear.
An intravenous drug user with persistent dyspnea and lung infiltrates
A 58-year-old-man with a history of intravenous drug abuse, chronic hepatitis C, and anxiety presented to our emergency department twice in 4 weeks with progressive dyspnea and night sweats. He was a nonsmoker and had been an electrician for 15 years.
The first time he came in, chest radiography revealed bilateral reticulonodular infiltrates in the lung bases. He was treated with intravenous ceftriaxone (Rocephin) and azithromycin (Zithromax) for presumed community-acquired pneumonia and was then sent home on a 10-day course of oral amoxicillin-clavulanate (Augmentin). The antibiotics did not improve his symptoms, and 3 weeks later he presented again to the emergency department.
On his second presentation, he was in respiratory distress (oxygen saturation 78% on room air) and was afebrile and tachypneic. Physical examination revealed numerous injection marks or “tracks” on the skin of both arms, and auscultation revealed diminished intensity of breath sounds in both lung bases.
Repeat chest radiography demonstrated that the infiltrates were still there. Computed tomography was ordered and showed mild centrilobular emphysematous changes in both lungs, bibasilar opacifications, and a mass-like lesion (3.3 × 1.9 cm) in the right lower lobe (Figure 1).
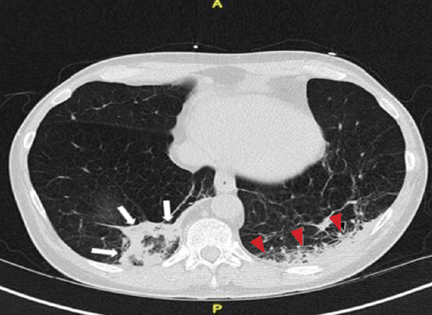
He subsequently underwent bronchoscopy, which showed no endobronchial abnormalities. Transbronchial lung biopsy was performed, and histopathologic analysis of the specimen (Figure 2) revealed rodlike, birefringent crystals under polarized light, with an extensive foreign-body giant-cell reaction outside pulmonary capillaries, suggestive of intravascular pulmonary talcosis. Blood and sputum cultures were negative for pathologic organisms. Bronchoalveolar lavage samples were negative for pathologic organisms and malignant cells.
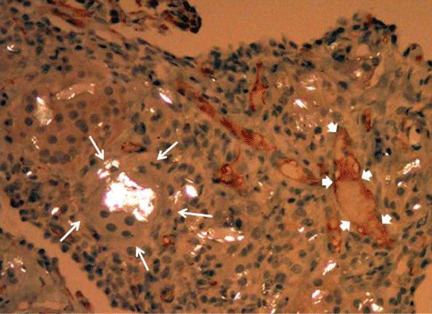
On further questioning, the patient revealed that he intravenously injected various drugs intended for oral use, such as crushed meperidine (Demerol), methylphenidate (Ritalin), and methadone tablets.
Pulmonary function tests indicated a severe obstructive pattern. The predicted forced expiratory volume in the first second of expiration (FEV1) was 25%, and the ratio of FEV1 to forced vital capacity was 27%.
Transthoracic echocardiography revealed mild pulmonary hypertension with a right ventricular systolic pressure of 28 mm Hg at rest.
Based on the results of the histologic examination, a diagnosis of intravascular pulmonary talcosis was made. Antibiotics were discontinued, and treatment with albuterol and ipratropium bromide (Combivent) inhalers was started. The patient remained oxygen-dependent at the time of hospital discharge.
INTRAVASCULAR PULMONARY TALCOSIS
Intravascular pulmonary talcosis is seen predominantly in those who chronically inject intravenous drugs intended for oral use.1,2
Many oral medications contain talc as a filler and lubricant to prevent the tablet from sticking to equipment during the manufacturing process. When oral medications containing talc are crushed, dissolved in water, and injected intravenously, the talc crystals and other particles lodge in the pulmonary vascular bed, resulting in microscopic pulmonary embolizations.
Over time, these particles migrate to the pulmonary interstitium and incite a foreign-body granulomatous reaction, which may be associated with progressive pulmonary fibrosis. The severity of this immune reaction and fibrosis may vary; hence, some patients remain asymptomatic, whereas some present with dyspnea from extensive fibrosis and pulmonary hypertension.
Persistent dyspnea along with persistent infiltrates on chest imaging in an intravenous drug abuser should prompt suspicion for intravascular pulmonary talcosis as well as consideration of other diagnoses, such as pneumonia, malignancy, and septic pulmonary emboli.
There is no established treatment for intravascular pulmonary talcosis; treatment is often supportive. A few studies and case reports have indicated varied success with systemic and inhaled corticosteroids.3–5 In extreme cases, lung transplantation may be necessary; however, this would require a comprehensive psychiatric assessment to minimize the risk of addiction relapse after transplantation.
- Arnett EN, Battle WE, Russo JV, Roberts WC. Intravenous injection of talc-containing drugs intended for oral use. A cause of pulmonary granulomatosis and pulmonary hypertension. Am J Med 1976; 60:711–718.
- Griffith CC, Raval JS, Nichols L. Intravascular talcosis due to intravenous drug use is an underrecognized cause of pulmonary hypertension. Pulm Med 2012; 2012:617531.
- Chau CH, Yew WW, Lee J. Inhaled budesonide in the treatment of talc-induced pulmonary granulomatosis. Respiration 2003; 70:439.
- Gysbrechts C, Michiels E, Verbeken E, et al. Interstitial lung disease more than 40 years after a 5 year occupational exposure to talc. Eur Respir J 1998; 11:1412–1415.
- Marchiori E, Lourenço S, Gasparetto TD, Zanetti G, Mano CM, Nobre LF. Pulmonary talcosis: imaging findings. Lung 2010; 188:165–171.
A 58-year-old-man with a history of intravenous drug abuse, chronic hepatitis C, and anxiety presented to our emergency department twice in 4 weeks with progressive dyspnea and night sweats. He was a nonsmoker and had been an electrician for 15 years.
The first time he came in, chest radiography revealed bilateral reticulonodular infiltrates in the lung bases. He was treated with intravenous ceftriaxone (Rocephin) and azithromycin (Zithromax) for presumed community-acquired pneumonia and was then sent home on a 10-day course of oral amoxicillin-clavulanate (Augmentin). The antibiotics did not improve his symptoms, and 3 weeks later he presented again to the emergency department.
On his second presentation, he was in respiratory distress (oxygen saturation 78% on room air) and was afebrile and tachypneic. Physical examination revealed numerous injection marks or “tracks” on the skin of both arms, and auscultation revealed diminished intensity of breath sounds in both lung bases.
Repeat chest radiography demonstrated that the infiltrates were still there. Computed tomography was ordered and showed mild centrilobular emphysematous changes in both lungs, bibasilar opacifications, and a mass-like lesion (3.3 × 1.9 cm) in the right lower lobe (Figure 1).
He subsequently underwent bronchoscopy, which showed no endobronchial abnormalities. Transbronchial lung biopsy was performed, and histopathologic analysis of the specimen (Figure 2) revealed rodlike, birefringent crystals under polarized light, with an extensive foreign-body giant-cell reaction outside pulmonary capillaries, suggestive of intravascular pulmonary talcosis. Blood and sputum cultures were negative for pathologic organisms. Bronchoalveolar lavage samples were negative for pathologic organisms and malignant cells.
On further questioning, the patient revealed that he intravenously injected various drugs intended for oral use, such as crushed meperidine (Demerol), methylphenidate (Ritalin), and methadone tablets.
Pulmonary function tests indicated a severe obstructive pattern. The predicted forced expiratory volume in the first second of expiration (FEV1) was 25%, and the ratio of FEV1 to forced vital capacity was 27%.
Transthoracic echocardiography revealed mild pulmonary hypertension with a right ventricular systolic pressure of 28 mm Hg at rest.
Based on the results of the histologic examination, a diagnosis of intravascular pulmonary talcosis was made. Antibiotics were discontinued, and treatment with albuterol and ipratropium bromide (Combivent) inhalers was started. The patient remained oxygen-dependent at the time of hospital discharge.
INTRAVASCULAR PULMONARY TALCOSIS
Intravascular pulmonary talcosis is seen predominantly in those who chronically inject intravenous drugs intended for oral use.1,2
Many oral medications contain talc as a filler and lubricant to prevent the tablet from sticking to equipment during the manufacturing process. When oral medications containing talc are crushed, dissolved in water, and injected intravenously, the talc crystals and other particles lodge in the pulmonary vascular bed, resulting in microscopic pulmonary embolizations.
Over time, these particles migrate to the pulmonary interstitium and incite a foreign-body granulomatous reaction, which may be associated with progressive pulmonary fibrosis. The severity of this immune reaction and fibrosis may vary; hence, some patients remain asymptomatic, whereas some present with dyspnea from extensive fibrosis and pulmonary hypertension.
Persistent dyspnea along with persistent infiltrates on chest imaging in an intravenous drug abuser should prompt suspicion for intravascular pulmonary talcosis as well as consideration of other diagnoses, such as pneumonia, malignancy, and septic pulmonary emboli.
There is no established treatment for intravascular pulmonary talcosis; treatment is often supportive. A few studies and case reports have indicated varied success with systemic and inhaled corticosteroids.3–5 In extreme cases, lung transplantation may be necessary; however, this would require a comprehensive psychiatric assessment to minimize the risk of addiction relapse after transplantation.
- Arnett EN, Battle WE, Russo JV, Roberts WC. Intravenous injection of talc-containing drugs intended for oral use. A cause of pulmonary granulomatosis and pulmonary hypertension. Am J Med 1976; 60:711–718.
- Griffith CC, Raval JS, Nichols L. Intravascular talcosis due to intravenous drug use is an underrecognized cause of pulmonary hypertension. Pulm Med 2012; 2012:617531.
- Chau CH, Yew WW, Lee J. Inhaled budesonide in the treatment of talc-induced pulmonary granulomatosis. Respiration 2003; 70:439.
- Gysbrechts C, Michiels E, Verbeken E, et al. Interstitial lung disease more than 40 years after a 5 year occupational exposure to talc. Eur Respir J 1998; 11:1412–1415.
- Marchiori E, Lourenço S, Gasparetto TD, Zanetti G, Mano CM, Nobre LF. Pulmonary talcosis: imaging findings. Lung 2010; 188:165–171.
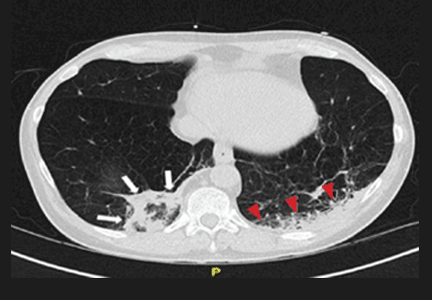
Acute and critical limb ischemia: When time is limb
In many ways, vascular disease in the leg is similar to that in the heart. The risk factors, underlying conditions, and pathogenetic processes are the same, and in many cases, patients have both conditions. And just as cardiologists and emergency physicians have learned that in acute myocardial infarction “time is muscle,” we are coming to appreciate that in many cases of limb ischemia, “time is limb.”
Most physicians well understand the clinical spectrum of coronary artery disease, which ranges from stable angina to ST-elevation myocardial infarction. In the leg, the same situation exists: at the more benign end of the spectrum, patients experience no symptoms, but often that is because they lead a sedentary lifestyle, modifying their activity level to avoid pain. As the disease worsens, they can develop claudication and critical leg ischemia, comparable to non-ST-elevation myocardial infarction. The most severe condition is acute limb ischemia, analagous to ST-elevation myocardial infarction.
Distinguishing acute from critical limb ischemia is essential in patients who present with leg problems, whether it be leg pain or ulcers. The farther along the clinical spectrum the patient’s condition is, the more important it is to be aggressive in diagnosis and treatment. The history and physical examination are the most important first steps, focusing on the onset of symptoms, history, risk factors, and past interventions.
Peripheral artery disease is increasingly becoming a worldwide problem that is now being emphasized by the World Health Organization. Unfortunately, not enough attention is paid to the problem, not only in less-developed countries but also in the United States. Patients with peripheral artery disease tend to be elderly, in the lowest economic classes, and uninsured, and they often do not understand the impact of the disease on their health.
LEG ULCERS: CAUSES AND COSTS
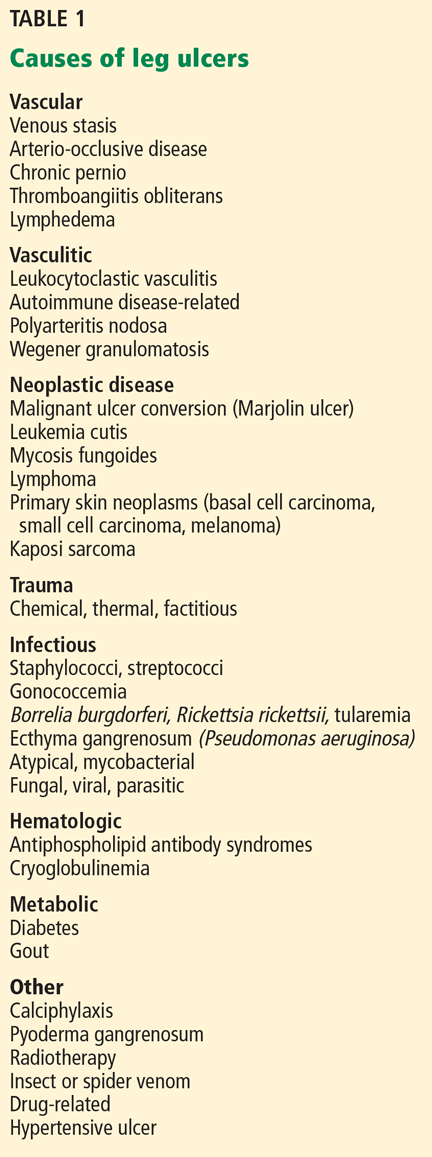
Finding the underlying cause of leg ulcers is important, and the differential diagnosis is large (Table 1). However, knowing the cause does not necessarily lead to healing; it is still essential to assess perfusion, infection, and wound care, and to arrest edema.
Causes of leg and foot ulcers include venous insufficiency (with an estimated 2.5 million cases annually),1,2 diabetes (nearly 1 million cases),3 and pressure (ie, bedsores, occurring in up to 28% of patients in extended care),4 all at a cost in the billions of dollars.5–7
In general, peripheral artery disease itself does not cause ulcers; it is an inciting factor. It is important to find what started the process. Ill-fitting shoes, poor sensation because of diabetes, or a cut when trimming toenails can all contribute to a wound, and peripheral artery disease makes it unable to heal. The healing process requires more nutrients and oxygen than poor circulation can provide.
ACUTE LIMB ISCHEMIA
Acute limb ischemia is defined as any sudden decrease in limb perfusion causing a potential threat to limb viability.8 Although it comes on suddenly, it does not imply that the patient has not had long-standing peripheral artery disease. It is important to determine what suddenly changed to cause the onset of symptoms.
History and physical examination: The six Ps
A good history includes a thorough evaluation of the present illness, including the pain’s time of onset, abruptness, location, intensity, and change over time, and whether it is present at rest. The medical history should focus on claudication, diabetes, smoking, heart disease, palpitations, atrial fibrillation, and previous ischemic symptoms.8
The physical examination should focus on the “six Ps”:
- Pain
- Pulselessness
- Paresthesia (numbness occurs in about half of patients)
- Pallor (obstruction is typically one joint above the level of demarcation of pallor)
- Paralysis (a bad sign, particularly if the calf is tight)
- Poikilothermia (inability to regulate temperature).
A good pulse examination includes measuring the ankle-brachial index and a Doppler examination of both legs. A neurologic examination focusing on sensory and motor function is critical for determining the level of ischemia and the urgency of intervention.
Classification of acute limb ischemia
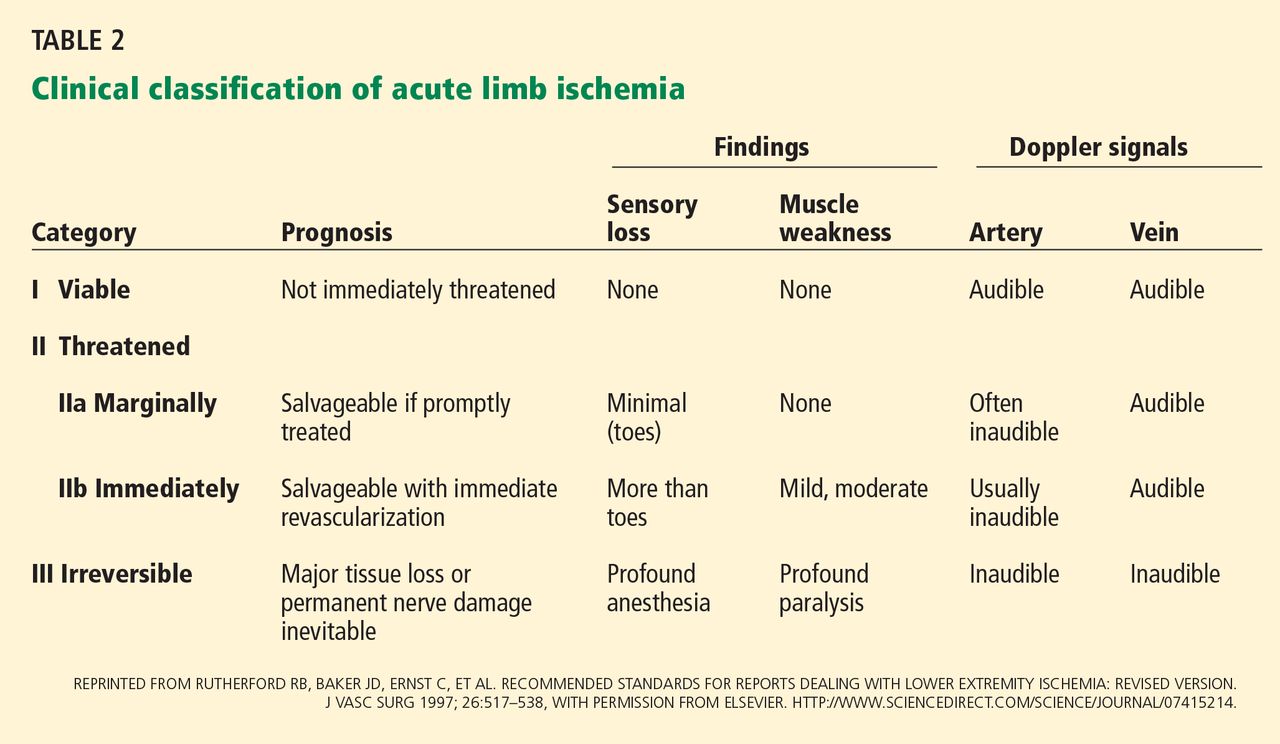
If it is determined that a patient has acute leg ischemia, it is important to categorize the condition using the classification system devised by the Society of Vascular Surgery and International Society of Cardiovascular Surgery (Table 2).9 The category establishes the type and urgency of treatment. This classification system is simple and depends on factors that can be assessed easily by nonspecialists:
- Pulses—arterial and venous pulses assessed by Doppler ultrasonography
- Sensation—the patient closes the eyes and answers if he or she can feel the examiner’s touch
- Motor function—can the patient move his or her toes?
Venous pulses can be difficult to assess. However, if the arterial pulse is present, the venous pulse should be next to it. Knowing the other criteria can determine the category, so not being certain of the venous pulse should not deter a clinician from assessing the other factors.
Category I is “viable.” Patients have intact sensory and motor functions and audible pulses. Patients in this category should be admitted and possibly started on anticoagulation therapy and referred to a vascular specialist within hours.
Category IIa is “threatened.” Sensation is starting to be lost but motor function is still present. These patients are considered to have reversible ischemia, analogous to myocardial infarction of the leg, and they require immediate attention.
Category IIb is similar and it also requires immediate attention.
Category III is usually irreversible, with loss of motor function and sensation.
CAUSES OF ACUTE LIMB ISCHEMIA
Thrombosis accounts for about 50% of cases. Underlying causes of the thrombosis are artherosclerosis (native or bypass), aneurysm, trauma, vasculitis (eg, in a rheumatologic disease such as lupus), and hypercoagulable states (particularly in patients with cancer).
Embolism accounts for about 30% of cases. Emboli usually arise from plaque rupture in atherosclerotic arteries or a clot breaking off from an aneurysm or from within the heart in patients with atrial fibrillation or another underlying heart disease. Paradoxical embolism, caused by an embolism crossing the heart through an opening such as a patent foramen ovale, is rare.
Uncommon causes include arterial dissection following trauma, adventitial cystic disease, popliteal artery entrapment, ergotism (from consuming fungus-contaminated grains), and human immunodeficiency virus arteriopathy.
The physical examination provides clues to the origin: livedo reticularis (purple discoloration in a mottled pattern) and blue nail beds indicate that an embolus is likely. Tests, including electrocardiography, echocardiography, and computed tomography of the chest and abdomen to look for an aneurysm, can help identify the cause. Ultrasonography of the popliteal arteries should also be considered to search for an aneurysm.
CRITICAL LIMB ISCHEMIA
Critical limb ischemia is more likely than acute limb ischemia to be seen in a general practice. Many aspects need to be addressed simultaneously, by different specialists: vascular and endocrine systems, infection, and wound care. The most successful management strategy is a dynamic approach using every piece of information.10
The Rutherford classification of peripheral artery disease has six categories based on the clinical presentation, with categories I through III being mild to severe claudication. We discuss here only the more severe categories: IV (pain at rest), V (tissue loss), and VI (gangrene).
Strong indicators of pain at rest are that the patient has to get up at night to dangle the leg over the bed or walk a few steps, or sleeps in a chair, or refuses to elevate the leg because of pain. The affected leg tends to appear red when the patient is standing (dependent rubor), but pale when the foot is elevated (elevation pallor).
Confirming that a patient has dependent rubor can be challenging, especially in people with dark skin. Classically, redness is seen when the leg is down and disappears with elevation, but in cellulitis, redness can also be reduced by elevating the leg. A foot that is hot to the touch is an indication of infection and not lack of perfusion alone.
The hemodynamic definition of critical limb ischemia is11:
- Ankle-brachial pressure index less than 0.4
- Reduced toebrachial pressure index, ie, less than 0.7
- Reduced transcutaneous pressure of oxygen (Tcpo2), ie, less than 40 mm Hg.
From 15% to 20% of patients with claudication will progress to critical ischemia over their lifetime, and in patients with claudication who also have diabetes, the risk is nearly 10 times higher. Without revascularization, the risk of amputation within 1 year is 73% for patients in Rutherford class IV and 95% for patients in class V or VI.
Revascularization and limb preservation
Preserving the limb is a prime goal. For patients who have an amputation, the mortality rate is 40% within 2 years.8 These patients tend to be elderly, and after an amputation, most will not learn to use a prosthesis and resume their previous level of activity. Other treatment objectives are to relieve pain, reduce cardiovascular risk, and minimize procedural complications.
Although limb preservation is not a controversial goal, best practices to preserve limbs are not universally available. Goodney et al12 studied variation in the United States in the use of lower-extremity vascular procedures for critical limb ischemia. They defined “low-intensity” to “high-intensity” regions of the country depending on the proportion of patients who underwent a vascular procedure in the year before amputation. They found considerable variation, but even in the region of highest intensity, more than 40% of patients did not have a vascular procedure in the year before amputation.
Similarly, Jones et al13 mapped amputation rates by US state and found significant variation even after adjusting for risk factors such as tobacco use and obesity.
Controversy surrounds the specifics of revascularization treatment, as in many fields in vascular medicine. However, most experts agree that improved perfusion is the goal.
The Trans-Atlantic Inter-Society Consensus for the Management of Peripheral Artery Disease recommends revascularization as the best treatment for patients with critical limb ischemia.8 In addition, the American College of Cardiology and American Heart Association Guidelines for the Management of Patients With Peripheral Arterial Disease (Lower Extremity, Renal, Mesenteric, and Abdominal Aortic) state that the tibial or pedal artery that is capable of providing continuous and uncompromised outflow to the foot should be used as the site of distal anastomosis.14 These guidelines do not yet mention endovascular therapy.
Angiosomes guide revascularization
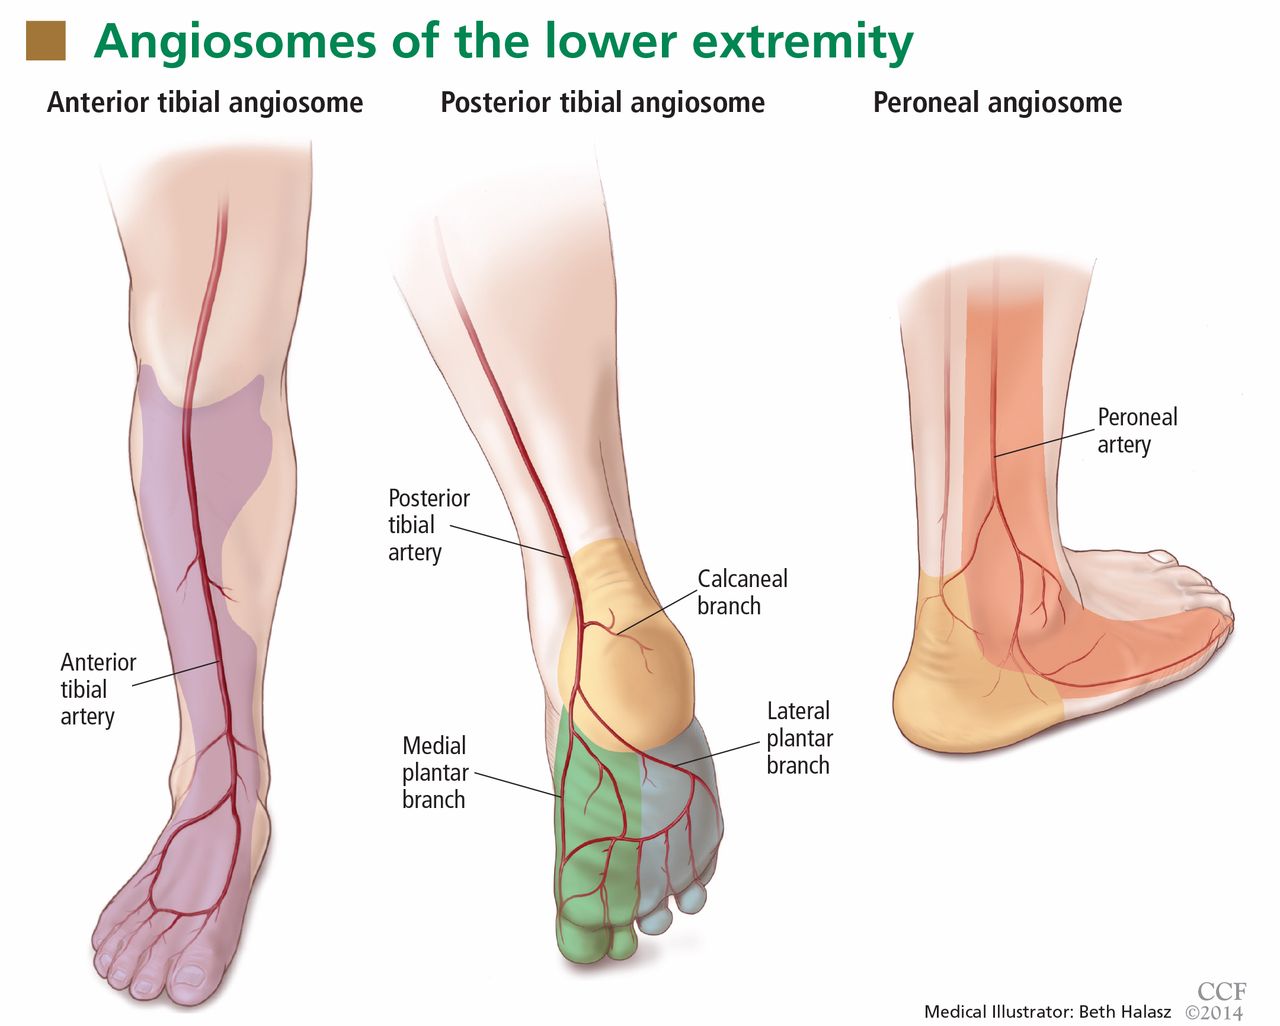
In the past few years, the ability to facilitate healing of foot ulcers has improved. Angiosomes—regions of vascularization supplied by specific arteries—can be mapped on the skin, similar to the way dermatomes are mapped for neural innervation (Figure 1). The foot and lower leg region has six angiosomes perfused by three arteries that branch off the popliteal artery after it passes behind the knee:
- The anterior tibial artery supplies the dorsum of the foot and the front of the lower limb.
- The posterior tibial artery supplies the plantar surface of the foot via three branches—the medial plantar, lateral plantar, and calcaneal branches.
- The peroneal artery supplies the lateral part of the foot with collaterals to the anterior and posterior tibial arteries if they are compromised.
Studies have compared angiosome-based treatment vs revascularizing the best available artery (thus depending on collateral flow to compensate to surrounding areas). They have found that regardless of whether an endovascular or bypass method of revascularization was used, an angiosome-based approach led to significantly higher amputation-free survival rates.15–17
Patients typically do not have blockage of only a single tibial artery. Graziani et al18 assessed the vascular lesions in 417 patients with critical limb ischemia and found that multiple below-knee arteries were frequently involved. This makes it difficult to decide where to target revascularization efforts, and the angiosome concept helps with that.
ASSESSING WOUND PERFUSION
Ankle- and toe-brachial indices assess perfusion
The ankle-brachial index19 is a good superficial assessment of perfusion. Multiple epidemiologic studies have shown the prognostic value of the ankle brachial index beyond the traditional risk factors and even the Framingham risk score.19 Values:
- Normal 1.1–1.30 (> 1.31 is abnormal and consistent with calcified vessels, and is an unreliable measure)
- Low normal 0.91–1.00
- Mild disease 0.71–0.90
- Moderate disease 0.41–0.70
- Severe disease ≤ 0.40.
However, the ankle-brachial index assesses perfusion only to the ankle, and many patients have ulcers in the toes and distal foot. The toe-brachial index must be specifically ordered in most institutions (if the first toe has an ulcer, the second toe should be assessed). The toe-brachial index is also important if the ankle-brachial index cannot be obtained because of calcified, noncompressible arteries in the ankle. A normal toe-brachial index is greater than 0.7.
The segmental blood pressure examination compares blood pressure measurements at multiple sites in the lower extremity. A drop of more than 20 mm Hg between segments indicates obstruction at that location. The test is simple and noninvasive and often can replace computed tomography.20
Transcutaneous oximetry
Transcutaneous oximetry measures the Tcpo2 from 1 to 2 mm deep in the skin from local capillaries. Measured adjacent to an ulcer, it is useful to predict wound healing and to assess the response to hyperbaric oxygen therapy.21 The values are:
- Normal > 70 mm Hg
- Impaired wound healing < 40 mm Hg
- Critical limb ischemia < 30 mm Hg.
Although most agree that a Tcpo2 below 40 mm Hg requires revascularization, low values can arise from many causes other than peripheral artery disease, including high altitude, pulmonary disease, heart failure, edema, inflammation, callus, and skin diseases such as scleroderma.
Skin perfusion pressure better predicts healing
Skin perfusion pressure is a measure of the capillary opening pressure after occlusion and is another way to assess perfusion. This test is not routinely done and must be specially requested.
The test is performed by inflating a blood pressure cuff on the leg until blood flow is occluded, then using laser Doppler to determine reactive hyperemia, ie, the gradual return of blood flow during controlled pressure release. The pressure at which movement is detected is the skin perfusion pressure.22
The laser Doppler probe emits and detects light scattered in the tissue. Light hitting moving blood cells undergoes a change in frequency, ie, a Doppler shift. An algorithm converts the optical information in the skin perfusion pressure by capturing the onset of capillary flow return and determining the pressure at which flow returns. Categories of results:
- > 50 mm Hg—normal
- 40–50 mm Hg—mild ischemia (wound healing probable)
- 30–40 mm Hg—moderate ischemia (wound healing uncertain)
- < 30 mm Hg—critical limb ischemia (wound healing unlikely).
Skin perfusion pressure testing has the advantages of not being affected by vessel calcification, thickened skin, or edema. It can be used on the plantar aspect of the foot and on digits. Recent small studies indicate that it is more sensitive for predicting wound healing than Tcpo2 measures.
On the other hand, skin perfusion pressure testing is not useful for predicting response to hyperbaric oxygen therapy. Also, blood flow occlusion by the cuff may be painful.
Intraoperative fluorescence angiography
Intraoperative fluorescence angiography is used to assess flap viability during reconstructive surgery and is being studied to determine its usefulness for assessing tissue viability in limb ischemia.
The test provides real-time assessment of capillary perfusion, determining surface tissue viability. The imaging head contains a digital camera, a laser light source, and a distance sensor. The test requires intravenous administration of indocyanine green, which binds to plasma proteins and is cleared through the liver, making it safe for patients with renal dysfunction. It cannot be used in patients with allergies to iodine contrast, penicillin, or sulfa.23
PREVENTION TARGETS CARDIOVASCULAR RISK FACTORS
Preventive measures are the same as for cardiovascular disease, ie, aggressive risk-factor modification: quitting smoking, lowering low-density lipoprotein cholesterol, reducing blood pressure, controlling diabetes, and managing heart failure.
Dual antiplatelet therapy should be instituted with aspirin and clopidogrel (Plavix) in patients undergoing revascularization. One can also consider cilostazol (Pletal); however, the role of this agent in patients with critical limb ischemia is less defined.
BYPASS OR ANGIOPLASTY?
The Bypass Versus Angioplasty in Severe Ischaemia of the Leg (BASIL) trial24 randomly assigned 452 patients with severe limb ischemia due to infrainguinal atherosclerosis to receive either surgery-first or angioplasty-first care and followed them for 5.5 years.
No significant differences between the two groups were found in amputation-free survival, deaths, or health-related quality of life. However, hospital costs associated with the surgery-first strategy were about one-third higher. As expected, more patients in the surgery group developed a wound infection, and more patients in the angioplasty group required bypass surgery at some point.
The conclusion that can be reached from this study is that patients presenting with severe limb ischemia due to infrainguinal atherosclerotic occlusive disease who are suitable for both surgical and interventional procedures can be treated with either method. However, most experts consider endovascular therapy as the first option in many patients. The National Institutes of Health recently funded a study to compare contemporary endovascular therapy vs surgery in patients with critical limb ischemia.
TAKE-HOME POINTS
In the last decade, significant endovascular advances have been made. New devices and techniques have enhanced our ability to treat high-risk patients who have critical limb ischemia. The combination of risk factor modification, accurate diagnosis, and aggressive revascularization should prevent limb loss in many of these patients. For the primary care physician, a low threshold for assessing perfusion in patients with critical limb ischemia is important using a screening ankle-brachial index and toe-brachial index. These patients should promptly be referred to a vascular specialist for further evaluation and treatment.
- Phillips T, Stanton B, Provan A, Lew R. A study of the impact of leg ulcers on quality of life: financial, social, and psychologic implications. J Am Acad Dermatol 1994; 31:49–53.
- Brem H, Kirsner RS, Falanga V. Protocol for the successful treatment of venous ulcers. Am J Surg 2004; 188(1A suppl):1–8.
- Ramsey SD, Newton K, Blough D, et al. Incidence, outcomes, and cost of foot ulcers in patients with diabetes. Diabetes Care 1999; 22:382–387.
- Cuddigan J, Berlowitz DR, Ayello E; National Pressure Ulcer Advisory Panel. Pressure ulcers in America: Prevalence, incidence, and implications for the future: an executive summary of the National Pressure Ulcer Advisory Panel monograph. Adv Skin Wound Care 2001; 14:208–215.
- Olin JW, Beusterien KM, Childs MB, Seavey C, McHugh L, Griffiths RI. Medical costs of treating venous stasis ulcers: evidence from a retrospective cohort study. Vasc Med 1999; 4:1–7.
- Gordois A, Scuffham P, Shearer A, Oglesby A, Tobian JA. The health care costs of diabetic peripheral neuropathy in the US. Diabetes Care 2003; 26:1790–1795.
- Kumar RN, Gupchup GV, Dodd MA, et al. Direct health care costs of 4 common skin ulcers in New Mexico Medicaid fee-for-service patients. Adv Skin Wound Care 2004; 17:143–149.
- Norgren L, Hiatt WR, Dormandy JA, Nehler MR, Harris KA, Fowkes FG; TASC II Working Group. Inter-society Consensus for the Management of Peripheral Arterial Disease (TASC II). J Vasc Surg 2007; 45(suppl):S5–S67.
- Rutherford RB, Baker JD, Ernst C, et al. Recommended standards for reports dealing with lower extremity ischemia: revised version. J Vasc Surg 1997; 26:517–538. Erratum in J Vasc Surg 2001; 33:805.
- Hamburg MA, Collins FS. The path to personalized medicine. N Engl J Med 2010; 363:301–304. Erratum in N Engl J Med 2010; 363:1092.
- Dormandy JA, Rutherford RB. Management of peripheral arterial disease (PAD). TASC Working Group. TransAtlantic Inter-Society Consensus (TASC). J Vasc Surg 2000; 31:S1–S296.
- Goodney PP, Travis LL, Nallamothu BK, et al. Variation in the use of lower extremity vascular procedures for critical limb ischemia. Circ Cardiovasc Qual Outcomes 2012; 5:94–102.
- Jones WS, Patel MR, Dai D, et al. Temporal trends and geographic variation of lower-extremity amputation in patients with peripheral artery disease: results from U.S. Medicare 2000–2008. J Am Coll Cardiol 2012; 60:2230–2236.
- Hirsch AT, Haskal ZJ, Mertzer NR, et al. ACC/AHA 2005 Practice Guidelines for the management of patients with peripheral arterial disease (lower extremity, renal, mesenteric, and abdominal aortic): a collaborative report from the American Association for Vascular Surgery/Society for Vascular Surgery, Society for Cardiovascular Angiography and Interventions, Society for Vascular Medicine and Biology, Society of Interventional Radiology, and the ACC/AHA Task Force on Practice Guidelines (Writing Committee to Develop Guidelines for the Management of Patients With Peripheral Arterial Disease): endorsed by the American Association of Cardiovascular and Pulmonary Rehabilitation; National Heart, Lung, and Blood Institute; Society for Vascular Nursing; TransAtlantic Inter-Society Consensus; and Vascular Disease Foundation. Circulation 2006; 113:e463–e654.
- Alexandrescu VA, Hubermont G, Philips Y, et al. Selective primary angioplasty following an angiosome model of reperfusion in the treatment of Wagner 1–4 diabetic foot lesions: practice in a multidisciplinary diabetic limb service. J Endovasc Ther 2008; 15:580–593.
- Neville RF, Attinger CE, Bulan EJ, Ducic I, Thomassen M, Sidawy AN. Revascularization of a specific angiosome for limb salvage: does the target artery matter? Ann Vasc Surg 2009; 23:367–373.
- Iida O, Soga Y, Hirano K, et al. Long-term results of direct and indirect endovascular revascularization based on the angiosome concept in patients with critical limb ischemia presenting with isolated below-the-knee lesions. J Vasc Surg 2012; 55:363–370.
- Graziani L, Silvestro A, Bertone V, et al. Vascular involvement in diabetic subjects with ischemic foot ulcer: a new morphologic categorization of disease severity. Eur J Vasc Endovasc Surg 2007; 33:453–460.
- Newman AB, Siscovick DS, Manolio TA, et al., Cardiovascular Heart Study (CHS) Collaborative Research Group. Ankle-arm index as a marker of atherosclerosis in the Cardiovascular Health Study. Circulation 1993; 88:837–845.
- Cronenwett JL, Johnston KW. Rutherford’s Vascular Surgery. 7th ed. Philadelphia, PA: Saunders Elsevier; 2010.
- Fife CE, Smart DR, Sheffield PJ, Hopf HW, Hawkins G, Clarke D. Transcutaneous oximetry in clinical practice: consensus statements from an expert panel based on evidence. Undersea Hyperb Med 2009; 36:43–53.
- Lo T, Sample R, Moore P, Gold P. Prediction of wound healing outcome using skin perfusion pressure and transcutaneous oximetry. Wounds 2009; 21:310–316.
- Perry D, Bharara M, Armstrong DG, Mills J. Intraoperative fluorescence vascular angiography: during tibial bypass. J Diabetes Sci Technol 2012; 6:204–208.
- Adam DJ, Beard JD, Cleveland T, et al; BASIL trial participants. Bypass versus angioplasty in severe ischaemia of the leg (BASIL): multicentre, randomised controlled trial. Lancet 2005; 366:1925–1934.
In many ways, vascular disease in the leg is similar to that in the heart. The risk factors, underlying conditions, and pathogenetic processes are the same, and in many cases, patients have both conditions. And just as cardiologists and emergency physicians have learned that in acute myocardial infarction “time is muscle,” we are coming to appreciate that in many cases of limb ischemia, “time is limb.”
Most physicians well understand the clinical spectrum of coronary artery disease, which ranges from stable angina to ST-elevation myocardial infarction. In the leg, the same situation exists: at the more benign end of the spectrum, patients experience no symptoms, but often that is because they lead a sedentary lifestyle, modifying their activity level to avoid pain. As the disease worsens, they can develop claudication and critical leg ischemia, comparable to non-ST-elevation myocardial infarction. The most severe condition is acute limb ischemia, analagous to ST-elevation myocardial infarction.
Distinguishing acute from critical limb ischemia is essential in patients who present with leg problems, whether it be leg pain or ulcers. The farther along the clinical spectrum the patient’s condition is, the more important it is to be aggressive in diagnosis and treatment. The history and physical examination are the most important first steps, focusing on the onset of symptoms, history, risk factors, and past interventions.
Peripheral artery disease is increasingly becoming a worldwide problem that is now being emphasized by the World Health Organization. Unfortunately, not enough attention is paid to the problem, not only in less-developed countries but also in the United States. Patients with peripheral artery disease tend to be elderly, in the lowest economic classes, and uninsured, and they often do not understand the impact of the disease on their health.
LEG ULCERS: CAUSES AND COSTS
Finding the underlying cause of leg ulcers is important, and the differential diagnosis is large (Table 1). However, knowing the cause does not necessarily lead to healing; it is still essential to assess perfusion, infection, and wound care, and to arrest edema.
Causes of leg and foot ulcers include venous insufficiency (with an estimated 2.5 million cases annually),1,2 diabetes (nearly 1 million cases),3 and pressure (ie, bedsores, occurring in up to 28% of patients in extended care),4 all at a cost in the billions of dollars.5–7
In general, peripheral artery disease itself does not cause ulcers; it is an inciting factor. It is important to find what started the process. Ill-fitting shoes, poor sensation because of diabetes, or a cut when trimming toenails can all contribute to a wound, and peripheral artery disease makes it unable to heal. The healing process requires more nutrients and oxygen than poor circulation can provide.
ACUTE LIMB ISCHEMIA
Acute limb ischemia is defined as any sudden decrease in limb perfusion causing a potential threat to limb viability.8 Although it comes on suddenly, it does not imply that the patient has not had long-standing peripheral artery disease. It is important to determine what suddenly changed to cause the onset of symptoms.
History and physical examination: The six Ps
A good history includes a thorough evaluation of the present illness, including the pain’s time of onset, abruptness, location, intensity, and change over time, and whether it is present at rest. The medical history should focus on claudication, diabetes, smoking, heart disease, palpitations, atrial fibrillation, and previous ischemic symptoms.8
The physical examination should focus on the “six Ps”:
- Pain
- Pulselessness
- Paresthesia (numbness occurs in about half of patients)
- Pallor (obstruction is typically one joint above the level of demarcation of pallor)
- Paralysis (a bad sign, particularly if the calf is tight)
- Poikilothermia (inability to regulate temperature).
A good pulse examination includes measuring the ankle-brachial index and a Doppler examination of both legs. A neurologic examination focusing on sensory and motor function is critical for determining the level of ischemia and the urgency of intervention.
Classification of acute limb ischemia
If it is determined that a patient has acute leg ischemia, it is important to categorize the condition using the classification system devised by the Society of Vascular Surgery and International Society of Cardiovascular Surgery (Table 2).9 The category establishes the type and urgency of treatment. This classification system is simple and depends on factors that can be assessed easily by nonspecialists:
- Pulses—arterial and venous pulses assessed by Doppler ultrasonography
- Sensation—the patient closes the eyes and answers if he or she can feel the examiner’s touch
- Motor function—can the patient move his or her toes?
Venous pulses can be difficult to assess. However, if the arterial pulse is present, the venous pulse should be next to it. Knowing the other criteria can determine the category, so not being certain of the venous pulse should not deter a clinician from assessing the other factors.
Category I is “viable.” Patients have intact sensory and motor functions and audible pulses. Patients in this category should be admitted and possibly started on anticoagulation therapy and referred to a vascular specialist within hours.
Category IIa is “threatened.” Sensation is starting to be lost but motor function is still present. These patients are considered to have reversible ischemia, analogous to myocardial infarction of the leg, and they require immediate attention.
Category IIb is similar and it also requires immediate attention.
Category III is usually irreversible, with loss of motor function and sensation.
CAUSES OF ACUTE LIMB ISCHEMIA
Thrombosis accounts for about 50% of cases. Underlying causes of the thrombosis are artherosclerosis (native or bypass), aneurysm, trauma, vasculitis (eg, in a rheumatologic disease such as lupus), and hypercoagulable states (particularly in patients with cancer).
Embolism accounts for about 30% of cases. Emboli usually arise from plaque rupture in atherosclerotic arteries or a clot breaking off from an aneurysm or from within the heart in patients with atrial fibrillation or another underlying heart disease. Paradoxical embolism, caused by an embolism crossing the heart through an opening such as a patent foramen ovale, is rare.
Uncommon causes include arterial dissection following trauma, adventitial cystic disease, popliteal artery entrapment, ergotism (from consuming fungus-contaminated grains), and human immunodeficiency virus arteriopathy.
The physical examination provides clues to the origin: livedo reticularis (purple discoloration in a mottled pattern) and blue nail beds indicate that an embolus is likely. Tests, including electrocardiography, echocardiography, and computed tomography of the chest and abdomen to look for an aneurysm, can help identify the cause. Ultrasonography of the popliteal arteries should also be considered to search for an aneurysm.
CRITICAL LIMB ISCHEMIA
Critical limb ischemia is more likely than acute limb ischemia to be seen in a general practice. Many aspects need to be addressed simultaneously, by different specialists: vascular and endocrine systems, infection, and wound care. The most successful management strategy is a dynamic approach using every piece of information.10
The Rutherford classification of peripheral artery disease has six categories based on the clinical presentation, with categories I through III being mild to severe claudication. We discuss here only the more severe categories: IV (pain at rest), V (tissue loss), and VI (gangrene).
Strong indicators of pain at rest are that the patient has to get up at night to dangle the leg over the bed or walk a few steps, or sleeps in a chair, or refuses to elevate the leg because of pain. The affected leg tends to appear red when the patient is standing (dependent rubor), but pale when the foot is elevated (elevation pallor).
Confirming that a patient has dependent rubor can be challenging, especially in people with dark skin. Classically, redness is seen when the leg is down and disappears with elevation, but in cellulitis, redness can also be reduced by elevating the leg. A foot that is hot to the touch is an indication of infection and not lack of perfusion alone.
The hemodynamic definition of critical limb ischemia is11:
- Ankle-brachial pressure index less than 0.4
- Reduced toebrachial pressure index, ie, less than 0.7
- Reduced transcutaneous pressure of oxygen (Tcpo2), ie, less than 40 mm Hg.
From 15% to 20% of patients with claudication will progress to critical ischemia over their lifetime, and in patients with claudication who also have diabetes, the risk is nearly 10 times higher. Without revascularization, the risk of amputation within 1 year is 73% for patients in Rutherford class IV and 95% for patients in class V or VI.
Revascularization and limb preservation
Preserving the limb is a prime goal. For patients who have an amputation, the mortality rate is 40% within 2 years.8 These patients tend to be elderly, and after an amputation, most will not learn to use a prosthesis and resume their previous level of activity. Other treatment objectives are to relieve pain, reduce cardiovascular risk, and minimize procedural complications.
Although limb preservation is not a controversial goal, best practices to preserve limbs are not universally available. Goodney et al12 studied variation in the United States in the use of lower-extremity vascular procedures for critical limb ischemia. They defined “low-intensity” to “high-intensity” regions of the country depending on the proportion of patients who underwent a vascular procedure in the year before amputation. They found considerable variation, but even in the region of highest intensity, more than 40% of patients did not have a vascular procedure in the year before amputation.
Similarly, Jones et al13 mapped amputation rates by US state and found significant variation even after adjusting for risk factors such as tobacco use and obesity.
Controversy surrounds the specifics of revascularization treatment, as in many fields in vascular medicine. However, most experts agree that improved perfusion is the goal.
The Trans-Atlantic Inter-Society Consensus for the Management of Peripheral Artery Disease recommends revascularization as the best treatment for patients with critical limb ischemia.8 In addition, the American College of Cardiology and American Heart Association Guidelines for the Management of Patients With Peripheral Arterial Disease (Lower Extremity, Renal, Mesenteric, and Abdominal Aortic) state that the tibial or pedal artery that is capable of providing continuous and uncompromised outflow to the foot should be used as the site of distal anastomosis.14 These guidelines do not yet mention endovascular therapy.
Angiosomes guide revascularization
In the past few years, the ability to facilitate healing of foot ulcers has improved. Angiosomes—regions of vascularization supplied by specific arteries—can be mapped on the skin, similar to the way dermatomes are mapped for neural innervation (Figure 1). The foot and lower leg region has six angiosomes perfused by three arteries that branch off the popliteal artery after it passes behind the knee:
- The anterior tibial artery supplies the dorsum of the foot and the front of the lower limb.
- The posterior tibial artery supplies the plantar surface of the foot via three branches—the medial plantar, lateral plantar, and calcaneal branches.
- The peroneal artery supplies the lateral part of the foot with collaterals to the anterior and posterior tibial arteries if they are compromised.
Studies have compared angiosome-based treatment vs revascularizing the best available artery (thus depending on collateral flow to compensate to surrounding areas). They have found that regardless of whether an endovascular or bypass method of revascularization was used, an angiosome-based approach led to significantly higher amputation-free survival rates.15–17
Patients typically do not have blockage of only a single tibial artery. Graziani et al18 assessed the vascular lesions in 417 patients with critical limb ischemia and found that multiple below-knee arteries were frequently involved. This makes it difficult to decide where to target revascularization efforts, and the angiosome concept helps with that.
ASSESSING WOUND PERFUSION
Ankle- and toe-brachial indices assess perfusion
The ankle-brachial index19 is a good superficial assessment of perfusion. Multiple epidemiologic studies have shown the prognostic value of the ankle brachial index beyond the traditional risk factors and even the Framingham risk score.19 Values:
- Normal 1.1–1.30 (> 1.31 is abnormal and consistent with calcified vessels, and is an unreliable measure)
- Low normal 0.91–1.00
- Mild disease 0.71–0.90
- Moderate disease 0.41–0.70
- Severe disease ≤ 0.40.
However, the ankle-brachial index assesses perfusion only to the ankle, and many patients have ulcers in the toes and distal foot. The toe-brachial index must be specifically ordered in most institutions (if the first toe has an ulcer, the second toe should be assessed). The toe-brachial index is also important if the ankle-brachial index cannot be obtained because of calcified, noncompressible arteries in the ankle. A normal toe-brachial index is greater than 0.7.
The segmental blood pressure examination compares blood pressure measurements at multiple sites in the lower extremity. A drop of more than 20 mm Hg between segments indicates obstruction at that location. The test is simple and noninvasive and often can replace computed tomography.20
Transcutaneous oximetry
Transcutaneous oximetry measures the Tcpo2 from 1 to 2 mm deep in the skin from local capillaries. Measured adjacent to an ulcer, it is useful to predict wound healing and to assess the response to hyperbaric oxygen therapy.21 The values are:
- Normal > 70 mm Hg
- Impaired wound healing < 40 mm Hg
- Critical limb ischemia < 30 mm Hg.
Although most agree that a Tcpo2 below 40 mm Hg requires revascularization, low values can arise from many causes other than peripheral artery disease, including high altitude, pulmonary disease, heart failure, edema, inflammation, callus, and skin diseases such as scleroderma.
Skin perfusion pressure better predicts healing
Skin perfusion pressure is a measure of the capillary opening pressure after occlusion and is another way to assess perfusion. This test is not routinely done and must be specially requested.
The test is performed by inflating a blood pressure cuff on the leg until blood flow is occluded, then using laser Doppler to determine reactive hyperemia, ie, the gradual return of blood flow during controlled pressure release. The pressure at which movement is detected is the skin perfusion pressure.22
The laser Doppler probe emits and detects light scattered in the tissue. Light hitting moving blood cells undergoes a change in frequency, ie, a Doppler shift. An algorithm converts the optical information in the skin perfusion pressure by capturing the onset of capillary flow return and determining the pressure at which flow returns. Categories of results:
- > 50 mm Hg—normal
- 40–50 mm Hg—mild ischemia (wound healing probable)
- 30–40 mm Hg—moderate ischemia (wound healing uncertain)
- < 30 mm Hg—critical limb ischemia (wound healing unlikely).
Skin perfusion pressure testing has the advantages of not being affected by vessel calcification, thickened skin, or edema. It can be used on the plantar aspect of the foot and on digits. Recent small studies indicate that it is more sensitive for predicting wound healing than Tcpo2 measures.
On the other hand, skin perfusion pressure testing is not useful for predicting response to hyperbaric oxygen therapy. Also, blood flow occlusion by the cuff may be painful.
Intraoperative fluorescence angiography
Intraoperative fluorescence angiography is used to assess flap viability during reconstructive surgery and is being studied to determine its usefulness for assessing tissue viability in limb ischemia.
The test provides real-time assessment of capillary perfusion, determining surface tissue viability. The imaging head contains a digital camera, a laser light source, and a distance sensor. The test requires intravenous administration of indocyanine green, which binds to plasma proteins and is cleared through the liver, making it safe for patients with renal dysfunction. It cannot be used in patients with allergies to iodine contrast, penicillin, or sulfa.23
PREVENTION TARGETS CARDIOVASCULAR RISK FACTORS
Preventive measures are the same as for cardiovascular disease, ie, aggressive risk-factor modification: quitting smoking, lowering low-density lipoprotein cholesterol, reducing blood pressure, controlling diabetes, and managing heart failure.
Dual antiplatelet therapy should be instituted with aspirin and clopidogrel (Plavix) in patients undergoing revascularization. One can also consider cilostazol (Pletal); however, the role of this agent in patients with critical limb ischemia is less defined.
BYPASS OR ANGIOPLASTY?
The Bypass Versus Angioplasty in Severe Ischaemia of the Leg (BASIL) trial24 randomly assigned 452 patients with severe limb ischemia due to infrainguinal atherosclerosis to receive either surgery-first or angioplasty-first care and followed them for 5.5 years.
No significant differences between the two groups were found in amputation-free survival, deaths, or health-related quality of life. However, hospital costs associated with the surgery-first strategy were about one-third higher. As expected, more patients in the surgery group developed a wound infection, and more patients in the angioplasty group required bypass surgery at some point.
The conclusion that can be reached from this study is that patients presenting with severe limb ischemia due to infrainguinal atherosclerotic occlusive disease who are suitable for both surgical and interventional procedures can be treated with either method. However, most experts consider endovascular therapy as the first option in many patients. The National Institutes of Health recently funded a study to compare contemporary endovascular therapy vs surgery in patients with critical limb ischemia.
TAKE-HOME POINTS
In the last decade, significant endovascular advances have been made. New devices and techniques have enhanced our ability to treat high-risk patients who have critical limb ischemia. The combination of risk factor modification, accurate diagnosis, and aggressive revascularization should prevent limb loss in many of these patients. For the primary care physician, a low threshold for assessing perfusion in patients with critical limb ischemia is important using a screening ankle-brachial index and toe-brachial index. These patients should promptly be referred to a vascular specialist for further evaluation and treatment.
- Phillips T, Stanton B, Provan A, Lew R. A study of the impact of leg ulcers on quality of life: financial, social, and psychologic implications. J Am Acad Dermatol 1994; 31:49–53.
- Brem H, Kirsner RS, Falanga V. Protocol for the successful treatment of venous ulcers. Am J Surg 2004; 188(1A suppl):1–8.
- Ramsey SD, Newton K, Blough D, et al. Incidence, outcomes, and cost of foot ulcers in patients with diabetes. Diabetes Care 1999; 22:382–387.
- Cuddigan J, Berlowitz DR, Ayello E; National Pressure Ulcer Advisory Panel. Pressure ulcers in America: Prevalence, incidence, and implications for the future: an executive summary of the National Pressure Ulcer Advisory Panel monograph. Adv Skin Wound Care 2001; 14:208–215.
- Olin JW, Beusterien KM, Childs MB, Seavey C, McHugh L, Griffiths RI. Medical costs of treating venous stasis ulcers: evidence from a retrospective cohort study. Vasc Med 1999; 4:1–7.
- Gordois A, Scuffham P, Shearer A, Oglesby A, Tobian JA. The health care costs of diabetic peripheral neuropathy in the US. Diabetes Care 2003; 26:1790–1795.
- Kumar RN, Gupchup GV, Dodd MA, et al. Direct health care costs of 4 common skin ulcers in New Mexico Medicaid fee-for-service patients. Adv Skin Wound Care 2004; 17:143–149.
- Norgren L, Hiatt WR, Dormandy JA, Nehler MR, Harris KA, Fowkes FG; TASC II Working Group. Inter-society Consensus for the Management of Peripheral Arterial Disease (TASC II). J Vasc Surg 2007; 45(suppl):S5–S67.
- Rutherford RB, Baker JD, Ernst C, et al. Recommended standards for reports dealing with lower extremity ischemia: revised version. J Vasc Surg 1997; 26:517–538. Erratum in J Vasc Surg 2001; 33:805.
- Hamburg MA, Collins FS. The path to personalized medicine. N Engl J Med 2010; 363:301–304. Erratum in N Engl J Med 2010; 363:1092.
- Dormandy JA, Rutherford RB. Management of peripheral arterial disease (PAD). TASC Working Group. TransAtlantic Inter-Society Consensus (TASC). J Vasc Surg 2000; 31:S1–S296.
- Goodney PP, Travis LL, Nallamothu BK, et al. Variation in the use of lower extremity vascular procedures for critical limb ischemia. Circ Cardiovasc Qual Outcomes 2012; 5:94–102.
- Jones WS, Patel MR, Dai D, et al. Temporal trends and geographic variation of lower-extremity amputation in patients with peripheral artery disease: results from U.S. Medicare 2000–2008. J Am Coll Cardiol 2012; 60:2230–2236.
- Hirsch AT, Haskal ZJ, Mertzer NR, et al. ACC/AHA 2005 Practice Guidelines for the management of patients with peripheral arterial disease (lower extremity, renal, mesenteric, and abdominal aortic): a collaborative report from the American Association for Vascular Surgery/Society for Vascular Surgery, Society for Cardiovascular Angiography and Interventions, Society for Vascular Medicine and Biology, Society of Interventional Radiology, and the ACC/AHA Task Force on Practice Guidelines (Writing Committee to Develop Guidelines for the Management of Patients With Peripheral Arterial Disease): endorsed by the American Association of Cardiovascular and Pulmonary Rehabilitation; National Heart, Lung, and Blood Institute; Society for Vascular Nursing; TransAtlantic Inter-Society Consensus; and Vascular Disease Foundation. Circulation 2006; 113:e463–e654.
- Alexandrescu VA, Hubermont G, Philips Y, et al. Selective primary angioplasty following an angiosome model of reperfusion in the treatment of Wagner 1–4 diabetic foot lesions: practice in a multidisciplinary diabetic limb service. J Endovasc Ther 2008; 15:580–593.
- Neville RF, Attinger CE, Bulan EJ, Ducic I, Thomassen M, Sidawy AN. Revascularization of a specific angiosome for limb salvage: does the target artery matter? Ann Vasc Surg 2009; 23:367–373.
- Iida O, Soga Y, Hirano K, et al. Long-term results of direct and indirect endovascular revascularization based on the angiosome concept in patients with critical limb ischemia presenting with isolated below-the-knee lesions. J Vasc Surg 2012; 55:363–370.
- Graziani L, Silvestro A, Bertone V, et al. Vascular involvement in diabetic subjects with ischemic foot ulcer: a new morphologic categorization of disease severity. Eur J Vasc Endovasc Surg 2007; 33:453–460.
- Newman AB, Siscovick DS, Manolio TA, et al., Cardiovascular Heart Study (CHS) Collaborative Research Group. Ankle-arm index as a marker of atherosclerosis in the Cardiovascular Health Study. Circulation 1993; 88:837–845.
- Cronenwett JL, Johnston KW. Rutherford’s Vascular Surgery. 7th ed. Philadelphia, PA: Saunders Elsevier; 2010.
- Fife CE, Smart DR, Sheffield PJ, Hopf HW, Hawkins G, Clarke D. Transcutaneous oximetry in clinical practice: consensus statements from an expert panel based on evidence. Undersea Hyperb Med 2009; 36:43–53.
- Lo T, Sample R, Moore P, Gold P. Prediction of wound healing outcome using skin perfusion pressure and transcutaneous oximetry. Wounds 2009; 21:310–316.
- Perry D, Bharara M, Armstrong DG, Mills J. Intraoperative fluorescence vascular angiography: during tibial bypass. J Diabetes Sci Technol 2012; 6:204–208.
- Adam DJ, Beard JD, Cleveland T, et al; BASIL trial participants. Bypass versus angioplasty in severe ischaemia of the leg (BASIL): multicentre, randomised controlled trial. Lancet 2005; 366:1925–1934.
KEY POINTS
- In assessing peripheral artery disease, perform a thorough history and physical examination, paying close attention to the onset and characteristics of pain, activity level, history, and pulses, and the condition of the feet.
- Acute limb ischemia is a sudden decrease in limb perfusion, potentially threatening limb viability. Patients who have acute cessation of blood flow, sensation, or motor function need immediate revascularization to avoid amputation.
- Critical limb ischemia ranges from rest pain to gangrene and must be addressed with a multidisciplinary approach.
- The ankle-brachial index is a noninvasive, inexpensive test that can be done in the office with a hand-held Doppler device to assess the presence and severity of peripheral artery disease.
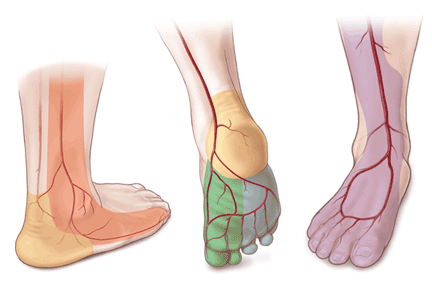
Appreciating the appetite for reflective practice

The article by Dickstein et al on eating disorders in this issue of the Journal made me think about my experience long ago as an internist comanaging patients who had severe eating disorders.
As a rheumatologist, I noticed that these young women had a very high prevalence of fibromyalgia and associated visceral pain syndromes such as irritable bowel syndrome and interstitial cystitis. Because they had been experiencing fatigue and generalized pain, many of them had been tested for lupus. Since about 20% of young women may have a low-positive antinuclear antibody titer, some of these patients had been diagnosed with lupus, and some had been offered therapy.
Other factors reinforced their physicians’ appropriate concerns about possible connective tissue disease. For example, modest leukopenia is not infrequent in malnourished patients, and Raynaud phenomenon is common in young women. Bulimia is associated with gastroesophageal dysmotility, and some of these women had slightly elevated creatine kinase levels. These abnormalities were generally the result of over-vigorous exercise, ipecac use, emesis, and hypokalemia. However, myositis or scleroderma overlap syndromes had occasionally been diagnosed in some patients, especially when the severity of the primary eating disorder was unappreciated.
Many, including myself, have written about the strengths and limitations of evidence-based medicine. We routinely make both evidence- and experience-based clinical decisions, often with little time to reflect on the exact reason for each decision. As I think back on my stint in the eating disorders clinic, recalling individual patients and lessons learned, I am struck by how observation-based my management of those patients was and how those experiences have stuck with me.
Reflective clinical care (also known as anecdotal experience) can have a lasting impact on the way we practice. Twenty-five years later, I still think about eating disorders when I evaluate young women who have severe fibromyalgia.
Recognizing, managing medical consequences of eating disorders in primary care
Eating disorders are debilitating biopsychosocial illnesses associated with serious medical illness and a high risk of death.1
Primary care physicians are often the first to see young women who have these problems, diagnose them, and start their evaluation and treatment.2–4 Many patients require acute medical interventions as well as long-term care for chronic medical issues. Therefore, primary care physicians play essential front-line and long-term roles in the multidisciplinary treatment team.
DEFINITIONS OF EATING DISORDERS HAVE CHANGED
Several problems existed in the category of eating disorders in the fourth edition of the Diagnostic and Statistical Manual of Mental Disorders (DSM-4) and in the DSM-4 Text Revision (DSM-4-TR). These problems have been addressed in the fifth edition (DSM-5), released in 2013.5
One problem in the earlier editions was that many patients referred for treatment of eating disorders—more than 50% in one study6—did not meet the criteria for anorexia nervosa or bulimia nervosa and thus had to be categorized as having “eating disorder not otherwise specified.” Further, the earlier editions did not recognize that young children and adolescent males can be affected.7
Eating disorders are now recognized as an equal-opportunity disease, with all ethnic and socioeconomic groups affected. Children can run into medical trouble with even a small amount of weight loss or falling off the growth curve. Moreover, children and adolescents do not “experience” their bodies in the same way adults do; they may lack the vocabulary for eating-disorder thoughts.
For these reasons, the definitions of eating disorders have changed in the DSM-5.5
Anorexia nervosa. Older editions of the DSM listed amenorrhea as a criterion. This has been eliminated in DSM-5, since amenorrhea does not necessarily predict medical risk or treatment outcome; also, it is not applicable to males or premenorrheal girls and postmenopausal women.8 In addition, the requirement of low weight is now defined in the context of “age, sex, developmental trajectory, and physical health,” rather than the old threshold of 85% of expected weight.9
What remains unchanged is that anorexia nervosa is still characterized by self-starvation in order to maintain an abnormally low body weight, along with an intense fear of being fat and a disturbed self-image.
Bulimia nervosa. In both the old and the new editions of the DSM, bulimia nervosa is characterized by episodes of binge eating followed by inappropriate compensatory behaviors to avoid weight gain, such as vomiting, laxative abuse, diuretic abuse, and overexercise. In DSM-5, bulimia nervosa no longer has subtypes and requires only one binge per week with compensatory behavior, for at least 3 months. This change was based on the finding that there is no clear difference in psychopathology or treatment outcome between patients with one and two binge-purge episodes a week.10
“Eating disorder not otherwise specified” was a wastebasket category, lumping all those who did not meet the criteria for anorexia nervosa or bulimia nervosa or who did not neatly fit into a specific category.10 In DSM-5, subcategories were designed to help distinguish different treatment needs and outcomes between various subtypes.
Binge-eating disorder, one of the new subcategories, is characterized by binge eating without inappropriate compensatory behaviors.9 Patients with binge-eating disorder are often obese, have greater functional impairment, and are more likely to develop components of metabolic syndrome than obese patients without eating disorders.11
Avoidant/restrictive food intake disorder is another new DSM-5 diagnosis, characterized by failure to meet nutritional needs for reasons other than weight control. Reasons include disinterest in eating, dislike of sensory characteristics of food, or avoidance of consequences of eating. This disorder replaces the category “feeding disorder of infancy or early childhood,” since the condition can also occur in adolescents and adults.12
Other new diagnoses are:
- Atypical anorexia nervosa (if the patient is not underweight)
- Purging disorder
- Subthreshold bulimia nervosa (if the patient has < 1 episode per week or has had them for < 3 months)
- Subthreshold binge eating disorder (< 1 time a week or < 3 months)
- Night eating syndrome
- Pica and rumination disorder.
Regardless of the diagnostic label, the medical evaluation and treatment of anyone with an eating disorder should be tailored to the specific behaviors of the eating disorder. Medical complications can be subdivided into those from starvation, from purging, and from refeeding.
MEDICAL COMPLICATIONS OF STARVATION
Cardiovascular effects of starvation
Malnutrition and starvation have multiple adverse effects on the heart.
Electrophysiologic effects. Sinus bradycardia (< 60 bpm) and hypotension are common cardiac manifestations of starvation.13 Bradycardia has been attributed to an adaptive increase in parasympathetic vagal tone.14 QTc prolongation is also seen in patients with malnutrition.15
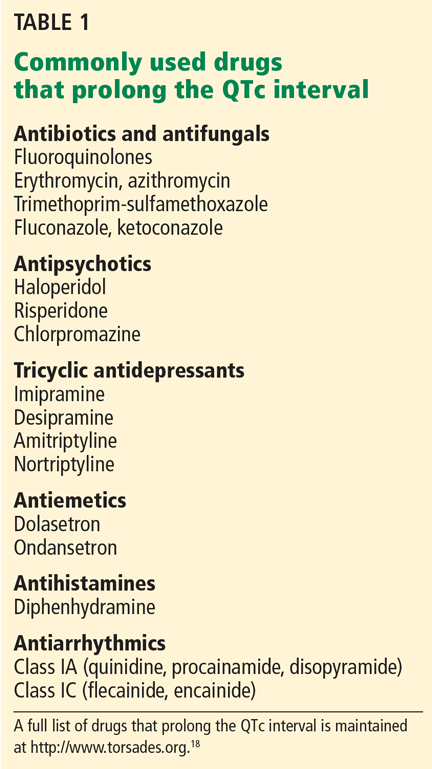
Together, these electrocardiographic abnormalities predispose the patient to ventricular arrhythmia and sudden cardiac death.16 The risk of ventricular arrhythmia is particularly relevant when treating psychiatric symptoms, since antipsychotics and tricyclic antidepressants are among several drug classes that can cause further QTc prolongation (Table 1).17,18
In patients with QTc prolongation, bradycardia, or both, the standard of care involves acute hospitalization for refeeding using continuous telemetric monitoring until normal rhythm is restored and the heart rate is above 40 at night and 50 by day.4,19
Structural changes. Starvation also causes structural changes in the heart. Loss of lean body mass can reduce cardiac muscle mass, compromise cardiac output, and lead to mitral valve prolapse.20 These changes are fully reversible with restored nutrition and regaining of heart mass.21,22
Effects of starvation on the brain
Starvation can affect brain structure and cognitive function. Undernourished patients have reduced volumes of white and gray matter, a change that can occur within months. Cortical volumes may increase with weight gain, but a reduction in gray matter volume may not be completely reversible.23
Furthermore, starvation impairs cognitive functions that are needed to stop eating-disorder behaviors; namely, decision-making, emotional control, regulation of appetite, and reward path-ways. Therefore, undernourished patients may not have sufficient insight into the disease to be able to make the best choices for recovery. This finding lends support for using the Maudsley method in adolescents, in which parents take control of their child’s eating until the child can maintain a healthy weight.24
Gastrointestinal consequences of starvation
Patients with malnutrition have prolonged gastric emptying and colonic transit time with solid foods.25 They often complain of early satiety, abdominal pain, bloating, and constipation, all symptoms that complicate the refeeding process. A prokinetic such as metoclopramide (Reglan), given 1 hour before meals and at bedtime, may provide some relief from gastrointestinal symptoms.26
Patients may also experience transient lactose or fructose intolerance after prolonged starvation. Taking a lactase supplement (eg, Lactaid 1–10 tabs) before consuming dairy products and dextrose (contained in candies such as Smarties) before eating fruit or fructose-containing foods can sometimes partially relieve symptoms. In general, gastrointestinal function returns over time as nutritional status improves.
Patients with severe or prolonged starvation can develop steatosis accompanied by elevated levels of aspartate aminotransferase (AST) and alanine aminotransferase (ALT). In reports of starvation-induced steatosis, liver enzyme levels rapidly normalize with nutritional rehabilitation.27
Endocrine consequences of starvation
Amenorrhea. Dysregulation of the hypothalamic-pituitary-gonadal axis is a major endocrine complication of nutritional in-sufficiency. Weight loss disrupts the normal pulsatile secretion of gonadotropin-releasing hormone, reduces secretion of luteinizing hormone and follicle-stimulating hormone, and decreases estrogen levels.28 Leptin deficiency likely plays a role in suppressing gonadotropin secretion with subsequent development of amenorrhea. With weight gain, levels of leptin and gonadotropins normalize and menstruation eventually returns.29,30
Hypothyroidism. Starvation can also lead to dysregulation of the hypothalamic-pituitary-thyroid axis. Typically, the concentration of triiodothyronine (T3) is reduced, the ratio of thyroxine (T4) to T3 is elevated, and thyroid-stimulating hormone (TSH) is close to or within the normal range, creating a euthyroid sick syndrome. In eating disorders, this thyroid disturbance is a result of starvation and resolves with weight restoration. Therefore, thyroid hormone replacement therapy is not medically indicated.28
Osteoporosis. Amenorrhea resulting from low estrogen levels in undernourished patients can raise the risk of osteoporosis and fractures, particularly in patients with a low body mass index. Osteopenia results from a negative balance between bone deposition and resorption.
Lack of bone deposition can be especially problematic when disordered eating occurs during peak bone mass development, ie, ages 11 to 14 for girls, and ages 15 to 17 for boys.31,32 Even a 5% to 10% decrease in bone deposition can result in significant risk of osteopenia.33 However, after age 30, bone resorption is a greater contributor.34
Does hormone therapy correct bone loss? Given the association between estrogen deficiency and bone loss, estrogen supplementation was expected to be an effective treatment for bone loss in patients with eating disorders.35 Also, the restoration of menses through hormone replacement may give underweight patients a false sense of achieving a “healthy” weight.36
Golden et al37 prospectively studied 50 adolescents and found no significant difference in bone mineral density at 1 year of follow-up between patients treated with estrogen and those who received only standard nutritional therapy. However, increased bone mineral density was achieved in adolescents with anorexia nervosa treated with transdermally administered estrogen dosed to mimic physiologic pubertal levels.38
Klibanski et al39 found that hormone therapy resulted in a 4% gain in bone density in an extremely low-weight subset of women with anorexia nervosa (< 70% of ideal body weight), whereas similar patients in the control group lost 20%. However, in all groups, only weight gain correlated with bone gain in women who were within 70% of their ideal body weight.
Divasta et al40 evaluated 60 girls and women ages 13 to 27 with anorexia nervosa, randomized to receive either placebo or dehydroepiandrosterone combined with an estrogen-progestin oral contraceptive, and followed for 18 months. As in the study by Klibanski et al,39 bone loss was prevented in the treatment group, but significant bone gain occurred only in the context of weight gain.
The bottom line is that only weight gain has resulted in significant increases in bone density in patients with anorexia nervosa, and hormone therapy without weight gain has not been shown to increase bone density effectively in this population. Although calcium and vitamin D in oral therapeutic doses through foods or through supplementation are required for bone gain, the combination is not enough to augment bone density in the absence of weight gain.37 Although not curative, weight gain is currently the best option for treating bone loss, and no single pharmacologic treatment is effective.
COMPLICATIONS OF PURGING
Oral complications of purging
Patients who purge by vomiting are at risk of complications from exposure of the esophagus, pharynx, and mouth to acidic gastric contents.
Dental problems. Over time, contact with gastric acid wears down enamel on the lingual and occlusal surfaces of teeth, resulting in dental caries and periodontal disease. Until they can give up purging, patients should be instructed to rinse with mouthwash or water immediately after vomiting to reduce the acidity in the mouth.41,42 We recommend that patients not brush their teeth after vomiting, because brushing can deliver acid to otherwise unreachable surfaces and thus worsen tooth erosion. For patients who are determined to brush after vomiting, a bicarbonate toothpaste might mitigate harm.42
Sialadenosis (hypertrophy of the salivary glands) is another consequence of repeated vomiting, with elevated salivary amylase. Both the size of the glands and the salivary amylase level generally normalize on their own after vomiting is stopped, but parotitis can take up to a year to resolve. Similar to smoker’s cough, parotitis may acutely worsen when the patient abruptly stops vomiting and may worsen before it improves.
To reduce discomfort, patients can use hot compresses or sugarless hard candies.44 However, the latter should not be substituted as a chronic habit in a patient with disordered eating. Patients need to be reassured that the swelling is not permanent, since they often interpret it as having fat cheeks (the “chipmunk sign”).
Hypokalemia, metabolic alkalosis, renal dysfunction
Chronic vomiting can cause electrolyte and acid-base imbalances, the most worrisome of which is hypokalemia. With repeated vomiting, loss of potassium and gastric acid causes metabolic alkalosis with hypokalemia, hypochloremia, and hypomagnesemia. Loss of water and the resultant volume contraction activates the renin-angiotensin-aldosterone system, and elevated aldosterone further decreases serum potassium.
In patients with eating disorders, who often have other factors contributing to electrolyte imbalance, vomiting-induced hypokalemia heightens the risk of cardiac arrhythmias.43
Hypokalemia can also cause rhabdomyolysis and kidney damage.41,43 Prolonged hypokalemia and reduced kidney perfusion in the setting of volume depletion causes acute kidney injury and impaired concentrating ability of the renal tubules. Hypovolemia can cause prerenal azotemia and increases the risk for nephrolithiasis and nephrocalcinosis.44,45
When a patient stops vomiting, elevated aldosterone from prior hypovolemia results in water retention and can manifest in significant edema associated with hypochloremic alkalosis. This condition, known as pseudo-Bartter syndrome, usually resolves without treatment. In the meantime, salt restriction and leg elevation can help reduce edema.26
Laxative abuse: A mode of purging
Many patients with eating disorders abuse laxatives to lose weight or to prevent weight gain. Believing that laxatives will prevent calorie absorption, patients commonly take them to compensate for caloric intake (eg, during a binge episode). The immediate weight loss, albeit artificial, is highly reinforcing for an eating-disorder patient. In some cases, patients with eating disorders also abuse laxatives to self-treat the constipation that results from chronic starvation.46
Over time, tolerance to laxatives develops, and patients use increasingly larger doses. This can lead to activation of the renin-angiotensin-aldosterone system.47 Patients interpret the resultant edema as true weight gain and again take laxatives to get rid of it. If laxatives are stopped abruptly, the patient may need inpatient and outpatient support for the resultant fluid shifts.
Gastrointestinal complications of laxative abuse include reflex hypofunction of the bowel, malabsorption, steatorrhea, and gastrointestinal bleeding.47 Reflex hypofunction during laxative withdrawal is a consequence of the bowel becoming tolerant of laxatives.48 Cathartic colon syndrome is a rare complication characterized by loss of the normal haustral markings and slowed or absent peristalsis in segments of the colon.49
Systemically, the major risk of laxative abuse relates to electrolyte and acid-base imbalance. Loss of potassium and water in the stool can cause hypokalemia and metabolic alkalosis.48 The disturbances caused by laxative abuse are similar to those caused by vomiting and diuretic use and have the same treatment.
The most important component of treating laxative abuse is giving patients realistic expectations to help them tolerate temporary discomfort and to help manage the edema and fluid shifts that can happen acutely with shifting of fluid into the intracellular space. In extreme cases, this may need to be managed in the hospital. To help relieve the initial anxiety, doctors should emphasize that any bloating the patient experiences is not true weight gain and will go away within a few days to weeks. In addition, explaining that laxatives reduce nutrient absorption only minimally may lessen the temptation to resume taking them.48
Diuretic abuse: Another form of purging
Diuretic abuse is yet another mode of purging, with its own set of medical complications. Like laxatives, diuretics are not effective weight-loss agents, and the weight reduction they cause is only temporary.
As with vomiting, there is a compensatory activation of the renin-angiotensin-aldosterone system, and therefore subsequent fluid intake will lead to water retention, which encourages further diuretic use.41 Diuretics can also contribute to hypokalemia, hypomagnesemia, hypochloremia, and metabolic alkalosis.
Ipecac abuse can lead to heart failure
Ipecac syrup has long been used to induce vomiting, but this practice has become much less common since ipecac has become harder to obtain in the United States.50 The emetine base contained in ipecac binds irreversibly to cardiac and skeletal muscle. With continued use, irreversible cardiomyopathy develops and can lead to heart failure. Treatment should include supportive care and immediate cessation of ipecac use.
Diabetic patients may skip insulin to lose weight
Patients with diabetes, especially those with type 1 that begins in childhood, are at greater risk of eating disorders over time.51 They may withhold insulin to lose weight, a practice referred to in the nonmedical literature as “diabulimia,” and they seem particularly more likely to develop bulimia nervosa than those without diabetes.52
The medical prognosis is poor for patients with diabetes who develop eating disorders and do not receive intensive treatment.51 In addition, if a diabetic patient on an insulin pump becomes depressed in addition to having an eating disorder, careful monitoring for suicidal thoughts and a rapid follow-up with mental health services are in order.
REFEEDING SYNDROME
When refeeding is started, a high glucose load stimulates insulin secretion, resulting in cellular uptake of phosphorus along with potassium, magnesium, and glucose. In addition, total body phosphorus is depleted by the increased demand for adenosine triphosphate and 2,3-diphosphoglycerate for cellular metabolism.
When liver enzyme levels increase, the astute clinician will closely monitor the patient for evidence of refeeding syndrome. In a child, adolescent, or young adult, the standard of care is inpatient monitoring for acute stabilization.4,19
Hypophosphatemia is the hallmark of refeeding syndrome, although hypomagnesemia, hypokalemia, and hypoglycemia can also occur.53 In addition, sodium and water retention can lead to fluid overload, with shifting of fluid into the intracellular space, resulting in dependent edema.
Cardiovascular complications are the most worrisome manifestations of refeeding syndrome. Electrolyte shifts and increased fluid volume can cause arrhythmias and heart failure. Furthermore, severely undernourished patients may have reduced myocardial mass as well as electrocardiographic abnormalities associated with starvation, which further increase their vulnerability to electrolyte shifts and fluid retention during refeeding.15
Other manifestations of refeeding syndrome include delirium, seizures, rhabdomyolysis, and respiratory failure. In the most extreme cases, refeeding syndrome causes sudden death.53
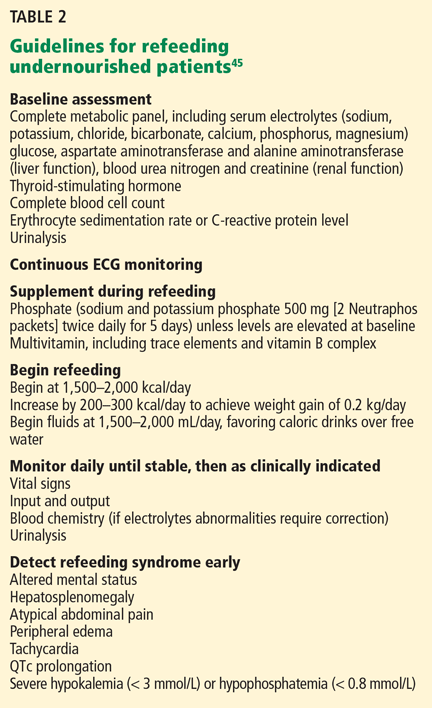
Fortunately, refeeding syndrome is easily preventable and treatable when recognized early. Electrolytes and cardiovascular and renal function must be carefully monitored, especially during the first week of nutritional restoration.53 In patients with extremely low body mass (< 70% of ideal body weight) or with precipitous weight loss, close monitoring of the complete metabolic panel including electrolytes, AST, ALT, calcium, magnesium, and phosphorus may be required to detect changes that can affect cardiac status. Specific suggestions for refeeding are discussed below and in Table 2.45
ACUTE CARE OF PATIENTS WITH EATING DISORDERS
Refeeding in the inpatient setting
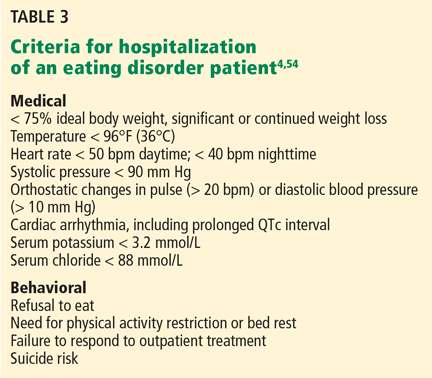
The decision to hospitalize an eating-disorder patient is based on the current or potential risk of serious medical complications and the likelihood of success at home. Medical criteria for hospital admission are outlined in Table 3.4,54
In refeeding undernourished patients, the challenge is to maximize weight gain while preventing refeeding syndrome. Undernourished patients are generally hypometabolic at baseline but become hypermetabolic once refeeding begins.
How many calories should refeeding start with? The traditional principle of “start low and go slow” has been recently challenged.55 Starting at 1,200 kcal/day or less in the typical patient can result in failure to gain weight or even in weight loss in the first week of refeeding.56 The goal is to achieve a weight gain of 0.2 kg/day while the patient is in the hospital. Thus, we start higher, and to date we have seen no cases of life-threatening refeeding syndrome. In all patients who need hospitalization or who are beginning the refeeding process as outpatients, caloric intake should be started at 1,500 to 2,000 kcal/day.45,57 However, for exceptionally low-weight patients, intake may be started lower.
In Australia, patients are started at 1,900 kcal/day.56 All patients in one program there receive nasogastric feeding initially in an intensive care unit and then are moved to a regular nursing floor where they graduate to full oral feeding as they improve cardiovascularly and behaviorally. In the United States, some programs use nasogastric feeding at night for caloric restoration; our program and others use nasogastric feeding as a behavioral modification strategy for patients who refuse food or supplements by mouth.
Phosphorus supplementation. Many centers give phosphorus supplements preventively. In our center, we give potassium phosphate (Neutra-Phos) 500 mg orally twice daily for 5 days, and we have seen no life-threatening cases of refeeding syndrome with that regimen. Other centers give phosphorus supplements in a dose of 250 mg orally twice a day for 5 days, while still others only supplement phosphorus reactively once a deficit has been identified. The latter method requires daily blood draws for monitoring and is reactive rather than proactive. Further studies can help clarify the optimal dosing and timing of phosphorus supplementation.
Managing fluid balance. Fluid-loading these patients may tip them over the edge into refeeding syndrome. Except in cases of shock, patients with eating disorders should not be given intravenous fluids, as it is safer to rehydrate and feed them orally. Electrolyte imbalances can be corrected orally with no need for intravenous supplementation. To avoid fluid overload, fluids can be started at 1,500 mL to 2,000 mL per day, with strict monitoring of intake and output. Fluids are liberalized if ALT and AST levels remain normal and to gradually correct orthostatic hypotension; caloric fluids are ideal to help address energy needs and improve bradycardia.
Laboratory monitoring. On admission, a urinalysis, complete blood cell count, complete metabolic panel, TSH, erythrocyte sedimentation rate, serum magnesium, and phosphorus should be obtained.26 In addition, continuous electrocardiographic recording should begin on admission.45 Inpatient use of a telemetry bed helps identify extreme tachycardia with arrhythmia, as well as profound bradycardia.45,56
Some protocols call for daily laboratory monitoring, although that degree of testing is less cost-effective. If initial results are normal, clinical judgment can be used on when to repeat laboratory evaluation. For instance, patients with edema require repeat complete metabolic panels to assess for elevated ALT and AST, electrolyte imbalances, and other abnormalities.
Signs of refeeding syndrome include tachycardia, hepatosplenomegaly, peripheral edema, altered mental status, and electrolyte disturbances, specifically, acute or severe hypophosphatemia or hypokalemia.26,45 If refeeding syndrome is suspected, the rate of caloric intake should be reduced or not advanced, fluid intake should be urgently reassessed for volume overload, and supportive care with close monitoring should be provided.
KNOWLEDGE SAVES LIVES
Eating disorders can lead to potentially life-threatening medical complications that require attentive care by the primary care clinician and subspecialist. Without thoughtful consideration, it is easy for even a caring medical team to unintentionally enable patients with these illnesses or to cause active harm in the case of underrecognized pathology.58
Acute medical stabilization on an inpatient unit trained to recognize pathology and treat sequelae can be lifesaving. Arming patients and families with medical knowledge, as provided in the Academy for Eating Disorders’ brochure, “Critical Points for Early Recognition and Medical Risk Management in the Care of Individuals with Eating Disorders”59 can help save patients’ lives.
- Arcelus J, Mitchell AJ, Wales J, Nielsen S. Mortality rates in patients with anorexia nervosa and other eating disorders. A meta-analysis of 36 studies. Arch Gen Psychiatry 2011; 68:724–731.
- Walsh JM, Wheat ME, Freund K. Detection, evaluation, and treatment of eating disorders the role of the primary care physician. J Gen Intern Med 2000; 15:577–590.
- American Academy of Pediatrics; Committee on Adolescence. Identifying and treating eating disorders. Pediatrics 2003; 111:204–211.
- Rosen DS; American Academy of Pediatrics Committee on Adolescence. Identification and management of eating disorders in children and adolescents. Pediatrics 2010; 126:1240–1253.
- American Psychiatric Association. Diagnostic and Statistical Manual of Mental Disorders. 5th edition. Arlington, VA: American Psychiatric Publishing, Incorporated; 2013.
- Eddy KT, Celio Doyle A, Hoste RR, Herzog DB, le Grange D. Eating disorder not otherwise specified in adolescents. J Am Acad Child Adolesc Psychiatry 2008; 47:156–164.
- Muise AM, Stein DG, Arbess G. Eating disorders in adolescent boys: a review of the adolescent and young adult literature. J Adolesc Health 2003; 33:427–435.
- Attia E, Roberto CA. Should amenorrhea be a diagnostic criterion for anorexia nervosa? Int J Eat Disord 2009; 42:581–589.
- American Psychiatric Association. Diagnostic and Statistical Manual of Mental Disorders, fifth edition. http://dsm.psychiatryonline.org/content.aspx?bookid=556§ionid=41101776#103439089. Accessed January 31, 2014.
- Wilfley DE, Bishop ME, Wilson GT, Agras WS. Classification of eating disorders: toward DSM-V. Int J Eat Disord 2007; 40:S123–S129.
- Wonderlich SA, Gordon KH, Mitchell JE, Crosby RD, Engel SG. The validity and clinical utility of binge eating disorder. Int J Eat Disord 2009; 42:687–705.
- Ornstein RM, Rosen DS, Mammel KA, et al. Distribution of eating disorders in children and adolescents using the proposed DSM-5 criteria for feeding and eating disorders. J Adolesc Health 2013: 53:303–305.
- Winston AP, Stafford PJ. Cardiovascular effects of anorexia nervosa. Eur Eat Disord Rev 2000; 8:117–125.
- Galetta F, Franzoni F, Prattichizzo F, Rolla M, Santoro G, Pentimone F. Heart rate variability and left ventricular diastolic function in anorexia nervosa. J Adolesc Health 2003; 32:416–421.
- McCallum K, Bermudez O, Ohlemeyer C, Tyson E, Portilla M, Ferdman B. How should the clinician evaluate and manage the cardiovascular complications of anorexia nervosa? Eat Disord 2006; 14:73–80.
- Akhtar M. Clinical spectrum of ventricular tachycardia. Circulation 1990; 82:1561–1573.
- Beach SR, Celano CM, Noseworthy PA, Januzzi JL, Huffman JC. QTc prolongation, torsades de pointes, and psychotropic medications. Psychosomatics 2013; 54:1–13.
- The University of Arizona Center for Education and Research on Therapeutics. QT Drug Lists. http://crediblemeds.org/everyone/compos-ite-list-all-qtdrugs/?rf=US. Accessed January 31, 2014.
- Rome ES, Ammerman S. Medical complications of eating disorders: an update. J Adolesc Health 2003; 33:418–426.
- Romano C, Chinali M, Pasanisi F, et al. Reduced hemodynamic load and cardiac hypotrophy in patients with anorexia nervosa. Am J Clin Nutr 2003; 77:308–312.
- Shamim T, Golden NH, Arden M, Filiberto L, Shenker IR. Resolution of vital sign instability: an objective measure of medical stability in anorexia nervosa. J Adolesc Health 2003; 32:73–77.
- Mont L, Castro J, Herreros B, et al. Reversibility of cardiac abnormalities in adolescents with anorexia nervosa after weight recovery. J Am Acad Child Adolesc Psychiatry 2003; 42:808–813.
- Roberto CA, Mayer LE, Brickman AM, et al. Brain tissue volume changes following weight gain in adults with anorexia nervosa. Int J Eat Disord 2011; 44:406–411.
- Treasure J, Russell G. The case for early intervention in anorexia nervosa: theoretical exploration of maintaining factors. Br J Psychiatry 2011; 199:5–7.
- Hadley SJ, Walsh BT. Gastrointestinal disturbances in anorexia nervosa and bulimia nervosa. Curr Drug Targets CNS Neurol Disord 2003; 2:1–9.
- Yager J, Andersen AE. Clinical practice. Anorexia nervosa. N Engl J Med 2005; 353:1481–1488.
- De Caprio C, Alfano A, Senatore I, Zarrella L, Pasanisi F, Contaldo F. Severe acute liver damage in anorexia nervosa: two case reports. Nutrition 2006; 22:572–575.
- Lawson EA, Klibanski A. Endocrine abnormalities in anorexia nervosa. Nat Clin Pract Endocrinol Metab 2008; 4:407–414.
- Holtkamp K, Mika C, Grzella I, et al. Reproductive function during weight gain in anorexia nervosa. Leptin represents a metabolic gate to gonadotropin secretion. J Neural Transm 2003; 110:427–435.
- Golden NH, Jacobson MS, Schebendach J, Solanto MV, Hertz SM, Shenker IR. Resumption of menses in anorexia nervosa. Arch Pediatr Adolesc Med 1997; 151:16–21.
- Soyka LA, Misra M, Frenchman A, et al. Abnormal bone mineral accrual in adolescent girls with anorexia nervosa. J Clin Endocrinol Metab 2002; 87:4177–4185.
- Misra M, Klibanski A. Bone metabolism in adolescents with anorexia nervosa. J Endocrinol Invest 2011; 34:324–332.
- Recker RR, Davies KM, Hinders SM, Heaney RP, Stegman MR, Kimmel DB. Bone gain in young adult women. JAMA 1992; 268:2403–2408.
- Biller BM, Saxe V, Herzog DB, Rosenthal DI, Holzman S, Klibanski A. Mechanisms of osteoporosis in adult and adolescent women with anorexia nervosa. J Clin Endocrinol Metab 1989; 68:548–554.
- Hergenroeder AC, Smith EO, Shypailo R, Jones LA, Klish WJ, Ellis K. Bone mineral changes in young women with hypothalamic amenorrhea treated with oral contraceptives, medroxyprogesterone, or placebo over 12 months. Am J Obstet Gynecol 1997; 176:1017–1025.
- Sim LA, McGovern L, Elamin MB, Swiglo BA, Erwin PJ, Montori VM. Effect on bone health of estrogen preparations in premenopausal women with anorexia nervosa: a systematic review and meta-analyses. Int J Eat Disord 2010; 43:218–225.
- Golden NH, Lanzkowsky L, Schebendach J, Palestro CJ, Jacobson MS, Shenker IR. The effect of estrogen-progestin treatment on bone mineral density in anorexia nervosa. J Pediatr Adolesc Gynecol 2002; 15:135–143.
- Misra M, Katzman D, Miller KK, et al. Physiologic estrogen replacement increases bone density in adolescent girls with anorexia nervosa. J Bone Miner Res 2011; 26:2430–2438.
- Klibanski A, Biller BM, Schoenfeld DA, Herzog DB, Saxe VC. The effects of estrogen administration on trabecular bone loss in young women with anorexia nervosa. J Clin Endocrinol Metab 1995; 80:898–904.
- Divasta AD, Feldman HA, Giancaterino C, Rosen CJ, Leboff MS, Gordon CM. The effect of gonadal and adrenal steroid therapy on skeletal health in adolescents and young women with anorexia nervosa. Metabolism 2012; 61:1010–1020.
- Mehler PS. Medical complications of bulimia nervosa and their treatments. Int J Eat Disord 2011; 44:95–104.
- Milosevic A. Eating disorders and the dentist. Br Dent J 1999; 186:109–113.
- Greenfeld D, Mickley D, Quinlan DM, Roloff P. Hypokalemia in outpatients with eating disorders. Am J Psychiatry 1995; 152:60–63.
- Bouquegneau A, Dubois BE, Krzesinski JM, Delanaye P. Anorexia nervosa and the kidney. Am J Kidney Dis 2012; 60:299–307.
- Auron M, Rome E. Anorexia nervosa and bulimia nervosa: what the hospitalist needs to know about CPT 269.9, or nutritional insufficiency. ACP Hospitalist 2011 Sept:28–45.
- Steffen KJ, Mitchell JE, Roerig JL, Lancaster KL. The eating disorders medicine cabinet revisited: a clinician’s guide to ipecac and laxatives. Int J Eat Disord 2007; 40:360–368.
- Roerig JL, Steffen KJ, Mitchell JE, Zunker C. Laxative abuse: epidemiology, diagnosis and management. Drugs 2010; 70:1487–1503.
- Mitchell JE, Boutacoff LI. Laxative abuse complicating bulimia: medical and treatment implications. Int J Eat Disord 1986; 5:325–334.
- Joo JS, Ehrenpreis ED, Gonzalez L, et al. Alterations in colonic anatomy induced by chronic stimulant laxatives: the cathartic colon revisited. J Clin Gastroenterol 1998; 26:283–286.
- Drugs.com. Ipecac syrup. www.drugs.com/monograph/ipecac-syrup.html. Accessed January 31, 2014.
- Peveler RC, Bryden KS, Neil HA, et al. The relationship of disordered eating habits and attitudes to clinical outcomes in young adult females with type 1 diabetes. Diabetes Care 2005; 28:84–88.
- Mannucci E, Rotella F, Ricca V, Moretti S, Placidi GF, Rotella CM. Eating disorders in patients with type 1 diabetes: a meta-analysis. J Endocrinol Invest 2005; 28:417–419.
- Crook MA, Hally V, Panteli JV. The importance of the refeeding syndrome. Nutrition 2001; 17:632–637.
- Fisher M, Golden NH, Katzman DK, et al. Eating disorders in adolescents: a background paper. J Adolesc Health 1995; 16:420–437.
- Kohn MR, Madden S, Clarke SD. Refeeding in anorexia nervosa: increased safety and efficiency through understanding the pathophysiology of protein calorie malnutrition. Curr Opin Pediatr 2011; 23:390–394.
- Garber AK, Michihata N, Hetnal K, Shafer MA, Moscicki AB. A prospective examination of weight gain in hospitalized adolescents with anorexia nervosa on a recommended refeeding protocol. J Adolesc Health 2012; 50:24–29.
- Whitelaw M, Gilbertson H, Lam PY, Sawyer SM. Does aggressive refeeding in hospitalized adolescents with anorexia nervosa result in increased hypophosphatemia? J Adolesc Health 2010; 46:577–582.
- Treasure J, Crane A, McKnight R, Buchanan E, Wolfe M. First do no harm: iatrogenic maintaining factors in anorexia nervosa. Eur Eat Disord Rev 2011; 19:296–302.
- Academy for Eating Disorders (AED). Critical points for early recognition and medical risk management in the care of individuals with eating disorders. http://www.aedweb.org/AM/Template.cfm?Section=Medical_Care_Standards&Template=/CM/ContentDisplay.cfm&ContentID=2413. Accessed January 31, 2014.
Eating disorders are debilitating biopsychosocial illnesses associated with serious medical illness and a high risk of death.1
Primary care physicians are often the first to see young women who have these problems, diagnose them, and start their evaluation and treatment.2–4 Many patients require acute medical interventions as well as long-term care for chronic medical issues. Therefore, primary care physicians play essential front-line and long-term roles in the multidisciplinary treatment team.
DEFINITIONS OF EATING DISORDERS HAVE CHANGED
Several problems existed in the category of eating disorders in the fourth edition of the Diagnostic and Statistical Manual of Mental Disorders (DSM-4) and in the DSM-4 Text Revision (DSM-4-TR). These problems have been addressed in the fifth edition (DSM-5), released in 2013.5
One problem in the earlier editions was that many patients referred for treatment of eating disorders—more than 50% in one study6—did not meet the criteria for anorexia nervosa or bulimia nervosa and thus had to be categorized as having “eating disorder not otherwise specified.” Further, the earlier editions did not recognize that young children and adolescent males can be affected.7
Eating disorders are now recognized as an equal-opportunity disease, with all ethnic and socioeconomic groups affected. Children can run into medical trouble with even a small amount of weight loss or falling off the growth curve. Moreover, children and adolescents do not “experience” their bodies in the same way adults do; they may lack the vocabulary for eating-disorder thoughts.
For these reasons, the definitions of eating disorders have changed in the DSM-5.5
Anorexia nervosa. Older editions of the DSM listed amenorrhea as a criterion. This has been eliminated in DSM-5, since amenorrhea does not necessarily predict medical risk or treatment outcome; also, it is not applicable to males or premenorrheal girls and postmenopausal women.8 In addition, the requirement of low weight is now defined in the context of “age, sex, developmental trajectory, and physical health,” rather than the old threshold of 85% of expected weight.9
What remains unchanged is that anorexia nervosa is still characterized by self-starvation in order to maintain an abnormally low body weight, along with an intense fear of being fat and a disturbed self-image.
Bulimia nervosa. In both the old and the new editions of the DSM, bulimia nervosa is characterized by episodes of binge eating followed by inappropriate compensatory behaviors to avoid weight gain, such as vomiting, laxative abuse, diuretic abuse, and overexercise. In DSM-5, bulimia nervosa no longer has subtypes and requires only one binge per week with compensatory behavior, for at least 3 months. This change was based on the finding that there is no clear difference in psychopathology or treatment outcome between patients with one and two binge-purge episodes a week.10
“Eating disorder not otherwise specified” was a wastebasket category, lumping all those who did not meet the criteria for anorexia nervosa or bulimia nervosa or who did not neatly fit into a specific category.10 In DSM-5, subcategories were designed to help distinguish different treatment needs and outcomes between various subtypes.
Binge-eating disorder, one of the new subcategories, is characterized by binge eating without inappropriate compensatory behaviors.9 Patients with binge-eating disorder are often obese, have greater functional impairment, and are more likely to develop components of metabolic syndrome than obese patients without eating disorders.11
Avoidant/restrictive food intake disorder is another new DSM-5 diagnosis, characterized by failure to meet nutritional needs for reasons other than weight control. Reasons include disinterest in eating, dislike of sensory characteristics of food, or avoidance of consequences of eating. This disorder replaces the category “feeding disorder of infancy or early childhood,” since the condition can also occur in adolescents and adults.12
Other new diagnoses are:
- Atypical anorexia nervosa (if the patient is not underweight)
- Purging disorder
- Subthreshold bulimia nervosa (if the patient has < 1 episode per week or has had them for < 3 months)
- Subthreshold binge eating disorder (< 1 time a week or < 3 months)
- Night eating syndrome
- Pica and rumination disorder.
Regardless of the diagnostic label, the medical evaluation and treatment of anyone with an eating disorder should be tailored to the specific behaviors of the eating disorder. Medical complications can be subdivided into those from starvation, from purging, and from refeeding.
MEDICAL COMPLICATIONS OF STARVATION
Cardiovascular effects of starvation
Malnutrition and starvation have multiple adverse effects on the heart.
Electrophysiologic effects. Sinus bradycardia (< 60 bpm) and hypotension are common cardiac manifestations of starvation.13 Bradycardia has been attributed to an adaptive increase in parasympathetic vagal tone.14 QTc prolongation is also seen in patients with malnutrition.15
Together, these electrocardiographic abnormalities predispose the patient to ventricular arrhythmia and sudden cardiac death.16 The risk of ventricular arrhythmia is particularly relevant when treating psychiatric symptoms, since antipsychotics and tricyclic antidepressants are among several drug classes that can cause further QTc prolongation (Table 1).17,18
In patients with QTc prolongation, bradycardia, or both, the standard of care involves acute hospitalization for refeeding using continuous telemetric monitoring until normal rhythm is restored and the heart rate is above 40 at night and 50 by day.4,19
Structural changes. Starvation also causes structural changes in the heart. Loss of lean body mass can reduce cardiac muscle mass, compromise cardiac output, and lead to mitral valve prolapse.20 These changes are fully reversible with restored nutrition and regaining of heart mass.21,22
Effects of starvation on the brain
Starvation can affect brain structure and cognitive function. Undernourished patients have reduced volumes of white and gray matter, a change that can occur within months. Cortical volumes may increase with weight gain, but a reduction in gray matter volume may not be completely reversible.23
Furthermore, starvation impairs cognitive functions that are needed to stop eating-disorder behaviors; namely, decision-making, emotional control, regulation of appetite, and reward path-ways. Therefore, undernourished patients may not have sufficient insight into the disease to be able to make the best choices for recovery. This finding lends support for using the Maudsley method in adolescents, in which parents take control of their child’s eating until the child can maintain a healthy weight.24
Gastrointestinal consequences of starvation
Patients with malnutrition have prolonged gastric emptying and colonic transit time with solid foods.25 They often complain of early satiety, abdominal pain, bloating, and constipation, all symptoms that complicate the refeeding process. A prokinetic such as metoclopramide (Reglan), given 1 hour before meals and at bedtime, may provide some relief from gastrointestinal symptoms.26
Patients may also experience transient lactose or fructose intolerance after prolonged starvation. Taking a lactase supplement (eg, Lactaid 1–10 tabs) before consuming dairy products and dextrose (contained in candies such as Smarties) before eating fruit or fructose-containing foods can sometimes partially relieve symptoms. In general, gastrointestinal function returns over time as nutritional status improves.
Patients with severe or prolonged starvation can develop steatosis accompanied by elevated levels of aspartate aminotransferase (AST) and alanine aminotransferase (ALT). In reports of starvation-induced steatosis, liver enzyme levels rapidly normalize with nutritional rehabilitation.27
Endocrine consequences of starvation
Amenorrhea. Dysregulation of the hypothalamic-pituitary-gonadal axis is a major endocrine complication of nutritional in-sufficiency. Weight loss disrupts the normal pulsatile secretion of gonadotropin-releasing hormone, reduces secretion of luteinizing hormone and follicle-stimulating hormone, and decreases estrogen levels.28 Leptin deficiency likely plays a role in suppressing gonadotropin secretion with subsequent development of amenorrhea. With weight gain, levels of leptin and gonadotropins normalize and menstruation eventually returns.29,30
Hypothyroidism. Starvation can also lead to dysregulation of the hypothalamic-pituitary-thyroid axis. Typically, the concentration of triiodothyronine (T3) is reduced, the ratio of thyroxine (T4) to T3 is elevated, and thyroid-stimulating hormone (TSH) is close to or within the normal range, creating a euthyroid sick syndrome. In eating disorders, this thyroid disturbance is a result of starvation and resolves with weight restoration. Therefore, thyroid hormone replacement therapy is not medically indicated.28
Osteoporosis. Amenorrhea resulting from low estrogen levels in undernourished patients can raise the risk of osteoporosis and fractures, particularly in patients with a low body mass index. Osteopenia results from a negative balance between bone deposition and resorption.
Lack of bone deposition can be especially problematic when disordered eating occurs during peak bone mass development, ie, ages 11 to 14 for girls, and ages 15 to 17 for boys.31,32 Even a 5% to 10% decrease in bone deposition can result in significant risk of osteopenia.33 However, after age 30, bone resorption is a greater contributor.34
Does hormone therapy correct bone loss? Given the association between estrogen deficiency and bone loss, estrogen supplementation was expected to be an effective treatment for bone loss in patients with eating disorders.35 Also, the restoration of menses through hormone replacement may give underweight patients a false sense of achieving a “healthy” weight.36
Golden et al37 prospectively studied 50 adolescents and found no significant difference in bone mineral density at 1 year of follow-up between patients treated with estrogen and those who received only standard nutritional therapy. However, increased bone mineral density was achieved in adolescents with anorexia nervosa treated with transdermally administered estrogen dosed to mimic physiologic pubertal levels.38
Klibanski et al39 found that hormone therapy resulted in a 4% gain in bone density in an extremely low-weight subset of women with anorexia nervosa (< 70% of ideal body weight), whereas similar patients in the control group lost 20%. However, in all groups, only weight gain correlated with bone gain in women who were within 70% of their ideal body weight.
Divasta et al40 evaluated 60 girls and women ages 13 to 27 with anorexia nervosa, randomized to receive either placebo or dehydroepiandrosterone combined with an estrogen-progestin oral contraceptive, and followed for 18 months. As in the study by Klibanski et al,39 bone loss was prevented in the treatment group, but significant bone gain occurred only in the context of weight gain.
The bottom line is that only weight gain has resulted in significant increases in bone density in patients with anorexia nervosa, and hormone therapy without weight gain has not been shown to increase bone density effectively in this population. Although calcium and vitamin D in oral therapeutic doses through foods or through supplementation are required for bone gain, the combination is not enough to augment bone density in the absence of weight gain.37 Although not curative, weight gain is currently the best option for treating bone loss, and no single pharmacologic treatment is effective.
COMPLICATIONS OF PURGING
Oral complications of purging
Patients who purge by vomiting are at risk of complications from exposure of the esophagus, pharynx, and mouth to acidic gastric contents.
Dental problems. Over time, contact with gastric acid wears down enamel on the lingual and occlusal surfaces of teeth, resulting in dental caries and periodontal disease. Until they can give up purging, patients should be instructed to rinse with mouthwash or water immediately after vomiting to reduce the acidity in the mouth.41,42 We recommend that patients not brush their teeth after vomiting, because brushing can deliver acid to otherwise unreachable surfaces and thus worsen tooth erosion. For patients who are determined to brush after vomiting, a bicarbonate toothpaste might mitigate harm.42
Sialadenosis (hypertrophy of the salivary glands) is another consequence of repeated vomiting, with elevated salivary amylase. Both the size of the glands and the salivary amylase level generally normalize on their own after vomiting is stopped, but parotitis can take up to a year to resolve. Similar to smoker’s cough, parotitis may acutely worsen when the patient abruptly stops vomiting and may worsen before it improves.
To reduce discomfort, patients can use hot compresses or sugarless hard candies.44 However, the latter should not be substituted as a chronic habit in a patient with disordered eating. Patients need to be reassured that the swelling is not permanent, since they often interpret it as having fat cheeks (the “chipmunk sign”).
Hypokalemia, metabolic alkalosis, renal dysfunction
Chronic vomiting can cause electrolyte and acid-base imbalances, the most worrisome of which is hypokalemia. With repeated vomiting, loss of potassium and gastric acid causes metabolic alkalosis with hypokalemia, hypochloremia, and hypomagnesemia. Loss of water and the resultant volume contraction activates the renin-angiotensin-aldosterone system, and elevated aldosterone further decreases serum potassium.
In patients with eating disorders, who often have other factors contributing to electrolyte imbalance, vomiting-induced hypokalemia heightens the risk of cardiac arrhythmias.43
Hypokalemia can also cause rhabdomyolysis and kidney damage.41,43 Prolonged hypokalemia and reduced kidney perfusion in the setting of volume depletion causes acute kidney injury and impaired concentrating ability of the renal tubules. Hypovolemia can cause prerenal azotemia and increases the risk for nephrolithiasis and nephrocalcinosis.44,45
When a patient stops vomiting, elevated aldosterone from prior hypovolemia results in water retention and can manifest in significant edema associated with hypochloremic alkalosis. This condition, known as pseudo-Bartter syndrome, usually resolves without treatment. In the meantime, salt restriction and leg elevation can help reduce edema.26
Laxative abuse: A mode of purging
Many patients with eating disorders abuse laxatives to lose weight or to prevent weight gain. Believing that laxatives will prevent calorie absorption, patients commonly take them to compensate for caloric intake (eg, during a binge episode). The immediate weight loss, albeit artificial, is highly reinforcing for an eating-disorder patient. In some cases, patients with eating disorders also abuse laxatives to self-treat the constipation that results from chronic starvation.46
Over time, tolerance to laxatives develops, and patients use increasingly larger doses. This can lead to activation of the renin-angiotensin-aldosterone system.47 Patients interpret the resultant edema as true weight gain and again take laxatives to get rid of it. If laxatives are stopped abruptly, the patient may need inpatient and outpatient support for the resultant fluid shifts.
Gastrointestinal complications of laxative abuse include reflex hypofunction of the bowel, malabsorption, steatorrhea, and gastrointestinal bleeding.47 Reflex hypofunction during laxative withdrawal is a consequence of the bowel becoming tolerant of laxatives.48 Cathartic colon syndrome is a rare complication characterized by loss of the normal haustral markings and slowed or absent peristalsis in segments of the colon.49
Systemically, the major risk of laxative abuse relates to electrolyte and acid-base imbalance. Loss of potassium and water in the stool can cause hypokalemia and metabolic alkalosis.48 The disturbances caused by laxative abuse are similar to those caused by vomiting and diuretic use and have the same treatment.
The most important component of treating laxative abuse is giving patients realistic expectations to help them tolerate temporary discomfort and to help manage the edema and fluid shifts that can happen acutely with shifting of fluid into the intracellular space. In extreme cases, this may need to be managed in the hospital. To help relieve the initial anxiety, doctors should emphasize that any bloating the patient experiences is not true weight gain and will go away within a few days to weeks. In addition, explaining that laxatives reduce nutrient absorption only minimally may lessen the temptation to resume taking them.48
Diuretic abuse: Another form of purging
Diuretic abuse is yet another mode of purging, with its own set of medical complications. Like laxatives, diuretics are not effective weight-loss agents, and the weight reduction they cause is only temporary.
As with vomiting, there is a compensatory activation of the renin-angiotensin-aldosterone system, and therefore subsequent fluid intake will lead to water retention, which encourages further diuretic use.41 Diuretics can also contribute to hypokalemia, hypomagnesemia, hypochloremia, and metabolic alkalosis.
Ipecac abuse can lead to heart failure
Ipecac syrup has long been used to induce vomiting, but this practice has become much less common since ipecac has become harder to obtain in the United States.50 The emetine base contained in ipecac binds irreversibly to cardiac and skeletal muscle. With continued use, irreversible cardiomyopathy develops and can lead to heart failure. Treatment should include supportive care and immediate cessation of ipecac use.
Diabetic patients may skip insulin to lose weight
Patients with diabetes, especially those with type 1 that begins in childhood, are at greater risk of eating disorders over time.51 They may withhold insulin to lose weight, a practice referred to in the nonmedical literature as “diabulimia,” and they seem particularly more likely to develop bulimia nervosa than those without diabetes.52
The medical prognosis is poor for patients with diabetes who develop eating disorders and do not receive intensive treatment.51 In addition, if a diabetic patient on an insulin pump becomes depressed in addition to having an eating disorder, careful monitoring for suicidal thoughts and a rapid follow-up with mental health services are in order.
REFEEDING SYNDROME
When refeeding is started, a high glucose load stimulates insulin secretion, resulting in cellular uptake of phosphorus along with potassium, magnesium, and glucose. In addition, total body phosphorus is depleted by the increased demand for adenosine triphosphate and 2,3-diphosphoglycerate for cellular metabolism.
When liver enzyme levels increase, the astute clinician will closely monitor the patient for evidence of refeeding syndrome. In a child, adolescent, or young adult, the standard of care is inpatient monitoring for acute stabilization.4,19
Hypophosphatemia is the hallmark of refeeding syndrome, although hypomagnesemia, hypokalemia, and hypoglycemia can also occur.53 In addition, sodium and water retention can lead to fluid overload, with shifting of fluid into the intracellular space, resulting in dependent edema.
Cardiovascular complications are the most worrisome manifestations of refeeding syndrome. Electrolyte shifts and increased fluid volume can cause arrhythmias and heart failure. Furthermore, severely undernourished patients may have reduced myocardial mass as well as electrocardiographic abnormalities associated with starvation, which further increase their vulnerability to electrolyte shifts and fluid retention during refeeding.15
Other manifestations of refeeding syndrome include delirium, seizures, rhabdomyolysis, and respiratory failure. In the most extreme cases, refeeding syndrome causes sudden death.53
Fortunately, refeeding syndrome is easily preventable and treatable when recognized early. Electrolytes and cardiovascular and renal function must be carefully monitored, especially during the first week of nutritional restoration.53 In patients with extremely low body mass (< 70% of ideal body weight) or with precipitous weight loss, close monitoring of the complete metabolic panel including electrolytes, AST, ALT, calcium, magnesium, and phosphorus may be required to detect changes that can affect cardiac status. Specific suggestions for refeeding are discussed below and in Table 2.45
ACUTE CARE OF PATIENTS WITH EATING DISORDERS
Refeeding in the inpatient setting
The decision to hospitalize an eating-disorder patient is based on the current or potential risk of serious medical complications and the likelihood of success at home. Medical criteria for hospital admission are outlined in Table 3.4,54
In refeeding undernourished patients, the challenge is to maximize weight gain while preventing refeeding syndrome. Undernourished patients are generally hypometabolic at baseline but become hypermetabolic once refeeding begins.
How many calories should refeeding start with? The traditional principle of “start low and go slow” has been recently challenged.55 Starting at 1,200 kcal/day or less in the typical patient can result in failure to gain weight or even in weight loss in the first week of refeeding.56 The goal is to achieve a weight gain of 0.2 kg/day while the patient is in the hospital. Thus, we start higher, and to date we have seen no cases of life-threatening refeeding syndrome. In all patients who need hospitalization or who are beginning the refeeding process as outpatients, caloric intake should be started at 1,500 to 2,000 kcal/day.45,57 However, for exceptionally low-weight patients, intake may be started lower.
In Australia, patients are started at 1,900 kcal/day.56 All patients in one program there receive nasogastric feeding initially in an intensive care unit and then are moved to a regular nursing floor where they graduate to full oral feeding as they improve cardiovascularly and behaviorally. In the United States, some programs use nasogastric feeding at night for caloric restoration; our program and others use nasogastric feeding as a behavioral modification strategy for patients who refuse food or supplements by mouth.
Phosphorus supplementation. Many centers give phosphorus supplements preventively. In our center, we give potassium phosphate (Neutra-Phos) 500 mg orally twice daily for 5 days, and we have seen no life-threatening cases of refeeding syndrome with that regimen. Other centers give phosphorus supplements in a dose of 250 mg orally twice a day for 5 days, while still others only supplement phosphorus reactively once a deficit has been identified. The latter method requires daily blood draws for monitoring and is reactive rather than proactive. Further studies can help clarify the optimal dosing and timing of phosphorus supplementation.
Managing fluid balance. Fluid-loading these patients may tip them over the edge into refeeding syndrome. Except in cases of shock, patients with eating disorders should not be given intravenous fluids, as it is safer to rehydrate and feed them orally. Electrolyte imbalances can be corrected orally with no need for intravenous supplementation. To avoid fluid overload, fluids can be started at 1,500 mL to 2,000 mL per day, with strict monitoring of intake and output. Fluids are liberalized if ALT and AST levels remain normal and to gradually correct orthostatic hypotension; caloric fluids are ideal to help address energy needs and improve bradycardia.
Laboratory monitoring. On admission, a urinalysis, complete blood cell count, complete metabolic panel, TSH, erythrocyte sedimentation rate, serum magnesium, and phosphorus should be obtained.26 In addition, continuous electrocardiographic recording should begin on admission.45 Inpatient use of a telemetry bed helps identify extreme tachycardia with arrhythmia, as well as profound bradycardia.45,56
Some protocols call for daily laboratory monitoring, although that degree of testing is less cost-effective. If initial results are normal, clinical judgment can be used on when to repeat laboratory evaluation. For instance, patients with edema require repeat complete metabolic panels to assess for elevated ALT and AST, electrolyte imbalances, and other abnormalities.
Signs of refeeding syndrome include tachycardia, hepatosplenomegaly, peripheral edema, altered mental status, and electrolyte disturbances, specifically, acute or severe hypophosphatemia or hypokalemia.26,45 If refeeding syndrome is suspected, the rate of caloric intake should be reduced or not advanced, fluid intake should be urgently reassessed for volume overload, and supportive care with close monitoring should be provided.
KNOWLEDGE SAVES LIVES
Eating disorders can lead to potentially life-threatening medical complications that require attentive care by the primary care clinician and subspecialist. Without thoughtful consideration, it is easy for even a caring medical team to unintentionally enable patients with these illnesses or to cause active harm in the case of underrecognized pathology.58
Acute medical stabilization on an inpatient unit trained to recognize pathology and treat sequelae can be lifesaving. Arming patients and families with medical knowledge, as provided in the Academy for Eating Disorders’ brochure, “Critical Points for Early Recognition and Medical Risk Management in the Care of Individuals with Eating Disorders”59 can help save patients’ lives.
- Arcelus J, Mitchell AJ, Wales J, Nielsen S. Mortality rates in patients with anorexia nervosa and other eating disorders. A meta-analysis of 36 studies. Arch Gen Psychiatry 2011; 68:724–731.
- Walsh JM, Wheat ME, Freund K. Detection, evaluation, and treatment of eating disorders the role of the primary care physician. J Gen Intern Med 2000; 15:577–590.
- American Academy of Pediatrics; Committee on Adolescence. Identifying and treating eating disorders. Pediatrics 2003; 111:204–211.
- Rosen DS; American Academy of Pediatrics Committee on Adolescence. Identification and management of eating disorders in children and adolescents. Pediatrics 2010; 126:1240–1253.
- American Psychiatric Association. Diagnostic and Statistical Manual of Mental Disorders. 5th edition. Arlington, VA: American Psychiatric Publishing, Incorporated; 2013.
- Eddy KT, Celio Doyle A, Hoste RR, Herzog DB, le Grange D. Eating disorder not otherwise specified in adolescents. J Am Acad Child Adolesc Psychiatry 2008; 47:156–164.
- Muise AM, Stein DG, Arbess G. Eating disorders in adolescent boys: a review of the adolescent and young adult literature. J Adolesc Health 2003; 33:427–435.
- Attia E, Roberto CA. Should amenorrhea be a diagnostic criterion for anorexia nervosa? Int J Eat Disord 2009; 42:581–589.
- American Psychiatric Association. Diagnostic and Statistical Manual of Mental Disorders, fifth edition. http://dsm.psychiatryonline.org/content.aspx?bookid=556§ionid=41101776#103439089. Accessed January 31, 2014.
- Wilfley DE, Bishop ME, Wilson GT, Agras WS. Classification of eating disorders: toward DSM-V. Int J Eat Disord 2007; 40:S123–S129.
- Wonderlich SA, Gordon KH, Mitchell JE, Crosby RD, Engel SG. The validity and clinical utility of binge eating disorder. Int J Eat Disord 2009; 42:687–705.
- Ornstein RM, Rosen DS, Mammel KA, et al. Distribution of eating disorders in children and adolescents using the proposed DSM-5 criteria for feeding and eating disorders. J Adolesc Health 2013: 53:303–305.
- Winston AP, Stafford PJ. Cardiovascular effects of anorexia nervosa. Eur Eat Disord Rev 2000; 8:117–125.
- Galetta F, Franzoni F, Prattichizzo F, Rolla M, Santoro G, Pentimone F. Heart rate variability and left ventricular diastolic function in anorexia nervosa. J Adolesc Health 2003; 32:416–421.
- McCallum K, Bermudez O, Ohlemeyer C, Tyson E, Portilla M, Ferdman B. How should the clinician evaluate and manage the cardiovascular complications of anorexia nervosa? Eat Disord 2006; 14:73–80.
- Akhtar M. Clinical spectrum of ventricular tachycardia. Circulation 1990; 82:1561–1573.
- Beach SR, Celano CM, Noseworthy PA, Januzzi JL, Huffman JC. QTc prolongation, torsades de pointes, and psychotropic medications. Psychosomatics 2013; 54:1–13.
- The University of Arizona Center for Education and Research on Therapeutics. QT Drug Lists. http://crediblemeds.org/everyone/compos-ite-list-all-qtdrugs/?rf=US. Accessed January 31, 2014.
- Rome ES, Ammerman S. Medical complications of eating disorders: an update. J Adolesc Health 2003; 33:418–426.
- Romano C, Chinali M, Pasanisi F, et al. Reduced hemodynamic load and cardiac hypotrophy in patients with anorexia nervosa. Am J Clin Nutr 2003; 77:308–312.
- Shamim T, Golden NH, Arden M, Filiberto L, Shenker IR. Resolution of vital sign instability: an objective measure of medical stability in anorexia nervosa. J Adolesc Health 2003; 32:73–77.
- Mont L, Castro J, Herreros B, et al. Reversibility of cardiac abnormalities in adolescents with anorexia nervosa after weight recovery. J Am Acad Child Adolesc Psychiatry 2003; 42:808–813.
- Roberto CA, Mayer LE, Brickman AM, et al. Brain tissue volume changes following weight gain in adults with anorexia nervosa. Int J Eat Disord 2011; 44:406–411.
- Treasure J, Russell G. The case for early intervention in anorexia nervosa: theoretical exploration of maintaining factors. Br J Psychiatry 2011; 199:5–7.
- Hadley SJ, Walsh BT. Gastrointestinal disturbances in anorexia nervosa and bulimia nervosa. Curr Drug Targets CNS Neurol Disord 2003; 2:1–9.
- Yager J, Andersen AE. Clinical practice. Anorexia nervosa. N Engl J Med 2005; 353:1481–1488.
- De Caprio C, Alfano A, Senatore I, Zarrella L, Pasanisi F, Contaldo F. Severe acute liver damage in anorexia nervosa: two case reports. Nutrition 2006; 22:572–575.
- Lawson EA, Klibanski A. Endocrine abnormalities in anorexia nervosa. Nat Clin Pract Endocrinol Metab 2008; 4:407–414.
- Holtkamp K, Mika C, Grzella I, et al. Reproductive function during weight gain in anorexia nervosa. Leptin represents a metabolic gate to gonadotropin secretion. J Neural Transm 2003; 110:427–435.
- Golden NH, Jacobson MS, Schebendach J, Solanto MV, Hertz SM, Shenker IR. Resumption of menses in anorexia nervosa. Arch Pediatr Adolesc Med 1997; 151:16–21.
- Soyka LA, Misra M, Frenchman A, et al. Abnormal bone mineral accrual in adolescent girls with anorexia nervosa. J Clin Endocrinol Metab 2002; 87:4177–4185.
- Misra M, Klibanski A. Bone metabolism in adolescents with anorexia nervosa. J Endocrinol Invest 2011; 34:324–332.
- Recker RR, Davies KM, Hinders SM, Heaney RP, Stegman MR, Kimmel DB. Bone gain in young adult women. JAMA 1992; 268:2403–2408.
- Biller BM, Saxe V, Herzog DB, Rosenthal DI, Holzman S, Klibanski A. Mechanisms of osteoporosis in adult and adolescent women with anorexia nervosa. J Clin Endocrinol Metab 1989; 68:548–554.
- Hergenroeder AC, Smith EO, Shypailo R, Jones LA, Klish WJ, Ellis K. Bone mineral changes in young women with hypothalamic amenorrhea treated with oral contraceptives, medroxyprogesterone, or placebo over 12 months. Am J Obstet Gynecol 1997; 176:1017–1025.
- Sim LA, McGovern L, Elamin MB, Swiglo BA, Erwin PJ, Montori VM. Effect on bone health of estrogen preparations in premenopausal women with anorexia nervosa: a systematic review and meta-analyses. Int J Eat Disord 2010; 43:218–225.
- Golden NH, Lanzkowsky L, Schebendach J, Palestro CJ, Jacobson MS, Shenker IR. The effect of estrogen-progestin treatment on bone mineral density in anorexia nervosa. J Pediatr Adolesc Gynecol 2002; 15:135–143.
- Misra M, Katzman D, Miller KK, et al. Physiologic estrogen replacement increases bone density in adolescent girls with anorexia nervosa. J Bone Miner Res 2011; 26:2430–2438.
- Klibanski A, Biller BM, Schoenfeld DA, Herzog DB, Saxe VC. The effects of estrogen administration on trabecular bone loss in young women with anorexia nervosa. J Clin Endocrinol Metab 1995; 80:898–904.
- Divasta AD, Feldman HA, Giancaterino C, Rosen CJ, Leboff MS, Gordon CM. The effect of gonadal and adrenal steroid therapy on skeletal health in adolescents and young women with anorexia nervosa. Metabolism 2012; 61:1010–1020.
- Mehler PS. Medical complications of bulimia nervosa and their treatments. Int J Eat Disord 2011; 44:95–104.
- Milosevic A. Eating disorders and the dentist. Br Dent J 1999; 186:109–113.
- Greenfeld D, Mickley D, Quinlan DM, Roloff P. Hypokalemia in outpatients with eating disorders. Am J Psychiatry 1995; 152:60–63.
- Bouquegneau A, Dubois BE, Krzesinski JM, Delanaye P. Anorexia nervosa and the kidney. Am J Kidney Dis 2012; 60:299–307.
- Auron M, Rome E. Anorexia nervosa and bulimia nervosa: what the hospitalist needs to know about CPT 269.9, or nutritional insufficiency. ACP Hospitalist 2011 Sept:28–45.
- Steffen KJ, Mitchell JE, Roerig JL, Lancaster KL. The eating disorders medicine cabinet revisited: a clinician’s guide to ipecac and laxatives. Int J Eat Disord 2007; 40:360–368.
- Roerig JL, Steffen KJ, Mitchell JE, Zunker C. Laxative abuse: epidemiology, diagnosis and management. Drugs 2010; 70:1487–1503.
- Mitchell JE, Boutacoff LI. Laxative abuse complicating bulimia: medical and treatment implications. Int J Eat Disord 1986; 5:325–334.
- Joo JS, Ehrenpreis ED, Gonzalez L, et al. Alterations in colonic anatomy induced by chronic stimulant laxatives: the cathartic colon revisited. J Clin Gastroenterol 1998; 26:283–286.
- Drugs.com. Ipecac syrup. www.drugs.com/monograph/ipecac-syrup.html. Accessed January 31, 2014.
- Peveler RC, Bryden KS, Neil HA, et al. The relationship of disordered eating habits and attitudes to clinical outcomes in young adult females with type 1 diabetes. Diabetes Care 2005; 28:84–88.
- Mannucci E, Rotella F, Ricca V, Moretti S, Placidi GF, Rotella CM. Eating disorders in patients with type 1 diabetes: a meta-analysis. J Endocrinol Invest 2005; 28:417–419.
- Crook MA, Hally V, Panteli JV. The importance of the refeeding syndrome. Nutrition 2001; 17:632–637.
- Fisher M, Golden NH, Katzman DK, et al. Eating disorders in adolescents: a background paper. J Adolesc Health 1995; 16:420–437.
- Kohn MR, Madden S, Clarke SD. Refeeding in anorexia nervosa: increased safety and efficiency through understanding the pathophysiology of protein calorie malnutrition. Curr Opin Pediatr 2011; 23:390–394.
- Garber AK, Michihata N, Hetnal K, Shafer MA, Moscicki AB. A prospective examination of weight gain in hospitalized adolescents with anorexia nervosa on a recommended refeeding protocol. J Adolesc Health 2012; 50:24–29.
- Whitelaw M, Gilbertson H, Lam PY, Sawyer SM. Does aggressive refeeding in hospitalized adolescents with anorexia nervosa result in increased hypophosphatemia? J Adolesc Health 2010; 46:577–582.
- Treasure J, Crane A, McKnight R, Buchanan E, Wolfe M. First do no harm: iatrogenic maintaining factors in anorexia nervosa. Eur Eat Disord Rev 2011; 19:296–302.
- Academy for Eating Disorders (AED). Critical points for early recognition and medical risk management in the care of individuals with eating disorders. http://www.aedweb.org/AM/Template.cfm?Section=Medical_Care_Standards&Template=/CM/ContentDisplay.cfm&ContentID=2413. Accessed January 31, 2014.
KEY POINTS
- The fifth edition of the Diagnostic and Statistical Manual of Mental Disorders (DSM-5), released in 2013, has updated the criteria for some eating disorders and has added some new disorders.
- Starvation can cause cardiac, cerebral, gastrointestinal, and endocrine problems.
- Purging can lead to problems with oral health, electrolyte imbalances, and even renal failure.
- Refeeding poses the risk of refeeding syndrome, with fluid overload and electrolyte imbalances. Many patients undergoing refeeding are best managed in the hospital.
HM14 Special Report: Setting up Your QI Project for Success: Organizational Imperatives, Data Collection, Implementation Strategy
Quality improvement (QI) is about system change for the entire organization. In a session at HM14, Michelle Mourad, MD, and Nasim Afsar, MD, SFHM, outlined QI principles and a systematic step-wise process that can create and sustain change successfully in our hospitals.
QI principles include creating a sense of urgency, implementation, and sustainability. The seven steps for a successful QI project are as follows: understand the problem, convince others there is a problem, identify areas of improvement, prioritize a small test of change, devise a measurement strategy, measure change, and sustain change.
Understanding the problem includes creating a fishbone diagram that helps you identify the causes of your problem. Convincing others requires presentation of inspiring data and telling your story.
Dr. Mourad encouraged the audience to use personal anecdotes and focus on the ‘why,’ not the ‘what’ or ‘how’ to relate to others on a personal level. Identifying areas of improvement requires creation of a process map to identify obstacles that can be removed. “Your goal is to make systems work for people,” said Dr. Mourad. Ask people to tell you how the process will work better for them.
Prioritizing small tests of change requires identifying low-effort, high-impact tasks that will lead to easy wins. “Don’t do the thankless tasks that are high-effort with low impact,” said Dr. Afsar. She further encouraged physicians to perform small tests of change to help understand if their ideas are worthy of large scale implementation.
Plan-Do-Study-Act (PDSA) and A3 methodology are two methods by which a QI project can be organized for implementation. Devising a measurement strategy requires collecting data from appropriate sources in the hospital to ensure improved outcomes as a result of interventions performed. Outcomes, structure, and process are the areas in which results can be measured.
Coaching your team is an important part of motivating your team for continued progress. Change can be concretely measured and plotted over time via statistical process control charts (download SPC macros in Excel to plot graphs).
Lastly, sustaining change requires celebrating success. Dr. Afsar cautioned the audience to set appropriate expectations and goals to sustain system change. Further, once the change is set in motion, put the process ownership into the group (not on you). Creating data that is readily accessible and visible to the group helps them understand progress over time. Design the process to fit into natural workflow to make the process an easy transition that is sustainable long-term.
Key Points
• QI is a four legged stool: education, data audit and feedback, systems change, and culture change;
• Create a fishbone diagram to understand the cause and the effect;
• Create a sense of urgency by sharing inspirational data and finding your story and focusing on the why;
• Use process maps to identify areas of improvement;
• Prioritize those areas and implement small tests of change;
• Measure all outcomes and use statistical process control charts to demonstrate change;
• Motivate and coach people throughout the process change;
• Make data easily accessible to all members of the group to track progress; and
• Sustain change by setting realistic expectations and celebrating success.
Dr. Kanikkannan is Hospitalist Medical Director and Assistant Professor of Medicine at Rowan University School of Osteopathic Medicine and is a member of Team Hospitalist.