User login
Transfusion strategy appears to impact death patterns
![]()
Credit: UAB Hospital
A change in transfusion protocol has resulted in fewer potentially preventable deaths among soldiers, researchers have reported in JAMA Surgery.
In 2006, hospitals treating soldiers from Iraq and Afghanistan implemented a protocol called damage control resuscitation (DCR).
It involves administering blood products early and in a balanced ratio, using an aggressive approach to correct coagulopathy, and minimizing the use of crystalloid fluids.
The research showed that soldiers who died in the hospital after DCR was implemented were more likely than their predecessors to be severely injured and have a severe brain injury.
And this is consistent with a decrease in potentially preventable deaths, according to study author Nicholas R. Langan, MD, of the Madigan Army Medical Center in Tacoma, Washington, and his colleagues.
To conduct the study, the researchers reviewed data from the Joint Theater Trauma Registry of US forward combat hospitals. This included 57,179 soldiers, 2565 (4.5%) of whom died in the hospital. Seventy-four percent of these patients were severely injured, and 80% died within 24 hours of admission.
To assess the impact of DCR, the researchers divided patients into 2 groups: those treated before DCR implementation, from 2002 through 2005, and those treated with the DCR protocol, from 2006 through 2011.
The analysis showed that DCR policies were successfully implemented. There was a significant decrease in mean crystalloid infusion volume in the first 24 hours after hospitalization, from 6.1 L to 3.2 L (P<0.05).
There was a significant increase in fresh-frozen plasma use—from 3.2 U to 10.1 U (P=0.01)—and packed red blood cell use—from 8.4 U to 11.4 U (P=0.01)—in the first 24 hours after hospitalization.
And the mean ratio of packed red blood cells to fresh-frozen plasma changed from 2.6:1 in the pre-DCR period to 1.4:1 during the DCR period (P<0.01).
On the other hand, there was no significant difference in cryoprecipitate use, platelet use, or the ratio of packed red blood cells to cryoprecipitate or platelets.
The change in treatment protocol was associated with a change in the incidence of early and late, but not intermediate, deaths. The incidence of early death (within the first 24 hours) increased from 77% pre-DCR to 80% during DCR (P=0.02).
The incidence of late death (more than 7 days after injury) decreased from 10% pre-DCR to 6% during DCR (P<0.01). And the rate of intermediate death (1-7 days after injury) measured 13% for both periods (P=0.95).
The percentage of patients with any severe injury increased significantly from the pre-DCR period to the DCR period, from 64% to 80% (P<0.05). And the percentage of patients with severe head injuries increased significantly, from 57% to 73% (P<0.05).
As patients who died during the DCR period were more likely to have such “nonsurvivable” wounds, the researchers said this suggests that DCR is associated with a decrease in deaths among potentially salvageable patients. ![]()
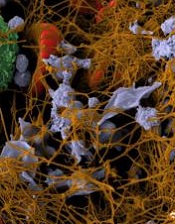
Protein map may point to new cancer treatments

the endoplasmic reticulum
in green, mitochondria in red,
and chromosomes in blue
Credit: Wellcome Images
Researchers say they’ve uncovered the structure of one of the most important protein complexes involved in cell division, and their finding has implications for cancer treatment.
The team mapped the anaphase-promoting complex (APC/C), which performs a wide range of tasks associated with mitosis.
The researchers believe that seeing APC/C in unprecedented detail could transform our understanding of how cells divide and reveal binding sites for future cancer drugs.
“It’s very rewarding to finally tie down the detailed structure of this important protein, which is both one of the most important and most complicated found in all of nature,” said David Barford, DPhil, of the Medical Research Council Laboratory of Molecular Biology in Cambridge, UK.
“We hope our discovery will open up whole new avenues of research that increase our understanding of the process of mitosis and ultimately lead to the discovery of new cancer drugs.”
Dr Barford and his colleagues detailed their discovery in Nature.
The researchers reconstituted human APC/C and used a combination of electron microscopy and imaging software to visualize it at a resolution of less than a billionth of a meter.
The resolution was so fine that it allowed the team to see the secondary structure—the set of basic building blocks that combine to form every protein. Alpha-helix rods and folded beta-sheet constructions were clearly visible within the 20 subunits of the APC/C, defining the overall architecture of the complex.
Previous studies led by the same team had shown a globular structure for APC/C in much lower resolution, but the secondary structure had not been mapped.
Each of the APC/C’s subunits bond and mesh with other units at different points in the cell cycle, allowing it to control a range of mitotic processes, including the initiation of DNA replication, the segregation of chromosomes along spindles, and cytokinesis. Disrupting each of these processes could selectively kill cancer cells or prevent them from dividing.
“The fantastic insights into molecular structure provided by this study are a vivid illustration of the critical role played by fundamental cell biology in cancer research,” said Paul Workman, PhD, of The Institute of Cancer Research, London.
“The new study is a major step forward in our understanding of cell division. When this process goes awry, it is a critical difference that separates cancer cells from their healthy counterparts. Understanding exactly how cancer cells divide inappropriately is crucial to the discovery of innovative cancer treatments to improve outcomes for cancer patients.” ![]()
Lab-generated platelets seem just like the real thing
Credit: Andre E.X. Brown
A next-generation bioreactor can produce fully functional platelets, according to research published in Blood.
The bioreactor recapitulates human bone marrow and blood vessel microenvironments.
And when the researchers introduced megakaryocytes derived from human induced pluripotent stem cell cultures (hiPSC-MKs), the bioreactor produced platelets with the structural and functional properties of natural platelets.
The team said this work is a major advancement that could help address blood transfusion needs worldwide.
“The ability to generate an alternative source of functional human platelets with virtually no disease transmission represents a paradigm shift in how we collect platelets that may allow us to meet the growing need for blood transfusions,” said lead study author Jonathan Thon, PhD, of Brigham and Women’s Hospital in Boston.
His group’s bioreactor uses biologically inspired engineering to fully integrate the major components of bone marrow, modeling both its composition and blood flow characteristics.
The bioreactor recapitulates features such as bone marrow stiffness, extracellular matrix composition, micro-channel size, and blood flow stability under high-resolution live-cell microscopy to make human platelets.
“[B]eing able to develop a device that successfully models bone marrow represents a crucial bridge connecting our understanding of the physiological triggers of platelet formation to support drug development and scale platelet production,” said senior study author Joseph Italiano, Jr, PhD, also of Brigham and Women’s Hospital.
He and his colleagues showed that physiological shear stresses in the bioreactor triggered proplatelet initiation, reproduced ex vivo bone marrow proplatelet production, and generated functional platelets.
In static culture, hiPSC-MKs began producing proplatelets at 6 hours post-isolation and reached maximal production at 18 hours. However, hiPSC-MKs under physiological shear stress began producing proplatelets immediately upon trapping and extended/released proplatelets within the first 2 hours of culture.
About 90% of hiPSC-MKs under shear stress produced proplatelets, compared to 10% of hiPSC-MKs in static cultures.
The hiPSC-MK-derived bioreactor platelets displayed forward scatter, side scatter, and surface biomarker expression characteristic of human platelets. Electron microscopy showed the 2 types of platelets were ultrastructurally indistinguishable from one another.
Furthermore, bioreactor platelets displayed morphology and microtubule expression comparable to human platelets. And bioreactor platelets spread normally upon contact-activation with glass, forming both filpodia and lamellipodia.
“Bioreactor-derived platelets theoretically have several advantages over conventional, donor-derived platelets in terms of safety and resource utilization,” said William Savage, MD, PhD, medical director at Kraft Family Blood Donor Center at Brigham and Women’s Hospital, who did not contribute to the study.
“A major factor that has limited our ability to compare bioreactor platelets to donor platelets is the inefficiency of growing platelets, a problem that slows progress of clinical research. This study addresses that gap, while contributing to our understanding of platelet biology at the same time.”
Based on the promising results of this study, the researchers would like to begin clinical trials testing the bioreactor platelets in 2017.
“The regulatory bar is appropriately set high for blood products,” Dr Thon said. “And it is important to us that we show platelet quality, function, and safety over these next 3 years, since we’ll likely be recipients of these platelets ourselves at some point.” ![]()
Depth of molecular response factors into safe TKI withdrawal in CML
MILAN – A full 61.5% of patients with chronic myeloid leukemia in deep molecular remission for more than 1 year on long-term tyrosine kinase inhibitor therapy remained alive and free of relapse 6 months after stopping their TKI in the EURO-SKI trial.
Molecular relapse-free survival at 9 months was 58% and 55% at 12 months.
The preplanned interim analysis after 200 patients allowed the trialists to discard the study’s null hypothesis that molecular relapse-free survival at 6 months would be 40% or less (P less than .0001).
"With less strict inclusion and relapse criteria than the A-STIM study and other trials, stopping is safe and we can continue with the trial," Dr. Susanne Saussele said in a late-breaking abstract session at the annual meeting of the European Hematology Association.
Importantly, interim results from the EURO-SKI (European Stop TKI) study also suggest that the level of molecular response (MR) achieved prior to TKI withdrawal affects molecular relapse-free survival.
Among 197 patients with molecular laboratory results available for exact classification, 49% of patients in MR4 relapsed, compared with 39% in MR4.5 and 39% in MR5.
"In the setting of standardized molecular testing within a CML [chronic myeloid leukemia] stopping trial, it seems that molecular remission has an impact on molecular free-survival," said Dr. Saussele of University Medical Centre Mannheim, Germany.
As no statistical test was performed and this was an interim analysis, MR4.5 or MR5 cannot yet be used as a criterion to select patients to withdraw from treatment, she said in an interview.
The findings do confirm results from the recent A-STIM (According to Stop Imatinib) study showing that loss of major molecular response can be used as a practical criterion for restarting imatinib (J. Clin. Oncol. 2014;32:424-30).
Several studies including the STIM (Stop Imatinib) trial and the STOP 2G-TKI (Stop Second Generation Tyrosine Kinase Inhibitors) study have shown that imatinib (Gleevec), dasatinib (Sprycel), and nilotinib (Tasigna) can be safely withdrawn in a substantial proportion of patients with CML in deep MR.
A number of questions remain open, however, such as which molecular level has to be reached before stopping TKI therapy, the minimal duration of TKI pretreatment or MR4 before stopping, and which prognostic factors influence molecular relapse-free survival, she said.
EURO-SKI was set up to define prognostic markers to increase the rate of patients in durable deep MR after stopping TKI treatment. Other aims are to evaluate methods of molecular monitoring, quality of life, and saved treatment costs per country.
Patients with chronic-phase CML from eight countries were eligible if they were on a TKI for at least 3 years and had a confirmed deep MR, defined as more than a 4 log reduction in BCR-ABL (breakpoint cluster region–Abelson) transcripts for more than 12 months confirmed by three consecutive polymerase chain reaction results.
MR4 status also had to be confirmed in an MR4-standardized laboratory according to criteria by Cross et al. (Leukemia 2012;26:2172-5)
Patients with previous or planned allogeneic stem cell transplantation or a prior TKI failure were excluded.
A total of 103 patients received pretreatment before TKI therapy, mostly with hydroxyurea alone (n = 71) or with interferon (n = 22). Their median age was 53 years.
First-line TKI was imatinib in 194 patients, nilotinib in 3, and dasatinib in 3.
The median duration of TKI therapy was 8 years and median MR4 duration before stopping TKI therapy was 5 years.
Dr. Saussele cautioned that adverse events and quality of life must be taken into account when considering TKI withdrawal in these patients.
A total of 222 adverse events were reported in 98 patients, with 57 events in 37 patients related to treatment stop. None were grade 4.
The most common adverse event was musculoskeletal or joint pain (39 events of all grades and 6 grade 3/4 events). This was first described in the Swedish EURO-SKI patients in 15-20% of patients after TKI withdrawal, prompting the investigators to send an advisory letter to all participating physicians, she remarked.
Other adverse events included sweating, skin disorders, folliculitis, depressive episodes, fatigue, urticaria, and weight loss.
The EURO-SKI trial was recently expanded to enroll 700 patients, with a quality of life analysis expected later this year. The next report on the primary endpoint is expected at the American Society of Hematology annual meeting, Dr. Saussele said.
Dr. Saussele reported honoraria and research and travel support from BMS, Novartis, and Pfizer.
AT THE EHA CONGRESS
Key clinical point: Long-time TKI therapy can be stopped in chronic myeloid leukemia in deep molecular remission. The level of molecular response prior to TKI withdrawal affects molecular relapse-free survival.
Major finding: After TKI withdrawal, 49% of patients in MR4 relapsed, compared with 39% in MR4.5 and 39% in MR5.
Data source: First interim analysis from a prospective study in 200 CML patients in deep molecular remission.
Disclosures: Dr. Saussele reported honoraria and research and travel support from BMS, Novartis, and Pfizer.
Risks scream caution for catheter-directed thrombolysis for proximal DVT
Catheter-directed thrombolysis plus anticoagulation is no more effective than anticoagulation alone in preventing in-hospital death among adults who have lower-extremity proximal deep vein thrombosis, according to a nationwide observational study reported online July 21 in JAMA Internal Medicine.
However, catheter-directed thrombolysis carries higher risks, particularly serious bleeding risks such as intracranial hemorrhage, than does anticoagulation alone, and it costs nearly three times as much money. These findings highlight the need for randomized trials "to evaluate the magnitude of the effect of catheter-directed thrombolysis on ... mortality, postthrombotic syndrome, and recurrence of DVT [deep vein thrombosis]. In the absence of such data, it may be reasonable to restrict this form of therapy to those patients who have a low bleeding risk and a high risk for postthrombotic syndrome, such as patients with iliofemoral DVT," said Dr. Riyaz Bashir of the division of cardiovascular diseases, Temple University, Philadelphia, and his associates.
Conflicting data from several small studies as to the safety and effectiveness of catheter-directed thrombolysis have led professional societies to devise conflicting recommendations for its use: the American College of Chest Physicians advises against using the procedure, while the American Heart Association recommends it as a first-line therapy for certain patients. "We sought to assess real-world comparative-safety outcomes in patients proximal and caval DVT who underwent catheter-directed thrombolysis plus anticoagulation with a group treated with anticoagulation alone using risk-adjusted propensity-score matching," the investigators said.
They analyzed data from an Agency for Healthcare Research and Quality administrative database of patient discharges from approximately 1,000 nonfederal acute-care hospitals per year for a 6-year period. They identified 90,618 patients with a discharge diagnosis of proximal DVT; propensity-score matching yielded 3,594 well-matched patients in each study group. In-hospital mortality was not significantly different between patients who had catheter-directed thrombolysis plus anticoagulation (1.2%) and those who had anticoagulation alone (0.9%), Dr. Bashir and his associates wrote (JAMA Intern. Med. 2014 July 21 [doi:10.1001/jamainternmed.2014.3415]).
However, rates of blood transfusion (11.1% vs. 6.5%), pulmonary embolism (17.9% vs 11.4%), and intracranial hemorrhage (0.9% vs 0.3%) were significantly higher with the invasive intervention. And patients in the catheter-directed thrombolysis group required significantly longer hospitalizations (7.2 vs. 5.0 days) and incurred significantly higher hospital expenses ($85,094 vs. $28,164). "It is imperative that the magnitude of benefit from catheter-directed therapy be substantial to justify the increased initial resource utilization and bleeding risks of this therapy," the investigators noted.
FROM JAMA INTERNAL MEDICINE
Key clinical point: Catheter-directed thrombolysis carries higher risks and may not improve outcomes for proximal DVT patients.
Major finding: In-hospital mortality was not significantly different between patients who had catheter-directed thrombolysis plus anticoagulation (1.2%) and those who had anticoagulation alone (0.9%), but rates of blood transfusion (11.1% vs 6.5%), pulmonary embolism (17.9% vs 11.4%), and intracranial hemorrhage (0.9% vs 0.3%) were significantly higher with the invasive intervention.
Data source: A propensity-matched analysis comparing the effectiveness and safety profiles between catheter-directed thrombolysis plus anticoagulation and anticoagulation alone in 3,594 adults across the country hospitalized with lower-extremity proximal DVT during a 6-year period.
Disclosures: This study was supported by Temple University Hospital, Philadelphia. Dr. Bashir reported no financial conflicts of interest; his associates reported ties to Covidien, Health Systems Networks, and Insight Telehealth.
Serum albumin, creatinine predicted survival in ALS
Serum levels of both albumin and creatinine proved to be independent biomarkers of disease severity in men and women with amyotrophic lateral sclerosis, with lower levels denoting more serious disease and a shorter survival time, according to a report published online July 21 in JAMA Neurology.
To identify any potential correlations between hematologic biomarkers and ALS severity, researchers analyzed data concerning 638 patients from a regional registry of people diagnosed during 2007-2011 in the Piemonte and Valle d’Aosta areas of Italy. The 352 men and 286 women underwent complete physical examinations at the time of diagnosis, which included tests for 17 serum biomarkers. The only two serum biomarkers found to correlate with ALS severity were albumin level, which reflected inflammation, and creatinine, which reflected muscle wasting, said Dr. Adriano Chio, professor of neuroscience, University of Torino, Turin, Italy, and his associates.
Both biomarkers showed an inverse dose-response relationship with clinical function at diagnosis in men and women. Both had sensitivity and specificity values at predicting 1-year mortality that were similar to those of "the best established prognostic factors" for ALS, such as forced vital capacity, age, and scores on the ALS Functional Rating Scale-Revised, the investigators said (JAMA Neurol. 2014 July 21 [doi:10.1001/jamaneurol.2014.1129]).
Dr. Chio and his colleagues performed a validation study in a cohort of 122 patients (54 men, 68 women) at all stages of ALS who were treated at an ALS tertiary care center in another area of Italy. This study confirmed the findings from the discovery cohort. "Both creatinine and albumin are reliable and easily detectable blood markers of the severity of motor dysfunction in ALS and could be used in defining patients’ prognosis at the time of diagnosis," they said.
This study was supported by the Italian Ministry of Health and the European Community’s Health Seventh Framework Programme. Dr. Chio reported serving on scientific advisory board for Biogen Idec and Cytokinetics
FROM JAMA NEUROLOGY
Key clinical point: Serum levels of both albumin and creatinine were independent biomarkers of ALS severity.
Major finding: At diagnosis, serum levels of both albumin and creatinine showed an inverse dose-response relationship with clinical function in men and women, with sensitivity and specificity values at predicting 1-year mortality that were similar to those of "the best established prognostic factors" for ALS.
Data source: A population-based cohort study of serum biomarkers in 638 ALS patients registered in an Italian regional database, and a validation cohort study of 122 patients with different stages of ALS seen consecutively at an ALS tertiary care center in another area of Italy.
Disclosures: This study was supported by the Italian Ministry of Health and the European Community’s Health Seventh Framework Programme. Dr. Chio reported serving on scientific advisory board for Biogen Idec and Cytokinetics.
ABT-199 rebounds in advanced CLL after tackling tumor lysis syndrome
MILAN – The investigational Bcl-2 inhibitor ABT-199 continues to impress with substantial activity as single-agent or combination therapy in relapsed or refractory chronic lymphocytic leukemia, following dose-scheduling modifications to address the risk of tumor lysis syndrome.
ABT-199 monotherapy
Updated data from all 105 CLL patients in the phase I trial show the overall response rate remains high at 77%, with 23% of patients achieving complete remission.
Seven of 11 complete responders assessed had no detectable minimal residual disease, Dr. John F. Seymour said at the annual congress of the European Hematology Association.
Overall response rates were sustained in the 75%-80% range for high-risk patients with deletion 17p, fludarabine-refractory, or immunoglobulin heavy-chain variable (IGHV)-unmutated CLL; and complete response rates in these subgroups also did not differ from the overall group at 22% to 29%.
Prior results from the first-in-human trial dazzled the leukemia community, but tumor lysis syndrome (TLS) complications, including two fatal events, temporarily halted ABT-199 clinical trials and gave the advantage to its closest competitor, the recently approved and more tolerable CLL drug ibrutinib (Imbruvica).
Use of a modified, ramp-up dosing scheme and aggressive TLS prophylaxis appear to have ameliorated the risk of TLS, with no further clinically significant or grade 3 or 4 events reported in the 49 patients treated with this schema, said Dr. Seymour, director of hematology and cancer medicine at the Peter MacCallum Cancer Centre, East Melbourne, Australia.
Rather than using a 3-week schedule and 50-mg starting dose, the safety expansion cohort received once-daily oral ABT-199 beginning at 20 mg, with weekly adjustments to 50 mg, 100 mg, 200 mg, and 400 mg over 5 weeks.
The 400-mg dose has been identified as the phase II dose, with 59% of patients free of progression at 18 months and beyond on this dose, he said.
As of April 2014, 37 of the 105 patients discontinued treatment, 22 due to progressive disease and 12 for adverse events; in addition, two proceeded to allogeneic hematopoietic cell transplantation, and one needed Coumadin, which is not permitted on protocol.
The median duration of response has not yet been reached for patients treated at doses of 400 mg or above, he said.
The most common treatment-emergent adverse events of any grade were diarrhea (40% of patients), neutropenia (36%), and nausea (35%).
Neutropenia was the only grade 3/4 event occurring in more than 10% of patients (33%), followed by anemia in 10%.
Combination ABT-199
Of substantial interest to many was a second phase Ib study presented in the same session, evaluating the role of ABT-199 with the anti-CD20 antibody rituximab (Rituxan) in relapsed or refractory CLL.
After a median time on study of just 7.5 months, the overall response rate was 84% among 25 evaluable patients, including 9 complete responses (36%) and 12 partial responses (48%), said Dr. Andrew W. Roberts, with the Royal Melbourne (Australia) Hospital and Walter and Eliza Hall Institute of Medical Research.
Six of eight complete responders tested were negative for minimal residual disease by flow cytometry.
Preliminary pharmacokinetic results suggest no apparent effect of rituximab on ABT-199 exposure, he said.
Three patients discontinued ABT-199 after achieving a complete remission, including one with fludarabine-refractory disease, and all remain in complete remission at 8.6, 8.8, and 11.6 months after cessation.
Dose modifications were also made in this study following a fatal TLS event in December 2012 after a first dose of ABT-199 at 50 mg. Under the modified step-up dosing, ABT-199 was started at 20 mg, escalating up to 600 mg daily over 5 weeks, with rituximab 375 mg/m2 added on day 1 of week 5 and rituximab 500 mg/m2 added on day 1 of months 2-6.
The combination was well tolerated, and no new safety concerns were identified, Dr. Roberts said. The most common grade 3/4 adverse events among 45 patients evaluable for safety were neutropenia in 47%, anemia in 16%, thrombocytopenia in 13%, and febrile neutropenia in 7%. Grade 3/4 neutropenia was more common at 600 mg, with the 400-mg dose selected for the ongoing safety expansion cohort. Two serious TLS events occurred, but both were prior to schedule modifications, he said.
One patient in the combination study and 13 in the monotherapy study received treatment for small lymphocytic lymphoma. Response rates and tolerability were similar between CLL and SLL patients in the monotherapy study, Dr. Roberts said in an interview.
During a press briefing at the meeting, Dr. Seymour said ABT-199 potentially could be combined with ibrutinib and that the combination was very potent in laboratory tests in both CLL and some forms of mantle cell lymphoma. Negotiations with the various companies involved are intricate, but there is agreement and commitment "to begin clinical trials of the combination later this year," he added.
ABT-199 is currently being evaluated in a phase II trial as monotherapy in deletion 17p relapsed CLL, as combination therapy with rituximab versus bendamustine plus rituximab in a phase III trial in relapsed/refractory CLL, and in combination trials with bendamustine/rituximab and obinutuzumab in relapsed/refractory CLL.
AbbVie and Genentech sponsored the trials. Dr. Seymour is a consultant and adviser for AbbVie, Genentech, and Roche. Dr. Roberts reported research funding from AbbVie and Genentech and milestone payments to his institution related to ABT-199.
AT THE EHA CONGRESS
Major finding: The overall response rate was 77% with ABT-199 monotherapy and 84% with the addition of rituximab in relapsed or refractory CLL.
Key clinical point: ABT-199 alone or as combination therapy with rituximab has substantial activity in relapsed/refractory CLL.
Data source: Two phase I trials in patients with CLL.
Disclosures: AbbVie and Genentech, codevelopers of ABT-199, sponsored the trials. Dr. Seymour is a consultant and adviser for AbbVie, Genentech, and Roche. Dr. Roberts reported research funding from AbbVie and Genentech and milestone payments to his institution related to ABT-199.
Two blood cancer patients cleared of HIV

Credit: CDC
MELBOURNE—Two men with hematologic malignancies who were also HIV-positive appear to be free of the virus after receiving stem cell transplants.
The patients have undetectable levels of HIV and remain free of their cancers—acute myeloid leukemia and non-Hodgkin lymphoma—more than 3 years after their transplants.
Importantly, the patients’ stem cell donors were not homozygous for CCR5-delta 32, a mutation that affords protection against HIV.
The researchers said these results herald a new direction in HIV research and provide hope for HIV-positive patients with leukemia and lymphoma.
The work was presented at the “Towards an HIV Cure Symposium,” which is part of the 20th International AIDS Conference.
Both patients were treated at St Vincent’s Hospital in partnership with the University of New South Wales’s Kirby Institute in Sydney, Australia.
One patient underwent a transplant in 2010 to treat his non-Hodgkin lymphoma, and his donor had 1 copy of CCR5-delta 32.
The second patient underwent a similar procedure for acute myeloid leukemia in 2011, and his donor did not have any copies of CCR5-delta 32.
Nevertheless, both patients were successfully cleared of HIV, although they remain on antiretroviral therapy as a protective measure.
“We’re so pleased that both patients are doing reasonably well years after the treatment for their cancers and remain free of both the original cancer and the HIV virus,” said David Cooper, MBBS, MD, DSc, of the Kirby Institute and St Vincent’s Hospital.
Until now, the only person considered to have cleared HIV is an American man, Timothy Ray Brown, who underwent 2 stem cell transplants in Berlin (in 2007 and 2008).
The cells in his second transplant included both copies of CCR5-delta 32, which affords protection against HIV and is found in less than 1% of the population. The man is no longer on antiretroviral therapy and remains free of HIV.
In Boston, 2 other patients underwent similar transplants in 2012, but the donor cells did not contain CCR5-delta 32. In both cases, HIV returned after antiretroviral treatment was stopped.
“It is very difficult to find a match for bone marrow donors and even more so to find one that affords protective immunity against HIV,” Dr Cooper said.
While his group’s results are a significant development, the researchers stressed that transplants are not a general functional “cure” for the up to 38.8 million people infected with HIV worldwide.
“This is a terrific, unexpected result for people with malignancy and HIV,” said Sam Milliken, MBBS, of St Vincent’s Hospital. “It may well give us a whole new insight into HIV, using the principles of stem cell transplantation.”
“It is important to caution that, at this stage, this form of treatment is far too dangerous for treating patients with HIV alone, but there may be potential for using transplants as an effective treatment modality for HIV down the track.”
The researchers said the 2 Sydney patients will be the subject of investigations to determine where any residual virus might be hiding and how it can be controlled. And the patients’ results point to a new direction for HIV research.
“We still don’t know why these patients have undetectable viral loads,” said Kersten Koelsch, MD, of the Kirby Institute. “One theory is that the induction therapy helps to destroy the cells in which the virus is hiding and that any remaining infected cells are destroyed by the patient’s new immune system.”
“We need more research to establish why and how bone marrow transplantation clears the virus. We also want to explore the predictors of sustained viral clearance and how this might be able to be exploited without the need for bone marrow transplantation.”
For the time being, the results mean that more patients who are eligible for transplant might be able to participate in clinical trials to determine the value of this procedure in HIV. ![]()