User login
What are your responsibilities after a screening call?
Dear Dr. Mossman,
When I take a call from a treatment-seeker at our outpatient clinic, I ask brief screening questions to determine whether our services would be appropriate. Shortly after I screened one caller, Ms. C, she called back requesting a medication refill and asking about her diagnosis.
What obligation do I have to Ms. C? Is she my patient? Would I be liable if I didn’t help her out and something bad happened to her?
Submitted by “Dr. S”
Office and hospital Web sites, LinkedIn profiles, and Facebook pages are just a few of the ways that people find physicians and learn about their services. But most 21st century doctor-patient relationships still start with 19th century technology: a telephone call.
Talking with prospective patients before setting up an appointment makes sense. A short conversation can clarify whether you offer the services that a caller needs and increases the show-up rate for initial appointments.1
But if you ask for some personal history and information about symptoms in a screening interview, does that make the caller your patient? Ms. C seemed to have thought so. To find out whether Ms. C was right and to learn how Dr. S should handle initial telephone calls, we’ll look at:
• the rationale for screening callers before initiating treatment
• features of screening that can create a doctor-patient relationship
• how to fulfill duties that result from screening.
Why screen prospective patients?
Mental health treatment has become more diversified and specialized over the past 30 years. No psychiatrist nowadays has all the therapeutic skills that all potential patients might need.
Before speaking to you, a treatment-seeker often won’t know whether your practice style will fit his (her) needs. You might prefer not to provide medication management for another clinician’s psychotherapy patient or, if you’re like most psychiatrists, you might not offer psychotherapy.
In the absence of prior obligation (eg, agreeing to provide coverage for an emergency room), physicians may structure their practices and contract for their services as they see fit2—but this leaves you with some obligation to screen potential patients for appropriate mutual fit. In years past, some psychiatrists saw potential patients for an in-office evaluation to decide whether to provide treatment—a practicethat remains acceptable if the person is told, when the appointment is made, that the first meeting is “to meet each other and see if you want to establish a treatment relationship.”3
Good treatment plans take into account patients’ temperament, emotional state, cognitive capacity, culture, family circumstances, substance use, and medical history.4 Common mental conditions often can be identified in a telephone call.5,6 Although the diagnostic accuracy of such efforts is uncertain,7 such calls can help practitioners determine whether they offer the right services for callers. Good decisions about initiating care always take financial pressures and constraints into account,8 and a pre-appointment telephone call can address those issues, too.
For all these reasons, talking to a prospective patient before he comes to see you makes sense. Screening lets you decide:
• whether you’re the right clinician for his needs
• who the right clinician is if you are not
• whether he should seek emergency evaluation when the situation sounds urgent.
Do phone calls start treatment?
As Dr. S’s questions show, telephone screenings might leave some callers thinking that treatment has started, even before their first office appointment. Having a treatment relationship is a prerequisite to malpractice liability,9 and courts have concluded that, under the right circumstances, telephone assessments do create physician-patient relationships.
Creating a physician-patient relationship
How or when might telephone screening make someone your patient? This question doesn’t have a precise answer, but how courts decided similar questions has depended on the questions the physician asked and whether the physician offered what sounded like medical advice.10,11 A physician-patient relationship forms when the physician takes some implied or affirmative action to treat, see, examine, care for, or offer a diagnosis to the patient,9,12,13 such as:
• knowingly accepting someone as a patient14
• explicitly agreeing to treat a person
• “acting in some other way such that the patient might reasonably be led to assume a doctor-patient relationship has been established.”15
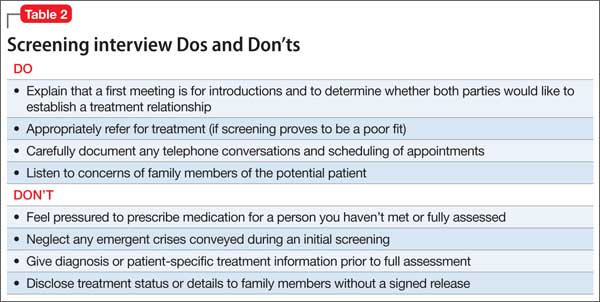
Also, the “fact that a physician does not deal directly with a patient does not necessarily preclude the existence of a physician-patient relationship,”12 so a telephone conversation can create such a relationship if it contains the right elements. Table 116 highlights actions that, during the course of screening, might constitute initiation of a physician-patient relationship. Table 2 offers suggestions for managing initial telephone contacts to reduce the chance of inadvertently creating a physician-patient relationship.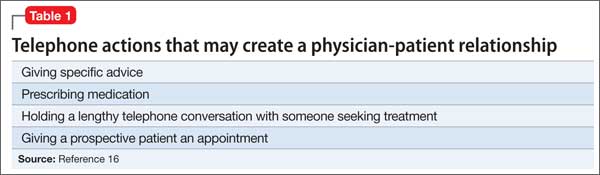
In the eyes of the law, whether a physician-patient relationship was formed depends on specific facts of the situation and may be decided by a jury.13,14 In the case of Ms. C, Dr. S might avoid premature creation of a physician-patient relationship by refraining from offering a diagnosis at the conclusion of the screening call.17
Prescribing
Although features of the original screening interview indicated that Ms. C was not yet Dr. S’s patient, prescribing certainly would commence a physician-patient relationship.18 But even if the screening had made Ms. C a patient, refilling her prescription now probably is a bad idea.
Assuming that a physician-patient relationship exists, it is unlikely that a short telephone interview gave Dr. S enough information about Ms. C’s medical history and present mental status to ensure that his diagnostic reasoning would not be faulty. It also is unlikely that telephone screening allowed Dr. S to meet the standard of care for prescribing—a process that involves choosing medications suitable to the patient’s clinical needs, checking the results of any necessary lab tests, and obtaining appropriate informed consent.19
Satisfying duties
Outpatient facilities can instruct telephone screeners to conduct interviews in ways that reduce inadvertent establishment of a treatment relationship, but establishing such a relationship cannot be avoided in all cases. If a caller is distraught or in crisis, for example, compassion dictates helping him, and some callers (eg, Ms. C) may feel they have a firmer treatment relationship than actually exists.
Once you have created a physician-patient relationship, you must continue that relationship until you end it appropriately.3 That does not mean you have to provide definitive treatment; you simply need to exercise “reasonable care according to the standards of the profession.”16,20 If a caller telephones in an emergency situation, for example, the screening clinician should take appropriate steps to ensure safety, which might include calling law enforcement or facilitating hospitalization.3
One way to fulfill the duties of a physician-patient relationship inadvertently established during initial screening is through explicit discharge (if medically appropriate) or transfer of care to another physician.15 A prudent clinic or practitioner will describe other mental health resources in the community and sometimes assist with referral if the inquiring potential patient needs services that the provider does not offer.
In many communities, finding appropriate mental health resources is difficult. Creative approaches to this problem include transitional psychiatry or crisis support clinics that serve as a “bridge” to longer-term services,21,22 preliminary process groups,23 and telepsychiatry transitional clinics.24 When a clinic does not accept a person as a patient, the clinic should clearly document 1) key features of the contact and 2) the rationale for that decision
Bottom Line
You have a right and a responsibility to screen prospective patients for good fit to your treatment services. In doing so, however, you might inadvertently create a physician-patient relationship. If this happens, you should fulfill your clinical responsibilities, as you would for any patient, by helping the patient get appropriate care from you or another provider.
Disclosures
The authors report no financial relationship with any company whose products are mentioned in this article or with manufacturers of competing products.
1. Shoffner J, Staudt M, Marcus S, et al. Using telephone reminders to increase attendance at psychiatric appointments: findings of a pilot study in rural Appalachia. Psychiatr Serv. 2007;58(6):872-875.
2. Hiser v Randolph, 1980 617 P2d 774 (Ariz App).
3. American Psychiatric Association. Practice management for early career psychiatrists: a reference guide, 6th edition. http://www.psych.org/practice/managing-a-practice/ starting-a-practice. Published October 16, 2006. Accessed July 8, 2014.
4. Delgado SV, Strawn JR. Difficult psychiatric consultations: an integrated approach. New York, NY: Springer; 2014.
5. Aziz MA, Kenford S. Comparability of telephone and face-to-face interviews in assessing patients with posttraumatic stress disorder. J Psychiatric Pract. 2004;10(5): 307-313.
6. Michel C, Schimmelmann BG, Kupferschmid S, et al. Reliability of telephone assessments of at-risk criteria of psychosis: a comparison to face-to-face interviews. Schizophr Res. 2014;153(1-3):251-253.
7. Muskens EM, Lucassen P, Groenleer W, et al. Psychiatric diagnosis by telephone: is it an opportunity [published online March 15, 2014]? Soc Psychiatry Psychiatr Epidemiol. doi: 10.1007/s00127-014-0861-9.
8. Cassel CK, Guest JA. Choosing wisely: helping physicians and patients make smart decisions about their care. JAMA. 2012;307(17):1801-1802.
9. Roberts v Sankey, 2004 813 NE2d 1195 (Ind App).
10. O’Neill v Montefiore Hospital, 1960 202 NYS 2d 436 (NY App).
11. McKinney v Schlatter, 1997 692 NE2d 1045 (Ohio App).
12. Dehn v Edgecombe, 865 A2d 603 (Md 2005).
13. Kelley v Middle Tennessee Emergency Physicians, 133 SW3d 587 (Tenn 2004).
14. Oliver v Brock, 342 So2d 1 (Ala 1976).
15. Appelbaum PS, Gutheil TG. Malpractice and other forms of liability. In: Appelbaum PS, Gutheil TG, eds. Clinical Handbook of Psychiatry and the Law, 4th ed. Philadelphia, PA: Lippincott Williams and Wilkins; 2007:115-116.
16. Simon RI, Shuman DW. The doctor-patient relationship. Focus. 2007;5(4):423-431.
17. Torres A, Wagner R. Establishing the physician-patient relationship. J Dermatol Surg Oncol. 1993;19(2):147-149.
18. Aboff BM, Collier VU, Farber NJ, et al. Residents’ prescription writing for nonpatients. JAMA. 2002;288(3):381-385.
19. Edersheim JG, Stern TA. Liability associated with prescribing medications. Prim Care Companion J Clin Psychiatry. 2009;11(3):115-119.
20. Brown v Koulizakis, 331 SE2d 440 (Va 1985).
21. University of Michigan Department of Psychiatry. Crisis support clinic. http://www.psych.med.umich.edu/patient-care/crisis-support-clinic. Accessed July 9, 2014.
22. UAB Department of Psychiatry. http://www.uab.edu/ medicine/psychiatry. Accessed July 9, 2014.
23. Stone WN, Klein EB. The waiting-list group. Int J Group Psychother. 1999;49(4):417-428.
24. Detweiler MB, Arif S, Candelario J, et al. A telepsychiatry transition clinic: the first 12 months experience. J Telemed Telecare. 2011;17(6):293-297.
Dear Dr. Mossman,
When I take a call from a treatment-seeker at our outpatient clinic, I ask brief screening questions to determine whether our services would be appropriate. Shortly after I screened one caller, Ms. C, she called back requesting a medication refill and asking about her diagnosis.
What obligation do I have to Ms. C? Is she my patient? Would I be liable if I didn’t help her out and something bad happened to her?
Submitted by “Dr. S”
Office and hospital Web sites, LinkedIn profiles, and Facebook pages are just a few of the ways that people find physicians and learn about their services. But most 21st century doctor-patient relationships still start with 19th century technology: a telephone call.
Talking with prospective patients before setting up an appointment makes sense. A short conversation can clarify whether you offer the services that a caller needs and increases the show-up rate for initial appointments.1
But if you ask for some personal history and information about symptoms in a screening interview, does that make the caller your patient? Ms. C seemed to have thought so. To find out whether Ms. C was right and to learn how Dr. S should handle initial telephone calls, we’ll look at:
• the rationale for screening callers before initiating treatment
• features of screening that can create a doctor-patient relationship
• how to fulfill duties that result from screening.
Why screen prospective patients?
Mental health treatment has become more diversified and specialized over the past 30 years. No psychiatrist nowadays has all the therapeutic skills that all potential patients might need.
Before speaking to you, a treatment-seeker often won’t know whether your practice style will fit his (her) needs. You might prefer not to provide medication management for another clinician’s psychotherapy patient or, if you’re like most psychiatrists, you might not offer psychotherapy.
In the absence of prior obligation (eg, agreeing to provide coverage for an emergency room), physicians may structure their practices and contract for their services as they see fit2—but this leaves you with some obligation to screen potential patients for appropriate mutual fit. In years past, some psychiatrists saw potential patients for an in-office evaluation to decide whether to provide treatment—a practicethat remains acceptable if the person is told, when the appointment is made, that the first meeting is “to meet each other and see if you want to establish a treatment relationship.”3
Good treatment plans take into account patients’ temperament, emotional state, cognitive capacity, culture, family circumstances, substance use, and medical history.4 Common mental conditions often can be identified in a telephone call.5,6 Although the diagnostic accuracy of such efforts is uncertain,7 such calls can help practitioners determine whether they offer the right services for callers. Good decisions about initiating care always take financial pressures and constraints into account,8 and a pre-appointment telephone call can address those issues, too.
For all these reasons, talking to a prospective patient before he comes to see you makes sense. Screening lets you decide:
• whether you’re the right clinician for his needs
• who the right clinician is if you are not
• whether he should seek emergency evaluation when the situation sounds urgent.
Do phone calls start treatment?
As Dr. S’s questions show, telephone screenings might leave some callers thinking that treatment has started, even before their first office appointment. Having a treatment relationship is a prerequisite to malpractice liability,9 and courts have concluded that, under the right circumstances, telephone assessments do create physician-patient relationships.
Creating a physician-patient relationship
How or when might telephone screening make someone your patient? This question doesn’t have a precise answer, but how courts decided similar questions has depended on the questions the physician asked and whether the physician offered what sounded like medical advice.10,11 A physician-patient relationship forms when the physician takes some implied or affirmative action to treat, see, examine, care for, or offer a diagnosis to the patient,9,12,13 such as:
• knowingly accepting someone as a patient14
• explicitly agreeing to treat a person
• “acting in some other way such that the patient might reasonably be led to assume a doctor-patient relationship has been established.”15
Also, the “fact that a physician does not deal directly with a patient does not necessarily preclude the existence of a physician-patient relationship,”12 so a telephone conversation can create such a relationship if it contains the right elements. Table 116 highlights actions that, during the course of screening, might constitute initiation of a physician-patient relationship. Table 2 offers suggestions for managing initial telephone contacts to reduce the chance of inadvertently creating a physician-patient relationship.
In the eyes of the law, whether a physician-patient relationship was formed depends on specific facts of the situation and may be decided by a jury.13,14 In the case of Ms. C, Dr. S might avoid premature creation of a physician-patient relationship by refraining from offering a diagnosis at the conclusion of the screening call.17
Prescribing
Although features of the original screening interview indicated that Ms. C was not yet Dr. S’s patient, prescribing certainly would commence a physician-patient relationship.18 But even if the screening had made Ms. C a patient, refilling her prescription now probably is a bad idea.
Assuming that a physician-patient relationship exists, it is unlikely that a short telephone interview gave Dr. S enough information about Ms. C’s medical history and present mental status to ensure that his diagnostic reasoning would not be faulty. It also is unlikely that telephone screening allowed Dr. S to meet the standard of care for prescribing—a process that involves choosing medications suitable to the patient’s clinical needs, checking the results of any necessary lab tests, and obtaining appropriate informed consent.19
Satisfying duties
Outpatient facilities can instruct telephone screeners to conduct interviews in ways that reduce inadvertent establishment of a treatment relationship, but establishing such a relationship cannot be avoided in all cases. If a caller is distraught or in crisis, for example, compassion dictates helping him, and some callers (eg, Ms. C) may feel they have a firmer treatment relationship than actually exists.
Once you have created a physician-patient relationship, you must continue that relationship until you end it appropriately.3 That does not mean you have to provide definitive treatment; you simply need to exercise “reasonable care according to the standards of the profession.”16,20 If a caller telephones in an emergency situation, for example, the screening clinician should take appropriate steps to ensure safety, which might include calling law enforcement or facilitating hospitalization.3
One way to fulfill the duties of a physician-patient relationship inadvertently established during initial screening is through explicit discharge (if medically appropriate) or transfer of care to another physician.15 A prudent clinic or practitioner will describe other mental health resources in the community and sometimes assist with referral if the inquiring potential patient needs services that the provider does not offer.
In many communities, finding appropriate mental health resources is difficult. Creative approaches to this problem include transitional psychiatry or crisis support clinics that serve as a “bridge” to longer-term services,21,22 preliminary process groups,23 and telepsychiatry transitional clinics.24 When a clinic does not accept a person as a patient, the clinic should clearly document 1) key features of the contact and 2) the rationale for that decision
Bottom Line
You have a right and a responsibility to screen prospective patients for good fit to your treatment services. In doing so, however, you might inadvertently create a physician-patient relationship. If this happens, you should fulfill your clinical responsibilities, as you would for any patient, by helping the patient get appropriate care from you or another provider.
Disclosures
The authors report no financial relationship with any company whose products are mentioned in this article or with manufacturers of competing products.
1. Shoffner J, Staudt M, Marcus S, et al. Using telephone reminders to increase attendance at psychiatric appointments: findings of a pilot study in rural Appalachia. Psychiatr Serv. 2007;58(6):872-875.
2. Hiser v Randolph, 1980 617 P2d 774 (Ariz App).
3. American Psychiatric Association. Practice management for early career psychiatrists: a reference guide, 6th edition. http://www.psych.org/practice/managing-a-practice/ starting-a-practice. Published October 16, 2006. Accessed July 8, 2014.
4. Delgado SV, Strawn JR. Difficult psychiatric consultations: an integrated approach. New York, NY: Springer; 2014.
5. Aziz MA, Kenford S. Comparability of telephone and face-to-face interviews in assessing patients with posttraumatic stress disorder. J Psychiatric Pract. 2004;10(5): 307-313.
6. Michel C, Schimmelmann BG, Kupferschmid S, et al. Reliability of telephone assessments of at-risk criteria of psychosis: a comparison to face-to-face interviews. Schizophr Res. 2014;153(1-3):251-253.
7. Muskens EM, Lucassen P, Groenleer W, et al. Psychiatric diagnosis by telephone: is it an opportunity [published online March 15, 2014]? Soc Psychiatry Psychiatr Epidemiol. doi: 10.1007/s00127-014-0861-9.
8. Cassel CK, Guest JA. Choosing wisely: helping physicians and patients make smart decisions about their care. JAMA. 2012;307(17):1801-1802.
9. Roberts v Sankey, 2004 813 NE2d 1195 (Ind App).
10. O’Neill v Montefiore Hospital, 1960 202 NYS 2d 436 (NY App).
11. McKinney v Schlatter, 1997 692 NE2d 1045 (Ohio App).
12. Dehn v Edgecombe, 865 A2d 603 (Md 2005).
13. Kelley v Middle Tennessee Emergency Physicians, 133 SW3d 587 (Tenn 2004).
14. Oliver v Brock, 342 So2d 1 (Ala 1976).
15. Appelbaum PS, Gutheil TG. Malpractice and other forms of liability. In: Appelbaum PS, Gutheil TG, eds. Clinical Handbook of Psychiatry and the Law, 4th ed. Philadelphia, PA: Lippincott Williams and Wilkins; 2007:115-116.
16. Simon RI, Shuman DW. The doctor-patient relationship. Focus. 2007;5(4):423-431.
17. Torres A, Wagner R. Establishing the physician-patient relationship. J Dermatol Surg Oncol. 1993;19(2):147-149.
18. Aboff BM, Collier VU, Farber NJ, et al. Residents’ prescription writing for nonpatients. JAMA. 2002;288(3):381-385.
19. Edersheim JG, Stern TA. Liability associated with prescribing medications. Prim Care Companion J Clin Psychiatry. 2009;11(3):115-119.
20. Brown v Koulizakis, 331 SE2d 440 (Va 1985).
21. University of Michigan Department of Psychiatry. Crisis support clinic. http://www.psych.med.umich.edu/patient-care/crisis-support-clinic. Accessed July 9, 2014.
22. UAB Department of Psychiatry. http://www.uab.edu/ medicine/psychiatry. Accessed July 9, 2014.
23. Stone WN, Klein EB. The waiting-list group. Int J Group Psychother. 1999;49(4):417-428.
24. Detweiler MB, Arif S, Candelario J, et al. A telepsychiatry transition clinic: the first 12 months experience. J Telemed Telecare. 2011;17(6):293-297.
A young man with psychosis whose heart is racing
Case Agitated and violent
Mr. C, age 19, presents with anxiety, agitation, isolation, social withdrawal, and paranoia. He is admitted to the inpatient unit after attempting to punch his father and place him in a headlock. Mr. C has no history of mental illness, no significant medical history, and no significant family history of mental illness.
The treatment team determines that this is Mr. C’s first psychotic break. He is given a diagnosis of psychosis, not otherwise specified and started on risperidone, titrated to 2 mg/d, later discontinued secondary to tachycardia. He is then started on haloperidol, 5 mg/d titrated to 10 mg/d, and psychotic symptoms abate. Mr. C is discharged with a plan to receive follow-up care at an outpatient mental health center.
One year later, Mr. C is readmitted with a similar presentation: paranoia, agitation, anxiety, and isolation. After discharge, he starts an intensive outpatient program (IOP) for long-term treatment of adults who have a diagnosis of a schizophrenia spectrum disorder.
Several medication trials ensue, including risperidone, escitalopram, citalopram, fluphenazine, lorazepam, quetiapine, and haloperidol. Despite these trials over the course of 2 years, Mr. C continues to display paranoia and agitation, and is unable to resume academic and community activities. Within the IOP, Mr. C is placed in a vocational training program and struggles to remain stable enough to continue his job at a small greenhouse.
Concurrently, Mr. C is noted to be abusing alcohol. After the IOP treatment team expresses concern about his abuse, he reduces alcohol intake and he and his parents are educated on the impact of alcohol use on schizophrenia.
Which treatment option would you choose next?
a) initiate a trial of clozapine
b) try a long-acting injectable antipsychotic
c) recommend inpatient treatment
The authors’ observations
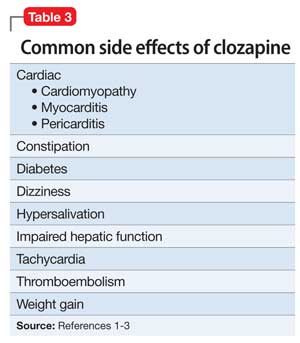
Clozapine is an atypical antipsychotic that is FDA-approved for treatment-resistant schizophrenia; it also helps reduce recurrent suicidal behavior in patients with schizophrenia or schizoaffective disorder.
Clozapine works by blocking D2 receptors, thereby reducing positive symptoms. It also blocks serotonin 2A receptors, which enhances dopamine release in certain brain regions, thereby reducing motor side effects. Interactions at 5-HT2C and 5-HT1A receptors may address cognitive and affective symptoms. Clozapine can help relieve negative symptoms and can decrease aggression. Because it has a low risk of tardive dyskinesia, clozapine is useful when treating patients with treatment-resistant schizophrenia.1-3
Treatment Quick heart rate
Mr. C’s IOP treatment team considers a clozapine trial because previous medication trials failed. All paperwork for the registry and screening labs are completed and Mr. C is started on clozapine.
Mr. C’s clozapine dosages are:
• Days 1 to 9: 25 mg/d
• Days 10 to 16: 50 mg/d
• Days 17 to 23: 75 mg/d
• Days 24 to 32: 100 mg/d
• Days 33 to 37: 125 mg/d
• Day 38: 150 mg/d.
On Day 45 of the clozapine trial, Mr. C is increasingly paranoid toward his father and thinks that his father is controlling his thoughts. Mr. C tells the attending psychiatrist that he ingested a handful of clonazepam and considered putting a bag over his head with the intent to commit suicide. Mr. C is admitted to the inpatient unit.
Admission vitals recorded a heart rate of 72 beats per minute but, later that day, the rate was recorded in the vital sign book as 137 beats per minute. The treatment team considers dehydration, anxiety, and staff error; Mr. C is observed carefully. Over the next 2 days, heart rate remains between 102 and 119 beats per minute.
Because of persistent tachycardia, the team orders lab studies, a medical consult, and an electrocardiogram (ECG). Thyroid panel, electrolytes, and clozapine level are within normal limits; ECG is unremarkable.
Although tachycardia is a known side effect of clozapine,3,4 we order an echocardiogram because of Mr. C’s young age and non-diagnostic laboratory workup. The echo study demonstrates reduced left-ventricular ejection fraction (LVEF) of 45%. Tests for HIV infection and Lyme disease are negative. The cardiology team diagnoses cardiomyopathy of unknown origin.
Although Mr. C has a history of alcohol abuse, the cardiology team believes that alcohol consumption does not adequately explain the cardiomyopathy, given his young age and the limited number of lifetime drinking-years (approximately 4 or 5); the team determines that clozapine is causing secondary cardiomyopathy and tachycardia, leading to reduced LVEF. Clozapine is stopped because the recommended treatment for toxic secondary cardiomyopathy is to remove the offending agent. At this point, the clozapine dosage is 250 mg/d.
At the medical team’s recommendation, Mr. C is started on metoprolol, a beta blocker, at 25 mg/d.
The etiology of secondary cardiomyopathy includes all of the following except:
a) tachycardia-induced
b) autoimmune
c) radiation-induced
d) infiltrative
e) endomyocardial
The authors’ observations
Cardiomyopathies are diseases of the heart muscle causing mechanical and electrical dysfunction. This group of diseases has a range of symptoms, causes, and treatments. Disease manifests typically as arrhythmia, systolic dysfunction, or diastolic dysfunction. Classification systems are based on origin, anatomy, physiology, primary treatments, method of diagnosis, biopsy, histopathology, and symptomatic state.
The American Heart Association Scientific Statement5 distinguishes cardiomyopathies by degree of organ involvement. Diseases confined to the heart are defined as primary cardiomyopathy, which may have a genetic, acquired, or mixed cause. Acquired causes include inflammatory (myocarditis), stress (Takotsubo), peripartum, and tachycardia. Cardiomyopathies that are part of generalized systemic disorders are defined as secondary cardiomyopathy (Table 1).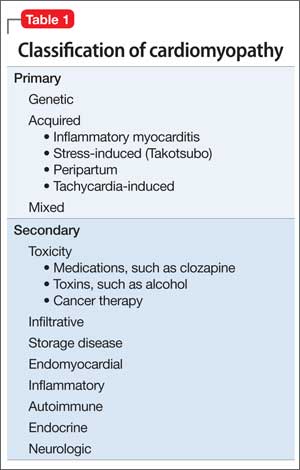
Secondary cardiomyopathies have many causes. These include toxicity (medications or alcohol), cancer therapy, infiltrative, storage disease, and endomyocardial, inflammatory, autoimmune, endocrine, and neurologic diseases.5
Evaluation of suspected cardiomyopathy begins with a history and physical focused on identifying causative factors. Selective testing, based on pretest probabilities, might include lab testing, ECG, and echocardiography, and can narrow the differential diagnosis. When toxin-induced cardiomyopathy is suspected, withdrawing the toxin and monitoring for improvement is recommended. The treatment and prognosis for cardiomyopathies vary, based on the cause.6
Review of the literature
After 23 cases of fatal and non-fatal myocarditis were found in a study of 8,000 patients starting clozapine,7 manufacturers in Australia introduced clinical guidelines. Before initiating clozapine, they recommended, clinicians should:
• screen for cardiac symptoms
• screen for a family history of heart disease
• obtain baseline ECG
• obtain baseline markers of myocardial damage (troponin assay and serum creatinine)
• obtain baseline echocardiogram
• repeat cardiac monitoring after the first and second week and then repeat in 6 months
• maintain a high degree of vigilance for signs and symptoms of cardiac toxicity throughout clozapine treatment.8,9
After studying 38 cases of clozapine-induced myocarditis—3 fatal— Ronaldson et al10 listed primary diagnostic features as:
• tachycardia (heart rate >100 beats per minute)
• heart rate >120 beats per minute
• temperature >37°C
• chest pain
• troponin I/T level >2 ng/mL
• C-reactive protein (CRP) > 100 mg/L
• erythrocyte sedimentation rate >50 mm/h.
Among non-fatal cases, symptoms abated after clozapine was discontinued. In 36 of the 38 cases, symptoms emerged 14 to 22 days after clozapine was started. For tachycardia to be considered a diagnostic feature, it must persist for at least 24 hours; if the heart rate is ≥120 beats per minute, however, persistence is not a criterion. It was thought that elevated CRP might herald disease onset; the authors suggest that CRP >50 mg/L should warrant increased monitoring with daily ECG and troponin levels.
Authors’ recommendations include:
• measuring troponin and CRP and order an ECG at baseline and at 7, 14, 21, and 28 days
• examining patient for signs and symptoms of illness at these same intervals
• considering chest pain or fever as an indicator of cardiomyopathy
• asking patients to report any illness during this 4-week period
• if ECG is abnormal or troponin elevated, decreasing clozapine pending further investigation.10
When medications fail
We had to discontinue Mr. C’s clozapine, which meant that the therapeutic relationship established between him and the psychology fellow became an important and, at times, the only bond between him and the medical team while olanzapine was initiated. The alliance between patient and clinician is an important factor for positive prognosis in mental health treatment.11-13 Priebe and McCabe14 asked if the therapeutic relationship in psychiatry is “the basis of therapy or therapy itself?” In a review of studies that used an operationalized measurement of the therapeutic relationship in treating severe mental illness, the authors concluded that the therapeutic relationship is a reliable predictor of outcome.15
In Mr. C’s case, the psychology fellow, who also works with the Partial Hospitalization Program/Intensive Outpatient Program (PHP/IOP), joined the treatment team on the inpatient unit a few days into hospitalization. Eleven meetings, including a discharge session, were held between the psychology fellow and the patient during the inpatient hospitalization. Mr. C also participated in a daily group session, facilitated by the psychology fellow.
Maintaining recognition of the boundary disturbance that characterizes schizophrenic psychoses was important for Mr. C. As Auerhahn and Moskowitz16 wrote, the inpatient therapist can be transformed by the schizophrenia patient into the all-knowing, all-powerful early mother, which could contribute to substantial improvement in the patient’s functioning and report of symptoms, only to have the patient’s symptoms return after discharge.
In an effort to evaluate the duration, frequency, and intensity of Mr. C’s symptom experience, a goal of Mr. C’s hospitalization was to attach words to his internal states, including mood and intensity of paranoid ideation. We showed Mr. C directly and indirectly that reporting intensification of symptoms and decreased functioning would not result in abandonment or punishment, and worked to demonstrate through our actions that the treatment team differs from Mr. C’s view of the world as dangerous and others as hostile and omnipotent.
Treatment Developing language
Initially, Mr. C gives a number (from 1 to 10) to describe his mood, 10 being the happiest he has ever felt and 1 being the most depressed. The treatment team discusses how important it is that Mr. C know his feelings and be able to convey to others how he feels.
Over time, Mr. C is encouraged to attach a feeling word to the number, and by discharge, he stops using numbers and responds to inquiries about his feelings with a mood word. This practice has been reinforced with the patient in the IOP program, allowing him to continue practicing linking his internal state with feeling words.
During hospitalization, Mr. C becomes more vocal about his level of paranoia and is now more likely to seek support when he first experiences a paranoid thought, rather than waiting until after he is paranoid and agitated. Mr. C is encouraged to monitor his thoughts and feelings, and to practice coping strategies he has identified as helpful, including deep breathing, meditation, listening to music, and reminding himself that he is safe.
The treatment team responds to Mr. C’s reports of paranoid ideation (eg, “Some of the other patients were talking about me today”) by processing the affect, and hypothesizing other explanations for these events to slow down “jumping to conclusions,” which is a common part of the paranoid experience.17 Additionally, all meetings with the cardiology team are processed and Mr. C receives psychoeducation about his heart function. Joint sessions with the psychiatry resident and psychology fellow allow Mr. C to ask medical questions and immediately process his reactions, which likely ameliorated his anxiety and allowed him to continue connecting with, identifying, and verbalizing his internal experiences. Given his history of paranoia, sessions also showed that Mr. C is an active participant in his treatment, with the hope of lessening his belief that bad things happen to him and that they are out of his control.
We maintain frequent contact with Mr. C’s parents to update them on their son’s functioning and to discuss treatment interventions that were helpful and the family could implement when Mr. C returns home. Discharge medications are discussed.
After 24 days in the inpatient unit, Mr. C is discharged to the IOP program. The psychology fellow walks Mr. C to the IOP program, where he transitioned immediately from inpatient to the IOP daily schedule of groups and an appointment with the program psychiatrist. The psychology fellow also arranged for and participated in the family meeting with Mr. C’s parents, sister, and treatment providers in the IOP program after his first day back at the IOP.
Throughout his hospitalization, Mr. C had no symptoms of cardiomyopathy, without exercise intolerance, shortness of breath, fatigue, or fever. He is discharged with follow-up care at his outpatient program at the PHP level of care and a follow-up echocardiogram and cardiology appointment are scheduled for 6 weeks later.
The authors' observations
Throughout Mr. C’s hospitalization, the intersections among psychiatry, psychology, cardiology, and internal medicine were apparent and necessary for treatment. No one specialty was able to completely direct this patient’s care without the expertise of, and input from, others. When it looked like all medications had failed, the relationship between the patient and the psychology fellow and the application of previously learned coping strategies prevented acute decompensation.
Clozapine is FDA-approved for treatment-resistant schizophrenia and often is a last resort to help patients remain stable. When clozapine is chosen, it is important to be aware of its side-effect profile (Table 2,1 and Table 3,1-3) and the need for monitoring. The importance of relying on colleagues from other specialties to assist in the effective monitoring process cannot be overstated. This multidisciplinary team ensured that Mr. C did not experience acute decompensation during this process. Cardiac function improved, with an LVEF of 50% after clozapine was discontinued. Mr. C has not needed hospitalization again.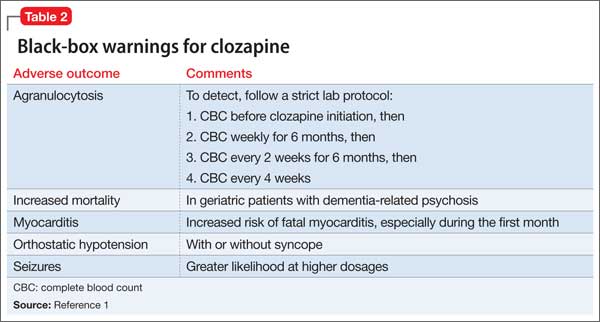
Outcome Stability achieved
Mr. C is successfully discharged from the inpatient service after 24 days in the hospital on the following regimen: olanzapine, 20 mg/d; duloxetine 60 mg/d; benztropine, 0.5 mg/d; haloperidol, 20 mg/d; metoprolol, 25 mg/d; clonazepam, 0.25 mg/d; quetiapine, 50 mg/d; and chlorpromazine, 50 mg as needed for agitation and paranoia. He is given a diagnosis of toxic secondary cardiomyopathy due to clozapine, and remains asymptomatic from a cardiac perspective after discontinuing clozapine.
Follow-up appointment with cardiology and repeat echocardiography were scheduled for 6 weeks after discharge. The follow-up echocardiogram showed improvement (LVEF, 50%). Mr. C continues to do well and remains a client at the IOP program.
Bottom Line
Clozapine often is used as a last resort for patients with treatment-resistant schizophrenia, but its side-effect profile requires careful management and monitoring. If a patient taking clozapine shows tachycardia, consider cardiomyopathy. Evaluation might include lab testing, electrocardiography, and echocardiography. Symptoms often resolve when clozapine is discontinued.
Related Resources
• Citrome L. Clozapine for schizophrenia: life-threatening or life-saving treatment? Current Psychiatry. 2009;8(12):56-63.
• Layland JJ, Liew D, Prior DL. Clozapine-induced cardiotoxicity: a clinical update. Med J Aust. 2009;190(4):190-192.
Drug Brand Names
Benztropine • Cogentin Fluphenazine • Prolixin
Chlorpromazine • Thorazine Haloperidol • Haldol
Citalopram • Celexa Lorazepam • Ativan
Clonazepam • Klonopin Metoprolol • Lopressor
Clozapine • Clozaril Olanzapine • Zyprexa
Duloxetine • Cymbalta Quetiapine • Seroquel
Escitalopram • Lexapro Risperidone • Risperdal
Disclosure
The authors report no financial relationship with any company whose products are mentioned in this article or with manufacturers of competing products.
1. Clozaril [package insert]. East Hanover, NJ: Novartis Pharmaceuticals Corporation; 2013.
2. Stahl SM. Clozapine. In: Stahl SM. The prescriber’s guide: Stahl’s essential psychopharmacology. 3rd ed. New York, NY: Cambridge University Press; 2009:113-118.
3. Young CR, Bowers MB Jr, Mazure CM. Management of the adverse effects of clozapine. Schizophr Bull. 1998;24(3):381-388.
4. Lang UE, Willbring M, von Golitschek R, et al. Clozapine-induced myocarditis after long-term treatment: case presentation and clinical perspectives. J Psychopharmacol. 2008;22(5):576-580.
5. Maron BJ, Towbin JA, Thiene G, et al; American Heart Association; Council on Clinical Cardiology, Heart Failure and Transplantation Committee; Quality of Care and Outcomes Research and Functional Genomics and Translational Biology Interdisciplinary Working Groups; Council on Epidemiology and Prevention. Contemporary definitions and classification of the cardiomyopathies: an American Heart Association scientific statement from the Council on Clinical Cardiology, Heart Failure and Transplantation Committee; Quality of Care and Outcomes Research and Functional Genomics and Translational Biology Interdisciplinary Working Groups; and Council on Epidemiology and Prevention. Circulation. 2006;113(14):1807-1816.
6. Hare JM. The dilated, restrictive, and infiltrative cardiomyopathies. In: Braunwald’s heart disease: a textbook of cardiovascular medicine. 9th ed. Bonow RO, Mann DL, Zipes DP, eds. New York, NY: Elsevier; 2012:1561-1581.
7. Kilian JG, Kerr K, Lawrence C, et al. Myocarditis and cardiomyopathy associated with clozapine. Lancet. 1999;354(9193):1841-1845.
8. Clopine [package insert]. Aukland, New Zealand: Douglas Pharmaceuticals; 2014.
9. Killian JG, Kerr K, Lawrence C, et al. Myocarditis and cardiomyopathy associated with clozapine. Lancet. 1999; 354(9193):1841-1845.
10. Ronaldson KJ, Taylor AJ, Fitzgerald PB, et al. Diagnostic characteristics of clozapine-induced myocarditis identified by an analysis of 38 cases and 47 controls. J Clin Psychiatry. 2010;71(8):976-981.
11. Rogers CR. On becoming a person: a therapist’s view of psychotherapy. New York, NY: Houghton Mifflin; 1961.
12. Horvath AO, Symonds BD. Relation between a working alliance and outcome in psychotherapy: a meta-analysis. Journal of Counseling Psychology. 1991;38(2):139-149.
13. Krupnick JL, Sotsky SM, Simmens S, et al. The role of the therapeutic alliance in psychotherapy and pharmacotherapy outcome: Findings in the National Institute of Mental Health Treatment of Depression Collaborative Research Program. Journal of Consulting and Clinical Psychology. 1996;64(3):532-539.
14. Priebe S, McCabe R. Therapeutic relationships in psychiatry: the basis of therapy or therapy in itself? Int Rev Psychiatry. 2008;20(6):521-526.
15. McCabe R, Priebe S. The therapeutic relationship in the treatment of severe mental illness: a review of methods and findings. Int J Soc Psychiatry. 2004;50(2):115-128.
16. Auerhahn NC, Moskowitz MB. Merger fantasies in individual inpatient therapy with schizophrenic patient. Psychoanalytic Psychology. 1984;1(2):131-148.
17. Penn DL, Roberts DL, Combs D, et al. Best practices: The development of the Social Cognition and Interaction Training program for schizophrenia spectrum disorders. Psychiatr Serv. 2007;58(4):449-451.
Case Agitated and violent
Mr. C, age 19, presents with anxiety, agitation, isolation, social withdrawal, and paranoia. He is admitted to the inpatient unit after attempting to punch his father and place him in a headlock. Mr. C has no history of mental illness, no significant medical history, and no significant family history of mental illness.
The treatment team determines that this is Mr. C’s first psychotic break. He is given a diagnosis of psychosis, not otherwise specified and started on risperidone, titrated to 2 mg/d, later discontinued secondary to tachycardia. He is then started on haloperidol, 5 mg/d titrated to 10 mg/d, and psychotic symptoms abate. Mr. C is discharged with a plan to receive follow-up care at an outpatient mental health center.
One year later, Mr. C is readmitted with a similar presentation: paranoia, agitation, anxiety, and isolation. After discharge, he starts an intensive outpatient program (IOP) for long-term treatment of adults who have a diagnosis of a schizophrenia spectrum disorder.
Several medication trials ensue, including risperidone, escitalopram, citalopram, fluphenazine, lorazepam, quetiapine, and haloperidol. Despite these trials over the course of 2 years, Mr. C continues to display paranoia and agitation, and is unable to resume academic and community activities. Within the IOP, Mr. C is placed in a vocational training program and struggles to remain stable enough to continue his job at a small greenhouse.
Concurrently, Mr. C is noted to be abusing alcohol. After the IOP treatment team expresses concern about his abuse, he reduces alcohol intake and he and his parents are educated on the impact of alcohol use on schizophrenia.
Which treatment option would you choose next?
a) initiate a trial of clozapine
b) try a long-acting injectable antipsychotic
c) recommend inpatient treatment
The authors’ observations
Clozapine is an atypical antipsychotic that is FDA-approved for treatment-resistant schizophrenia; it also helps reduce recurrent suicidal behavior in patients with schizophrenia or schizoaffective disorder.
Clozapine works by blocking D2 receptors, thereby reducing positive symptoms. It also blocks serotonin 2A receptors, which enhances dopamine release in certain brain regions, thereby reducing motor side effects. Interactions at 5-HT2C and 5-HT1A receptors may address cognitive and affective symptoms. Clozapine can help relieve negative symptoms and can decrease aggression. Because it has a low risk of tardive dyskinesia, clozapine is useful when treating patients with treatment-resistant schizophrenia.1-3
Treatment Quick heart rate
Mr. C’s IOP treatment team considers a clozapine trial because previous medication trials failed. All paperwork for the registry and screening labs are completed and Mr. C is started on clozapine.
Mr. C’s clozapine dosages are:
• Days 1 to 9: 25 mg/d
• Days 10 to 16: 50 mg/d
• Days 17 to 23: 75 mg/d
• Days 24 to 32: 100 mg/d
• Days 33 to 37: 125 mg/d
• Day 38: 150 mg/d.
On Day 45 of the clozapine trial, Mr. C is increasingly paranoid toward his father and thinks that his father is controlling his thoughts. Mr. C tells the attending psychiatrist that he ingested a handful of clonazepam and considered putting a bag over his head with the intent to commit suicide. Mr. C is admitted to the inpatient unit.
Admission vitals recorded a heart rate of 72 beats per minute but, later that day, the rate was recorded in the vital sign book as 137 beats per minute. The treatment team considers dehydration, anxiety, and staff error; Mr. C is observed carefully. Over the next 2 days, heart rate remains between 102 and 119 beats per minute.
Because of persistent tachycardia, the team orders lab studies, a medical consult, and an electrocardiogram (ECG). Thyroid panel, electrolytes, and clozapine level are within normal limits; ECG is unremarkable.
Although tachycardia is a known side effect of clozapine,3,4 we order an echocardiogram because of Mr. C’s young age and non-diagnostic laboratory workup. The echo study demonstrates reduced left-ventricular ejection fraction (LVEF) of 45%. Tests for HIV infection and Lyme disease are negative. The cardiology team diagnoses cardiomyopathy of unknown origin.
Although Mr. C has a history of alcohol abuse, the cardiology team believes that alcohol consumption does not adequately explain the cardiomyopathy, given his young age and the limited number of lifetime drinking-years (approximately 4 or 5); the team determines that clozapine is causing secondary cardiomyopathy and tachycardia, leading to reduced LVEF. Clozapine is stopped because the recommended treatment for toxic secondary cardiomyopathy is to remove the offending agent. At this point, the clozapine dosage is 250 mg/d.
At the medical team’s recommendation, Mr. C is started on metoprolol, a beta blocker, at 25 mg/d.
The etiology of secondary cardiomyopathy includes all of the following except:
a) tachycardia-induced
b) autoimmune
c) radiation-induced
d) infiltrative
e) endomyocardial
The authors’ observations
Cardiomyopathies are diseases of the heart muscle causing mechanical and electrical dysfunction. This group of diseases has a range of symptoms, causes, and treatments. Disease manifests typically as arrhythmia, systolic dysfunction, or diastolic dysfunction. Classification systems are based on origin, anatomy, physiology, primary treatments, method of diagnosis, biopsy, histopathology, and symptomatic state.
The American Heart Association Scientific Statement5 distinguishes cardiomyopathies by degree of organ involvement. Diseases confined to the heart are defined as primary cardiomyopathy, which may have a genetic, acquired, or mixed cause. Acquired causes include inflammatory (myocarditis), stress (Takotsubo), peripartum, and tachycardia. Cardiomyopathies that are part of generalized systemic disorders are defined as secondary cardiomyopathy (Table 1).
Secondary cardiomyopathies have many causes. These include toxicity (medications or alcohol), cancer therapy, infiltrative, storage disease, and endomyocardial, inflammatory, autoimmune, endocrine, and neurologic diseases.5
Evaluation of suspected cardiomyopathy begins with a history and physical focused on identifying causative factors. Selective testing, based on pretest probabilities, might include lab testing, ECG, and echocardiography, and can narrow the differential diagnosis. When toxin-induced cardiomyopathy is suspected, withdrawing the toxin and monitoring for improvement is recommended. The treatment and prognosis for cardiomyopathies vary, based on the cause.6
Review of the literature
After 23 cases of fatal and non-fatal myocarditis were found in a study of 8,000 patients starting clozapine,7 manufacturers in Australia introduced clinical guidelines. Before initiating clozapine, they recommended, clinicians should:
• screen for cardiac symptoms
• screen for a family history of heart disease
• obtain baseline ECG
• obtain baseline markers of myocardial damage (troponin assay and serum creatinine)
• obtain baseline echocardiogram
• repeat cardiac monitoring after the first and second week and then repeat in 6 months
• maintain a high degree of vigilance for signs and symptoms of cardiac toxicity throughout clozapine treatment.8,9
After studying 38 cases of clozapine-induced myocarditis—3 fatal— Ronaldson et al10 listed primary diagnostic features as:
• tachycardia (heart rate >100 beats per minute)
• heart rate >120 beats per minute
• temperature >37°C
• chest pain
• troponin I/T level >2 ng/mL
• C-reactive protein (CRP) > 100 mg/L
• erythrocyte sedimentation rate >50 mm/h.
Among non-fatal cases, symptoms abated after clozapine was discontinued. In 36 of the 38 cases, symptoms emerged 14 to 22 days after clozapine was started. For tachycardia to be considered a diagnostic feature, it must persist for at least 24 hours; if the heart rate is ≥120 beats per minute, however, persistence is not a criterion. It was thought that elevated CRP might herald disease onset; the authors suggest that CRP >50 mg/L should warrant increased monitoring with daily ECG and troponin levels.
Authors’ recommendations include:
• measuring troponin and CRP and order an ECG at baseline and at 7, 14, 21, and 28 days
• examining patient for signs and symptoms of illness at these same intervals
• considering chest pain or fever as an indicator of cardiomyopathy
• asking patients to report any illness during this 4-week period
• if ECG is abnormal or troponin elevated, decreasing clozapine pending further investigation.10
When medications fail
We had to discontinue Mr. C’s clozapine, which meant that the therapeutic relationship established between him and the psychology fellow became an important and, at times, the only bond between him and the medical team while olanzapine was initiated. The alliance between patient and clinician is an important factor for positive prognosis in mental health treatment.11-13 Priebe and McCabe14 asked if the therapeutic relationship in psychiatry is “the basis of therapy or therapy itself?” In a review of studies that used an operationalized measurement of the therapeutic relationship in treating severe mental illness, the authors concluded that the therapeutic relationship is a reliable predictor of outcome.15
In Mr. C’s case, the psychology fellow, who also works with the Partial Hospitalization Program/Intensive Outpatient Program (PHP/IOP), joined the treatment team on the inpatient unit a few days into hospitalization. Eleven meetings, including a discharge session, were held between the psychology fellow and the patient during the inpatient hospitalization. Mr. C also participated in a daily group session, facilitated by the psychology fellow.
Maintaining recognition of the boundary disturbance that characterizes schizophrenic psychoses was important for Mr. C. As Auerhahn and Moskowitz16 wrote, the inpatient therapist can be transformed by the schizophrenia patient into the all-knowing, all-powerful early mother, which could contribute to substantial improvement in the patient’s functioning and report of symptoms, only to have the patient’s symptoms return after discharge.
In an effort to evaluate the duration, frequency, and intensity of Mr. C’s symptom experience, a goal of Mr. C’s hospitalization was to attach words to his internal states, including mood and intensity of paranoid ideation. We showed Mr. C directly and indirectly that reporting intensification of symptoms and decreased functioning would not result in abandonment or punishment, and worked to demonstrate through our actions that the treatment team differs from Mr. C’s view of the world as dangerous and others as hostile and omnipotent.
Treatment Developing language
Initially, Mr. C gives a number (from 1 to 10) to describe his mood, 10 being the happiest he has ever felt and 1 being the most depressed. The treatment team discusses how important it is that Mr. C know his feelings and be able to convey to others how he feels.
Over time, Mr. C is encouraged to attach a feeling word to the number, and by discharge, he stops using numbers and responds to inquiries about his feelings with a mood word. This practice has been reinforced with the patient in the IOP program, allowing him to continue practicing linking his internal state with feeling words.
During hospitalization, Mr. C becomes more vocal about his level of paranoia and is now more likely to seek support when he first experiences a paranoid thought, rather than waiting until after he is paranoid and agitated. Mr. C is encouraged to monitor his thoughts and feelings, and to practice coping strategies he has identified as helpful, including deep breathing, meditation, listening to music, and reminding himself that he is safe.
The treatment team responds to Mr. C’s reports of paranoid ideation (eg, “Some of the other patients were talking about me today”) by processing the affect, and hypothesizing other explanations for these events to slow down “jumping to conclusions,” which is a common part of the paranoid experience.17 Additionally, all meetings with the cardiology team are processed and Mr. C receives psychoeducation about his heart function. Joint sessions with the psychiatry resident and psychology fellow allow Mr. C to ask medical questions and immediately process his reactions, which likely ameliorated his anxiety and allowed him to continue connecting with, identifying, and verbalizing his internal experiences. Given his history of paranoia, sessions also showed that Mr. C is an active participant in his treatment, with the hope of lessening his belief that bad things happen to him and that they are out of his control.
We maintain frequent contact with Mr. C’s parents to update them on their son’s functioning and to discuss treatment interventions that were helpful and the family could implement when Mr. C returns home. Discharge medications are discussed.
After 24 days in the inpatient unit, Mr. C is discharged to the IOP program. The psychology fellow walks Mr. C to the IOP program, where he transitioned immediately from inpatient to the IOP daily schedule of groups and an appointment with the program psychiatrist. The psychology fellow also arranged for and participated in the family meeting with Mr. C’s parents, sister, and treatment providers in the IOP program after his first day back at the IOP.
Throughout his hospitalization, Mr. C had no symptoms of cardiomyopathy, without exercise intolerance, shortness of breath, fatigue, or fever. He is discharged with follow-up care at his outpatient program at the PHP level of care and a follow-up echocardiogram and cardiology appointment are scheduled for 6 weeks later.
The authors' observations
Throughout Mr. C’s hospitalization, the intersections among psychiatry, psychology, cardiology, and internal medicine were apparent and necessary for treatment. No one specialty was able to completely direct this patient’s care without the expertise of, and input from, others. When it looked like all medications had failed, the relationship between the patient and the psychology fellow and the application of previously learned coping strategies prevented acute decompensation.
Clozapine is FDA-approved for treatment-resistant schizophrenia and often is a last resort to help patients remain stable. When clozapine is chosen, it is important to be aware of its side-effect profile (Table 2,1 and Table 3,1-3) and the need for monitoring. The importance of relying on colleagues from other specialties to assist in the effective monitoring process cannot be overstated. This multidisciplinary team ensured that Mr. C did not experience acute decompensation during this process. Cardiac function improved, with an LVEF of 50% after clozapine was discontinued. Mr. C has not needed hospitalization again.
Outcome Stability achieved
Mr. C is successfully discharged from the inpatient service after 24 days in the hospital on the following regimen: olanzapine, 20 mg/d; duloxetine 60 mg/d; benztropine, 0.5 mg/d; haloperidol, 20 mg/d; metoprolol, 25 mg/d; clonazepam, 0.25 mg/d; quetiapine, 50 mg/d; and chlorpromazine, 50 mg as needed for agitation and paranoia. He is given a diagnosis of toxic secondary cardiomyopathy due to clozapine, and remains asymptomatic from a cardiac perspective after discontinuing clozapine.
Follow-up appointment with cardiology and repeat echocardiography were scheduled for 6 weeks after discharge. The follow-up echocardiogram showed improvement (LVEF, 50%). Mr. C continues to do well and remains a client at the IOP program.
Bottom Line
Clozapine often is used as a last resort for patients with treatment-resistant schizophrenia, but its side-effect profile requires careful management and monitoring. If a patient taking clozapine shows tachycardia, consider cardiomyopathy. Evaluation might include lab testing, electrocardiography, and echocardiography. Symptoms often resolve when clozapine is discontinued.
Related Resources
• Citrome L. Clozapine for schizophrenia: life-threatening or life-saving treatment? Current Psychiatry. 2009;8(12):56-63.
• Layland JJ, Liew D, Prior DL. Clozapine-induced cardiotoxicity: a clinical update. Med J Aust. 2009;190(4):190-192.
Drug Brand Names
Benztropine • Cogentin Fluphenazine • Prolixin
Chlorpromazine • Thorazine Haloperidol • Haldol
Citalopram • Celexa Lorazepam • Ativan
Clonazepam • Klonopin Metoprolol • Lopressor
Clozapine • Clozaril Olanzapine • Zyprexa
Duloxetine • Cymbalta Quetiapine • Seroquel
Escitalopram • Lexapro Risperidone • Risperdal
Disclosure
The authors report no financial relationship with any company whose products are mentioned in this article or with manufacturers of competing products.
1. Clozaril [package insert]. East Hanover, NJ: Novartis Pharmaceuticals Corporation; 2013.
2. Stahl SM. Clozapine. In: Stahl SM. The prescriber’s guide: Stahl’s essential psychopharmacology. 3rd ed. New York, NY: Cambridge University Press; 2009:113-118.
3. Young CR, Bowers MB Jr, Mazure CM. Management of the adverse effects of clozapine. Schizophr Bull. 1998;24(3):381-388.
4. Lang UE, Willbring M, von Golitschek R, et al. Clozapine-induced myocarditis after long-term treatment: case presentation and clinical perspectives. J Psychopharmacol. 2008;22(5):576-580.
5. Maron BJ, Towbin JA, Thiene G, et al; American Heart Association; Council on Clinical Cardiology, Heart Failure and Transplantation Committee; Quality of Care and Outcomes Research and Functional Genomics and Translational Biology Interdisciplinary Working Groups; Council on Epidemiology and Prevention. Contemporary definitions and classification of the cardiomyopathies: an American Heart Association scientific statement from the Council on Clinical Cardiology, Heart Failure and Transplantation Committee; Quality of Care and Outcomes Research and Functional Genomics and Translational Biology Interdisciplinary Working Groups; and Council on Epidemiology and Prevention. Circulation. 2006;113(14):1807-1816.
6. Hare JM. The dilated, restrictive, and infiltrative cardiomyopathies. In: Braunwald’s heart disease: a textbook of cardiovascular medicine. 9th ed. Bonow RO, Mann DL, Zipes DP, eds. New York, NY: Elsevier; 2012:1561-1581.
7. Kilian JG, Kerr K, Lawrence C, et al. Myocarditis and cardiomyopathy associated with clozapine. Lancet. 1999;354(9193):1841-1845.
8. Clopine [package insert]. Aukland, New Zealand: Douglas Pharmaceuticals; 2014.
9. Killian JG, Kerr K, Lawrence C, et al. Myocarditis and cardiomyopathy associated with clozapine. Lancet. 1999; 354(9193):1841-1845.
10. Ronaldson KJ, Taylor AJ, Fitzgerald PB, et al. Diagnostic characteristics of clozapine-induced myocarditis identified by an analysis of 38 cases and 47 controls. J Clin Psychiatry. 2010;71(8):976-981.
11. Rogers CR. On becoming a person: a therapist’s view of psychotherapy. New York, NY: Houghton Mifflin; 1961.
12. Horvath AO, Symonds BD. Relation between a working alliance and outcome in psychotherapy: a meta-analysis. Journal of Counseling Psychology. 1991;38(2):139-149.
13. Krupnick JL, Sotsky SM, Simmens S, et al. The role of the therapeutic alliance in psychotherapy and pharmacotherapy outcome: Findings in the National Institute of Mental Health Treatment of Depression Collaborative Research Program. Journal of Consulting and Clinical Psychology. 1996;64(3):532-539.
14. Priebe S, McCabe R. Therapeutic relationships in psychiatry: the basis of therapy or therapy in itself? Int Rev Psychiatry. 2008;20(6):521-526.
15. McCabe R, Priebe S. The therapeutic relationship in the treatment of severe mental illness: a review of methods and findings. Int J Soc Psychiatry. 2004;50(2):115-128.
16. Auerhahn NC, Moskowitz MB. Merger fantasies in individual inpatient therapy with schizophrenic patient. Psychoanalytic Psychology. 1984;1(2):131-148.
17. Penn DL, Roberts DL, Combs D, et al. Best practices: The development of the Social Cognition and Interaction Training program for schizophrenia spectrum disorders. Psychiatr Serv. 2007;58(4):449-451.
PTSD ‘updates’ in DSM-5 concerning
As a seasoned psychiatrist, I try to take most events in stride. My main reaction to unsettling events is to flatten down and take my own pulse.
However, when I saw the article in the Lancet Psychiatry (2014 Aug. 14 [doi:10.1016/S2215-0366(14)70235-4]) by my longtime colleague, Col. (Ret.) Charles W. Hoge, M.D., and his coauthors, my pulse went way up, and "Oh, my God" was my very unscientific reaction.

As readers may recall, the new definition of posttraumatic stress disorder raises the number of symptoms from 17 to 20, and 8 of those original symptoms were substantially reworded. In addition, PTSD was moved in the new manual from an anxiety disorder to disorders related to trauma and stressors.
In their study, Dr. Hoge and his coauthors administered surveys to soldiers looking at DSM-IV-TR and DSM-5 criteria. In brief, about a third of soldiers who met DSM-IV-TR criteria for PTSD did not meet DSM-5 criteria. Almost a third were in the opposite camp, meeting DSM-5 but not the older criteria, wrote Dr. Hoge of the Center for Psychiatry and Neuroscience at the Walter Reed Army Institute of Research in Silver Spring, Md. The main issue is about criterion C and the splitting up of avoidance symptoms from depressive symptoms.
Why was my reaction so strong? I had thought that the new criteria would widen those eligible for the diagnosis. Instead, it eliminates almost a third of them, mainly because they did not meet the avoidant criteria. (Please read the article for the full complex details.)
In the disability system in the military and Veterans Affairs system, the diagnosis of PTSD carries major weight. So what will happen if the criteria exclude them?
The good news is that both Veterans Affairs and the Department of Defense have made it clear that service members and veterans who already have the diagnosis according to the DSM-IV will not have it changed as a result of DSM-5, so the new definition mostly pertains to those newly seeking care or benefits now. It remains unclear what diagnosis should be used for those veterans who clearly would have met the previous definition (which has been used for more than 25 years), but not the new one. The DSM-5 recommends the use of adjustment disorder in this case, but some experts are concerned that the use of this diagnosis for this purpose will have negative effects. A major issue is that service members can be separated without benefits for an adjustment disorder. Questions also remain about whether adjustment disorder should have even been paired with PTSD in the same chapter in the new DSM-5.
In the accompanying commentary, Dr. Alexander C. McFarlane, of the Centre for Traumatic Studies at the University of Adelaide, Australia, warns about the negative consequences of the change in definition (Lancet Psychiatry 2014 Aug. 14 [doi:10.1016/S2215-0366(14)70321-9]. He also urges caution when the new diagnosis is used in forensic or disability evaluations.
I recommend that readers review this important article and commentary, and that the military and the VA also take a cautious approach.
Dr. Ritchie is former chief of psychiatry for the U.S. Army and current chief clinical officer in the behavioral health department for the District of Columbia.
As a seasoned psychiatrist, I try to take most events in stride. My main reaction to unsettling events is to flatten down and take my own pulse.
However, when I saw the article in the Lancet Psychiatry (2014 Aug. 14 [doi:10.1016/S2215-0366(14)70235-4]) by my longtime colleague, Col. (Ret.) Charles W. Hoge, M.D., and his coauthors, my pulse went way up, and "Oh, my God" was my very unscientific reaction.
As readers may recall, the new definition of posttraumatic stress disorder raises the number of symptoms from 17 to 20, and 8 of those original symptoms were substantially reworded. In addition, PTSD was moved in the new manual from an anxiety disorder to disorders related to trauma and stressors.
In their study, Dr. Hoge and his coauthors administered surveys to soldiers looking at DSM-IV-TR and DSM-5 criteria. In brief, about a third of soldiers who met DSM-IV-TR criteria for PTSD did not meet DSM-5 criteria. Almost a third were in the opposite camp, meeting DSM-5 but not the older criteria, wrote Dr. Hoge of the Center for Psychiatry and Neuroscience at the Walter Reed Army Institute of Research in Silver Spring, Md. The main issue is about criterion C and the splitting up of avoidance symptoms from depressive symptoms.
Why was my reaction so strong? I had thought that the new criteria would widen those eligible for the diagnosis. Instead, it eliminates almost a third of them, mainly because they did not meet the avoidant criteria. (Please read the article for the full complex details.)
In the disability system in the military and Veterans Affairs system, the diagnosis of PTSD carries major weight. So what will happen if the criteria exclude them?
The good news is that both Veterans Affairs and the Department of Defense have made it clear that service members and veterans who already have the diagnosis according to the DSM-IV will not have it changed as a result of DSM-5, so the new definition mostly pertains to those newly seeking care or benefits now. It remains unclear what diagnosis should be used for those veterans who clearly would have met the previous definition (which has been used for more than 25 years), but not the new one. The DSM-5 recommends the use of adjustment disorder in this case, but some experts are concerned that the use of this diagnosis for this purpose will have negative effects. A major issue is that service members can be separated without benefits for an adjustment disorder. Questions also remain about whether adjustment disorder should have even been paired with PTSD in the same chapter in the new DSM-5.
In the accompanying commentary, Dr. Alexander C. McFarlane, of the Centre for Traumatic Studies at the University of Adelaide, Australia, warns about the negative consequences of the change in definition (Lancet Psychiatry 2014 Aug. 14 [doi:10.1016/S2215-0366(14)70321-9]. He also urges caution when the new diagnosis is used in forensic or disability evaluations.
I recommend that readers review this important article and commentary, and that the military and the VA also take a cautious approach.
Dr. Ritchie is former chief of psychiatry for the U.S. Army and current chief clinical officer in the behavioral health department for the District of Columbia.

Autologous NK cells can fight ALL

Credit: Bjorn Onfelt/Dan Davis
In vitro experiments suggest a patient’s own natural killer (NK) cells can be expanded and modified to fight acute lymphoblastic leukemia (ALL).
Researchers successfully expanded CD56+ cells isolated from the bone marrow and peripheral blood of ALL patients.
And these cells exhibited cytotoxicity against the patients’ own ALL cells. The effect was enhanced by the addition of IL-15 and a monoclonal antibody (mAb) targeting BAFF-R.
Hisham Abdel-Azim, MD, of Children’s Hospital Los Angeles, and his colleagues reported these results in Leukemia.
The researchers first used flow cytometry to detect CD56+ cells in bone marrow and peripheral blood samples from ALL patients. The team discovered these cells were detectable at diagnosis, post-induction, and relapse.
To expand the cells, the researchers cocultured them with artificial antigen-presenting K562 clone 9.mbIL-21 cells. The expanded CD56+ cells demonstrated allogeneic cytotoxicity against ALL cells, even in the absence of antibody.
The addition of a mAb targeting BAFF-R enhanced CD56+ cells’ cytotoxicity against ALL cells. The activity of these CD56+ cells was comparable to that of NK cells derived from healthy patients.
The researchers also compared CD56+CD3- cells to CD56+CD3+ cells and found the CD3- cells exhibited increased levels of activation in antibody-mediated cellular cytotoxicity reactions. The CD56+CD3+ cells were not stimulated by BAFF-R mAbs.
The team then tested the NK cells’ autologous cytotoxicity. And, as in previous experiments, the CD56+ cells from ALL samples demonstrated nonantibody-dependent cytotoxicity and enhanced cytotoxicity in the presence of BAFF-R mAbs.
Finally, the researchers decided to investigate whether the addition of IL-2 or IL-15 could further stimulate CD56+ cells’ cytotoxicity. And while they found that both cytokines did the job, IL-15 proved more successful.
“These results are very promising, with potential as a part of first-line therapy and also as a treatment for eliminating any remaining cancer cells . . . following standard chemotherapy,” Dr Abdel-Azim said. “We anticipate additional preclinical testing and then a clinical trial to evaluate the therapy in children with leukemia.” ![]()
Combo offers better detection of invasive aspergillosis

Results of a retrospective study may have revealed the most accurate way to diagnose invasive aspergillosis (IA).
The fungal infection can be life-threatening, particularly for immunosuppressed patients, but it remains difficult to diagnose.
So researchers compared 3 tests used to diagnose IA and found the combination of nucleic acid sequence-based amplification (NASBA) and real-time quantitative PCR (qPCR) had a 100% positive predictive value.
The team reported this discovery in The Journal of Molecular Diagnostics.
IA is caused by the fungus Aspergillus fumigatus, which is considered by many pathologists to be the world’s most harmful mold.
“Traditional diagnostic methods, such as culture and histopathology of infected tissues, often fail to detect Aspergillus,” said study investigator Yun Xia, PhD, of the First Affiliated Hospital of Chongqing Medical University in China.
With this in mind, he and his colleagues evaluated the diagnostic performance of 2 nucleic acid amplification assays—qPCR and NASBA—and 1 antigen-detection method—galactomannan enzyme-linked immunosorbent assay (GM-ELISA)—using blood samples from 80 patients at high risk of IA.
The researchers evaluated the tests alone and in combination. Of the 80 patients, 42.5% had proven or probable IA.
Tests showed that NASBA predicted IA with the highest sensitivity—76.47%, compared to 67.65% for qPCR and 52.94% for GM-ELISA. But qPCR offered the highest specificity—89.13%, compared to 80.43% for both NASBA and GM-ELISA.
NASBA had the highest negative predictive value—82.22%, compared to 78.85% for qPCR and 69.81% for GM-ELISA. And qPCR had the highest positive predictive value—82.14%, compared to 74.29% for NASBA and 66.67% for GM-ELISA.
NASBA and qPCR each had a high Youden index as well—0.5690 and 0.5678, respectively—compared to GM-ELISA—0.3337.
And combining the tests improved their accuracy. The combination of NASBA and qPCR led to 100% specificity and a 100% positive predictive value.
Dr Xia and his colleagues also noted that NASBA offers the advantages of rapid amplification (90 minutes) and simple operation with low instrument cost, compared with qPCR and GM-ELISA.
Finally, the team stressed that although GM-ELISA is widely and routinely used for aspergillosis diagnosis, this study indicates that it is inferior to both NASBA and qPCR. ![]()
Tool reveals how malaria parasites infect RBCs

an RBC; Credit: St Jude
Children’s Research Hospital
Researchers say laser optical tweezers have allowed them to study how Plasmodium falciparum interacts with red blood cells (RBCs) at the single-cell level.
The research has revealed new insights into malaria biology and may pave the way for more effective drugs or vaccines.
Julian Rayner, PhD, of the Wellcome Trust Sanger Institute in Cambridge, UK, and his colleagues described their use of laser optical tweezers in Biophysical Journal.
“Using laser tweezers to study red blood cell invasion gives us an unprecedented level of control over the whole process and will help us to understand this critical process at a level of detail that has not been possible before,” Dr Rayner said.
He and his colleagues noted that P falciparum merozoites usually leave one RBC and invade another in less than a minute. And the merozoites lose the ability to infect host cells within 2 or 3 minutes of release.
So the researchers used laser optical tweezers to study this transient event. The tweezers allow for precise control over the movements of cells by exerting extremely small forces with a highly focused laser beam.
The team used the tweezers to pick up individual merozoites that had just emerged from an RBC and deliver them to another RBC, demonstrating that the technique is suitable for studying the invasion process.
The researchers also used the tweezers to measure how strongly the merozoites adhere to RBCs. They discovered that attachment is probably mediated by multiple weak interactions, which could potentially be blocked by a combination of drugs or antibodies.
Finally, the team used the tweezers to shed light on how 3 different invasion-inhibiting drugs—heparin, cytochalasin D, and chymotrypsin—affect interactions between merozoites and RBCs.
The tweezers revealed that heparin blocks merozoite attachment to any surface, including glass slides. This suggests a receptor-independent mode of action, which contradicts the previously proposed mechanism.
Cytochalasin D, on the other hand, had no effect on attachment force, a finding that also contradicts previous thought.
And with chymotrypsin, the researchers observed 2 different effects. When merozoites adhered to chymotrypsin-treated RBCs, they did so with a reduction in the force of attachment that was similar to the effect the enzyme had on the overall efficiency of invasion.
However, merozoites that had been released more than 3 minutes previously were no longer able to adhere to chymotrypsin-treated RBCs. This suggests that chymotrypsin affects both the force of merozoite attachment and the time in which invasion can occur.
Taken together, these findings show that optical tweezers enable the study of malaria biology and drug mechanisms at the single-cell level.
“We now plan to apply this technology to dissect the process of invasion and understand what genes and proteins function at what step,” Dr Rayner said. “This will allow us to design better inhibitors or vaccines that block invasion by targeting multiple steps at the same time.” ![]()
DOJ closes investigation of PLATO trial

Credit: AstraZeneca
The US Department of Justice (DOJ) is closing its investigation of PLATO, a clinical trial of the antiplatelet agent ticagrelor (Brilinta), according to the drug’s developer, AstraZeneca.
The company also said the government is not planning any further action.
The DOJ began its investigation in October 2013, issuing a civil investigative demand requiring AstraZeneca to provide the department with documents and information related to the PLATO trial.
The trial compared ticagrelor to the antiplatelet agent clopidogrel in 18,624 patients with acute coronary syndromes (ACS), with or without ST-segment elevation.
The results suggested that ticagrelor significantly reduced the rate of myocardial infarction and death from any cause, although it did not decrease the risk of stroke. Ticagrelor did not increase the rate of overall bleeding, but it did increase the rate of bleeding not related to procedures.
These results led to ticagrelor’s approval in the US and more than 100 other countries. But members of the medical community questioned PLATO’s results, with some even suggesting the possibility of trial misconduct.
So the DOJ launched its investigation. The details of the inquiry are unclear, but AstraZeneca said it “focused on questions that have been raised previously in public about the trial.”
Many of those questions have been raised in the International Journal of Cardiology, in articles by Victor Serebruany, MD, PhD, of HeartDrug Research Laboratories in Towson, Maryland, and James DiNicolantonio, PharmD, of Wegmans Pharmacy in Ithaca, New York.
In the years since PLATO’s results were first published, Drs DiNicolantonio and Serebruany have pointed out differences between trial data published in the NEJM paper and FDA reviews of the data, noted the geographic discrepancies in results observed with ticagrelor, and raised questions about site monitoring, blinding practices, and patient deaths, among other issues.
PLATO investigators addressed these questions and allegations in an article of their own, which appeared in the International Journal of Cardiology in December 2013. The overall message was that PLATO’s results are valid.
“We have always had absolute confidence in the integrity of the PLATO trial, and we are proud of the important benefit [ticagrelor] offers to patients around the world suffering from acute coronary syndrome,” said Pascal Soriot, AstraZeneca’s Chief Executive Officer.
As for the future of ticagrelor, AstraZeneca recently announced the start of the SOCRATES trial, a study of the drug for patients with acute ischemic stroke or transient ischemic attack, and the THEMIS study in patients with type 2 diabetes and coronary atherosclerosis.
These studies form part of PARTHENON, a trial program involving more than 80,000 patients worldwide. The program also includes 2 trials that have recently completed recruitment—EUCLID, a study of patients with peripheral artery disease and PEGASUS, a study of ticagrelor for secondary prevention in patients with previous myocardial infarction.
AstraZeneca expects headline results from PEGASUS to be available in the first quarter of 2015. ![]()
Intrateam Coverage and Handoffs
We have traditionally viewed continuity of care with a particular intern as important for high‐quality inpatient care, but this continuity is difficult to achieve. As we move to a model of team rather than individual continuity, information transfers between team members become critical.
When discontinuity between the primary team and a cross‐covering team occurs, this informational continuity is managed through formal handoffs.[1] Accordingly, there has been ample research on handoffs between different teams,[2, 3, 4, 5] but there has been little published literature to date to describe handoffs between members of the same team. Therefore, we set out (1) to learn how interns view intrateam handoffs and (2) to identify intern‐perceived problems with intrateam handoffs.
MATERIALS AND METHODS
This was a cross‐sectional survey study done at a 500‐bed academic medical center affiliated with a large internal medicine residency program. The survey was developed by the study team and reviewed for content and clarity by our chief residents and by 2 nationally known medical educators outside our institution. Study participants were internal medicine interns. Interns in this program rotate through 3 hospitals and do 7 to 8 ward months. The call schedules are different at each site (see Supporting Information, Appendix A, in the online version of this article). Opportunities for intrateam coverage of 1 intern by another include clinics (1/week), days off (1/week), some overnight periods, and occasional educational conferences. When possible, daily attending rounds include the entire team, but due to clinics, conferences, and days off, it is rare that the entire team is present. Bedside rounds are done at the discretion of the attending. The survey (see Supporting Information, Appendix B, in the online version of this article) included questions regarding situations when the respondent was covering his or her cointern's patients (cointern was defined as another intern on the respondent's same inpatient ward team). We also asked about situations when a cointern was covering the respondent's patients. For those questions, we considered answers of >60% to be a majority. We distributed this anonymous survey on 2 dates (January 2012 and March 2012) during regularly scheduled conferences. We mainly report descriptive findings. We also compared the percentage of study participants reporting problems when covering cointerns' patients to the percentage of study participants reporting problems when cointerns covered their (study participants') patients using 2, with significance set at P0.05. This study was designated as exempt by the institutional review board.
RESULTS
Thirty‐four interns completed the survey out of a total of 44 interns present at the conferences (response rate=77%). There were 46 interns in the program, including categorical, medicine‐pediatrics, and preliminary interns. The mean age was 28 (standard deviation 2.8). Two‐thirds of respondents were female, and 65% were categorical.
Difference Between Intra‐ and Interteam Handoffs
Eighty‐eight percent felt that a handoff to a cointern was different than a handoff to an overnight cross‐cover intern; many interns said they assumed their cointerns had at least some knowledge of their patients, and therefore put less time and detail into their handoffs. When covering for their cointern, 47% reported feeling the same amount of responsibility as for their own patients, whereas 38% of interns reported feeling much or somewhat less responsible for their cointerns' patients and the remainder (15%) felt somewhat or much more responsible.
Knowledge of Cointern's Patients
Most (65%) interns reported at least 3 days in their last inpatient ward month when they covered a cointern's patient that had not been formally handed off to them. Forty‐five percent of respondents reported seldom or never receiving a written sign‐out on their cointern's patients.
Respondents were asked to think about times before they had covered their cointern's patients. Sixty‐eight percent of respondents reported knowing the number 1 problem for the majority of their cointern's patients. Twenty‐four percent reported having ever actually seen the majority of their cointern's patients. Only 3% of respondents said they had ever examined the majority of their cointern's patients prior to providing coverage.
Perceived Problems With Intrateam Coverage
While covering a cointern's patients, nearly half reported missing changes in patients' exams and forgetting to order labs or imaging. More than half reported unexpected family meetings or phone calls. In contrast, respondents noted more problems when their cointern had covered for them (Table 1). Seventy‐nine percent felt that patient care was at least sometimes delayed because of incomplete knowledge due to intrateam coverage.
| What Problems Have You Noticed | ||
|---|---|---|
| While Respondent Covers a Cointern's Patient? | After Respondent's Patients Were Covered by Cointern? | |
| ||
| Missed labs | 18% | 33% |
| Missed consult recommendations | 21% | 30% |
| Missed exam changes | 42% | 27% |
| Forgot to follow‐up imaging | 27% | 30% |
| Forgot to order labs or imaging | 42%a | 70%a |
| Failure to adjust meds | 27% | 27% |
| Unexpected family meeting/phone calls | 61%a | 30%a |
| Did not understand the plan from cointern's notes | 45% | 27% |
DISCUSSION
In our program, interns commonly cover for each other. This intrateam coverage frequently occurs without a formal handoff, and interns do not always know key information about their cointern's patients. Interns reported frequent problems with intrateam coverage such as missed lab results, consult recommendations, and changes in the physical exam. These missed items could result in delayed diagnoses and delayed treatment. These problems have been identified in interteam handoffs as well.[6, 7] Even in optimized interteam handoffs, receivers fail to identify the most important piece of information about 60% of the patients,[8] and our results mirror this finding.
The finding that fewer than a quarter of the respondents have ever seen the majority of their cointerns' patients is certainly of concern. This likely arises from several inter‐related factors: reduced hours for housestaff, schedules built to accommodate the reduced hours (eg, overlapping rather than simultaneous shifts), and the choice of some attendings to not take the entire team around to see every patient. In institutions where bedside rounds as a team are the norm, this finding will be less applicable, but others across the country have noticed this trend[9, 10] and have tried to counteract it.[11] This situation has both patient care and educational implications. The main patient care implication is that the other team members may be less able to seamlessly assume care when the primary intern is away or busy. Therefore, intrateam coverage becomes much more like traditional cross‐coverage of another team's patients, during which there is no expectation that the covering person will have ever seen the patients for whom they are assuming care. The main educational implication of not seeing the cointerns' patients is that the interns are seeing only half the patients that they could otherwise see. Learning medicine is experiential, and limiting opportunities for seeing and examining patients is unwise in this era of reduced time spent in the hospital.
Limitations of this study include being conducted in a single program. It will be important for other sites to assess their own practices with respect to intrateam handoffs. Another limitation is that it was a cross‐sectional survey subject to recall bias. We may have obtained more detailed information if we had conducted interviews. We also did not quantify the frequency of missed labs, consult recommendations, and physical examination changes that occurred during intrateam coverage. Finally, we did not independently verify the problems identified by the interns.
Some possible strategies to address this issue include (1) treating intrateam handoffs like interteam handoffs by implementing a formal system, (2) better utilizing senior residents/faculty when interns are covering for each other, (3) using bedside attending rounds to increase the exposure of all team members to the team's patients, (4) block scheduling to avoid absences due to clinics,[12] and (5) better communication and teamwork training to increase team awareness of all patients.[13]
Disclosures
Disclosures: There was no external funding for this work. However, this material is the result of work supported with resources and the use of facilities at the Clement J. Zablocki VA Medical Center, Milwaukee, WI. This work was presented in poster format at the national Society of Hospital Medicine meeting in National Harbor, Maryland in May 2013. The authors have no conflicts of interest to report.
- , , , et al. Residents' and attending physicians' handoffs: a systematic review of the literature. Acad Med. 2009;84(12):1775–1787.
- , , . Standardized sign‐out reduces intern perception of medical errors on the general internal medicine ward. Teach Learn Med. 2009;21(2):121–126.
- , , , . Faculty member review and feedback using a sign‐out checklist: improving intern written sign‐out. Acad Med. 2012;87(8):1125–1131.
- , , , , . Using a computerized sign‐out program to improve continuity of inpatient care and prevent adverse events. Jt Comm J Qual Improv. 1998;24(2):77–87.
- , , , . Transfers of patient care between house staff on internal medicine wards. Arch Intern Med. 2006;166:1173–1177.
- , , , , . Communication failures in patient sign‐out and suggestions for improvement: a critical incident analysis. Qual Saf Health Care 2005;14(6):401–407.
- , , , , . Consequences of inadequate sign‐out for patient care. Arch Intern Med. 2008;168(16):1755–1760.
- , , , , . Interns overestimate the effectiveness of their hand‐off communication. Pediatrics. 2010;125(3):491–496.
- . Culture shock—patient as icon, icon as patient. N Engl J Med. 2008;359(26):2748–2751.
- , , , . Attending rounds and bedside case presentations: medical student and medicine resident experiences and attitudes. Teach Learn Med. 2009;21(2):105–110.
- , , , . The return of bedside rounds: an educational intervention. J Gen Intern Med. 2010;25(8):792–798.
- , , , et al. The ambulatory long‐block: an accreditation council for graduate medical education (ACGME) educational innovations project (EIP). J Gen Intern Med. 2008;23(7):921–926.
- AHRQ. TeamSTEPPS: National Implementation. Available at: http://teamstepps.ahrq.gov/. Accessed June 19, 2014.
We have traditionally viewed continuity of care with a particular intern as important for high‐quality inpatient care, but this continuity is difficult to achieve. As we move to a model of team rather than individual continuity, information transfers between team members become critical.
When discontinuity between the primary team and a cross‐covering team occurs, this informational continuity is managed through formal handoffs.[1] Accordingly, there has been ample research on handoffs between different teams,[2, 3, 4, 5] but there has been little published literature to date to describe handoffs between members of the same team. Therefore, we set out (1) to learn how interns view intrateam handoffs and (2) to identify intern‐perceived problems with intrateam handoffs.
MATERIALS AND METHODS
This was a cross‐sectional survey study done at a 500‐bed academic medical center affiliated with a large internal medicine residency program. The survey was developed by the study team and reviewed for content and clarity by our chief residents and by 2 nationally known medical educators outside our institution. Study participants were internal medicine interns. Interns in this program rotate through 3 hospitals and do 7 to 8 ward months. The call schedules are different at each site (see Supporting Information, Appendix A, in the online version of this article). Opportunities for intrateam coverage of 1 intern by another include clinics (1/week), days off (1/week), some overnight periods, and occasional educational conferences. When possible, daily attending rounds include the entire team, but due to clinics, conferences, and days off, it is rare that the entire team is present. Bedside rounds are done at the discretion of the attending. The survey (see Supporting Information, Appendix B, in the online version of this article) included questions regarding situations when the respondent was covering his or her cointern's patients (cointern was defined as another intern on the respondent's same inpatient ward team). We also asked about situations when a cointern was covering the respondent's patients. For those questions, we considered answers of >60% to be a majority. We distributed this anonymous survey on 2 dates (January 2012 and March 2012) during regularly scheduled conferences. We mainly report descriptive findings. We also compared the percentage of study participants reporting problems when covering cointerns' patients to the percentage of study participants reporting problems when cointerns covered their (study participants') patients using 2, with significance set at P0.05. This study was designated as exempt by the institutional review board.
RESULTS
Thirty‐four interns completed the survey out of a total of 44 interns present at the conferences (response rate=77%). There were 46 interns in the program, including categorical, medicine‐pediatrics, and preliminary interns. The mean age was 28 (standard deviation 2.8). Two‐thirds of respondents were female, and 65% were categorical.
Difference Between Intra‐ and Interteam Handoffs
Eighty‐eight percent felt that a handoff to a cointern was different than a handoff to an overnight cross‐cover intern; many interns said they assumed their cointerns had at least some knowledge of their patients, and therefore put less time and detail into their handoffs. When covering for their cointern, 47% reported feeling the same amount of responsibility as for their own patients, whereas 38% of interns reported feeling much or somewhat less responsible for their cointerns' patients and the remainder (15%) felt somewhat or much more responsible.
Knowledge of Cointern's Patients
Most (65%) interns reported at least 3 days in their last inpatient ward month when they covered a cointern's patient that had not been formally handed off to them. Forty‐five percent of respondents reported seldom or never receiving a written sign‐out on their cointern's patients.
Respondents were asked to think about times before they had covered their cointern's patients. Sixty‐eight percent of respondents reported knowing the number 1 problem for the majority of their cointern's patients. Twenty‐four percent reported having ever actually seen the majority of their cointern's patients. Only 3% of respondents said they had ever examined the majority of their cointern's patients prior to providing coverage.
Perceived Problems With Intrateam Coverage
While covering a cointern's patients, nearly half reported missing changes in patients' exams and forgetting to order labs or imaging. More than half reported unexpected family meetings or phone calls. In contrast, respondents noted more problems when their cointern had covered for them (Table 1). Seventy‐nine percent felt that patient care was at least sometimes delayed because of incomplete knowledge due to intrateam coverage.
| What Problems Have You Noticed | ||
|---|---|---|
| While Respondent Covers a Cointern's Patient? | After Respondent's Patients Were Covered by Cointern? | |
| ||
| Missed labs | 18% | 33% |
| Missed consult recommendations | 21% | 30% |
| Missed exam changes | 42% | 27% |
| Forgot to follow‐up imaging | 27% | 30% |
| Forgot to order labs or imaging | 42%a | 70%a |
| Failure to adjust meds | 27% | 27% |
| Unexpected family meeting/phone calls | 61%a | 30%a |
| Did not understand the plan from cointern's notes | 45% | 27% |
DISCUSSION
In our program, interns commonly cover for each other. This intrateam coverage frequently occurs without a formal handoff, and interns do not always know key information about their cointern's patients. Interns reported frequent problems with intrateam coverage such as missed lab results, consult recommendations, and changes in the physical exam. These missed items could result in delayed diagnoses and delayed treatment. These problems have been identified in interteam handoffs as well.[6, 7] Even in optimized interteam handoffs, receivers fail to identify the most important piece of information about 60% of the patients,[8] and our results mirror this finding.
The finding that fewer than a quarter of the respondents have ever seen the majority of their cointerns' patients is certainly of concern. This likely arises from several inter‐related factors: reduced hours for housestaff, schedules built to accommodate the reduced hours (eg, overlapping rather than simultaneous shifts), and the choice of some attendings to not take the entire team around to see every patient. In institutions where bedside rounds as a team are the norm, this finding will be less applicable, but others across the country have noticed this trend[9, 10] and have tried to counteract it.[11] This situation has both patient care and educational implications. The main patient care implication is that the other team members may be less able to seamlessly assume care when the primary intern is away or busy. Therefore, intrateam coverage becomes much more like traditional cross‐coverage of another team's patients, during which there is no expectation that the covering person will have ever seen the patients for whom they are assuming care. The main educational implication of not seeing the cointerns' patients is that the interns are seeing only half the patients that they could otherwise see. Learning medicine is experiential, and limiting opportunities for seeing and examining patients is unwise in this era of reduced time spent in the hospital.
Limitations of this study include being conducted in a single program. It will be important for other sites to assess their own practices with respect to intrateam handoffs. Another limitation is that it was a cross‐sectional survey subject to recall bias. We may have obtained more detailed information if we had conducted interviews. We also did not quantify the frequency of missed labs, consult recommendations, and physical examination changes that occurred during intrateam coverage. Finally, we did not independently verify the problems identified by the interns.
Some possible strategies to address this issue include (1) treating intrateam handoffs like interteam handoffs by implementing a formal system, (2) better utilizing senior residents/faculty when interns are covering for each other, (3) using bedside attending rounds to increase the exposure of all team members to the team's patients, (4) block scheduling to avoid absences due to clinics,[12] and (5) better communication and teamwork training to increase team awareness of all patients.[13]
Disclosures
Disclosures: There was no external funding for this work. However, this material is the result of work supported with resources and the use of facilities at the Clement J. Zablocki VA Medical Center, Milwaukee, WI. This work was presented in poster format at the national Society of Hospital Medicine meeting in National Harbor, Maryland in May 2013. The authors have no conflicts of interest to report.
- , , , et al. Residents' and attending physicians' handoffs: a systematic review of the literature. Acad Med. 2009;84(12):1775–1787.
- , , . Standardized sign‐out reduces intern perception of medical errors on the general internal medicine ward. Teach Learn Med. 2009;21(2):121–126.
- , , , . Faculty member review and feedback using a sign‐out checklist: improving intern written sign‐out. Acad Med. 2012;87(8):1125–1131.
- , , , , . Using a computerized sign‐out program to improve continuity of inpatient care and prevent adverse events. Jt Comm J Qual Improv. 1998;24(2):77–87.
- , , , . Transfers of patient care between house staff on internal medicine wards. Arch Intern Med. 2006;166:1173–1177.
- , , , , . Communication failures in patient sign‐out and suggestions for improvement: a critical incident analysis. Qual Saf Health Care 2005;14(6):401–407.
- , , , , . Consequences of inadequate sign‐out for patient care. Arch Intern Med. 2008;168(16):1755–1760.
- , , , , . Interns overestimate the effectiveness of their hand‐off communication. Pediatrics. 2010;125(3):491–496.
- . Culture shock—patient as icon, icon as patient. N Engl J Med. 2008;359(26):2748–2751.
- , , , . Attending rounds and bedside case presentations: medical student and medicine resident experiences and attitudes. Teach Learn Med. 2009;21(2):105–110.
- , , , . The return of bedside rounds: an educational intervention. J Gen Intern Med. 2010;25(8):792–798.
- , , , et al. The ambulatory long‐block: an accreditation council for graduate medical education (ACGME) educational innovations project (EIP). J Gen Intern Med. 2008;23(7):921–926.
- AHRQ. TeamSTEPPS: National Implementation. Available at: http://teamstepps.ahrq.gov/. Accessed June 19, 2014.
ALS ice bucket challenge: It’s hard to argue with success
The ALS ice bucket challenge has taken the social media world by storm and surprised many by how fast and far it has spread. People simply make a video of themselves dumping a bucket of ice water on their heads and then post it on a social media site and challenge others to do the same within 24 hours or make a donation to ALS research (or both).
The stunt, which began early in the summer as a challenge unrelated to amyotrophic lateral sclerosis, has resonated with many people in the dog days of summer and has been helped by many celebrities taking up the challenge. It became linked to ALS when Peter Frates, a 29-year-old man with the disease, took the challenge – albeit by nodding his head to the song "Ice Ice Baby" instead of having ice water dumped on him – and asked others to do the same.

According to the ALS Association, as of Aug. 19, existing donors and more than 450,000 new donors have contributed $22.9 million since July 29, compared with $1.9 million during the same period last year. The ALS has a four-out-of-four stars rating on Charity Navigator, and an overall score of 90.73 out of 100. Overall, 72% of its expenses are spent on the programs and services it delivers, 11% on administration, and 17% on fundraising.
Some critics have suggested that the stunt promotes click and post activism, keeping people from doing real activism, or is "narcissism masked as altruism," but most people have embraced it as fun for a good cause.
I asked a few Clinical Neurology News editorial advisory board members to weigh in:
• Dr. Richard J. Caselli, professor of neurology at the Mayo Clinic, Scottsdale, Ariz.: "If it is raising money for ALS research, what’s not to like? Not everyone was destined to be a molecular biologist or clinical trialist, and this gives people a way to contribute that seems to be culturally in synch with the ‘social media’ community. ... The ice water is an interesting twist in that it implies that if you turn a blind eye to this cause you should punish yourself, and I suspect many people harbor feelings of at least slight guilt when they feel they are not contributing to worthwhile needs."

• Matthew Huentelman, Ph.D., associate professor of neurogenomics at the Translational Genomics Research Institute, Phoenix: "If a campaign works (and doesn’t harm) then it is hard to argue against. I think that any awareness campaign that actually gets a response from the White House has probably been a useful one. President Obama confirmed he would be donating but not doing the ice bucket thing. ... I suspect that a lot of research foundations are going to be having ‘tough’ conversations at this month’s board meetings as they compare their awareness and fundraising attempts to the simple ALS ice bucket challenge. It just demonstrates to all of us again that social media is relevant for both spreading the word and getting results. There are a few keys from this too: (1) visual "stuff" matters – short video clips is now how the world communicates; (2) challenging your friends/colleagues by name is important, too – it sort of forces a response from them; and (3) celebs are still key to pushing something viral in a truly short period of time."
(While you contemplate taking the ice bucket challenge, you might as well visit Dr. Huentelman’s social media project, MindCrowd, a site leveraging social media to recruit participants into a brain research study.)
The ALS ice bucket challenge has taken the social media world by storm and surprised many by how fast and far it has spread. People simply make a video of themselves dumping a bucket of ice water on their heads and then post it on a social media site and challenge others to do the same within 24 hours or make a donation to ALS research (or both).
The stunt, which began early in the summer as a challenge unrelated to amyotrophic lateral sclerosis, has resonated with many people in the dog days of summer and has been helped by many celebrities taking up the challenge. It became linked to ALS when Peter Frates, a 29-year-old man with the disease, took the challenge – albeit by nodding his head to the song "Ice Ice Baby" instead of having ice water dumped on him – and asked others to do the same.
According to the ALS Association, as of Aug. 19, existing donors and more than 450,000 new donors have contributed $22.9 million since July 29, compared with $1.9 million during the same period last year. The ALS has a four-out-of-four stars rating on Charity Navigator, and an overall score of 90.73 out of 100. Overall, 72% of its expenses are spent on the programs and services it delivers, 11% on administration, and 17% on fundraising.
Some critics have suggested that the stunt promotes click and post activism, keeping people from doing real activism, or is "narcissism masked as altruism," but most people have embraced it as fun for a good cause.
I asked a few Clinical Neurology News editorial advisory board members to weigh in:
• Dr. Richard J. Caselli, professor of neurology at the Mayo Clinic, Scottsdale, Ariz.: "If it is raising money for ALS research, what’s not to like? Not everyone was destined to be a molecular biologist or clinical trialist, and this gives people a way to contribute that seems to be culturally in synch with the ‘social media’ community. ... The ice water is an interesting twist in that it implies that if you turn a blind eye to this cause you should punish yourself, and I suspect many people harbor feelings of at least slight guilt when they feel they are not contributing to worthwhile needs."
• Matthew Huentelman, Ph.D., associate professor of neurogenomics at the Translational Genomics Research Institute, Phoenix: "If a campaign works (and doesn’t harm) then it is hard to argue against. I think that any awareness campaign that actually gets a response from the White House has probably been a useful one. President Obama confirmed he would be donating but not doing the ice bucket thing. ... I suspect that a lot of research foundations are going to be having ‘tough’ conversations at this month’s board meetings as they compare their awareness and fundraising attempts to the simple ALS ice bucket challenge. It just demonstrates to all of us again that social media is relevant for both spreading the word and getting results. There are a few keys from this too: (1) visual "stuff" matters – short video clips is now how the world communicates; (2) challenging your friends/colleagues by name is important, too – it sort of forces a response from them; and (3) celebs are still key to pushing something viral in a truly short period of time."
(While you contemplate taking the ice bucket challenge, you might as well visit Dr. Huentelman’s social media project, MindCrowd, a site leveraging social media to recruit participants into a brain research study.)

Guidelines can predict infertility in child cancer survivors

patient and her father
Credit: Rhoda Baer
Guidelines developed almost 20 years ago can accurately predict infertility in girls with cancer, according to research published in The Lancet Oncology.
Researchers found the criteria in these guidelines can help healthcare professionals select which girls should be given the option of ovarian tissue cryopreservation.
The team noted that taking the initial samples of ovarian tissue involves a surgical technique that is still relatively experimental.
So it is crucial to accurately predict which patients are most likely to benefit from the procedure and when it can be safely performed.
The guidelines, known as the Edinburgh selection criteria, were instituted in 1996 to help healthcare professionals decide which girls should be given the option of cryopreservation, based on their age, type of cancer treatment, and their chance of cure.
Specifically, patients were required to meet the following criteria:
- Age younger than 35 years
- No previous chemotherapy or radiotherapy if 15 years or older at diagnosis, but mild, non-gonadotoxic chemotherapy was acceptable if a patient was younger than 15
- A realistic chance of surviving for 5 years
- A high risk of premature ovarian insufficiency (>50%)
- Informed consent (from parents and the patient, if possible)
- Negative serology results for HIV, syphilis, and hepatitis B
- Not pregnant and no existing children.
Testing the guidelines
To validate the selection criteria, W. Hamish B. Wallace, MD, of the Royal Hospital for Sick Children in Edinburgh, UK, and his colleagues analyzed 410 female cancer patients who were younger than 18 years at their time of diagnosis.
The patients were treated between January 1, 1996, and June 30, 2012, at the Edinburgh Children’s Cancer Centre, which serves the southeast region of Scotland.
In all, 34 patients (8%) met the Edinburgh selection criteria and were given the option of ovarian tissue cryopreservation before starting cancer treatment. Thirteen patients declined, 21 consented, and 20 had a successful procedure.
The researchers were able to assess ovarian function in 14 of the 20 patients with successful cryopreservation and 6 of the 13 patients who declined the procedure.
Of the 14 evaluable patients who underwent cryopreservation, 6 developed premature ovarian insufficiency at a median age of 13.4 years (range, 12.5–14.6), but 1 of these patients also had a natural pregnancy.
One patient each among the 6 evaluable patients who declined cryopreservation and the 141 evaluable patients who were not offered cryopreservation developed premature ovarian insufficiency.
So, overall, the probability of ovarian insufficiency was significantly higher for patients who met the Edinburgh selection criteria than for those who did not. The 15-year probability was 35% and 1%, respectively (P<0.0001).
The researchers said these results validate the use of the selection criteria, as they can accurately identify patients who will likely develop premature ovarian insufficiency.
“Advances in life-saving treatments mean that more and more young people with cancer are surviving the disease,” Dr Wallace said. “Here, we have an opportunity to help young women to have families of their own when they grow up, if they so choose.” ![]()