User login
Drug on the fast track to treat AML
Credit: Esther Dyson
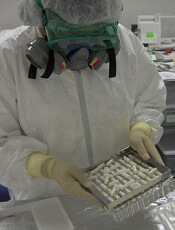
The US Food and Drug Administration (FDA) has granted fast track designation for AG-221 to treat acute myelogenous leukemia (AML) patients with mutated isocitrate dehydrogenase-2 (IDH2).
AG-221 is an IDH2 inhibitor under evaluation in a phase 1 trial of patients with advanced hematologic malignancies.
Results from this trial were presented at the 19th Congress of the European Hematology Association, which took place in Milan in June.
The FDA’s fast track drug development program is designed to expedite clinical development and submission of a new drug application (NDA) for drugs with the potential to treat serious or life-threatening conditions and address unmet medical needs.
Fast track designation facilitates meetings between the FDA and the company developing a drug to discuss all aspects of development to support approval. It also affords the developer the opportunity to submit sections of an NDA on a rolling basis as data become available, so the FDA does not have wait for the entire NDA submission before beginning its review.
AG-221 also recently received orphan designation as a treatment for AML. The FDA grants orphan status to support the development of drugs for underserved patient populations or rare disorders that affect fewer than 200,000 people in the US.
Orphan designation affords the drug’s developer certain benefits, including market exclusivity upon regulatory approval, exemption of FDA application fees, and tax credits for qualified clinical trials.
Phase 1 trial results
Thus far in the phase 1 study, AG-221 has proven active and well-tolerated in patients with AML, myelodysplastic syndromes (MDS), and chronic myelomonocytic leukemia (CMML).
The trial included 35 patients with a median age of 68 years (range, 48-81).
Twenty-seven patients had relapsed/refractory AML, 4 had relapsed/refractory MDS, 2 had untreated AML, 1 had CMML, and 1 had granulocytic sarcoma. Thirty-one patients had R140Q IDH2 mutations, and 4 had R172K IDH2 mutations.
The patients received AG-221 at doses ranging from 30 mg BID to 150 mg QD. Patients completed a median of 1 cycle of treatment (range, <1-5+) and a mean of 2 cycles.
The drug was generally well-tolerated, largely prompting grade 1 or 2 adverse events. Grade 3 or higher events included thrombocytopenia (n=3), anemia (n=1), febrile neutropenia (n=3), sepsis (n=3), diarrhea (n=1), fatigue (n=1), leukocytosis (n=2), neutropenia (n=1), and rash (n=1).
Four patients had serious events possibly related to treatment. One patient had grade 3 confusion and grade 5 respiratory failure. One patient had grade 3 leukocytosis, grade 3 anorexia, and grade 1 nausea. One patient had grade 3 diarrhea. And 1 patient had grade 3 leukocytosis.
Twenty-five patients were evaluable for response. There were 6 complete responses (CRs), 2 CRs with incomplete platelet recovery, 1 CR with incomplete hematologic recovery, and 5 partial responses. Five patients had stable disease, and 6 had progressive disease.
The most responses occurred among patients who received AG-221 at 50 mg BID, and most responses occurred in cycle 1.
Twelve of the 14 responses are ongoing. Of the 8 patients who achieved a CR or CR with incomplete platelet recovery, 5 have lasted more than 2.5 months (range, 1-4+ months). And the 5 patients with stable disease remain on study.
This study is sponsored by Agios Pharmaceuticals Inc., the company developing AG-221 in collaboration with Celgene. ![]()
Credit: Esther Dyson
The US Food and Drug Administration (FDA) has granted fast track designation for AG-221 to treat acute myelogenous leukemia (AML) patients with mutated isocitrate dehydrogenase-2 (IDH2).
AG-221 is an IDH2 inhibitor under evaluation in a phase 1 trial of patients with advanced hematologic malignancies.
Results from this trial were presented at the 19th Congress of the European Hematology Association, which took place in Milan in June.
The FDA’s fast track drug development program is designed to expedite clinical development and submission of a new drug application (NDA) for drugs with the potential to treat serious or life-threatening conditions and address unmet medical needs.
Fast track designation facilitates meetings between the FDA and the company developing a drug to discuss all aspects of development to support approval. It also affords the developer the opportunity to submit sections of an NDA on a rolling basis as data become available, so the FDA does not have wait for the entire NDA submission before beginning its review.
AG-221 also recently received orphan designation as a treatment for AML. The FDA grants orphan status to support the development of drugs for underserved patient populations or rare disorders that affect fewer than 200,000 people in the US.
Orphan designation affords the drug’s developer certain benefits, including market exclusivity upon regulatory approval, exemption of FDA application fees, and tax credits for qualified clinical trials.
Phase 1 trial results
Thus far in the phase 1 study, AG-221 has proven active and well-tolerated in patients with AML, myelodysplastic syndromes (MDS), and chronic myelomonocytic leukemia (CMML).
The trial included 35 patients with a median age of 68 years (range, 48-81).
Twenty-seven patients had relapsed/refractory AML, 4 had relapsed/refractory MDS, 2 had untreated AML, 1 had CMML, and 1 had granulocytic sarcoma. Thirty-one patients had R140Q IDH2 mutations, and 4 had R172K IDH2 mutations.
The patients received AG-221 at doses ranging from 30 mg BID to 150 mg QD. Patients completed a median of 1 cycle of treatment (range, <1-5+) and a mean of 2 cycles.
The drug was generally well-tolerated, largely prompting grade 1 or 2 adverse events. Grade 3 or higher events included thrombocytopenia (n=3), anemia (n=1), febrile neutropenia (n=3), sepsis (n=3), diarrhea (n=1), fatigue (n=1), leukocytosis (n=2), neutropenia (n=1), and rash (n=1).
Four patients had serious events possibly related to treatment. One patient had grade 3 confusion and grade 5 respiratory failure. One patient had grade 3 leukocytosis, grade 3 anorexia, and grade 1 nausea. One patient had grade 3 diarrhea. And 1 patient had grade 3 leukocytosis.
Twenty-five patients were evaluable for response. There were 6 complete responses (CRs), 2 CRs with incomplete platelet recovery, 1 CR with incomplete hematologic recovery, and 5 partial responses. Five patients had stable disease, and 6 had progressive disease.
The most responses occurred among patients who received AG-221 at 50 mg BID, and most responses occurred in cycle 1.
Twelve of the 14 responses are ongoing. Of the 8 patients who achieved a CR or CR with incomplete platelet recovery, 5 have lasted more than 2.5 months (range, 1-4+ months). And the 5 patients with stable disease remain on study.
This study is sponsored by Agios Pharmaceuticals Inc., the company developing AG-221 in collaboration with Celgene. ![]()
Method could overcome chemoresistance in lymphoma

Credit: Rhoda Baer
Indirectly targeting the prosurvival protein Mcl-1 can reverse chemoresistance in lymphoma and other cancer cells, investigators have reported in The Journal of Biological Chemistry.
The team found that targeting an enzyme known as protein phosphatase 2A (PP2A) inhibited Mcl-1 dephosphorylation, which prompted the loss of Mcl-1 in chemoresistant Burkitt lymphoma cells.
“These findings may lead to a new target for chemoresistant cancer cells,” said Ruth W. Craig, PhD, of Geisel School of Medicine at Dartmouth in Hanover, New Hampshire.
“These cells are resistant to multiple types of standard chemotherapeutic agents because of [Mcl-1] overexpression. However, Mcl-1 expression plummets when we inhibit [PP2A], and then cancer cells subsequently die.”
Dr Craig and her colleagues found that PP2A can be inhibited to stop the removal of phosphate groups from a regulatory motif in Mcl-1 referred to as the PEST region (enriched with amino acids proline, glutamic acid, serine, and threonine).
And inhibiting the removal of phosphate groups, such as at threonine-163 and serine-159, targets the Mcl-1 protein for rapid destruction.
To reach this conclusion, the investigators studied BL41-3 cells, a Burkitt lymphoma cell line that overexpresses Mcl-1 and has proven resistant to multiple treatments.
The team exposed BL41-3 cells to 2 different PP2A inhibitors, okadaic acid and calyculin A. Both drugs prompted an increase in phosphorylation at threonine-163 and serine-159, as well as a decrease in Mcl-1 expression.
Further investigation confirmed that PP2A interacts with Mcl-1. And, as with therapeutic targeting, shRNA knockdown of PP2A/Aα increased phosphorylation while decreasing Mcl-1 expression.
Finally, the investigators showed the increase in Mcl-1 phosphorylation and decrease in its expression occurred well before markers of cell death appeared—about 2 to 3 hours before.
“PP2A is a complex multi-subunit enzyme, and we hope to identify more specifically which form of PP2A is involved in dephosphorylating Mcl-1,” Dr Craig said. “This could [provide us with] a more specific way of causing Mcl-1 destruction.” ![]()
ESA recalled due to particulates

Amgen is recalling lots of the erythropoiesis-stimulating agent Aranesp (darbepoetin alfa) that were distributed in several countries outside the US.
The recall applies to 9 lots of Aranesp 500 mcg prefilled syringes from non-US distributors, wholesalers, and hospital pharmacies.
A routine quality examination revealed cellulose and/or polyester particles in a small number of syringes, so Amgen is recalling the 9 lots as a precautionary measure.
To date, there have been no complaints or adverse events that can be attributed to the presence of these particles.
The presence of particulate matter could elicit inflammatory and allergic responses, both chronic and acute, and may be life-threatening.
However, health implications may vary depending on the route of drug administration, the amount of particulate matter injected into the patient, the size of the particles, the patient’s underlying medical condition, and the presence of a right-to-left cardiac shunt.
The products impacted by the recall are Aranesp 500 mcg prefilled syringes. A single lot of Aranesp was packaged for different countries into 9 lots: 1042847, 1044141A, 1044141C, 1044141D, 1046891A, 1046891B, 1047394A, 1047622A, and 1047996A.
The impacted syringes were distributed in Belgium, Denmark, Finland, France, Ireland, Italy, Kuwait, Luxemburg, Russia, Saudi Arabia, Slovenia, Sweden, Switzerland, and the UK.
Consumers in the US who have questions regarding this recall can contact Amgen at 1-800-77-AMGEN (open 24 hours per day, 7 days per week).
Adverse events or quality problems associated with Aranesp can be reported to the US Food and Drug Administration’s MedWatch Adverse Event Reporting Program.
In the US, Aranesp is indicated for the treatment of anemia associated with chronic renal failure, including patients on dialysis and patients not on dialysis, or in patients with non-myeloid malignancies where anemia results from concomitantly administered chemotherapy. ![]()
Higher BMI increases risk of leukemia, other cancers

A higher body mass index (BMI) increases the risk of developing 10 common cancers, according to a study of more than 5 million adults in the UK.
The research revealed an association between BMI and leukemia, as well as certain solid tumor malignancies, but no association for multiple myeloma or non-Hodgkin lymphoma.
Krishnan Bhaskaran, PhD, of the London School of Hygiene & Tropical Medicine in the UK, and his colleagues reported these findings in The Lancet.
“The number of people who are overweight or obese is rapidly increasing, both in the UK and worldwide,” Dr Bhaskaran said. “It is well recognized that this is likely to cause more diabetes and cardiovascular disease. Our results show that, if these trends continue, we can also expect to see substantially more cancers as a result.”
Using data from general practitioner records in the UK’s Clinical Practice Research Datalink, Dr Bhaskaran and his colleagues identified 5.24 million individuals aged 16 and older who were cancer-free and had been followed for an average of 7.5 years.
The researchers assessed the subjects’ risk of developing 22 of the most common cancers, which represent 90% of the cancers diagnosed in the UK. The team evaluated cancer risk according to BMI after adjusting for individual factors such as age, sex, smoking status, and socioeconomic status.
A total of 166,955 people developed 1 of the 22 cancers studied during the follow-up period.
BMI was associated with 17 of the cancer types—leukemia and melanoma, as well as cancers of the oral cavity, esophagus, stomach, colon, liver, gallbladder, pancreas, lung, breast, cervix, uterus, ovaries, prostate, kidney, and thyroid.
BMI was not associated with non-Hodgkin lymphoma, multiple myeloma, or cancers of the rectum, bladder, or brain/central nervous system.
Each 5 kg/m² increase in BMI was clearly linked with a higher risk of cancers of the uterus (62% increase), gallbladder (31%), kidney (25%), cervix (10%), thyroid (9%), and leukemia (9%).
Higher BMI also increased the overall risk of liver (19% increase), colon (10%), ovarian (9%), and breast cancers (5%), but the effects on these cancers varied by underlying BMI and by factors such as sex and menopausal status.
Even within normal BMI ranges, a higher BMI was associated with an increased risk of some cancers.
On the other hand, there was some evidence that subjects with a high BMI were at a slightly reduced risk of prostate cancer and premenopausal breast cancer.
“There was a lot of variation in the effects of BMI on different cancers, ” Dr Bhaskaran explained. “For example, risk of cancer of the uterus increased substantially at higher body mass index. For other cancers, we saw more modest increases in risk, or no effect at all.”
“For some cancers, like breast cancer occurring in younger women before the menopause, there even seemed to be a lower risk at higher BMI. This variation tells us that BMI must affect cancer risk through a number of different processes, depending on the cancer type.”
In a linked comment article, Peter Campbell, PhD, of the American Cancer Society in Atlanta, Georgia, said this research underscores the need for policy changes to reduce the incidence of obesity and being overweight in the UK and the rest of the world. ![]()
More new insight into HSC generation

Credit: John Perry
Researchers say they have uncovered early clues that better explain how hematopoietic stem cells (HSCs) are generated.
Their research, conducted in zebrafish, provides new insight regarding the role of JAM proteins and the Notch signaling pathway, which was already known to be critical for HSC generation.
The new findings may help clear the way to producing HSCs from human pluripotent precursors, according to the researchers.
David Traver, PhD, of the University of California, San Diego School of Medicine, and his colleagues recounted these findings in a letter to Nature. A similar study, which revealed the role of endotome cells in HSC generation, was also recently published as a letter to Nature.
“Notch signaling between emitting and receiving cells is key to establishing HSC fate during development,” Dr Traver said. “What has not been known is where, when, and how Notch signal transduction is mediated.”
Through experiments in zebrafish models, Dr Traver and his colleagues found the Notch signal is transduced into HSC precursor cells from signal-emitting cells in the somite much earlier in the process than previously anticipated.
Specifically, the team found that JAM proteins, best known for helping maintain tight junctions between endothelial cells to prevent vascular leakage, were key mediators of Notch signaling.
When the researchers caused JAM proteins to lose function, Notch signaling and HSCs were also lost. When they enforced Notch signaling, the team rescued HSC development.
“To date, it has not been possible to generate HSCs de novo from human pluripotent precursors, like induced pluripotent stem cells,” Dr Traver said. “This has been due, in part, to a lack of understanding of the complete set of factors that the embryo uses to make HSCs in vivo. It has also likely been due to not knowing in what order each required factor is needed.”
“Our studies demonstrate that Notch signaling is required much earlier than previously thought. In fact, it may be one of the earliest determinants of HSC fate. This finding strongly suggests that in vitro approaches to instruct HSC fate from induced pluripotent stem cells must focus on the Notch pathway at early time-points in the process.”
“Our findings have also shown that JAM proteins serve as a sort of co-receptor for Notch signaling, in that they are required to maintain close contact between signal-emitting and signal-receiving cells to permit strong activation of Notch in the precursors of HSCs.”
Dr Traver and his colleagues believe the findings may have far-reaching implications for the eventual development of HSC-based therapies for diseases such as leukemia and congenital blood disorders. ![]()
Chikungunya vaccine safe, immunogenic in phase I trial
A novel chikungunya virus vaccine caused no serious adverse effects and was about as immunogenic as natural infection, authors of a phase I trial reported in the Lancet.
Eleven months after receiving the noninfectious viruslike particle (VLP) vaccine, trial participants had neutralizing antibody titers that resembled those seen in natural infection, said Dr. Lee-Jah Chang and associates at the National Institutes of Health in Bethesda, Md. (Lancet 2014 Aug. 15 [doi: 10.1016/S0140-6736(14)61185-5]).
Chikungunya virus infection is rarely fatal, but it causes fever and severe arthritis. The mosquito-born pathogen spread to the Americas in 2013, is now epidemic in the Caribbean, and has no approved vaccine or treatment.
To test a novel VLP vaccine candidate, researchers enrolled 25 healthy adults into a phase I, open-label, dose-escalation trial with doses of 10, 20, or 40 mcg administered at weeks 0, 4, and 20, the investigators reported. Participants were followed for 44 weeks after enrollment.
All groups had detectable neutralizing antibodies on ELISA (enzyme-linked immunosorbent assay) after the second dose, with geometric mean titers of the half-maximum inhibitory concentration of 2,688 in the 10-mcg group, 1,775 in the 20-mcg group, and 7,246 in the 40-mcg group. Antibody levels after the second dose substantially exceeded those measured after the first dose, with P values for differences ranging from .07 for the 10-mcg group to less than .0001 for the 40-mcg group, the investigators said. And titers did not significantly differ 4 weeks after the second and third doses, they added.
Participants reported no arthralgias or other serious adverse effects. Mild to moderate side effects occurred in four participants, and consisted of transient neutropenia (three cases) and transient increases in alanine aminotransferase (four cases), all of which resolved without clinical consequences, the investigators said.
"These clinical data represent an important step in vaccine development to combat this rapidly emerging pathogen," the researchers said. The next step is to test the vaccine in larger studies that include persons at risk of chikungunya virus infection, they added.
The trial was funded by the Intramural Research Program of the Vaccine Research Center, National Institute of Allergy and Infectious Diseases; and the National Institutes of Health. The authors declared no competing interests.
"Although this VLP vaccine candidate exhibits a range of properties that suggest it would be a good vaccine option, there is always concern about whether a vaccine for a vector-borne virus will be licensed," said Dr. Ann M. Powers. "Development of vaccines for orphan agents is challenging, because the market might not be large enough to justify the investment."
Developing a vaccine in the United States costs an estimated $200-$500 million; nonetheless, vaccines are the most cost-effective way to prevent disease, she said. "In view of the burden of chikungunya outbreaks, which have affected up to 63% of local populations in a matter of months, the continued development of this VLP vaccine candidate, along with other vaccine options, should be encouraged."
A VLP contains the outer structural proteins of the virus that the immune system typically recognizes, Dr. Powers added. But it does not contain live genetic material, which confers a safety and manufacturing advantage because high-containment facilities are not needed for production.
Dr. Powers is with the division of vector-borne diseases at the U.S. Centers for Disease Control and Prevention. She declared that she had no competing interests. These remarks were excerpted from her editorial accompanying Dr. Chang’s report (Lancet 2014 Aug. 15 [doi: 10.1016/S0140-6736(14)61290-3]).
A novel chikungunya virus vaccine caused no serious adverse effects and was about as immunogenic as natural infection, authors of a phase I trial reported in the Lancet.
Eleven months after receiving the noninfectious viruslike particle (VLP) vaccine, trial participants had neutralizing antibody titers that resembled those seen in natural infection, said Dr. Lee-Jah Chang and associates at the National Institutes of Health in Bethesda, Md. (Lancet 2014 Aug. 15 [doi: 10.1016/S0140-6736(14)61185-5]).
Chikungunya virus infection is rarely fatal, but it causes fever and severe arthritis. The mosquito-born pathogen spread to the Americas in 2013, is now epidemic in the Caribbean, and has no approved vaccine or treatment.
To test a novel VLP vaccine candidate, researchers enrolled 25 healthy adults into a phase I, open-label, dose-escalation trial with doses of 10, 20, or 40 mcg administered at weeks 0, 4, and 20, the investigators reported. Participants were followed for 44 weeks after enrollment.
All groups had detectable neutralizing antibodies on ELISA (enzyme-linked immunosorbent assay) after the second dose, with geometric mean titers of the half-maximum inhibitory concentration of 2,688 in the 10-mcg group, 1,775 in the 20-mcg group, and 7,246 in the 40-mcg group. Antibody levels after the second dose substantially exceeded those measured after the first dose, with P values for differences ranging from .07 for the 10-mcg group to less than .0001 for the 40-mcg group, the investigators said. And titers did not significantly differ 4 weeks after the second and third doses, they added.
Participants reported no arthralgias or other serious adverse effects. Mild to moderate side effects occurred in four participants, and consisted of transient neutropenia (three cases) and transient increases in alanine aminotransferase (four cases), all of which resolved without clinical consequences, the investigators said.
"These clinical data represent an important step in vaccine development to combat this rapidly emerging pathogen," the researchers said. The next step is to test the vaccine in larger studies that include persons at risk of chikungunya virus infection, they added.
The trial was funded by the Intramural Research Program of the Vaccine Research Center, National Institute of Allergy and Infectious Diseases; and the National Institutes of Health. The authors declared no competing interests.
FROM THE LANCET
Key clinical point: A novel, noninfectious vaccine for chikungunya virus was highly immunogenic and caused no serious adverse effects in a phase I trial.
Major finding: All dosing groups developed detectable neutralizing antibodies after a second vaccination with a chikungunya virus vaccine (geometric mean titers of the half-maximum inhibitory concentration: 2,688 in the 10-mcg group, 1,775 in the 20-mcg group, and 7,246 in the 40-mcg group).
Data source: Phase I, dose-escalation, open-label clinical trial of noninfectious viruslike particle chikungunya vaccine in 25 healthy adults.
Disclosures: Funding sources included the Intramural Research Program of the Vaccine Research Center, the National Institute of Allergy and Infectious Diseases, and the National Institutes of Health. The authors declared no competing interests.
Botulinum toxin for men
Men make up an increasing number of dermatology patients seeking cosmetic procedures. According to data from the American Society for Dermatologic Surgery and the American Society of Plastic Surgery, 9%-10% of all cosmetic procedures performed in the United States in 2013 were on men, a 104% increase since 2000. Botulinum toxin is currently the most common minimally invasive cosmetic procedure performed in men. While the overall percentage of men undergoing treatment, compared with women, is relatively small, more than 385,000 botulinum toxin treatments were performed on men last year in the United States, an increase of 310% since 2000.

Studies have shown that men often require more units of onabotulinumtoxinA than women when treating the glabella. In a 2005 study by Alstair and Jean Carruthers, 80 men were randomized to receive 20, 40, 60, or 80 units of onabotulinumtoxinA (Botox or Vistabel). The 40-, 60-, and 80-U doses were consistently more effective than the 20-U dose was in reducing glabellar lines (duration, peak response rate, and improvement from baseline). I find this to be true in my practice. Men may often require 20-60 U in the superficial corrugator and procerus muscles, compared with 20-30 units of onabotulinumtoxinA in the same muscles in women. For the frontalis muscles, I may use 5-20 U in men, compared with 5-10 U of onabotulinumtoxinA in women, but I take care not to inject too inferiorly to avoid a heavy brow or brow ptosis. The orbicularis oculi muscles often require the similar doses of between 6-15 U (most often 12 U/side) depending on degree of muscle contraction and severity of rhytids.

In addition to differences in botulinum toxin dosing between men and women, placement of toxin also may vary. Placement in the superficial corrugator, procerus, frontalis, and orbicularis oculi muscles are often the similar and patient dependent, based on a visual assessment of where their muscles move/contract. The superficial corrugator may insert more laterally in some men, and the brow is often straighter or less arched. The difference in injection site is often at the lateral brow. In women, botulinum toxin is often injected at the lateral brow at the junction where the lateral superior portion of the orbicularis oculi muscle and frontalis meet, in order to help give the brow a "lift." Men, however, often do not want raised or arched brow. Therefore, an injection is often placed about 1 cm above the lateral brow to maintain brow position and avoid overarching, or what some may regard as feminization of the male brow.
The depressor anguli oris and orbicularis oris muscles are injected less frequently in men than in women in my practice because of seemingly decreased rhytid formation in men in these locations. The platysmal muscles may be injected in men, but their average age is older compared with women who receive injections in this location.
Dr. Talakoub and Dr. Wesley are co-contributors to a monthly Aesthetic Dermatology column in Skin & Allergy News. Dr. Talakoub is in private practice in McLean, Va. Dr. Wesley practices dermatology in Beverly Hills, Calif. This month’s column is by Dr. Wesley.
Men make up an increasing number of dermatology patients seeking cosmetic procedures. According to data from the American Society for Dermatologic Surgery and the American Society of Plastic Surgery, 9%-10% of all cosmetic procedures performed in the United States in 2013 were on men, a 104% increase since 2000. Botulinum toxin is currently the most common minimally invasive cosmetic procedure performed in men. While the overall percentage of men undergoing treatment, compared with women, is relatively small, more than 385,000 botulinum toxin treatments were performed on men last year in the United States, an increase of 310% since 2000.
Studies have shown that men often require more units of onabotulinumtoxinA than women when treating the glabella. In a 2005 study by Alstair and Jean Carruthers, 80 men were randomized to receive 20, 40, 60, or 80 units of onabotulinumtoxinA (Botox or Vistabel). The 40-, 60-, and 80-U doses were consistently more effective than the 20-U dose was in reducing glabellar lines (duration, peak response rate, and improvement from baseline). I find this to be true in my practice. Men may often require 20-60 U in the superficial corrugator and procerus muscles, compared with 20-30 units of onabotulinumtoxinA in the same muscles in women. For the frontalis muscles, I may use 5-20 U in men, compared with 5-10 U of onabotulinumtoxinA in women, but I take care not to inject too inferiorly to avoid a heavy brow or brow ptosis. The orbicularis oculi muscles often require the similar doses of between 6-15 U (most often 12 U/side) depending on degree of muscle contraction and severity of rhytids.
In addition to differences in botulinum toxin dosing between men and women, placement of toxin also may vary. Placement in the superficial corrugator, procerus, frontalis, and orbicularis oculi muscles are often the similar and patient dependent, based on a visual assessment of where their muscles move/contract. The superficial corrugator may insert more laterally in some men, and the brow is often straighter or less arched. The difference in injection site is often at the lateral brow. In women, botulinum toxin is often injected at the lateral brow at the junction where the lateral superior portion of the orbicularis oculi muscle and frontalis meet, in order to help give the brow a "lift." Men, however, often do not want raised or arched brow. Therefore, an injection is often placed about 1 cm above the lateral brow to maintain brow position and avoid overarching, or what some may regard as feminization of the male brow.
The depressor anguli oris and orbicularis oris muscles are injected less frequently in men than in women in my practice because of seemingly decreased rhytid formation in men in these locations. The platysmal muscles may be injected in men, but their average age is older compared with women who receive injections in this location.
Dr. Talakoub and Dr. Wesley are co-contributors to a monthly Aesthetic Dermatology column in Skin & Allergy News. Dr. Talakoub is in private practice in McLean, Va. Dr. Wesley practices dermatology in Beverly Hills, Calif. This month’s column is by Dr. Wesley.

FDA looks to make companion diagnostics, lab tests more reliable
Last month, the Food and Drug Administration announced the latest steps it is taking to advance the use of personalized medicine.
First, the agency finalized guidance on the development of companion diagnostics. Second, it signaled its intent to begin oversight of certain laboratory developed tests (LDTs), tests that are designed, manufactured, and used within a single laboratory.
The guidance, initially issued as a draft in July 2011, offers the agency’s thinking on its expectations on the development of companion diagnostics. No substantive changes were made to the final guidance document from its draft version, agency officials said.
"When drug companies develop therapies that will only work on specific subpopulations, it’s important those therapies are approved with a diagnostic test that the FDA knows is accurate and reliable and patients and their physicians can count on," FDA Commissioner Dr. Margaret Hamburg said during a press teleconference.
The agency also revealed its initial thoughts on how it will regulate LDTs in a letter to Congress. The FDA is required to let Congress know 60 days prior to the issuance of draft and final guidance. The forthcoming draft represents a change in how the agency is approaching LDTs.
"The FDA has historically exercised enforcement discretion over LDTs, meaning the agency generally did not enforce applicable regulatory requirements on the tests because they were generally considered lower risk and used on a limited basis within a given institution," Dr. Hamburg said. "Today, they may be marketed and used more broadly and compete with FDA-approved tests without clinical studies to support their use. The deeper concern is about physicians and patients making critical health decisions based on diagnostic tests that have generally not been reviewed by the FDA. Without premarket review by the agency, patients, their health care providers, or the FDA itself cannot be assured those tests are accurate and reliable."
Dr. Hamburg said the agency plans to enforce premarket review requirements for higher-risk LDTs, "including those used to determine medical treatment and that have the same intended use of FDA-approved and FDA-cleared companion diagnostics currently on the market."
The agency’s actions received praise from cancer researchers.
"The recent announcements by the FDA are aimed at providing patients and their physicians with an important level of confidence and certainty with regard to the highly complex molecular and genetic information that these diagnostic tests are determining," American Association for Cancer Research President Dr. Carlos L. Arteaga said in a statement. "As an organization that represents the entire continuum of research, from the laboratory to the clinic, including the clinical researchers and physician-scientists engaged in cancer patient care, the AACR looks forward to continuing to engage with the FDA to ensure that the molecular and genetic diagnostic tests that are being utilized by physicians and patients are based on solidly supported scientific evidence."
Many in the health care community, particularly those in the oncology community, are looking at how best to use personalized medicine as a means of achieving better treatment outcomes and controlling costs of health care.
Zebrafish research solves mystery of HSC generation

A cure for a range of blood and immune disorders is in sight, according to researchers who say they’ve solved a mystery of hematopoietic stem cell (HSC) generation.
By studying zebrafish embryos, the investigators found that migratory cells from a region known as the endotome are essential for HSC formation.
The team also discovered some of the signals required for HSC generation and identified genes necessary for endotome formation.
The researchers believe these findings, published in Nature, bring us one step closer to creating viable HSCs in the lab.
“HSCs are one of the best therapeutic tools at our disposal because they can make any blood cell in the body,” said study author Peter Currie, PhD, of the Australian Regenerative Medicine Institute at Monash University in Victoria, Australia.
“Potentially, we could use these cells in many more ways than current transplantation strategies to treat serious blood disorders and diseases, but only if we can figure out how they are generated in the first place.”
In an attempt to do just that, Dr Currie and his colleagues studied developing zebrafish. They used high-resolution microscopy to film how HSCs form inside the embryo.
The investigators noted that, in vertebrate embryos, HSCs are initially generated within the dorsal aorta. And previous research showed that signaling relayed from adjacent somites coordinates HSC induction.
Dr Currie and his colleagues found that somite specification of HSCs occurs thanks to an endothelial precursor cell population. These cells arise in a sub-compartment of the zebrafish somite the researchers dubbed “the endotome.”
Endothelial cells from the endotome are specified thanks to activity of the homeobox gene meox1. Specified endotome cells then migrate to and colonize the dorsal aorta, where they induce HSC formation via chemokine signaling that’s activated during endotome formation.
“Endotome cells act like a comfy sofa for pre-HSCs to snuggle into, helping them progress to become fully fledged stem cells,” Dr Currie said. “Not only did we identify some of the cells and signals required for HSC formation, we also pinpointed the genes required for endotome formation in the first place.”
“The really exciting thing about these results is that if we can find the signals present in the endotome cells responsible for embryonic HSC formation, then we can use them in vitro to make different blood cells on demand for all sorts of blood-related disorders.”
For the next phase of this research, Dr Currie and his colleagues are attempting to identify more of the molecular cues that trigger HSC production. ![]()
Technique may predict progression in MM
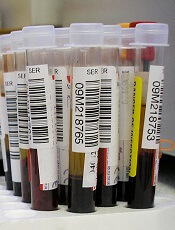
Credit: Graham Colm
Scientists have found that a technique used in Earth science research may be able to help physicians predict the course of multiple myeloma (MM).
The team showed they could use calcium isotope analysis to predict whether MM patients are at risk for developing bone lesions.
The group believes this technique could be used to chart the progression or recurrence of MM and help tailor therapies to better protect patients’ bones.
“At present, there is no good way to track changes in bone balance, except retrospectively using X-ray methods,” said Ariel Anbar, PhD, of Arizona State University in Tempe. “By the time the X-rays show something, the damage has been done.”
“Right now, pain is usually the first indication that cancer is affecting the bones,” added Rafael Fonseca, MD, of the Mayo Clinic in Scottsdale, Arizona. “If we could detect it earlier by an analysis of urine or blood in high-risk patients, it could significantly improve their care.”
To explore this possibility, Drs Fonseca, Anbar, and their colleagues performed calcium isotope analysis using blood samples from MM patients. The team recounted their results in a letter to Leukemia.
As the name suggests, calcium isotope analysis measures calcium isotopes that are naturally present in blood. The technique makes use of a fact well known to Earth scientists but not normally used in biomedicine: different isotopes of a chemical element can react at slightly different rates.
An earlier study testing this technique in healthy subjects showed that when bones form, the lighter isotopes of calcium enter bone a little faster than the heavier isotopes. That difference, called isotope fractionation, is the key to the method.
In healthy, active humans, bone is forming at about the same rate as it resorbs. But if bone loss is occurring, the isotopic composition of blood becomes enriched in the lighter isotopes as bones resorb more quickly than they are formed.
The effect on calcium isotopes is very small, typically less than a 0.02% change in the isotope ratio. But even effects that small can be measured using precise mass spectrometry methods.
Using these methods, the researchers tested peripheral blood samples from 71 adult patients—55 with MM, 9 with smoldering MM, and 7 with monoclonal gammopathy of undetermined significance.
The researchers found an association between how active a patient’s disease was and the change in the isotope ratios. In fact, the isotope ratios predicted disease activity better than, and independent from, standard clinical variables.
Blood samples from patients with active disease had significantly lower mean calcium isotope compositions than samples from patients with non-active disease (mean δ44/42Ca=-0.8 vs -0.67, P=0.025), regardless of diagnosis.
For MM patients specifically, those with active disease had a significantly lower mean δ44/42Ca than patients with non-active disease (-0.79 vs -0.63, P=0.016), which was consistent with resorption of bone containing lighter 42Ca.
Dr Anbar noted that, although calcium isotope analysis has worked in this small set of patients, additional research is needed to verify these initial findings and improve the efficiency of analysis.
“If the method proves to be robust after more careful validation, it could provide earlier detection of bone involvement than presently possible,” he said, “and also provide the possibility to monitor the effectiveness of drugs to combat bone loss.” ![]()
Credit: Graham Colm
Scientists have found that a technique used in Earth science research may be able to help physicians predict the course of multiple myeloma (MM).
The team showed they could use calcium isotope analysis to predict whether MM patients are at risk for developing bone lesions.
The group believes this technique could be used to chart the progression or recurrence of MM and help tailor therapies to better protect patients’ bones.
“At present, there is no good way to track changes in bone balance, except retrospectively using X-ray methods,” said Ariel Anbar, PhD, of Arizona State University in Tempe. “By the time the X-rays show something, the damage has been done.”
“Right now, pain is usually the first indication that cancer is affecting the bones,” added Rafael Fonseca, MD, of the Mayo Clinic in Scottsdale, Arizona. “If we could detect it earlier by an analysis of urine or blood in high-risk patients, it could significantly improve their care.”
To explore this possibility, Drs Fonseca, Anbar, and their colleagues performed calcium isotope analysis using blood samples from MM patients. The team recounted their results in a letter to Leukemia.
As the name suggests, calcium isotope analysis measures calcium isotopes that are naturally present in blood. The technique makes use of a fact well known to Earth scientists but not normally used in biomedicine: different isotopes of a chemical element can react at slightly different rates.
An earlier study testing this technique in healthy subjects showed that when bones form, the lighter isotopes of calcium enter bone a little faster than the heavier isotopes. That difference, called isotope fractionation, is the key to the method.
In healthy, active humans, bone is forming at about the same rate as it resorbs. But if bone loss is occurring, the isotopic composition of blood becomes enriched in the lighter isotopes as bones resorb more quickly than they are formed.
The effect on calcium isotopes is very small, typically less than a 0.02% change in the isotope ratio. But even effects that small can be measured using precise mass spectrometry methods.
Using these methods, the researchers tested peripheral blood samples from 71 adult patients—55 with MM, 9 with smoldering MM, and 7 with monoclonal gammopathy of undetermined significance.
The researchers found an association between how active a patient’s disease was and the change in the isotope ratios. In fact, the isotope ratios predicted disease activity better than, and independent from, standard clinical variables.
Blood samples from patients with active disease had significantly lower mean calcium isotope compositions than samples from patients with non-active disease (mean δ44/42Ca=-0.8 vs -0.67, P=0.025), regardless of diagnosis.
For MM patients specifically, those with active disease had a significantly lower mean δ44/42Ca than patients with non-active disease (-0.79 vs -0.63, P=0.016), which was consistent with resorption of bone containing lighter 42Ca.
Dr Anbar noted that, although calcium isotope analysis has worked in this small set of patients, additional research is needed to verify these initial findings and improve the efficiency of analysis.
“If the method proves to be robust after more careful validation, it could provide earlier detection of bone involvement than presently possible,” he said, “and also provide the possibility to monitor the effectiveness of drugs to combat bone loss.”