User login
The Right Choice? Surgeons, patients, and ethical analysis
In July 2011, I first had the opportunity to write a column on ethics for ACS Surgery News. That article, "Responding to Family/Patient Requests," explored possible responses to the family members’ requests to "do everything" for a critically ill patient. The article was published under the tag line, "The Right Choice."
Since that first article, I have had the opportunity to write 12 additional columns on different ethical issues in the care of surgical patients. The issues have ranged from considerations of informed consent and disclosure of information to the challenges of innovative techniques and scarce resources. Each of these columns has continued to be under the heading "The Right Choice." As I considered what to write about this month, I reviewed my previous articles and I was struck by a worrisome possibility. In the challenging surgical cases presented, is the suggestion that I know "the right choice" actually wrong?
Medical ethics has increasingly become an important topic in medical schools and the clinical care of patients since the late 1970s. Although the medical and surgical care of patients has always had an ethical dimension, it has only been in the last several decades that the ethical issues have been separately identified and analyzed. As the acceptance of surgeons making decisions about what is "best" for their patients has shifted to increasing respect for the patient as an autonomous decision maker, we have seen the importance of understanding patient preferences increase.
At the same time, as medical and surgical care has improved, we now have more options to prolong patients’ lives even when the quality of those lives may be dramatically diminished. These factors have led to the increased consideration of ethical dimensions of decisions that we must help our patients make.
Although many authors have suggested ways to proceed with the ethical analysis of cases, few methods have been as widely adopted as that suggested by Albert Jonsen, Mark Siegler, and William Winslade in their influential book, "Clinical Ethics: A Practical Approach to Ethical Decisions in Clinical Medicine," 7th edition (New York: Lange Clinical Science/McGraw Hill, 2010). These authors suggest that the analysis of a case should include attention to four sets of issues: medical indications, patient preferences, quality of life, and contextual features. By analyzing these issues for a difficult case, we are often able to see where the underlying principles of beneficence, nonmaleficence, respect for patient autonomy, and justice may be at odds.
For example, in the case that I discussed in the July 2011 issue, about the 80-year-old woman with extensive gangrenous bowel, a central concern was whether the surgical decision making should be altered by the family member’s request to "do everything you can." In this case, I suggested that requests from surrogate decision makers must be tempered by the realities of the case and the importance of not harming a patient by providing burdensome care that has minimal chance of success.
As I reread that prior article, I am struck by the fact that I suggest a way of thinking about the case and a series of considerations that are important. However, I am not comfortable saying that I have identified the single correct course of action. I believe that although ethical analysis of cases has tremendous value for doctors and patients, there is rarely one right answer. There may be several wrong answers, and there may be several acceptable answers, but there is rarely a single right choice. My goal in these columns that I wrote in the past and hope to write in the future is to raise awareness of the ethical dimensions of the case, to suggest important considerations, and perhaps even to identify some of the ethical principles that may be relevant. But I do not believe that I can identify "the right choice
In the very first edition of "Clinical Ethics" published in 1982, Jonsen, Siegler, and Winslade wrote in the preface, "We do not merely discuss or analyze the ethical problems; we offer counsel about decisions. Lest this be thought presumptuous, we do not consider our counsel the single and final answer. We offer it in the tradition of medical consultation: The consultant may bring to the practitioner’s view of the case not only broader information but another perspective."
I have tried to provide this type of information and perspective in the ACS Surgery News ethics columns and in view of the difficulty of determining the single right answer to many challenging cases, future columns will be found under the new heading, "The Right Choice?" By adding the critical question mark, I hope that readers will be reminded of the need for ongoing discussion of the challenging ethical questions that arise in the care of surgical patients.
Dr. Angelos is the Linda Kohler Anderson Professor of Surgery and Surgical Ethics; chief, endocrine surgery; and associate director, MacLean Center for Clinical Medical Ethics, at the University of Chicago.

Surgery in an aging population, part 2
Because of the increased risks associated with surgery in an elderly population, a thorough preoperative assessment should include identification of medical problems and important risk factors for increased perioperative morbidity and mortality, a thorough evaluation of the patient’s activities of daily living, and a mini–mental status exam (Primary Care 1989;16:361-76).

The severity of a patient’s illness is a better predictor of perioperative morbidity than age, and therefore age alone should not determine whether gynecologists operate (Clin. Podiatr. Med. Surg. 2003;20:607-26). In elderly patients, we should consider preoperative consultation with the patient’s primary care physician, subspecialists, geriatricians, physical and occupational therapists, and anesthesiologist to evaluate comorbidities and optimize preoperative status. Posthospitalization discharge planning also should start preoperatively if there is a concern that a patient may not be able to be discharged home.
Gynecologists also should consider the indications for surgery and a patient’s life expectancy. Prior to surgery, surgeons should believe that each patient has an expected life span such that they will benefit from the surgery. We should perform the most appropriate and least aggressive surgery and take into consideration the duration of the procedure. Surgeons also should consider functional outcomes, including quality of life, and the goal should be a postoperative return to normal function (Mt. Sinai J. Med. 2012;79:95-106).
Other factors to consider once a gynecologist has decided to operate on an elderly patient include surgical approach, mode of anesthesia, and the need for operative staging. An abdominal surgery is a risk factor for perioperative morbidity. Therefore, a laparoscopic or vaginal approach should be considered in elderly patients. These surgeries may promote more rapid return to functional status, thereby decreasing the risk of postoperative respiratory complications, length of hospital stay, and risk of delirium and postoperative cognitive decline (Curr. Opin. Obstet. Gynecol. 1997;9:300-305).Unfortunately, changes in cardiovascular physiology during abdominal insufflation and desufflation may lead to decreased peripheral perfusion and increased cardiac output. Additionally, a laparoscopic approach can lead to increases in operating time. Therefore, a gynecologist must carefully consider surgical approach.

Another important aspect to consider prior to surgery is whether the procedure can be performed under neuraxial anesthesia. An epidural could be left in place for postoperative pain control and eliminate the need for general anesthesia and postoperative pain control with narcotics. Gynecologic oncologists specifically must consider whether extending the procedure to include surgical staging is necessary and appropriate for each individual patient. A specific example concerns lymph node dissection in endometrial cancer. A recent study has shown that 5-year survival does not differ in women older than 80 years with low-grade endometrial cancer if lymph node dissection is omitted (Gynecol. Oncol. 2012;126:12-15).This may be important in limiting total anesthetic time to under 3 hours in an attempt to decrease perioperative morbidity and mortality.
Specific operating room considerations include patient position, coverage, and orientation. Elderly patients have fragile skin with decreased elasticity and decreased muscle mass. Therefore, they are more sensitive than their younger counterparts to bruising, skin tears, pressure ulcers, and hypothermia. Extra care must be taken during patient positioning to pad joints, avoid tape on fragile skin, and keep her covered with blankets or a warming device. Elderly patients also are at increased risk for venous thromboembolism; therefore sequential compression devices and, potentially, chemoprophylaxis should be used intraoperatively. On emergence from anesthesia, elderly patients should be given their glasses, and operating room staff should speak clearly and loudly to orient the patient to their situation.
Postoperatively, providers and family should continue to orient and reorient elderly patients to person, place, and situation. Good pain control is important, especially with larger abdominal incisions, to decrease respiratory complications and promote early ambulation. NSAIDs or neuraxial anesthesia should be considered to decrease the use of potentially sedating opioids. But avoid NSAIDs in patients with dehydration, congestive heart failure, and preexisting renal disease. It also is important to get patients back to their activities of daily living as soon as possible; therefore inpatient physical and occupational therapy should be considered on the day following surgery. Prior to discharge, care to avoid too many additional medications and attention to potential medication interactions are critical.
Elderly women are at risk for increased postoperative morbidity and mortality; however, with appropriate perioperative planning, these risks can be minimized. Each patient and her situation should be carefully evaluated, and a multidisciplinary team assembled to assist with taking the steps necessary to promote a smooth transition to the outpatient setting and decrease complications.
Dr. Hacker is a rising fourth-year resident in the department of obstetrics and gynecology at the University of North Carolina at Chapel Hill. Dr. Clarke-Pearson is the chair and the Robert A. Ross Distinguished Professor of Obstetrics and Gynecology, and a professor in the division of gynecologic oncology at the university. E-mail them at [email protected].
Because of the increased risks associated with surgery in an elderly population, a thorough preoperative assessment should include identification of medical problems and important risk factors for increased perioperative morbidity and mortality, a thorough evaluation of the patient’s activities of daily living, and a mini–mental status exam (Primary Care 1989;16:361-76).
The severity of a patient’s illness is a better predictor of perioperative morbidity than age, and therefore age alone should not determine whether gynecologists operate (Clin. Podiatr. Med. Surg. 2003;20:607-26). In elderly patients, we should consider preoperative consultation with the patient’s primary care physician, subspecialists, geriatricians, physical and occupational therapists, and anesthesiologist to evaluate comorbidities and optimize preoperative status. Posthospitalization discharge planning also should start preoperatively if there is a concern that a patient may not be able to be discharged home.
Gynecologists also should consider the indications for surgery and a patient’s life expectancy. Prior to surgery, surgeons should believe that each patient has an expected life span such that they will benefit from the surgery. We should perform the most appropriate and least aggressive surgery and take into consideration the duration of the procedure. Surgeons also should consider functional outcomes, including quality of life, and the goal should be a postoperative return to normal function (Mt. Sinai J. Med. 2012;79:95-106).
Other factors to consider once a gynecologist has decided to operate on an elderly patient include surgical approach, mode of anesthesia, and the need for operative staging. An abdominal surgery is a risk factor for perioperative morbidity. Therefore, a laparoscopic or vaginal approach should be considered in elderly patients. These surgeries may promote more rapid return to functional status, thereby decreasing the risk of postoperative respiratory complications, length of hospital stay, and risk of delirium and postoperative cognitive decline (Curr. Opin. Obstet. Gynecol. 1997;9:300-305).Unfortunately, changes in cardiovascular physiology during abdominal insufflation and desufflation may lead to decreased peripheral perfusion and increased cardiac output. Additionally, a laparoscopic approach can lead to increases in operating time. Therefore, a gynecologist must carefully consider surgical approach.
Another important aspect to consider prior to surgery is whether the procedure can be performed under neuraxial anesthesia. An epidural could be left in place for postoperative pain control and eliminate the need for general anesthesia and postoperative pain control with narcotics. Gynecologic oncologists specifically must consider whether extending the procedure to include surgical staging is necessary and appropriate for each individual patient. A specific example concerns lymph node dissection in endometrial cancer. A recent study has shown that 5-year survival does not differ in women older than 80 years with low-grade endometrial cancer if lymph node dissection is omitted (Gynecol. Oncol. 2012;126:12-15).This may be important in limiting total anesthetic time to under 3 hours in an attempt to decrease perioperative morbidity and mortality.
Specific operating room considerations include patient position, coverage, and orientation. Elderly patients have fragile skin with decreased elasticity and decreased muscle mass. Therefore, they are more sensitive than their younger counterparts to bruising, skin tears, pressure ulcers, and hypothermia. Extra care must be taken during patient positioning to pad joints, avoid tape on fragile skin, and keep her covered with blankets or a warming device. Elderly patients also are at increased risk for venous thromboembolism; therefore sequential compression devices and, potentially, chemoprophylaxis should be used intraoperatively. On emergence from anesthesia, elderly patients should be given their glasses, and operating room staff should speak clearly and loudly to orient the patient to their situation.
Postoperatively, providers and family should continue to orient and reorient elderly patients to person, place, and situation. Good pain control is important, especially with larger abdominal incisions, to decrease respiratory complications and promote early ambulation. NSAIDs or neuraxial anesthesia should be considered to decrease the use of potentially sedating opioids. But avoid NSAIDs in patients with dehydration, congestive heart failure, and preexisting renal disease. It also is important to get patients back to their activities of daily living as soon as possible; therefore inpatient physical and occupational therapy should be considered on the day following surgery. Prior to discharge, care to avoid too many additional medications and attention to potential medication interactions are critical.
Elderly women are at risk for increased postoperative morbidity and mortality; however, with appropriate perioperative planning, these risks can be minimized. Each patient and her situation should be carefully evaluated, and a multidisciplinary team assembled to assist with taking the steps necessary to promote a smooth transition to the outpatient setting and decrease complications.
Dr. Hacker is a rising fourth-year resident in the department of obstetrics and gynecology at the University of North Carolina at Chapel Hill. Dr. Clarke-Pearson is the chair and the Robert A. Ross Distinguished Professor of Obstetrics and Gynecology, and a professor in the division of gynecologic oncology at the university. E-mail them at [email protected].

Signaling Pathways and Novel Inhibitors in Chronic Lymphocytic Leukemia
Chronic lymphocytic leukemia (CLL) is a common hematological malignancy in the U.S. with 15,000 new patients diagnosed each year.1 This leukemia is frequently diagnosed in veterans since it is more commonly seen in an elderly male population. The disease is characterized by a slow accumulation of mature B cells that are functionally incompetent and resist apoptosis. CLL has an indolent clinical course, but about 60% to 70% of patients require treatment. The disease also runs a variable course, and a number of genetic abnormalities and prognostic markers have been defined to subclassify CLL patients and prognosticate.2-4 This article reviews important CLL signaling pathways and novel therapeutic agents in this leukemia.
Signaling Pathways
B-Cell Receptor Signaling
The B-cell receptor (BCR) signaling is the major signaling pathway in CLL, because it defines clinical, biologic, and prognostic characteristics of the disease.5 The BCR is composed of a surface transmembrane immunoglobulin that binds the antigen with CD79 alpha and beta chains. The activation of BCR results in the formation of a signaling complex or signalosome, which includes Lyn, Syk, BTK, and ZAP-70, among other components that assemble with other adaptor proteins (Figure). This assembly of proteins occurs on the cytoplasmic tails of immunoglobulin chains on regions called immunoreceptor tyrosine-based motifs (ITAMs).
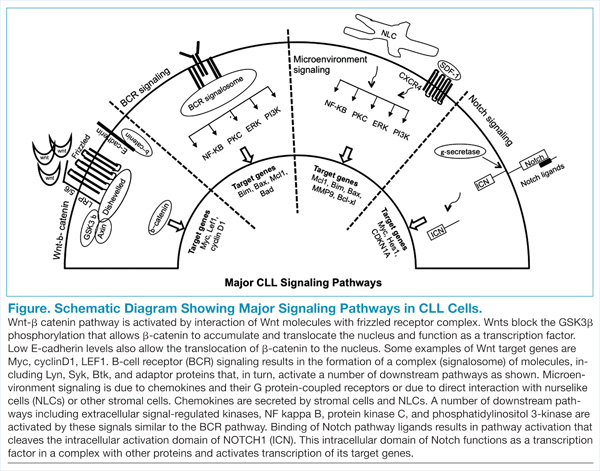
With the assembly of this signaling complex, BCR stimulates a number of downstream pathways, such as phosphatidylinositol 3-kinase (PI3K), protein kinase B (Akt), protein kinase C, nuclear factor-κB (NFκB), and extracellular signal-regulated kinases (ERKs) (Figure). Activation of these pathways results in cell proliferation, resistance to apoptosis, increased cell motility and migration. Recent studies have identified additional novel components of this signaling complex, including a guanine nucleotide exchange factor (GEF) RASGRF1. This GEF is activated by BCR signaling and, in turn, stimulates the ERK pathway by increasing the production of active GTP-bound Ras.6
The ability of BCR to activate a number of downstream signaling pathways makes it a highly relevant and investigated pathway in this leukemia. Inhibitors have been developed and/or identified against a number of signalosome components to block the BCR signaling.7 Syk and Lyn are Src kinases, and their phosphorylation is one of the initial events of BCR signaling. Syk is overexpressed in CLL specimens, and Syk inhibitors (R406 and P505-15, also known as PRT062607) have shown activity in CLL.8,9 Dasatinib is a Src inhibitor that also shows activity in CLL specimens and is being studied in combination with chemotherapy drugs in refractory CLL patients.10
BTK, a component of the BCR signalosome, is required for BCR function, and loss of its function is seen in X-linked agammaglobulinemia. PCI-32765 (ibrutinib) is an oral BTK inhibitor that irreversibly inactivates this kinase and has been approved for clinical use in CLL patients.11,12 Another signaling pathway activated by BCR is the PI3K, and a promising inhibitor (CAL-101) blocks its activity in CLL specimens.13 Investigative work has identified that the delta isoform of PI3K p110 is highly expressed in B cells and lymphocytes.14 This is a catalytic subunit of a class I PI3K with a role in BCR signaling. A selective inhibitor GS-1101 (CAL-101) is able to block PI3K signaling in CLL specimens and inhibits Akt phosphorylation and other downstream effectors along with induction of apoptosis.15 The clinical data with BTK and PI3K inhibitors will be discussed later in this review.
CLL and the Microenvironment
Interactions between CLL cells and the microenvironment allow CLL cells to thrive in certain niche environments.16,17 Interaction mainly occurs via bone marrow stromal cells and nurselike cells (NLCs), which evolve from monocytes (Figure). These interactions can be divided into 2 groups. First, CLL cell growth is supported by a number of chemokine receptor-ligand interactions. CXCR4 is the receptor for CXCL12 (SDF-1) that stimulates chemotaxis and tissue homing. Another chemokine is CXCL13, which acts via its receptor CXCR5 and is involved in chemotaxis and activation of other kinases. Second, NLCs also support CLL cells by expressing TNF family members BAFF and APRIL, which interact with their receptors and activate the NFκB pathway.
Leukemic cells also express VLA-4 integrins, which further their support adhesion to the stromal cells and predict for an aggressive phenotype. Specific inhibitors that block the stimulation by chemokines and cytokines are not yet available; however, one can envision that this class of inhibitors will decrease the chemoresistance of leukemic cells and will be used in conjunction with other chemotherapy agents. Interestingly, inhibitors that block BCR-mediated signaling (BTK and PI3K inhibitors) also inhibit signaling via the microenvironment and chemokines.
Wnt-β-catenin Pathway
Wnt signaling affects developmental pathways, and its aberrant activation has major oncogenic effects as well. This pathway is activated in CLL as these leukemic cells express high levels of Wnt and frizzled along with epigenetic downregulation of Wnt pathway antagonist genes, including secreted frizzled-related protein (SFRP) family members and WIF1 (Figure).18-20 The binding of Wnts to their cognate receptors results in inhibition of GSK3β phosphorylation and stabilization of β-catenin, which then translocates to the nucleus and interacts with lymphoid-enhancing (LEF) and T-cell transcription factors to activate transcription of Wnt-target genes. Lack of E-cadherin expression in CLL cells also results in an increase in translocation of β-catenin and upregulation of the Wnt pathway.20
Wnt-target genes include Myc, LEF, cyclinD1, COX-2, and MMP. Gene expression profiling from our laboratory and other groups have identified the overexpression of these wnt-target genes and support this pathway activation in CLL cells.20 This is a promising signalling pathway and an active area of research for developing inhibitors that will have a growth inhibitory effect on CLL leukemic cells. GSK3b inhibitors and other drugs that re-express epigenetically silenced Wnt antagonist genes have been shown to inhibit this pathway activity in CLL cells in vitro.
Notch Pathway Activation
High-throughput exome sequencing has identified recurring mutations in a number of genes, including NOTCH1.21 Analysis of additional CLL patients confirmed activating NOTCH1 mutations in 10% to 15% of CLL patients and were also associated with poor outcome.22 This pathway is activated by ligands such as Jagged and Delta-like, which interact with the Notch receptor, which is then cleaved by γ-secretases. The cleaved intracellular domain of the NOTCH1 receptor in combination with other factors activates transcription of target genes, including Myc and HES1 (Figure). Besides the mutations that generate a truncated protein or may stabilize the pathway, the Notch pathway is also constitutively active in CLL specimens.23 Notch stimulation increases activity of prosurvival pathways and genes such as NFκB that resist apoptotic signals. The pathway can be inhibited by γ-secretase inhibitors (GSIs), which reduce the levels of cleaved NOTCH1 protein and downregulated Notch target genes. This pathway is also able to modulate the microenvironment stimuli as the GSIs inhibit responses to chemokines such as CXCL12 and inhibit migration and invasion.24
Newer Theraputic Agents
Work on signaling mechanisms paid dividends in CLL with the recent development of 2 inhibitors. Ibrutinib (BTK inhibitor) and idelalisib (PI3K inhibitor) are being studied in clinical trials, and both drugs block the BCR and microenvironment signaling pathways, thereby inhibiting the growth of CLL cells.
BTK Inhibitor: Ibrutinib
The activity of BTK is critical for a number of CLL signaling pathways, and it is a component of the initial signaling complex or signalosome that is formed with BCR signaling. Studies have shown that inhibiting this kinase blocks a number of pathways, including ERK, NFκB, and others. The drug ibrutinib blocks this kinase by forming a covalent bond and inhibiting its enzyme activity. This orally bioavailable drug showed activity in phase 1 trials in different B-cell malignancies.25 In a phase 2 study, high-risk CLL patients were given 2 different doses of this inhibitor, and the overall response rate was 71% with an overall survival at 26 months of 83%.11 Responses were seen in all patients irrespective of clinical and genetic risk factors. Based on these findings, the drug was approved for clinical use in patients with relapsed or refractory disease. Recently, there are data on the use of this drug as frontline therapy in elderly patients, and the drug was well tolerated.26 There are additional ongoing trials to compare this drug with other agents, including chlorambucil (in chemotherapy-naïve patients) and ofatumumab (in relapsed or refractory patients).
PI3 Kinase p110 Delta Inhibitor: Idelalisib
The crucial finding for the development of this inhibitor was the over-expression of the delta isoform of PI3K p110 in B-cell malignancies.14 The drug CAL-101 selectively inhibits this constitutively active isoform and induces apoptosis in a number of B-cell malignancies.15,27 In the phase 1 trial, this inhibitor was evaluated in relapsed/refractory patients at multiple dose levels.28 There was inhibition of PI3K signaling with an overall response rate of 72%, and a partial response rate of 39% was observed in CLL patients. This was followed by a randomized, placebo-controlled phase 3 study in which patients with myelosuppression, decreased renal function, or other illnesses were treated with either rituximab alone or with rituximab and idelalisib.29
At the time of reporting, the median progression-free survival (PFS) was 5.5 months in the placebo arm and was not reached in the idelalisib arm. Overall response rates were higher in the idelalisib group (81% vs 13%) with similar toxicity profiles in the 2 groups. This drug is now being extensively studied in combination with bendamustine and other anti-CD20 antibodies in clinical trials.
A unique toxicity observed with both these inhibitors is the initial lymphocytosis. In the case of ibrutinib, this was seen in a majority of patients (77%) and at the same time there was a response in the nodal disease, implying a redistribution of leukemic cells from the tissues to the peripheral blood.30
A potential explanation is that these drugs inhibit signaling via chemokines and other components of the microenvironment and by inhibiting the homing signals, allows leukemic cells to move out of their niche areas. This was analyzed in a recent study that compared clinical and biochemical parameters of patients who had a complete or partial response with ibrutinib compared with a “partial response except for lymphocytosis.”30 Patients with “partial response except for lymphocytosis” were found to have favorable prognostic factors, and the persisting leukemic cells were not clonally different from the original cells. The progression free survival of patients with “partial response except for lymphocytosis” was also similar to the subgroup with no prolonged lymphocytosis.
Discussion
Several therapeutic agents with novel mechanisms of action are effective in killing the CLL leukemic cells, and a number of targeted agents are currently in the pipeline. The next challenge for treating CLL will be the proper integration of these novel targeted agents with the traditional chemotherapy and chemoimmunotherapy approaches. Let us consider CLL patients in different clinical settings. First, a patient aged 60 years who is otherwise healthy will be treated with possibly all the available chemotherapy and chemoimmunotherapy options, as well as the newer targeted agents. In this clinical setting sequencing of therapy is not a major concern. On the other hand, a patient aged 70 years who is already refractory to multiple lines of therapy is a good candidate for these newer drugs.
The more controversial use of these targeted agents will be in an older patient with some comorbidities and newly diagnosed CLL. In this clinical setting, should one go with traditional chemotherapy/chemoimmunotherapy approaches or consider newer targeted agents? These issues are now being addressed in clinical trials, and with acceptable toxicity profiles these newer drugs will move to the frontline setting.
Author disclosures
The author reports no actual or potential conflicts of interest with regard to this article.
Disclaimer
The opinions expressed herein are those of the author and do not necessarily reflect an endorsement by or opinion of Federal Practitioner, Frontline Medical Communications, the U.S. Air Force, the U.S. Government, or any of its agencies. This article may discuss unlabeled or investigational use of certain drugs. Please review complete prescribing information for specific drug combinations–including indications, contraindications, warnings, and adverse effects–before administering pharmacologic therapy to patients.
1. Siegel R, Ma J, Zou Z, Jemal A. Cancer statistics, 2014. CA Cancer J Clin. 2014;64(1):9-29.
2. Döhner H, Stilgenbauer S, Döhner K, Bentz M, Lichter P. Chromosome aberrations in B-cell chronic lymphocytic leukemia: reassessment based on molecular cytogenetic analysis. J Mol Med. 1999;77(2):266-281.
3. Hamblin TJ, Davis Z, Gardiner A, Oscier DG, Stevenson FK. Unmutated Ig V(H) genes are associated with a more aggressive form of chronic lymphocytic leukemia. Blood. 1999;94(6):1848-1854.
4. Chen L, Widhopf G, Huynh L, et al. Expression of ZAP-70 is associated with increased B-cell receptor signaling in chronic lymphocytic leukemia. Blood. 2002;100(13):4609-4614.
5. Wickremasinghe RG, Prentice AG, Steele AJ. Aberrantly activated anti-apoptotic signalling mechanisms in chronic lymphocytic leukaemia cells: Clues to the identification of novel therapeutic targets. Br J Haematol. 2011;153(5):545-556.
6. Liao W, Jordaan G, Coriaty N, Sharma S. Amplification of B cell receptor-Erk signaling by Rasgrf-1 overexpression in chronic lymphocytic leukemia [published online ahead of print April 2, 2014]. Leuk Lymphoma. doi: 10.3109/10428194.2014898759.
7. Burger JA. Inhibiting B-cell receptor signaling pathways in chronic lymphocytic leukemia. Curr Hematol Malig Rep. 2012;7(1):26-33.
8. Buchner M, Fuchs S, Prinz G, et al. Spleen tyrosine kinase is overexpressed and represents a potential therapeutic target in chronic lymphocytic leukemia. Cancer Res. 2009;69(13):5424-5432.
9. Spurgeon SE, Coffey G, Fletcher LB, et al. The selective SYK inhibitor P505-15 (PRT062607) inhibits B cell signaling and function in vitro and in vivo and augments the activity of fludarabine in chronic lymphocytic leukemia. J Pharmacol Exp Ther. 2013;344(2):378-387.
10. Veldurthy A, Patz M, Hagist S, et al. The kinase inhibitor dasatinib induces apoptosis in chronic lymphocytic leukemia cells in vitro with preference for a subgroup of patients with unmutated IgVH genes. Blood. 2008;112(4):1443-1452.
11. Byrd JC, Furman RR, Coutre SE, et al. Targeting BTK with ibrutinib in relapsed chronic lymphocytic leukemia [published correction appears in N Engl J Med. 2014;370(8):786]. N Engl J Med. 2013;369(1):32-42.
12. Cheng S, Ma J, Guo A, et al. BTK inhibition targets in vivo CLL proliferation through its effects on B-cell receptor signaling activity. Leukemia. 2014;28(3):649-657.
13. Lannutti BJ, Meadows SA, Herman SE, et al. CAL-101, a p110delta selective phosphatidylinositol-3-kinase inhibitor for the treatment of B-cell malignancies, inhibits PI3K signaling and cellular viability. Blood. 2011;117(2):591-594.
14. Chantry D, Vojtek A, Kashishian A, et al. p110delta, a novel phosphatidylinositol 3-kinase catalytic subunit that associates with p85 and is expressed predominantly in leukocytes. J Biol Chem. 1997;272(31):19236-19241.
15. Hoellenriegel J, Meadows SA, Sivina M, et al. The phosphoinositide 3’-kinase delta inhibitor, CAL-101, inhibits B-cell receptor signaling and chemokine networks in chronic lymphocytic leukemia. Blood. 2011;118(13):3603-3612.
16. Burger JA, Ghia P, Rosenwald A, Caligaris-Cappio F. The microenvironment in mature B-cell malignancies: A target for new treatment strategies. Blood. 2009;114(16):3367-3375.
17. ten Hacken E, Burger JA. Molecular pathways: targeting the microenvironment in chronic lymphocytic leukemia—focus on the B-cell receptor. Clin Cancer Res. 2014;20(3):548-556.
18. Gandhirajan RK, Poll-Wolbeck SJ, Gehrke I, Kreuzer KA. Wnt/b-catenin/LEF-1 signaling in chronic lymphocytic leukemia (CLL): a target for current and potential therapeutic options. Curr Cancer Drug Targets. 2010;10(7):716-727.
19. Gutierrez A, Jr, Tschumper RC, Wu X, et al. LEF-1 is a prosurvival factor in chronic lymphocytic leukemia and is expressed in the preleukemic state of monoclonal B-cell lymphocytosis. Blood. 2010;116(16):2975-2983.
20. Jordaan G, Liao W, Sharma S. E-cadherin gene re-expression in chronic lymphocytic leukemia cells by HDAC inhibitors. BMC Cancer. 2013;13:88.
21. Puente XS, Pinyol M, Quesada V, et al. Whole-genome sequencing identifies recurrent mutations in chronic lymphocytic leukaemia. Nature. 2011;475(7354):101-105.
22. Fabbri G, Rasi S, Rossi D, et al. Analysis of the chronic lymphocytic leukemia coding genome: role of NOTCH1 mutational activation. J Exp Med. 2011;208(7):1389-1401.
23. Rosati E, Sabatini R, Rampino G, et al. Constitutively activated Notch signaling is involved in survival and apoptosis resistance of B-CLL cells. Blood. 2009;113(4):856-865.
24. López-Guerra M, Xargay-Torrent S, Rosich L, et al. The g-secretase inhibitor PF-03084014 combined with fludarabine antagonizes migration, invasion and angiogenesis in NOTCH1-mutated CLL cells [published online ahead of print April 30, 2014]. Leukemia. doi: 10.1038/leu.2014.143.
25. Advani RH, Buggy JJ, Sharman JP, et al. Bruton tyrosine kinase inhibitor ibrutinib (PCI-32765) has significant activity in patients with relapsed/refractory B-cell malignancies. J Clin Oncol. 2013;31(1):88-94.
26. O’Brien S, Furman RR, Coutre SE, et al. Ibrutinib as initial therapy for elderly patients with chronic lymphocytic leukaemia or small lymphocytic lymphoma: An open-label, multicentre, phase 1b/2 trial. Lancet Oncol. 2014;15(1):48-58.
27. Brown JR, Byrd JC, Coutre SE, et al. Idelalisib, an inhibitor of phosphatidylinositol 3-kinase p110∂, for relapsed/refractory chronic lymphocytic leukemia. Blood. 2014;123(22):3390-3397.
28. Brown JR, Furman RR, Flinn I, et al. Final results of a phase I study of idelalisib (GS-1101) a selective inhibitor of PI3K∂, in patients with relapsed or refractory CLL. J Clin Oncol. 2013;31:Absract 7003.
29. Furman RR, Sharman JP, Coutre SE, et al. Idelalisib and rituximab in relapsed chronic lymphocytic leukemia. N Engl J Med. 2014;370(11):997-1007.
30. Woyach JA, Smucker K, Smith LL, et al. Prolonged lymphocytosis during ibrutinib therapy is associated with distinct molecular characteristics and does not indicate a suboptimal response to therapy. Blood. 2013;123(12):1810-1817.
Chronic lymphocytic leukemia (CLL) is a common hematological malignancy in the U.S. with 15,000 new patients diagnosed each year.1 This leukemia is frequently diagnosed in veterans since it is more commonly seen in an elderly male population. The disease is characterized by a slow accumulation of mature B cells that are functionally incompetent and resist apoptosis. CLL has an indolent clinical course, but about 60% to 70% of patients require treatment. The disease also runs a variable course, and a number of genetic abnormalities and prognostic markers have been defined to subclassify CLL patients and prognosticate.2-4 This article reviews important CLL signaling pathways and novel therapeutic agents in this leukemia.
Signaling Pathways
B-Cell Receptor Signaling
The B-cell receptor (BCR) signaling is the major signaling pathway in CLL, because it defines clinical, biologic, and prognostic characteristics of the disease.5 The BCR is composed of a surface transmembrane immunoglobulin that binds the antigen with CD79 alpha and beta chains. The activation of BCR results in the formation of a signaling complex or signalosome, which includes Lyn, Syk, BTK, and ZAP-70, among other components that assemble with other adaptor proteins (Figure). This assembly of proteins occurs on the cytoplasmic tails of immunoglobulin chains on regions called immunoreceptor tyrosine-based motifs (ITAMs).
With the assembly of this signaling complex, BCR stimulates a number of downstream pathways, such as phosphatidylinositol 3-kinase (PI3K), protein kinase B (Akt), protein kinase C, nuclear factor-κB (NFκB), and extracellular signal-regulated kinases (ERKs) (Figure). Activation of these pathways results in cell proliferation, resistance to apoptosis, increased cell motility and migration. Recent studies have identified additional novel components of this signaling complex, including a guanine nucleotide exchange factor (GEF) RASGRF1. This GEF is activated by BCR signaling and, in turn, stimulates the ERK pathway by increasing the production of active GTP-bound Ras.6
The ability of BCR to activate a number of downstream signaling pathways makes it a highly relevant and investigated pathway in this leukemia. Inhibitors have been developed and/or identified against a number of signalosome components to block the BCR signaling.7 Syk and Lyn are Src kinases, and their phosphorylation is one of the initial events of BCR signaling. Syk is overexpressed in CLL specimens, and Syk inhibitors (R406 and P505-15, also known as PRT062607) have shown activity in CLL.8,9 Dasatinib is a Src inhibitor that also shows activity in CLL specimens and is being studied in combination with chemotherapy drugs in refractory CLL patients.10
BTK, a component of the BCR signalosome, is required for BCR function, and loss of its function is seen in X-linked agammaglobulinemia. PCI-32765 (ibrutinib) is an oral BTK inhibitor that irreversibly inactivates this kinase and has been approved for clinical use in CLL patients.11,12 Another signaling pathway activated by BCR is the PI3K, and a promising inhibitor (CAL-101) blocks its activity in CLL specimens.13 Investigative work has identified that the delta isoform of PI3K p110 is highly expressed in B cells and lymphocytes.14 This is a catalytic subunit of a class I PI3K with a role in BCR signaling. A selective inhibitor GS-1101 (CAL-101) is able to block PI3K signaling in CLL specimens and inhibits Akt phosphorylation and other downstream effectors along with induction of apoptosis.15 The clinical data with BTK and PI3K inhibitors will be discussed later in this review.
CLL and the Microenvironment
Interactions between CLL cells and the microenvironment allow CLL cells to thrive in certain niche environments.16,17 Interaction mainly occurs via bone marrow stromal cells and nurselike cells (NLCs), which evolve from monocytes (Figure). These interactions can be divided into 2 groups. First, CLL cell growth is supported by a number of chemokine receptor-ligand interactions. CXCR4 is the receptor for CXCL12 (SDF-1) that stimulates chemotaxis and tissue homing. Another chemokine is CXCL13, which acts via its receptor CXCR5 and is involved in chemotaxis and activation of other kinases. Second, NLCs also support CLL cells by expressing TNF family members BAFF and APRIL, which interact with their receptors and activate the NFκB pathway.
Leukemic cells also express VLA-4 integrins, which further their support adhesion to the stromal cells and predict for an aggressive phenotype. Specific inhibitors that block the stimulation by chemokines and cytokines are not yet available; however, one can envision that this class of inhibitors will decrease the chemoresistance of leukemic cells and will be used in conjunction with other chemotherapy agents. Interestingly, inhibitors that block BCR-mediated signaling (BTK and PI3K inhibitors) also inhibit signaling via the microenvironment and chemokines.
Wnt-β-catenin Pathway
Wnt signaling affects developmental pathways, and its aberrant activation has major oncogenic effects as well. This pathway is activated in CLL as these leukemic cells express high levels of Wnt and frizzled along with epigenetic downregulation of Wnt pathway antagonist genes, including secreted frizzled-related protein (SFRP) family members and WIF1 (Figure).18-20 The binding of Wnts to their cognate receptors results in inhibition of GSK3β phosphorylation and stabilization of β-catenin, which then translocates to the nucleus and interacts with lymphoid-enhancing (LEF) and T-cell transcription factors to activate transcription of Wnt-target genes. Lack of E-cadherin expression in CLL cells also results in an increase in translocation of β-catenin and upregulation of the Wnt pathway.20
Wnt-target genes include Myc, LEF, cyclinD1, COX-2, and MMP. Gene expression profiling from our laboratory and other groups have identified the overexpression of these wnt-target genes and support this pathway activation in CLL cells.20 This is a promising signalling pathway and an active area of research for developing inhibitors that will have a growth inhibitory effect on CLL leukemic cells. GSK3b inhibitors and other drugs that re-express epigenetically silenced Wnt antagonist genes have been shown to inhibit this pathway activity in CLL cells in vitro.
Notch Pathway Activation
High-throughput exome sequencing has identified recurring mutations in a number of genes, including NOTCH1.21 Analysis of additional CLL patients confirmed activating NOTCH1 mutations in 10% to 15% of CLL patients and were also associated with poor outcome.22 This pathway is activated by ligands such as Jagged and Delta-like, which interact with the Notch receptor, which is then cleaved by γ-secretases. The cleaved intracellular domain of the NOTCH1 receptor in combination with other factors activates transcription of target genes, including Myc and HES1 (Figure). Besides the mutations that generate a truncated protein or may stabilize the pathway, the Notch pathway is also constitutively active in CLL specimens.23 Notch stimulation increases activity of prosurvival pathways and genes such as NFκB that resist apoptotic signals. The pathway can be inhibited by γ-secretase inhibitors (GSIs), which reduce the levels of cleaved NOTCH1 protein and downregulated Notch target genes. This pathway is also able to modulate the microenvironment stimuli as the GSIs inhibit responses to chemokines such as CXCL12 and inhibit migration and invasion.24
Newer Theraputic Agents
Work on signaling mechanisms paid dividends in CLL with the recent development of 2 inhibitors. Ibrutinib (BTK inhibitor) and idelalisib (PI3K inhibitor) are being studied in clinical trials, and both drugs block the BCR and microenvironment signaling pathways, thereby inhibiting the growth of CLL cells.
BTK Inhibitor: Ibrutinib
The activity of BTK is critical for a number of CLL signaling pathways, and it is a component of the initial signaling complex or signalosome that is formed with BCR signaling. Studies have shown that inhibiting this kinase blocks a number of pathways, including ERK, NFκB, and others. The drug ibrutinib blocks this kinase by forming a covalent bond and inhibiting its enzyme activity. This orally bioavailable drug showed activity in phase 1 trials in different B-cell malignancies.25 In a phase 2 study, high-risk CLL patients were given 2 different doses of this inhibitor, and the overall response rate was 71% with an overall survival at 26 months of 83%.11 Responses were seen in all patients irrespective of clinical and genetic risk factors. Based on these findings, the drug was approved for clinical use in patients with relapsed or refractory disease. Recently, there are data on the use of this drug as frontline therapy in elderly patients, and the drug was well tolerated.26 There are additional ongoing trials to compare this drug with other agents, including chlorambucil (in chemotherapy-naïve patients) and ofatumumab (in relapsed or refractory patients).
PI3 Kinase p110 Delta Inhibitor: Idelalisib
The crucial finding for the development of this inhibitor was the over-expression of the delta isoform of PI3K p110 in B-cell malignancies.14 The drug CAL-101 selectively inhibits this constitutively active isoform and induces apoptosis in a number of B-cell malignancies.15,27 In the phase 1 trial, this inhibitor was evaluated in relapsed/refractory patients at multiple dose levels.28 There was inhibition of PI3K signaling with an overall response rate of 72%, and a partial response rate of 39% was observed in CLL patients. This was followed by a randomized, placebo-controlled phase 3 study in which patients with myelosuppression, decreased renal function, or other illnesses were treated with either rituximab alone or with rituximab and idelalisib.29
At the time of reporting, the median progression-free survival (PFS) was 5.5 months in the placebo arm and was not reached in the idelalisib arm. Overall response rates were higher in the idelalisib group (81% vs 13%) with similar toxicity profiles in the 2 groups. This drug is now being extensively studied in combination with bendamustine and other anti-CD20 antibodies in clinical trials.
A unique toxicity observed with both these inhibitors is the initial lymphocytosis. In the case of ibrutinib, this was seen in a majority of patients (77%) and at the same time there was a response in the nodal disease, implying a redistribution of leukemic cells from the tissues to the peripheral blood.30
A potential explanation is that these drugs inhibit signaling via chemokines and other components of the microenvironment and by inhibiting the homing signals, allows leukemic cells to move out of their niche areas. This was analyzed in a recent study that compared clinical and biochemical parameters of patients who had a complete or partial response with ibrutinib compared with a “partial response except for lymphocytosis.”30 Patients with “partial response except for lymphocytosis” were found to have favorable prognostic factors, and the persisting leukemic cells were not clonally different from the original cells. The progression free survival of patients with “partial response except for lymphocytosis” was also similar to the subgroup with no prolonged lymphocytosis.
Discussion
Several therapeutic agents with novel mechanisms of action are effective in killing the CLL leukemic cells, and a number of targeted agents are currently in the pipeline. The next challenge for treating CLL will be the proper integration of these novel targeted agents with the traditional chemotherapy and chemoimmunotherapy approaches. Let us consider CLL patients in different clinical settings. First, a patient aged 60 years who is otherwise healthy will be treated with possibly all the available chemotherapy and chemoimmunotherapy options, as well as the newer targeted agents. In this clinical setting sequencing of therapy is not a major concern. On the other hand, a patient aged 70 years who is already refractory to multiple lines of therapy is a good candidate for these newer drugs.
The more controversial use of these targeted agents will be in an older patient with some comorbidities and newly diagnosed CLL. In this clinical setting, should one go with traditional chemotherapy/chemoimmunotherapy approaches or consider newer targeted agents? These issues are now being addressed in clinical trials, and with acceptable toxicity profiles these newer drugs will move to the frontline setting.
Author disclosures
The author reports no actual or potential conflicts of interest with regard to this article.
Disclaimer
The opinions expressed herein are those of the author and do not necessarily reflect an endorsement by or opinion of Federal Practitioner, Frontline Medical Communications, the U.S. Air Force, the U.S. Government, or any of its agencies. This article may discuss unlabeled or investigational use of certain drugs. Please review complete prescribing information for specific drug combinations–including indications, contraindications, warnings, and adverse effects–before administering pharmacologic therapy to patients.
1. Siegel R, Ma J, Zou Z, Jemal A. Cancer statistics, 2014. CA Cancer J Clin. 2014;64(1):9-29.
2. Döhner H, Stilgenbauer S, Döhner K, Bentz M, Lichter P. Chromosome aberrations in B-cell chronic lymphocytic leukemia: reassessment based on molecular cytogenetic analysis. J Mol Med. 1999;77(2):266-281.
3. Hamblin TJ, Davis Z, Gardiner A, Oscier DG, Stevenson FK. Unmutated Ig V(H) genes are associated with a more aggressive form of chronic lymphocytic leukemia. Blood. 1999;94(6):1848-1854.
4. Chen L, Widhopf G, Huynh L, et al. Expression of ZAP-70 is associated with increased B-cell receptor signaling in chronic lymphocytic leukemia. Blood. 2002;100(13):4609-4614.
5. Wickremasinghe RG, Prentice AG, Steele AJ. Aberrantly activated anti-apoptotic signalling mechanisms in chronic lymphocytic leukaemia cells: Clues to the identification of novel therapeutic targets. Br J Haematol. 2011;153(5):545-556.
6. Liao W, Jordaan G, Coriaty N, Sharma S. Amplification of B cell receptor-Erk signaling by Rasgrf-1 overexpression in chronic lymphocytic leukemia [published online ahead of print April 2, 2014]. Leuk Lymphoma. doi: 10.3109/10428194.2014898759.
7. Burger JA. Inhibiting B-cell receptor signaling pathways in chronic lymphocytic leukemia. Curr Hematol Malig Rep. 2012;7(1):26-33.
8. Buchner M, Fuchs S, Prinz G, et al. Spleen tyrosine kinase is overexpressed and represents a potential therapeutic target in chronic lymphocytic leukemia. Cancer Res. 2009;69(13):5424-5432.
9. Spurgeon SE, Coffey G, Fletcher LB, et al. The selective SYK inhibitor P505-15 (PRT062607) inhibits B cell signaling and function in vitro and in vivo and augments the activity of fludarabine in chronic lymphocytic leukemia. J Pharmacol Exp Ther. 2013;344(2):378-387.
10. Veldurthy A, Patz M, Hagist S, et al. The kinase inhibitor dasatinib induces apoptosis in chronic lymphocytic leukemia cells in vitro with preference for a subgroup of patients with unmutated IgVH genes. Blood. 2008;112(4):1443-1452.
11. Byrd JC, Furman RR, Coutre SE, et al. Targeting BTK with ibrutinib in relapsed chronic lymphocytic leukemia [published correction appears in N Engl J Med. 2014;370(8):786]. N Engl J Med. 2013;369(1):32-42.
12. Cheng S, Ma J, Guo A, et al. BTK inhibition targets in vivo CLL proliferation through its effects on B-cell receptor signaling activity. Leukemia. 2014;28(3):649-657.
13. Lannutti BJ, Meadows SA, Herman SE, et al. CAL-101, a p110delta selective phosphatidylinositol-3-kinase inhibitor for the treatment of B-cell malignancies, inhibits PI3K signaling and cellular viability. Blood. 2011;117(2):591-594.
14. Chantry D, Vojtek A, Kashishian A, et al. p110delta, a novel phosphatidylinositol 3-kinase catalytic subunit that associates with p85 and is expressed predominantly in leukocytes. J Biol Chem. 1997;272(31):19236-19241.
15. Hoellenriegel J, Meadows SA, Sivina M, et al. The phosphoinositide 3’-kinase delta inhibitor, CAL-101, inhibits B-cell receptor signaling and chemokine networks in chronic lymphocytic leukemia. Blood. 2011;118(13):3603-3612.
16. Burger JA, Ghia P, Rosenwald A, Caligaris-Cappio F. The microenvironment in mature B-cell malignancies: A target for new treatment strategies. Blood. 2009;114(16):3367-3375.
17. ten Hacken E, Burger JA. Molecular pathways: targeting the microenvironment in chronic lymphocytic leukemia—focus on the B-cell receptor. Clin Cancer Res. 2014;20(3):548-556.
18. Gandhirajan RK, Poll-Wolbeck SJ, Gehrke I, Kreuzer KA. Wnt/b-catenin/LEF-1 signaling in chronic lymphocytic leukemia (CLL): a target for current and potential therapeutic options. Curr Cancer Drug Targets. 2010;10(7):716-727.
19. Gutierrez A, Jr, Tschumper RC, Wu X, et al. LEF-1 is a prosurvival factor in chronic lymphocytic leukemia and is expressed in the preleukemic state of monoclonal B-cell lymphocytosis. Blood. 2010;116(16):2975-2983.
20. Jordaan G, Liao W, Sharma S. E-cadherin gene re-expression in chronic lymphocytic leukemia cells by HDAC inhibitors. BMC Cancer. 2013;13:88.
21. Puente XS, Pinyol M, Quesada V, et al. Whole-genome sequencing identifies recurrent mutations in chronic lymphocytic leukaemia. Nature. 2011;475(7354):101-105.
22. Fabbri G, Rasi S, Rossi D, et al. Analysis of the chronic lymphocytic leukemia coding genome: role of NOTCH1 mutational activation. J Exp Med. 2011;208(7):1389-1401.
23. Rosati E, Sabatini R, Rampino G, et al. Constitutively activated Notch signaling is involved in survival and apoptosis resistance of B-CLL cells. Blood. 2009;113(4):856-865.
24. López-Guerra M, Xargay-Torrent S, Rosich L, et al. The g-secretase inhibitor PF-03084014 combined with fludarabine antagonizes migration, invasion and angiogenesis in NOTCH1-mutated CLL cells [published online ahead of print April 30, 2014]. Leukemia. doi: 10.1038/leu.2014.143.
25. Advani RH, Buggy JJ, Sharman JP, et al. Bruton tyrosine kinase inhibitor ibrutinib (PCI-32765) has significant activity in patients with relapsed/refractory B-cell malignancies. J Clin Oncol. 2013;31(1):88-94.
26. O’Brien S, Furman RR, Coutre SE, et al. Ibrutinib as initial therapy for elderly patients with chronic lymphocytic leukaemia or small lymphocytic lymphoma: An open-label, multicentre, phase 1b/2 trial. Lancet Oncol. 2014;15(1):48-58.
27. Brown JR, Byrd JC, Coutre SE, et al. Idelalisib, an inhibitor of phosphatidylinositol 3-kinase p110∂, for relapsed/refractory chronic lymphocytic leukemia. Blood. 2014;123(22):3390-3397.
28. Brown JR, Furman RR, Flinn I, et al. Final results of a phase I study of idelalisib (GS-1101) a selective inhibitor of PI3K∂, in patients with relapsed or refractory CLL. J Clin Oncol. 2013;31:Absract 7003.
29. Furman RR, Sharman JP, Coutre SE, et al. Idelalisib and rituximab in relapsed chronic lymphocytic leukemia. N Engl J Med. 2014;370(11):997-1007.
30. Woyach JA, Smucker K, Smith LL, et al. Prolonged lymphocytosis during ibrutinib therapy is associated with distinct molecular characteristics and does not indicate a suboptimal response to therapy. Blood. 2013;123(12):1810-1817.
Enzyme plays key role in MM, group finds

Credit: Darren Baker
Researchers have identified an enzyme that appears key to prognosis and progression in multiple myeloma (MM).
The group found the enzyme, ST3GAL6, is overexpressed in MM cell lines and patients with disease.
This overexpression increases glycosylation, which escalates the interaction between MM cells and selectins.
And this encourages the circulation and spread of MM cells, as well as their retention in the bone marrow.
The researchers recounted this series of events in Blood.
“[W]e focused on alterations in [glycosylation] because of its role in cell-cell interactions and the spread of cancer cells in the blood,” said study author Michael O’Dwyer, MD, of National University of Ireland, Galway.
Using gene set enrichment analysis, he and his colleagues confirmed the overexpression of glycosylation-related signatures in MM. They also discovered the sialyltransferase ST3GAL6 was “one of the most significantly increased genes” in MM patients, when compared to healthy donors.
The team observed increased ST3GAL6 levels in both relapsed and newly diagnosed MM. And they found that higher ST3GAL6 levels were associated with decreased survival.
To expand upon these findings, the researchers went on to test 5 MM cell lines—MM1S, MM1R, U266, RPMI-8226, and H929. They found significantly higher levels of ST3GAL6 mRNA and protein in the cell lines compared to healthy CD138+ cells.
Knocking down ST3GAL6 in 2 of the cell lines—MM1S and RPMI-8226—significantly reduced the amount of alpha 2,3 sialic acid at the cell surface, which suggests that ST3GAL6 contributes to the synthesis of this glycan.
In addition, knocking down ST3GAL6 significantly reduced MM cells’ adhesion to bone marrow stem cells, human umbilical vein endothelial cells, and fibronectin. It also reduced MM cells’ transendothelial migration, attenuated Src activation in MM cells, and reduced the cells’ ability to roll on p-selectin.
Likewise, in mouse models, knockdown of ST3GAL6 reduced MM cell homing and engraftment. It also significantly decreased tumor burden and increased survival in the mice.
The researchers concluded that these findings highlight the importance of altered glycosylation, particularly sialylation, in MM cell adhesion and migration.
“Our research is crucial because it sheds new light on the biology of [MM], which could lead to new strategies to overcome resistance to treatment,” Dr O’Dwyer said. “Our aim now is to prevent these interactions that cause the spread [of MM cells] using specific enzyme and selectin inhibitors.” ![]()
Blast Phase Chronic Myelogenous Leukemia
Chronic myelogenous leukemia (CML) is caused by the constitutively active BCR-ABL fusion protein that results from t(9;22), the Philadelphia (Ph+) chromosome. Chronic myelogenous leukemia typically evolves through 3 clinical phases: an indolent chronic phase, an accelerated phase, and a terminal blast phase analogous to acute myeloid leukemia (AML) or acute lymphoblastic leukemia (ALL). Fortunately, today more than 80% of patients are diagnosed in the chronic phase of the disease.1
Before the development of the tyrosine kinase inhibitor (TKI) imatinib, > 20% of the patients with chronic phase CML progressed to the blast phase every year.2 Based on data from 8 years of follow-up with imatinib therapy, the rate of progression to the advanced phases of CML is about 1% per year, with freedom from progression at 92%.3 For the majority of patients with chronic phase CML, due to advances in treatment, the disease does not affect mortality.
For those who progress to the terminal blast phase of CML, survival is typically measured in months unless allogeneic stem cell transplant (allo-SCT) is an option. This article will review one of the major remaining problems in CML: how to manage blast phase CML.
Definition and Diagnosis
Defining blast phase CML can be confusing, because different criteria have been proposed, none of which are biologically based. The most widely used definition is set forth by the European LeukemiaNet, recommending 30% blasts in the blood or bone marrow or the presence of extramedullary disease.1 Clinically, blast phase CML may present with constitutional symptoms, bone pain, or symptoms related to cytopenias (fatigue, dyspnea, bleeding, infections).
Diagnostic workup should include a complete blood cell count (CBC) with differential, bone marrow analysis with conventional cytogenetics, flow cytometry to determine whether the blast phase is of myeloid or lymphoid origin, and molecular mutational analysis of the BCR-ABL tyrosine kinase domain to help guide the choice of TKI. If age and performance status are favorable, a donor search for allo-SCT should be started promptly.
Chronic myelogenous leukemia cells that contain the BCR-ABL kinase protein are genetically unstable.4,5 Additional cytogenetic aberrations (ACAs) are seen in up to 80% of those with blast phase CML and are the most consistent predictor of blast transformation in those with chronic phase CML.6 Chromosomal changes are broken down into the nonrandom, “major route” ACAs (trisomy 8, additional Ph+ chromosome, isochromosome 17q, trisomy 19), considered likely to be involved in the evolution of CML, and the more random “minor route” ACAs, which may denote nothing more than the instability of the genome.5,7 Mutations of the BCR-ABL tyrosine kinase domain are also seen in the majority of those in blast phase CML and, depending on the specific mutation, can negatively predict the response to certain TKI therapies.4
Prognosis
The single most important prognostic indicator for patients with CML remains the length of response to initial BCR-ABL–specific TKI therapy. Only a very small minority of patients are refractory to TKIs from the beginning; these are the patients with the worst prognosis.8 If the response to treatment seems inadequate, then the health care professional should first verify with the patient that he or she is taking the medicine as prescribed.1 Lack of adherence continues to be the most common reason for less-than-ideal outcomes or fluctuations in response and plays a critical role in treatment with TKI therapy, with worse outcomes when < 90% of doses are taken.9
Other features associated with a poor prognosis include cytogenetic clonal evolution, > 50% blasts, and/or extramedullary disease.7,10,11 At the time of imatinib failure, detection of mutations of the BCR-ABL tyrosine kinase domain correlates to worse 4-year event-free survival.12 Showing the instability of the genome in CML, patients who harbor mutations of the BCR-ABL domain have a higher likelihood of relapse associated with further mutations and, therefore, potentially further TKI resistance.13 Once CML has progressed to the blast phase, life expectancy is, on average, less than a year.11
Treatment Strategy
Currently, the most effective treatment strategy in blast phase CML is to prevent the transformation from chronic phase from ever occurring. Management of blast phase CML depends on 2 factors: (1) previous therapies; and (2) type of blast phase—myeloid or lymphoid. The goal of treatment is to knock the disease back to a clinical remission and/or a chronic phase for a long enough period to get the patient to allo-SCT if age, performance status, and suitable donor allow for it.
Using single-agent imatinib for blast phase CML has been tried in patients who have never been on TKI therapy before. Hematologic responses were seen in the majority of patients, but any form of cytogenetic response was seen in fewer than 20% of patients. Median overall survival, although better than with previous conventional chemotherapies, was still measured in months.6 A patient with blast phase CML who has never been on BCR-ABL–specific TKIs is very rare now; at a minimum, the patient has usually tried at least 1 TKI previously.
If blast phase CML develops while a patient is taking imatinib, treatment with a second-generation TKIs—nilotinib or dasatinib— should be attempted if the BCR-ABL tyrosine kinase domain analysis shows no resistant mutations.14 Both nilotinib and dasatinib have been tried as single agents in patients with imatinib-refractory CML or who are unable to tolerate imatinib.15,16 Cytogenetic response rates were 2 to 4 times higher for these agents than for imatinib when used in blast phase CML.
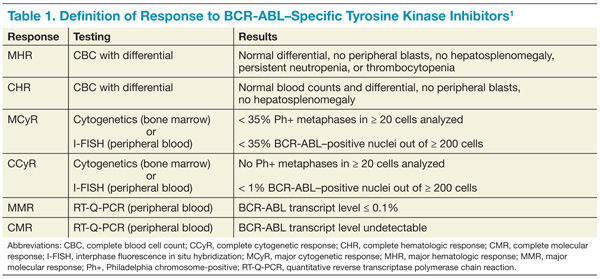
Table 1 reviews the common definitions of response, including cytogenetic response, to TKIs in CML. The pattern of response is usually very predictable: First, a hematologic response is seen, then a cytogenetic response, and finally, a hoped-for molecular response. Interestingly, in these studies, not all patients with blast phase CML who experienced a cytogenetic response had a hematologic response. This makes CBCs less reliable for assessing response and other peripheral blood tests, such as the interphase fluorescence in situ hybridization (I-FISH) test or the quantitative reverse transcriptase polymerase chain reaction (RT-Q-PCR) test, more important. Unfortunately, this improved cytogenetic response in blast phase CML did not translate to long-term survival advantage; median survival with these second- generation TKIs was still less than a year without transplant. If the T315I mutation is present, then clinical trials involving ponatinib or one of the newest non–FDA-approved TKIs should be considered.
Recent data involving ponatinib suggest similar response and survival rates to nilotinib and dasatinib, but this was in more heavily-pretreated CML patients who had resistance to, or unacceptable adverse effects from the second-generation TKIs or who had the BCR-ABL T315I mutation.17
In late 2013, ponatinib was voluntarily suspended from marketing and sales by its manufacturer due to a worrisome rate of serious arterial thromboembolic events reported in clinical trials and in postmarketing experience. However, the FDA reintroduced ponatinib in 2014 once additional safety measures were put in place, such as changes to the black box warning and review of the risk of arterial and venous thrombosis and occlusions.18
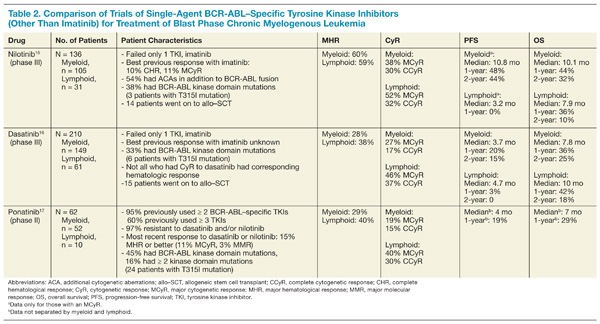
Table 2 compares the results between these newer TKIs in blast phase CML. If the patient can tolerate it, a combination of TKI with AML or ALL-type induction chemotherapy, preferably in a clinical trial setting, provides the best opportunity to return the patient to the chronic phase. If this is achieved, then allo-SCT represents the best chance for sustained remission or cure; allo-SCT was standard first-line therapy prior to the advent of BCR-ABL–specific TKIs. Tyrosine kinase inhibitor exposure prior to allo-SCT does not seem to affect transplantation outcomes.19 Allo-SCT while still in blast phase is discouraged because of its high risks with minimal benefit; disease-free survival rates are <10%.19 Although no scientific data support this, maintenance TKI posttransplantation seems logical, with monitoring of BCR-ABL transcript levels every 3 months.
Conclusion
With the advent of TKI therapy, the overall prognosis of CML has changed drastically. Unfortunately, the success seen with these novel agents in the chronic phase of CML has not translated into success in the blast phase of CML. Therefore, the best way to manage blast phase CML is to prevent this transformation from ever happening. The deeper and more rapid the cytogenetic and molecular response after TKI initiation, the better the long-term outcome for the patient.
If the patient progresses though TKI therapy, then combining a different TKI with a conventional induction chemotherapy regimen for acute leukemia should be tried; the goal is to achieve a remission that lasts long enough for the patient to be able to undergo allo-SCT. If the patient is not a candidate for allo-SCT, then the prognosis is extremely poor, and clinical trials with best supportive care should be considered.
Author disclosures
The authors report no actual or potential conflicts of interest with regard to this article.
Disclaimer
The opinions expressed herein are those of the authors and do not necessarily reflect those of Federal Practitioner, Frontline Medical Communications Inc., the U.S. Government, or any of its agencies. This article may discuss unlabeled or investigational use of certain drugs. Please review complete prescribing information for specific drugs or drug combinations—including indications, contraindications, warnings, and adverse effects—before administering pharmacologic therapy to patients.
1. Baccarani M, Pileri S, Steegmann JL, Muller M, Soverini S, Dreyling M; ESMO Guidelines Working Group. Chronic myeloid leukemia: ESMO Clinical Practice Guidelines for diagnosis, treatment and follow-up. Ann Oncol. 2012;23(7):vii72-vii77.
2. Sokal JE. Evaluation of survival data for chronic myelocytic leukemia. Am J Hematol. 1976;1(4):493-500.
3. Deininger M, O’Brien SG, Guilhot F, et al. International randomized study of interferon vs STI571 (IRIS) 8-year follow up: sustained survival and low risk for progression or events in patients with newly diagnosed chronic myeloid leukemia in chronic phase (CML-CP) treated with imatinib. Blood (ASH Annual Meeting Abstracts). 2009;114(22):abstract 1126.
4. Fabarius A, Leitner A, Hochhaus A, et al, Schweizerische Arbeitsgemeinschaft für Klinische Krebsforschung (SAKK) and the German CML Study Group. Impact of additional cytogenetic aberrations at diagnosis on prognosis of CML: long-term observation of 1151 patients from the randomized CML Study IV. Blood. 2011;118(26):6760-6768.
5. Johansson B, Fioretos T, Mitelman F. Cytogenetic and molecular genetic evolution of chronic myeloid leukemia. Acta Haematol. 2002;107(2):76-94.
6. Hehlmann R. How I treat CML blast crisis. Blood. 2012;120(4):737-747.
7. Jabbour EJ, Hughes TP, Cortes JE, Kantarjian HM, Hochhaus A. Potential mechanisms of disease progression and management of advanced-phase chronic myeloid leukemia [published online ahead of print November 12, 2013]. Leuk Lymphoma. doi:10.3109/10428194.2013.845883.
8. Jabbour E, Kantarjian H, O’Brien S, et al. The achievement of an early complete cytogenetic response is a major determinant for outcome in patients with early chronic phase chronic myeloid leukemia treated with tyrosine kinase inhibitors. Blood. 2011;118(17):4541-4546.
9. Marin D, Bazeos A, Mahon FX, et al. Adherence is the critical factor for achieving molecular responses in patients with chronic myeloid leukemia who achieve complete cytogenetic responses on imatinib. J Clin Oncol. 2010;28(14):2381-2388.
10. Cervantes F, Rozman M, Rosell J, Urbano-Ispizua A, Montserrat E, Rozman C. A study of prognostic factors in blast crisis of Philadelphia chromosome-positive chronic myelogenous leukemia. Br J Haematol. 1990;76(1):27-32.
11. Wadhwa J, Szydlo RM, Apperley JF, et al. Factors affecting duration of survival after onset of blastic transformation of chronic myeloid leukemia. Blood. 2002;99(7):2304-2309.
12. Quintas-Cardama A, Kantarjian H, O’Brien S, et al. Outcome of patients with chronic myeloid leukemia with multiple ABL1 kinase domain mutations receiving tyrosine kinase inhibitor therapy. Haematologica. 2011;96(6):918-921.
13. Soverini S, Gnani A, Colarossi S, et al. Philadelphia-positive patients who already harbor imatinib-resistant BCR-ABL kinase domain mutations have a higher likelihood of developing additional mutations associated with resistance to second- or third-line tyrosine kinase inhibitors. Blood. 2009;114(10):2168-2171.
14. Soverini S, Hochhaus A, Nicolini FE, et al. BCR-ABL kinase domain mutation analysis in chronic myeloid leukemia patients treated with tyrosine kinase inhibitors: recommendations from an expert panel on behalf of European LeukemiaNet. Blood. 2011;118(5):1208-1215.
15. Giles FJ, Kantarjian HM, le Coutre PD, et al. Nilotinib is effective in imatinib-resistant or -intolerant patients with chronic myeloid leukemia in blastic phase. Leukemia. 2012;26(5):959-962.
16. Saglio G, Hochhaus A, Goh YT, et al. Dasatinib in imatinib-resistant or imatinib-intolerant chronic myeloid leukemia in blast phase after 2 years of follow-up in a phase 3 study: efficacy and tolerability of 140 milligrams once daily and 70 milligrams twice daily. Cancer. 2010;116(16):3852-3861.
17. Cortes JE, Kim D-W, Pinilla-Ibarz J, et al; PACE Investigators. A phase 2 trial of ponatinib in Philadelphia chromosome-positive leukemias. N Engl J Med. 2013;369(19):1783-1796.
18. Food and Drug Administration. FDA Drug Safety Communication: FDA requires multiple new safety measures for leukemia drug Iclusig; company expected to resume marketing. U.S. Food and Drug Administration Website. http://www.fda.gov/drugs/drugsafety/ucm379554.htm. Updated December 20, 2013. Accessed June 13, 2014.
19. Khoury HJ, Kukreja M, Goldman JM, et al. Prognostic factors for outcomes in allogeneic transplantation for CML in the imatinib era: a CIBMTR analysis. Bone Marrow Transplant. 2012;47(6):810-816.
Chronic myelogenous leukemia (CML) is caused by the constitutively active BCR-ABL fusion protein that results from t(9;22), the Philadelphia (Ph+) chromosome. Chronic myelogenous leukemia typically evolves through 3 clinical phases: an indolent chronic phase, an accelerated phase, and a terminal blast phase analogous to acute myeloid leukemia (AML) or acute lymphoblastic leukemia (ALL). Fortunately, today more than 80% of patients are diagnosed in the chronic phase of the disease.1
Before the development of the tyrosine kinase inhibitor (TKI) imatinib, > 20% of the patients with chronic phase CML progressed to the blast phase every year.2 Based on data from 8 years of follow-up with imatinib therapy, the rate of progression to the advanced phases of CML is about 1% per year, with freedom from progression at 92%.3 For the majority of patients with chronic phase CML, due to advances in treatment, the disease does not affect mortality.
For those who progress to the terminal blast phase of CML, survival is typically measured in months unless allogeneic stem cell transplant (allo-SCT) is an option. This article will review one of the major remaining problems in CML: how to manage blast phase CML.
Definition and Diagnosis
Defining blast phase CML can be confusing, because different criteria have been proposed, none of which are biologically based. The most widely used definition is set forth by the European LeukemiaNet, recommending 30% blasts in the blood or bone marrow or the presence of extramedullary disease.1 Clinically, blast phase CML may present with constitutional symptoms, bone pain, or symptoms related to cytopenias (fatigue, dyspnea, bleeding, infections).
Diagnostic workup should include a complete blood cell count (CBC) with differential, bone marrow analysis with conventional cytogenetics, flow cytometry to determine whether the blast phase is of myeloid or lymphoid origin, and molecular mutational analysis of the BCR-ABL tyrosine kinase domain to help guide the choice of TKI. If age and performance status are favorable, a donor search for allo-SCT should be started promptly.
Chronic myelogenous leukemia cells that contain the BCR-ABL kinase protein are genetically unstable.4,5 Additional cytogenetic aberrations (ACAs) are seen in up to 80% of those with blast phase CML and are the most consistent predictor of blast transformation in those with chronic phase CML.6 Chromosomal changes are broken down into the nonrandom, “major route” ACAs (trisomy 8, additional Ph+ chromosome, isochromosome 17q, trisomy 19), considered likely to be involved in the evolution of CML, and the more random “minor route” ACAs, which may denote nothing more than the instability of the genome.5,7 Mutations of the BCR-ABL tyrosine kinase domain are also seen in the majority of those in blast phase CML and, depending on the specific mutation, can negatively predict the response to certain TKI therapies.4
Prognosis
The single most important prognostic indicator for patients with CML remains the length of response to initial BCR-ABL–specific TKI therapy. Only a very small minority of patients are refractory to TKIs from the beginning; these are the patients with the worst prognosis.8 If the response to treatment seems inadequate, then the health care professional should first verify with the patient that he or she is taking the medicine as prescribed.1 Lack of adherence continues to be the most common reason for less-than-ideal outcomes or fluctuations in response and plays a critical role in treatment with TKI therapy, with worse outcomes when < 90% of doses are taken.9
Other features associated with a poor prognosis include cytogenetic clonal evolution, > 50% blasts, and/or extramedullary disease.7,10,11 At the time of imatinib failure, detection of mutations of the BCR-ABL tyrosine kinase domain correlates to worse 4-year event-free survival.12 Showing the instability of the genome in CML, patients who harbor mutations of the BCR-ABL domain have a higher likelihood of relapse associated with further mutations and, therefore, potentially further TKI resistance.13 Once CML has progressed to the blast phase, life expectancy is, on average, less than a year.11
Treatment Strategy
Currently, the most effective treatment strategy in blast phase CML is to prevent the transformation from chronic phase from ever occurring. Management of blast phase CML depends on 2 factors: (1) previous therapies; and (2) type of blast phase—myeloid or lymphoid. The goal of treatment is to knock the disease back to a clinical remission and/or a chronic phase for a long enough period to get the patient to allo-SCT if age, performance status, and suitable donor allow for it.
Using single-agent imatinib for blast phase CML has been tried in patients who have never been on TKI therapy before. Hematologic responses were seen in the majority of patients, but any form of cytogenetic response was seen in fewer than 20% of patients. Median overall survival, although better than with previous conventional chemotherapies, was still measured in months.6 A patient with blast phase CML who has never been on BCR-ABL–specific TKIs is very rare now; at a minimum, the patient has usually tried at least 1 TKI previously.
If blast phase CML develops while a patient is taking imatinib, treatment with a second-generation TKIs—nilotinib or dasatinib— should be attempted if the BCR-ABL tyrosine kinase domain analysis shows no resistant mutations.14 Both nilotinib and dasatinib have been tried as single agents in patients with imatinib-refractory CML or who are unable to tolerate imatinib.15,16 Cytogenetic response rates were 2 to 4 times higher for these agents than for imatinib when used in blast phase CML.
Table 1 reviews the common definitions of response, including cytogenetic response, to TKIs in CML. The pattern of response is usually very predictable: First, a hematologic response is seen, then a cytogenetic response, and finally, a hoped-for molecular response. Interestingly, in these studies, not all patients with blast phase CML who experienced a cytogenetic response had a hematologic response. This makes CBCs less reliable for assessing response and other peripheral blood tests, such as the interphase fluorescence in situ hybridization (I-FISH) test or the quantitative reverse transcriptase polymerase chain reaction (RT-Q-PCR) test, more important. Unfortunately, this improved cytogenetic response in blast phase CML did not translate to long-term survival advantage; median survival with these second- generation TKIs was still less than a year without transplant. If the T315I mutation is present, then clinical trials involving ponatinib or one of the newest non–FDA-approved TKIs should be considered.
Recent data involving ponatinib suggest similar response and survival rates to nilotinib and dasatinib, but this was in more heavily-pretreated CML patients who had resistance to, or unacceptable adverse effects from the second-generation TKIs or who had the BCR-ABL T315I mutation.17
In late 2013, ponatinib was voluntarily suspended from marketing and sales by its manufacturer due to a worrisome rate of serious arterial thromboembolic events reported in clinical trials and in postmarketing experience. However, the FDA reintroduced ponatinib in 2014 once additional safety measures were put in place, such as changes to the black box warning and review of the risk of arterial and venous thrombosis and occlusions.18
Table 2 compares the results between these newer TKIs in blast phase CML. If the patient can tolerate it, a combination of TKI with AML or ALL-type induction chemotherapy, preferably in a clinical trial setting, provides the best opportunity to return the patient to the chronic phase. If this is achieved, then allo-SCT represents the best chance for sustained remission or cure; allo-SCT was standard first-line therapy prior to the advent of BCR-ABL–specific TKIs. Tyrosine kinase inhibitor exposure prior to allo-SCT does not seem to affect transplantation outcomes.19 Allo-SCT while still in blast phase is discouraged because of its high risks with minimal benefit; disease-free survival rates are <10%.19 Although no scientific data support this, maintenance TKI posttransplantation seems logical, with monitoring of BCR-ABL transcript levels every 3 months.
Conclusion
With the advent of TKI therapy, the overall prognosis of CML has changed drastically. Unfortunately, the success seen with these novel agents in the chronic phase of CML has not translated into success in the blast phase of CML. Therefore, the best way to manage blast phase CML is to prevent this transformation from ever happening. The deeper and more rapid the cytogenetic and molecular response after TKI initiation, the better the long-term outcome for the patient.
If the patient progresses though TKI therapy, then combining a different TKI with a conventional induction chemotherapy regimen for acute leukemia should be tried; the goal is to achieve a remission that lasts long enough for the patient to be able to undergo allo-SCT. If the patient is not a candidate for allo-SCT, then the prognosis is extremely poor, and clinical trials with best supportive care should be considered.
Author disclosures
The authors report no actual or potential conflicts of interest with regard to this article.
Disclaimer
The opinions expressed herein are those of the authors and do not necessarily reflect those of Federal Practitioner, Frontline Medical Communications Inc., the U.S. Government, or any of its agencies. This article may discuss unlabeled or investigational use of certain drugs. Please review complete prescribing information for specific drugs or drug combinations—including indications, contraindications, warnings, and adverse effects—before administering pharmacologic therapy to patients.
1. Baccarani M, Pileri S, Steegmann JL, Muller M, Soverini S, Dreyling M; ESMO Guidelines Working Group. Chronic myeloid leukemia: ESMO Clinical Practice Guidelines for diagnosis, treatment and follow-up. Ann Oncol. 2012;23(7):vii72-vii77.
2. Sokal JE. Evaluation of survival data for chronic myelocytic leukemia. Am J Hematol. 1976;1(4):493-500.
3. Deininger M, O’Brien SG, Guilhot F, et al. International randomized study of interferon vs STI571 (IRIS) 8-year follow up: sustained survival and low risk for progression or events in patients with newly diagnosed chronic myeloid leukemia in chronic phase (CML-CP) treated with imatinib. Blood (ASH Annual Meeting Abstracts). 2009;114(22):abstract 1126.
4. Fabarius A, Leitner A, Hochhaus A, et al, Schweizerische Arbeitsgemeinschaft für Klinische Krebsforschung (SAKK) and the German CML Study Group. Impact of additional cytogenetic aberrations at diagnosis on prognosis of CML: long-term observation of 1151 patients from the randomized CML Study IV. Blood. 2011;118(26):6760-6768.
5. Johansson B, Fioretos T, Mitelman F. Cytogenetic and molecular genetic evolution of chronic myeloid leukemia. Acta Haematol. 2002;107(2):76-94.
6. Hehlmann R. How I treat CML blast crisis. Blood. 2012;120(4):737-747.
7. Jabbour EJ, Hughes TP, Cortes JE, Kantarjian HM, Hochhaus A. Potential mechanisms of disease progression and management of advanced-phase chronic myeloid leukemia [published online ahead of print November 12, 2013]. Leuk Lymphoma. doi:10.3109/10428194.2013.845883.
8. Jabbour E, Kantarjian H, O’Brien S, et al. The achievement of an early complete cytogenetic response is a major determinant for outcome in patients with early chronic phase chronic myeloid leukemia treated with tyrosine kinase inhibitors. Blood. 2011;118(17):4541-4546.
9. Marin D, Bazeos A, Mahon FX, et al. Adherence is the critical factor for achieving molecular responses in patients with chronic myeloid leukemia who achieve complete cytogenetic responses on imatinib. J Clin Oncol. 2010;28(14):2381-2388.
10. Cervantes F, Rozman M, Rosell J, Urbano-Ispizua A, Montserrat E, Rozman C. A study of prognostic factors in blast crisis of Philadelphia chromosome-positive chronic myelogenous leukemia. Br J Haematol. 1990;76(1):27-32.
11. Wadhwa J, Szydlo RM, Apperley JF, et al. Factors affecting duration of survival after onset of blastic transformation of chronic myeloid leukemia. Blood. 2002;99(7):2304-2309.
12. Quintas-Cardama A, Kantarjian H, O’Brien S, et al. Outcome of patients with chronic myeloid leukemia with multiple ABL1 kinase domain mutations receiving tyrosine kinase inhibitor therapy. Haematologica. 2011;96(6):918-921.
13. Soverini S, Gnani A, Colarossi S, et al. Philadelphia-positive patients who already harbor imatinib-resistant BCR-ABL kinase domain mutations have a higher likelihood of developing additional mutations associated with resistance to second- or third-line tyrosine kinase inhibitors. Blood. 2009;114(10):2168-2171.
14. Soverini S, Hochhaus A, Nicolini FE, et al. BCR-ABL kinase domain mutation analysis in chronic myeloid leukemia patients treated with tyrosine kinase inhibitors: recommendations from an expert panel on behalf of European LeukemiaNet. Blood. 2011;118(5):1208-1215.
15. Giles FJ, Kantarjian HM, le Coutre PD, et al. Nilotinib is effective in imatinib-resistant or -intolerant patients with chronic myeloid leukemia in blastic phase. Leukemia. 2012;26(5):959-962.
16. Saglio G, Hochhaus A, Goh YT, et al. Dasatinib in imatinib-resistant or imatinib-intolerant chronic myeloid leukemia in blast phase after 2 years of follow-up in a phase 3 study: efficacy and tolerability of 140 milligrams once daily and 70 milligrams twice daily. Cancer. 2010;116(16):3852-3861.
17. Cortes JE, Kim D-W, Pinilla-Ibarz J, et al; PACE Investigators. A phase 2 trial of ponatinib in Philadelphia chromosome-positive leukemias. N Engl J Med. 2013;369(19):1783-1796.
18. Food and Drug Administration. FDA Drug Safety Communication: FDA requires multiple new safety measures for leukemia drug Iclusig; company expected to resume marketing. U.S. Food and Drug Administration Website. http://www.fda.gov/drugs/drugsafety/ucm379554.htm. Updated December 20, 2013. Accessed June 13, 2014.
19. Khoury HJ, Kukreja M, Goldman JM, et al. Prognostic factors for outcomes in allogeneic transplantation for CML in the imatinib era: a CIBMTR analysis. Bone Marrow Transplant. 2012;47(6):810-816.
Study reveals potential targets for MYC-dependent cancers

Credit: Juha Klefstrom
New research suggests the MYC protein drives cell growth by inhibiting a handful of genes involved in DNA packaging and cell death.
The study showed that MYC works through a microRNA to suppress the genes’ expression.
This marks the first time that a subset of MYC-controlled genes have been identified as critical players in the protein’s cancer-causing function, and it points to new therapeutic targets for MYC-dependent cancers.
“This is a different way of thinking about the roles of microRNA and chromatin packaging in cancer,” said Dean Felsher, MD, PhD, of the Stanford University School of Medicine in California.
“We were very surprised to learn that the overexpression of one microRNA can mimic the cancerous effect of MYC.”
Dr Felsher and his colleagues reported this discovery in Cancer Cell.
The team noted that MYC overexpression has been known to prompt an increase in the levels of a microRNA family called miR-17-92.
“People have known for several years that MYC regulates the expression of microRNAs,” Dr Felsher said. “But it wasn’t clear how this was related to MYC’s oncogenic function.”
To gain some insight, Dr Felsher and his colleagues analyzed MYC-dependent cancer cells in vitro and in vivo.
The cells in which miR-17-92 expression was locked in the “on” position kept dividing even when MYC expression was blocked. This suggested that MYC works through the microRNA family to exert its cancer-causing effects.
The researchers then looked for an overlap among genes affected by MYC overexpression and those affected by miR-17-92. There were about 401 genes whose expression was either increased or suppressed by both MYC and miR-17-92.
The team chose to focus on genes that were suppressed because these genes exhibited, on average, many more binding sites for the microRNAs. They further narrowed their panel down to 15 genes regulated by more than one miR-17-92 binding site.
Of these genes, 5 stood out. Four of them—Sin3b, Hbp1, Suv420h1, and Btg1—encode proteins known to regulate chromatin packaging.
These 4 proteins affect cell proliferation and senescence by regulating gene accessibility within the chromatin. They had never before been identified as MYC or miR-17-92 targets.
The fifth gene encodes the apoptotic protein Bim. Previous research suggested that Bim expression is affected by miR-17-92.
All 5 of the proteins are known to affect either cellular proliferation, entry into senescence, or apoptosis, in part by granting or prohibiting access to genes in tightly packaged stretches of DNA in the chromatin.
“MYC is still a general amplifier of gene transcription and expression,” Dr Felsher said. “But our study shows that the maintenance of the cancerous state relies on a more focused mechanism.”
Lastly, the researchers showed that suppressing the expression of the 5 target genes, effectively mimicking MYC overexpression, partially mitigates the effect of MYC deactivation.
Up to 30% of MYC-dependent cancer cells in culture continued to grow—compared to 11% of control cells—in the absence of MYC expression. And tumors in mice either failed to regress or recurred within a few weeks.
“One of the biggest unanswered questions in oncology is how oncogenes cause cancer, and whether you can replace an oncogene with another gene product,” Dr Felsher said.
“These experiments begin to reveal how MYC affects the self-renewal decisions of cells. They may also help us target those aspects of MYC overexpression that contribute to the cancer phenotype.” ![]()
Antibiotic recalled due to presence of particulates

Cubist Pharmaceuticals, Inc. is recalling 9 lots of the antibiotic Cubicin (daptomycin for injection), following complaints of foreign particulate matter in reconstituted vials.
Particulate matter in an intravenous drug poses a risk of thromboembolism and pulmonary embolism.
Other risks include phlebitis, the mechanical blocking of the capillaries or arterioles, the activation of platelets, the generation of microthrombi, and the formation of granulomas.
To date, there have been no adverse events associated with complaints of particulate matter from the 9 lots of Cubicin being recalled.
Cubicin is an intravenous product indicated for the treatment of skin infections and certain blood stream infections. The drug was distributed throughout the US, so the recall is nationwide.
The recall includes the following lots of Cubicin 500 mg (NDC 67919-011-01, UPC 3 67919-011-01 6):
Lot # Expiration date Ship dates
CDC203 DEC 2015 9/2/13 through 9/24/13
CDC207 JAN 2016 9/16/13 through 10/15/13
CDC213 FEB 2016 10/1/13 through 10/7/13
CDC217 MAR 2016 12/2/13 through 12/11/13
CDC226 APR 2016 7/29/13 through 8/26/13
CDC234 MAY 2016 8/26/13 through 9/19/13
CDC235 MAY 2016 9/19/13 through 10/17/13
CDC243 JUL 2016 10/17/13 through 11/12/13
CDC246 JUL 2016 11/12/13 through 12/2/13
Cubist Pharmaceuticals is notifying customers of this recall by letter and phone. Customers with product from the recalled lots should quarantine the product and discontinue distribution.
To arrange for the return and replacement of product, call Cubist at (855) 534-8309 between the hours of 9 am and 7 pm EDT, Monday through Friday.
Healthcare professionals and pharmacists with medical questions regarding this recall can contact Cubist Medical Information at (877) 282-4786 between the hours of 8 am and 5:30 pm EDT, Monday through Friday.
Adverse events or quality problems associated with the use of this product can be reported to the Food and Drug Administration’s MedWatch Adverse Events Program. ![]()
Method reveals unexpected hematopoiesis discovery

in the bone marrow
A new epigenetic profiling technique has allowed researchers to chart histone dynamics during hematopoiesis, and it has produced some surprising results.
The researchers developed a high-sensitivity, indexing-first chromatin immunoprecipitation approach (iChIP) that requires as few as 500 cells for accurate analysis.
The techniques currently in use require millions of cells for accurate detection and analysis, but iCHIP overcomes this limitation.
David Lara-Astiaso, of the Weizmann Institute of Science in Rehovot, Israel, and his colleagues described the new method in Science.
The team used iCHIP to profile the dynamics of 4 chromatin modifications across 16 stages of hematopoietic differentiation.
“Using this powerful approach, we were able to identify the exact DNA regulatory sequences, as well as the various regulatory proteins, that are involved in controlling stem cell fate, casting light on previously unseen parts of the basic program of life,” said Nir Friedman, PhD, of the Hebrew University of Jerusalem in Israel.
The research also suggested that as many as 50% of these regulatory sequences are established and opened during intermediate stages of cell development. This means epigenetics are active at stages in which we thought cell destiny was already set.
“This changes our whole understanding of the process of blood stem cell fate decisions,” Lara-Astiaso said.
“[The discovery suggests] the process is more dynamic and flexible than previously thought, giving the cell slightly more leeway at the later stages in deciding what type of cell to turn into, in case its circumstances change.”
Although this research was conducted on mouse HSCs, the researchers believe the mechanism may hold true for other types of cells as well.
“This research creates a lot of excitement in the field, as it sets the groundwork to study these regulatory elements in humans,” said Assaf Weiner, of the Hebrew University of Jerusalem.
Discovering the exact regulatory DNA sequence controlling the fate of hematopoietic stem cells, as well as understanding the mechanism, holds promise for the development of diagnostic tools and therapeutic interventions, the researchers noted. ![]()
Catheter-directed thrombolysis for leg DVTs held risky
Catheter-directed thrombolysis plus anticoagulation is no more effective than anticoagulation alone in preventing in-hospital death among adults who have lower-extremity proximal deep vein thrombosis, according to a nationwide observational study reported online July 21 in JAMA Internal Medicine.
However, catheter-directed thrombolysis carries higher risks, particularly serious bleeding risks such as intracranial hemorrhage, than does anticoagulation alone, and it costs nearly three times as much money. These findings highlight the need for randomized trials "to evaluate the magnitude of the effect of catheter-directed thrombolysis on ... mortality, postthrombotic syndrome, and recurrence of DVT [deep vein thrombosis]. In the absence of such data, it may be reasonable to restrict this form of therapy to those patients who have a low bleeding risk and a high risk for postthrombotic syndrome, such as patients with iliofemoral DVT," said Dr. Riyaz Bashir of the division of cardiovascular diseases, Temple University, Philadelphia, and his associates.
Conflicting data from several small studies as to the safety and effectiveness of catheter-directed thrombolysis have led professional societies to devise conflicting recommendations for its use: CHEST (the American College of Chest Physicians) advises against using the procedure, while the American Heart Association recommends it as a first-line therapy for certain patients. "We sought to assess real-world comparative-safety outcomes in patients with proximal and caval DVT who underwent catheter-directed thrombolysis plus anticoagulation with a group treated with anticoagulation alone using risk-adjusted propensity-score matching," the investigators said.
They analyzed data from an Agency for Healthcare Research and Quality administrative database of patient discharges from approximately 1,000 nonfederal acute-care hospitals per year for a 6-year period. They identified 90,618 patients with a discharge diagnosis of proximal DVT; propensity-score matching yielded 3,594 well-matched patients in each study group. In-hospital mortality was not significantly different between patients who had catheter-directed thrombolysis plus anticoagulation (1.2%) and those who had anticoagulation alone (0.9%), Dr. Bashir and his associates said (JAMA Intern. Med. 2014 July 21 [doi:10.1001/jamainternmed.2014.3415]).
However, rates of blood transfusion (11.1% vs. 6.5%), pulmonary embolism (17.9% vs 11.4%), and intracranial hemorrhage (0.9% vs 0.3%) were significantly higher with the invasive intervention. And patients in the catheter-directed thrombolysis group required significantly longer hospitalizations (7.2 vs. 5.0 days) and incurred significantly higher hospital expenses ($85,094 vs. $28,164). "It is imperative that the magnitude of benefit from catheter-directed therapy be substantial to justify the increased initial resource utilization and bleeding risks of this therapy," the investigators noted.
Dr. Steven Q. Simpson, FCCP, comments: This observational, real-world study provides more practical information, I believe, than we would obtain with a controlled trial for two drugs/techniques that are already FDA–approved for this purpose. We are able to infer how the drug/technique affects short-term mortality outcomes and financial costs beyond the strict selection criteria and adherence to a tight protocol that a trial requires. However, the study leaves us with the question of how catheter-directed thrombolysis compares with anticoagulation in the more immediately life-threatening setting of massive pulmonary embolism. Additionally, proponents of catheter-directed thrombolysis suggest that it reduces the pain and suffering of postphlebitic syndrome, an outcome not addressed by this study.
Dr. Steven Q. Simpson, FCCP, comments: This observational, real-world study provides more practical information, I believe, than we would obtain with a controlled trial for two drugs/techniques that are already FDA–approved for this purpose. We are able to infer how the drug/technique affects short-term mortality outcomes and financial costs beyond the strict selection criteria and adherence to a tight protocol that a trial requires. However, the study leaves us with the question of how catheter-directed thrombolysis compares with anticoagulation in the more immediately life-threatening setting of massive pulmonary embolism. Additionally, proponents of catheter-directed thrombolysis suggest that it reduces the pain and suffering of postphlebitic syndrome, an outcome not addressed by this study.
Dr. Steven Q. Simpson, FCCP, comments: This observational, real-world study provides more practical information, I believe, than we would obtain with a controlled trial for two drugs/techniques that are already FDA–approved for this purpose. We are able to infer how the drug/technique affects short-term mortality outcomes and financial costs beyond the strict selection criteria and adherence to a tight protocol that a trial requires. However, the study leaves us with the question of how catheter-directed thrombolysis compares with anticoagulation in the more immediately life-threatening setting of massive pulmonary embolism. Additionally, proponents of catheter-directed thrombolysis suggest that it reduces the pain and suffering of postphlebitic syndrome, an outcome not addressed by this study.
Catheter-directed thrombolysis plus anticoagulation is no more effective than anticoagulation alone in preventing in-hospital death among adults who have lower-extremity proximal deep vein thrombosis, according to a nationwide observational study reported online July 21 in JAMA Internal Medicine.
However, catheter-directed thrombolysis carries higher risks, particularly serious bleeding risks such as intracranial hemorrhage, than does anticoagulation alone, and it costs nearly three times as much money. These findings highlight the need for randomized trials "to evaluate the magnitude of the effect of catheter-directed thrombolysis on ... mortality, postthrombotic syndrome, and recurrence of DVT [deep vein thrombosis]. In the absence of such data, it may be reasonable to restrict this form of therapy to those patients who have a low bleeding risk and a high risk for postthrombotic syndrome, such as patients with iliofemoral DVT," said Dr. Riyaz Bashir of the division of cardiovascular diseases, Temple University, Philadelphia, and his associates.
Conflicting data from several small studies as to the safety and effectiveness of catheter-directed thrombolysis have led professional societies to devise conflicting recommendations for its use: CHEST (the American College of Chest Physicians) advises against using the procedure, while the American Heart Association recommends it as a first-line therapy for certain patients. "We sought to assess real-world comparative-safety outcomes in patients with proximal and caval DVT who underwent catheter-directed thrombolysis plus anticoagulation with a group treated with anticoagulation alone using risk-adjusted propensity-score matching," the investigators said.
They analyzed data from an Agency for Healthcare Research and Quality administrative database of patient discharges from approximately 1,000 nonfederal acute-care hospitals per year for a 6-year period. They identified 90,618 patients with a discharge diagnosis of proximal DVT; propensity-score matching yielded 3,594 well-matched patients in each study group. In-hospital mortality was not significantly different between patients who had catheter-directed thrombolysis plus anticoagulation (1.2%) and those who had anticoagulation alone (0.9%), Dr. Bashir and his associates said (JAMA Intern. Med. 2014 July 21 [doi:10.1001/jamainternmed.2014.3415]).
However, rates of blood transfusion (11.1% vs. 6.5%), pulmonary embolism (17.9% vs 11.4%), and intracranial hemorrhage (0.9% vs 0.3%) were significantly higher with the invasive intervention. And patients in the catheter-directed thrombolysis group required significantly longer hospitalizations (7.2 vs. 5.0 days) and incurred significantly higher hospital expenses ($85,094 vs. $28,164). "It is imperative that the magnitude of benefit from catheter-directed therapy be substantial to justify the increased initial resource utilization and bleeding risks of this therapy," the investigators noted.
Key clinical point: Catheter-directed thrombolysis carries higher risks and may not improve outcomes for proximal DVT patients.
Major finding: In-hospital mortality was not significantly different between patients who had catheter-directed thrombolysis plus anticoagulation (1.2%) and those who had anticoagulation alone (0.9%), but rates of blood transfusion (11.1% vs 6.5%), pulmonary embolism (17.9% vs 11.4%), and intracranial hemorrhage (0.9% vs 0.3%) were significantly higher with the invasive intervention.
Data source: A propensity-matched analysis comparing the effectiveness and safety profiles between catheter-directed thrombolysis plus anticoagulation and anticoagulation alone in 3,594 adults across the country hospitalized with lower-extremity proximal DVT during a 6-year period.
Disclosures: This study was supported by Temple University Hospital, Philadelphia. Dr. Bashir reported no financial conflicts of interest; his associates reported ties to Covidien, Health Systems Networks, and Insight Telehealth.
Psychiatry can help reduce prison violence
The news has been filled lately with stories of violence within correctional facilities, often involving prisoners or detainees who are alleged to have mental illness. The California prison system recently announced an initiative to reduce the use of force against mentally ill prisoners and to require correctional officers to consider an inmate’s mental health status prior to any use of force.
This is an excellent initiative, and close collaboration between security and mental health services is crucial for effective treatment of some mentally ill offenders.

However, this would be a good time to remember that not all seriously mentally ill prisoners are disruptive and that violence is a behavior rather than a diagnostic criterion. The nonsymptomatic causes of violence are important to consider as well: Is the inmate defending himself from attack by more aggressive peers? Is he taking a stand and making a display of force in order to make the point that he won’t be intimidated? Is he delirious from an unrecognized or treated medical condition? Is he having a seizure, suffering from withdrawal, or medically compromised in some other way? Or is the violence instrumental, a means to an end by a sociopathic inmate who needs to enforce his chain of command or protect his prison drug distribution channels? While for some, violence may be an outward sign of psychosis, for others it’s part of the cost of doing business.
In addition to looking at violence on an individual level, we also need to consider it from an institutional perspective. Violence may be a sign that there are serious problems not only on an individual level but possibly on an institutional one as well. Increased sensitivity to the mental status of the prisoner is only one piece of the puzzle.
Correctional officers are exposed to an environment unlike anything most civilians can imagine. They are exposed daily to threats, actual or implied assault, harassment, and sometimes even flying bodily fluids. When the prison budget doesn’t keep up with the daily institutional census, they may be required to work repeated overtime shifts or to work on tiers in which they are greatly outnumbered by the prisoners they are supposed to supervise and protect. Even when a correctional officer is not directly the subject of violence, the officer is required to respond to traumatic events like inmate-on-inmate assaults or completed suicides.
It’s not surprising, then, that many new officers leave the profession within the first 5 years, and that those who stay longer may be prone to stress-related absenteeism, substance abuse, and depression. Officers (or "guards" as the traditional media repeatedly misidentifies them) who show a change in personality or an unusually low tolerance for inmate misbehavior may be showing early signs of posttraumatic stress disorder or clinical depression. If this is being taken out on an inmate, it may also be a problem at home, leading to relationship problems or domestic violence. Officers who are cruel to a prisoner may not be particularly pleasant to civilian staff, either.
Changing a violent prison environment requires more than additional staff training and another redundant prison directive about the use of force. It requires change in a prison culture that values toughness and bravado. Access to mental health should be rapid and confidential, and not seen as an indication that an officer wants an "easy way out" through medical retirement. Security and psychiatry must work together for the care of the prisoner, but they also need to work on behalf of one another.
Dr. Hanson is a forensic psychiatrist and coauthor of "Shrink Rap: Three Psychiatrists Explain Their Work" (Baltimore: The Johns Hopkins University Press, 2011). The opinions expressed are those of the author only, and do not represent those of any of Dr. Hanson’s employers or consultees, including the Maryland Department of Health & Mental Hygiene or the Maryland State Division of Correction.
The news has been filled lately with stories of violence within correctional facilities, often involving prisoners or detainees who are alleged to have mental illness. The California prison system recently announced an initiative to reduce the use of force against mentally ill prisoners and to require correctional officers to consider an inmate’s mental health status prior to any use of force.
This is an excellent initiative, and close collaboration between security and mental health services is crucial for effective treatment of some mentally ill offenders.
However, this would be a good time to remember that not all seriously mentally ill prisoners are disruptive and that violence is a behavior rather than a diagnostic criterion. The nonsymptomatic causes of violence are important to consider as well: Is the inmate defending himself from attack by more aggressive peers? Is he taking a stand and making a display of force in order to make the point that he won’t be intimidated? Is he delirious from an unrecognized or treated medical condition? Is he having a seizure, suffering from withdrawal, or medically compromised in some other way? Or is the violence instrumental, a means to an end by a sociopathic inmate who needs to enforce his chain of command or protect his prison drug distribution channels? While for some, violence may be an outward sign of psychosis, for others it’s part of the cost of doing business.
In addition to looking at violence on an individual level, we also need to consider it from an institutional perspective. Violence may be a sign that there are serious problems not only on an individual level but possibly on an institutional one as well. Increased sensitivity to the mental status of the prisoner is only one piece of the puzzle.
Correctional officers are exposed to an environment unlike anything most civilians can imagine. They are exposed daily to threats, actual or implied assault, harassment, and sometimes even flying bodily fluids. When the prison budget doesn’t keep up with the daily institutional census, they may be required to work repeated overtime shifts or to work on tiers in which they are greatly outnumbered by the prisoners they are supposed to supervise and protect. Even when a correctional officer is not directly the subject of violence, the officer is required to respond to traumatic events like inmate-on-inmate assaults or completed suicides.
It’s not surprising, then, that many new officers leave the profession within the first 5 years, and that those who stay longer may be prone to stress-related absenteeism, substance abuse, and depression. Officers (or "guards" as the traditional media repeatedly misidentifies them) who show a change in personality or an unusually low tolerance for inmate misbehavior may be showing early signs of posttraumatic stress disorder or clinical depression. If this is being taken out on an inmate, it may also be a problem at home, leading to relationship problems or domestic violence. Officers who are cruel to a prisoner may not be particularly pleasant to civilian staff, either.
Changing a violent prison environment requires more than additional staff training and another redundant prison directive about the use of force. It requires change in a prison culture that values toughness and bravado. Access to mental health should be rapid and confidential, and not seen as an indication that an officer wants an "easy way out" through medical retirement. Security and psychiatry must work together for the care of the prisoner, but they also need to work on behalf of one another.
Dr. Hanson is a forensic psychiatrist and coauthor of "Shrink Rap: Three Psychiatrists Explain Their Work" (Baltimore: The Johns Hopkins University Press, 2011). The opinions expressed are those of the author only, and do not represent those of any of Dr. Hanson’s employers or consultees, including the Maryland Department of Health & Mental Hygiene or the Maryland State Division of Correction.
