User login
Ibrutinib demonstrates efficacy in CLL after allo-HSCT

Photo courtesy of CDC
SAN DIEGO—Ibrutinib can produce favorable results in heavily pretreated patients with chronic lymphocytic leukemia (CLL) who have undergone allogeneic transplant, according to studies presented at the 2015 BMT Tandem Meetings.
One study showed that ibrutinib prompted an 88% overall response rate (ORR) in 16 patients with relapsed/refractory CLL.
Another analysis showed that ibrutinib can promote full donor chimerism and resolution of chronic graft-vs-host disease (GVHD).
David B. Miklos, MD, PhD, of the Stanford University Medical Center in California, presented the outcomes in 16 patients as abstract 75.
Christine E. Ryan, also of the Stanford University Medical Center, and her colleagues presented the other analysis, which included 5 patients, in a poster at the meeting (abstract 444*).
High response rate
The data Dr Miklos presented were collected from 4 clinical trials (phases 2 and 3) in relapsed/refractory CLL. The research was sponsored by Pharmacyclics, the company co-developing ibrutinib with Janssen Biotech, Inc.
All 16 patients analyzed had prior allogeneic
hematopoietic stem cell transplant (allo-HSCT). They had a median of 5 prior therapies, 12 (75%) had received 4 or more prior therapies, and 10 (63%) had del 17p.
Patients received ibrutinib as a single agent or in combination with ofatumumab. The study endpoints were investigator-assessed ORR, duration of response, progression-free survival (PFS), and overall survival (OS).
The ORR was 88%, with 2 complete responses, 9 partial responses, and 3 partial responses with lymphocytosis.
The median duration of response, PFS, and OS were not reached at a median follow-up of 23 months. The estimated PFS at 24 months was 77%, and the estimated OS at that time point was 75%.
The median time on ibrutinib was 18 months (range, 0.4 to 38.8 months), with 69% (n=11) of patients continuing on treatment.
Five (31%) patients discontinued ibrutinib—2 due to disease progression, 2 due to pneumonia, and 1 as a voluntary patient withdrawal. Both patients who developed pneumonia died.
Grade 3 or higher treatment-emergent severe adverse events occurred in 11 patients. Six patients had infections.
And there was 1 case each of febrile neutropenia, atrial flutter, colitis, perirenal hematoma, subdural hematoma, postprocedural hemorrhage, hypercalcemia, bone lesion, syncope, hematuria, urinary retention, and dyspnea (some patients had more than 1 event).
‘Promising’ donor immune modulation
Ryan and her colleagues presented data from 5 patients with relapsed/refractory CLL. They had relapsed 1 to 8.5 years after allo-HSCT.
Four patients had never achieved donor CD3 T-cell chimerism greater than 95%. And 1 patient had chronic GVHD when ibrutinib treatment began.
Patients received single-agent ibrutinib at 420 mg daily, starting 1 month to 2 years after relapse. Four patients remain on treatment, with courses ranging from 3 to 17 months.
The researchers reported that all patients showed sustained disease response and promising donor immune modulation. Four patients with abnormal lymph nodes prior to ibrutinib treatment experienced a “dramatic” reduction in lymph node size—a 68% reduction after 3 months.
Two patients achieved undetectable minimal residual disease (MRD) after 39 months and 8 months, respectively. One of these patients achieved full donor CD3 chimerism after 1 year of ibrutinib treatment and has maintained undetectable MRD for more than 10 months after stopping therapy.
And the patient with chronic GVHD achieved complete resolution of the condition after 6 months of ibrutinib treatment.
Three investigators involved in this research work for Sequenta, Inc., the company developing the ClonoSIGHT MRD test, which was used to detect MRD in this study. ![]()
*Information in the abstract differs from that presented at the meeting.
Evolutionary findings may aid cancer drug development

Photo by Darren Baker
By tracking the evolution of Abl and Src, investigators have made discoveries that may aid the design of highly specific cancer drugs.
Abl and Src are 2 nearly identical protein kinases with a predilection to cause cancer in humans, mainly chronic myeloid leukemia and colon cancer.
The proteins are separated by 146 amino acids and one big difference: Abl is susceptible to treatment with the tyrosine kinase inhibitor imatinib (Gleevec), but Src is not.
Dorothee Kern, PhD, of Brandeis University in Waltham, Massachusetts, and her colleagues traced the journey of these 2 proteins over 1 billion years of evolution, pinpointing the exact evolutionary shifts that caused imatinib to bind well with one protein and poorly with the other.
This new approach to researching enzymes and their binding sites may have a major impact on the development of cancer drugs, the investigators said.
They published their findings in Science.
To determine why imatinib binds with Abl but not Src, Dr Kern and her colleagues turned back the evolutionary clock 1 billion years.
This revealed Abl and Src’s common ancestor, a primitive protein in yeast the team dubbed “ANC-AS.” They mapped out the family tree, searching for changes in amino acids and molecular mechanisms.
“Src and Abl differ by 146 amino acids, and we were looking for the handful that dictate Gleevec specificity,” Dr Kern said. “It was like finding a needle in a haystack and could only be done by our evolutionary approach.”
As ANC-AS evolved in more complex organisms, it began to specialize and branch into proteins with different regulation, roles, and catalysis processes—creating Abl and Src.
By following this progression, while testing the proteins’ affinity to imatinib along the way, the investigators were able to whittle down the 146 different amino acids to 15 that are responsible for imatinib specificity.
These 15 amino acids play a role in Abl’s conformational equilibrium—a process in which the protein transitions between 2 structures. The main difference between Abl and Src, when it comes to binding with imatinib, is the relative times the proteins spend in each configuration, resulting in a major difference in their binding energies.
By understanding how and why imatinib works on Abl—and doesn’t work on Src—scientists have a jumping off point to design other drugs with a high affinity and specificity, and a strong binding on cancerous proteins.
“Understanding the molecular basis for Gleevec specificity has opened the door wider to designing good drugs,” Dr Kern said. “Our results pave the way for a different approach to rational drug design.” ![]()
Generic enoxaparin launched in US

Image by Kevin MacKenzie
Teva Pharmaceutical Industries Ltd. has launched the generic equivalent of the low-molecular-weight heparin Lovenox (enoxaparin sodium injection) in 7 dosage strengths in the US.
Enoxaparin can be used to prevent deep vein thrombosis (DVT) in patients undergoing abdominal surgery, those receiving a hip or knee replacement, and patients at risk of thromboembolic complications due to severely restricted mobility during acute illness.
When administered with warfarin, enoxaparin can be used for inpatient treatment of acute DVT, with or without pulmonary embolism (PE). Enoxaparin given in conjunction with warfarin may also be used for outpatient treatment of acute DVT without PE.
When given concurrently with aspirin, enoxaparin can be used to prevent ischemic complications of unstable angina and non-Q-wave myocardial infarction. Enoxaparin may also be used to treat acute ST-segment elevation myocardial infarction that is managed medically or with subsequent percutaneous coronary intervention.
Teva’s Enoxaparin Sodium Injection USP is available in the following doses:
- 30 mg/0.3 mL syringe, 10 x 0.3 mL
- 40 mg/0.4 mL syringe, 10 x 0.4 mL
- 60 mg/0.6 mL syringe, 10 x 0.6 mL
- 80 mg/0.8 mL syringe, 10 x 0.8 mL
- 100 mg/mL syringe, 10 x 1 mL
- 120 mg/0.8 mL syringe, 10 x 0.8 mL
- 150 mg/mL syringe, 10 x 1 mL.
Safety information
Enoxaparin’s label contains a boxed warning detailing the risk of epidural or spinal hematomas that can occur in patients who are anticoagulated with low-molecular-weight heparins or heparinoids and are receiving neuraxial anesthesia or undergoing spinal puncture. The hematomas may result in long-term or permanent paralysis.
Enoxaparin is contraindicated in patients with active major bleeding, thrombocytopenia with a positive in vitro test for antiplatelet antibody in the presence of enoxaparin, or known hypersensitivity to enoxaparin, heparin, or pork products.
Serious adverse reactions reported with enoxaparin include increased risk of hemorrhage and thrombocytopenia.
Enoxaparin should be used with extreme caution in patients who have conditions with an increased risk of hemorrhage or in patients treated concomitantly with platelet inhibitors. Major hemorrhages, including retroperitoneal and intracranial bleeding, have been reported with enoxaparin. Some of these cases have been fatal.
Bleeding can occur at any site during enoxaparin treatment. The drug should be used with care in patients with a bleeding diathesis, uncontrolled arterial hypertension, or a history of recent gastrointestinal ulceration, diabetic retinopathy, renal dysfunction, and hemorrhage.
In clinical trials, the most common adverse reactions associated with enoxaparin (occurring in more than 1% of patients) were bleeding, anemia, thrombocytopenia, elevation of serum aminotransferase, diarrhea, and nausea. Mild local irritation, pain, hematoma, ecchymosis, and erythema may follow subcutaneous injection.
For additional information on enoxaparin, see the full prescribing information. ![]()
Group produces malaria vaccine candidate from algae

Image from Bielefeld University
A vaccine candidate generated using algae may be able to prevent the transmission of malaria from infected hosts to mosquitoes, preclinical research suggests.
Researchers used Chlamydomonas reinhardtii microalgae to produce recombinant Pfs25 protein.
When paired with human-compatible adjuvants—glucopyranosal lipid A (GLA) plus squalene oil-in-water emulsion—the protein generated antibodies that nearly eliminated malaria infection in mosquitoes.
The researchers reported these results in Infection and Immunity.
“Most malaria vaccine approaches are aimed at preventing humans from becoming infected when bitten by mosquitoes that carry the parasite,” said study author Joseph Vinetz, MD, of the University of California, San Diego.
“Our approach is to prevent transmission of the malaria parasite from infected humans to mosquitoes. This approach is similar to that of the current measles vaccine, which is such a hot topic of discussion these days, because the goal is to generate herd immunity in a population. We think that this approach is key to global malaria elimination too.”
Dr Vinetz and his colleagues wanted to produce a large quantity of properly folded Pfs25, a protein found on the surface of the malaria parasite’s reproductive cells, which are only present within the mosquito’s gut after it feeds on a malaria-infected blood meal.
Since antibodies against Pfs25 can halt the parasite’s lifecycle in the mosquito, they might also block transmission of the parasite to the next host. However, properly folded Pfs25 that induces transmission-blocking antibodies has been difficult to produce in the lab.
To overcome this problem, the researchers turned to Chlamydomonas reinhardtii. They introduced the Pfs25 gene into the algae by shooting the DNA into the plant cell’s nucleus.
After they let the algae do the work of replicating, building, and folding the protein, the team was able to purify enough functional Pfs25 for testing.
They also tested different adjuvants, which help stimulate the immune system’s response to Pfs25. They tested alum alone, GLA plus alum, squalene oil-in-water emulsion, and GLA plus squalene oil-in-water emulsion.
The best Pfs25/adjuvant combination—GLA plus squalene oil-in-water emulsion—elicited a uniquely robust antibody response in mice with high affinity and avidity—antibodies that specifically and strongly reacted with the malaria parasite’s reproductive cells.
The researchers then fed mosquitoes malaria parasites in the presence of control serum or immune serum collected from mice vaccinated with algae-produced Pfs25 in the presence of the adjuvants.
Eight days later, the team examined the mosquitoes’ guts for the presence of the malaria parasite. And they found that 4.2% (1/24) of mosquitoes that consumed the Pfs25/adjuvant-treated mouse serum were positive for the malaria parasite, compared to 70% (28/40) of control mosquitoes.
“We are really excited to see that Pfs25 produced by algae can effectively prevent malaria parasites from developing within the mosquito,” said study author Stephen Mayfield, PhD, of the University of California, San Diego.
“With the low cost of algal production, this may be the only system that can make an economic malaria vaccine. Now, we’re looking forward to comparing algae-produced Pfs25 and adjuvant head-to-head against other approaches to malaria vaccine production and administration.” ![]()
VIDEO: Ask patients about metal-on-metal hip implants
MAUI, HAWAII – Rheumatologists and other providers need to ask patients if they’ve had metal-on-metal hip implants.
That goes for hip resurfacing – which by definition is metal on metal – as well as actual metal-on-metal hips. Signs of trouble can be as subtle as mental status changes, and they go well beyond the traditional issues with worn-out artificial joints.
During a video interview at the 2015 Rheumatology Winter Clinical Symposium, Dr. Bill Bugbee, an orthopedic surgeon and professor at the University of California, San Diego, explained the problems and the warning signs for which physicians should watch.
The video associated with this article is no longer available on this site. Please view all of our videos on the MDedge YouTube channel
AT RWCS 2015

Anatomy of VSD in outflow tract defects indicates a continuum and has surgical relevance
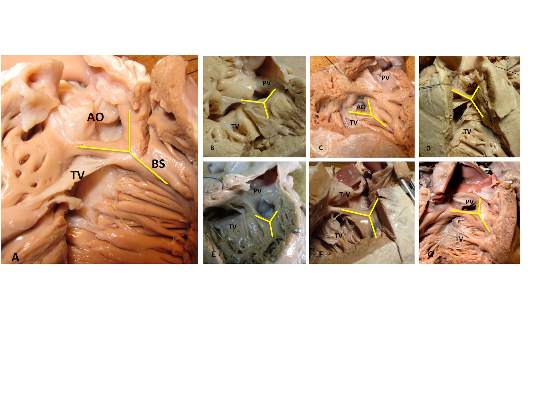
The outlet ventricular septal defect is a cornerstone of the outflow tract defects and exists on a continuum that is anatomically different from the isolated central perimembranous VSD, according to the results of an observational study of 277 preserved heart specimens with isolated outlet ventricular septal defect without subpulmonary stenosis.
“In all of the specimens studied, the VSD always opened in the outlet of the right ventricle, cradled between the two limbs of the septal band, irrespective of the presence or absence of a fibrous continuity between the aortic and tricuspid valves, and the presence of an outlet septum,” according to the report published in the March issue of the Journal of Thoracic and Cardiovascular Surgery by Dr. Meriem Mostefa-Kara of the Paris Descartes University and her colleagues.
The 277 specimens comprised 19 with isolated ventricular septal defect; 71 with tetralogy of Fallot (TOF); 51 with TOF with pulmonary atresia (PA); 54 with common arterial trunk (CAT); 65 with double-outlet right ventricle (DORV), with subaortic, doubly committed, or subpulmonary ventricular septal defect; and 17 with interrupted aortic arch (IAA) type B (doi:10.1016/j.jtcvs.2014.11.087).
Previous studies have shown that all malalignment defects include a VSD because of the malalignment and the absence of fusion between the outlet septum and the rest of the ventricular septum, and all authors agree that this VSD is cradled between the two limbs of the septal band, according to the researchers.
They found such an outlet VSD in all of the heart specimens studied, Dr. Mostefa-Kara and her colleagues added. In addition, they found that its anatomic variants were distributed differently according to the defect involved. This was especially true when focusing of the posteroinferior rim and particularly on the aortic-tricuspid fibrous continuity. In addition, this continuity occurred with different frequency among the various outflow tract defects studied.
They found the highest rate of continuity in isolated outlet VSD, then decreasing progressively from TOF to TOF-PA, then DORV, becoming “exceedingly rare” in CAT and absent in IAA type B.
The researchers also analyzed 26 hearts with isolated central perimembranous VSD from their anatomic collection and compared these with the outlet VSD hearts. All 26 of these VSDs were located behind the septal leaflet of the tricuspid valve, under the posteroinferior limb of the septal band, and NOT between the two limbs of the septal band as was the case with the outlet VSDs.
This led them to state that there was a “blatant anatomical difference between the these two types of VSDs,” and pointed out the risk of confusion. “The presence of a fibrous continuity at the posteroinferior rim of the VSD is important for the surgeon, because it makes the conduction axis vulnerable during surgery and therefore must be described specifically in the preoperative assessment of the defect,” they warned.
“This anatomic approach places the outlet VSD as a cornerstone of the outflow tract defects, anatomically different from the isolated central perimembranous VSD. This may help us to better understand the anatomy of the VSDs and to clarify their classification and terminology,” Dr. Mostefa-Kara and her colleagues concluded.
The study was sponsored by the French Society of Cardiology. The authors reported having no relevant disclosures.
The Paris researchers’ study is important for several reasons, according to the invited editorial commentary by Dr. Robert H. Anderson (doi:10.1016/j,jtcvs.2014.12.003). “First, it shows that careful examination of archives of autopsied hearts can still provide new information. Second, to provide all the information required to achieve safe and secure surgical closures of channels between the ventricles, they emphasize that knowledge is required how the defect opens toward the right ventricle and regarding the boundaries around which the surgeon will place a patch to restore septal integrity. The location of the defect relative to the right ventricle is geography. The details of the margins of the channel requiring closure represent its geometry. In earlier years, investigators tended to use either the geography or the geometry to provide their definitions, or else they accorded priority to one of these features. Both features are surgically important.” In addition, “as the Parisian investigators stress, it is not sufficient simply to state that a defect is perimembranous. We should now be distinguishing between perimembranous defects opening centrally, those that open to the outlet of the right ventricle between the limbs of the septal band, and those that can open to the right ventricular inlet. Another important feature of their research is the presence or absence of septal malalignment.”
Dr. Anderson is a professorial fellow at the Institute of Genetic Medicine, Newcastle University, Newcastle-upon-Tyne, England.
The outlet ventricular septal defect is a cornerstone of the outflow tract defects and exists on a continuum that is anatomically different from the isolated central perimembranous VSD, according to the results of an observational study of 277 preserved heart specimens with isolated outlet ventricular septal defect without subpulmonary stenosis.
“In all of the specimens studied, the VSD always opened in the outlet of the right ventricle, cradled between the two limbs of the septal band, irrespective of the presence or absence of a fibrous continuity between the aortic and tricuspid valves, and the presence of an outlet septum,” according to the report published in the March issue of the Journal of Thoracic and Cardiovascular Surgery by Dr. Meriem Mostefa-Kara of the Paris Descartes University and her colleagues.
The 277 specimens comprised 19 with isolated ventricular septal defect; 71 with tetralogy of Fallot (TOF); 51 with TOF with pulmonary atresia (PA); 54 with common arterial trunk (CAT); 65 with double-outlet right ventricle (DORV), with subaortic, doubly committed, or subpulmonary ventricular septal defect; and 17 with interrupted aortic arch (IAA) type B (doi:10.1016/j.jtcvs.2014.11.087).
Previous studies have shown that all malalignment defects include a VSD because of the malalignment and the absence of fusion between the outlet septum and the rest of the ventricular septum, and all authors agree that this VSD is cradled between the two limbs of the septal band, according to the researchers.
They found such an outlet VSD in all of the heart specimens studied, Dr. Mostefa-Kara and her colleagues added. In addition, they found that its anatomic variants were distributed differently according to the defect involved. This was especially true when focusing of the posteroinferior rim and particularly on the aortic-tricuspid fibrous continuity. In addition, this continuity occurred with different frequency among the various outflow tract defects studied.
They found the highest rate of continuity in isolated outlet VSD, then decreasing progressively from TOF to TOF-PA, then DORV, becoming “exceedingly rare” in CAT and absent in IAA type B.
The researchers also analyzed 26 hearts with isolated central perimembranous VSD from their anatomic collection and compared these with the outlet VSD hearts. All 26 of these VSDs were located behind the septal leaflet of the tricuspid valve, under the posteroinferior limb of the septal band, and NOT between the two limbs of the septal band as was the case with the outlet VSDs.
This led them to state that there was a “blatant anatomical difference between the these two types of VSDs,” and pointed out the risk of confusion. “The presence of a fibrous continuity at the posteroinferior rim of the VSD is important for the surgeon, because it makes the conduction axis vulnerable during surgery and therefore must be described specifically in the preoperative assessment of the defect,” they warned.
“This anatomic approach places the outlet VSD as a cornerstone of the outflow tract defects, anatomically different from the isolated central perimembranous VSD. This may help us to better understand the anatomy of the VSDs and to clarify their classification and terminology,” Dr. Mostefa-Kara and her colleagues concluded.
The study was sponsored by the French Society of Cardiology. The authors reported having no relevant disclosures.
FROM THE JOURNAL OF THORACIC AND CARDIOVASCULAR SURGERY
Key clinical point: The presence of a fibrous continuity at the postinferior rim of the VSD is important for the surgeon because it makes the conduction axis vulnerable during surgery and therefore must be described specifically in the preoperative assessment.
Major finding: The outlet VSD is a cornerstone of the outflow tract defects and exists on a continuum that is anatomically different from the isolated central perimembranous VSD.
Data source: The researchers examined 277 preserved heart specimens with isolated outlet ventricular septal defect.
Disclosures: The study was sponsored by the French Society of Cardiology. The authors reported having no relevant disclosures.

A Second Patient and a Double Diagnosis
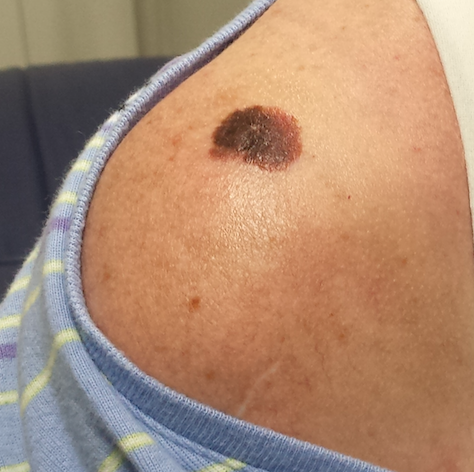
A 45-year-old woman brings her daughter for evaluation of the daughter’s acne. However, during the appointment, an odd lesion is noted on the mother’s shoulder.
Once the daughter’s evaluation is completed, attention turns to the mother’s lesion, which she reports “has been there for years.” Until last year, it hadn’t changed—but since then, it has grown considerably and also darkened.
The patient has an extensive history of poorly tolerated sun exposure in her childhood and young adulthood. She says she is able to tan but “it only holds for a short time.”
EXAMINATION
The lesion, a 2.8-cm black plaque with irregular margins, is located on the crown of the right shoulder. The patient has somewhat sun-damaged, freckled type II skin.
Dermatoscopic examination reveals regularly spaced white pinpoint areas scattered over the lesion’s surface. Focally, there is definite black streaking and pigment clumping on the borders of the lesion.
The white spots are consistent with pseudocysts seen in seborrheic keratosis. But the clumping and streaming of pigment are features we might expect to see with melanoma.
What is the diagnosis?
DISCUSSION
This case illustrates at least two useful principles:
1. The “patient” is not always the one listed on the charge sheet. I’ve found at least four melanomas and innumerable basal cell carcinomas on friends and relations who happen to be in the room with “the patient.” I can’t pretend I didn’t see the lesion, whoever it’s on. Of course, we must prioritize the patient of record—but then turn our attention to the “new” lesion/patient.
2. There is no law that says a seborrheic keratosis (SK) cannot occur in the same location as a melanoma. It may be rare, but it’s not unheard of. In this case, there were signs of both; the only way to sort it out, safely, was to excise the entire lesion and submit it to pathology. This provides the pathologist with adequate tissue to judge the whole lesion.
As it happens, this case entailed both diagnoses: the SK on the surface and a melanoma in situ on the underside. The latter was confined to the upper epidermis (ie, did not penetrate into the dermis). Re-excision with 5-mm margins was done, just to be on the safe side. Had the melanoma been left in place, it could have become invasive with time (though it might have taken years).
SKs are the most common benign lesions seen in dermatology practices—this patient had several others on her trunk—but can coincide with other lesions/diagnoses (eg, cancer). The oddity of the shoulder lesion’s appearance (a shape known as the black sheep sign), along with the patient’s fair, sun-damaged skin, prompted dermatoscopic examination.
With the power to visualize lesions under polarized light at 10x magnification, we have developed an entire body of knowledge about the features of benign vs malignant lesions—making the dermatoscope a common and valuable tool in dermatology practices across the world.
TAKE-HOME LEARNING POINTS
• Although a rare occurrence, seborrheic keratosis and melanoma (or another lesion) can co-exist in the same location.
• The odd appearance of the lesion, combined with the patient’s fair, sun-damaged skin, was enough to trigger a closer look.
• Dermatoscopic examination (10x magnification with polarized light) can identify features of benign and malignant lesions. In this case, both were found.
• Complete excision is the gold standard for biopsy of lesions suspicious for melanoma.

AUDIO: Chronically ill patients benefit from psychiatric care
As the director of the Visceral Inflammation and Pain Center at the University of Pittsburgh Medical Center, psychiatrist Eva Szigethy has been instrumental in the creation of a unique specialty medical home dedicated to the integrated treatment of inflammatory bowel disease.
Listen to Dr. Szigethy discuss how the inclusion of psychiatric care for patients with chronic illness can help drive down health care delivery costs while improving patient outcomes.
Dr. Szigethy had no relevant disclosures.
On Twitter @whitneymcknight
Walking in their shoes
When doctors become patients, the experience forces us to better our ability to practice the art of medicine because we gain more empathy and are able to relate to our patients’ feelings on a different level.

It’s one thing to read about the conditions we treat, and quite another when we are the ones lying flat on our backs looking up at the faces of complete strangers whom we are expected to trust for compassionate, competent, and sometimes life-altering care.
One of my first brushes with walking in my patients’ shoes was undergoing an MRI. Patients’ concerns that I had considered irrational and unfounded became understandable as I lay in the machine, unable to see anything but the inside of a tube or to move more than a few inches in any direction. All I could hear was the incessant, loud clicking of the machine as it took image after image. Alone with my thoughts, and the uncertainty of the test results, I could truly empathize with my patients’ anxieties about the procedure.
If you have never personally experienced a significant illness, I strongly recommend watching a movie called “The Doctor.” Early in my career, I remember watching this movie and it had a profound impact, the next best thing to getting sick myself, so to speak. The main character, played by William Hurt, is a brilliant, albeit insensitive doctor who is diagnosed with cancer and forced to deal in his most vulnerable state with the frustration of an inefficient medical system. Perhaps most intriguing, he is confronted head on with his own mortality and must seemingly place his trust in the hands of another brilliant and cold clinician. The result is a moving storyline; if you have never been seriously ill, this movie might just forever change your practice style.
Dr. Hester is a hospitalist at Baltimore-Washington Medical Center in Glen Burnie, Md. She is the creator of the Patient Whiz, a patient-engagement app for iOS. Reach her at [email protected].
When doctors become patients, the experience forces us to better our ability to practice the art of medicine because we gain more empathy and are able to relate to our patients’ feelings on a different level.
It’s one thing to read about the conditions we treat, and quite another when we are the ones lying flat on our backs looking up at the faces of complete strangers whom we are expected to trust for compassionate, competent, and sometimes life-altering care.
One of my first brushes with walking in my patients’ shoes was undergoing an MRI. Patients’ concerns that I had considered irrational and unfounded became understandable as I lay in the machine, unable to see anything but the inside of a tube or to move more than a few inches in any direction. All I could hear was the incessant, loud clicking of the machine as it took image after image. Alone with my thoughts, and the uncertainty of the test results, I could truly empathize with my patients’ anxieties about the procedure.
If you have never personally experienced a significant illness, I strongly recommend watching a movie called “The Doctor.” Early in my career, I remember watching this movie and it had a profound impact, the next best thing to getting sick myself, so to speak. The main character, played by William Hurt, is a brilliant, albeit insensitive doctor who is diagnosed with cancer and forced to deal in his most vulnerable state with the frustration of an inefficient medical system. Perhaps most intriguing, he is confronted head on with his own mortality and must seemingly place his trust in the hands of another brilliant and cold clinician. The result is a moving storyline; if you have never been seriously ill, this movie might just forever change your practice style.
Dr. Hester is a hospitalist at Baltimore-Washington Medical Center in Glen Burnie, Md. She is the creator of the Patient Whiz, a patient-engagement app for iOS. Reach her at [email protected].

Time to change our advice on alcohol
Alcohol is a drug, the abuse of which is the third leading cause of preventable death and disability in the United States. Most clinicians intuitively appreciate that 80% of drinkers consume only 20% of all the alcohol consumed in the United States. In other words, most problem drinkers consume most of the alcohol and most drinkers are not problem drinkers. Perhaps as a result, clinicians may recommend the consumption of alcohol in moderation for its putative health promoting effects (e.g., reduction in cardiovascular events and increases in HDL), hoping that patients can benefit without being put at risk.
I am personally guilty of such allowances among patients who already consume modestly. With all the potential negative consequences of alcohol use, it might not have taken much for me to change my clinical advice-giving.
Knott and colleagues conducted a population based study from the Health Survey for England encompassing the years 1998-2008 linked to national mortality data. The investigators observed that compared with never drinkers, protective effects of alcohol were limited to younger men (aged 50-64 years) and older women (≥ 65 years).
What this study adds to the literature is a cleaner comparison between alcohol consumers and never drinkers and adjustments for additional confounders. Many of the previous studies showing alcohol’s beneficial effects have included former drinkers in the nondrinker comparison group; however, former drinkers have a higher mortality risk than do never drinkers because they tend to be unhealthier than never drinkers. Compared to a healthier population of never drinkers, alcohol’s effects attenuate. The use of additional adjustment variables not used in previous studies also attenuated the effect of alcohol.
As patients age, their ability to metabolize and eliminate alcohol changes. Such alterations can lead to increased adverse health consequences and accidents. If the benefit of alcohol is not as great as we previously thought, maybe the time has come to change our advice on alcohol.
Dr. Ebbert is professor of medicine, a general internist at the Mayo Clinic in Rochester, Minn., and a diplomate of the American Board of Addiction Medicine. The opinions expressed are those of the author and do not necessarily represent the views and opinions of the Mayo Clinic. The opinions expressed in this article should not be used to diagnose or treat any medical condition nor should they be used as a substitute for medical advice from a qualified, board-certified practicing clinician.