User login
Rethinking the ABCs of EVAR
CHICAGO – Real-world experience with novel endografts like the Ovation Prime abdominal endograft system is prompting some vascular specialists to rethink such central abdominal aortic aneurysm tenets as aortic neck dilation and minimum neck size.
“We started using this in our worst cases, patients with small caliber access vessels and very short aortic necks, to test this device, but over time we’ve pretty much made this our workhorse graft based on our outcomes,” Dr. Syed Hussain of the University of Illinois at Champaign-Urbana, said at a vascular surgery symposium sponsored by Northwestern University.

Among 67 patients with AAAs treated since the team’s first implant in November 2012, the technical success rate is 100%. At baseline, 35% of patients had access vessels < 7 mm, 45% had short aortic neck (< 15 mm), 60% had moderate to severe calcification (> 25% circumferential), and half had moderate to severe thrombus (> 25% circumferential).
The Ovation Prime (TriVascular Technologies) device is relatively quick and easy to put in, with an average procedure time of only 33 minutes, he said. Access was percutaneous in 27%, average blood loss was minimal at 60 mL, and average hospital stay was 1.7 days.
Two patients with severe comorbidities were admitted to the ICU and two patients experienced intraoperative type 1a endoleaks, both successfully treated with a Palmaz stent.
After an average follow-up of 12 months, there have been no type 1, III or IV endoleaks, graft migration, aneurysm enlargement, conversions, ruptures, limb occlusions, or secondary procedures, said Dr. Hussain, who disclosed serving as a consultant for Trivascular and national principal investigator of the PostMarket Ovation Trial. There were 12 type II endoleaks (17%) and all have been clinically irrelevant.
Because of the Ovation’s novel O-ring sealing mechanism, “you get a pretty watertight seal ring on these patients,” he said. More importantly, shear stress is distributed evenly along the entire O-ring, which creates very minimal outward stress on the aorta, “maybe 2 or 3 atmospheres at best.”
Evidence continues to build that self-expandable stents place chronic outward stress on the aorta that causes degeneration of the aortic wall, resulting in eventual aortic neck dilation and endograft migration. While it’s been argued that disease progression leads to aortic dilation, the phenomenon took off after the arrival of endovascular stents, not during decades of open AAA repair, Dr. Hussain, also of the Vein & Vascular Center at the Christie Clinic in Champaign, said.
In the Ovation approval trial, proximal neck dilation at 2 years followed a similar curve in the Ovation and open repair cohorts, compared with those for the more traditional endografts, he noted.
The Ovation Prime system was approved in 2012 and in mid-2014, the Food and Drug Administration approved changes to the indication statement that eliminated the requirement for a minimal aortic neck length.
Essentially, the Ovation device can be placed in any patient if the diameter at 13 mm below the lowest renal artery (the site of the most proximal sealing ring) is within the treatable diameter range of the device (15.8 mm-30.4 mm), Dr. Hussain said.
“The idea of having a neck length is completely starting to go away,” he said. “And even though the trial by Endologix is looking at 1 centimeter as the current requirement for enrolling patients, I think eventually it’s going to get to the point where you’re not going to need a neck for the Nellix device either. You’re going to be able to treat patients who have very short, 1 to 2 millimeter necks, basically perirenal aneurysms, and get a seal on.”
The Nellix endovascular aneurysm sealing system (Endologix) is not commercially available in the U.S., but is the being evaluated in at least three studies. It consists of dual balloon-expandable end-frames surrounded by polymer-filled endobags and is designed to completely fill and seal the aortic aneurysm sac. Anatomical requirements for patients to be enrolled in clinical studies include a nonaneurysmal aortic neck length of ≥ 10 mm, nonaneurysmal aortic neck diameter of 18 mm-32 mm, maximum aortic blood flow lumen diameter of ≤ 60 mm, and common iliac artery diameter of 8 mm-35 mm, according to the company’s website.
CHICAGO – Real-world experience with novel endografts like the Ovation Prime abdominal endograft system is prompting some vascular specialists to rethink such central abdominal aortic aneurysm tenets as aortic neck dilation and minimum neck size.
“We started using this in our worst cases, patients with small caliber access vessels and very short aortic necks, to test this device, but over time we’ve pretty much made this our workhorse graft based on our outcomes,” Dr. Syed Hussain of the University of Illinois at Champaign-Urbana, said at a vascular surgery symposium sponsored by Northwestern University.
Among 67 patients with AAAs treated since the team’s first implant in November 2012, the technical success rate is 100%. At baseline, 35% of patients had access vessels < 7 mm, 45% had short aortic neck (< 15 mm), 60% had moderate to severe calcification (> 25% circumferential), and half had moderate to severe thrombus (> 25% circumferential).
The Ovation Prime (TriVascular Technologies) device is relatively quick and easy to put in, with an average procedure time of only 33 minutes, he said. Access was percutaneous in 27%, average blood loss was minimal at 60 mL, and average hospital stay was 1.7 days.
Two patients with severe comorbidities were admitted to the ICU and two patients experienced intraoperative type 1a endoleaks, both successfully treated with a Palmaz stent.
After an average follow-up of 12 months, there have been no type 1, III or IV endoleaks, graft migration, aneurysm enlargement, conversions, ruptures, limb occlusions, or secondary procedures, said Dr. Hussain, who disclosed serving as a consultant for Trivascular and national principal investigator of the PostMarket Ovation Trial. There were 12 type II endoleaks (17%) and all have been clinically irrelevant.
Because of the Ovation’s novel O-ring sealing mechanism, “you get a pretty watertight seal ring on these patients,” he said. More importantly, shear stress is distributed evenly along the entire O-ring, which creates very minimal outward stress on the aorta, “maybe 2 or 3 atmospheres at best.”
Evidence continues to build that self-expandable stents place chronic outward stress on the aorta that causes degeneration of the aortic wall, resulting in eventual aortic neck dilation and endograft migration. While it’s been argued that disease progression leads to aortic dilation, the phenomenon took off after the arrival of endovascular stents, not during decades of open AAA repair, Dr. Hussain, also of the Vein & Vascular Center at the Christie Clinic in Champaign, said.
In the Ovation approval trial, proximal neck dilation at 2 years followed a similar curve in the Ovation and open repair cohorts, compared with those for the more traditional endografts, he noted.
The Ovation Prime system was approved in 2012 and in mid-2014, the Food and Drug Administration approved changes to the indication statement that eliminated the requirement for a minimal aortic neck length.
Essentially, the Ovation device can be placed in any patient if the diameter at 13 mm below the lowest renal artery (the site of the most proximal sealing ring) is within the treatable diameter range of the device (15.8 mm-30.4 mm), Dr. Hussain said.
“The idea of having a neck length is completely starting to go away,” he said. “And even though the trial by Endologix is looking at 1 centimeter as the current requirement for enrolling patients, I think eventually it’s going to get to the point where you’re not going to need a neck for the Nellix device either. You’re going to be able to treat patients who have very short, 1 to 2 millimeter necks, basically perirenal aneurysms, and get a seal on.”
The Nellix endovascular aneurysm sealing system (Endologix) is not commercially available in the U.S., but is the being evaluated in at least three studies. It consists of dual balloon-expandable end-frames surrounded by polymer-filled endobags and is designed to completely fill and seal the aortic aneurysm sac. Anatomical requirements for patients to be enrolled in clinical studies include a nonaneurysmal aortic neck length of ≥ 10 mm, nonaneurysmal aortic neck diameter of 18 mm-32 mm, maximum aortic blood flow lumen diameter of ≤ 60 mm, and common iliac artery diameter of 8 mm-35 mm, according to the company’s website.
AT THE NORTHWESTERN VASCULAR SYMPOSIUM
Key clinical point: Requirement for an specified aortic neck for placement diminishing for new endografts.
Major finding: No type I, III or IV endoleaks, graft migration, aneurysm enlargement, conversions, ruptures, limb occlusions, or secondary procedures occurred after 12 months follow-up.
Data source: Retrospective analysis of 67 patients with AAA treated with Ovation Prime.
Disclosures: Dr. Hussain disclosed serving as a consultant for TriVascular and a national principal investigator for the PostMarket Ovation Trial.
Broadly implementing stroke embolectomy faces hurdles
NASHVILLE, TENN. – Results from three randomized controlled trials presented at the International Stroke Conference, plus the outcomes from a fourth trial first reported last fall, immediately established embolectomy as standard-of-care treatment for selected patients with acute ischemic stroke.
Stroke experts interviewed during the conference, however, said that making embolectomy routinely available to most U.S. stroke patients who would be candidates for the intervention will take months, if not years.
They envision challenges involving the availability of trained interventionalists, triage of patients to the right centers, and reimbursement issues as some of the obstacles to be dealt with before endovascular embolectomy aimed at removing intracerebral-artery occlusions in acute ischemic stroke patients becomes uniformly available.

Yet another challenge will arise when stroke-treatment groups that did not participate in the trials strive to replicate the success their colleagues reported by implementing the highly streamlined systems that were used in the trials for identifying appropriate stroke patients and for delivering treatment. Those systems were cited as an important reason why those studies succeeded in producing positive outcomes when similar embolectomy trials without the same efficiencies reported just a year or two ago failed to show benefit.
“The evidence makes it standard of care, but the challenge is that our systems are not set up. This is the big thing we will all go home to work on,” said Dr. Pooja Khatri, professor of neurology and director of acute stroke at the University of Cincinnati.
“You talk to everyone at this meeting, and what they want to go home and figure out is how can we deliver this care. It’s really challenging, at a myriad of levels,” said Dr. Colin P. Derdeyn, professor of neurology and director of the Center for Stroke and Cerebrovascular Disease at Washington University in St. Louis.
Growing endovascular availability
Arguably the most critical issue in rolling out endovascular stroke interventions more broadly is scaling up the number of centers that have the staff and systems in place to perform them. Clearly, the scope of providers able to deliver this treatment currently falls substantially short of what will be needed. “It’s kind of daunting to think about the [workforce] needs,” Dr. Khatri said in a talk at the conference, which was sponsored by the American Heart Association.
“In the United States, we’ve been building out a two-tier system, with comprehensive stroke centers capable of delivering this [endovascular embolectomy] treatment” and primary stroke centers capable of administering intravenous treatment with tissue plasminogen activator (TPA), the first treatment that patients eligible for embolectomy should receive, said Dr. Jeffrey L. Saver, professor of neurology and director of the stroke center at the University of California, Los Angeles, and lead investigator for one of the new embolectomy studies.

“Work groups have suggested about 60,000 U.S. stroke patients could potentially be treated with endovascular therapy, and we’d need about 300 comprehensive stroke centers to do this.” Dr. Saver estimated the current total of U.S. comprehensive stroke centers to be 75, a number that several others at the meeting pegged as more like 80, and they also noted that some centers are endovascular ready but have not received official comprehensive stroke center certification from the Joint Commission.
The extent to which availability of U.S. embolectomy remained limited through most of 2013 was apparent in data reported at the conference by Dr. Opeolu M. Adeoye, an emergency medicine physician and medical director of the telestroke program of the University of Cincinnati. During fiscal year 2013 (Oct. 2012 to Sept. 2013), 386,144 Medicare patients either older than 65 years or totally disabled had a primary hospital discharge diagnosis of stroke; of those, 5.1% had received thrombolytic therapy with intravenous TPA and 0.8% had undergone embolectomy. In a second analysis, he looked at stroke discharges and reperfusion treatments used in the 214 U.S. acute-care hospitals currently enrolled in StrokeNet, a program begun in 2013 by the National Institute of Neurological Disorders and Stroke to organize U.S. centers interested in participating in stroke trials.
During the same period, the 214 StrokeNet hospitals discharged 44,282 Medicare eligible patients who met the same age or disability criteria, with a TPA-treatment rate of 7.9% and an endovascular treatment rate of 2.2%. Although the StrokeNet hospitals treated roughly 11% of U.S. stroke patients in the specified demographic, they administered about 20% of the reperfusion treatment, Dr. Adeoye reported. He also highlighted that the 7.9% rate of TPA treatment among the StrokeNet hospitals correlated well with prior estimates that 6%-11% of stroke patients fulfill existing criteria for TPA treatment
A wide disparity existed in the rate of reperfusion use among StrokeNet hospitals. Sixty-seven hospitals, 31% of the StrokeNet group, treated at least 20 stroke patients with TPA during the study period, while 100 (47%) of the StrokeNet hospitals treated fewer than 10 acute stroke patients. The rate of those doing embolectomies was substantially lower, with 10 hospitals (5%) doing at least 20 endovascular procedures while 90% did fewer than 10.
Although Dr. Adeoye expressed confidence that the number of U.S. centers doing embolectomy cases will “change rapidly” following the new reports documenting the efficacy of the approach, he also acknowledged the challenges of growing the number of high-volume endovascular centers.
Centers that have been equivocal about embolectomy will now start doing it in a more concerted way, he predicted, but if cases get spread out and some sites do only a few patients a year, the quality of the procedures may suffer. “The more cases a site does, the better,” he noted, adding that regions that funnel all their stroke patients to a single endovascular site “do really well.”
“Right now, many hospitals want to do everything to get [fully] reimbursed and not send their patients down the line. There is a financial incentive to build up the stroke service at every hospital,” Dr. Derdeyn noted.
Another aspect to sorting out which centers start offering endovascular treatment will be the need to locate them in a rational way, as happened with trauma centers. Until now, placement of comprehensive stroke centers often depended on hospitals developing the capability as a marketing tool, noted Dr. Larry B. Goldstein, professor of neurology and director of the stroke center at Duke University in Durham, N.C. A hospital might achieve comprehensive stroke center certification, so a second center a few blocks away then follows suit seemingly to keep pace in a public-relations battle for cachet. The result has been an irrational clustering of centers with endovascular capability. He cited the situation in Cleveland, where comprehensive centers run by the Cleveland Clinic and Case Western stand a few dozen feet apart.
Challenges for triage
An analysis published last year by Dr. Adeoye and his colleagues showed that 56% of the U.S. population lived within a 60-minute drive of a hospital able to administer endovascular stroke treatment; by air, 85% had that access (Stroke 2014;45:3019-24). For TPA, 81% of people lived within a 60-minute drive of a center able to administer intravenous lytic treatment and 97% could reach these hospitals within an hour by air. While those numbers sound promising, though, fulfilling that potential depends on getting the right patients to the right hospitals.
Patient triage is perhaps the most vexing issue created by embolectomy’s success. For at least the short term, a limited number of centers will have the staffing and capacity to deliver endovascular embolectomy on a 24/7 basis to acute ischemic stroke patients who have a proximal blockage in a large cerebral artery. The relatively small number of sites able to offer embolectomy, and the much larger number of sites able to administer thrombolytic therapy with TPA, set the stage for some possible tension, or at least confusion, within communities over where an ambulance should bring an acute ischemic stroke patient.

“In some places they have trained the EMS [emergency medical services] to recognize severe strokes that are likely to benefit [from embolectomy], and they take those patients to places with endovascular capability. But there are some states with laws against doing this. There are major issues when EMS bypasses hospitals,” Dr. Derdeyn noted. “That’s the million-dollar question: How do you identify the stroke patients [with severe strokes who would benefit from embolectomy] and get them to where they need to go.” Like Dr. Adeoye, Dr. Derdeyn believes that endovascular treatment for stroke needs to be centralized at a relatively small number of high-volume centers.
“You can imagine that the fastest way to get stroke patients treated is to have them all go to one place, but that is much easier said than done,” Dr. Khatri said.
“Stent retrievers get cerebral arteries open, but that is not the biggest challenge. For the short term, the key issue is to get the correct patients to the correct hospitals where they can be treated by the correct team,” said Dr. Mayank Goyal, professor of diagnostic imaging at the University of Calgary (Alta.) and lead investigator for two of the three trials presented at the conference.
“You need a neurologist capable of deciding whether it really is a stroke, and pretty high-level imaging to identify the large-vessel occlusions that will benefit. Acquiring a CT angiography (CTA) image of the brain is a push-button process, but figuring out what the CTA says is not push button, especially the more sophisticated perfusion CT imaging to assess collateral circulation. I don’t see this capability happening in every catheterization laboratory,” Dr. Derdeyn said in an interview.
Another issue is volume. “Telemedicine may allow broader use of [more sophisticated] imaging, but if a place is only doing 20 endovascular procedures a year, they won’t have the best outcomes. Most small hospitals that today give patients TPA see 20 cases or fewer a year, and perhaps 5 patients will have a large-vessel occlusion,” Dr. Derdeyn said.
Before the new reports documenting the safety and efficacy of endovascular treatment, “we did not have the justification to bypass primary stroke centers and take patients directly to comprehensive stroke centers,” Dr. Khatri said. Now, “there is clear evidence that patients with severe strokes should not go to the nearby primary stroke center” but instead head directly for the centers capable of performing embolectomy. But Dr. Khatri also acknowledged that a complex calculation is needed to balance the trade off: Is it better to take a stroke patient more quickly to a nearby hospital that can only start TPA and perhaps later forward the patient to an embolectomy-ready hospital, or to transport the patient somewhat further to a facility able to deliver both TPA and embolectomy?
Dr. Khatri said that, in the Cincinnati area, “we have scheduled a retreat for March to start to plan how this will happen.” Her region includes just one comprehensive stroke center that already performs endovascular treatments for stroke, at the University of Cincinnati, which sits amid 16 other hospitals that perform acute stroke care and can administer TPA. “Ambulance-based triage will be a big issue,” she predicted.
Other aspects of improved triage will be training ambulance personal to better identify the more severe stroke patients who will most likely need endovascular treatment and improving communication between ambulance crews and receiving hospitals to further speed up a process that depends on quick treatment to get the best outcomes.
The ideal is “having paramedics call and tell us what is happening [in their ambulance] and give us as much information as possible so we can start planning for the patient’s arrival. Most hospitals don’t do this now; relatively few have their system well organized,” Dr. Goyal said in an interview. A finely orchestrated emergency transport system and hospital-based stroke team was part of the program developed at the University of Calgary by Dr. Goyal and his associates and which they credited with contributing to the successful embolectomy trial they led, called ESCAPE (Endovascular Treatment for Small Core and Anterior Circulation Proximal Occlusion with Emphasis on Minimizing CT to Recanalization Times)(N. Engl. J. Med. 2015 Feb. 11 [doi:10.1056/NEJMoa1414905]). Dr. Goyal said that he is now visiting hospitals around the world to assist them in setting up stroke-response systems that mimic what was successful in Calgary and the other centers that participated in ESCAPE.
Improving triage with better screening
A key to improved ambulance triage will be identifying a simple, evidence-based method for assessing stroke severity that ambulance personnel can use to determine what sort of care a patient needs and where the patient needs to go to. Although a couple of U.S. sites have begun pilot studies of field-based CT units that allow stroke patients to undergo imaging-based assessment in the field, clinical evaluation remains the main tool used in the ambulance.
One possible tool is the Los Angeles Motor Scale (LAMS), a stroke-assessment scoring system developed by Dr. Saver and his associates for ambulance use about a decade ago (Prehosp. Emerg. Care 2004;8:46-50). “A LAMS score of 4 or 5 [on a scale of 0-5] is a good starting point, and with time it might improve,” Dr. Goyal said.
The National Institutes of Health Stroke Scale (NIHSS) is a clinical assessment tool not designed for prehospital use, but a new analysis reported at the meeting showed value in using the NIHSS to identify stroke patients who are good candidates for endovascular treatment, further suggesting that a simple screening tool could potentially work in the ambulance to identify patients who probably need embolectomy.
The new analysis combined data from two randomized trials: The IMS (Interventional Management of Stroke) III trial, the results of which, published in early 2013, showed no incremental benefit of endovascular therapy plus TPA over TPA alone for patients with acute ischemic stroke (N. Engl. J. Med. 2013;368:893-903); and the MR CLEAN (Multicenter Randomized Clinical Trial of Endovascular Treatment for Acute Ischemic Stroke in the Netherlands) trial, the results of which, published in January, showed a significant incremental benefit from endovascular treatment – it was the first of the four studies recently reported to show this benefit (N. Engl. J. Med. 2015;372:11-20).
The combined data included all patients from both studies with a NIHSS score of at least 20, indicating a very severe stroke. This produced a total of 342 patients, of whom 191 received intravenous TPA plus endovascular treatment and 152 received only TPA. After 90 days, 24% of the patients treated with endovascular treatment and 14% of those treated only with TPA had a modified Rankin Scale score of 0-2, indicating no or limited disability, Dr. Joseph P. Broderick reported at the conference. After adjustments for age and other potential confounders, treatment with endovascular therapy produced a statistically significant 85% improvement in patients achieving an acceptable modified Rankin Scale score at 90 days, said Dr. Broderick, professor of neurology and director of the neuroscience institute at the University of Cincinnati.
“The NIHSS score is a surrogate for clot size. It is an imperfect measure, especially at lower levels, but when the score is 20 or higher it means the patient has a big clot” that will likely not fully respond to TPA but potentially will respond to embolectomy, Dr. Broderick said in an interview. “A patient with a NIHSS score of 20 or higher has about a 95% risk of having an ongoing major artery occlusion despite TPA treatment.”
“The challenge is that we don’t have a fully validated [prehospital] scoring system. Several groups are trying to create one; in the meantime we may come up with certain clinical thresholds” that can reliably guide ambulance crews on the best place to take each stroke patient, Dr. Khatri said.
Dr. Khatri has received research support from Penumbra and Genentech. Dr. Derdeyn has received honoraria from Penumbra and holds equity in Pulse Therapeutics. Dr. Saver has been a consultant to and received research support from Covidien. Dr. Adeoye has been a speaker for Genentech. Dr. Goldstein had no disclosures. Dr. Goyal has been a consultant to and received research support from Covidien and holds a patent on using CT angiography to diagnose stroke. Dr. Broderick has received research support from Genentech.
[email protected]
On Twitter @mitchelzoler
NASHVILLE, TENN. – Results from three randomized controlled trials presented at the International Stroke Conference, plus the outcomes from a fourth trial first reported last fall, immediately established embolectomy as standard-of-care treatment for selected patients with acute ischemic stroke.
Stroke experts interviewed during the conference, however, said that making embolectomy routinely available to most U.S. stroke patients who would be candidates for the intervention will take months, if not years.
They envision challenges involving the availability of trained interventionalists, triage of patients to the right centers, and reimbursement issues as some of the obstacles to be dealt with before endovascular embolectomy aimed at removing intracerebral-artery occlusions in acute ischemic stroke patients becomes uniformly available.
Yet another challenge will arise when stroke-treatment groups that did not participate in the trials strive to replicate the success their colleagues reported by implementing the highly streamlined systems that were used in the trials for identifying appropriate stroke patients and for delivering treatment. Those systems were cited as an important reason why those studies succeeded in producing positive outcomes when similar embolectomy trials without the same efficiencies reported just a year or two ago failed to show benefit.
“The evidence makes it standard of care, but the challenge is that our systems are not set up. This is the big thing we will all go home to work on,” said Dr. Pooja Khatri, professor of neurology and director of acute stroke at the University of Cincinnati.
“You talk to everyone at this meeting, and what they want to go home and figure out is how can we deliver this care. It’s really challenging, at a myriad of levels,” said Dr. Colin P. Derdeyn, professor of neurology and director of the Center for Stroke and Cerebrovascular Disease at Washington University in St. Louis.
Growing endovascular availability
Arguably the most critical issue in rolling out endovascular stroke interventions more broadly is scaling up the number of centers that have the staff and systems in place to perform them. Clearly, the scope of providers able to deliver this treatment currently falls substantially short of what will be needed. “It’s kind of daunting to think about the [workforce] needs,” Dr. Khatri said in a talk at the conference, which was sponsored by the American Heart Association.
“In the United States, we’ve been building out a two-tier system, with comprehensive stroke centers capable of delivering this [endovascular embolectomy] treatment” and primary stroke centers capable of administering intravenous treatment with tissue plasminogen activator (TPA), the first treatment that patients eligible for embolectomy should receive, said Dr. Jeffrey L. Saver, professor of neurology and director of the stroke center at the University of California, Los Angeles, and lead investigator for one of the new embolectomy studies.
“Work groups have suggested about 60,000 U.S. stroke patients could potentially be treated with endovascular therapy, and we’d need about 300 comprehensive stroke centers to do this.” Dr. Saver estimated the current total of U.S. comprehensive stroke centers to be 75, a number that several others at the meeting pegged as more like 80, and they also noted that some centers are endovascular ready but have not received official comprehensive stroke center certification from the Joint Commission.
The extent to which availability of U.S. embolectomy remained limited through most of 2013 was apparent in data reported at the conference by Dr. Opeolu M. Adeoye, an emergency medicine physician and medical director of the telestroke program of the University of Cincinnati. During fiscal year 2013 (Oct. 2012 to Sept. 2013), 386,144 Medicare patients either older than 65 years or totally disabled had a primary hospital discharge diagnosis of stroke; of those, 5.1% had received thrombolytic therapy with intravenous TPA and 0.8% had undergone embolectomy. In a second analysis, he looked at stroke discharges and reperfusion treatments used in the 214 U.S. acute-care hospitals currently enrolled in StrokeNet, a program begun in 2013 by the National Institute of Neurological Disorders and Stroke to organize U.S. centers interested in participating in stroke trials.
During the same period, the 214 StrokeNet hospitals discharged 44,282 Medicare eligible patients who met the same age or disability criteria, with a TPA-treatment rate of 7.9% and an endovascular treatment rate of 2.2%. Although the StrokeNet hospitals treated roughly 11% of U.S. stroke patients in the specified demographic, they administered about 20% of the reperfusion treatment, Dr. Adeoye reported. He also highlighted that the 7.9% rate of TPA treatment among the StrokeNet hospitals correlated well with prior estimates that 6%-11% of stroke patients fulfill existing criteria for TPA treatment
A wide disparity existed in the rate of reperfusion use among StrokeNet hospitals. Sixty-seven hospitals, 31% of the StrokeNet group, treated at least 20 stroke patients with TPA during the study period, while 100 (47%) of the StrokeNet hospitals treated fewer than 10 acute stroke patients. The rate of those doing embolectomies was substantially lower, with 10 hospitals (5%) doing at least 20 endovascular procedures while 90% did fewer than 10.
Although Dr. Adeoye expressed confidence that the number of U.S. centers doing embolectomy cases will “change rapidly” following the new reports documenting the efficacy of the approach, he also acknowledged the challenges of growing the number of high-volume endovascular centers.
Centers that have been equivocal about embolectomy will now start doing it in a more concerted way, he predicted, but if cases get spread out and some sites do only a few patients a year, the quality of the procedures may suffer. “The more cases a site does, the better,” he noted, adding that regions that funnel all their stroke patients to a single endovascular site “do really well.”
“Right now, many hospitals want to do everything to get [fully] reimbursed and not send their patients down the line. There is a financial incentive to build up the stroke service at every hospital,” Dr. Derdeyn noted.
Another aspect to sorting out which centers start offering endovascular treatment will be the need to locate them in a rational way, as happened with trauma centers. Until now, placement of comprehensive stroke centers often depended on hospitals developing the capability as a marketing tool, noted Dr. Larry B. Goldstein, professor of neurology and director of the stroke center at Duke University in Durham, N.C. A hospital might achieve comprehensive stroke center certification, so a second center a few blocks away then follows suit seemingly to keep pace in a public-relations battle for cachet. The result has been an irrational clustering of centers with endovascular capability. He cited the situation in Cleveland, where comprehensive centers run by the Cleveland Clinic and Case Western stand a few dozen feet apart.
Challenges for triage
An analysis published last year by Dr. Adeoye and his colleagues showed that 56% of the U.S. population lived within a 60-minute drive of a hospital able to administer endovascular stroke treatment; by air, 85% had that access (Stroke 2014;45:3019-24). For TPA, 81% of people lived within a 60-minute drive of a center able to administer intravenous lytic treatment and 97% could reach these hospitals within an hour by air. While those numbers sound promising, though, fulfilling that potential depends on getting the right patients to the right hospitals.
Patient triage is perhaps the most vexing issue created by embolectomy’s success. For at least the short term, a limited number of centers will have the staffing and capacity to deliver endovascular embolectomy on a 24/7 basis to acute ischemic stroke patients who have a proximal blockage in a large cerebral artery. The relatively small number of sites able to offer embolectomy, and the much larger number of sites able to administer thrombolytic therapy with TPA, set the stage for some possible tension, or at least confusion, within communities over where an ambulance should bring an acute ischemic stroke patient.
“In some places they have trained the EMS [emergency medical services] to recognize severe strokes that are likely to benefit [from embolectomy], and they take those patients to places with endovascular capability. But there are some states with laws against doing this. There are major issues when EMS bypasses hospitals,” Dr. Derdeyn noted. “That’s the million-dollar question: How do you identify the stroke patients [with severe strokes who would benefit from embolectomy] and get them to where they need to go.” Like Dr. Adeoye, Dr. Derdeyn believes that endovascular treatment for stroke needs to be centralized at a relatively small number of high-volume centers.
“You can imagine that the fastest way to get stroke patients treated is to have them all go to one place, but that is much easier said than done,” Dr. Khatri said.
“Stent retrievers get cerebral arteries open, but that is not the biggest challenge. For the short term, the key issue is to get the correct patients to the correct hospitals where they can be treated by the correct team,” said Dr. Mayank Goyal, professor of diagnostic imaging at the University of Calgary (Alta.) and lead investigator for two of the three trials presented at the conference.
“You need a neurologist capable of deciding whether it really is a stroke, and pretty high-level imaging to identify the large-vessel occlusions that will benefit. Acquiring a CT angiography (CTA) image of the brain is a push-button process, but figuring out what the CTA says is not push button, especially the more sophisticated perfusion CT imaging to assess collateral circulation. I don’t see this capability happening in every catheterization laboratory,” Dr. Derdeyn said in an interview.
Another issue is volume. “Telemedicine may allow broader use of [more sophisticated] imaging, but if a place is only doing 20 endovascular procedures a year, they won’t have the best outcomes. Most small hospitals that today give patients TPA see 20 cases or fewer a year, and perhaps 5 patients will have a large-vessel occlusion,” Dr. Derdeyn said.
Before the new reports documenting the safety and efficacy of endovascular treatment, “we did not have the justification to bypass primary stroke centers and take patients directly to comprehensive stroke centers,” Dr. Khatri said. Now, “there is clear evidence that patients with severe strokes should not go to the nearby primary stroke center” but instead head directly for the centers capable of performing embolectomy. But Dr. Khatri also acknowledged that a complex calculation is needed to balance the trade off: Is it better to take a stroke patient more quickly to a nearby hospital that can only start TPA and perhaps later forward the patient to an embolectomy-ready hospital, or to transport the patient somewhat further to a facility able to deliver both TPA and embolectomy?
Dr. Khatri said that, in the Cincinnati area, “we have scheduled a retreat for March to start to plan how this will happen.” Her region includes just one comprehensive stroke center that already performs endovascular treatments for stroke, at the University of Cincinnati, which sits amid 16 other hospitals that perform acute stroke care and can administer TPA. “Ambulance-based triage will be a big issue,” she predicted.
Other aspects of improved triage will be training ambulance personal to better identify the more severe stroke patients who will most likely need endovascular treatment and improving communication between ambulance crews and receiving hospitals to further speed up a process that depends on quick treatment to get the best outcomes.
The ideal is “having paramedics call and tell us what is happening [in their ambulance] and give us as much information as possible so we can start planning for the patient’s arrival. Most hospitals don’t do this now; relatively few have their system well organized,” Dr. Goyal said in an interview. A finely orchestrated emergency transport system and hospital-based stroke team was part of the program developed at the University of Calgary by Dr. Goyal and his associates and which they credited with contributing to the successful embolectomy trial they led, called ESCAPE (Endovascular Treatment for Small Core and Anterior Circulation Proximal Occlusion with Emphasis on Minimizing CT to Recanalization Times)(N. Engl. J. Med. 2015 Feb. 11 [doi:10.1056/NEJMoa1414905]). Dr. Goyal said that he is now visiting hospitals around the world to assist them in setting up stroke-response systems that mimic what was successful in Calgary and the other centers that participated in ESCAPE.
Improving triage with better screening
A key to improved ambulance triage will be identifying a simple, evidence-based method for assessing stroke severity that ambulance personnel can use to determine what sort of care a patient needs and where the patient needs to go to. Although a couple of U.S. sites have begun pilot studies of field-based CT units that allow stroke patients to undergo imaging-based assessment in the field, clinical evaluation remains the main tool used in the ambulance.
One possible tool is the Los Angeles Motor Scale (LAMS), a stroke-assessment scoring system developed by Dr. Saver and his associates for ambulance use about a decade ago (Prehosp. Emerg. Care 2004;8:46-50). “A LAMS score of 4 or 5 [on a scale of 0-5] is a good starting point, and with time it might improve,” Dr. Goyal said.
The National Institutes of Health Stroke Scale (NIHSS) is a clinical assessment tool not designed for prehospital use, but a new analysis reported at the meeting showed value in using the NIHSS to identify stroke patients who are good candidates for endovascular treatment, further suggesting that a simple screening tool could potentially work in the ambulance to identify patients who probably need embolectomy.
The new analysis combined data from two randomized trials: The IMS (Interventional Management of Stroke) III trial, the results of which, published in early 2013, showed no incremental benefit of endovascular therapy plus TPA over TPA alone for patients with acute ischemic stroke (N. Engl. J. Med. 2013;368:893-903); and the MR CLEAN (Multicenter Randomized Clinical Trial of Endovascular Treatment for Acute Ischemic Stroke in the Netherlands) trial, the results of which, published in January, showed a significant incremental benefit from endovascular treatment – it was the first of the four studies recently reported to show this benefit (N. Engl. J. Med. 2015;372:11-20).
The combined data included all patients from both studies with a NIHSS score of at least 20, indicating a very severe stroke. This produced a total of 342 patients, of whom 191 received intravenous TPA plus endovascular treatment and 152 received only TPA. After 90 days, 24% of the patients treated with endovascular treatment and 14% of those treated only with TPA had a modified Rankin Scale score of 0-2, indicating no or limited disability, Dr. Joseph P. Broderick reported at the conference. After adjustments for age and other potential confounders, treatment with endovascular therapy produced a statistically significant 85% improvement in patients achieving an acceptable modified Rankin Scale score at 90 days, said Dr. Broderick, professor of neurology and director of the neuroscience institute at the University of Cincinnati.
“The NIHSS score is a surrogate for clot size. It is an imperfect measure, especially at lower levels, but when the score is 20 or higher it means the patient has a big clot” that will likely not fully respond to TPA but potentially will respond to embolectomy, Dr. Broderick said in an interview. “A patient with a NIHSS score of 20 or higher has about a 95% risk of having an ongoing major artery occlusion despite TPA treatment.”
“The challenge is that we don’t have a fully validated [prehospital] scoring system. Several groups are trying to create one; in the meantime we may come up with certain clinical thresholds” that can reliably guide ambulance crews on the best place to take each stroke patient, Dr. Khatri said.
Dr. Khatri has received research support from Penumbra and Genentech. Dr. Derdeyn has received honoraria from Penumbra and holds equity in Pulse Therapeutics. Dr. Saver has been a consultant to and received research support from Covidien. Dr. Adeoye has been a speaker for Genentech. Dr. Goldstein had no disclosures. Dr. Goyal has been a consultant to and received research support from Covidien and holds a patent on using CT angiography to diagnose stroke. Dr. Broderick has received research support from Genentech.
[email protected]
On Twitter @mitchelzoler
EXPERT ANALYSIS FROM THE INTERNATIONAL STROKE CONFERENCE
VIDEO: Challenges abound in rolling out stroke embolectomy
NASHVILLE, TENN. – U.S. stroke specialists now face the challenge of making endovascular embolectomy a routinely available option for selected patients with acute ischemic stroke, Dr. Pooja Khatri said in an interview at the International Stroke Conference.
During the conference, which was sponsored by the American Heart Association, new reports from three independent, randomized controlled trials, as well as data from a fourth study published in January, collectively established endovascular embolectomy as the new standard-of-care treatment for acute ischemic stroke patients with a proximal occlusion of a large, intracerebral artery. The stroke community, however, now faces the responsibility of figuring out how to make this a reality.
Among the hurdles they face are using CT imaging or other methods to identify in daily practice the specific patients who will get the biggest benefit from endovascular treatment and finding a consensus within each region on how to triage acute stroke patients to centers that can perform embolectomy, said Dr. Khatri, professor of neurology and director of acute stroke at the University of Cincinnati. In Cincinnati, Dr. Khatri and her colleagues are planning to soon hold a retreat with representatives from other area hospitals to try to work out the logistics.Dr. Khatri has received research support from Penumbra and Genentech.
The video associated with this article is no longer available on this site. Please view all of our videos on the MDedge YouTube channel
[email protected]
On Twitter @mitchelzoler
EXPERT ANALYSIS FROM THE INTERNATIONAL STROKE CONFERENCE
Haplo-BMT feasible in high-risk malignancies
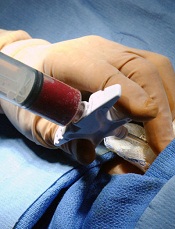
Photo by Chad McNeeley
SAN DIEGO—Haploidentical bone marrow transplant (haplo-BMT) is a feasible option for patients with high-risk hematologic malignancies who don’t have timely access to an HLA-matched donor, according to a speaker at the 2015 BMT Tandem Meetings.
Haplo-BMT using myeloablative conditioning, T-cell replete grafts, and post-transplant cyclophosphamide elicited “excellent” rates of engraftment, graft-vs-host disease (GVHD), and transplant-related mortality, said Heather Symons, MD, of The Johns Hopkins University School of Medicine in Baltimore, Maryland.
Dr Symons presented these results at the meeting as abstract 6*, which was chosen as one of the meeting’s “Best Abstracts.” The research was funded by Otsuka Pharmaceuticals.
Dr Symons and her colleagues conducted a phase 2 study of 96 patients with high-risk hematologic malignancies and a median age of 42 (range, 1-65). Males made up 58% of the population.
Diagnoses included acute and chronic leukemias, lymphomas, multiple myeloma, and myelodysplastic syndromes. Some patients were in complete remission, and some were in chemo-sensitive partial remission. There was also a mix of minimal residual disease positivity and negativity.
“Given the heterogeneity of these patients, we further classified our patients by disease risk index,” Dr Symons said. “We used the revised disease risk index as published by Armand in 2013. The disease risk index, or DRI, assigned patients into overall survival risk groups based on disease type and status.”
So 6 patients had a low DRI, 61 had an intermediate DRI, and 29 had a high DRI.
For most patients (n=73), conditioning consisted of intravenous busulfan (pharmacokinetically adjusted) on days –6 to –3 and cyclophosphamide (50 mg/kg/day) on days –2 and –1. But 23 patients (those with acute lymphocytic leukemia or lymphoblastic lymphoma) received cyclophosphamide (50 mg/kg/day) on days –5 and –4 and total body irradiation (200 cGy twice daily) on days –3 to -1.
All patients received T-cell-replete bone marrow from haploidentical, related donors. The median number of HLA mismatches was 4.
Post-transplant immunosuppression consisted of cyclophosphamide (50 mg/kg/day) on days 3 and 4, followed by mycophenolate mofetil for 30 days and tacrolimus for 6 months.
‘Excellent’ outcomes
The median follow-up was 18 months (range, 3-59). The median time to neutrophil engraftment was 24 days, and the median time to platelet engraftment was 29 days. Ninety-one percent of patients had donor chimerism greater than 95% at day 60.
The cumulative incidence of acute GVHD was 17% for grades 2-4 and 7% for grades 3-4. The cumulative incidence of chronic GHVD was 15%. For moderate-to-severe chronic GVHD, it was 5%.
Twenty-four percent of patients had CMV reactivation, and 22% had hemorrhagic cystitis.
The rate of relapse was 36% at 1 year and 44% at 3 years. The transplant-related mortality rate was 6% at 100 days and 11% at 1 year.
Ten patients died—2 from GVHD, 1 of cardiomyopathy, 2 of veno-occlusive disease, 1 of drug-induced liver injury, 2 due to infection, and 2 of unknown causes.
Overall survival was 72% at 1 year, 57% at 2 years, and 51% at 3 years. Event-free survival was 56% at 1 year, 51% at 2 years, and 47% at 3 years.
A multivariate analysis revealed that overall survival decreased with increasing age and increasing DRI.
Compared to patients younger than 20, the hazard ratio (HR) was 6.3 for patients ages 20 to 50 (P=0.02) and 4.7 for patients older than 50 (P=0.04). Compared to patients with a low or intermediate DRI, the HR was 2.2 for those with a high DRI (P=0.03).
The analysis also indicated that increasing age and donor CMV-positivity conferred worse event-free survival.
Compared to patients younger than 20, the HR was 3.6 for patients ages 20 to 50 (P=0.04) and 4.0 for patients older than 50 (P=0.03). Compared to patients who had a CMV-negative donor, the HR was 2.2 for patients who had a CMV-positive donor (P=0.01).
“In conclusion, myeloablative haploidentical bone marrow transplantation with post-transplantation cyclophosphamide for high-risk hematologic malignancies has excellent rates of engraftment, graft-vs-host disease, and transplant-related mortality, with results that are similar to those described in myeloablative HLA-matched bone marrow transplantation,” Dr Symons said.
“Overall, this seems a feasible option for high-risk patients who lack timely access to an HLA-matched donor and warrants continued study. We are soon to start enrolling patients on a Pediatric Blood & Marrow Transplant Consortium trial using myeloablative conditioning, haploidentical donors, and post-transplantation cyclophosphamide.” ![]()
*Information in the abstract differs from that presented at the meeting.
Protein appears key to success with clopidogrel

Image by Andre E.X. Brown
The platelet protein RASA3 is critical to treatment success with the antiplatelet drug clopidogrel (Plavix), according to research published in The Journal of Clinical Investigation.
The study shows that RASA3 is part of a cellular pathway that is crucial for platelet activity during thrombus formation.
Researchers believe this newfound information could aid the development of new antiplatelet compounds and antidotes to clopidogrel.
“We believe these findings could lead to improved strategies for treatment following a heart attack and a better understanding of why people respond differently to antiplatelet drugs such as aspirin and Plavix,” said study author Wolfgang Bergmeier, PhD, of the University of North Carolina at Chapel Hill.
Since the 1970s, scientists have known that clopidogrel has an anticlotting effect on platelets. In 2001, they found the compound’s target—the adenosine diphosphate receptor P2Y12. But they didn’t know how this receptor communicates with other proteins in the cell pathways important for platelet activation.
Researchers have since learned that P2Y12 communicates with RAP1, a small GTPase that cycles between an inactive GDP-bound form and an active GTP-bound form. RAP1 is tightly regulated by GEFs, which stimulate GTP loading, and GAPs, which catalyze GTP hydrolysis.
Dr Bergmeier’s group and others previously showed that RAP1 regulates platelet adhesion and thrombosis.
Now, his team has found evidence suggesting the GAP RASA3 is the “missing link” between P2Y12 and RAP1 in platelets. And agents that inhibit P2Y12, like clopidogrel, prevent thrombosis mainly through their effect on RASA3/RAP1 signaling.
The researchers used deep sequencing techniques to show that RASA3 was the only highly expressed GAP gene for RAP1 in platelets. And they hypothesized that a malfunctioning RASA3 protein would lead to the activation and clearance of platelets.
Experiments showed that mice with a RASA3 mutation had 3% to 5% of the typical platelet count. The rest of their platelets were being activated and cleared from circulation.
However, when the researchers disabled the major GEF proteins, platelet counts rose to normal levels. This suggests a tightly controlled balance between GEF and GAP proteins, especially RASA3, is vital for platelet activity.
“These experiments show that this RAP1 GEF-GAP pathway is crucial for platelets to jump into action to plug a hole in the endothelium,” Dr Bergmeier said. “And now we know that RASA3 is a critical negative regulator, a ‘brake’ on the process.”
“We have good reason to believe that the RAP1 ‘switch,’ controlled by the same GEF and GAP proteins, also regulates the active state of human platelets. We expect this research will provide critical information for improving antiplatelet therapies, possibly including approaches that eliminate some of the patient-to-patient variability and the increased bleeding risk associated with current antiplatelet drugs.” ![]()
NSAIDs may increase bleeding, cardiovascular events

Photo courtesy of CDC
A large, retrospective study has shown that nonsteroidal anti-inflammatory drugs (NSAIDs) can increase the risk of bleeding and cardiovascular events in patients who are receiving antithrombotic therapy after myocardial infarction (MI).
The risks were increased regardless of the type of antithrombotic treatment patients received, the types of NSAIDs they were prescribed, or the duration of NSAID use.
Researchers reported these findings in JAMA.
Anne-Marie Schjerning Olsen, MD, PhD, of Copenhagen University Hospital Gentofte in Hellerup, Denmark, and her colleagues conducted the research. They used nationwide administrative registries in Denmark (2002-2011) to analyze patients 30 years of age or older who were admitted with first-time MI and were alive 30 days after hospital discharge.
The team looked at subsequent treatment with aspirin, clopidogrel, or other oral anticoagulants and their combinations, as well as ongoing, concomitant, prescription NSAID use. They assessed the risk of bleeding requiring hospitalization and a composite cardiovascular outcome (cardiovascular death, nonfatal recurrent MI, and stroke).
The study included 61,971 patients with a mean age of 68 years. Thirty-four percent of these patients filled at least 1 NSAID prescription.
At a median follow-up of 3.5 years, 18,105 patients (29.2%) had died. There were 5288 bleeding events (8.5%) and 18,568 cardiovascular events (30.0%).
A multivariate analysis showed that NSAID use increased the risk of bleeding (hazard ratio, 2.02) and cardiovascular events (hazard ratio, 1.40). The increased risk of these events was present regardless of the type of antithrombotic treatment, the types of NSAIDs used, or the duration of NSAID use.
Dr Schjerning Olsen and her colleagues said additional research is needed to confirm these findings, but physicians should exercise caution when prescribing NSAIDs to patients with a recent MI.
Authors of a related editorial pointed out that this study only included prescription NSAID use. In countries where NSAIDs are available over the counter, physicians may be unaware that patients are taking these drugs. ![]()
Variant may predict risk of toxicity in ALL

Kristine Crews, Barthelemy
Diouf, and William Evans
Photo by Seth Dixon
A gene variant may help predict vincristine-related toxicity in children with acute lymphoblastic leukemia (ALL).
A study of more than 300 children with ALL showed that patients with an inherited variant in the gene CEP72 were more likely to develop peripheral neuropathy after receiving the chemotherapy drug vincristine.
If these results can be replicated in additional populations, they may provide a basis for safer dosing of the drug, according to investigators.
William Evans, PharmD, of St Jude Children’s Research Hospital in Memphis, Tennessee, and his colleagues conducted this research and shared the results in JAMA.
The investigators analyzed patients in 2 prospective clinical trials for childhood ALL that included treatment with 36 to 39 doses of vincristine. The team performed genetic analyses and assessed vincristine-induced peripheral neuropathy in 321 patients in whom DNA data were available.
This included 222 patients with a median age of 6 years who were enrolled in a St Jude Children’s Research Hospital study from 1994 to 1998, as well as 99 patients with a median age of 11.4 years who were enrolled in a Children’s Oncology Group (COG) study from 2007 to 2010.
Grade 2 to 4 vincristine-induced peripheral neuropathy occurred in 28.8% of patients (64/222) in the St Jude cohort and in 22.2% (22/99) in the COG cohort.
The investigators found that a single nucleotide polymorphism (SNP) in the promoter region of the CEP72 gene, which encodes a centrosomal protein involved in microtubule formation, was significantly associated with vincristine-induced neuropathy (P=6.3×10⁻⁹).
This SNP had a minor allele frequency of 37%, and 16% of patients (50/321) were homozygous for the risk allele (TT at rs924607).
Among patients with the high-risk CEP72 genotype, 56% (28/50) had at least 1 episode of grade 2 to 4 neuropathy. This was significantly higher than in patients with the CEP72 CC or CT genotypes. About 21% of those patients (58/271) had at least 1 episode of grade 2 to 4 neuropathy (P=2.4×10⁻⁶).
In addition, the severity of neuropathy was greater in patients who were homozygous for the TT genotype than in patients with the CC or CT genotype—2.4-fold greater by Poisson regression (P<0.0001) and 2.7-fold greater based on the mean grade of neuropathy (P=0.004).
Finally, in lab experiments, the investigators found that reducing CEP72 expression in human neurons and leukemia cells increased their sensitivity to vincristine.
In a related editorial, Howard L. McLeod, PharmD, of the Moffitt Cancer Center in Tampa, Florida, noted that this study has several strengths: genome-wide discovery in patients from well-conducted clinical trials, replication in a multicenter cohort, statistical robustness, and laboratory correlative findings that contribute to biologic plausibility.
However, he also pointed out that vincristine remains a component of the most widely accepted treatment regimens for childhood ALL.
“It is not clear that vincristine can be removed from the treatment options for a child with CEP72 variants, although this study suggests that the resulting increase in leukemia cellular sensitivity makes vincristine dose reductions possible without compromising antileukemic effect,” he wrote.
“However, there is value in the association of CEP72 with vincristine-induced peripheral neuropathy (VIPN). The ability to objectively ascribe a degree of heightened VIPN risk will allow for greater transparency in discussions of risk and benefits of therapy with patients and their family members.”
“This also may lead to developmental therapeutic approaches to modulate CEP72 function as either primary prevention or treatment of chronic VIPN. This study also represents an initial robust effort to generate predictors for adverse drug reactions in cancer care.” ![]()
NSAIDs after MI raise bleeding risk
Even a short course of NSAIDs markedly raises the risk of major bleeding in patients receiving antithrombotic medication after having a myocardial infarction, according to a report published online Feb. 24 in JAMA.
In a nationwide Danish study, this risk was increased no matter which antithrombotic regimens the participants were taking and no matter which NSAIDs they were given. “There was no safe therapeutic window for concomitant NSAID use, because even short-term (0-3 days) treatment was associated with increased risk of bleeding,” said Dr. Anne-Marie Schjerning Olsen of Copenhagen University Hospital Gentofte, Hellerup (Denmark), and her associates.

More research is needed to confirm the findings of this observational study, but until then “physicians should exercise appropriate caution when prescribing NSAIDs for patients who have recently experienced MI,” they noted.
The only NSAID available over the counter in Denmark during the study period was ibuprofen, and it could only be purchased in low (20-mg) doses and in limited quantities (100 tablets). In countries like the United States, where ibuprofen and other NSAIDs are available without prescriptions and where there are few restrictions on the amounts that can be purchased, these study findings are even more worrying, Dr. Schjerning Olsen and her colleagues said.
Several current guidelines discourage the use of NSAIDs in people with a history of MI, including recommendations from the American Heart Association and the European Medicines Agency. But several sources have indicated that many such patients are being exposed to the drugs. To study the issue, the investigators analyzed data in four nationwide Danish health care registries. They identified roughly 62,000 adults (mean age 67.7 years) hospitalized for recent MI in 2002-2011 and put on antithrombotic medications, of whom nearly 21,000 (33.8%) also received at least one prescription for NSAID treatment.
During a median follow-up of 3.5 years, there were 5,288 major bleeding events in the study cohort, including 799 fatal bleeding events.
The incidence of major bleeding events was 4.2 per 100 person-years among patients given NSAIDs, compared with 2.2 per 100 person-years without NSAID therapy, for a hazard ratio of 2.0. Bleeding risk was markedly increased from the first day of exposure to NSAIDs (HR of 3.37 on days 0-3), and it persisted through 90 days. This pattern was consistent across all antithrombotic regimens and regardless of whether the prescribed NSAIDs were selective COX-2 inhibitors, such as rofecoxib or celecoxib, or nonselective COX-2 inhibitors, such as ibuprofen or diclofenac (JAMA 2015 Feb. 24 [doi:10.1001/jama.2015.0809]).
When major gastrointestinal bleeding events were considered individually, the incidence was 2.1 events per 100 person-years among NSAID users, compared with only 0.8 events per 100 person-years without NSAIDs, for an HR of 2.65. The incidence of combined cardiovascular events was 11.2 per 100 person-years among NSAID users, compared with 8.3 per 100 person-years without NSAIDs, for an HR of 1.4.
These results persisted through several sensitivity analyses. They remained consistent when patients with rheumatoid arthritis were excluded from the analysis; such patients are the primary users of NSAIDs in the age group of the study population. The findings also remained consistent when patients at high risk of bleeding due to comorbidities were excluded from the analysis, including those with malignancy, acute or chronic renal failure, or a history of bleeding events.
“Although it seems unlikely that physicians can completely avoid prescription of NSAIDs, even among high-risk patients, these results highlight the importance of considering the balance of benefits and risks before initiating any NSAID treatment,” Dr. Schjerning Olsen and her associates said.
The study was funded by the Danish Council for Independent Research, the William Harvey Research Institute at Barts, and the London School of Medicine and Dentistry. Dr. Schjerning Olsen reported having no financial conflicts of interest; one of her associates reported ties to Cardiome, Merck, Sanofi, Daiichi, and Bristol-Myers Squibb.
These findings are an important reminder that even though NSAIDs can be helpful and at times necessary medications, their use in patients with recent MI is related to clinically meaningful bleeding and ischemia risks.
The risks are even higher in countries like the U.S. than in Denmark, because NSAIDs are widely available here over the counter, and physicians may be unaware whether or not their patients are taking the drugs. Clinicians should advise all patients with CVD against using any NSAID except low-dose aspirin, especially those who’ve had a recent acute coronary syndrome.
Dr. Charles L. Campbell is in the division of cardiovascular medicine at the University of Tennessee, Chattanooga. Dr. David J. Moliterno is at Gill Heart Institute at the University of Kentucky, Lexington. They made these remarks in an editorial accompanying Dr. Schjerning Olsen’s report (JAMA 2015;313:801-2), and reported having no financial conflicts of interest.
Even a short course of NSAIDs markedly raises the risk of major bleeding in patients receiving antithrombotic medication after having a myocardial infarction, according to a report published online Feb. 24 in JAMA.
In a nationwide Danish study, this risk was increased no matter which antithrombotic regimens the participants were taking and no matter which NSAIDs they were given. “There was no safe therapeutic window for concomitant NSAID use, because even short-term (0-3 days) treatment was associated with increased risk of bleeding,” said Dr. Anne-Marie Schjerning Olsen of Copenhagen University Hospital Gentofte, Hellerup (Denmark), and her associates.
More research is needed to confirm the findings of this observational study, but until then “physicians should exercise appropriate caution when prescribing NSAIDs for patients who have recently experienced MI,” they noted.
The only NSAID available over the counter in Denmark during the study period was ibuprofen, and it could only be purchased in low (20-mg) doses and in limited quantities (100 tablets). In countries like the United States, where ibuprofen and other NSAIDs are available without prescriptions and where there are few restrictions on the amounts that can be purchased, these study findings are even more worrying, Dr. Schjerning Olsen and her colleagues said.
Several current guidelines discourage the use of NSAIDs in people with a history of MI, including recommendations from the American Heart Association and the European Medicines Agency. But several sources have indicated that many such patients are being exposed to the drugs. To study the issue, the investigators analyzed data in four nationwide Danish health care registries. They identified roughly 62,000 adults (mean age 67.7 years) hospitalized for recent MI in 2002-2011 and put on antithrombotic medications, of whom nearly 21,000 (33.8%) also received at least one prescription for NSAID treatment.
During a median follow-up of 3.5 years, there were 5,288 major bleeding events in the study cohort, including 799 fatal bleeding events.
The incidence of major bleeding events was 4.2 per 100 person-years among patients given NSAIDs, compared with 2.2 per 100 person-years without NSAID therapy, for a hazard ratio of 2.0. Bleeding risk was markedly increased from the first day of exposure to NSAIDs (HR of 3.37 on days 0-3), and it persisted through 90 days. This pattern was consistent across all antithrombotic regimens and regardless of whether the prescribed NSAIDs were selective COX-2 inhibitors, such as rofecoxib or celecoxib, or nonselective COX-2 inhibitors, such as ibuprofen or diclofenac (JAMA 2015 Feb. 24 [doi:10.1001/jama.2015.0809]).
When major gastrointestinal bleeding events were considered individually, the incidence was 2.1 events per 100 person-years among NSAID users, compared with only 0.8 events per 100 person-years without NSAIDs, for an HR of 2.65. The incidence of combined cardiovascular events was 11.2 per 100 person-years among NSAID users, compared with 8.3 per 100 person-years without NSAIDs, for an HR of 1.4.
These results persisted through several sensitivity analyses. They remained consistent when patients with rheumatoid arthritis were excluded from the analysis; such patients are the primary users of NSAIDs in the age group of the study population. The findings also remained consistent when patients at high risk of bleeding due to comorbidities were excluded from the analysis, including those with malignancy, acute or chronic renal failure, or a history of bleeding events.
“Although it seems unlikely that physicians can completely avoid prescription of NSAIDs, even among high-risk patients, these results highlight the importance of considering the balance of benefits and risks before initiating any NSAID treatment,” Dr. Schjerning Olsen and her associates said.
The study was funded by the Danish Council for Independent Research, the William Harvey Research Institute at Barts, and the London School of Medicine and Dentistry. Dr. Schjerning Olsen reported having no financial conflicts of interest; one of her associates reported ties to Cardiome, Merck, Sanofi, Daiichi, and Bristol-Myers Squibb.
Key clinical point: NSAIDs markedly raise major bleeding risk in patients taking antithrombotics after having an MI.
Major finding: The incidence of major bleeding events was 4.2 per 100 person-years among patients given NSAIDs, compared with 2.2 per 100 person-years without NSAID therapy, for a hazard ratio of 2.0.
Data source: An observational cohort study of bleeding risks in 61,971 MI patients across Denmark who were prescribed NSAIDs while receiving antithrombotic medications.
Disclosures: The study was funded by the Danish Council for Independent Research, the William Harvey Research Institute at Barts, and the London School of Medicine and Dentistry. Dr. Schjerning Olsen reported having no financial conflicts of interest; one of her associates reported ties to Cardiome, Merck, Sanofi, Daiichi, and Bristol-Myers Squibb.

Similar Outcomes for Patients Discharged on Weekends vs. Weekdays
Inpatients discharged from teaching hospitals on weekends experience similar postdischarge outcomes and shorter lengths of stay compared with patients discharged on weekdays, according to a recent Journal of Hospital Medicine study.
The study, led by Finlay McAlister, MSc, MD, LMCC, general internist and population health investigator at the Alberta Heritage Foundation for Medical Research in Canada, examined death or nonelective readmission rates for general medicine inpatients 30 days after weekend and weekday discharges at all seven teaching hospitals in Alberta.
Although fewer pharmacists, physicians, and therapists typically are available to assist patients discharged on weekends, Dr. McAlister and colleagues found that patients sent home on weekends do not bounce back to the hospital or the ED sooner than patients sent home on weekdays.
"If somebody is ready to go [home] on a weekend, you do not have to hold them until Monday, and nurse them and give them a false impression that that will improve their 30-day outcome," Dr. McAlister says.
In a previous study of patients with heart failure, Dr. McAlister noticed a trend that suggested better outcomes for patients discharged on weekdays. However, after studying a wider spectrum of patients with various diagnoses, he concluded there is no difference between weekend and weekday discharges in terms of patients' 30-day outcome.
Dr. McAlister suggests more research can be done to determine whether there is a difference in outcomes for weekend discharges from nonteaching hospitals.
"Because teaching hospitals may be a bit of a safety net, in terms of having house staff that is there seven days a week," he says. "The impact of reduced staffing levels may be more severe than at nonteaching hospitals."
Visit our website for more information on patient-discharge recommendations.
Threat of Facility Closure Puts Pressure on Rural Hospitalists
A pair of rural South Carolina hospitals that may soon shutter their doors is the latest example of the pressure on rural hospitalists, says a veteran HM director. But hospital closures also give rural hospitalists the opportunity to carve out a niche doing medical work that best serves their community.
Marlboro Park Hospital and Chesterfield General Hospital, 15 miles apart in northeastern South Carolina, are set to close this spring as Community Health Systems—which runs the hospitals and employs hospital staff—announced it would not renew its operating lease. A new operator is being sought.
The fear of a rural institution closing is a common one for hospitalists, says Dana Giarrizzi, DO, FHM, national medical director for telehospitalist services for Eagle Hospital Physicians and section leader for the rural section of SHM.
"There's always that feeling of walking the tightrope," Dr. Giarrizzi says. "It's a fine line because you can't offer everything…there aren't enough physicians."
And while hospitals' shrinking bottom lines, more intensive reporting and quality protocols, and ongoing changes to the rules of the Affordable Care Act have roiled rural hospitalists, Dr. Giarrizzi sees the current environment as one that offers rural groups an opportunity to focus on what they do best and home in on that.
"It's really important [for rural hospitalist groups] to figure out what their niche is, figure out what works for them, and then to run that well," Dr. Giarrizzi adds. "I think it hurts them when they're pushed or when they feel like they have to do everything…you don't have that ability. These small rural hospitals serve their purpose, but their purpose isn't to serve everything."
Visit our website for more information on rural hospitals.