User login
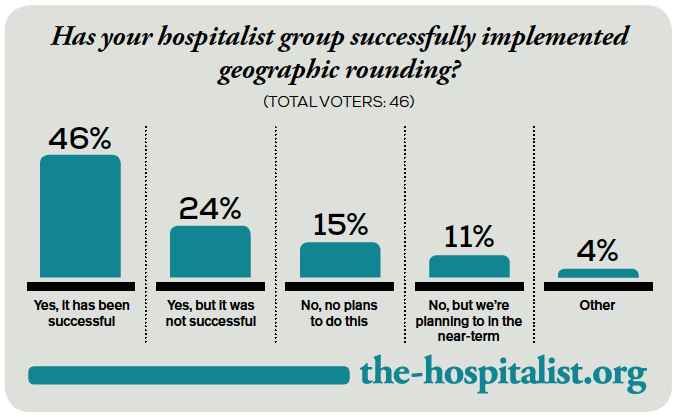
Geographic Rounding of Hospital Nurses Challenges Unit-Based Theory
Nurses, of course, have always been assigned by unit—that is, geographically. So it should come as no surprise that searching “unit-based” at the-hospitalist.org returns many articles about assigning hospitalists geographically, but not nurses, partly because few would consider it a new idea. But this article is about a new wrinkle in assigning nurses.
Although there likely are a number of hospitals doing something similar, I’ll describe a place I was lucky enough to see up close.
Bassett Medical Center
On a cold day last December, I was part of a team that spent a few days in Cooperstown, N.Y. This is a place that is so pretty that I didn’t immediately recognize we had arrived at the Bassett Medical Center Campus, since the entrance we used looked more like a library topped by a pretty cupola and warmly decorated for the holidays. We met so many nice people, including Kai Mebust, MD, FHM, who I’m convinced works full-time for the local Chamber of Commerce and tourism industry. If he doesn’t, then they should put him on their payroll.
Not long after our arrival, Dr. Mebust led us outside in the winter air without our coats to see the very beautiful view from the patio adjacent to the hospital cafeteria. And before we left for home he climbed in our car to direct us on a tour of the town. I’m sold. What a beautiful place. So much more than the Baseball Hall of Fame for which Cooperstown is known.
When not promoting his town’s tourism or enthusiastically describing his eighth-grade son playing with the Preservation Hall Jazz Band in New Orleans, he seems to find time to serve as the chief of this academic hospital’s hospital medicine practice. He was the principal engineer of the geographic assignment of nurses and describes it with an enthusiasm that matches his service as tour guide.
Geographic Care: Single RN Caring for Five Adjacent Patients
The idea is simple and best described using an illustration. A single nurse cares for five patients in adjacent rooms referred to as a “pod.” A second nurse is responsible for the next pod of five consecutive patients, and a single hospitalist cares for all 10 in both pods. There are currently four pods on a single floor of 36 beds; however, they hope to expand this system to most of the medical-surgical beds in the hospital.
The nurses eligible to care for patients in these pods are all trained to be able to provide “step down” level of care, meaning patients don’t need to transfer to a different location for more frequent monitoring and such therapies as vasopressors, mask ventilation, and the like.
Each hospitalist caring for two pods of 10 adjacent patients will typically have additional patients in other locations. This is the hospital’s way of finding the sweet spot between the competing interests of “load leveling” patient volume across hospitalists and rigidly assigning each doctor to a single location, though if they succeed in expanding the model through most of the hospital, the hospitalists will likely need to figure out how to assign themselves more rigidly to three or four pods.
Additional Components
Each morning, the hospitalist meets with the two pod nurses. They briefly discuss overnight events and plans for the day.
Much later in the morning, they also conduct daily multidisciplinary rounds involving nurse, case manager, pharmacist, dietician, social worker, respiratory therapist, and hospitalist. These follow a standard format, which is posted on the wall, and are done in a workroom that allows most participants to be in front of a computer, so they can enter notes and orders into the electronic health record (EHR) as they discuss patients.
What Is the Big Deal Here?
A lot of smart people have developed and written about systems that assign hospitalists geographically, but in most cases this has not been accompanied by adjustments in the way nurses are assigned. On nursing units at most hospitals, this means that even if a hospitalist has all of her patients on the same floor, she is still interacting with five to seven nurses caring for her patients. That usually means the hospitalist and nurse have less awareness of each other’s thinking and doing than if the ratio is reduced to no more than three or four nurses for a single hospitalist.
Dr. Mebust provided a document enumerating the goals for the program:
- Improve communication;
- Reduce patient bed moves;
- Improve patient and staff satisfaction; and
- Provide more efficient care as measured in time-of-discharge, decreased physician time-per-patient, and possibly length of stay.
Because of a number of problems teasing out the effects of this program and its limited duration to this point, Dr. Mebust and staff can’t provide robust statistics to document success in these goals. But anecdotal information is very encouraging, and clearly the nurses love it.
A major barrier to assigning nurses based rigidly on patients in adjacent rooms is the inability to ensure that each nurse has a workload of roughly equivalent complexity, but they’ve found this is a much less significant problem than feared. The nurse I spoke with said any risk of ending up with unusually complex and time-consuming patients is essentially offset by the efficiency gained by having the same attending hospitalist for all of her patients.
In fact, the nurses love it so much that they much prefer being assigned to a pod rather than a traditional assortment of patients with different attending physicians, even if the latter offers a chance to address uneven acuity.
The Big Picture
I’ve often wished that I could incorporate into hospitalist work some of the efficient ways a doctor and nurse can work together seeing scheduled patients in an outpatient setting. Surely assigning hospitalists geographically does this to some degree and has a number of advantages that others have written about. But it comes at the cost of difficult tradeoffs for hospitalists, and I know of many groups that have abandoned it after concluding that the challenges of the system exceeded its benefits.
But when it is coupled with assigning nurses geographically, I think the benefits are even greater, not only for the hospitalists, but also for patients, nurses, and other hospital staff.
Next time you’re in Cooperstown, be sure you don’t just visit the Baseball Hall of Fame. Look up Dr. Mebust, Komron Ostovar, MD, and their colleagues at Bassett Medical Center. I betcha you’ll be persuaded to see the value of their geographic model.
And maybe you’ll even fall so far under the spell of how they all talk about where they work and live that you’ll be ready to move there and join them.
Little Progress Made Training Hospitalists to Stem Shortage of Intensivists
What would the status be for a hospitalist who could train for one year to become a critical care intensivist to address the shortage of intensivists? I’m one of the hospitalists who love critical care but cannot do two more years out for critical care training.
—Amadeo Rivera, MD
Has there been any progress in the 2012 SCCM/SHM proposal to train hospitalists as intensivists?
—Stephen M. Pastores, MD, Memorial
Sloan-Kettering Cancer Center, New York, N.Y.
Dr. Hospitalist responds:

As you may recall, SHM and the Society of Critical Care Medicine (SCCM) published a joint position paper in the Journal of Hospital Medicine in June 2012 in which they proposed a one-year critical care fellowship for hospitalists with at least three years of experience.
Since only one year of clinical rotations is required for critical care board eligibility, and there already exists a one-year track for other medical subspecialists (e.g. nephrology, infectious disease), most of us in hospital medicine thought the recommendation would have been much better received. Well, you guessed it. The following month, the leadership of the American College of Chest Physicians and the American Association of Critical-Care Nurses wrote in an editorial that a one-year fellowship was inadequate for hospitalists to gain competence in critical care medicine. Since then, there has not been much progress, at least not publicly, toward a standardized, streamlined, and accredited process for hospitalists to achieve critical care certification in one year.
Nevertheless, employing a standard search engine (Google) and terminology, I was able to locate one U.S.-based training program offering a one-year critical care medicine fellowship program recognized by the Accreditation Council for Graduate Medical Education for candidates with a background in anesthesiology, surgery, or internal medicine.
What would the status be for a hospitalist who could train for one year to become a critical care intensivist to address the shortage of intensivists? I’m one of the hospitalists who love critical care but cannot do two more years out for critical care training.
—Amadeo Rivera, MD
Has there been any progress in the 2012 SCCM/SHM proposal to train hospitalists as intensivists?
—Stephen M. Pastores, MD, Memorial
Sloan-Kettering Cancer Center, New York, N.Y.
Dr. Hospitalist responds:
As you may recall, SHM and the Society of Critical Care Medicine (SCCM) published a joint position paper in the Journal of Hospital Medicine in June 2012 in which they proposed a one-year critical care fellowship for hospitalists with at least three years of experience.
Since only one year of clinical rotations is required for critical care board eligibility, and there already exists a one-year track for other medical subspecialists (e.g. nephrology, infectious disease), most of us in hospital medicine thought the recommendation would have been much better received. Well, you guessed it. The following month, the leadership of the American College of Chest Physicians and the American Association of Critical-Care Nurses wrote in an editorial that a one-year fellowship was inadequate for hospitalists to gain competence in critical care medicine. Since then, there has not been much progress, at least not publicly, toward a standardized, streamlined, and accredited process for hospitalists to achieve critical care certification in one year.
Nevertheless, employing a standard search engine (Google) and terminology, I was able to locate one U.S.-based training program offering a one-year critical care medicine fellowship program recognized by the Accreditation Council for Graduate Medical Education for candidates with a background in anesthesiology, surgery, or internal medicine.
Billing for Hospital Admission, Discharge in Same 24-Hour Period
Should the admitting physician or the discharge physician bill the CPT code (99234-99236) for a patient who is admitted and discharged in the same 24-hour period?
—Charlette
Dr. Hospitalist responds:
Assuming both physicians are part of the same group and specialty, they are considered one physician. Since it appears that both face-to-face encounters are separated by eight hours, you’re correct, only one physician can bill the bundled care code 99234-99236. The group must decide which physician gets the RVU credit for the bundled code. Our group gives the credit to the admitting physician.
Hospital Violence Hits Home
Hospitalists could hardly be faulted for wondering: Am I safe? After all, the inpatient setting can be a tense place, and it’s where hospitalists work day in and day out.
David Pressel, MD, PhD, FHM, a pediatric hospitalist and medical director of inpatient services at Nemours Children’s Health System, which has locations in Delaware, New Jersey, Pennsylvania, and Florida, says it’s no wonder violence can erupt in the hospital setting.
“Violence is an issue in hospitals that is a reflection of our society, unfortunately,” says Dr. Pressel, a member of Team Hospitalist. “And it happens because these are very stressful places where people’s behavior can get outside the norm given the stress of the problems.”
Dr. Pressel, in collaboration with many others, has developed a workplace violence prevention program at Nemours aimed at de-escalating situations to avoid physical violence. The program teaches providers how to respond when something violent does happen. It’s a tiered training regimen that involves more training for those most involved in handling violent situations.
Dr. Pressel is no stranger to violence himself. Although he is a pediatric hospitalist and his patients are younger, some adolescent patients can have the physical presence of adults and pose just as serious a threat. He said that before the training program was put into place about a year ago, an episode of violence every month or two would require a patient to be placed in restraints.
“Staff has been hurt,” he explains. “I’ve been bitten twice by a patient. I have a scar on my arm that will be with me for life from one episode.”
A Slow, Disheartening, Upward Trend
Whether violence in hospitals and medical facilities is really a growing problem—or whether awareness of the issue is simply greater given these recent, high profile incidents—is not entirely known.
But according to the latest figures available from the Bureau of Labor Statistics (BLS), provided by the Occupational Safety and Health Administration (OSHA), violent incidents in hospitals did appear to be on the rise through 2013. The number of hospital assaults rose from 5,030 in 2011 to 5,500 in 2012 to 5,660 in 2013.
The number of assaults rose across all private sector industries over that span, but the percentage of those assaults that occurred in hospitals grew greater during that time—an indication that hospitals might be getting more violent at a faster pace than other workplaces. In 2011, according to BLS data, 21.4% of all assaults in private sector industries occurred in hospitals. That number rose to 21.8% in 2012 and to 22.1% in 2013.
According to the 2014 Healthcare Crime Survey, published by the International Association for Healthcare Security and Safety (IAHSS)—an organization of hospital security officials and administrators—violent crime at U.S. facilities rose from two incidents per 100 beds in 2012 to 2.5 incidents per 100 beds in 2013. That category includes murder, rape, aggravated assault, and robbery.
Assaults rose from 10.7 incidents per 100 beds in 2012 to 11.1 incidents per 100 beds in 2013.
BLS data also show that more injuries in hospitals are due to assaults compared with the private sector overall. In 2011, 2.6% of all private sector injuries were due to assault; in 2012, the number rose to 2.8%; and, in 2013, it was 2.8%. In hospitals in 2011, 8.6% of all injuries resulted from assaults. That percentage rose to 9.5% in 2012 and to 9.8% in 2013.
“BLS data show that nonfatal injuries due to violence are greater in the healthcare/social assistance setting than in other workplaces,” an OSHA spokesperson says. “Assaults represent a serious safety and health hazard within healthcare, and data indicate that hospitals comprise a large percentage of workplace assaults.”
Incident Prevention
Programs aimed at preventing violence can reduce these incidents.
“How well prepared hospital workers are in dealing with violent situations depends on the workplace violence prevention program implemented at a facility,” the OSHA spokesperson says. “Some states have passed legislation that specifically requires workplace violence prevention programs in the healthcare setting.”
These programs should address management commitment and employee participation, worksite analysis, hazard prevention and control, safety and health training, and recordkeeping and program evaluation. These elements should be assessed regularly, with changes made to respond to changing conditions, OSHA says.
A large number of OSHA inspections in the healthcare setting occur because of complaints regarding lack of protections against workplace violence. In 2014, the agency did 35 inspections in response to such complaints; 25 of those were in a healthcare setting, with 12 specifically at hospitals. As a result, five citations were issued, all of which were in healthcare, including two at hospitals.
Last year, Brookdale University Hospital and Medical Center in Brooklyn, N.Y., was fined $78,000 after an OSHA inspection found 40 incidents of workplace violence between Feb. 7 and April 12. They included employees who were threatened or verbally or physically assaulted by patients and visitors or while breaking up fights between patients. In the worst attack, a nurse sustained severe brain injuries.
The bulk of the hospital’s fines came as a result of a willful violation—an intentional or voluntary disregard for laws meant to protect workers against hospital violence.
While data from IAHSS and the BLS show an increase in hospital violence, those national figures aren’t as important as what is happening at your own facility, says David LaRose, MS, CHPA, CPP, the president of IAHSS and director of safety, security, and emergency management at Lakeland Regional Medical Center in Florida.
“You have to do a vulnerability assessment, and you specifically have to look at your demographic,” he says. “You specifically have to look at what is the history and the culture of the facility” to determine a hospital’s specific risk factors.
Although it’s crucial that a hospital track its own statistics on violence, that’s not to say that incidents elsewhere are irrelevant.
“You also want to look at what’s happening in the real world,” he says. “Somebody else’s unfortunate (occurrence) is a learning experience for my system, so we can try to be proactively preventing that.”
Educate, Recognize, React
At Nemours, Dr. Pressel didn’t develop the training in response to a perceived rise in incidents there. It was apparent, he says, that deficiencies in readiness needed to be addressed.
In the Nemours program, every staff member with some level of patient care responsibility gets basic training in aggressive child emergencies: identifying these situations, responding appropriately, and keeping safe. This group includes doctors, nurses, and nurse’s aids. The training involves actually playing out scenarios of violence, with staff members attempting to subdue a would-be attacker.
Depending on the job, each worker receives extra training that is specific to the role he or she would play in handling violent scenarios.
The training is designed to help individuals respond to such situations with “the same alacrity and acuity as they would respond to a Code Blue,” Dr. Pressel says. “Drop what you’re doing and run. These events are dangerous. That’s what they teach people. They’re dangerous and they’re scary and they’re chaotic, just like a Code Blue. That’s how people need to treat it.”
The goal is to de-escalate a situation, verbally or physically, without more aggressive means. But if that doesn’t work, physical restraints, medication, or both are used.
Throughout the medical field, training in this area is scarce, Dr. Pressel says. In nursing school and medical school, “for the most part, it’s zero,” he says.
“If you’re in a psychiatric facility, these events happen,” he adds. “And then you get a lot of enhanced training.” But, he notes, “I had no formal training until I became tasked with dealing with this.”
Since the program was implemented at Nemours, it seems to have worked.
“We have had many of these episodes that have been resolved by verbal de-escalation, as opposed to physical restraints or medication,” he says.
His hospital has also made other changes. The facility used to have multiple entrances and exits that were unsecured, and anybody could walk into any unit “with no challenge whatsoever.” Now, everyone entering has to pass hospital personnel. And, to get into a patient unit, visitors have to check in and be issued a photo ID. Also, in response to an incident in 2013, the hospital now has “constables” who are trained and licensed to carry firearms, Dr. Pressel says.
Above all, he notes, is personal safety. If you yourself are hurt, you won’t be able to help anyone else.
“That’s absolutely the first thing that people hear, the last thing that people hear, and it’s repeated over and over again,” he says.
Both Dr. Pressel and LaRose say that even with the drumbeat of high profile incidents, they haven’t heard from colleagues that health professionals are concerned about people losing interest in entering the field or are feeling burned out because of safety concerns. Being prepared is the key, and the level of preparedness varies by facility, LaRose says. The IAHSS provides security and healthcare safety guidelines at iahss.org.
“We recognize that we are in an occupation that tends to be on the receiving end of more aggression and more violence than the average worker,” LaRose says. “Therefore, how proactively does the organization or the institution take that knowledge and provide the tools and the training to the staff?
“What can we do as a team to increase our sense of security and safety and make this a great place to continue your career?”
Tom Collins is a freelance writer in South Florida.
Hospitalists Try To Reclaim Lead Role in Bedside Procedures

On his way to a recent conference, David Lichtman, PA, stopped to talk with medical residents at a nearby medical center about their experiences performing bedside procedures. “How many times have you guys done something that you knew you weren’t fully trained for but you didn’t want to say anything?” asked Lichtman, a hospitalist and director of the Johns Hopkins Central Procedure Service in Baltimore, Md. “At least once?”
Everyone raised a hand.
When Lichtman asked how many of the residents had ever spoken up and admitted being uncomfortable about doing a procedure, however, only about 20% raised their hands.
It’s one thing to struggle with a procedure like drawing blood. But a less-than-confident or unskilled provider who attempts more invasive procedures, such as a central line insertion or thoracentesis, can do major harm. And observers say confidence and competence levels, particularly among internal medicine residents, are heading in the wrong direction.
Two years ago, in fact, three hospitalists penned an article in The Hospitalist lamenting the “sharp decline” of HM proficiency in bedside procedures.1 Co-author Joshua Lenchus, DO, RPh, FACP, SFHM, associate director of the University of Miami-Jackson Memorial Hospital Center for Patient Safety and medical director of the hospital’s Procedure Service, says the trend is continuing for several reasons.
“One is internal medicine’s willingness to surrender these bedside procedures to others,” Dr. Lenchus says, perhaps due to time constraints, a lack of confidence, or a perception that it’s not cost effective for HM providers to take on the role. Several medical organizations have loosened their competency standards, and the default in many cases has been for interventional radiologists to perform the procedures instead.
Another reason may be more practical: Perhaps there just isn’t a need for all hospitalists to perform them. Many new hospitalist positions advertised through employment agencies, Dr. Lenchus says, do not require competency in bedside procedures.
“The question is, did that happen first and then we reacted to it as hospitalists, or did we stop doing them and employment agencies then modified their process to reflect that?” he says.
For hospitalists, perhaps the bigger question is this: Is there a need to address the decline?
For Lichtman, Dr. Lenchus, and many other leaders, the answer is an emphatic yes—an opportunity to carve out a niche of skilled and patient-focused bedside care and to demonstrate real value to hospitals.
“I think it makes perfect sense from a financial and throughput and healthcare system perspective,” he says. The talent, knowledge, and experience of interventional radiologists, Dr. Lenchus says, is far better spent on procedures that cannot be conducted at a patient’s bedside.
It’s also a matter of professional pride for hospitalists like Michelle Mourad, MD, associate professor of clinical medicine and director of quality improvement and patient safety for the division of hospital medicine at the University of California San Francisco.
“I derive a tremendous amount of enjoyment from working with my hands, from being able to provide my patients this service, from often giving them relief from excessive fluid buildup, and from being able to do these procedures at the bedside,” she says.
Reversing the recent slide of hospitalist involvement in procedures, however, may require more cohesive expectations, an emphasis on minimizing complications, identification of willing and able procedure champions, and comprehensive technology-aided training.
Confounding Expectations
Paracentesis, thoracentesis, arthrocentesis, lumbar puncture, and central line placement generally are considered “core” bedside procedures. Experts like Lichtman, however, say little agreement exists on the main procedures for which hospitalists should demonstrate competency.
“We don’t have any semblance of that,” he says. “The reality is that different groups have different beliefs, and different hospitals have different protocols that they follow.”
Pinning down a consistent list can be difficult, because HM providers can play different roles depending on the setting, says hospitalist Sally Wang, MD, FHM, director of procedure education at Brigham and Women’s Hospital and a clinical instructor at Harvard Medical School in Boston.
“You could be in an academic center. You could be in a community hospital. You could be in a rural setting where there’s no other access to anyone else doing these procedures, or you can have a robust interventional radiology service that will do all the procedures for you,” she says.
In 2007, the American Board of Internal Medicine (ABIM) revised its procedure-related requirements for board certification. Physicians still had to understand indications and contraindications, recognize the risks and benefits and manage complications, and interpret procedure results. But they no longer had to perform a minimum number to demonstrate competency. To assure “adequate knowledge and understanding” of each procedure, however, ABIM recommended that residents be active participants five or more times. The Accreditation Council for Graduate Medical Education (ACGME) followed suit in its program requirements for internal medicine.

Furman McDonald, MD, ABIM’s vice president of graduate medical education, says the board isn’t suggesting that procedure training should be limited to “book learning.” Rather, he says, the revision reflects the broad range of practice among internists and the recognition that not all of them will be conducting bedside procedures as part of their daily responsibilities. In that context, then, perhaps more rigorous training should be linked to the honing of a subspecialty practice that demands competency in specific procedures.
“It really is one of those areas where I don’t think one size fits all when it comes to training needs,” Dr. McDonald says, “and it’s also an area where practices vary so much depending on the size of the institution and availability of the people who can do the procedures.”
Nevertheless, observers say the retreat from an absolute numerical threshold—itself a debatable standard—set the tone for many hospitalist groups and has contributed to a lack of consistency in expectations.

“If someone is never going to be doing these procedures in their career, we can argue whether they should be trained,” says Jeffrey Barsuk, MD, MS, associate professor of medicine at Northwestern University Feinberg School of Medicine in Chicago. But evidence suggests that internal medicine residents are still performing many bedside procedures in academic hospitals, he says. A recent study of his, in fact, found that internal medicine and family medicine-trained clinicians frequently perform paracentesis procedures on complex inpatients.2 If they’re expected to be able to do these procedures safely on the first day of residency, he says, the lack of a requirement for hands-on competency is “ridiculous.”
Whatever the reasons, observers say, fewer well-trained hospitalists are performing bedside procedures on a routine basis.
“I think we’re seeing a trend away from an expectation that all residents are going to be comfortable and qualified to perform these procedures,” says Melissa Tukey, MD, MSc, a pulmonology critical care physician at Lahey Clinic in Burlington, Mass., who has studied procedural training and outcomes. “That is reflected in the literature showing that a lot of graduating residents, even before these changes were made, felt uncomfortable performing these procedures unsupervised, even later into their residency.”
By changing their requirements, however, she says the ABIM and ACGME have effectively accelerated the de-emphasis on procedures among internal medicine generalists and put the onus on individual hospitals to ensure that they have qualified and capable staff to perform them. As a result, some medical institutions are opting to train a smaller subset of internal medicine physicians, while others are shifting the workload to other subspecialists.
Lichtman says he’s frustrated that many medical boards and programs continue to link competency in bedside procedures to arbitrary numbers that seem to come out of “thin air.” While studies suggest that practitioners aren’t experienced until they’ve performed 50 central line insertions, for example, many guidelines suggest that they can perform the procedure on their own after only five supervised insertions. “My thought is, you need as many as it takes for you, as an individual, to become good,” Lichtman says. “That may be five. It may be 10. It may be 100.”

Virtually all of us started doing this because we were asked to do cases that couldn’t be done by others because we had imaging—usually ultrasound guidance—and that yielded superior results. —Robert L. Vogelzang, MD, FSIR, professor of radiology, Northwestern University Medical School, Chicago, and past president, Society for Interventional Radiology
Complicating Factors
Central venous line placement has been a lightning rod in the debate over training, standardization, and staffing roles for bedside procedures, Lichtman says, due in large part to the seriousness of a central line-associated bloodstream infection, or CLABSI. In 2008, the Centers for Medicare and Medicaid Services deemed the preventable and life-threatening infection a “never” event and stopped reimbursing hospitals for any CLABSI-related treatment costs.
“If I’m trying to stick a needle in your knee to drain fluid out, there’s a really low risk of something catastrophically bad happening,” he says. But patients can die from faulty central line insertion and management. Stick the needle in the wrong place, and you could cause unnecessary bleeding, a stroke, or complications ranging from a fistula to a hemopneumothorax.
If discomfort and concern over potential complications are contributing to a decline in hospitalist-led bedside procedures, many experts agree that the role may not always make economic or practical sense either. “It doesn’t make sense to train all hospitalists to do all of these procedures,” Dr. Lenchus says. “If you’re at a small community hospital where the procedures are done in the ICU and you have no ICU coverage, then, frankly, that skill’s going to be lost on you, because you’re never going to do it in the real world in the course of your normal, everyday activities.”
Even at bigger institutions, he says, it makes sense to identify and train a core group of providers who have both the skill and the desire to perform procedures on a consistent basis. “It’s a technical skill. Not all of us could be concert pianists, even if we were trained,” Dr. Lenchus says.
Dr. Wang says it will be particularly important for hospitalist groups to identify a subset of “procedure champions” who enjoy doing the procedures, are good at it, have been properly trained, and can maintain their competency with regular practice.
Familiar Territory
At first glance, the significant time commitment and lackluster reimbursement of many bedside procedures would seem to do little to up the incentive for busy hospitalists. “If they have to stop and take two hours to do a procedure that 1) they don’t feel comfortable with and 2) they get very little reimbursement for, why not just put an order in and have interventional radiologists whisk them off and do these procedures?” Dr. Wang says.
Robert L. Vogelzang, MD, FSIR, professor of radiology at Northwestern University Medical School in Chicago and a past president of the Society of Interventional Radiology, says radiologists are regularly called upon to perform bedside procedures because of their imaging expertise.
“Virtually all of us started doing this because we were asked to do cases that couldn’t be done by others because we had imaging—usually ultrasound guidance—and that yielded superior results,” he says.
Dr. Vogelzang says he’s “specialty-agnostic” about who should perform the procedures, as long as they’re done by well-trained providers who use imaging guidance and do them on a regular basis. Hospitalists could defer to radiologists if they’re uncomfortable with any procedure, he says, while teams of physician assistants and nurse practitioners might offer another cost-effective solution. Ultimately, the question over who performs minor bedside procedures “is going to reach a solution that involves dedicated teams in some fashion, because as a patient, you don’t want someone who does five a year,” he says. “Patient care is improved by trained people who do enough of them to do it consistently.”
So why not train designated hospitalists as proceduralists? Dr. Lenchus and other experts say naysayers who believe hospitalists should give up the role aren’t fully considering the impact of a well-trained individual or team. “It’s not just the money that you bring in—it’s the money that you don’t spend,” he says. An initial hospitalist consultation, for example, may determine that a procedure isn’t needed at all for some patients. Perhaps more importantly, a well-trained provider can reduce or eliminate costly complications, such as CLABSIs.

Dr. Wang agrees, stressing that the profession still has the opportunity to build a niche in providing care that decreases overall hospital costs. Instead of regularly sending patients to the interventional radiology department, she says, hospitalist-performed bedside procedures can allow radiologists to focus on more complex cases.
A hospitalist, she says, can generate additional value by eliminating the need to put in a separate order, provide patient transportation, or spend more time fitting the patient into another specialist’s schedule—potentially extending that patient’s length of stay. The economic case for hospitalist-led procedures could improve even more under a bundled payment structure, Dr. Wang says.
“I see a future here if the accountable care organizations are infiltrated through the United States,” she says.
Future involvement of hospitalists in bedside procedures also could depend on the ability of programs to deliver top-notch teaching and training options. At Harvard Medical School, Dr. Wang regularly trains internal medicine residents, fellows, and even some attending physicians with a “robust” curriculum that includes hands-on practice with ultrasound in a simulation center and one-on-one testing on patients. Since instituting the training program a few years ago, she says, procedure-related infection rates have dropped to zero. Within the hospital’s ICUs, Dr. Wang says, complication rates have dropped as well.
Among the comments she now regularly hears: “Oh my gosh. I can’t believe we used to do this without a training program.”
Bryn Nelson is a freelance medical writer in Seattle and frequent contributor to The Hospitalist.
References
- Chang W, Lenchus J, Barsuk J. A lost art? The Hospitalist. 2012;16(6):1,28,30,32.
- Barsuk JH, Feinglass J, Kozmic SE, Hohmann SF, Ganger D, Wayne DB. Specialties performing paracentesis procedures at university hospitals: implications for training and certification. J Hosp Med. 2014;9(3):162-168.
- Mourad M, Auerbach AD, Maselli J, Sliwka D. Patient satisfaction with a hospitalist procedure service: Is bedside procedure teaching reassuring to patients? J Hosp Med. 2011;6(4):219-224.
- Tukey MH, Wiener RS. The impact of a medical procedure service on patient safety, procedure quality and resident training opportunities. J Gen Intern Med. 2013;29(3):485-490.
- Barsuk JH, McGaghie WC, Cohen ER, O’Leary KJ, Wayne DB. Simulation-based mastery learning reduces complications during central venous catheter insertion in a medical intensive care unit. Crit Care Med. 2009;37(10):2697-2701.
On his way to a recent conference, David Lichtman, PA, stopped to talk with medical residents at a nearby medical center about their experiences performing bedside procedures. “How many times have you guys done something that you knew you weren’t fully trained for but you didn’t want to say anything?” asked Lichtman, a hospitalist and director of the Johns Hopkins Central Procedure Service in Baltimore, Md. “At least once?”
Everyone raised a hand.
When Lichtman asked how many of the residents had ever spoken up and admitted being uncomfortable about doing a procedure, however, only about 20% raised their hands.
It’s one thing to struggle with a procedure like drawing blood. But a less-than-confident or unskilled provider who attempts more invasive procedures, such as a central line insertion or thoracentesis, can do major harm. And observers say confidence and competence levels, particularly among internal medicine residents, are heading in the wrong direction.
Two years ago, in fact, three hospitalists penned an article in The Hospitalist lamenting the “sharp decline” of HM proficiency in bedside procedures.1 Co-author Joshua Lenchus, DO, RPh, FACP, SFHM, associate director of the University of Miami-Jackson Memorial Hospital Center for Patient Safety and medical director of the hospital’s Procedure Service, says the trend is continuing for several reasons.
“One is internal medicine’s willingness to surrender these bedside procedures to others,” Dr. Lenchus says, perhaps due to time constraints, a lack of confidence, or a perception that it’s not cost effective for HM providers to take on the role. Several medical organizations have loosened their competency standards, and the default in many cases has been for interventional radiologists to perform the procedures instead.
Another reason may be more practical: Perhaps there just isn’t a need for all hospitalists to perform them. Many new hospitalist positions advertised through employment agencies, Dr. Lenchus says, do not require competency in bedside procedures.
“The question is, did that happen first and then we reacted to it as hospitalists, or did we stop doing them and employment agencies then modified their process to reflect that?” he says.
For hospitalists, perhaps the bigger question is this: Is there a need to address the decline?
For Lichtman, Dr. Lenchus, and many other leaders, the answer is an emphatic yes—an opportunity to carve out a niche of skilled and patient-focused bedside care and to demonstrate real value to hospitals.
“I think it makes perfect sense from a financial and throughput and healthcare system perspective,” he says. The talent, knowledge, and experience of interventional radiologists, Dr. Lenchus says, is far better spent on procedures that cannot be conducted at a patient’s bedside.
It’s also a matter of professional pride for hospitalists like Michelle Mourad, MD, associate professor of clinical medicine and director of quality improvement and patient safety for the division of hospital medicine at the University of California San Francisco.
“I derive a tremendous amount of enjoyment from working with my hands, from being able to provide my patients this service, from often giving them relief from excessive fluid buildup, and from being able to do these procedures at the bedside,” she says.
Reversing the recent slide of hospitalist involvement in procedures, however, may require more cohesive expectations, an emphasis on minimizing complications, identification of willing and able procedure champions, and comprehensive technology-aided training.
Confounding Expectations
Paracentesis, thoracentesis, arthrocentesis, lumbar puncture, and central line placement generally are considered “core” bedside procedures. Experts like Lichtman, however, say little agreement exists on the main procedures for which hospitalists should demonstrate competency.
“We don’t have any semblance of that,” he says. “The reality is that different groups have different beliefs, and different hospitals have different protocols that they follow.”
Pinning down a consistent list can be difficult, because HM providers can play different roles depending on the setting, says hospitalist Sally Wang, MD, FHM, director of procedure education at Brigham and Women’s Hospital and a clinical instructor at Harvard Medical School in Boston.
“You could be in an academic center. You could be in a community hospital. You could be in a rural setting where there’s no other access to anyone else doing these procedures, or you can have a robust interventional radiology service that will do all the procedures for you,” she says.
In 2007, the American Board of Internal Medicine (ABIM) revised its procedure-related requirements for board certification. Physicians still had to understand indications and contraindications, recognize the risks and benefits and manage complications, and interpret procedure results. But they no longer had to perform a minimum number to demonstrate competency. To assure “adequate knowledge and understanding” of each procedure, however, ABIM recommended that residents be active participants five or more times. The Accreditation Council for Graduate Medical Education (ACGME) followed suit in its program requirements for internal medicine.
Furman McDonald, MD, ABIM’s vice president of graduate medical education, says the board isn’t suggesting that procedure training should be limited to “book learning.” Rather, he says, the revision reflects the broad range of practice among internists and the recognition that not all of them will be conducting bedside procedures as part of their daily responsibilities. In that context, then, perhaps more rigorous training should be linked to the honing of a subspecialty practice that demands competency in specific procedures.
“It really is one of those areas where I don’t think one size fits all when it comes to training needs,” Dr. McDonald says, “and it’s also an area where practices vary so much depending on the size of the institution and availability of the people who can do the procedures.”
Nevertheless, observers say the retreat from an absolute numerical threshold—itself a debatable standard—set the tone for many hospitalist groups and has contributed to a lack of consistency in expectations.
“If someone is never going to be doing these procedures in their career, we can argue whether they should be trained,” says Jeffrey Barsuk, MD, MS, associate professor of medicine at Northwestern University Feinberg School of Medicine in Chicago. But evidence suggests that internal medicine residents are still performing many bedside procedures in academic hospitals, he says. A recent study of his, in fact, found that internal medicine and family medicine-trained clinicians frequently perform paracentesis procedures on complex inpatients.2 If they’re expected to be able to do these procedures safely on the first day of residency, he says, the lack of a requirement for hands-on competency is “ridiculous.”
Whatever the reasons, observers say, fewer well-trained hospitalists are performing bedside procedures on a routine basis.
“I think we’re seeing a trend away from an expectation that all residents are going to be comfortable and qualified to perform these procedures,” says Melissa Tukey, MD, MSc, a pulmonology critical care physician at Lahey Clinic in Burlington, Mass., who has studied procedural training and outcomes. “That is reflected in the literature showing that a lot of graduating residents, even before these changes were made, felt uncomfortable performing these procedures unsupervised, even later into their residency.”
By changing their requirements, however, she says the ABIM and ACGME have effectively accelerated the de-emphasis on procedures among internal medicine generalists and put the onus on individual hospitals to ensure that they have qualified and capable staff to perform them. As a result, some medical institutions are opting to train a smaller subset of internal medicine physicians, while others are shifting the workload to other subspecialists.
Lichtman says he’s frustrated that many medical boards and programs continue to link competency in bedside procedures to arbitrary numbers that seem to come out of “thin air.” While studies suggest that practitioners aren’t experienced until they’ve performed 50 central line insertions, for example, many guidelines suggest that they can perform the procedure on their own after only five supervised insertions. “My thought is, you need as many as it takes for you, as an individual, to become good,” Lichtman says. “That may be five. It may be 10. It may be 100.”
Virtually all of us started doing this because we were asked to do cases that couldn’t be done by others because we had imaging—usually ultrasound guidance—and that yielded superior results. —Robert L. Vogelzang, MD, FSIR, professor of radiology, Northwestern University Medical School, Chicago, and past president, Society for Interventional Radiology
Complicating Factors
Central venous line placement has been a lightning rod in the debate over training, standardization, and staffing roles for bedside procedures, Lichtman says, due in large part to the seriousness of a central line-associated bloodstream infection, or CLABSI. In 2008, the Centers for Medicare and Medicaid Services deemed the preventable and life-threatening infection a “never” event and stopped reimbursing hospitals for any CLABSI-related treatment costs.
“If I’m trying to stick a needle in your knee to drain fluid out, there’s a really low risk of something catastrophically bad happening,” he says. But patients can die from faulty central line insertion and management. Stick the needle in the wrong place, and you could cause unnecessary bleeding, a stroke, or complications ranging from a fistula to a hemopneumothorax.
If discomfort and concern over potential complications are contributing to a decline in hospitalist-led bedside procedures, many experts agree that the role may not always make economic or practical sense either. “It doesn’t make sense to train all hospitalists to do all of these procedures,” Dr. Lenchus says. “If you’re at a small community hospital where the procedures are done in the ICU and you have no ICU coverage, then, frankly, that skill’s going to be lost on you, because you’re never going to do it in the real world in the course of your normal, everyday activities.”
Even at bigger institutions, he says, it makes sense to identify and train a core group of providers who have both the skill and the desire to perform procedures on a consistent basis. “It’s a technical skill. Not all of us could be concert pianists, even if we were trained,” Dr. Lenchus says.
Dr. Wang says it will be particularly important for hospitalist groups to identify a subset of “procedure champions” who enjoy doing the procedures, are good at it, have been properly trained, and can maintain their competency with regular practice.
Familiar Territory
At first glance, the significant time commitment and lackluster reimbursement of many bedside procedures would seem to do little to up the incentive for busy hospitalists. “If they have to stop and take two hours to do a procedure that 1) they don’t feel comfortable with and 2) they get very little reimbursement for, why not just put an order in and have interventional radiologists whisk them off and do these procedures?” Dr. Wang says.
Robert L. Vogelzang, MD, FSIR, professor of radiology at Northwestern University Medical School in Chicago and a past president of the Society of Interventional Radiology, says radiologists are regularly called upon to perform bedside procedures because of their imaging expertise.
“Virtually all of us started doing this because we were asked to do cases that couldn’t be done by others because we had imaging—usually ultrasound guidance—and that yielded superior results,” he says.
Dr. Vogelzang says he’s “specialty-agnostic” about who should perform the procedures, as long as they’re done by well-trained providers who use imaging guidance and do them on a regular basis. Hospitalists could defer to radiologists if they’re uncomfortable with any procedure, he says, while teams of physician assistants and nurse practitioners might offer another cost-effective solution. Ultimately, the question over who performs minor bedside procedures “is going to reach a solution that involves dedicated teams in some fashion, because as a patient, you don’t want someone who does five a year,” he says. “Patient care is improved by trained people who do enough of them to do it consistently.”
So why not train designated hospitalists as proceduralists? Dr. Lenchus and other experts say naysayers who believe hospitalists should give up the role aren’t fully considering the impact of a well-trained individual or team. “It’s not just the money that you bring in—it’s the money that you don’t spend,” he says. An initial hospitalist consultation, for example, may determine that a procedure isn’t needed at all for some patients. Perhaps more importantly, a well-trained provider can reduce or eliminate costly complications, such as CLABSIs.
Dr. Wang agrees, stressing that the profession still has the opportunity to build a niche in providing care that decreases overall hospital costs. Instead of regularly sending patients to the interventional radiology department, she says, hospitalist-performed bedside procedures can allow radiologists to focus on more complex cases.
A hospitalist, she says, can generate additional value by eliminating the need to put in a separate order, provide patient transportation, or spend more time fitting the patient into another specialist’s schedule—potentially extending that patient’s length of stay. The economic case for hospitalist-led procedures could improve even more under a bundled payment structure, Dr. Wang says.
“I see a future here if the accountable care organizations are infiltrated through the United States,” she says.
Future involvement of hospitalists in bedside procedures also could depend on the ability of programs to deliver top-notch teaching and training options. At Harvard Medical School, Dr. Wang regularly trains internal medicine residents, fellows, and even some attending physicians with a “robust” curriculum that includes hands-on practice with ultrasound in a simulation center and one-on-one testing on patients. Since instituting the training program a few years ago, she says, procedure-related infection rates have dropped to zero. Within the hospital’s ICUs, Dr. Wang says, complication rates have dropped as well.
Among the comments she now regularly hears: “Oh my gosh. I can’t believe we used to do this without a training program.”
Bryn Nelson is a freelance medical writer in Seattle and frequent contributor to The Hospitalist.
References
- Chang W, Lenchus J, Barsuk J. A lost art? The Hospitalist. 2012;16(6):1,28,30,32.
- Barsuk JH, Feinglass J, Kozmic SE, Hohmann SF, Ganger D, Wayne DB. Specialties performing paracentesis procedures at university hospitals: implications for training and certification. J Hosp Med. 2014;9(3):162-168.
- Mourad M, Auerbach AD, Maselli J, Sliwka D. Patient satisfaction with a hospitalist procedure service: Is bedside procedure teaching reassuring to patients? J Hosp Med. 2011;6(4):219-224.
- Tukey MH, Wiener RS. The impact of a medical procedure service on patient safety, procedure quality and resident training opportunities. J Gen Intern Med. 2013;29(3):485-490.
- Barsuk JH, McGaghie WC, Cohen ER, O’Leary KJ, Wayne DB. Simulation-based mastery learning reduces complications during central venous catheter insertion in a medical intensive care unit. Crit Care Med. 2009;37(10):2697-2701.
Infectious Diseases Society of America 2014 Practice Guidelines To Diagnose, Manage Skin, Soft Tissue Infections
Background
Surveillance studies in the U.S. have shown an increase in the number of hospitalizations for skin and soft tissue infections (SSTIs) by 29% from 2000 to 2004.1 Moreover, recent studies on the inpatient management of SSTIs have shown significant deviation from recommended therapy, with the majority of patients receiving excessively long treatment courses or unnecessarily broad antimicrobial coverage.2,3
With the ever-increasing threat of antibiotic resistance and rising rates of Clostridium difficile colitis, this update provides clinicians with a set of recommendations to apply antibiotic stewardship while effectively managing SSTIs.4
Guideline Update
In June 2014, the Infectious Diseases Society of America (IDSA) published an update to its 2005 guidelines for the treatment of SSTIs.5 For purulent SSTIs (cutaneous abscesses, furuncles, carbuncles, and inflamed epidermoid cysts), incision and drainage is primary therapy. The use of systemic antimicrobial therapy is unnecessary for mild cases, even those caused by methicillin-resistant Staphylococcus aureus (MRSA). The use of empiric adjunctive antibiotics should be reserved for those with impaired host defenses or signs of systemic inflammatory response syndrome (SIRS). The recommended antibiotics in such patients have anti-MRSA activity and include trimethoprim-sulfamethoxazole or doxycycline for moderate infections and vancomycin, daptomycin, linezolid, telavancin, or ceftaroline for severe infections. Antibiotics should subsequently be adjusted based on susceptibilities of the organism cultured from purulent drainage.
Nonpurulent cellulitis without SIRS may be treated on an outpatient basis with an oral antibiotic targeted against streptococci, including penicillin VK, cephalosporins, dicloxacillin, or clindamycin. Cellulitis with SIRS may be treated with an intravenous antibiotic with methicillin-susceptible Staphylococcus aureus (MSSA) activity, including penicillin, ceftriaxone, cefazolin, or clindamycin.
The use of antibiotics with MRSA activity should be reserved for those at highest risk, such as patients with impaired immunity or signs of a deep space infection. Cultures of blood, cutaneous biopsies, or swabs are not routinely recommended; however, prompt surgical consultation is recommended for patients suspected of having a necrotizing infection or gangrene.
The recommended duration of antimicrobial therapy for uncomplicated cellulitis is five days, and therapy should only be extended in those who have not shown clinical improvement. Elevation of the affected area and the use of systemic corticosteroids in nondiabetic adults may lead to a more rapid resolution of cellulitis, although the clinician must ensure that a deeper space infection is not present prior to initiating steroids.
Preventing the recurrence of cellulitis is an integral part of routine patient care and includes the treatment of interdigital toe space fissuring, scaling, and maceration, which may act as a reservoir for streptococci. Likewise, treatment of predisposing conditions such as eczema, venous insufficiency, and lymphedema may reduce the recurrence of infection. In patients who have three to four episodes of cellulitis despite attempts to treat or control predisposing risk factors, the use of prophylactic antibiotics with erythromycin or penicillin may be considered.
For patients with an SSTI during the first episode of febrile neutropenia, hospitalization and empiric therapy with vancomycin and an antipseudomonal beta-lactam are recommended. Antibiotics should subsequently be adjusted based on the antimicrobial susceptibilities of isolated organisms.
For patients with SSTIs in the presence of persistent or recurrent febrile neutropenia, empirically adding antifungal therapy is recommended. Such patients should be aggressively evaluated with blood cultures and biopsy with tissue culture of the skin lesions. The recommended duration of therapy is seven to 14 days for most bacterial SSTIs in the immunocompromised patient.
Analysis
The updated SSTI guidelines provide hospitalists with a practical algorithm for the management of SSTIs, focusing on the presence or absence of purulence, systemic signs of infection, and host immune status to guide therapy. Whereas the 2005 guidelines provided clinicians with a list of recommended antibiotics based on spectrum of activity, the updated guidelines provide a short list of empiric antibiotics based on the type and severity of infection.6
The list of recommended antibiotics with MRSA activity has been updated to include ceftaroline and telavancin. Of note, since these guidelines have been published, three new antibiotics with MRSA activity (tedizolid, oritavancin, and dalbavancin) have been approved by the FDA for the treatment of SSTIs, although their specific role in routine clinical practice is not yet determined.
The treatment algorithm for surgical site infections remains largely unchanged, which reinforces the concept that fever in the first 48 hours is unlikely to represent infection unless accompanied by purulent wound drainage with a positive culture. Likewise, the guidelines recommend risk-stratifying patients with fever and a suspected wound infection more than four days after surgery by the presence or absence of systemic infection or evidence of surrounding cellulitis.
A comprehensive guide to the management of specific pathogens or conditions, such as tularemia, cutaneous anthrax, and bite wounds, is largely unchanged, although the update now includes focused summary statements to navigate through these recommendations more easily.
The updated guidelines provide a more robust yet focused set of recommendations for the diagnosis and treatment of bacterial, fungal, and viral skin infections in immunocompromised hosts, especially those with neutropenia.
HM Takeaways
The 2014 update to the IDSA practice guidelines for SSTIs contains a chart to help clinicians diagnose and manage common skin infections more effectively. The guidelines’ algorithm stratifies the severity of illness according to whether or not the patient has SIRS or is immunocompromised. The authors recommend against the use of antibiotics for mild purulent SSTIs and reserve the use of anti-MRSA therapy mainly for patients with moderate purulent SSTIs, those with severe SSTIs, or those at high risk for MRSA. Likewise, the use of broad spectrum gram-negative coverage is not recommended in most common, uncomplicated SSTIs and should be reserved for special populations, such as those with immune compromise.
The guidelines strongly recommend a short, five-day course of therapy for uncomplicated cellulitis. Longer treatment courses (i.e., 10 days) are unnecessary and do not improve efficacy for those exhibiting clinical improvement by day five.
Drs. Yogo and Saveli work in the division of infectious disease in the department of medicine at the University of Colorado School of Medicine in Aurora.
References
- Edelsberg J, Taneja C, Zervos M, et al. Trends in the US hospital admissions for skin and soft tissue infections. Emerg Infect Dis. 2009;15(9):1516-1518.
- Jenkins TC, Sabel AL, Sacrone EE, Price CS, Mehler PS, Burman WJ. Skin and soft-tissue infections requiring hospitalization at an academic medical center: opportunities for antimicrobial stewardship. Clin Infect Dis. 2010;51(8):895-903.
- Jenkins TC, Knepper BC, Moore SJ, et al. Antibiotic prescribing practices in a multicenter cohort of patients hospitalized for acute bacterial skin and skin structure infection. Infect Control Hosp Epidemiol. 2014;35(10):1241-1250.
- U.S. Department of Health and Human Services. Centers for Disease Control and Prevention. Antibiotic resistance threats in the United States, 2013. Available at: http://www.cdc.gov/drugresistance/threat-report-2013/pdf/ar-threats-2013-508.pdf. Accessed February 8, 2015.
- Stevens DL, Bisno AL, Chambers HF, et al. Practice guidelines for the diagnosis and management of skin and soft tissue infections: 2014 update by the Infectious Diseases Society of America. Clin Infect Dis. 2014;59(2):e10-52. Stevens DL, Bisno AL, Chambers HF, et al.
- Practice guidelines for the diagnosis and management of skin and soft-tissue infections. Clin Infect Dis. 2005;41(10):1373-1406.
Vivek Murthy, Hospitalist and America’s Top Doctor
On Dec. 15, 2014, 37-year-old hospitalist and internist Vivek Murthy, MD, MBA, was sworn in as the 19th surgeon general of the United States. He is the youngest person to hold the post and the first of Indian-American descent.

Dr. Murthy said in a February 26 conference call that, as the nation’s highest physician, he plans to focus on the challenges of obesity and chronic illness—especially diabetes and cardiovascular disease—as well as advocate for expanded health coverage, modernize communications from the surgeon general’s office, and work with local communities to improve the health of all Americans.
He also highlighted the ways in which his work as a hospitalist will inform his new role.
“Being a hospitalist has given me a wonderful view into the challenges people face during moments of acute illness,” said Dr. Murthy, who practices as a hospitalist at Brigham and Women’s Hospital in Boston. “I’ve had the opportunity to work with patients and their families during moments of crisis, and I have a deep appreciation for how important it is to not only have healthcare and a healthcare system that takes care of people, but also how hard we need to work in preventing illness in the first place.”
Dr. Murthy recently completed part of a nationwide listening tour, visiting communities around the country to hear about the issues they face.
“In every place we visited, there was great concern about obesity, chronic disease, mental illness, substance abuse, and vaccination rates, especially with the current outbreak of measles,” Dr. Murthy said.
As a result, he plans to focus heavily on community health, working on three approaches: taking care of people where they are, equipping children with the tools and education they need to lead healthy lives, and building cross-sector collaborations to address the social aspects of health and disease.
Dr. Murthy has experience in this arena, as co-founder of a community health project in India called Swasthya (Sanskrit for health and well-being), where women were enlisted as health providers and educators.
Changes may also be in store for medical training; Dr. Murthy says he hopes to better integrate primary care and public health, areas that he said have “traditionally been more separate than they need to be.”
“Physicians are an important part of improving public health for the country,” Dr. Murthy said. “One of the first [priorities] is to get the message out to the public about the importance of vaccinations, particularly measles.”
Many parents, he said, would benefit from hearing from their doctors that vaccines are safe, effective, and one of the best ways to protect their children’s health. Most are not strongly opposed to vaccinations; they just lack the right information.
As surgeon general, Dr. Murthy serves as the country’s top public health spokesperson, overseeing the 6,700-member U.S. Public Health Service Commissioned Corps.
The time he spent in his parents’ primary care office in his hometown of Miami inspired Dr. Murthy to pursue medicine. He earned his MBA and MD from Yale and already founded a drug development software company, TrialNetworks (now DrugDev TrialNetworks), as well as two nonprofits, Doctors for America (formerly Doctors for Obama) and VISIONS Worldwide, Inc., which is dedicated to HIV and AIDS education.
In Boston, working as a hospitalist both before and after major health reform efforts in the state, Dr. Murthy saw the difference that access to health insurance made in the lives of his patients. Now, as the country’s top doctor, he wants to do “everything possible” to ensure a high-quality, lower-cost healthcare system in the U.S.
His mission is especially relevant this year, as the Supreme Court takes on another challenge to the Affordable Care Act in King v. Burwell.
“I am concerned that patients may be in a situation, and citizens may be in a situation, where they lose coverage and access to healthcare in the coming months or years, depending on the ruling,” he said. “I want to emphasize this kind of coverage is essential to patients.”
Kelly April Tyrrell is a freelance writer in Madison, Wis.
On Dec. 15, 2014, 37-year-old hospitalist and internist Vivek Murthy, MD, MBA, was sworn in as the 19th surgeon general of the United States. He is the youngest person to hold the post and the first of Indian-American descent.
Dr. Murthy said in a February 26 conference call that, as the nation’s highest physician, he plans to focus on the challenges of obesity and chronic illness—especially diabetes and cardiovascular disease—as well as advocate for expanded health coverage, modernize communications from the surgeon general’s office, and work with local communities to improve the health of all Americans.
He also highlighted the ways in which his work as a hospitalist will inform his new role.
“Being a hospitalist has given me a wonderful view into the challenges people face during moments of acute illness,” said Dr. Murthy, who practices as a hospitalist at Brigham and Women’s Hospital in Boston. “I’ve had the opportunity to work with patients and their families during moments of crisis, and I have a deep appreciation for how important it is to not only have healthcare and a healthcare system that takes care of people, but also how hard we need to work in preventing illness in the first place.”
Dr. Murthy recently completed part of a nationwide listening tour, visiting communities around the country to hear about the issues they face.
“In every place we visited, there was great concern about obesity, chronic disease, mental illness, substance abuse, and vaccination rates, especially with the current outbreak of measles,” Dr. Murthy said.
As a result, he plans to focus heavily on community health, working on three approaches: taking care of people where they are, equipping children with the tools and education they need to lead healthy lives, and building cross-sector collaborations to address the social aspects of health and disease.
Dr. Murthy has experience in this arena, as co-founder of a community health project in India called Swasthya (Sanskrit for health and well-being), where women were enlisted as health providers and educators.
Changes may also be in store for medical training; Dr. Murthy says he hopes to better integrate primary care and public health, areas that he said have “traditionally been more separate than they need to be.”
“Physicians are an important part of improving public health for the country,” Dr. Murthy said. “One of the first [priorities] is to get the message out to the public about the importance of vaccinations, particularly measles.”
Many parents, he said, would benefit from hearing from their doctors that vaccines are safe, effective, and one of the best ways to protect their children’s health. Most are not strongly opposed to vaccinations; they just lack the right information.
As surgeon general, Dr. Murthy serves as the country’s top public health spokesperson, overseeing the 6,700-member U.S. Public Health Service Commissioned Corps.
The time he spent in his parents’ primary care office in his hometown of Miami inspired Dr. Murthy to pursue medicine. He earned his MBA and MD from Yale and already founded a drug development software company, TrialNetworks (now DrugDev TrialNetworks), as well as two nonprofits, Doctors for America (formerly Doctors for Obama) and VISIONS Worldwide, Inc., which is dedicated to HIV and AIDS education.
In Boston, working as a hospitalist both before and after major health reform efforts in the state, Dr. Murthy saw the difference that access to health insurance made in the lives of his patients. Now, as the country’s top doctor, he wants to do “everything possible” to ensure a high-quality, lower-cost healthcare system in the U.S.
His mission is especially relevant this year, as the Supreme Court takes on another challenge to the Affordable Care Act in King v. Burwell.
“I am concerned that patients may be in a situation, and citizens may be in a situation, where they lose coverage and access to healthcare in the coming months or years, depending on the ruling,” he said. “I want to emphasize this kind of coverage is essential to patients.”
Kelly April Tyrrell is a freelance writer in Madison, Wis.
Too many blood tests can lead to anemia, transfusions
Photo by Juan D. Alfonso
A single-center study has shown that laboratory testing among patients undergoing cardiac surgery can lead to excessive bloodletting.
This can increase the risk of hospital-acquired anemia and, therefore, the need for blood transfusions.
Among cardiac surgery patients, transfusions have been associated with an increased risk of infection, more time spent on a ventilator, and a higher likelihood of death, said Colleen G. Koch, MD, of the Cleveland Clinic in Ohio.
She and her colleagues conducted this research and published their findings in The Annals of Thoracic Surgery.
The researchers recorded every laboratory test performed on 1894 patients who underwent cardiac surgery at the Cleveland Clinic from January to June 2012.
The team evaluated the number and type of blood tests performed from the time patients met their surgeons until hospital discharge, tallying up the total amount of blood taken from each patient.
‘Astonishing’ amount of blood drawn
There were 221,498 laboratory tests performed during the study period, or an average of 115 tests per patient. The most common tests were blood gas analyses (n=88,068), coagulation tests (n=39,535), complete blood counts (n=30,421), and metabolic panels (n=29,374).
The cumulative median phlebotomy volume for the entire hospital stay was 454 mL per patient. Patients tended to have more blood drawn if they were in the intensive care unit as compared to other hospital floors, with median phlebotomy volumes of 332 mL and 118 mL, respectively.
“We were astonished by the amount of blood taken from our patients for laboratory testing,” Dr Koch said. “Total phlebotomy volumes approached 1 to 2 units of red blood cells, which is roughly equivalent to 1 to 2 cans of soda.”
More complex procedures were associated with higher overall phlebotomy volume. Patients undergoing combined coronary artery bypass grafting surgery (CABG) and valve procedures had the highest median cumulative phlebotomy volume. The median volume was 653 mL for CABG-valve procedures, 448 mL for CABG alone, and 338 mL for valve procedures alone.
Transfusion need
The researchers also found that an increase in cumulative phlebotomy volume was linked to an increased need for blood products. Similarly, the longer a patient was hospitalized, the more blood was taken, which increased the subsequent need for a transfusion.
Overall, 49% of patients received red blood cells (RBCs), 25% fresh-frozen plasma (FFP), 33% platelets, and 15% cryoprecipitate.
Patients in the lowest phlebotomy volume quartile (0%-25th%) were much less likely to receive transfusions than patients in the highest quartile (75th% to 100th%).
In the lowest quartile, 2% of patients received cryoprecipitate, 3% FFP, 7% platelets, and 12% RBCs. In the highest quartile, 31% of patients received cryoprecipitate, 54% FFP, 61% platelets, and 87% RBCs.
So to reduce the use of transfusions, we must curb the use of blood tests, Dr Koch said, noting that patients can help.
“Patients should feel empowered to ask their doctors whether a specific test is necessary—’What is the indication for the test?,’ ‘Will it change my care?,’ and ‘If so, do you need to do it every day?,’” Dr Koch said.
“They should inquire whether smaller-volume test tubes could be used for the tests that are deemed necessary. Every attempt should be made to conserve the patient’s own blood. Every drop of blood counts.”
In an invited commentary, Milo Engoren, MD, of the University of Michigan in Ann Arbor, emphasized the importance of reducing blood loss to decrease possible complications during surgery.
“We make efforts to minimize intraoperative blood loss,” he noted. “Now, we need to make similar efforts postoperatively. While some may argue that transfusion itself is not harmful, but only a marker of a sicker patient, most would agree that avoiding anemia and transfusion is the best course for patients.” ![]()
FDA grants T-cell therapy breakthrough designation
Photo by Charles Haymond
The US Food and Drug Administration (FDA) has granted breakthrough designation to a therapy consisting of cytotoxic T lymphocytes activated against Epstein-Barr virus (EBV-CTLs).
The treatment is intended for use in patients with rituximab-refractory, EBV-associated lymphoproliferative disease (EBV-LPD), which occurs after allogeneic hematopoietic stem cell transplant.
EBV-CTLs consist of T cells collected from third-party donors.
The T cells are exposed to antigens, expanded, characterized, and stored for future use in an appropriate, partially HLA-matched patient.
In the context of EBV-LPD, the EBV-CTLs are able to target and destroy cancer cells expressing EBV.
“The receipt of breakthrough therapy designation brings us one step closer to our ultimate goal of making EBV-CTL available to all patients with EBV-LPD, a serious and life-threatening condition with limited treatment options,” said Richard O’Reilly, MD, Chair of the Department of Pediatrics and Chief of the Pediatric Bone Marrow Transplant Service at Memorial Sloan Kettering Cancer Center (MSKCC) in New York, New York.
MSKCC is developing EBV-CTLs in conjunction with Atara Biotherapeutics, Inc.
Breakthrough therapy designation for EBV-CTLs was based on data from 2 clinical trials of EBV-CTLs conducted at MSKCC.
Data from these studies have been submitted for presentation at an upcoming medical conference. Results of a phase 1/2 study of EBV-CTLs were previously presented at the APHON 37th Annual Conference and Exhibit in 2013.
The FDA’s breakthrough therapy designation is designed to expedite the development and review of new drugs for the treatment of serious or life-threatening conditions.
To qualify for this designation, a drug must show credible evidence of a substantial improvement on a clinically significant endpoint over available therapies, or over placebo if there is no available therapy, or in a study that compares the new treatment plus the standard of care to the standard of care alone.
The designation confers several benefits, including intensive FDA guidance and eligibility for submission of a rolling biologic license application. ![]()
More AF patients need anticoagulants, guidelines suggest

Results of a large analysis suggest the latest guidelines for atrial fibrillation (AF) recommend anticoagulant therapy for nearly all women with AF and AF patients older than 65.
In 2014, the American Heart Association, American College of Cardiology, and Heart Rhythm Society issued broader guidelines for the use of anticoagulants in AF patients.
A group of researchers wanted to assess how these guidelines would change the use of anticoagulant therapy.
So they evaluated patients enrolled in the ORBIT-AF study, comparing how recommendations from the 2011 AF guidelines and the guidelines issued in 2014 would affect these patients.
Emily O’Brien, PhD, of the Duke Clinical Research Institute in Durham, North Carolina, and her colleagues conducted this research and described their findings in a letter to JAMA Internal Medicine.
The ORBIT-AF study included 10,132 AF patients from 176 sites across the US. Available data included patients’ age, gender, and risk factors such as prior congestive heart failure, high blood pressure, diabetes, and prior stroke.
The researchers found the overall proportion of AF patients recommended for anticoagulants increased from about 72% of patients with the 2011 guidelines to 91% with the newer guidelines.
A similar increase occurred for women with AF. Under the previous guidelines, anticoagulants would have been recommended for about 77% of female AF patients in the study population. Under the new guidelines, 98% of women in the sample population would have enough risk factors to qualify for treatment.
The 2014 guidelines also lower the age at which patients are considered at risk for stroke from 75 to 65.
In the study population, this meant that anticoagulant therapy would be recommended for almost 99% of patients with AF who were older than 65, compared to roughly 80% whose stroke risk was severe enough under the previous criteria.
“The full adoption of the guidelines could reclassify nearly 1 million people with AFib who previously weren’t recommended for treatment with blood thinners,” Dr O’Brien said.
“What we don’t know yet is the extent to which doctors in community practice will incorporate the guidelines into their clinical routines and what that will mean for the long-term outcomes for those patients. That will be the next step for our study.” ![]()