User login
Ischemic mitral regurgitation: valve repair vs. replacement
SNOWMASS, COLO. – A clear message from the first-ever randomized trial of surgical mitral valve repair versus replacement for patients with severe ischemic mitral regurgitation is that replacement should be utilized more liberally, Dr. Michael J. Mack said at the Annual Cardiovascular Conference at Snowmass.
The results of prosthetic valve implantation proved far more durable than repair. At 2 years of follow-up in this 251-patient multicenter trial conducted by the Cardiothoracic Surgical Trials Network (CSTN), the incidence of recurrent moderate or severe mitral regurgitation was just 3.8% in the valve replacement group, compared with 58.8% with repair via restrictive annuloplasty. As a result, the repair group had significantly more heart failure–related adverse events and cardiovascular hospitalizations and a lower rate of clinically meaningful improvement in quality of life scores, noted Dr. Mack, an investigator in the trial and medical director of the Baylor Health Care System in Plano, Tex.

“I think surgical mitral valve replacement has had a bad name over the years, and one of the reasons is because of the worse left ventricular function afterwards. However, that was a casualty of excising the mitral valve and the subvalvular apparatus, causing atrial-ventricular disconnection. We’ve gotten smarter about this. The techniques we now use are valve sparing,” the cardiothoracic surgeon said.
He was quick to add, however, that the CSTN study results are by no means the death knell for restrictive mitral annuloplasty. Indeed, participants in the mitral valve repair group who didn’t develop recurrent regurgitation actually experienced significant positive reverse remodeling as reflected by improvement in their left ventricular end-systolic volume index, the primary endpoint of the study (N Engl J Med. 2016;374:344-35).
The key to successful outcomes in mitral valve repair is to save the procedure for patients who are unlikely to develop recurrent regurgitation. And a substudy of the CTSN trial led by Dr. Irving L. Kron, professor of surgery at the University of Virginia, Charlottesville, provides practical guidance on that score. The investigators conducted a logistic regression analysis of the mitral valve repair group’s baseline echocardiographic and clinical characteristics and identified a collection of strong predictors of recurrent regurgitation within 2 years (J Thorac Cardiovasc Surg. 2015 Mar;149[3]:752-61).
“The bottom line is, the more tethering you have of the mitral valve leaflets, the more likely you are to have recurrent mitral regurgitation after mitral valve annuloplasty,” Dr. Mack said.
The predictors of recurrent regurgitation included a coaptation depth greater than 10 mm, a posterior leaflet angle in excess of 45 degrees, a distal anterior leaflet angle greater than 25 degrees, inferior basal aneurysm, mitral annular calcification, and a left ventricular end diastolic diameter greater than 65 mm, as well as other indices of advanced left ventricular remodeling.
No or only mild annular dilation, as occurs, for example, in patients whose mitral regurgitation is caused by atrial fibrillation, is another independent predictor of recurrent regurgitation post repair.
“Shrinking the annulus isn’t going to make a difference if the annulus wasn’t dilated to begin with,” the surgeon observed. “If surgery is performed, we now know those patients who are most likely to recur – and they should have mitral valve replacement. If those factors are not present, then repair is still a viable option,” according to Dr. Mack.
That being said, it’s still not known whether correcting severe ischemic mitral regurgitation prolongs life or improves quality of life long term, compared with guideline-directed medical therapy, he stressed.
“Secondary mitral regurgitation is a disease of the left ventricle, not the mitral valve. So it’s possible that mitral regurgitation reduction has no benefit because the regurgitation is a surrogate marker not causally related to outcome. I don’t think so, but it is a possibility,” Dr. Mack conceded.
This is a clinically important unresolved question because secondary mitral regurgitation is extremely common. In a retrospective echocardiographic study of 558 heart failure patients with a left ventricular ejection fraction of 35% or less and class III-IV symptoms, 90% of them had some degree of mitral regurgitation (J Card Fail. 2004 Aug;10[4]:285-91).
Together with Columbia University cardiologist Dr. Gregg W. Stone, Dr. Mack is coprincipal investigator of the COAPT (Cardiovascular Outcomes Assessment of the MitraClip Percutaneous Therapy for Heart Failure Patients with Functional Mitral Regurgitation) trial, which is expected to provide an answer to this key question. The multicenter U.S. study involves a planned 420 patients with severely symptomatic secondary mitral regurgitation who are deemed at prohibitive risk for surgery. They are to be randomized to guideline-directed medical therapy with or without transcatheter mitral valve repair using the MitraClip device. Enrollment should be completed by May, with initial results available in late 2017.
Dr. Mack reported receiving research grants from Abbott Vascular, which is sponsoring the COAPT trial, as well as from Edwards Lifesciences.
SNOWMASS, COLO. – A clear message from the first-ever randomized trial of surgical mitral valve repair versus replacement for patients with severe ischemic mitral regurgitation is that replacement should be utilized more liberally, Dr. Michael J. Mack said at the Annual Cardiovascular Conference at Snowmass.
The results of prosthetic valve implantation proved far more durable than repair. At 2 years of follow-up in this 251-patient multicenter trial conducted by the Cardiothoracic Surgical Trials Network (CSTN), the incidence of recurrent moderate or severe mitral regurgitation was just 3.8% in the valve replacement group, compared with 58.8% with repair via restrictive annuloplasty. As a result, the repair group had significantly more heart failure–related adverse events and cardiovascular hospitalizations and a lower rate of clinically meaningful improvement in quality of life scores, noted Dr. Mack, an investigator in the trial and medical director of the Baylor Health Care System in Plano, Tex.
“I think surgical mitral valve replacement has had a bad name over the years, and one of the reasons is because of the worse left ventricular function afterwards. However, that was a casualty of excising the mitral valve and the subvalvular apparatus, causing atrial-ventricular disconnection. We’ve gotten smarter about this. The techniques we now use are valve sparing,” the cardiothoracic surgeon said.
He was quick to add, however, that the CSTN study results are by no means the death knell for restrictive mitral annuloplasty. Indeed, participants in the mitral valve repair group who didn’t develop recurrent regurgitation actually experienced significant positive reverse remodeling as reflected by improvement in their left ventricular end-systolic volume index, the primary endpoint of the study (N Engl J Med. 2016;374:344-35).
The key to successful outcomes in mitral valve repair is to save the procedure for patients who are unlikely to develop recurrent regurgitation. And a substudy of the CTSN trial led by Dr. Irving L. Kron, professor of surgery at the University of Virginia, Charlottesville, provides practical guidance on that score. The investigators conducted a logistic regression analysis of the mitral valve repair group’s baseline echocardiographic and clinical characteristics and identified a collection of strong predictors of recurrent regurgitation within 2 years (J Thorac Cardiovasc Surg. 2015 Mar;149[3]:752-61).
“The bottom line is, the more tethering you have of the mitral valve leaflets, the more likely you are to have recurrent mitral regurgitation after mitral valve annuloplasty,” Dr. Mack said.
The predictors of recurrent regurgitation included a coaptation depth greater than 10 mm, a posterior leaflet angle in excess of 45 degrees, a distal anterior leaflet angle greater than 25 degrees, inferior basal aneurysm, mitral annular calcification, and a left ventricular end diastolic diameter greater than 65 mm, as well as other indices of advanced left ventricular remodeling.
No or only mild annular dilation, as occurs, for example, in patients whose mitral regurgitation is caused by atrial fibrillation, is another independent predictor of recurrent regurgitation post repair.
“Shrinking the annulus isn’t going to make a difference if the annulus wasn’t dilated to begin with,” the surgeon observed. “If surgery is performed, we now know those patients who are most likely to recur – and they should have mitral valve replacement. If those factors are not present, then repair is still a viable option,” according to Dr. Mack.
That being said, it’s still not known whether correcting severe ischemic mitral regurgitation prolongs life or improves quality of life long term, compared with guideline-directed medical therapy, he stressed.
“Secondary mitral regurgitation is a disease of the left ventricle, not the mitral valve. So it’s possible that mitral regurgitation reduction has no benefit because the regurgitation is a surrogate marker not causally related to outcome. I don’t think so, but it is a possibility,” Dr. Mack conceded.
This is a clinically important unresolved question because secondary mitral regurgitation is extremely common. In a retrospective echocardiographic study of 558 heart failure patients with a left ventricular ejection fraction of 35% or less and class III-IV symptoms, 90% of them had some degree of mitral regurgitation (J Card Fail. 2004 Aug;10[4]:285-91).
Together with Columbia University cardiologist Dr. Gregg W. Stone, Dr. Mack is coprincipal investigator of the COAPT (Cardiovascular Outcomes Assessment of the MitraClip Percutaneous Therapy for Heart Failure Patients with Functional Mitral Regurgitation) trial, which is expected to provide an answer to this key question. The multicenter U.S. study involves a planned 420 patients with severely symptomatic secondary mitral regurgitation who are deemed at prohibitive risk for surgery. They are to be randomized to guideline-directed medical therapy with or without transcatheter mitral valve repair using the MitraClip device. Enrollment should be completed by May, with initial results available in late 2017.
Dr. Mack reported receiving research grants from Abbott Vascular, which is sponsoring the COAPT trial, as well as from Edwards Lifesciences.
EXPERT ANALYSIS FROM THE CARDIOVASCULAR CONFERENCE AT SNOWMASS

FDA clears new iteration of blood-draw device

Photo courtesy of
Velano Vascular
The US Food and Drug Administration (FDA) has granted 510(k) clearance for a new iteration of a needle-free blood-draw device produced by Velano Vascular.
The device was originally cleared by the FDA last year.
It resembles a common syringe and allows peripheral intravenous catheters to be repurposed to draw blood from patients.
The goal of this is to reduce the need for additional needle sticks among patients receiving medications and hydration via intravenous delivery.
The new clearance for the blood-draw device covers a pair of modifications aimed at inpatient blood draws.
The first modification is a clamp for use with syringe draws. And the second is a revised indication for use that removes a limitation on when the device can be used with in-dwelling peripheral intravenous catheters.
“We rapidly implemented and pursued FDA clearance for these modifications based on input from patients and medical professionals who are using and systematically assessing our blood-draw technology,” said Eric Stone, co-founder & CEO of Velano Vascular.
Velano Vascular said it is working closely with clinical and non-profit partners, including Brigham and Women’s Hospital, Intermountain Healthcare, Griffin Health, The University of Pennsylvania Health System, The Children’s Hospital of Philadelphia, Children’s National Hospital, and Planetree, to capture patient and practitioner input regarding today’s approaches to inpatient blood draws and how the Velano technology could eventually become a standard of care. ![]()
Proton radiotherapy effective for childhood medulloblastoma
Treatment of childhood medulloblastoma with proton radiotherapy resulted in acceptable toxicity, with no observed cardiac, pulmonary, or gastrointestinal late effects, and achieved outcomes that were similar to those of photon (x-ray)-based therapy.
At a median follow up of 5 years, the cumulative incidence of grade 3 to 4 hearing loss was 16% (95% confidence interval, 6-29). The Full Scale Intelligence Quotient decreased significantly, particularly in children younger than 8 years, driven mostly by drops in processing speed and verbal comprehension. The cumulative incidence of any hormone deficit at 7 years was 63% (95% CI, 48-75).
For all patients, progression-free survival (PFS) at 5 years was 80% (95% CI, 67-88) and overall survival (OS) was 83% (95% CI, 70-90). For patients with standard-risk disease, PFS was 85% (95% CI, 69-93) and OS was 86% (95% CI, 70-94); for intermediate-risk disease, PFS was 67% (95% CI, 19-90) and OS was 67% (95% CI, 19-90); for high-risk disease, PFS was 71% (95% CI, 41-88) and OS was 79% (95% CI, 47-93). These rates are similar to previously published outcomes of 81%-83% for PFS and 85%-86% for OS (Lancet Onc. 2016 Jan 29. doi: 10.1016/S1470-2045(15)00167-9).
“Therefore, the similar disease control coupled with similar patterns of failure should quell concerns raised about the differences in relative biologic effectiveness of passively scattered proton radiotherapy,” wrote Dr. Torunn Yock, chief of pediatric radiation oncology at Massachusetts General Hospital, Boston, and colleagues.
“Although there remain some effects of treatment on hearing, endocrine, and neurocognitive outcomes – particularly in younger patients – other late effects common in photon-treated patients, such as cardiac, pulmonary, and gastrointestinal toxic effects, were absent,” they said.
Medulloblastoma survivors often have treatment-related adverse late effects, and proton radiotherapy is used to mitigate late effects by decreasing the volume of normal tissue irradiated.
The estimated mean loss per year of IQ points, at –1.5, was less than IQ differences reported in previous studies, which ranged from –1.9 to –5.8 depending on age, craniospinal irradiation dosing, boost volumes, and length of follow-up.
There were no observed cardiac effects, and no patients had restrictive lung disease, which can occur in 24%-50% of long-term survivors treated with craniospinal photon irradiation. In addition, there were no new cases of gastrointestinal toxic effects that have occurred in up to 44% of photon-treated patients.
The prospective, nonrandomized phase II study carried out at Massachusetts General Hospital, Boston, evaluated 59 patients aged 3-21 years (median age 6.6 years) who had medulloblastoma (39 standard risk, 6 intermediate risk, and 14 high risk). All patients received chemotherapy and 55 had a near or gross total resection.
The prospective study by Dr. Yock and colleagues sets a new benchmark for treatment of medulloblastoma in pediatric patients and alludes to the clinical benefits of advanced radiation treatment. It becomes increasingly important for radiation oncologists to incorporate new findings in genomics and molecular subtyping for diseases such as medulloblastoma in the design of prospective studies, and to implement strategies to prevent cognitive decline in pediatric patients. The investigators demonstrate benefits of low-dose sparing afforded by proton therapy, but further improvements are possible. With newer delivery techniques, such as spot scanning proton therapy for the craniospinal component of treatment, more improvements in hearing outcomes can be expected.
The rarity of the disease, combined with the compelling results of Dr. Yock and colleagues, make randomized trials of photons versus protons for medulloblastoma unlikely. Without randomized trial data, some states require that all pediatric patients be treated with photon therapy, a requirement that could result higher rates of cardiovascular disease and other adverse effects. Radiation oncologists understand the potential for severe adverse effects of treatment, and many embrace new technologies that mitigate effects of radiation therapy on patients’ quality of life, a consideration that is particularly important in treatment of pediatric cancers.
Dr. David Grosshans is at the department of radiation oncology, University of Texas MD Anderson Cancer Center, Houston. These remarks were part of an editorial accompanying the report by Dr. Yock and colleagues (Lancet Onc. 2016 Jan 29. doi: 10.1016/S1470-2045(15)00217-X. Dr. Grosshans reported having no disclosures.
Treatment of childhood medulloblastoma with proton radiotherapy resulted in acceptable toxicity, with no observed cardiac, pulmonary, or gastrointestinal late effects, and achieved outcomes that were similar to those of photon (x-ray)-based therapy.
At a median follow up of 5 years, the cumulative incidence of grade 3 to 4 hearing loss was 16% (95% confidence interval, 6-29). The Full Scale Intelligence Quotient decreased significantly, particularly in children younger than 8 years, driven mostly by drops in processing speed and verbal comprehension. The cumulative incidence of any hormone deficit at 7 years was 63% (95% CI, 48-75).
For all patients, progression-free survival (PFS) at 5 years was 80% (95% CI, 67-88) and overall survival (OS) was 83% (95% CI, 70-90). For patients with standard-risk disease, PFS was 85% (95% CI, 69-93) and OS was 86% (95% CI, 70-94); for intermediate-risk disease, PFS was 67% (95% CI, 19-90) and OS was 67% (95% CI, 19-90); for high-risk disease, PFS was 71% (95% CI, 41-88) and OS was 79% (95% CI, 47-93). These rates are similar to previously published outcomes of 81%-83% for PFS and 85%-86% for OS (Lancet Onc. 2016 Jan 29. doi: 10.1016/S1470-2045(15)00167-9).
“Therefore, the similar disease control coupled with similar patterns of failure should quell concerns raised about the differences in relative biologic effectiveness of passively scattered proton radiotherapy,” wrote Dr. Torunn Yock, chief of pediatric radiation oncology at Massachusetts General Hospital, Boston, and colleagues.
“Although there remain some effects of treatment on hearing, endocrine, and neurocognitive outcomes – particularly in younger patients – other late effects common in photon-treated patients, such as cardiac, pulmonary, and gastrointestinal toxic effects, were absent,” they said.
Medulloblastoma survivors often have treatment-related adverse late effects, and proton radiotherapy is used to mitigate late effects by decreasing the volume of normal tissue irradiated.
The estimated mean loss per year of IQ points, at –1.5, was less than IQ differences reported in previous studies, which ranged from –1.9 to –5.8 depending on age, craniospinal irradiation dosing, boost volumes, and length of follow-up.
There were no observed cardiac effects, and no patients had restrictive lung disease, which can occur in 24%-50% of long-term survivors treated with craniospinal photon irradiation. In addition, there were no new cases of gastrointestinal toxic effects that have occurred in up to 44% of photon-treated patients.
The prospective, nonrandomized phase II study carried out at Massachusetts General Hospital, Boston, evaluated 59 patients aged 3-21 years (median age 6.6 years) who had medulloblastoma (39 standard risk, 6 intermediate risk, and 14 high risk). All patients received chemotherapy and 55 had a near or gross total resection.
FROM THE LANCET ONCOLOGY
Key clinical point: Proton radiotherapy for childhood medulloblastoma resulted in similar survival outcomes to those of photon-based therapy and had acceptable toxicity.
Major finding: At 5 years, the cumulative incidence of grade 3 to 4 hearing loss was 16%; 5-year progression-free and overall survival for patients with standard risk were 85% and 86%, respectively, and for those with high to intermediate risk, 70% and 75%, respectively.
Data source: A prospective, nonrandomized, phase II study with 59 patients aged 3-21 years who had medulloblastoma (39 standard risk, 6 intermediate risk, and 14 high risk).
Disclosures: Dr. Yock and coauthors reported having no disclosures.
VIDEO: U.S. TAVR growth continues, mostly among octogenarians
PHOENIX – Use of transcatheter aortic valve replacement continued to expand through the first half of 2015, but the procedure remained primarily targeted to patients at least 80 years old, according to data collected in a U.S. postmarketing registry.
When the Food and Drug Administration first approved a transcatheter aortic valve replacement (TAVR) system for routine U.S. use in late 2011, the patients who underwent TAVR “were either at very high risk or inoperable, and we’ve seen that move into high-risk patients – and I’m sure we’ll see more introduction of this into patients who are at medium risk,” said Dr. Frederick L. Grover in a video interview at the annual meeting of the Society of Thoracic Surgeons.
Despite this downward trend in risk level, the median and average ages of TAVR patients remain above 80 years.
In 2015, U.S. TAVR recipients had a median age of 83 years and a mean age of 81 years, virtually unchanged from the 84-year median and 82-year mean during routine U.S. practice in 2012, the first year for data collection by the STS and American College of Cardiology Transcatheter Valve Therapy (TVT) Registry. Dr. Grover reported the latest data from the registry at the meeting, through roughly the first half of 2015.
“There has been some movement downward” from 2012 to 2014 in the predicted 30-day mortality rate of patients as measured by their preprocedural STS risk score. The rate declined from an average predicted mortality rate of 7.05% in 2012 to an average of 6.69% among patients treated during 2014.
Despite this shift, TAVR patients remain highly vulnerable to surgical complications because of their advanced age and frailty, said Dr. Grover, a professor of cardiothoracic surgery at the University of Colorado in Aurora and vice chairman of the registry steering committee.
STS encourages surgeons and cardiologists who collaborate on the heart teams that judge patient suitability for TAVR to measure frailty with the 5-meter walk test, run sequentially three times. Patients who take an average of 6 seconds or more to complete the test are deemed frail and eligible for TAVR. Registry data show that during 2012-2014, 81% of TAVR patients met this frailty criterion.
Perhaps the most notable statistics in the registry are the snowballing numbers of procedures performed, which have come close to doubling each year.
In the first full year of commercial use, 2012, 4,601 patients underwent TAVR, which jumped to 9,128 patients in 2013, 16,314 patients in 2014, and 23,002 patients during just the first part of 2015, Dr. Grover reported.
Dr. Grover had no relevant disclosures.
The video associated with this article is no longer available on this site. Please view all of our videos on the MDedge YouTube channel
On Twitter @mitchelzoler
AT THE STS ANNUAL MEETING
Key clinical point: The U.S. postmarketing database for TAVR showed steadily increasing growth in use from 2012 to 2015, with an ongoing focus on treating octogenarian patients.
Major finding: U.S. TAVR use jumped from 4,600 procedures in 2012 to 23,000 procedures in roughly the first half of 2015.
Data source: The STS/ACC TVT registry, which included 53,045 U.S. TAVR patients through mid 2015.
Disclosures: Dr. Grover had no relevant disclosures.
Obstructive sleep apnea: Who should be tested, and how?
Only 10% of people with obstructive sleep apnea (OSA) are diagnosed—a dismal statistic considering the consequences. So who’s at risk? Common risk factors include obesity, resistant hypertension, retrognathia, large neck circumference (> 17 inches in men, > 16 inches in women), and history of stroke, atrial fibrillation, nocturnal arrhythmias, heart failure, and pulmonary hypertension. Patients who have risk factors for OSA or who report symptoms should be screened for it, first with a complete sleep history and standardized questionnaire, and then by objective testing if indicated. Read the full article at the Cleveland Clinic Journal of Medicine: http://www.ccjm.org/topics/obesity-weight-management/single-article-page/obstructive-sleep-apnea-who-should-be-tested-and-how/a486844138b1eb76c90923d6d1d1a255.html.
Only 10% of people with obstructive sleep apnea (OSA) are diagnosed—a dismal statistic considering the consequences. So who’s at risk? Common risk factors include obesity, resistant hypertension, retrognathia, large neck circumference (> 17 inches in men, > 16 inches in women), and history of stroke, atrial fibrillation, nocturnal arrhythmias, heart failure, and pulmonary hypertension. Patients who have risk factors for OSA or who report symptoms should be screened for it, first with a complete sleep history and standardized questionnaire, and then by objective testing if indicated. Read the full article at the Cleveland Clinic Journal of Medicine: http://www.ccjm.org/topics/obesity-weight-management/single-article-page/obstructive-sleep-apnea-who-should-be-tested-and-how/a486844138b1eb76c90923d6d1d1a255.html.
Only 10% of people with obstructive sleep apnea (OSA) are diagnosed—a dismal statistic considering the consequences. So who’s at risk? Common risk factors include obesity, resistant hypertension, retrognathia, large neck circumference (> 17 inches in men, > 16 inches in women), and history of stroke, atrial fibrillation, nocturnal arrhythmias, heart failure, and pulmonary hypertension. Patients who have risk factors for OSA or who report symptoms should be screened for it, first with a complete sleep history and standardized questionnaire, and then by objective testing if indicated. Read the full article at the Cleveland Clinic Journal of Medicine: http://www.ccjm.org/topics/obesity-weight-management/single-article-page/obstructive-sleep-apnea-who-should-be-tested-and-how/a486844138b1eb76c90923d6d1d1a255.html.
Hepatitis C virus infection linked to cardiovascular death, disease, and stroke
Patients with hepatitis C virus (HCV) infection face a significantly increased risk of cardiovascular death, subclinical carotid thickening and atherosclerosis, and cerebrocardiovascular events—especially when they also have diabetes and hypertension—according to a systematic review and meta-analysis of 22 studies published in the January issue of Gastroenterology. Read more about what researchers discovered at Family Practice News: http://www.familypracticenews.com/specialty-focus/gastroenterology/single-article-page/hepatitis-c-virus-infection-linked-to-cardiovascular-death-disease-and-stroke/b2a81f04cbda6c9aaa51466f699f3dc9.html.
Patients with hepatitis C virus (HCV) infection face a significantly increased risk of cardiovascular death, subclinical carotid thickening and atherosclerosis, and cerebrocardiovascular events—especially when they also have diabetes and hypertension—according to a systematic review and meta-analysis of 22 studies published in the January issue of Gastroenterology. Read more about what researchers discovered at Family Practice News: http://www.familypracticenews.com/specialty-focus/gastroenterology/single-article-page/hepatitis-c-virus-infection-linked-to-cardiovascular-death-disease-and-stroke/b2a81f04cbda6c9aaa51466f699f3dc9.html.
Patients with hepatitis C virus (HCV) infection face a significantly increased risk of cardiovascular death, subclinical carotid thickening and atherosclerosis, and cerebrocardiovascular events—especially when they also have diabetes and hypertension—according to a systematic review and meta-analysis of 22 studies published in the January issue of Gastroenterology. Read more about what researchers discovered at Family Practice News: http://www.familypracticenews.com/specialty-focus/gastroenterology/single-article-page/hepatitis-c-virus-infection-linked-to-cardiovascular-death-disease-and-stroke/b2a81f04cbda6c9aaa51466f699f3dc9.html.
U.S. flu activity continues slow increase
The proportion of U.S. outpatient visits for influenza-like illness (ILI) crept up from 2.1% to 2.2% for the week ending Jan. 23 – week 15 of the 2015-2016 flu season, the Centers for Disease Control and Prevention reported.
That increase put the proportion of visits involving ILI back above the national baseline level of 2.1% for the first time since the week ending Jan. 2, when it reached a season-high 2.8%, the CDC said.
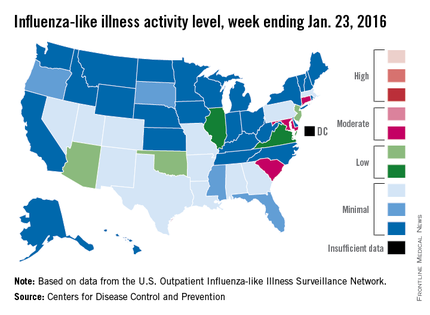
Puerto Rico was the nation’s influenza hotspot at level 8 on the CDC’s 1-10 scale of ILI activity, but the states with the most activity were Connecticut, Maryland, and South Carolina, which were categorized in the “moderate” range at level 6. Connecticut was up from level 2 the week before; the other two states were unchanged.
There were five states in the “low” range: Arizona, New Jersey, and Oklahoma at level 5 and Illinois and Virginia at level 4. Arizona (down from level 7) and Oklahoma (up from level 3) were the biggest movers in this group from the previous week. There were 12 states at level 3 and four states at level 2, putting the total at 24 states at level 2 or higher, according to data from the CDC’s Outpatient Influenza-like Illness Surveillance Network.
There were no pediatric deaths reported in week 15, keeping the total for the season at seven, the CDC said, which is well below the number of deaths reported by week 15 in each of the last three flu seasons.
The ILI hospitalization rate for the season so far is 2.1 per 100,000 population, with 575 laboratory-confirmed, influenza-associated hospitalizations reported between Oct. 1, 2015, and Jan. 23, 2016. The highest hospitalization rates are among adults aged 65 years and older (7.0 per 100,000 population) and children aged 0-4 years (3.4 per 100,000), the CDC reported.
The proportion of U.S. outpatient visits for influenza-like illness (ILI) crept up from 2.1% to 2.2% for the week ending Jan. 23 – week 15 of the 2015-2016 flu season, the Centers for Disease Control and Prevention reported.
That increase put the proportion of visits involving ILI back above the national baseline level of 2.1% for the first time since the week ending Jan. 2, when it reached a season-high 2.8%, the CDC said.
Puerto Rico was the nation’s influenza hotspot at level 8 on the CDC’s 1-10 scale of ILI activity, but the states with the most activity were Connecticut, Maryland, and South Carolina, which were categorized in the “moderate” range at level 6. Connecticut was up from level 2 the week before; the other two states were unchanged.
There were five states in the “low” range: Arizona, New Jersey, and Oklahoma at level 5 and Illinois and Virginia at level 4. Arizona (down from level 7) and Oklahoma (up from level 3) were the biggest movers in this group from the previous week. There were 12 states at level 3 and four states at level 2, putting the total at 24 states at level 2 or higher, according to data from the CDC’s Outpatient Influenza-like Illness Surveillance Network.
There were no pediatric deaths reported in week 15, keeping the total for the season at seven, the CDC said, which is well below the number of deaths reported by week 15 in each of the last three flu seasons.
The ILI hospitalization rate for the season so far is 2.1 per 100,000 population, with 575 laboratory-confirmed, influenza-associated hospitalizations reported between Oct. 1, 2015, and Jan. 23, 2016. The highest hospitalization rates are among adults aged 65 years and older (7.0 per 100,000 population) and children aged 0-4 years (3.4 per 100,000), the CDC reported.

Endometrial cancer after unopposed estrogen: $7.5M
Endometrial cancer after unopposed estrogen: $7.5M
A 42-year-old woman took unopposed estrogen as treatment for reported perimenopausal symptoms from October 2010 through October 2012, although she still had her uterus.
In December 2013, the patient was diagnosed with Stage 3 endometrial cancer. She underwent a radical hysterectomy followed by several rounds of chemotherapy. Despite treatment, the cancer metastasized, leaving the patient with a decreased life expectancy.
Patient’s claim Use of unopposed estrogens by a woman who still has her uterus significantly increases her risk of developing endometrial cancer. The gynecologist was negligent for prescribing the drug.
Physician’s defense The case was settled during the trial.
Verdict A $7.5 million Illinois settlement was reached
Preeclampsia treatment delayed because BP machine failed: $5M
At 31 4/7 weeks’ gestation, a woman went to the hospital. She reported burning pain in her chest, headache, and vomiting.
Two nurses cared for the mother: one who was completing her shift (Nurse A) and another who was beginning her shift (Nurse B). Nurse A stated that the blood pressure (BP) machine was not working correctly when she attempted to assess the patient at admission. When Nurse B took the patient’s BP, it indicated preeclampsia. Shortly thereafter, fetal heart-rate monitoring showed a concerning pattern. Nurse B notified the ObGyn 75 minutes after the mother’s arrival. The ObGyn ordered intervention to treat the baby’s concerning heart rate and, when those efforts failed, an emergency cesarean delivery was performed. The baby was found to have brain damage caused by hypoxia.
Parents’ claim Because the BP machine was not working properly when the mother arrived at the hospital, intervention for preeclampsia was delayed. Preeclampsia caused the baby’s injuries. An earlier cesarean delivery should have been performed.
Defendant’s defense The patient was adequately treated. The injury likely occurred before the mother arrived at the hospital. The case was settled during the trial.
Verdict A $5 million Massachusetts settlement was reached with the hospital and ObGyn.
Standard prenatal scan missed congenital syndrome: $3.75M
A woman receiving prenatal care at a medical center requested an ultrasonographic anatomical fetal scan. A limited ultrasound (US) was performed, and no abnormalities were detected.
Upon birth, the child was found to have Dandy Walker syndrome, a malformation of the brain affecting mobility. The child requires full-time nursing care.
Parents’ claim If a complete prenatal anatomical survey had been performed when requested, the abnormality would have been detected. The mother would have terminated the pregnancy.
Defendant’s defense It is the medical center’s policy to perform complete anatomical surveys only on women with high-risk pregnancies, which this was not. The woman switched health care providers during her pregnancy. A subsequent US performed by the new health care provider did not show a fetal abnormality. The case was settled during the trial.
Verdict A $3.75 million New Jersey settlement was reached with the medical center.
Should mother have been discharged? $700,000 settlement
Due to elevated fetal heart rate, a woman was admitted to the hospital for fetal heart-rate monitoring and then discharged a few hours later. After 2 days, the mother was readmitted for induction of labor, but she was discharged the following day. The next day, she was readmitted when she noticed lack of fetal movement. The infant was stillborn.
Parents’ claim The mother and fetus were not properly monitored; she should not have been sent home after induction of labor. The hospital was negligent for not properly monitoring labor, for not assigning an ObGyn to care for the mother, and for not performing cesarean delivery.
Hospital’s defense The case was settled during the trial.
Verdict A $700,000 Illinois settlement was reached with the hospital.
ADDITIONAL MEDICAL VERDICTS CASES:
Stroke during delivery: $35.4M verdict: OBG Manag. 2016;28(2):46.
Failure to find breast cancer; later diagnosed at Stage 3: OBG Manag. 2016;28(2):48.
VIDEO: Addressing rosacea comorbidities and their role in flushing
GRAND CAYMAN – What impact do treatments for gastroesophageal reflux disease (GERD), hypertension, hyperlipidemia, and menopausal flushing have in patients with erythematotelangiectatic and papulopustular rosacea?
In a video interview at the Caribbean Dermatology Symposium, Dr. Jonathan K. Wilkin, who is in private practice in Grand Cayman and is a former director of the Food and Drug Administration’s Division of Dermatologic and Dental Drug Products, refers to recent studies that have linked rosacea to these and other comorbidities. He shares his insights into how addressing these four comorbidities into your treatment calculus can improve outcomes in patients who have rosacea with flushing.
The meeting is provided by Global Academy for Medical Education. Global Academy and this news organization are owned by the same parent company.
The video associated with this article is no longer available on this site. Please view all of our videos on the MDedge YouTube channel
On Twitter @whitneymcknight
AT THE CARIBBEAN DERMATOLOGY SYMPOSIUM

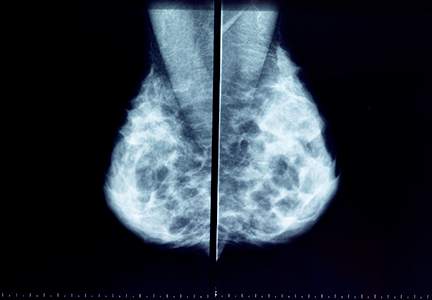
No surprises from the USPSTF with new guidance on screening mammography
In 2009, the US Preventive Services Task Force (USPSTF) recommended that biennial mammography screening in average-risk women begin at age 50.1 New guidelines, that take into account reviews and modeling studies, clarify the earlier USPSTF recommendations, paying particular attention to individualized screening for women aged 40 to 49, use of tomosynthesis, and supplemental evaluation for women with radiologically dense breasts.
The new guidance only applies to women at average risk for breast cancer (not to those at substantially higher-than-average risk), including those with prior breast cancer or biopsy-confirmed high-risk lesions (eg, atypical hyperplasia), certain genetic conditions (such as BRCA1 or BRCA2 mutation), or histories of chest irradiation (eg, Hodgkin lymphoma).
Major statements:
- Biennial screening is recommended for women aged 50 to 74 (B recommendation; definitions of USPSTF grades are available online at ).
- Initiation of screening before age 50 should be individualized depending on patient preferences (C recommendation).
- For women aged ≥75, current evidence is insufficient to assess benefits and harms of screening (I statement).
- Current evidence is insufficient to assess the benefits and harms of adding tomosynthesis to conventional screening mammography (I statement).
- For women with radiologically dense breasts, current evidence is insufficient to assess the benefits and harms of adjunctive ultrasound, magnetic resonance imaging (MRI), or tomosynthesis (I statement).2
The Task Force generated controversy with its 2009 recommendation that screening begin at age 50 in average-risk women. The current guidance clarifies that repetitive screening of women through 10 years reduces breast cancer deaths by 4 (aged 40–49), 8 (aged 50–59), and 21 (aged 60–69) per 10,000 women, respectively.2
The term “overdiagnosis” refers to detection and treatment of invasive and noninvasive (usually ductal carcinoma in situ) lesions that would have gone undetected without screening and would not have caused health problems. The USPSTF acknowledges that, while overdiagnosis represents the principal harm from screening, estimating overdiagnosis rates is challenging (best estimates range from 1 in 5 to 1 in 8 breast cancers diagnosed in screened women).2–4 False-positive results, which lead to unnecessary additional imaging and biopsies,3,4 can represent an additional harm of screening mammography.
The rationale for recommending that average-risk women begin screening at age 50 is based on the relatively smaller benefits and greater harms incurred when younger women are screened;3,4 however, in noting that most of the screening benefits for women in their 40s are realized starting at age 45, the USPSTF guidance opens the door to average-risk women to begin screening at that age (congruent with the November 2015 American Cancer Society recommendations5). Also, women with a first-degree relative with breast cancer may want to initiate screening at age 40.
Regarding screening frequency, annual screening generates minimal if any benefit while increasing the potential for harm3,4; thus, for most women at average risk for breast cancer, biennial screening provides the best benefit–harm balance.
What about use of tomosynthesis and women with dense breasts?
Tomosynthesis, which can be performed along with conventional digital screening mammography, seems to diminish the need for follow-up imaging while also increasing cancer detection rates.6 However, whether these additional cancers represent overdiagnosis remains unknown. Furthermore, tomosynthesis can expose women to about twice the radiation as conventional digital screening.7
Twenty-four states currently mandate that patients with dense breasts identified at screening be notified. Although increased breast density is a common independent risk factor for breast cancer, the degree of radiographic density can vary substantially from one screen to the next in the same woman. Evidence for or against adjunctive imaging is very limited in women found to have dense breasts in an otherwise negative mammogram, and suggests that ultrasonography and MRI (as well as tomosynthesis) can detect additional breast cancers while also generating more false-positive results.8 Thus, the USPSTF does not recommend specific screening strategies for women with dense breasts.
How I counsel my patients
I plan to continue recommending screening based on USPSTF guidance. However, I also will continue to support the preferences of many of my patients to:
- initiate screening before age 50
- undergo screening annually
- continue screening after age 74.
You and your patients alike may find the USPSTF’s Summary for Patients9 (http://annals.org/article.aspx?articleid=2480981&resultClick=3) to be helpful when navigating this territory.
Share your thoughts! Send your Letter to the Editor to [email protected]. Please include your name and the city and state in which you practice.
- US Preventive Services Task Force. Screening for breast cancer: US Preventive Services Task Force recommendation statement. Ann Intern Med. 2009;151(10):716−726.
- Siu AL; US Preventive Services Task Force. Screening for breast cancer: US Preventive Services Task Force recommendation statement [published online ahead of print January 12, 2016]. Ann Intern Med. doi:10.7326/M15-2886.
- Nelson HD, Pappas M, Cantor A, Griffin J, Daeges M, Humphrey L. Harms of breast cancer screening: systematic review to update the 2009 US Preventive Services Task Force recommendation [published online ahead of print January 12, 2016]. Ann Intern Med. doi: 10.7326/M15-0970.
- Mandelblatt JS, Stout NK, Schechter CB, et al. Collaborative modeling of the benefits and harms associated with different US breast cancer screening strategies [published online ahead of print January 12, 2016]. Ann Intern Med. doi: 10.7326 /M15-1536.
- Oeffinger KC, Fontham ET, Etzioni R, et al; American Cancer Society. Breast cancer screening for women at average risk: 2015 guideline update from the American Cancer Society. JAMA. 2015;314(15):1599−1614.
- Nelson HD, OMeara ES, Kerlikowski K, Balch S, Miglioretti D. Factors associated with rates of false-positive and false-negative results from digital mammography screening: an analysis of registry data [published online ahead of print January 12, 2016]. Ann Intern Med. doi: 10.7326/M15-0971.
- Miglioretti DL, Lange J, van den Broek JJ, et al. Radiation-induced breast cancer incidence and mortality from digital mammography screening: a modeling study [published online ahead of print January 12, 2016]. Ann Intern Med. doi: 10.7326 /M15-1241.
- Melnikow J, Fenton JJ, Whitlock EP, et al. Supplemental screening for breast cancer in women with dense breasts: a systematic review for the US Preventive Services Task Force [published online ahead of print January 12, 2016]. Ann Intern Med. doi: 10.7326/M15-1789.
- Siu AL; US Preventive Services Task Force. Screening for breast cancer: US Preventive Services Task Force Recommendation Statement (Summary for Patients). Ann Intern Med. 2016:164:279–296. http://annals.org/article.aspx?articleid=2480981&resultClick=3. Published January 12, 2016. Accessed January 25, 2016.

Andrew M. Kaunitz, MD
Dr. Kaunitz is University of Florida Research Foundation Professor and Associate Chairman, Department of Obstetrics and Gynecology, University of Florida College of Medicine–Jacksonville. He directs Menopause and Gynecologic Ultrasound Services, UF Women’s Health Specialists–Emerson. He serves on the OBG Management Board of Editors.
The author reports no financial relationships relevant to this article.
In 2009, the US Preventive Services Task Force (USPSTF) recommended that biennial mammography screening in average-risk women begin at age 50.1 New guidelines, that take into account reviews and modeling studies, clarify the earlier USPSTF recommendations, paying particular attention to individualized screening for women aged 40 to 49, use of tomosynthesis, and supplemental evaluation for women with radiologically dense breasts.
The new guidance only applies to women at average risk for breast cancer (not to those at substantially higher-than-average risk), including those with prior breast cancer or biopsy-confirmed high-risk lesions (eg, atypical hyperplasia), certain genetic conditions (such as BRCA1 or BRCA2 mutation), or histories of chest irradiation (eg, Hodgkin lymphoma).
Major statements:
- Biennial screening is recommended for women aged 50 to 74 (B recommendation; definitions of USPSTF grades are available online at ).
- Initiation of screening before age 50 should be individualized depending on patient preferences (C recommendation).
- For women aged ≥75, current evidence is insufficient to assess benefits and harms of screening (I statement).
- Current evidence is insufficient to assess the benefits and harms of adding tomosynthesis to conventional screening mammography (I statement).
- For women with radiologically dense breasts, current evidence is insufficient to assess the benefits and harms of adjunctive ultrasound, magnetic resonance imaging (MRI), or tomosynthesis (I statement).2
The Task Force generated controversy with its 2009 recommendation that screening begin at age 50 in average-risk women. The current guidance clarifies that repetitive screening of women through 10 years reduces breast cancer deaths by 4 (aged 40–49), 8 (aged 50–59), and 21 (aged 60–69) per 10,000 women, respectively.2
The term “overdiagnosis” refers to detection and treatment of invasive and noninvasive (usually ductal carcinoma in situ) lesions that would have gone undetected without screening and would not have caused health problems. The USPSTF acknowledges that, while overdiagnosis represents the principal harm from screening, estimating overdiagnosis rates is challenging (best estimates range from 1 in 5 to 1 in 8 breast cancers diagnosed in screened women).2–4 False-positive results, which lead to unnecessary additional imaging and biopsies,3,4 can represent an additional harm of screening mammography.
The rationale for recommending that average-risk women begin screening at age 50 is based on the relatively smaller benefits and greater harms incurred when younger women are screened;3,4 however, in noting that most of the screening benefits for women in their 40s are realized starting at age 45, the USPSTF guidance opens the door to average-risk women to begin screening at that age (congruent with the November 2015 American Cancer Society recommendations5). Also, women with a first-degree relative with breast cancer may want to initiate screening at age 40.
Regarding screening frequency, annual screening generates minimal if any benefit while increasing the potential for harm3,4; thus, for most women at average risk for breast cancer, biennial screening provides the best benefit–harm balance.
What about use of tomosynthesis and women with dense breasts?
Tomosynthesis, which can be performed along with conventional digital screening mammography, seems to diminish the need for follow-up imaging while also increasing cancer detection rates.6 However, whether these additional cancers represent overdiagnosis remains unknown. Furthermore, tomosynthesis can expose women to about twice the radiation as conventional digital screening.7
Twenty-four states currently mandate that patients with dense breasts identified at screening be notified. Although increased breast density is a common independent risk factor for breast cancer, the degree of radiographic density can vary substantially from one screen to the next in the same woman. Evidence for or against adjunctive imaging is very limited in women found to have dense breasts in an otherwise negative mammogram, and suggests that ultrasonography and MRI (as well as tomosynthesis) can detect additional breast cancers while also generating more false-positive results.8 Thus, the USPSTF does not recommend specific screening strategies for women with dense breasts.
How I counsel my patients
I plan to continue recommending screening based on USPSTF guidance. However, I also will continue to support the preferences of many of my patients to:
- initiate screening before age 50
- undergo screening annually
- continue screening after age 74.
You and your patients alike may find the USPSTF’s Summary for Patients9 (http://annals.org/article.aspx?articleid=2480981&resultClick=3) to be helpful when navigating this territory.
Share your thoughts! Send your Letter to the Editor to [email protected]. Please include your name and the city and state in which you practice.
- US Preventive Services Task Force. Screening for breast cancer: US Preventive Services Task Force recommendation statement. Ann Intern Med. 2009;151(10):716−726.
- Siu AL; US Preventive Services Task Force. Screening for breast cancer: US Preventive Services Task Force recommendation statement [published online ahead of print January 12, 2016]. Ann Intern Med. doi:10.7326/M15-2886.
- Nelson HD, Pappas M, Cantor A, Griffin J, Daeges M, Humphrey L. Harms of breast cancer screening: systematic review to update the 2009 US Preventive Services Task Force recommendation [published online ahead of print January 12, 2016]. Ann Intern Med. doi: 10.7326/M15-0970.
- Mandelblatt JS, Stout NK, Schechter CB, et al. Collaborative modeling of the benefits and harms associated with different US breast cancer screening strategies [published online ahead of print January 12, 2016]. Ann Intern Med. doi: 10.7326 /M15-1536.
- Oeffinger KC, Fontham ET, Etzioni R, et al; American Cancer Society. Breast cancer screening for women at average risk: 2015 guideline update from the American Cancer Society. JAMA. 2015;314(15):1599−1614.
- Nelson HD, OMeara ES, Kerlikowski K, Balch S, Miglioretti D. Factors associated with rates of false-positive and false-negative results from digital mammography screening: an analysis of registry data [published online ahead of print January 12, 2016]. Ann Intern Med. doi: 10.7326/M15-0971.
- Miglioretti DL, Lange J, van den Broek JJ, et al. Radiation-induced breast cancer incidence and mortality from digital mammography screening: a modeling study [published online ahead of print January 12, 2016]. Ann Intern Med. doi: 10.7326 /M15-1241.
- Melnikow J, Fenton JJ, Whitlock EP, et al. Supplemental screening for breast cancer in women with dense breasts: a systematic review for the US Preventive Services Task Force [published online ahead of print January 12, 2016]. Ann Intern Med. doi: 10.7326/M15-1789.
- Siu AL; US Preventive Services Task Force. Screening for breast cancer: US Preventive Services Task Force Recommendation Statement (Summary for Patients). Ann Intern Med. 2016:164:279–296. http://annals.org/article.aspx?articleid=2480981&resultClick=3. Published January 12, 2016. Accessed January 25, 2016.