User login
Register for VAM for Chance to Win a New iPad Pro
The Vascular Annual Meeting – affectionately known as VAM – is in little over a week. For those who haven’t registered yet, what are you waiting for?
When registration hits 1,485 – the number of people registered in 2015 BEFORE VAM opened – all registrants are entered into a drawing to win a new iPad Pro.
Don’t wait -- register today.
Implanted phrenic-nerve stimulator improves central sleep apnea
FLORENCE, ITALY – In patients with moderate to severe central sleep apnea, an implanted device that stimulates the phrenic nerve to optimize diaphragm-driven breathing met its efficacy and safety goals, based on results from a multicenter, controlled trial with 151 patients.
Among the 68 patients randomized to active treatment with the device and available for follow-up after 6 months on treatment, 35 patients (51%) had a 50% or better reduction in their apnea-hypopnea index compared with 8 of 73 patients (11%) who had this level of response following device implantation but without its active use.
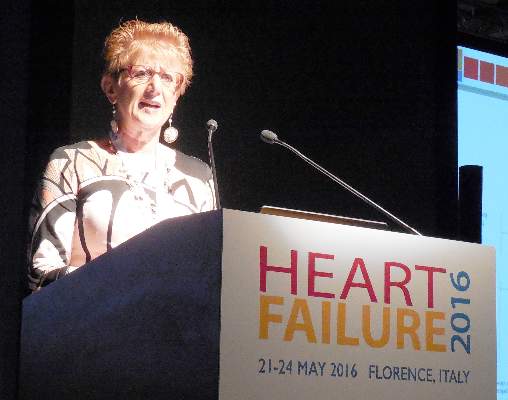
This statistically significant difference in response to the study’s primary endpoint should pave the way for the device’s approval, Dr. Maria Rosa Costanzo said at a meeting held by the Heart Failure Association of the European Society of Cardiology.
Although the trial enrolled patients with a mix of disorders that caused their central sleep apnea, the majority, 80 patients, had heart failure. Other enrollees had their breathing disorder secondary to atrial fibrillation, hypertension, and other diseases, suggesting that the implanted device, called the remede System, is suitable for patients with moderate to severe central sleep apnea regardless of the etiology, said Dr. Costanzo, medical director for heart failure at the Advocate Medical Group in Naperville, Ill. Among the 80 heart failure patients in the trial, the percentage of patients on active treatment who had a 50% or better reduction in their apnea-hypopnea index closely matched the rate in the entire study group.
The results also demonstrated the treatment’s safety, with a 9% rate of serious adverse events secondary to either the device’s implantation or function during the 12 months following placement in all 151 patients enrolled. Patients in the control arm had a device implanted but not turned on during the first 6 months of the study. The device was turned on and they received active treatment during the next 6 months. The trial’s prespecified safety goal, developed in conjunction with the Food and Drug Administration, was a 1-year rate of freedom from a serious adverse event of at least 80%; the actual rate achieved was 91%.
Successful implantation of the device by electrophysiology cardiologists occurred in 97% of enrolled patients, a procedure that took an average of nearly 3 hours. Need for a lead revision, one of the serious adverse events tallied during follow-up, occurred in 3% of patients. No patients in the study died during 1-year follow-up. Most other serious adverse events involved lead reposition (but not revision) to better optimize the phrenic nerve stimulation. Dr. Costanzo likened the complexity of implanting and operating the device to placement and use of a cardiac resynchronization device.
The efficacy and safety of the device shown in this pivotal trial “should be plenty” for obtaining FDA approval, predicted Dr. Costanzo, the study’s lead investigator, which would make it the first approved intervention for central sleep apnea. “I think this is a game changer,” she said in an interview.
But coming less than a year after a report of an unexpected excess-mortality rate in heart failure patients treated for central sleep apnea with an adaptive servo-ventilation device (N Engl J Med. 2015 Sept 17;373[12]:1095-1105), heart-failure specialists are now more demanding about the data needed to prove safety and clinical benefit from an intervention that targets central sleep apnea and sleep-disordered breathing.
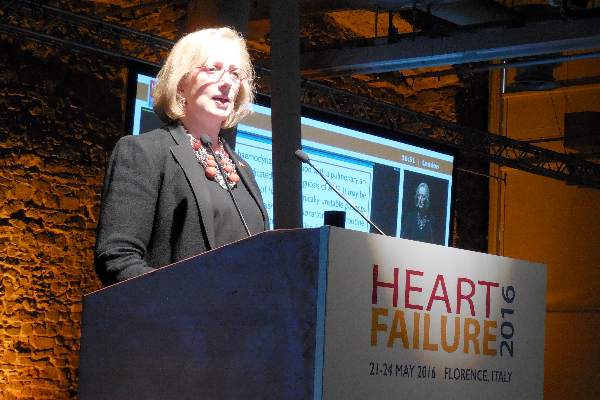
“I think we need an endpoint that involves hospitalizations and death” to more clearly demonstrate meaningful clinical benefit and safety, said Dr. Mariell Jessup, a professor of medicine and heart failure specialist at the University of Pennsylvania in Philadelphia. Following the experience with increased mortality from servo-ventilation “we now need to demand” more comprehensive safety data in sleep trials. Also, the approach tested in this study involves “putting a device into patients, so it’s not completely benign,” she said in an interview. “A lot of things that we thought made a lot of sense, like treating a heart-failure patient’s sleep apnea, turned out to cause things we didn’t expect. We need to be cautious.”
Dr. Costanzo agreed that there is need for additional studies of the phrenic-nerve stimulating device in larger number of heart failure patients that involve heart-failure-specific endpoints. But she also stressed how life changing this intervention was for some of the patients in the study. “The transformation of their lives was unbelievable. They said things like ‘I feel I have my life back.’ ”
She also stressed that the mechanism of action of phrenic nerve stimulation is dramatically different from more traditional sleep-apnea treatments that have relied on positive air pressure devices.
Phrenic nerve stimulation causes contraction of a patient’s diaphragm that creates negative pressure within the chest cavity in a manner similar to that of natural breathing. The stimulation is adjusted to make it imperceptible to patients, and stimulation does not occur when a patient is standing or sitting, only when lying down. “With positive airway pressure in patients with advanced heart failure you reduce venous return, and when a patient’s heart is sick and depends on preload this can hurt the patient. Phrenic nerve stimulation does the opposite. It contracts the diaphragm and creates negative pressure, so it anything it facilitates venous return,” she explained.
The trial, run at 31 centers, mostly in the United States with the others in Europe, enrolled patients with moderate to severe central sleep apnea with an average apnea-hypopnea index of 45 episodes per hour while sleeping. The average age was 65 years, about 90% of the patients were men, and average body mass index was 31 kg/m2.
In addition to the primary efficacy endpoint of reduced apnea-hypopnea index, the patients on active treatment also showed statistically significant reductions compared with baseline in central apnea episodes and in daytime sleepiness measured on the Epworth Sleepiness Scale and an improvement in the patients’ global assessment of their condition. The changes did not occur in the control patients. In the treated patients central apnea episodes fell from an average of 32 episodes per hour at baseline to an average of 6 central episodes an hour after 6 months on treatment.
Dr. Costanzo is a consultant to and has received research support from Respicardia, the company developing the tested phrenic-nerve stimulation device. Dr. Jessup had no disclosures.
On Twitter @mitchelzoler
This is a really interesting and provocative study that tests a concept that flies in the face of conventional wisdom. In the past, we tried our best to avoid phrenic nerve stimulation when implanting pacemakers or other devices; it was considered a side effect. With the approach studied in this new trial, phrenic-nerve stimulation is the goal.

|
Dr. Frank Ruschitzka |
I see inherent drawbacks with a treatment that requires implantation of a device. Implanted devices never deliver an unmitigated good; there is always a downside. I am very interested in seeing more complete safety data to better judge the potential risks from this treatment. The report from the SERVE-HF trial last year (N Engl J Med. 2015 Sept 17;373[12]:1095-1105), which showed excess mortality from a different treatment for central sleep apnea, further highlighted the importance of fully evaluating safety when treating central sleep apnea.
Another important issue is does the reduction in apnea-hypopnea index seen in this trial translate into a clinically-meaningful benefit? Ultimately that is what is important, but so far it hasn’t been shown. The treatment did, on average, decrease the apnea-hypopnea index, but does it decrease outcomes like hospitalizations or deaths? We need to see is more data specifically in heart failure patients. When judging the value of a device what we want to see are no safety concerns and fewer clinical events.
Dr. Frank Ruschitzka is professor of cardiology and head of the heart failure unit at University Hospital in Zurich. He made these comments in an interview. He had no disclosures.
This is a really interesting and provocative study that tests a concept that flies in the face of conventional wisdom. In the past, we tried our best to avoid phrenic nerve stimulation when implanting pacemakers or other devices; it was considered a side effect. With the approach studied in this new trial, phrenic-nerve stimulation is the goal.
|
|
Dr. Frank Ruschitzka |
I see inherent drawbacks with a treatment that requires implantation of a device. Implanted devices never deliver an unmitigated good; there is always a downside. I am very interested in seeing more complete safety data to better judge the potential risks from this treatment. The report from the SERVE-HF trial last year (N Engl J Med. 2015 Sept 17;373[12]:1095-1105), which showed excess mortality from a different treatment for central sleep apnea, further highlighted the importance of fully evaluating safety when treating central sleep apnea.
Another important issue is does the reduction in apnea-hypopnea index seen in this trial translate into a clinically-meaningful benefit? Ultimately that is what is important, but so far it hasn’t been shown. The treatment did, on average, decrease the apnea-hypopnea index, but does it decrease outcomes like hospitalizations or deaths? We need to see is more data specifically in heart failure patients. When judging the value of a device what we want to see are no safety concerns and fewer clinical events.
Dr. Frank Ruschitzka is professor of cardiology and head of the heart failure unit at University Hospital in Zurich. He made these comments in an interview. He had no disclosures.
FLORENCE, ITALY – In patients with moderate to severe central sleep apnea, an implanted device that stimulates the phrenic nerve to optimize diaphragm-driven breathing met its efficacy and safety goals, based on results from a multicenter, controlled trial with 151 patients.
Among the 68 patients randomized to active treatment with the device and available for follow-up after 6 months on treatment, 35 patients (51%) had a 50% or better reduction in their apnea-hypopnea index compared with 8 of 73 patients (11%) who had this level of response following device implantation but without its active use.
This statistically significant difference in response to the study’s primary endpoint should pave the way for the device’s approval, Dr. Maria Rosa Costanzo said at a meeting held by the Heart Failure Association of the European Society of Cardiology.
Although the trial enrolled patients with a mix of disorders that caused their central sleep apnea, the majority, 80 patients, had heart failure. Other enrollees had their breathing disorder secondary to atrial fibrillation, hypertension, and other diseases, suggesting that the implanted device, called the remede System, is suitable for patients with moderate to severe central sleep apnea regardless of the etiology, said Dr. Costanzo, medical director for heart failure at the Advocate Medical Group in Naperville, Ill. Among the 80 heart failure patients in the trial, the percentage of patients on active treatment who had a 50% or better reduction in their apnea-hypopnea index closely matched the rate in the entire study group.
The results also demonstrated the treatment’s safety, with a 9% rate of serious adverse events secondary to either the device’s implantation or function during the 12 months following placement in all 151 patients enrolled. Patients in the control arm had a device implanted but not turned on during the first 6 months of the study. The device was turned on and they received active treatment during the next 6 months. The trial’s prespecified safety goal, developed in conjunction with the Food and Drug Administration, was a 1-year rate of freedom from a serious adverse event of at least 80%; the actual rate achieved was 91%.
Successful implantation of the device by electrophysiology cardiologists occurred in 97% of enrolled patients, a procedure that took an average of nearly 3 hours. Need for a lead revision, one of the serious adverse events tallied during follow-up, occurred in 3% of patients. No patients in the study died during 1-year follow-up. Most other serious adverse events involved lead reposition (but not revision) to better optimize the phrenic nerve stimulation. Dr. Costanzo likened the complexity of implanting and operating the device to placement and use of a cardiac resynchronization device.
The efficacy and safety of the device shown in this pivotal trial “should be plenty” for obtaining FDA approval, predicted Dr. Costanzo, the study’s lead investigator, which would make it the first approved intervention for central sleep apnea. “I think this is a game changer,” she said in an interview.
But coming less than a year after a report of an unexpected excess-mortality rate in heart failure patients treated for central sleep apnea with an adaptive servo-ventilation device (N Engl J Med. 2015 Sept 17;373[12]:1095-1105), heart-failure specialists are now more demanding about the data needed to prove safety and clinical benefit from an intervention that targets central sleep apnea and sleep-disordered breathing.
“I think we need an endpoint that involves hospitalizations and death” to more clearly demonstrate meaningful clinical benefit and safety, said Dr. Mariell Jessup, a professor of medicine and heart failure specialist at the University of Pennsylvania in Philadelphia. Following the experience with increased mortality from servo-ventilation “we now need to demand” more comprehensive safety data in sleep trials. Also, the approach tested in this study involves “putting a device into patients, so it’s not completely benign,” she said in an interview. “A lot of things that we thought made a lot of sense, like treating a heart-failure patient’s sleep apnea, turned out to cause things we didn’t expect. We need to be cautious.”
Dr. Costanzo agreed that there is need for additional studies of the phrenic-nerve stimulating device in larger number of heart failure patients that involve heart-failure-specific endpoints. But she also stressed how life changing this intervention was for some of the patients in the study. “The transformation of their lives was unbelievable. They said things like ‘I feel I have my life back.’ ”
She also stressed that the mechanism of action of phrenic nerve stimulation is dramatically different from more traditional sleep-apnea treatments that have relied on positive air pressure devices.
Phrenic nerve stimulation causes contraction of a patient’s diaphragm that creates negative pressure within the chest cavity in a manner similar to that of natural breathing. The stimulation is adjusted to make it imperceptible to patients, and stimulation does not occur when a patient is standing or sitting, only when lying down. “With positive airway pressure in patients with advanced heart failure you reduce venous return, and when a patient’s heart is sick and depends on preload this can hurt the patient. Phrenic nerve stimulation does the opposite. It contracts the diaphragm and creates negative pressure, so it anything it facilitates venous return,” she explained.
The trial, run at 31 centers, mostly in the United States with the others in Europe, enrolled patients with moderate to severe central sleep apnea with an average apnea-hypopnea index of 45 episodes per hour while sleeping. The average age was 65 years, about 90% of the patients were men, and average body mass index was 31 kg/m2.
In addition to the primary efficacy endpoint of reduced apnea-hypopnea index, the patients on active treatment also showed statistically significant reductions compared with baseline in central apnea episodes and in daytime sleepiness measured on the Epworth Sleepiness Scale and an improvement in the patients’ global assessment of their condition. The changes did not occur in the control patients. In the treated patients central apnea episodes fell from an average of 32 episodes per hour at baseline to an average of 6 central episodes an hour after 6 months on treatment.
Dr. Costanzo is a consultant to and has received research support from Respicardia, the company developing the tested phrenic-nerve stimulation device. Dr. Jessup had no disclosures.
On Twitter @mitchelzoler
AT HEART FAILURE 2016
Key clinical point: An implanted device that cuts patients’ apnea-hypopnea index was safe and effective, based on results from a pivotal trial.
Major finding: A 50% or greater reduction in apnea-hypopnea index was seen in 51% of patients who received a phrenic-nerve stimulation device and 11% of control patients.
Data source: Randomized, multicenter trial with 151 patients with central sleep apnea of various etiologies.
Disclosures: Dr. Costanzo is a consultant to and has received research support from Respicardia, the company developing the tested phrenic-nerve stimulation device. Dr. Jessup had no disclosures.

Tacrolimus worsens IBD post liver transplant for primary sclerosing cholangitis
SAN DIEGO – A retrospective study provides insight as to why some patients have a milder versus a more severe course of inflammatory bowel disease (IBD) after liver transplant for primary sclerosing cholangitis (PSC).
Recurrent PSC, prolonged use of steroids, and cancer development after liver transplant were associated with a milder course of IBD, but tacrolimus use was associated with increased IBD flare post transplant.
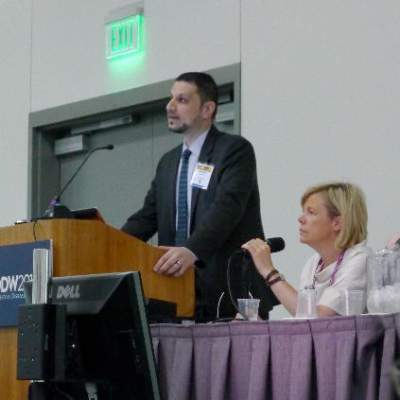
“The course of IBD is highly variable after liver transplant for PSC. PSC is associated with IBD in 60% to 90% of patients, and IBD worsens in about 30% of PSC-IBD patients after transplant. We wanted to explore the risk factors for worsening IBD in this setting,” Dr. Mohamad Mouchli of the Mayo Clinic in Rochester, Minn., explained at the annual Digestive Disease Week.
For purposes of this study, progression of IBD was defined as the need for escalation of medical therapy, compared with before liver transplant, or need for colectomy for medically refractory IBD.
The study population included patients with PSC-IBD who underwent liver transplant for noncholangiocarcinoma indications at the Mayo Clinic from 1998 to 2012. Patients were followed through February 2015.
The investigators screened 373 patients: After exclusions for cancer, no IBD at transplant, and pretransplant colectomy, 151 patients with an intact colon were left and formed the basis of further analysis.
Median age at transplant was 46 years and two-thirds of the patients were male. Transplant-related variables included the following: 23% experienced allograft failure, 36% had recurrent PSC, 25.2% had CMV infection, 19.2% were retransplanted, 22.5% developed cancer after liver transplant, and 52.3% had acute cellular rejection.
Before transplant, 69 patients had quiescent IBD with no therapy and 62 were maintained on 5-aminosalicylates. Post transplant, despite transplant-related immunosuppression, 56 patients (37.1%) required escalation of therapy, 87 patients (57.6%) had a stable course, and 8 patients (5.3%) improved.
Risk of IBD progression at 1, 5, and 10 years was 4%, 18.5%, and 25.5%, respectively. Thirty-five patients underwent colectomy after transplant: the 1-, 5-, and 10-year risks of colectomy were 2%, 9.3%, and 17.2%, respectively. Fourteen percent of patients required anti–tumor necrosis factor therapy after transplant.
On multivariate analysis, tacrolimus exposure emerged as a risk factor for progression of IBD. Tacrolimus immunosuppression was twice as likely as cyclosporine-based immunosuppression to lead to IBD progression. By contrast, recurrent PSC, use of steroids for longer than 6 months, and cancer development after liver transplant were protective of IBD progression.
No association was found between progression of IBD and transplant-related infection or mismatch, immunosuppression with mycophenolate or azathioprine, or IBD-related factors such as pretransplant IBD status or empirical initiation of 5-aminosalicylates within 4 months of liver transplant. During the question-and-answer session following his presentation, Dr. Mouchli was asked whether these results justify prophylactic colectomy. He said that could be considered in patients with active IBD before transplant, but on a case-by-case basis.
SAN DIEGO – A retrospective study provides insight as to why some patients have a milder versus a more severe course of inflammatory bowel disease (IBD) after liver transplant for primary sclerosing cholangitis (PSC).
Recurrent PSC, prolonged use of steroids, and cancer development after liver transplant were associated with a milder course of IBD, but tacrolimus use was associated with increased IBD flare post transplant.
“The course of IBD is highly variable after liver transplant for PSC. PSC is associated with IBD in 60% to 90% of patients, and IBD worsens in about 30% of PSC-IBD patients after transplant. We wanted to explore the risk factors for worsening IBD in this setting,” Dr. Mohamad Mouchli of the Mayo Clinic in Rochester, Minn., explained at the annual Digestive Disease Week.
For purposes of this study, progression of IBD was defined as the need for escalation of medical therapy, compared with before liver transplant, or need for colectomy for medically refractory IBD.
The study population included patients with PSC-IBD who underwent liver transplant for noncholangiocarcinoma indications at the Mayo Clinic from 1998 to 2012. Patients were followed through February 2015.
The investigators screened 373 patients: After exclusions for cancer, no IBD at transplant, and pretransplant colectomy, 151 patients with an intact colon were left and formed the basis of further analysis.
Median age at transplant was 46 years and two-thirds of the patients were male. Transplant-related variables included the following: 23% experienced allograft failure, 36% had recurrent PSC, 25.2% had CMV infection, 19.2% were retransplanted, 22.5% developed cancer after liver transplant, and 52.3% had acute cellular rejection.
Before transplant, 69 patients had quiescent IBD with no therapy and 62 were maintained on 5-aminosalicylates. Post transplant, despite transplant-related immunosuppression, 56 patients (37.1%) required escalation of therapy, 87 patients (57.6%) had a stable course, and 8 patients (5.3%) improved.
Risk of IBD progression at 1, 5, and 10 years was 4%, 18.5%, and 25.5%, respectively. Thirty-five patients underwent colectomy after transplant: the 1-, 5-, and 10-year risks of colectomy were 2%, 9.3%, and 17.2%, respectively. Fourteen percent of patients required anti–tumor necrosis factor therapy after transplant.
On multivariate analysis, tacrolimus exposure emerged as a risk factor for progression of IBD. Tacrolimus immunosuppression was twice as likely as cyclosporine-based immunosuppression to lead to IBD progression. By contrast, recurrent PSC, use of steroids for longer than 6 months, and cancer development after liver transplant were protective of IBD progression.
No association was found between progression of IBD and transplant-related infection or mismatch, immunosuppression with mycophenolate or azathioprine, or IBD-related factors such as pretransplant IBD status or empirical initiation of 5-aminosalicylates within 4 months of liver transplant. During the question-and-answer session following his presentation, Dr. Mouchli was asked whether these results justify prophylactic colectomy. He said that could be considered in patients with active IBD before transplant, but on a case-by-case basis.
AT DDW® 2016
Key clinical point: Tacrolimus exposure was an independent risk factor for IBD progression after liver transplant in patients with PSC-IBD.
Major finding: Tacrolimus immunosuppression was twice as likely as cyclosporine-based immunosuppression to lead to worsening IBC post liver transplant.
Data source: Retrospective study of the natural history of IBD following liver transplant in 151 patients with PSC-IBD.
Disclosures: Dr. Mouchli had no financial disclosures to report.

Updated CHEST Guidelines for Antithrombotic Therapy of VTE
Clinical question: What are the current recommendations for antithrombotic therapy in various venous thromboembolism (VTE) scenarios?

Background: VTE is commonly encountered with a multitude of therapeutic options. Selecting the optimal anticoagulant is as important as making the diagnosis and requires knowledge of individual patient characteristics to initiate the correct therapy. These factors include malignancy, location of thrombus, and history of recurrent VTE despite anticoagulation.
Study design: Guideline.
Setting: Expert panel.
Synopsis: For VTE patients without cancer, non-vitamin K oral anticoagulants (NOAC) are now suggested over vitamin K antagonists (Grade 2B). However, there remains no strong evidence to favor one NOAC over another.
Better evidence now supports the prior recommendation to discourage IVC filters for VTE that is being treated with anticoagulation (Grade 1B).
In pulmonary embolism of the subsegmental type without proximal DVT, clinical surveillance is favored over anticoagulation in lower-risk patients (Grade 2C).
Low-molecular-weight heparin (LMWH) is advised in recurrent VTE treated with non-LMWH, and for recurrences on LMWH, a dose increase of LMWH is advised (Grade 2C).
Finally, routine use of compression stockings for post-thrombotic syndrome prevention is not routinely recommended (Grade 2B).
Limitations include only 20 of the 54 total recommendations being of strong Grade 1 criteria. Additionally, none of the 54 statements are drawn from high-quality evidence.
Further study is needed to continually update our practice in caring for VTE disease as more experience and comparison data are obtained with the use of NOAC drugs.
Bottom line: Anticoagulant therapy recommendations have been updated, but few are strong recommendations and none are based on high-quality evidence.
Citation: Kearon C, Akl EA, Ornelas J, et al. Antithrombotic therapy for VTE disease: CHEST guideline and expert panel report. Chest. 2016;149(2):315-352.
Clinical question: What are the current recommendations for antithrombotic therapy in various venous thromboembolism (VTE) scenarios?
Background: VTE is commonly encountered with a multitude of therapeutic options. Selecting the optimal anticoagulant is as important as making the diagnosis and requires knowledge of individual patient characteristics to initiate the correct therapy. These factors include malignancy, location of thrombus, and history of recurrent VTE despite anticoagulation.
Study design: Guideline.
Setting: Expert panel.
Synopsis: For VTE patients without cancer, non-vitamin K oral anticoagulants (NOAC) are now suggested over vitamin K antagonists (Grade 2B). However, there remains no strong evidence to favor one NOAC over another.
Better evidence now supports the prior recommendation to discourage IVC filters for VTE that is being treated with anticoagulation (Grade 1B).
In pulmonary embolism of the subsegmental type without proximal DVT, clinical surveillance is favored over anticoagulation in lower-risk patients (Grade 2C).
Low-molecular-weight heparin (LMWH) is advised in recurrent VTE treated with non-LMWH, and for recurrences on LMWH, a dose increase of LMWH is advised (Grade 2C).
Finally, routine use of compression stockings for post-thrombotic syndrome prevention is not routinely recommended (Grade 2B).
Limitations include only 20 of the 54 total recommendations being of strong Grade 1 criteria. Additionally, none of the 54 statements are drawn from high-quality evidence.
Further study is needed to continually update our practice in caring for VTE disease as more experience and comparison data are obtained with the use of NOAC drugs.
Bottom line: Anticoagulant therapy recommendations have been updated, but few are strong recommendations and none are based on high-quality evidence.
Citation: Kearon C, Akl EA, Ornelas J, et al. Antithrombotic therapy for VTE disease: CHEST guideline and expert panel report. Chest. 2016;149(2):315-352.

Tamsulosin Can Be Used as Expulsive Therapy for Some Ureteric Stones
Clinical question: Is tamsulosin efficacious as an expulsive therapy for distal ureter stones ≤10 mm in diameter?
Background: Ureteric calculi are a common reason for hospital admission, and use of medical expulsive therapy during observation periods for small caliber stones has gained much attention recently. Specifically, tamsulosin has been suggested as a medical therapy for small stones.
Study design: Randomized, double-blind, placebo-controlled study.
Setting: Five EDs in Australia.
Synopsis: A total of 403 patients participated in the study, based on inclusion criteria of age older than 18 years with symptoms and CT evidence of ureteric stones Exclusion criteria included fever, glomerular filtration rate <60, and calculi >10 mm. Patients were randomized to placebo or 0.4 mg tamsulosin daily for 28 days. The outcome was stone expulsion demonstrated by absence of calculi on repeat CT. Stone passage in the entire group occurred in 87% of the tamsulosin arm and 81.9% of the placebo, with a 95% CI of -3.0% to 13%, which was not a significant difference with P=0.22.
Interestingly, in a subgroup analysis of larger stones 5–10 mm, 83% of tamsulosin subjects compared to 61% of placebo subjects had stone passage that was significant at a 22% difference and P=.03.
Limitations included compliance in both groups, applicability to other populations given study based in Australia, and the lack of follow-through with CT scan at 28 days in 17% of the original group, resulting in missing outcome data.
Bottom line: Patients with ureteric stones 5–10 mm in size demonstrate increased spontaneous stone expulsion with the addition of tamsulosin and should thus be offered this therapy.
Citation: Furyk J, Chu K, Banks C, et al. Distal ureteric stones and tamsulosin: a double-blind, placebo-controlled, randomized, multicenter trial. Ann Emerg Med. 2016;67(1):86-95.e2.
Short Take
Low Diagnostic Yield of Blood Cultures in Hospitalized Medical Patients
Prospective cohort study of patients hospitalized on a medical service demonstrated a true positive rate of blood cultures that was lower than previously studied. Using objective clinical predictors may improve likelihood of true positive blood cultures.
Citation: Linsenmeyer K, Gupta K, Strymish JM, Dhanani M, Brecher SM, Breu AC. Culture if spikes? Indications and yield of blood cultures in hospitalized medical patients [published online ahead of print January 13, 2016]. J Hosp Med. doi:10.1002/jhm.2541.
Study reveals how BET inhibitors kill cancer cells
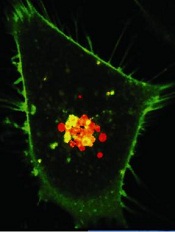
Image courtesy of PNAS
Researchers say they have determined how BET inhibitors fight hematologic malignancies.
Previous studies showed that BET inhibitors are effective at halting tumor growth, but it wasn’t clear whether the drugs kill cancer cells outright or merely pause their growth.
The new study provides an answer and reveals potential ways in which cancer cells may develop resistance to BET inhibitors.
The findings have been published in Leukaemia.
Researchers tested the BET inhibitors JQ1 and IBET151 in a range of hematopoietic cancer cell lines (leukemias, lymphomas, and multiple myeloma) and in mice (with and without malignancy).
The team found that JQ1’s ability to kill cancer cells principally relies on the activation of BAX/BAK-dependent mitochondrial apoptosis. They said this is largely triggered by upregulation of the protein BIM when BET inhibitors suppress miR-17-92, a post-transcriptional repressor of BIM expression.
“We found that when apoptosis was impaired—for instance, by loss of BIM—the BET inhibitors were no longer effective,” said study author Zhen Xu, PhD, of Walter and Eliza Hall Institute of Medical Research in Melbourne, Victoria, Australia.
“This suggests that cancer cells that acquire mutations in genes that drive apoptosis will lose sensitivity to BET inhibitors and thus will be able to survive treatment, leading to disease relapse.”
The researchers also found that BET inhibitors could induce apoptosis in normal hematopoietic cells, particularly those of lymphoid origin. The team said this suggests the cells’ susceptibility to BET inhibitors did not arise from oncogenic transformation.
These findings could help researchers improve strategies for using BET inhibitors to treat cancers, according to study author Stefan Glaser, PhD, of the Walter and Eliza Hall Institute of Medical Research.
“Understanding how the drugs work gives us the opportunity to investigate new treatments—for example, by using combination therapies or altering the dosage and timing of treatment to prevent drug resistance from emerging,” Dr Glaser said. ![]()
Fertility concerns of female cancer survivors

Photo by Vera Kratochvil
A new study indicates that many young adult female cancer survivors do not receive adequate information about their fertility as part of their survivorship care, despite having concerns about their ability to bear children in the future.
The research, published in Cancer, suggests a need for better resources to support cancer survivors in making informed decisions about their reproductive options after they complete treatment.
To conduct this study, Catherine Benedict, PhD, of North Shore-Long Island Jewish Medical Center in Manhasset, New York, and her colleagues asked female cancer survivors to complete a web-based, anonymous survey.
There were 346 participants. They had an average age of 29.9 and had completed treatment an average of 4.9 years earlier.
The investigators focused on a subgroup of 179 women with uncertain fertility status who had not previously undergone or attempted fertility preservation, either before or after their cancer treatment, and who either wanted future children or were unsure.
Many of these women said they did not have enough information concerning their risk of infertility (58%), risk of early menopause (60%), options to assess their fertility (62%), options to preserve their fertility (51%), or options for alternative family building (43%).
The women’s greatest reproductive concerns were potential fertility problems and the health of a future child. Sixty-four percent of the women said they were concerned about not being able to have children (or more children), and 59% were worried about passing the risk of cancer on to their future children.
Only 13% of women said they were well informed about options for preserving fertility, and 74% were unclear about their personal values regarding fertility preservation.
Seventy percent of the women said they hadn’t received enough advice on fertility preservation, and 35% said they didn’t have enough support to make a decision about fertility preservation.
The investigators found a significant association between greater unmet information needs and higher levels of decisional conflict about fertility preservation (P<0.001).
On the other hand, having undergone a fertility evaluation after treatment was associated with lower decisional conflict (P=0.02).
The investigators said these findings establish the need for support services to help young female cancer survivors make decisions about fertility preservation and family-building as part of survivorship care.
The literature has largely focused on the clinical and support needs of women making fertility decisions before their treatment begins, but most patients do not preserve their fertility before treatment for a number of reasons, despite wanting children in the future.
“The potential loss of fertility has been described in the literature as being almost as painful, if not more so, than the cancer diagnosis itself,” Dr Benedict said.
“Failure to provide information and address concerns with respect to fertility-related decisions may have lasting consequences for young women who hope to move on from their cancer experience to achieve important life goals such as having children. For women at risk for early menopause, delaying fertility-related decisions may cause them to miss their narrowed window of opportunity to preserve their fertility, if desired.” ![]()
Cognitive impairment in ALL survivors

Photo by Bill Branson
New research indicates that survivors of pediatric acute lymphoblastic leukemia (ALL) suffer from brain injury even if they have no history of central nervous system disease or cranial radiation.
The study suggests the neurotoxic effects of chemotherapeutic drugs on the developing brains of young ALL patients may impair their cognitive functioning by disrupting the formation of neural networks that connect brain regions and transfer information.
Shelli Kesler, PhD, of the University of Texas MD Anderson Cancer Center in Houston, and her colleagues reported these findings in Brain Connectivity.
The researchers used diffusion tensor imaging to analyze and compare the gray matter connectome of 31 pediatric ALL survivors and 39 matched control subjects.
The team found significantly greater cognitive impairment among the ALL survivors (P=0.027), as well as significantly lower connectivity, based on small-worldness (P=0.007) and network clustering coefficient (P=0.019).
The researchers noted that clustered connectivity was altered in the parietal, frontal, hippocampal, amygdalar, thalamic, and occipital regions in the ALL survivors.
The team also described a model that can be used to predict cognitive impairment in ALL survivors. The model’s classification accuracy was 89.39% (P<0.0001), its sensitivity was 95.83%, and specificity was 85.71%.
“As survival rates for cancer patients increase, issues related to survivorship, such as chemotherapy-induced cognitive impairment, become more important to the cancer research community,” said Christopher Pawela, PhD, co-editor-in-chief of Brain Connectivity and an assistant professor at the Medical College of Wisconsin in Milwaukee.
“Dr Kesler and colleagues are developing new MRI-based biomarkers to measure brain changes associated with the neurotoxic effects of chemotherapy in the brain. These biomarkers may find utility in providing insight into the mechanisms of brain damage caused by chemotherapeutic drugs and could be used to develop neuroprotective therapies to mitigate the harmful effects of these drugs on the brain.” ![]()
Rotor ablation for atrial fibrillation strikes out in first randomized trial
SAN FRANCISCO – Focal impulse and rotor modulation-guided ablation for persistent atrial fibrillation – either alone or in conjunction with other procedures – increased procedural times without improving outcomes, according to the first randomized trial to assess its utility.
In fact, enrollment in the rotor ablation-only (RA) arm was halted early for futility. “There was 100% recurrence” of atrial fibrillation (AF), said senior investigator Dr. Andrea Natale, executive medical director of the Texas Cardiac Arrhythmia Institute, Austin.
“I’m surprised it took this long for a randomized study, because this system has been around for 5 or 6 years,” noted Dr. Natale. “Our community should demand these sorts of studies earlier, because it’s not fair for patients to go on with a procedure for years that has not been proven to be effective.
“For us, unless there is a new version of rotor mapping that I feel is significantly different, this will be the end of rotor ablation in my lab with this system [the Topera Physiologic Rotor Mapping Solution],” Dr. Natale said at the annual scientific sessions of the Heart Rhythm Society.
In the study, his team randomized 29 patients to RA only, 42 to RA plus pulmonary vein antral isolation (PVAI), and 42 to PVAI plus posterior wall and nonpulmonary vein trigger ablation.
At about 1 year, four RA-only patients (14%), 22 RA plus PVAI patients (52%), and 32 patients in the PVAI plus trigger group (76%) were free of AF and atrial tachycardias without antiarrhythmic drugs (P < .0001).
Meanwhile, RA alone and RA plus PVAI cases took about 230 minutes, while the more effective PVAI plus trigger approach took about 130 minutes (P < .001).
There was “a very poor outcome with rotor-only ablation,” Dr. Natale said. “There isn’t a benefit either alone or as an add-on strategy, at least with this mapping software.”
Perhaps “people who think rotors don’t exist are right,” he added. On the other hand, maybe the basket mapping catheter doesn’t touch enough of the left atrium, or the software that makes sense of what the catheter detects needs to be improved, Dr. Natale noted.
All the patients were undergoing their first ablation. They were in their early 60s, on average, and most were men. The mean left atrium diameter was about 47 mm, and mean left ventricle ejection fraction about 55%. There were no statistically significant differences between the study arms, and no significant differences in outcomes between the 70% of patients with persistent AF and the 30% with long-standing persistent AF.
There was no industry funding for the work. Dr. Natale disclosed relationships with Biosense Webster, Boston Scientific, Janssen, Medtronic, and St. Jude Medical.
My gut sense is that there’s something to rotor mapping, but we are not there yet. There are a lot of investment dollars and a lot of bright people working on this. It really is the Holy Grail to find the source of AF.
Dr. John Day is the director of Intermountain Heart Rhythm Specialists in Murray, Utah, and the current president of the Hearth Rhythm Society. He had no disclosures.
SAN FRANCISCO – Focal impulse and rotor modulation-guided ablation for persistent atrial fibrillation – either alone or in conjunction with other procedures – increased procedural times without improving outcomes, according to the first randomized trial to assess its utility.
In fact, enrollment in the rotor ablation-only (RA) arm was halted early for futility. “There was 100% recurrence” of atrial fibrillation (AF), said senior investigator Dr. Andrea Natale, executive medical director of the Texas Cardiac Arrhythmia Institute, Austin.
“I’m surprised it took this long for a randomized study, because this system has been around for 5 or 6 years,” noted Dr. Natale. “Our community should demand these sorts of studies earlier, because it’s not fair for patients to go on with a procedure for years that has not been proven to be effective.
“For us, unless there is a new version of rotor mapping that I feel is significantly different, this will be the end of rotor ablation in my lab with this system [the Topera Physiologic Rotor Mapping Solution],” Dr. Natale said at the annual scientific sessions of the Heart Rhythm Society.
In the study, his team randomized 29 patients to RA only, 42 to RA plus pulmonary vein antral isolation (PVAI), and 42 to PVAI plus posterior wall and nonpulmonary vein trigger ablation.
At about 1 year, four RA-only patients (14%), 22 RA plus PVAI patients (52%), and 32 patients in the PVAI plus trigger group (76%) were free of AF and atrial tachycardias without antiarrhythmic drugs (P < .0001).
Meanwhile, RA alone and RA plus PVAI cases took about 230 minutes, while the more effective PVAI plus trigger approach took about 130 minutes (P < .001).
There was “a very poor outcome with rotor-only ablation,” Dr. Natale said. “There isn’t a benefit either alone or as an add-on strategy, at least with this mapping software.”
Perhaps “people who think rotors don’t exist are right,” he added. On the other hand, maybe the basket mapping catheter doesn’t touch enough of the left atrium, or the software that makes sense of what the catheter detects needs to be improved, Dr. Natale noted.
All the patients were undergoing their first ablation. They were in their early 60s, on average, and most were men. The mean left atrium diameter was about 47 mm, and mean left ventricle ejection fraction about 55%. There were no statistically significant differences between the study arms, and no significant differences in outcomes between the 70% of patients with persistent AF and the 30% with long-standing persistent AF.
There was no industry funding for the work. Dr. Natale disclosed relationships with Biosense Webster, Boston Scientific, Janssen, Medtronic, and St. Jude Medical.
AT HEART RHYTHM 2016
Key clinical point: Focal impulse and rotor modulation-guided ablation for persistent atrial fibrillation – either alone or in conjunction with other procedures – increased procedural times without improving outcomes.
Major finding: At about 1 year, four rotor ablation-only patients (14%), 22 RA plus pulmonary vein antral isolation patients (52.4%), and 32 patients in the PVAI plus trigger group (76%) were free of atrial fibrillation and atrial tachycardias without antiarrhythmic drugs (P < .0001).
Data source: A randomized trial in 113 persistent AF patients.
Disclosures: There was no industry funding for the work. The senior investigator disclosed relationships with Biosense Webster, Boston Scientific, Janssen, Medtronic, and St. Jude Medical.

Nitroxl prodrug shows promise in acute heart failure
FLORENCE, ITALY – A novel intravenous prodrug that results in formation of nitroxyl once inside the body showed several potentially beneficial hemodynamic effects during a single, 6-hour infusion in a controlled proof-of-concept study with 46 patients hospitalized with advanced heart failure with reduced ejection fraction.
While receiving the drug, patients showed “statistically significant and clinically meaningful” reductions in pulmonary capillary wedge pressure and in pulmonary artery diastolic pressure, two of the studies three primary endpoints, Dr. Veselin Mitrovic said at a meeting held by the Heart Failure Association of the ESC.
For the study’s third primary endpoint, a change in cardiac index, treatment with the drug led to increased cardiac output using noninvasive measures, especially at the highest tested dose, as well as in all of the subset of treated patients in whom cardiac index was measured by thermodilution.
On the safety side, the drug appeared safe and well tolerated at all four tested doses, while causing no episodes of symptomatic hypotension and no increase in heart rate. Transient, asymptomatic reductions in blood pressure were similar in the treated and control patients.
“This is a very interesting and exciting drug that went in the right direction,” summed up Dr. Mitrovic, professor of cardiology at Goethe University in Frankfurt, Germany, and head of the department of cardiovascular research at the Kerckhoff Clinic in Bad Nauheim, Germany.
“This is the first demonstration of safety and preliminary efficacy in patients with advanced heart failure,” he said in an interview. “We had a very good clinical signal in a relatively small study. We now need a larger study.”
The drug “improved myocardial function in several ways: inotropy, lusitropy, and unloading. It also causes arterial vasodilation and increased stroke volume,” Dr. Mitrovic said. “Other drugs with a positive inotropic effect increase myocardial oxygen consumption; but with this drug, we see a neutral effect on mixed venous oxygen saturation. It balances myocardial oxygen consumption by its effect on unloading and reduced vascular resistance. This is a big advantage.”
Each molecule of nitroxyl is made from single atoms of hydrogen, nitrogen, and oxygen, and its physiologic action is distinct from nitric monoxide. Nitroxyl improves calcium efficiency and recycling without producing intracellular calcium overload, and its effects are not mediated by cyclic AMP or cyclic GMP.
The dose-ranging study enrolled 34 patients with New York Heart Association class III heart failure and 11 with class IV. All patients had to have a left ventricular ejection fraction of 40% or less, and their actual ejection fractions averaged about 25%.
When measured after 2, 4, and 6 hours of infusion, pulmonary capillary wedge pressure (PCWP) fell by an average of about 5 mm Hg, compared with baseline, among patients who received the three highest-dose infusions of the nitroxyl prodrug, known as CXL-1427, and by an average of about 3 mm Hg in those who received the lowest dose.
That effect had disappeared when PCWP was remeasured 2 hours after the end of the 6-hour infusion, and the 11 patients randomized to placebo showed no change at any time point in PCWP. The average declines in PCWP in each of the four dose groups were statistically significant changes, compared with the control patients.
All the drug-treated patients showed an average drop in pulmonary artery systolic pressure of about 5 mm Hg, compared with baseline, and about 3-4 mm Hg in pulmonary artery diastolic pressure. The patients who received the highest dose of CXL-1427 had an average drop in their right artery pressure of about 4 mm Hg. All of those decreases were statistically significant, compared with the lack of any measurable changes in the control patients.
Total peripheral resistance also showed statistically significant declines relative to baseline in all the treated patients when these decreases were compared with the controls.
CXL-1427 was initially developed by Cardioxyl Pharmaceuticals. Bristol-Myers Squibb acquired the company in late 2015. The study was sponsored by Cardioxyl. Dr. Mitrovic has been a consultant to Bayer, Cardiorentis, and Novartis.
On Twitter @mitchelzoler
Nitroxyl is a very promising and interesting drug. It had an effect on both contractility and inotropy, and also affected diastolic function and reduced afterload. The study’s inclusion criteria enrolled patients who are typical for acute heart failure. It is very important to conduct these sorts of hemodynamic studies of a drug’s effect in this setting.
This drug is obviously very powerful in reducing pulmonary capillary wedge pressure; only about 20% of patients did not respond. It also reduced both systolic and diastolic pulmonary artery pressure and right artery pressure, suggesting that it has a powerful effect on contractility in a way that not only affects the periphery by reducing systolic and diastolic pressures, but also produced little change in heart rate. What is important is that this drug acts at multiple points in the cardiovascular system.
The drug’s safety and tolerability looked very good, but it needs to undergo further study.
Dr. Petar M. Seferovic is a professor of cardiology at Belgrade University, Serbia. He made these comments as designated discussant for the report. He has been a speaker for and consultant to Berlin-Chemie, Boehringer Ingelheim, Pfizer, and Gedeon Richter.
FLORENCE, ITALY – A novel intravenous prodrug that results in formation of nitroxyl once inside the body showed several potentially beneficial hemodynamic effects during a single, 6-hour infusion in a controlled proof-of-concept study with 46 patients hospitalized with advanced heart failure with reduced ejection fraction.
While receiving the drug, patients showed “statistically significant and clinically meaningful” reductions in pulmonary capillary wedge pressure and in pulmonary artery diastolic pressure, two of the studies three primary endpoints, Dr. Veselin Mitrovic said at a meeting held by the Heart Failure Association of the ESC.
For the study’s third primary endpoint, a change in cardiac index, treatment with the drug led to increased cardiac output using noninvasive measures, especially at the highest tested dose, as well as in all of the subset of treated patients in whom cardiac index was measured by thermodilution.
On the safety side, the drug appeared safe and well tolerated at all four tested doses, while causing no episodes of symptomatic hypotension and no increase in heart rate. Transient, asymptomatic reductions in blood pressure were similar in the treated and control patients.
“This is a very interesting and exciting drug that went in the right direction,” summed up Dr. Mitrovic, professor of cardiology at Goethe University in Frankfurt, Germany, and head of the department of cardiovascular research at the Kerckhoff Clinic in Bad Nauheim, Germany.
“This is the first demonstration of safety and preliminary efficacy in patients with advanced heart failure,” he said in an interview. “We had a very good clinical signal in a relatively small study. We now need a larger study.”
The drug “improved myocardial function in several ways: inotropy, lusitropy, and unloading. It also causes arterial vasodilation and increased stroke volume,” Dr. Mitrovic said. “Other drugs with a positive inotropic effect increase myocardial oxygen consumption; but with this drug, we see a neutral effect on mixed venous oxygen saturation. It balances myocardial oxygen consumption by its effect on unloading and reduced vascular resistance. This is a big advantage.”
Each molecule of nitroxyl is made from single atoms of hydrogen, nitrogen, and oxygen, and its physiologic action is distinct from nitric monoxide. Nitroxyl improves calcium efficiency and recycling without producing intracellular calcium overload, and its effects are not mediated by cyclic AMP or cyclic GMP.
The dose-ranging study enrolled 34 patients with New York Heart Association class III heart failure and 11 with class IV. All patients had to have a left ventricular ejection fraction of 40% or less, and their actual ejection fractions averaged about 25%.
When measured after 2, 4, and 6 hours of infusion, pulmonary capillary wedge pressure (PCWP) fell by an average of about 5 mm Hg, compared with baseline, among patients who received the three highest-dose infusions of the nitroxyl prodrug, known as CXL-1427, and by an average of about 3 mm Hg in those who received the lowest dose.
That effect had disappeared when PCWP was remeasured 2 hours after the end of the 6-hour infusion, and the 11 patients randomized to placebo showed no change at any time point in PCWP. The average declines in PCWP in each of the four dose groups were statistically significant changes, compared with the control patients.
All the drug-treated patients showed an average drop in pulmonary artery systolic pressure of about 5 mm Hg, compared with baseline, and about 3-4 mm Hg in pulmonary artery diastolic pressure. The patients who received the highest dose of CXL-1427 had an average drop in their right artery pressure of about 4 mm Hg. All of those decreases were statistically significant, compared with the lack of any measurable changes in the control patients.
Total peripheral resistance also showed statistically significant declines relative to baseline in all the treated patients when these decreases were compared with the controls.
CXL-1427 was initially developed by Cardioxyl Pharmaceuticals. Bristol-Myers Squibb acquired the company in late 2015. The study was sponsored by Cardioxyl. Dr. Mitrovic has been a consultant to Bayer, Cardiorentis, and Novartis.
On Twitter @mitchelzoler
AT HEART FAILURE 2016
Key clinical point: Intravenous infusion of a nitroxyl prodrug for 6 hours showed safety and several promising hemodynamic effects in a pilot, controlled study with 46 patients with advanced heart failure.
Major finding: Pulmonary capillary wedge pressure fell by about 5 mm Hg throughout a 6-hour infusion at the three highest tested doses of a nitroxyl prodrug.
Data source: A single-center, single-dose study with 46 patients hospitalized with advanced heart failure.
Disclosures: The study was sponsored by Cardioxyl, the drug’s developer, which was recently acquired by Bristol-Myers Squibb. Dr. Mitrovic has been a consultant to Bayer, Cardiorentis, and Novartis.
