User login
Staffing, work environment drive VAP risk in the ICU
SAN FRANCISCO – The work environment for nurses and the physician staffing model in the intensive care unit influence patients’ likelihood of acquiring ventilator-associated pneumonia (VAP), based on a cohort study of 25 ICUs.
Overall, each 1-point increase in the score for the nurse work environment – indicating that nurses had a greater sense of playing an important role in patient care – was unexpectedly associated with a roughly sixfold higher rate of VAP among the ICU’s patients, according to data reported in a session and press briefing at an international conference of the American Thoracic Society. However, additional analyses showed that the rate of VAP was higher in closed units where a board-certified critical care physician (intensivist) managed and led care rather than an open unit where care is shared.

“We think that the organization of the ICU is actually influencing nursing practice, which is a really novel finding,” commented first author Deena Kelly Costa, PhD, RN, of the University of Michigan School of Nursing in Ann Arbor. “In closed ICUs, when you have a board-certified physician and an ICU team managing and leading care, even if the work environment is better, nurses may not feel as empowered to standardize their care or practice.”
“ICU nurses are the ones who are primarily responsible for VAP preventive practices: they keep the head of the bed higher than 45 degrees, they conduct oral care, they conduct (patient) surveillance. ICU physicians are involved with writing the orders and ventilator setting management. So how these providers work together could theoretically influence the risk for patients developing VAP,” Dr. Costa said.
“We need to be thinking a little bit more critically about not only the care that’s happening at the bedside... but also at an organizational level. How are these providers organized, and can we work together to improve patient outcomes?”
“I’m not suggesting that we get rid of all closed ICUs because I don’t think that’s the solution,” Dr. Costa maintained. “I think from an administrative perspective, we need to be considering what’s the organization of these clinicians and this unit, and [in a context-specific manner], how can we improve it for better patient outcomes? That may be both working on improving the work environment and making the nurses feel more empowered, or it could be potentially considering other staffing models.”
Some data have already linked a more favorable nurse work environment and the presence of a board-certified critical care physician independently with better patient outcomes in the ICU. But studies of their joint impact are lacking.
The investigators performed a secondary, unit-level analysis of nurse survey data collected during 2005 and 2006 in ICUs in southern Michigan.
In all, 462 nurses working in 25 ICUs completed the Practice Environment Scale of the Nursing Work Index, on which averaged summary scores range between 1 (unfavorable) and 4 (favorable). The scale captures environmental factors such as the adequacy of resources for nurses, support from their managers, and their level of involvement in hospital policy decisions.
The rate of VAP during the same period was assessed using data from more than 1,000 patients from each ICU.
The summary nurse work environment score averaged 2.69 points in the 21 ICUs that had a closed physician staffing model and 2.62 points in the 4 ICUs that had an open physician staffing model. The respective rates of VAP were 7.5% and 2.5%.
In adjusted analysis among all 25 ICUs, each 1-point increase in an ICU’s Practice Environment Scale score was associated with a sharply higher rate of VAP on the unit (adjusted incidence rate ratio, 5.76; P = .02).
However, there was a strong interaction between the score and physician staffing model (P less than .001). In open ICUs, as the score rose, the rate of VAP fell (from about 16% to 5%), whereas in closed ICUs, as the score rose, so did the rate of VAP (from about 3% to 14%).
Dr. Costa disclosed that she had no relevant conflicts of interest. The parent survey was funded by the Blue Cross Blue Shield Foundation of Michigan.
SAN FRANCISCO – The work environment for nurses and the physician staffing model in the intensive care unit influence patients’ likelihood of acquiring ventilator-associated pneumonia (VAP), based on a cohort study of 25 ICUs.
Overall, each 1-point increase in the score for the nurse work environment – indicating that nurses had a greater sense of playing an important role in patient care – was unexpectedly associated with a roughly sixfold higher rate of VAP among the ICU’s patients, according to data reported in a session and press briefing at an international conference of the American Thoracic Society. However, additional analyses showed that the rate of VAP was higher in closed units where a board-certified critical care physician (intensivist) managed and led care rather than an open unit where care is shared.
“We think that the organization of the ICU is actually influencing nursing practice, which is a really novel finding,” commented first author Deena Kelly Costa, PhD, RN, of the University of Michigan School of Nursing in Ann Arbor. “In closed ICUs, when you have a board-certified physician and an ICU team managing and leading care, even if the work environment is better, nurses may not feel as empowered to standardize their care or practice.”
“ICU nurses are the ones who are primarily responsible for VAP preventive practices: they keep the head of the bed higher than 45 degrees, they conduct oral care, they conduct (patient) surveillance. ICU physicians are involved with writing the orders and ventilator setting management. So how these providers work together could theoretically influence the risk for patients developing VAP,” Dr. Costa said.
“We need to be thinking a little bit more critically about not only the care that’s happening at the bedside... but also at an organizational level. How are these providers organized, and can we work together to improve patient outcomes?”
“I’m not suggesting that we get rid of all closed ICUs because I don’t think that’s the solution,” Dr. Costa maintained. “I think from an administrative perspective, we need to be considering what’s the organization of these clinicians and this unit, and [in a context-specific manner], how can we improve it for better patient outcomes? That may be both working on improving the work environment and making the nurses feel more empowered, or it could be potentially considering other staffing models.”
Some data have already linked a more favorable nurse work environment and the presence of a board-certified critical care physician independently with better patient outcomes in the ICU. But studies of their joint impact are lacking.
The investigators performed a secondary, unit-level analysis of nurse survey data collected during 2005 and 2006 in ICUs in southern Michigan.
In all, 462 nurses working in 25 ICUs completed the Practice Environment Scale of the Nursing Work Index, on which averaged summary scores range between 1 (unfavorable) and 4 (favorable). The scale captures environmental factors such as the adequacy of resources for nurses, support from their managers, and their level of involvement in hospital policy decisions.
The rate of VAP during the same period was assessed using data from more than 1,000 patients from each ICU.
The summary nurse work environment score averaged 2.69 points in the 21 ICUs that had a closed physician staffing model and 2.62 points in the 4 ICUs that had an open physician staffing model. The respective rates of VAP were 7.5% and 2.5%.
In adjusted analysis among all 25 ICUs, each 1-point increase in an ICU’s Practice Environment Scale score was associated with a sharply higher rate of VAP on the unit (adjusted incidence rate ratio, 5.76; P = .02).
However, there was a strong interaction between the score and physician staffing model (P less than .001). In open ICUs, as the score rose, the rate of VAP fell (from about 16% to 5%), whereas in closed ICUs, as the score rose, so did the rate of VAP (from about 3% to 14%).
Dr. Costa disclosed that she had no relevant conflicts of interest. The parent survey was funded by the Blue Cross Blue Shield Foundation of Michigan.
AT ATS 2016
Key clinical point: The impact of nurse work environment on risk of VAP in the ICU depends on the unit’s physician staffing model.
Major finding: A better nurse work environment was associated with a higher rate of VAP overall (incidence rate ratio, 5.76), but there was an interaction whereby it was positively associated with rate in closed units but negatively so in open units.
Data source: A cohort study of 25 ICUs, 462 nurses, and more than 25,000 patients in southern Michigan between 2005 and 2006.
Disclosures: Dr. Costa disclosed that she had no relevant conflicts of interest. The parent study was funded by the Blue Cross Blue Shield Foundation of Michigan.

In T1D, quality of life measures fall short
NEW ORLEANS – Quality of life measures are sorely lacking for patients with type 1 diabetes, but researchers are attempting to identify measures of patient well-being that go beyond the hemoglobin A1c (HbA1c) level.
At a symposium at the annual scientific sessions of the American Diabetes Association, moderator Kimberly A. Driscoll, PhD, of the University of Colorado, said that “measuring quality of life [should become] a standard part of the routine diabetes clinic visit, just like taking blood pressure.” Parents, partners, and caregivers also need to be involved in deciding what quality of life measures matter, as they are the patients’ sources of support.

Marisa E. Hilliard, PhD, reported on her research team’s efforts to glean from questionnaires the measures that would matter to those with type 1 diabetes and their caregivers. The goal is to create a tool to measure diabetes-related quality of life.
“We want to be able to track quality of life over time and understand how it’s different for different people, and there is not great research on that data,” said Dr. Hilliard of Baylor College of Medicine/Texas Children’s Hospital, Houston.
Lawrence Fisher, PhD, concurred that a quality of life research gap exists for those with type 1 diabetes. A PubMed search indicates that 1,273 papers were published in 2015 with the key words “diabetes” and “quality of life,” yet few of these papers had designated quality of life as a primary outcome. In type 1 diabetes, quality of life “is comprised of one gigantic bucket into which we have thrown all kinds of things, and it’s mired by dozens of different kinds of measures that are all called ‘quality of life’ but define and measure it in very different ways,” said Dr. Fisher of the Behavioral Diabetes Research Group at the University of California, San Francisco.
Patient management in diabetes is a three-legged stool comprised of equal components of glycemic control, behavioral change, and quality of life. Patients are living longer and have healthier lives, but “I don’t think we’re doing as good a job with the happy” aspect of patients’ lives, he said “We spend far too much time treating glucose numbers and not enough time treating people.”
Without measuring quality of life, “you never evaluate the actual cost to individuals of achieving a gain in improved HbA1c or improved behavioral change.”

“I’m told that today, at this point, there are between 15 and 20 diabetes-specific quality of life scales,” he said. “It’s a real hodgepodge. … and one shouldn’t “just go in and pull the measure off the shelf because it has ‘quality of life’ in the title.” The measure must also take into account factors such as patient age, gender, and ethnicity.
Dr. Hilliard and her team are trying to address the “major lack of developmentally tailored measurement instruments. When you have diabetes, you have it for life, and the issues relevant to your quality of life change from age 8 to 18 to 40 and so on.”
Based on interviews with 81 people with type 1 diabetes and their caregivers, the research team developed 14 different measures specifically designed for seven different age bands of people with diabetes – from age 8 years and younger through age 60 years and older. Each age band, with the exception of age 8 years and younger, involves self-reporting by the patient and either the parent, partner, or caregiver. Only the parent self-reports in the youngest age band.
To validate the measures, the researchers plan to enroll 3,600 participants at six sites from the Type 1 Diabetes Exchange and hope to have results in about 18 months. “Our goal is to get the questionnaire to less than 30 items so it takes less than 5 minutes to complete, and to develop a scoring system,” Dr. Hilliard said.
Besides patient care, the measures could be used for clinical trials across the lifespan of people with type 1 diabetes and quality improvement initiatives, she said. Once established, an expert committee would review the measures every 5 years and update them as needed.
Dr. Fisher disclosed he is a consultant to Abbott, Eli Lilly and Company, and Roche Diagnostics.
Dr. Hilliard had no financial disclosures. The Leona M. and Harry B. Helmsley Charitable Trust and the National Institutes of Diabetes and Digestive and Kidney Disease have provided funding for her study.
NEW ORLEANS – Quality of life measures are sorely lacking for patients with type 1 diabetes, but researchers are attempting to identify measures of patient well-being that go beyond the hemoglobin A1c (HbA1c) level.
At a symposium at the annual scientific sessions of the American Diabetes Association, moderator Kimberly A. Driscoll, PhD, of the University of Colorado, said that “measuring quality of life [should become] a standard part of the routine diabetes clinic visit, just like taking blood pressure.” Parents, partners, and caregivers also need to be involved in deciding what quality of life measures matter, as they are the patients’ sources of support.
Marisa E. Hilliard, PhD, reported on her research team’s efforts to glean from questionnaires the measures that would matter to those with type 1 diabetes and their caregivers. The goal is to create a tool to measure diabetes-related quality of life.
“We want to be able to track quality of life over time and understand how it’s different for different people, and there is not great research on that data,” said Dr. Hilliard of Baylor College of Medicine/Texas Children’s Hospital, Houston.
Lawrence Fisher, PhD, concurred that a quality of life research gap exists for those with type 1 diabetes. A PubMed search indicates that 1,273 papers were published in 2015 with the key words “diabetes” and “quality of life,” yet few of these papers had designated quality of life as a primary outcome. In type 1 diabetes, quality of life “is comprised of one gigantic bucket into which we have thrown all kinds of things, and it’s mired by dozens of different kinds of measures that are all called ‘quality of life’ but define and measure it in very different ways,” said Dr. Fisher of the Behavioral Diabetes Research Group at the University of California, San Francisco.
Patient management in diabetes is a three-legged stool comprised of equal components of glycemic control, behavioral change, and quality of life. Patients are living longer and have healthier lives, but “I don’t think we’re doing as good a job with the happy” aspect of patients’ lives, he said “We spend far too much time treating glucose numbers and not enough time treating people.”
Without measuring quality of life, “you never evaluate the actual cost to individuals of achieving a gain in improved HbA1c or improved behavioral change.”
“I’m told that today, at this point, there are between 15 and 20 diabetes-specific quality of life scales,” he said. “It’s a real hodgepodge. … and one shouldn’t “just go in and pull the measure off the shelf because it has ‘quality of life’ in the title.” The measure must also take into account factors such as patient age, gender, and ethnicity.
Dr. Hilliard and her team are trying to address the “major lack of developmentally tailored measurement instruments. When you have diabetes, you have it for life, and the issues relevant to your quality of life change from age 8 to 18 to 40 and so on.”
Based on interviews with 81 people with type 1 diabetes and their caregivers, the research team developed 14 different measures specifically designed for seven different age bands of people with diabetes – from age 8 years and younger through age 60 years and older. Each age band, with the exception of age 8 years and younger, involves self-reporting by the patient and either the parent, partner, or caregiver. Only the parent self-reports in the youngest age band.
To validate the measures, the researchers plan to enroll 3,600 participants at six sites from the Type 1 Diabetes Exchange and hope to have results in about 18 months. “Our goal is to get the questionnaire to less than 30 items so it takes less than 5 minutes to complete, and to develop a scoring system,” Dr. Hilliard said.
Besides patient care, the measures could be used for clinical trials across the lifespan of people with type 1 diabetes and quality improvement initiatives, she said. Once established, an expert committee would review the measures every 5 years and update them as needed.
Dr. Fisher disclosed he is a consultant to Abbott, Eli Lilly and Company, and Roche Diagnostics.
Dr. Hilliard had no financial disclosures. The Leona M. and Harry B. Helmsley Charitable Trust and the National Institutes of Diabetes and Digestive and Kidney Disease have provided funding for her study.
AT THE ADA ANNUAL SCIENTIFIC SESSIONS
Key clinical point: Physicians have inadequate tools for measuring quality of life in people with type 1 diabetes.
Major finding: Very few PubMed citations on “diabetes” and “quality of life” designated “quality of life” as a primary outcome.
Data source: Review of 1,273 PubMed citations, and interviews with 81 people with type 1 diabetes and caregivers to inform involvement of 3,600 participants at six Type 1 Diabetes Exchange sites in the development of a quality of life questionnaire.
Disclosures: Dr. Fisher disclosed he is a consultant to Abbott, Eli Lilly and Company, and Roche Diagnostics. Dr. Hilliard had no financial disclosures. The Leona M. and Harry B. Helmsley Charitable Trust and the National Institutes of Diabetes and Digestive and Kidney Disease have provided funding for her study.

Nearly 200 practices expected to participate in Oncology Care Model
The Department of Health and Human Services has announced that nearly 200 physician group practices – more than double the number expected – and 17 health insurance companies will be participating in the Oncology Care Model, a voluntary payment and care delivery model developed by the CMS Innovation Center and advanced by the Affordable Care Act. The 5-year program, designed to improve cancer care by providing financial incentives to physician practices that provide effective treatment, is set to begin July 1, 2016.
The Medicare arm of the Oncology Care Model (OCM) will include more than 3,200 oncologists and will cover approximately 155,000 Medicare beneficiaries nationwide, according to a written statement from the HHS.

“CMS is thrilled with how many physician groups chose to be a part of the Oncology Care Model,” Patrick Conway, MD, CMS principal deputy administrator and chief medical officer, said in the statement.
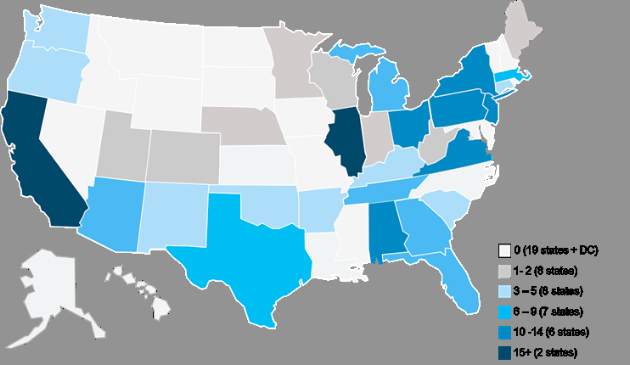
Physician practices from 31 states will be participating, with the highest levels of provider participation in Alabama, California, Illinois, New Jersey, New York, Ohio, Pennsylvania, and Virginia, according to an analysis conducted by Avalere Health, a Washington, DC–based health care consulting firm.
The CMS first announced the OCM project in February 2015 and originally aimed to have 100 physician practices participating in the first-ever oncology-specific payment reform model.
“Based on feedback from the medical, consumer, and business communities, we are launching this new model of care to support clinicians’ work with their patients,” HHS Secretary Sylvia M. Burwell said in a written statement in February 2015.

“We aim to provide Medicare beneficiaries struggling with cancer with high-quality care around the clock and to reward doctors for the value, not volume, of care they provide. Improving the way we pay providers and deliver care to patients will result in healthier people,” she said.
The OCM encourages practices to improve care and lower costs through episodic and performance-based payments that reward high-quality patient care. It is a multipayer model that includes Medicare’s fee-for-service (OCM-FFS) and commercial payers.
OCM participants will receive regular OCM-FFS payments during the model. To create incentives to improve the quality of care, reimbursement will include a monthly payment of $160 per beneficiary for delivery of OCM enhanced services, and a performance-based payment for OCM episodes, according to a CMS fact sheet.
An OCM-FFS episode begins on the date of initial Part B or D chemotherapy claim and includes all Medicare Part A and B (and some Part D) services received during the episode period which lasts 6 months. Beneficiaries who receive chemotherapy after the end of an episode will begin a new episode.
Enhanced services include patient navigation, a care plan based on the Institute of Medicine care management report, patient access 24 hours a day, 7 days a week, and treatment with therapies that are consistent with nationally recognized clinical guidelines.
View the complete list of participating practices at https://innovation.cms.gov/initiatives/Oncology-Care.
On Twitter @jessnicolecraig
The Department of Health and Human Services has announced that nearly 200 physician group practices – more than double the number expected – and 17 health insurance companies will be participating in the Oncology Care Model, a voluntary payment and care delivery model developed by the CMS Innovation Center and advanced by the Affordable Care Act. The 5-year program, designed to improve cancer care by providing financial incentives to physician practices that provide effective treatment, is set to begin July 1, 2016.
The Medicare arm of the Oncology Care Model (OCM) will include more than 3,200 oncologists and will cover approximately 155,000 Medicare beneficiaries nationwide, according to a written statement from the HHS.
“CMS is thrilled with how many physician groups chose to be a part of the Oncology Care Model,” Patrick Conway, MD, CMS principal deputy administrator and chief medical officer, said in the statement.
Physician practices from 31 states will be participating, with the highest levels of provider participation in Alabama, California, Illinois, New Jersey, New York, Ohio, Pennsylvania, and Virginia, according to an analysis conducted by Avalere Health, a Washington, DC–based health care consulting firm.
The CMS first announced the OCM project in February 2015 and originally aimed to have 100 physician practices participating in the first-ever oncology-specific payment reform model.
“Based on feedback from the medical, consumer, and business communities, we are launching this new model of care to support clinicians’ work with their patients,” HHS Secretary Sylvia M. Burwell said in a written statement in February 2015.
“We aim to provide Medicare beneficiaries struggling with cancer with high-quality care around the clock and to reward doctors for the value, not volume, of care they provide. Improving the way we pay providers and deliver care to patients will result in healthier people,” she said.
The OCM encourages practices to improve care and lower costs through episodic and performance-based payments that reward high-quality patient care. It is a multipayer model that includes Medicare’s fee-for-service (OCM-FFS) and commercial payers.
OCM participants will receive regular OCM-FFS payments during the model. To create incentives to improve the quality of care, reimbursement will include a monthly payment of $160 per beneficiary for delivery of OCM enhanced services, and a performance-based payment for OCM episodes, according to a CMS fact sheet.
An OCM-FFS episode begins on the date of initial Part B or D chemotherapy claim and includes all Medicare Part A and B (and some Part D) services received during the episode period which lasts 6 months. Beneficiaries who receive chemotherapy after the end of an episode will begin a new episode.
Enhanced services include patient navigation, a care plan based on the Institute of Medicine care management report, patient access 24 hours a day, 7 days a week, and treatment with therapies that are consistent with nationally recognized clinical guidelines.
View the complete list of participating practices at https://innovation.cms.gov/initiatives/Oncology-Care.
On Twitter @jessnicolecraig
New and Noteworthy Information—July 2016
There is a strong, inverse association between midlife cardiorespiratory fitness and stroke risk in later life, independent of the baseline and antecedent burden of risk factors, according to a study published online ahead of print June 9 in Stroke. Researchers studied 19,815 individuals who received Medicare coverage from 1999 to 2009. Cardiorespiratory fitness estimated at baseline was analyzed as a continuous variable and according to age- and sex-specific quintiles. Associations between midlife cardiorespiratory fitness and stroke hospitalization after age 65 were assessed by applying a proportional hazards recurrent events model to failure time data with hypertension, diabetes mellitus, and atrial fibrillation as time-dependent covariates. The investigators observed 808 stroke hospitalizations. After adjustment for baseline risk factors, higher midlife cardiorespiratory fitness was associated with a lower risk of stroke hospitalization.
Incident dementia early after intracerebral hemorrhage is strongly associated with hematoma size and location, according to a study published online ahead of print June 13 in JAMA Neurology. A longitudinal study enrolled patients with intracerebral hemorrhage from January 1, 2006, to December 31, 2013. In all, 738 participants ages 18 or older, without pre-intracerebral hemorrhage dementia, who presented to a tertiary care academic institution with primary intracerebral hemorrhage were included in the study. A total of 140 patients developed dementia within six months. Larger hematoma size and lobar location of intracerebral hemorrhage were associated with early post-intracerebral hemorrhage dementia, but not with delayed post-intracerebral hemorrhage dementia. Educational level, incident mood symptoms, and white matter disease were associated with delayed, but not early, post-intracerebral hemorrhage dementia.
The FDA is investigating the risk of serious burns and potential permanent scarring from the use of the Zecuity (sumatriptan iontophoretic transdermal system) patch for migraine. The patch delivers a dose of medicine in a single-use, battery-powered patch that is wrapped around the upper arm or thigh. Since the introduction of the patch, many patients have reported injury to the skin where the patch was worn. The reports include descriptions of severe redness, pain, skin discoloration, blistering, and cracked skin. Patients who experience moderate to severe pain at the patch site should immediately remove the patch to avoid possible burns or scarring, regardless of how long the patch has been worn, and contact a health care professional. Teva Pharmaceuticals has suspended the sale, marketing, and distribution of the patch.
More than 90% of the global stroke burden is attributable to modifiable risk factors, including air pollution, and controlling behavioral and metabolic risk factors could avert more than 75% of the global stroke burden, according to a study published online ahead of print June 9 in the Lancet Neurology. Researchers used data on stroke-related disability-adjusted life-years, risk factors, and population-attributable fraction from the Global Burden of Disease Study 2013 to estimate the burden of stroke by age and sex in 188 countries. Approximately 74% of the global stroke burden was attributable to behavioral factors. Clusters of metabolic factors (72%) and environmental factors (33%) were the second and third largest contributors to disability-adjusted life-years, respectively. About 29% of the burden of stroke was attributed to air pollution.
Abnormally high fractional anisotropy (FA) on diffusion tensor imaging (DTI) is associated with better outcomes after mild traumatic brain injury (mTBI), according to a study published online ahead of print June 9 in the American Journal of Neuroradiology. DTI was performed on 39 subjects with mTBI within 16 days of injury and on 40 controls. In all, 26 subjects with mTBI returned for follow-up at one year. Among these subjects, high FA in the left frontal lobe and left temporal lobe was associated with better attention. High FA in the left and right cerebelli was associated with improved somatic postconcussion symptoms. High FA in the right thalamus was associated with improved emotional postconcussion symptoms. Abnormally high FA may be an imaging correlate of postinjury compensatory processes, said the investigators.
Among patients with multiple sclerosis (MS), obstructive sleep apnea and sleep disturbance are significantly associated with diminished visual memory, verbal memory, executive function, attention, processing speed, and working memory, according to a study published online ahead of print May 3 in Sleep. Thirty-eight participants underwent MS-specific cognitive testing and in-laboratory overnight polysomnography. In adjusted linear regression models, the oxygen desaturation index and minimum oxygen saturation were significantly associated with performance on multiple Minimal Assessment of Cognitive Function in MS measures. Apnea severity measures accounted for between 11% and 23% of the variance in cognitive test performance. Polysomnographic measures of sleep fragmentation and total sleep time also showed significant associations with a component of the California Verbal Learning Test-II, explaining 18% and 27% of the variance in performance, respectively.
The differences in stroke mortality between African Americans and Caucasians are largely related to differences in stroke incidence, according to a study published online ahead of print June 2 in Stroke. Researchers assessed the difference between African American and Caucasian stroke mortality for 29,681 participants in the Reasons for Geographic and Racial Differences in Stroke cohort. They found that African Americans are four times more likely to die of stroke at age 45 than Caucasians because stroke incidence is greater among African Americans. By age 85, however, the difference in stroke mortality is no longer present. More should be done to reduce the disparity in stroke mortality between African Americans and Caucasians, and interventions should focus on prevention of stroke among African Americans, according to the investigators.
A mutant transmembrane protein of synaptic vesicles in neurons is etiologically linked to Parkinson's disease, according to a study published online ahead of print June 6 in Nature Genetics. Researchers first investigated a family with 15 members who had typical symptoms of Parkinson's disease. They used DNA samples to perform a genome-wide analysis on 65 of the family's members, including 13 with Parkinson's disease, to find a common mutation that could explain the prevalence of Parkinson's disease. The study authors identified TMEM230 as the gene with a disease-causing mutation and found that TMEM230 encodes a protein that extends across the membrane of tiny sacs inside synaptic vesicles. The research team also found mutations in TMEM230 in cases of Parkinson's disease in additional families in North America and China.
People with blast exposure have a pattern of interface astroglial scarring at boundaries between brain parenchyma and fluids, and between gray and white matter, according to a study published online ahead of print June 9 in the Lancet Neurology. Researchers analyzed brain specimens from five military service members with chronic blast exposure, three with acute blast exposure, five with chronic impact traumatic brain injury, five with exposure to opiates, and three control cases with no known neurologic disorders. All five cases with chronic blast exposure showed prominent astroglial scarring involving the subpial glial plate, penetrating cortical blood vessels, gray-white matter junctions, and structures lining the ventricles. Cases of acute blast exposure showed early astroglial scarring in the same brain regions. Cases of chronic blast exposure had an antemortem diagnosis of posttraumatic stress disorder.
A combination of dextromethorphan and quinidine is an effective and well-tolerated treatment for pseudobulbar affect secondary to dementia, stroke, or traumatic brain injury, according to a study published June 9 in BMC Neurology. The study included 367 participants with this disorder. Participants in this open-label, multicenter, 90-day trial received dextromethorphan and quinidine twice daily. The mean Center for Neurologic Study-Lability Scale score improved from 20.4 at baseline to 12.8 at the 90-day final visit. Reduction in pseudobulbar affect episode count was 72.3% at the 90-day final visit, compared with baseline. Scores on Clinical Global Impression of Change and Patient Global Impression of Change indicated that 76.6% and 72.4% of participants, respectively, showed much or very much improvement in symptoms of pseudobulbar affect.
—Kimberly Williams

Light therapy for nonseasonal major depressive disorder?
Consider treatment with bright light therapy, alone or in combination with fluoxetine, for patients with nonseasonal major depressive disorder (MDD).1
Strength of recommendation
B: Based on a single moderate-quality randomized control trial.
Lam RW, Levitt AJ, Levitan RD, et al. Efficacy of bright light treatment, fluoxetine, and the combination in patients with nonseasonal major depressive disorder: a randomized clinical trial. JAMA Psychiatry. 2016;73:56-63.
Illustrative Case
A 38-year-old woman recently diagnosed with MDD without a seasonal pattern comes to see you for her treatment options. Her Hamilton Depression Rating Scale (HAM-D) is 22, and she is not suicidal. Should you consider bright light therapy in addition to pharmacotherapy?
MDD is one of the most common psychiatric illnesses in the United States, affecting approximately one in 5 adults at some point in their lives.2 Selective serotonin reuptake inhibitors (SSRIs) and serotonin-norepinephrine reuptake inhibitors are considered effective first-line pharmacotherapy options for MDD.2,3 Despite their effectiveness, however, studies have shown that only about 40% of patients with MDD achieve remission with first- or second-line drugs.2 In addition, pharmacologic agents have a higher frequency of treatment-associated adverse effects than fluorescent light therapy.4
A Cochrane systematic review of 20 studies (N=620) showed the effectiveness of combined light therapy and pharmacotherapy in treating nonseasonal MDD, but found no benefit to light used as a monotherapy.5 However, the majority of the studies were of poor quality, occurred in the inpatient setting, and lasted fewer than 4 weeks.
In a 5-week, controlled, double-blind trial not included in the Cochrane review, 102 patients with nonseasonal MDD were randomized to receive either active treatment (bright light therapy) plus sertraline 50 mg daily or sham light treatment (using a dim red light) plus sertraline 50 mg daily. The investigators found a statistically significant larger reduction in depression score in the active treatment group than in the sham light group, based on the HAM-D, the Hamilton 6-Item Subscale, the Melancholia Scale, and the 7 atypical items from the Structured Interview Guide for the Seasonal Affective Disorder version of the HAM-D.6,7
Study Summary
Light therapy improves depression without a seasonal component
This latest study was an 8-week randomized, double-blind, placebo- and sham-controlled clinical trial evaluating the benefit of light therapy with and without pharmacotherapy for nonseasonal MDD.1 The investigators enrolled 122 adult patients (ages 19-60 years) from outpatient psychiatry clinics with a diagnosis of MDD (as diagnosed by a psychiatrist) and a HAM-D8 score of at least 20. Subjects had to be off psychotropic medication for at least 2 weeks prior to the first visit and were subsequently monitored for one week to identify spontaneous responders and to give patients time to better regulate their sleep-wake cycle (with the goal of sleeping only between 10:00 pm and 8:00 am daily).
The investigators randomly assigned patients to one of 4 treatment groups: active light monotherapy (10,000-lux fluorescent white light for 30 min/d early in the morning) plus a placebo pill; fluoxetine 20 mg/d plus sham light therapy; placebo pills with sham light therapy; and combined active light therapy with fluoxetine 20 mg daily. Sham light therapy consisted of the use of an inactivated negative ion generator, used in the same fashion as a light box. All patients were analyzed based on modified intention to treat.
The investigators monitored patients for adherence to active and sham treatment by review of their daily logs of device treatment times. Pill counts were used to assess medication adherence. The primary outcome at 8 weeks was the change from baseline in the Montgomery-Asberg Depression Rating Scale (MADRS), a 10-item questionnaire with a worst score of 60.9 Secondary outcomes were treatment response (≥50% MADRS score reduction) and remission (≤10 MADRS score) at the final 8th-week visit. MADRS scoring was used because of its higher sensitivity to treatment-induced changes and its high correlation with the HAM-D scale.
At the end of 8 weeks, the mean (standard deviation [SD]) changes in MADRS scores from baseline were: light monotherapy 13.4 (7.5), fluoxetine monotherapy 8.8 (9.9), combination therapy 16.9 (9.2), and placebo 6.5 (9.6). The improvement was significant in the light monotherapy treatment group vs the placebo group (P=.006), in the combination treatment group vs the vs placebo group (P<.001), and in the combination group vs the fluoxetine treatment group (P=.02), but not for the fluoxetine treatment group vs the placebo group (P=.32). The effect sizes vs placebo were: fluoxetine, d=0.24 (95% confidence interval [CI], −0.27 to 0.74); light monotherapy, 0.80 (95% CI, 0.28 to 1.31); and combination therapy, 1.11 (95% CI, 0.54 to 1.64). Effect sizes of more than 0.8 are often considered large.10
The treatment response (≥50% MADRS improvement) rate was highest in the combination treatment group (75.9%) with response rates to light monotherapy, placebo, and fluoxetine monotherapy of 50%, 33.3%, and 29%, respectively. There was a significant response effect for the combination vs placebo treatment group (P=.005). Similarly, there was a higher remission rate in the combination treatment group (58.6%) than in the placebo, light monotherapy, or fluoxetine treatment groups (30%, 43.8%, and 19.4%, respectively) with a significant effect for the combination vs placebo treatment group (P=.02).
Combination therapy was superior to placebo in treatment response (≥50% reduction in the MADRS score) and remission (MADRS ≤10) with numbers needed to treat of 2.4 (95% CI, 1.6-5.8) and 3.5 (95% CI, 2.0-29.9), respectively.
By the end of the 8-week study period, 16 of 122 patients had dropped out; 2 reported lack of efficacy, 5 reported adverse effects, and the remainder cited administrative reasons, were lost to follow-up, or withdrew consent.
What’s New?
New evidence on a not-so-new treatment
We now have evidence that bright light therapy, either alone or in combination with fluoxetine, is efficacious in increasing the remission rate of nonseasonal MDD.
Caveats
Choice of SSRI, geography, and trial duration may have affected results
A single SSRI (fluoxetine) was used in this study; other more potent SSRIs might work better. This study was conducted in southern Canada, and light therapy may not demonstrate as large a benefit in regions located farther south. The study excluded pregnant and breastfeeding women.
The trial duration was relatively short, and the investigators did not attain their pre-planned sample size for the study, which limited the power to detect clinically significant seasonal treatment effects and differences between the fluoxetine and placebo groups, regardless of whether they received active phototherapy.
Also, it’s worth noting that there were trends for some adverse events (nausea, heartburn, weight gain, agitation, sexual dysfunction, and skin rash) to occur less frequently in the combination group than in the fluoxetine monotherapy group. Possible explanations are that the study had inadequate power, that the sham treatment did not adequately blind patients, or that light therapy can ameliorate some of the adverse effects of fluoxetine.
Challenges to Implementation
Commercial insurance doesn’t usually cover light therapy
Bright light therapy is fairly safe, and some evidence exists supporting its use in the treatment of nonseasonal MDD; however, the data for its use in this area are limited.11 Since only a few studies have tested light therapy for nonseasonal MDD, significant uncertainty remains about patient selection, as well as optimal dose, timing, and duration of light therapy in the management of nonseasonal MDD.12 Although the risks associated with bright light therapy are minimal, the therapy can lead to mania or hypomania,3 so clinicians need to monitor for such effects when initiating therapy.
Lastly, commercial insurance does not usually cover light therapy. The average price of the bright light devices, which can be found in medical supply stores and online outlets, ranges between $118 and $237.4,12 However, such devices are reusable, making the amortized cost almost negligible.13
ACKNOWLEDGEMENT
The PURLs Surveillance System was supported in part by Grant Number UL1RR024999 from the National Center For Research Resources, a Clinical Translational Science Award to the University of Chicago. The content is solely the responsibility of the authors and does not necessarily represent the official views of the National Center For Research Resources or the National Institutes of Health.
1. Lam RW, Levitt AJ, Levitan RD, et al. Efficacy of bright light treatment, fluoxetine, and the combination in patients with nonseasonal major depressive disorder: a randomized clinical trial. JAMA Psychiatry. 2016;73:56-63.
2. Weihs K, Wert JM. A primary care focus on the treatment of patients with major depressive disorder. Am J Med Sci. 2011;342:324-330.
3. Gelenberg AJ, Freeman CMP, Markowitz JC, et al. Practice guideline for the treatment of patients with major depressive disorder. 3rd edition. 2010. Available at: http://psychiatryonline.org/pb/assets/raw/sitewide/practice_guidelines/guidelines/mdd.pdf. Accessed April 20, 2016.
4. Lam RW, Tam EM. A Clinician’s Guide to Using Light Therapy. New York, NY: Cambridge University Press; 2009. Available at: http://www.ubcmood.ca/sad/SAD%20resources%20package%202009.pdf. Accessed April 20, 2016.
5. Tuunainen A, Kripke DF, Endo T. Light therapy for non-seasonal depression. Cochrane Database Syst Rev. 2004;2:CD004050.
6. Martiny K. Adjunctive bright light in non-seasonal major depression. Acta Psychiatr Scand Suppl. 2004;425:7-28.
7. Martiny K, Lunde M, Unden M, et al. Adjunctive bright light in non-seasonal major depression: results from clinician-rated depression scales. Acta Psychiatr Scand. 2005;112:117-125.
8. Hamilton M. A rating scale for depression. J Neurol Neurosurg Psychiatry. 1960;23:56-62.
9. Montgomery SA, Asberg M. A new depression scale designed to be sensitive to change. Br J Psychiatry. 1979;134:382-389.
10. Sullivan GM, Feinn R. Using effect size—or why the P value is not enough. J Grad Med Educ. 2012;4:279-282.
11. Oldham MA, Ciraulo DA. Use of bright light therapy among psychiatrists in Massachusetts: an e-mail survey. The Primary Care Companion for CNS Disorders. 2014;16.
12. Sloane PD, Figueiro M, Cohen L. Light as therapy for sleep disorders and depression in older adults. Clin Geriatr. 2008;16:25-31.
13. Kripke DF. A breakthrough treatment for major depression. J Clin Psychiatry. 2015;76:e660-e661.
Consider treatment with bright light therapy, alone or in combination with fluoxetine, for patients with nonseasonal major depressive disorder (MDD).1
Strength of recommendation
B: Based on a single moderate-quality randomized control trial.
Lam RW, Levitt AJ, Levitan RD, et al. Efficacy of bright light treatment, fluoxetine, and the combination in patients with nonseasonal major depressive disorder: a randomized clinical trial. JAMA Psychiatry. 2016;73:56-63.
Illustrative Case
A 38-year-old woman recently diagnosed with MDD without a seasonal pattern comes to see you for her treatment options. Her Hamilton Depression Rating Scale (HAM-D) is 22, and she is not suicidal. Should you consider bright light therapy in addition to pharmacotherapy?
MDD is one of the most common psychiatric illnesses in the United States, affecting approximately one in 5 adults at some point in their lives.2 Selective serotonin reuptake inhibitors (SSRIs) and serotonin-norepinephrine reuptake inhibitors are considered effective first-line pharmacotherapy options for MDD.2,3 Despite their effectiveness, however, studies have shown that only about 40% of patients with MDD achieve remission with first- or second-line drugs.2 In addition, pharmacologic agents have a higher frequency of treatment-associated adverse effects than fluorescent light therapy.4
A Cochrane systematic review of 20 studies (N=620) showed the effectiveness of combined light therapy and pharmacotherapy in treating nonseasonal MDD, but found no benefit to light used as a monotherapy.5 However, the majority of the studies were of poor quality, occurred in the inpatient setting, and lasted fewer than 4 weeks.
In a 5-week, controlled, double-blind trial not included in the Cochrane review, 102 patients with nonseasonal MDD were randomized to receive either active treatment (bright light therapy) plus sertraline 50 mg daily or sham light treatment (using a dim red light) plus sertraline 50 mg daily. The investigators found a statistically significant larger reduction in depression score in the active treatment group than in the sham light group, based on the HAM-D, the Hamilton 6-Item Subscale, the Melancholia Scale, and the 7 atypical items from the Structured Interview Guide for the Seasonal Affective Disorder version of the HAM-D.6,7
Study Summary
Light therapy improves depression without a seasonal component
This latest study was an 8-week randomized, double-blind, placebo- and sham-controlled clinical trial evaluating the benefit of light therapy with and without pharmacotherapy for nonseasonal MDD.1 The investigators enrolled 122 adult patients (ages 19-60 years) from outpatient psychiatry clinics with a diagnosis of MDD (as diagnosed by a psychiatrist) and a HAM-D8 score of at least 20. Subjects had to be off psychotropic medication for at least 2 weeks prior to the first visit and were subsequently monitored for one week to identify spontaneous responders and to give patients time to better regulate their sleep-wake cycle (with the goal of sleeping only between 10:00 pm and 8:00 am daily).
The investigators randomly assigned patients to one of 4 treatment groups: active light monotherapy (10,000-lux fluorescent white light for 30 min/d early in the morning) plus a placebo pill; fluoxetine 20 mg/d plus sham light therapy; placebo pills with sham light therapy; and combined active light therapy with fluoxetine 20 mg daily. Sham light therapy consisted of the use of an inactivated negative ion generator, used in the same fashion as a light box. All patients were analyzed based on modified intention to treat.
The investigators monitored patients for adherence to active and sham treatment by review of their daily logs of device treatment times. Pill counts were used to assess medication adherence. The primary outcome at 8 weeks was the change from baseline in the Montgomery-Asberg Depression Rating Scale (MADRS), a 10-item questionnaire with a worst score of 60.9 Secondary outcomes were treatment response (≥50% MADRS score reduction) and remission (≤10 MADRS score) at the final 8th-week visit. MADRS scoring was used because of its higher sensitivity to treatment-induced changes and its high correlation with the HAM-D scale.
At the end of 8 weeks, the mean (standard deviation [SD]) changes in MADRS scores from baseline were: light monotherapy 13.4 (7.5), fluoxetine monotherapy 8.8 (9.9), combination therapy 16.9 (9.2), and placebo 6.5 (9.6). The improvement was significant in the light monotherapy treatment group vs the placebo group (P=.006), in the combination treatment group vs the vs placebo group (P<.001), and in the combination group vs the fluoxetine treatment group (P=.02), but not for the fluoxetine treatment group vs the placebo group (P=.32). The effect sizes vs placebo were: fluoxetine, d=0.24 (95% confidence interval [CI], −0.27 to 0.74); light monotherapy, 0.80 (95% CI, 0.28 to 1.31); and combination therapy, 1.11 (95% CI, 0.54 to 1.64). Effect sizes of more than 0.8 are often considered large.10
The treatment response (≥50% MADRS improvement) rate was highest in the combination treatment group (75.9%) with response rates to light monotherapy, placebo, and fluoxetine monotherapy of 50%, 33.3%, and 29%, respectively. There was a significant response effect for the combination vs placebo treatment group (P=.005). Similarly, there was a higher remission rate in the combination treatment group (58.6%) than in the placebo, light monotherapy, or fluoxetine treatment groups (30%, 43.8%, and 19.4%, respectively) with a significant effect for the combination vs placebo treatment group (P=.02).
Combination therapy was superior to placebo in treatment response (≥50% reduction in the MADRS score) and remission (MADRS ≤10) with numbers needed to treat of 2.4 (95% CI, 1.6-5.8) and 3.5 (95% CI, 2.0-29.9), respectively.
By the end of the 8-week study period, 16 of 122 patients had dropped out; 2 reported lack of efficacy, 5 reported adverse effects, and the remainder cited administrative reasons, were lost to follow-up, or withdrew consent.
What’s New?
New evidence on a not-so-new treatment
We now have evidence that bright light therapy, either alone or in combination with fluoxetine, is efficacious in increasing the remission rate of nonseasonal MDD.
Caveats
Choice of SSRI, geography, and trial duration may have affected results
A single SSRI (fluoxetine) was used in this study; other more potent SSRIs might work better. This study was conducted in southern Canada, and light therapy may not demonstrate as large a benefit in regions located farther south. The study excluded pregnant and breastfeeding women.
The trial duration was relatively short, and the investigators did not attain their pre-planned sample size for the study, which limited the power to detect clinically significant seasonal treatment effects and differences between the fluoxetine and placebo groups, regardless of whether they received active phototherapy.
Also, it’s worth noting that there were trends for some adverse events (nausea, heartburn, weight gain, agitation, sexual dysfunction, and skin rash) to occur less frequently in the combination group than in the fluoxetine monotherapy group. Possible explanations are that the study had inadequate power, that the sham treatment did not adequately blind patients, or that light therapy can ameliorate some of the adverse effects of fluoxetine.
Challenges to Implementation
Commercial insurance doesn’t usually cover light therapy
Bright light therapy is fairly safe, and some evidence exists supporting its use in the treatment of nonseasonal MDD; however, the data for its use in this area are limited.11 Since only a few studies have tested light therapy for nonseasonal MDD, significant uncertainty remains about patient selection, as well as optimal dose, timing, and duration of light therapy in the management of nonseasonal MDD.12 Although the risks associated with bright light therapy are minimal, the therapy can lead to mania or hypomania,3 so clinicians need to monitor for such effects when initiating therapy.
Lastly, commercial insurance does not usually cover light therapy. The average price of the bright light devices, which can be found in medical supply stores and online outlets, ranges between $118 and $237.4,12 However, such devices are reusable, making the amortized cost almost negligible.13
ACKNOWLEDGEMENT
The PURLs Surveillance System was supported in part by Grant Number UL1RR024999 from the National Center For Research Resources, a Clinical Translational Science Award to the University of Chicago. The content is solely the responsibility of the authors and does not necessarily represent the official views of the National Center For Research Resources or the National Institutes of Health.
1. Lam RW, Levitt AJ, Levitan RD, et al. Efficacy of bright light treatment, fluoxetine, and the combination in patients with nonseasonal major depressive disorder: a randomized clinical trial. JAMA Psychiatry. 2016;73:56-63.
2. Weihs K, Wert JM. A primary care focus on the treatment of patients with major depressive disorder. Am J Med Sci. 2011;342:324-330.
3. Gelenberg AJ, Freeman CMP, Markowitz JC, et al. Practice guideline for the treatment of patients with major depressive disorder. 3rd edition. 2010. Available at: http://psychiatryonline.org/pb/assets/raw/sitewide/practice_guidelines/guidelines/mdd.pdf. Accessed April 20, 2016.
4. Lam RW, Tam EM. A Clinician’s Guide to Using Light Therapy. New York, NY: Cambridge University Press; 2009. Available at: http://www.ubcmood.ca/sad/SAD%20resources%20package%202009.pdf. Accessed April 20, 2016.
5. Tuunainen A, Kripke DF, Endo T. Light therapy for non-seasonal depression. Cochrane Database Syst Rev. 2004;2:CD004050.
6. Martiny K. Adjunctive bright light in non-seasonal major depression. Acta Psychiatr Scand Suppl. 2004;425:7-28.
7. Martiny K, Lunde M, Unden M, et al. Adjunctive bright light in non-seasonal major depression: results from clinician-rated depression scales. Acta Psychiatr Scand. 2005;112:117-125.
8. Hamilton M. A rating scale for depression. J Neurol Neurosurg Psychiatry. 1960;23:56-62.
9. Montgomery SA, Asberg M. A new depression scale designed to be sensitive to change. Br J Psychiatry. 1979;134:382-389.
10. Sullivan GM, Feinn R. Using effect size—or why the P value is not enough. J Grad Med Educ. 2012;4:279-282.
11. Oldham MA, Ciraulo DA. Use of bright light therapy among psychiatrists in Massachusetts: an e-mail survey. The Primary Care Companion for CNS Disorders. 2014;16.
12. Sloane PD, Figueiro M, Cohen L. Light as therapy for sleep disorders and depression in older adults. Clin Geriatr. 2008;16:25-31.
13. Kripke DF. A breakthrough treatment for major depression. J Clin Psychiatry. 2015;76:e660-e661.
Copyright © 2016. The Family Physicians Inquiries Network. All rights reserved.

Evolving therapeutic strategies maintain clinical momentum in melanoma
The past 5 years have witnessed a watershed moment in the management of metastatic melanoma. The successes of molecularly targeted and immune-based therapies have transformed it from an aggressively lethal malignancy into one that is readily treatable. Here, we discuss continued efforts to find new therapies and broaden the clinical impact of existing options to maintain the unprecedented momentum of improving patient outcomes.
Click on the PDF icon at the top of this introduction to read the full article.
Group-based psychosocial services: assessing outpatient oncology needs
Background Group-based services can improve quality-of-life outcomes for oncology patients.
Objective To assess patient preferences for supportive and wellness programming to better meet patient needs and allocate resources.
Methods Patients from 3 cancer centers in New York City completed a 15-item questionnaire about their interest in educational topics (wellness, nutrition, legal issues, etc) and services (support groups, lectures, and exercise programs).
Results 311 patients participated in the survey. Mean age was 59 years, and 74% were women. The most common cancer was breast (40%), followed by genitourinary (15%). Women preferred wellness workshops most, followed by informative sessions; men most preferred informative sessions, followed equally by posttreatment support and wellness workshops. Older age was related to an increased likelihood of group attendance. Overall, 68% of participants reported that they would be likely to attend groups. For lectures, nutrition was of greatest interest for men (43%) and women (34%), followed by anxiety management (17% and 18%, respectively). Overall, 64% of participants reported that they would be likely to attend a lecture. A majority of respondents (54%) expressed a desire for exercise programs.
Limitations Generalizability to all cancer centers is limited, because data was not tracked on those who refused to complete the questionnaire.
Conclusions Obtaining patient feedback on psychosocial programs is imperative for understanding patient preferences and developing effective support programming.
Click on the PDF icon at the top of this introduction to read the full article.
Tips for Living With Dystonia

Early results positive for nivolumab as first-line therapy in advanced NSCLC
The PD-1 immune checkpoint inhibitor nivolumab may be safe and effective as a first-line therapy in adult patients with non–small cell lung cancer (NSCLC), according to the results of the phase I CheckMate 012 trial.
Of 52 adult patients with advanced NSCLC who received nivolumab, 19% experienced grade three or four adverse events, and the overall response rate was 23% with four ongoing complete responses, reported Scott Gettinger, MD, of the Yale Cancer Center, New Haven, Conn., and his associates (J Clin Oncol. 2016 June. doi: 10.1200/JCO.2016.66.9929).

In the study cohort, 94% had stage IV NSCLC, 79% were former or current smokers, and 65% had received either radiotherapy, adjuvant or neoadjuvant chemotherapy.
Treatment-related adverse events were reported in 71% of patients, the most common being fatigue (29%), rash (19%), and nausea (14%). Grade 3 or 4 adverse events including rash, cardiac failure, and lung infection occurred in 10 patients (19%). There were no treatment-related deaths, but adverse events led to the discontinuation of the drug treatment in six patients.
Responses to nivolumab (overall response rate, 23%) were durable with duration of responses ranging from 4.2 to 25.8 months. In addition, the median overall survival was 19.4 months, median progression-free survival was 3.5 months, and the 24-week progression-free survival rate was 31% (95% confidence interval, 28%-60%).
Forty-six patients had tumor specimens evaluable for PD-L1 expression. Clinical activity was observed regardless of PD-L1 expression, the investigators reported. However, the overall response rate was higher in patients with tumors that expressed PD-L1, compared with non-PD-L1-expressing tumors.
All investigators reported serving in advisory roles for, receiving financial compensation or honoraria from, or having ownership or stock in multiple companies including Bristol-Myers Squibb, which funded the study.
On Twitter @jessnicolecraig
The PD-1 immune checkpoint inhibitor nivolumab may be safe and effective as a first-line therapy in adult patients with non–small cell lung cancer (NSCLC), according to the results of the phase I CheckMate 012 trial.
Of 52 adult patients with advanced NSCLC who received nivolumab, 19% experienced grade three or four adverse events, and the overall response rate was 23% with four ongoing complete responses, reported Scott Gettinger, MD, of the Yale Cancer Center, New Haven, Conn., and his associates (J Clin Oncol. 2016 June. doi: 10.1200/JCO.2016.66.9929).
In the study cohort, 94% had stage IV NSCLC, 79% were former or current smokers, and 65% had received either radiotherapy, adjuvant or neoadjuvant chemotherapy.
Treatment-related adverse events were reported in 71% of patients, the most common being fatigue (29%), rash (19%), and nausea (14%). Grade 3 or 4 adverse events including rash, cardiac failure, and lung infection occurred in 10 patients (19%). There were no treatment-related deaths, but adverse events led to the discontinuation of the drug treatment in six patients.
Responses to nivolumab (overall response rate, 23%) were durable with duration of responses ranging from 4.2 to 25.8 months. In addition, the median overall survival was 19.4 months, median progression-free survival was 3.5 months, and the 24-week progression-free survival rate was 31% (95% confidence interval, 28%-60%).
Forty-six patients had tumor specimens evaluable for PD-L1 expression. Clinical activity was observed regardless of PD-L1 expression, the investigators reported. However, the overall response rate was higher in patients with tumors that expressed PD-L1, compared with non-PD-L1-expressing tumors.
All investigators reported serving in advisory roles for, receiving financial compensation or honoraria from, or having ownership or stock in multiple companies including Bristol-Myers Squibb, which funded the study.
On Twitter @jessnicolecraig
FROM THE JOURNAL OF CLINICAL ONCOLOGY
Key clinical point: A phase I trial indicates that nivolumab is safe and shows durable activity as a first-line therapy in treating patients with advanced NSCLC.
Major finding: Grade 3 or 4 adverse events were reported in 19% of patients. The overall response rate was 23% with four ongoing complete responses.
Data source: A phase I trial of 52 patients with stage 3 or 4 non–small-cell lung cancer.
Disclosures: All investigators reported serving in advisory roles for, receiving financial compensation or honoraria from, or having ownership or stock interest in multiple companies including Bristol-Myers Squibb, which funded the study.

The impact of a nurse practitioner-led symptom clinic on emergency department use in cancer patients
Background Emergency department (ED) use and hospitalization is distressing to cancer patients and drives up the cost of health care. A growing body of evidence demonstrates that more than half of those visits may be avoidable.
Objective To examine the impact of a nurse practitioner (NP)-led, physician-supervised, outpatient symptom management clinic on ED use.
Methods We conducted a retrospective review of ED encounters to quantify the frequency of ED use by oncology patients at a community cancer institute 6 months before (October 2012-March 2013) and after (April-September 2013) the initiation of an NP-staffed symptom management clinic.
Results The highest use of the ED and supportive clinic was among patients with advanced cancer, most commonly with lung or breast cancer, who were receiving cytotoxic chemotherapy. Uncontrolled symptoms of shortness of breath, pain, weakness, fever, nausea, vomiting, and diarrhea commonly led to ED visits. Despite instituting the NP-staffed symptom management clinic to manage those symptoms, there was a 17.9% increase in ED use. However, of the patients seen by the NP, 95% may have avoided hospitalization.
Limitations Retrospective study
Conclusions Our study identifies a high-risk population of patients who use the ED frequently. NP-led clinics could aggressively manage the symptom burden of these patients and potentially reduce ED visits as other studies have demonstrated. Although our study did not directly demonstrate this, we have identified weaknesses of care delivery in our clinic that could be optimized. In addition, we have demonstrated that the majority of patients seen for acute symptoms by an NP avoided an ED visit.
Click on the PDF icon at the top of this introduction to read the full article.