User login
Combined Anterior-Posterior Decompression and Fusion for Cervical Spondylotic Myelopathy
Take-Home Points
- Surgical intervention for cervical spondylosis and radiculopathy classically involves either an anterior or posterior approach for adequate decompression of the spinal cord and associated nerve roots.
- Combined anterior-posterior surgery for cervical spondylotic myelopathy is a relatively new technique that has previously been used for disorders of the thoracolumbar spine.
- Combined anterior-posterior cervical decompression and fusion for the treatment of cervical spondylotic myelopathy is associated with minor complications and excellent neurologic outcomes.
- Combined surgery can either be performed in a single day or in a staged manner, with current literature showing that same-day surgery is superior with respect to estimated blood loss and length of stay.
Cervical spondylotic myelopathy (CSM) is a degenerative disease characterized by progressive compression of the spinal cord. CSM has been found to be the most common cause of spinal impairment as well as the most frequently acquired cause of spinal dysfunction in people over 55 years of age.1,2 If left untreated, this condition can reduce manual dexterity and cause gait disturbances, dysesthesias, and weakness in the extremities. When conservative treatments fail, surgical intervention often becomes the preferred course of action for CSM and/or myeloradiculopathy.
The surgical approach for CSM and other advanced cervical spine (CS) deformities varies and is often a source of debate. Being a relatively safe and effective procedure, anterior decompression with fusion is optimal in treating discogenic lesions causing myelopathy but is less effective in multilevel disease.3,4 When pseudarthrosis, adjacent segment degeneration (ASD), and hardware failure are of concern, posterior decompressive laminectomy with instrumentation is a promising option.5 However, this method is less effective in restoring lordosis and can increase the risk for later clinical deterioration.6 There is a select subset of patients for whom a combined anterior-posterior approach is ideal.7-9In cases in which a combined anterior-posterior approach is identified as the best treatment option, whether to perform the operation in a sequential or staged manner must be decided, and this question is another source of debate. Single-day surgery is sometimes anecdotally criticized as posing a greater risk to the patient. On the other hand, some comparative studies have shown no statistically significant difference in major complication rates between the 2 options.10,11 More descriptive studies of combined anterior-posterior decompression and fusion (CAPDF) are needed to explore the efficacy of the procedure. In this article, we describe a study we conducted to characterize the operative data, perioperative complications, and short-term outcomes associated with CAPDF for the treatment of CSM in a select group of patients.
Methods
After receiving Institutional Review Board approval for this study (formal consent was not required), we retrospectively reviewed the charts of 21 patients who underwent CAPDF for CSM at our institution. All patients underwent surgery between February 2010 and March 2015. Criteria for inclusion in the study included same-day CAPDF for CSM. Staged procedures were excluded, as were combined procedures for the treatment of other diseases (eg, malignancies). All patients were operated on by the same primary surgeon (Dr. Davis) and co-surgeon (Dr. Labiak). The 1 patient who was lost to follow-up was excluded from the postoperative outcome analysis.
We reviewed the patients’ medical records for surgical consultations, operative reports, intraoperative reports, progress notes, and postoperative office visit reports. Demographic information included age, sex, body mass index, and preoperative risk factors, such as diabetes and tobacco use. All patients had been diagnosed with myelopathy. Clinical data included previous history of CS surgery, levels fused (and number of levels fused) anteriorly and posteriorly, operative time, estimated blood loss (EBL), length of stay (LOS), and perioperative complications. Short-term (3-month follow-up) neurologic improvement was determined both objectively, with the Nurick grading system,12 and subjectively, with determination of patient quality of life before and after surgery and with neurologic examination.
Operative Technique: Anterior Approach
All operations were performed with continuous somatosensory evoked potential monitoring of both upper and lower extremities. Each patient, positioned supine with the head in a neutral position, underwent standard endotracheal intubation. Intubation was followed by a transverse incision and dissection down to the deep cervical fascia with maintenance of the carotid sheath laterally and tracheoesophageal complex medially. Interspaces were identified and later were confirmed with lateral radiographs. Discectomy, osteophytectomy, and removal of hypertrophied or calcified ligament were then performed until decompression was satisfactory. Corpectomies were not performed. Polyetheretherketone interbody spacers (Stryker) were used with autograft harvested from vertebral body resection. Low-profile screw-plate systems were placed. After completion of the anterior procedure, the patient was placed prone, with the head fixed in a Mayfield clamping device in neutral position and with all pressure points carefully padded.
Operative Technique: Posterior Approach
A midline incision was made through the skin and subcutaneous tissue to the level of the deep cervical fascia. Then, dissection was performed to the tips of the lateral masses. Instrumentation and fusion preceded spinal decompression. This order, chosen to preserve bony landmarks for guidance during instrumentation, did not interfere with subsequent decompression. Segmental spinal instrumentation was placed using lateral mass screw-rod fixation. After the laminae and ligamenta flava were bilaterally mobilized, the entire bony ligamentous complex spanning the area of fusion was removed en masse (most commonly C3–C7) in order to decrease the number of instrument passes near the spinal cord. Next, a modest foraminotomy was performed to extend the opening laterally and ensure adequate decompression of the nerve roots. Autograft harvested from the spinous processes and laminae was used. The posterior portion of the operation contributed significantly to blood loss and postoperative pain during the perioperative period. We recommend performing a very meticulous dissection to minimize these consequences. No patient in this study required a halo orthosis.
Results
Twenty-one patients with CSM were treated with CAPDF between February 2010 and March 2015 (Table 1). 
Table 2 summarizes the operative data. Mean number of levels fused was 2 (range, 1-3) anteriorly and 3 (range, 1-4) posteriorly. 

Of the 21 patients, 9 (42.3%) had at least 1 complication during the perioperative period. Table 3 summarizes all encountered complications. Neither neurologic instability nor mortality was observed after surgery. 
Patient 7 was lost to follow-up. For the other 20 patients, mean time to “3-month follow-up” was 96 days (range, 51-149 days). The most commonly noted improvements in quality of life included resolution of numbness, improvement in gait, and return to previous activities, such as walking and even exercising. 

Representative Case
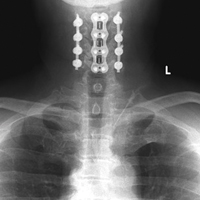
Patient 15, a 53-year-old man, presented with complaints of dysesthesias of the hands. Focused neurologic evaluation at the time revealed limited CS range of motion on extension. The patient (Figures 2A-2D) was diffusely hyperreflexic and had pathologic spread in the upper extremities. 
Discussion
Cervical myelopathy is a common yet frequently underdiagnosed disease, owing to the fact that many patients remain asymptomatic even after experiencing degenerative changes in the spinal column.14-16 The additive effects of spondylosis, osteophyte formation, ligamentous hypertrophy, and listhesis lead to progressive canal and intervertebral foraminal compromise, ultimately producing the clinical syndromes of myelopathy and radiculopathy.17 The characteristic symptoms of CSM are known to have an insidious onset. In the early stages, patients note a subtle gait disturbance and later experience manual dexterity reductions and upper extremity dysesthesias.18 As the condition progresses and conservative management fails, surgical intervention is sought.
Nevertheless, the pursuit of surgical treatment for CSM remains somewhat controversial. Some authors have found no statistically significant difference between conservative and surgical management of mild to moderate CSM,19 whereas others have found that surgically treated patients had much better outcomes than their medically treated counterparts.20 In 2010, Scardino and colleagues21 reported that CSM patients who were bedridden and/or wheelchair-bound with seemingly irreversible myelopathy were capable of neurologic improvement after surgical intervention. At the very least, what remains clear is that untreated CSM is known to follow an unpredictable course, with the condition deteriorating faster for some patients than others.22Traditional anterior or posterior approaches, which can be used in the majority of cases of cervical spondylosis and/or radiculopathy, have been compared extensively.23,24 The inverse relationship concerning the integrity of an anterior construct and the number of levels fused is a well-established clinical finding.3,4,8,25-28 Laminectomy with fusion is not without its disadvantages: Cervical instability secondary to mechanical loss of posterior cervical support, and subsequent post-laminectomy kyphosis, is a common complication.23 In cases in which more stability is required, the combined anterior-posterior approach is more promising than either approach alone. This technique has its roots in the treatment of several thoracolumbar spine disorders, including infections, scoliosis, trauma, and tumors.29-31 More recently, the technique has been applied to CS disorders.
In 2008, Gok and colleagues32 retrospectively compared the results of anterior-only fusion and CAPDF for CSM. Forty-six patients underwent anterior surgery only, and 21 underwent CAPDF. The groups’ complication rates were similar: 28.6% (anterior only) and 24% (CAPDF); the incidence of ASD was lower in the combined group. Song and colleagues33 conducted a similar study in 2010. They compared anterior fusion alone and CAPDF in treating degenerative cervical kyphosis. Results were strongly in favor of the combined technique, as it led to “greater correction of sagittal alignment, a better maintenance of correction angle, a higher rate of fusion, a lower rate of subsidence and lower complications.” Both studies established that, in a select group of patients, the benefits of CAPDF outweighed the risks. These findings, combined with our study’s findings of no major complications and the transience of minor complications, suggest CAPDF should not be considered too invasive or risky.
The results of our study also mirror those of 3 other studies on the use of CAPDF for CS disorders. In 1995, McAfee and colleagues34 reported on a group of 100 patients with follow-up of 2 years or more. In most cases, the surgical indication was trauma, but neoplasm, infection, rheumatoid arthritis, and CSM were found as well. Outcomes were very favorable: improvement in a previous neurologic deficit (57/75 patients), ability to walk again (21/35 patients), no new neurologic deficits, and no hardware failures. In 2000, Schultz and colleagues35 retrospectively reviewed the cases of 72 patients who underwent CAPDF for a variety of complex CS disorders. Two of the 72 experienced transient neurologic deficits, and, though the immediate complication rate was relatively high (32%), the long-term complication rate was down to 5%. In 2009, Konya and colleagues36 retrospectively reviewed the cases of 40 patients who underwent CAPDF, primarily for CSM. Within 1 week after surgery, neurologic deficits were reduced in 36 patients; by 1 year after surgery, neurologic deficits were reduced in all 40 patients, and fusion was achieved in 39. These 3 studies34-36 helped establish CAPDF of the CS as a viable and effective procedure that can be performed within a single day.
Although many physicians have achieved favorable results with single-day surgery, the decision to operate in a sequential or staged manner remains controversial. Some anecdotally claim CAPDF poses a greater operative risk to the patient. In 1991, the continuous procedure was found to involve less blood loss and shorter LOS while providing for better correction of severe spinal deformity in patients with scoliosis and rigid kyphosis.37 Three more recent comparative studies examining the same issue in the treatment of CS diseases found staging did not reduce the complication rate and may in fact have been associated with higher complication rates, more blood loss, and longer total operative time and LOS.10,11,38 Our study’s lower blood loss, shorter LOS, and lower major complication rate relative to the combined groups in all 3 of those studies are most likely attributable to our operating on a lower mean number of spinal levels and our restricting the surgical indication to CSM. The positive short-term outcomes and low rate of long-term complications in our study, combined with the data from these 3 comparative studies, suggest that same-day surgery is superior to staged surgery. A staged operation should be considered only if the patient cannot tolerate long periods under general anesthesia.
Many have advocated extending fusion down to T1 to prevent ASD at the C7–T1 disk space.35,39,40 We decided against this approach for 2 reasons. First, at C7, lateral mass screws were always chosen over pedicle screws. When possible, shorter lateral mass screws were used at this level, making C7 much less rigid. Second, the C7–T1 facet capsule was maintained to preserve joint integrity. We suggest extending fusion down to T1 only if there is prior evidence of spinal disease and/or listhesis at C7–T1. Although long-term (many-year) follow-up is often desired, we specifically assessed short-term (3-month) outcomes. We have anecdotally found that degree of improvement often follows a predictable course after 3-month follow-up. If myelopathy resolves even to a small extent during the first 3 postoperative months, later improvement will likely follow an upward course. Conversely, if myelopathy does not improve during the first 3 months, further improvement is much less likely.
This trend in neurologic improvement likely is directly related to degree of myelopathy before surgery. Patients with CSM generally experience symptoms over an extended period and try conservative management before any surgical consultation. Although spinal ischemia is often resolved by decompression, permanent ischemic damage to the cord is not uncommon. In this setting, postoperative neurologic improvement is minimal or even nonexistent, and decompression is preventive rather than curative. In our study, 1 patient had no subjective improvement after surgery. At 3-month follow-up, magnetic resonance imaging showed notable myelomalacia without residual spinal cord compression. We attribute the failure of the ischemic changes to resolve to long-standing preoperative damage to the cord. Nevertheless, surgery stabilized the myelopathy and prevented further ischemic damage and clinical deterioration.
As is the case with any operation, patients must be carefully selected for CAPDF. Indications for CAPDF, as described by Kim and Alexander,7 include acute spinal trauma, post-laminectomy kyphosis, kyphotic deformity with intact posterior tension band, multilevel spondylosis and OPLL, and preexisting risk factors for pseudarthrosis. Clearly, the severity of each varies, and the pathologies are not mutually exclusive. We emphasize that these indications provide only a guideline for performing CAPDF, and patients must be selected on a case-by-case basis. All the patients in our study were symptomatic and exhibited significant compression of the spinal cord anteriorly and posteriorly at multiple levels. Several presented with concomitant pathologies, such as cervical kyphotic deformity, congenital spinal stenosis, and OPLL. In each case, the indication for surgical intervention was undoubted. We sought both to improve the patient’s baseline symptoms and to prevent further damage to the spinal cord.
This study had its limitations. First, its retrospective design predisposed it to a higher degree of bias. Second, because CAPDF is not commonly performed, the sample size was relatively small. Third, although it provided a descriptive analysis of CAPDF for CSM, the study did not use a direct comparison group to establish whether treatment within a single day or staged treatment was more beneficial for our cohort in particular. On the basis of prior experience and observation, we think performing the operation within a single day is much more beneficial for the patient. Our discussion of studies that have compared same-day and staged surgery supports this observation. Therefore, staged treatment was not recommended to our patients.
Conclusion
Few descriptive studies have explored CAPDF for CSM. Our study’s results showed the procedure was associated with minor complications and provided symptomatic relief for a majority of patients as early as 3 months after surgery. In addition, CAPDF can be successfully performed sequentially within a single day. As such, it represents an excellent option for treating multilevel symptomatic CSM cases that require more extensive spinal decompression and more stability.
Am J Orthop. 2017;46(2):E97-E104. Copyright Frontline Medical Communications Inc. 2017. All rights reserved.
1. Baptiste DC, Fehlings MG. Pathophysiology of cervical myelopathy. Spine J. 2006;6(6 suppl):190S-197S.
2. Kalsi-Ryan S, Karadimas SK, Fehlings MG. Cervical spondylotic myelopathy: the clinical phenomenon and the current pathobiology of an increasingly prevalent and devastating disorder. Neuroscientist. 2013;19(4):409-421.
3. Sasso RC, Ruggiero RA Jr, Reilly TM, Hall PV. Early reconstruction failures after multilevel cervical corpectomy. Spine. 2003;28(2):140-142.
4. Zdeblick TA, Hughes SS, Riew KD, Bohlman HH. Failed anterior cervical discectomy and arthrodesis. Analysis and treatment of thirty-five patients. J Bone Joint Surg Am. 1997;79(4):523-532.
5. Zhu B, Xu Y, Liu X, Liu Z, Dang G. Anterior approach versus posterior approach for the treatment of multilevel cervical spondylotic myelopathy: a systemic review and meta-analysis. Eur Spine J. 2013;22(7):1583-1593.
6. Cabraja M, Abbushi A, Koeppen D, Kroppenstedt S, Woiciechowsky C. Comparison between anterior and posterior decompression with instrumentation for cervical spondylotic myelopathy: sagittal alignment and clinical outcome. Neurosurg Focus. 2010;28(3):E15.
7. Kim PK, Alexander JT. Indications for circumferential surgery for cervical spondylotic myelopathy. Spine J. 2006;6(6 suppl):299S-307S.
8. König SA, Ranguis S, Spetzger U. Management of complex cervical instability. J Neurol Surg A Cent Eur Neurosurg. 2015;76(2):119-125.
9. König SA, Spetzger U. Surgical management of cervical spondylotic myelopathy—indications for anterior, posterior or combined procedures for decompression and stabilisation. Acta Neurochir. 2014;156(2):253-258.
10. Harel R, Hwang R, Fakhar M, et al. Circumferential cervical surgery: to stage or not to stage? J Spinal Disord Tech. 2013;26(4):183-188.
11. Siemionow K, Tyrakowski M, Patel K, Neckrysh S. Comparison of perioperative complications following staged versus one-day anterior and posterior cervical decompression and fusion crossing the cervico-thoracic junction. Neurol Neurochir Pol. 2014;48(6):403-409.
12. Nurick S. The pathogenesis of the spinal cord disorder associated with cervical spondylosis. Brain. 1972;95(1):87-100.
13. Chen CJ, Saulle D, Fu KM, Smith JS, Shaffrey CI. Dysphagia following combined anterior-posterior cervical spine surgeries. J Neurosurg Spine. 2013;19(3):279-287.
14. Boden SD, McCowin PR, Davis DO, Dina TS, Mark AS, Wiesel S. Abnormal magnetic-resonance scans of the cervical spine in asymptomatic subjects. A prospective investigation. J Bone Joint Surg Am. 1990;72(8):1178-1184.
15. Gore DR, Sepic SB, Gardner GM. Roentgenographic findings of the cervical spine in asymptomatic people. Spine. 1986;11(6):521-524.
16. Law MD Jr, Bernhardt M, White AA 3rd. Cervical spondylotic myelopathy: a review of surgical indications and decision making. Yale J Biol Med. 1993;66(3):165-177.
17. Kelly JC, Groarke PJ, Butler JS, Poynton AR, O’Byrne JM. The natural history and clinical syndromes of degenerative cervical spondylosis. Adv Orthop. 2012;(2012):393642.
18. Baron EM, Young WF. Cervical spondylotic myelopathy: a brief review of its pathophysiology, clinical course, and diagnosis. Neurosurgery. 2007;60(1 suppl 1):S35-S41.
19. Kadanka Z, Mares M, Bednarik J, et al. Approaches to spondylotic cervical myelopathy: conservative versus surgical results in a 3-year follow-up study. Spine. 2002;27(20):2205-2210.
20. Sampath P, Bendebba M, Davis JD, Ducker TB. Outcome of patients treated for cervical myelopathy. A prospective, multicenter study with independent clinical review. Spine. 2000;25(6):670-676.
21. Scardino FB, Rocha LP, Barcelos AC, Rotta JM, Botelho RV. Is there a benefit to operating on patients (bedridden or in wheelchairs) with advanced stage cervical spondylotic myelopathy? Eur Spine J. 2010;19(5):699-705.
22. Edwards CC 2nd, Riew KD, Anderson PA, Hilibrand AS, Vaccaro AF. Cervical myelopathy. Current diagnostic and treatment strategies. Spine J. 2003;3(1):68-81.
23. Herkowitz HN. A comparison of anterior cervical fusion, cervical laminectomy, and cervical laminoplasty for the surgical management of multiple level spondylotic radiculopathy. Spine. 1988;13(7):774-780.
24. Hukuda S, Mochizuki T, Ogata M, Shichikawa K, Shimomura Y. Operations for cervical spondylotic myelopathy. A comparison of the results of anterior and posterior procedures. J Bone Joint Surg Br. 1985;67(4):609-615.
25. Fernyhough JC, White JI, LaRocca H. Fusion rates in multilevel cervical spondylosis comparing allograft fibula with autograft fibula in 126 patients. Spine. 1991;16(10 suppl):S561-S564.
26. Macdonald RL, Fehlings MG, Tator CH, et al. Multilevel anterior cervical corpectomy and fibular allograft fusion for cervical myelopathy. J Neurosurg. 1997;86(6):990-997.
27. Mayr MT, Subach BR, Comey CH, Rodts GE, Haid RW Jr. Cervical spinal stenosis: outcome after anterior corpectomy, allograft reconstruction, and instrumentation. J Neurosurg. 2002;96(1 suppl):10-16.
28. Swank ML, Lowery GL, Bhat AL, McDonough RF. Anterior cervical allograft arthrodesis and instrumentation: multilevel interbody grafting or strut graft reconstruction. Eur Spine J. 1997;6(2):138-143.
29. Böhm H, Harms J, Donk R, Zielke K. Correction and stabilization of angular kyphosis. Clin Orthop Relat Res. 1990;(258):56-61.
30. Spencer DL, DeWald RL. Simultaneous anterior and posterior surgical approach to the thoracic and lumbar spine. Spine. 1979;4(1):29-36.
31. Whitesides TE Jr, Shah SGA. On the management of unstable fractures of the thoracolumbar spine: rationale for use of anterior decompression and fusion and posterior stabilization. Spine. 1976;1(2):99-107.
32. Gok B, Sciubba DM, McLoughlin GS, et al. Surgical treatment of cervical spondylotic myelopathy with anterior compression: a review of 67 cases. J Neurosurg Spine. 2008;9(2):152-157.
33. Song KJ, Johnson JS, Choi BR, Wang JC, Lee KB. Anterior fusion alone compared with combined anterior and posterior fusion for the treatment of degenerative cervical kyphosis. J Bone Joint Surg Br. 2010;92(11):1548-1552.
34. McAfee PC, Bohlman HH, Ducker TB, Zeidman SM, Goldstein JA. One-stage anterior cervical decompression and posterior stabilization. A study of one hundred patients with a minimum of two years of follow-up. J Bone Joint Surg Am. 1995;77(12):1791-1800.
35. Schultz KD Jr, McLaughlin MR, Haid RW Jr, Comey CH, Rodts GE Jr, Alexander J. Single-stage anterior-posterior decompression and stabilization for complex cervical spine disorders. J Neurosurg. 2000;93(2 suppl):214-221.
36. Konya D, Ozgen S, Gercek A, Pamir MN. Outcomes for combined anterior and posterior surgical approaches for patients with multisegmental cervical spondylotic myelopathy. J Clin Neurosci. 2009;16(3):404-409.
37. Shufflebarger HL, Grimm JO, Bui V, Thomson JD. Anterior and posterior spinal fusion. Staged versus same-day surgery. Spine. 1991;16(8):930-933.
38. Ozturk C, Aydinli U, Vural R, Sehirlioglu A, Mutlu M. Simultaneous versus sequential one-stage combined anterior and posterior spinal surgery for spinal infections (outcomes and complications). Int Orthop. 2007;31(3):363-366.
39. Aryan HE, Sanchez-Mejia RO, Ben-Haim S, Ames CP. Successful treatment of cervical myelopathy with minimal morbidity by circumferential decompression and fusion. Eur Spine J. 2007;16(9):1401-1409.
40. Steinmetz MP, Miller J, Warbel A, Krishnaney AA, Bingaman W, Benzel EC. Regional instability following cervicothoracic junction surgery. J Neurosurg Spine. 2006;4(4):278-284.
Take-Home Points
- Surgical intervention for cervical spondylosis and radiculopathy classically involves either an anterior or posterior approach for adequate decompression of the spinal cord and associated nerve roots.
- Combined anterior-posterior surgery for cervical spondylotic myelopathy is a relatively new technique that has previously been used for disorders of the thoracolumbar spine.
- Combined anterior-posterior cervical decompression and fusion for the treatment of cervical spondylotic myelopathy is associated with minor complications and excellent neurologic outcomes.
- Combined surgery can either be performed in a single day or in a staged manner, with current literature showing that same-day surgery is superior with respect to estimated blood loss and length of stay.
Cervical spondylotic myelopathy (CSM) is a degenerative disease characterized by progressive compression of the spinal cord. CSM has been found to be the most common cause of spinal impairment as well as the most frequently acquired cause of spinal dysfunction in people over 55 years of age.1,2 If left untreated, this condition can reduce manual dexterity and cause gait disturbances, dysesthesias, and weakness in the extremities. When conservative treatments fail, surgical intervention often becomes the preferred course of action for CSM and/or myeloradiculopathy.
The surgical approach for CSM and other advanced cervical spine (CS) deformities varies and is often a source of debate. Being a relatively safe and effective procedure, anterior decompression with fusion is optimal in treating discogenic lesions causing myelopathy but is less effective in multilevel disease.3,4 When pseudarthrosis, adjacent segment degeneration (ASD), and hardware failure are of concern, posterior decompressive laminectomy with instrumentation is a promising option.5 However, this method is less effective in restoring lordosis and can increase the risk for later clinical deterioration.6 There is a select subset of patients for whom a combined anterior-posterior approach is ideal.7-9In cases in which a combined anterior-posterior approach is identified as the best treatment option, whether to perform the operation in a sequential or staged manner must be decided, and this question is another source of debate. Single-day surgery is sometimes anecdotally criticized as posing a greater risk to the patient. On the other hand, some comparative studies have shown no statistically significant difference in major complication rates between the 2 options.10,11 More descriptive studies of combined anterior-posterior decompression and fusion (CAPDF) are needed to explore the efficacy of the procedure. In this article, we describe a study we conducted to characterize the operative data, perioperative complications, and short-term outcomes associated with CAPDF for the treatment of CSM in a select group of patients.
Methods
After receiving Institutional Review Board approval for this study (formal consent was not required), we retrospectively reviewed the charts of 21 patients who underwent CAPDF for CSM at our institution. All patients underwent surgery between February 2010 and March 2015. Criteria for inclusion in the study included same-day CAPDF for CSM. Staged procedures were excluded, as were combined procedures for the treatment of other diseases (eg, malignancies). All patients were operated on by the same primary surgeon (Dr. Davis) and co-surgeon (Dr. Labiak). The 1 patient who was lost to follow-up was excluded from the postoperative outcome analysis.
We reviewed the patients’ medical records for surgical consultations, operative reports, intraoperative reports, progress notes, and postoperative office visit reports. Demographic information included age, sex, body mass index, and preoperative risk factors, such as diabetes and tobacco use. All patients had been diagnosed with myelopathy. Clinical data included previous history of CS surgery, levels fused (and number of levels fused) anteriorly and posteriorly, operative time, estimated blood loss (EBL), length of stay (LOS), and perioperative complications. Short-term (3-month follow-up) neurologic improvement was determined both objectively, with the Nurick grading system,12 and subjectively, with determination of patient quality of life before and after surgery and with neurologic examination.
Operative Technique: Anterior Approach
All operations were performed with continuous somatosensory evoked potential monitoring of both upper and lower extremities. Each patient, positioned supine with the head in a neutral position, underwent standard endotracheal intubation. Intubation was followed by a transverse incision and dissection down to the deep cervical fascia with maintenance of the carotid sheath laterally and tracheoesophageal complex medially. Interspaces were identified and later were confirmed with lateral radiographs. Discectomy, osteophytectomy, and removal of hypertrophied or calcified ligament were then performed until decompression was satisfactory. Corpectomies were not performed. Polyetheretherketone interbody spacers (Stryker) were used with autograft harvested from vertebral body resection. Low-profile screw-plate systems were placed. After completion of the anterior procedure, the patient was placed prone, with the head fixed in a Mayfield clamping device in neutral position and with all pressure points carefully padded.
Operative Technique: Posterior Approach
A midline incision was made through the skin and subcutaneous tissue to the level of the deep cervical fascia. Then, dissection was performed to the tips of the lateral masses. Instrumentation and fusion preceded spinal decompression. This order, chosen to preserve bony landmarks for guidance during instrumentation, did not interfere with subsequent decompression. Segmental spinal instrumentation was placed using lateral mass screw-rod fixation. After the laminae and ligamenta flava were bilaterally mobilized, the entire bony ligamentous complex spanning the area of fusion was removed en masse (most commonly C3–C7) in order to decrease the number of instrument passes near the spinal cord. Next, a modest foraminotomy was performed to extend the opening laterally and ensure adequate decompression of the nerve roots. Autograft harvested from the spinous processes and laminae was used. The posterior portion of the operation contributed significantly to blood loss and postoperative pain during the perioperative period. We recommend performing a very meticulous dissection to minimize these consequences. No patient in this study required a halo orthosis.
Results
Twenty-one patients with CSM were treated with CAPDF between February 2010 and March 2015 (Table 1).
Table 2 summarizes the operative data. Mean number of levels fused was 2 (range, 1-3) anteriorly and 3 (range, 1-4) posteriorly.
Of the 21 patients, 9 (42.3%) had at least 1 complication during the perioperative period. Table 3 summarizes all encountered complications. Neither neurologic instability nor mortality was observed after surgery.
Patient 7 was lost to follow-up. For the other 20 patients, mean time to “3-month follow-up” was 96 days (range, 51-149 days). The most commonly noted improvements in quality of life included resolution of numbness, improvement in gait, and return to previous activities, such as walking and even exercising.
Representative Case
Patient 15, a 53-year-old man, presented with complaints of dysesthesias of the hands. Focused neurologic evaluation at the time revealed limited CS range of motion on extension. The patient (Figures 2A-2D) was diffusely hyperreflexic and had pathologic spread in the upper extremities.
Discussion
Cervical myelopathy is a common yet frequently underdiagnosed disease, owing to the fact that many patients remain asymptomatic even after experiencing degenerative changes in the spinal column.14-16 The additive effects of spondylosis, osteophyte formation, ligamentous hypertrophy, and listhesis lead to progressive canal and intervertebral foraminal compromise, ultimately producing the clinical syndromes of myelopathy and radiculopathy.17 The characteristic symptoms of CSM are known to have an insidious onset. In the early stages, patients note a subtle gait disturbance and later experience manual dexterity reductions and upper extremity dysesthesias.18 As the condition progresses and conservative management fails, surgical intervention is sought.
Nevertheless, the pursuit of surgical treatment for CSM remains somewhat controversial. Some authors have found no statistically significant difference between conservative and surgical management of mild to moderate CSM,19 whereas others have found that surgically treated patients had much better outcomes than their medically treated counterparts.20 In 2010, Scardino and colleagues21 reported that CSM patients who were bedridden and/or wheelchair-bound with seemingly irreversible myelopathy were capable of neurologic improvement after surgical intervention. At the very least, what remains clear is that untreated CSM is known to follow an unpredictable course, with the condition deteriorating faster for some patients than others.22Traditional anterior or posterior approaches, which can be used in the majority of cases of cervical spondylosis and/or radiculopathy, have been compared extensively.23,24 The inverse relationship concerning the integrity of an anterior construct and the number of levels fused is a well-established clinical finding.3,4,8,25-28 Laminectomy with fusion is not without its disadvantages: Cervical instability secondary to mechanical loss of posterior cervical support, and subsequent post-laminectomy kyphosis, is a common complication.23 In cases in which more stability is required, the combined anterior-posterior approach is more promising than either approach alone. This technique has its roots in the treatment of several thoracolumbar spine disorders, including infections, scoliosis, trauma, and tumors.29-31 More recently, the technique has been applied to CS disorders.
In 2008, Gok and colleagues32 retrospectively compared the results of anterior-only fusion and CAPDF for CSM. Forty-six patients underwent anterior surgery only, and 21 underwent CAPDF. The groups’ complication rates were similar: 28.6% (anterior only) and 24% (CAPDF); the incidence of ASD was lower in the combined group. Song and colleagues33 conducted a similar study in 2010. They compared anterior fusion alone and CAPDF in treating degenerative cervical kyphosis. Results were strongly in favor of the combined technique, as it led to “greater correction of sagittal alignment, a better maintenance of correction angle, a higher rate of fusion, a lower rate of subsidence and lower complications.” Both studies established that, in a select group of patients, the benefits of CAPDF outweighed the risks. These findings, combined with our study’s findings of no major complications and the transience of minor complications, suggest CAPDF should not be considered too invasive or risky.
The results of our study also mirror those of 3 other studies on the use of CAPDF for CS disorders. In 1995, McAfee and colleagues34 reported on a group of 100 patients with follow-up of 2 years or more. In most cases, the surgical indication was trauma, but neoplasm, infection, rheumatoid arthritis, and CSM were found as well. Outcomes were very favorable: improvement in a previous neurologic deficit (57/75 patients), ability to walk again (21/35 patients), no new neurologic deficits, and no hardware failures. In 2000, Schultz and colleagues35 retrospectively reviewed the cases of 72 patients who underwent CAPDF for a variety of complex CS disorders. Two of the 72 experienced transient neurologic deficits, and, though the immediate complication rate was relatively high (32%), the long-term complication rate was down to 5%. In 2009, Konya and colleagues36 retrospectively reviewed the cases of 40 patients who underwent CAPDF, primarily for CSM. Within 1 week after surgery, neurologic deficits were reduced in 36 patients; by 1 year after surgery, neurologic deficits were reduced in all 40 patients, and fusion was achieved in 39. These 3 studies34-36 helped establish CAPDF of the CS as a viable and effective procedure that can be performed within a single day.
Although many physicians have achieved favorable results with single-day surgery, the decision to operate in a sequential or staged manner remains controversial. Some anecdotally claim CAPDF poses a greater operative risk to the patient. In 1991, the continuous procedure was found to involve less blood loss and shorter LOS while providing for better correction of severe spinal deformity in patients with scoliosis and rigid kyphosis.37 Three more recent comparative studies examining the same issue in the treatment of CS diseases found staging did not reduce the complication rate and may in fact have been associated with higher complication rates, more blood loss, and longer total operative time and LOS.10,11,38 Our study’s lower blood loss, shorter LOS, and lower major complication rate relative to the combined groups in all 3 of those studies are most likely attributable to our operating on a lower mean number of spinal levels and our restricting the surgical indication to CSM. The positive short-term outcomes and low rate of long-term complications in our study, combined with the data from these 3 comparative studies, suggest that same-day surgery is superior to staged surgery. A staged operation should be considered only if the patient cannot tolerate long periods under general anesthesia.
Many have advocated extending fusion down to T1 to prevent ASD at the C7–T1 disk space.35,39,40 We decided against this approach for 2 reasons. First, at C7, lateral mass screws were always chosen over pedicle screws. When possible, shorter lateral mass screws were used at this level, making C7 much less rigid. Second, the C7–T1 facet capsule was maintained to preserve joint integrity. We suggest extending fusion down to T1 only if there is prior evidence of spinal disease and/or listhesis at C7–T1. Although long-term (many-year) follow-up is often desired, we specifically assessed short-term (3-month) outcomes. We have anecdotally found that degree of improvement often follows a predictable course after 3-month follow-up. If myelopathy resolves even to a small extent during the first 3 postoperative months, later improvement will likely follow an upward course. Conversely, if myelopathy does not improve during the first 3 months, further improvement is much less likely.
This trend in neurologic improvement likely is directly related to degree of myelopathy before surgery. Patients with CSM generally experience symptoms over an extended period and try conservative management before any surgical consultation. Although spinal ischemia is often resolved by decompression, permanent ischemic damage to the cord is not uncommon. In this setting, postoperative neurologic improvement is minimal or even nonexistent, and decompression is preventive rather than curative. In our study, 1 patient had no subjective improvement after surgery. At 3-month follow-up, magnetic resonance imaging showed notable myelomalacia without residual spinal cord compression. We attribute the failure of the ischemic changes to resolve to long-standing preoperative damage to the cord. Nevertheless, surgery stabilized the myelopathy and prevented further ischemic damage and clinical deterioration.
As is the case with any operation, patients must be carefully selected for CAPDF. Indications for CAPDF, as described by Kim and Alexander,7 include acute spinal trauma, post-laminectomy kyphosis, kyphotic deformity with intact posterior tension band, multilevel spondylosis and OPLL, and preexisting risk factors for pseudarthrosis. Clearly, the severity of each varies, and the pathologies are not mutually exclusive. We emphasize that these indications provide only a guideline for performing CAPDF, and patients must be selected on a case-by-case basis. All the patients in our study were symptomatic and exhibited significant compression of the spinal cord anteriorly and posteriorly at multiple levels. Several presented with concomitant pathologies, such as cervical kyphotic deformity, congenital spinal stenosis, and OPLL. In each case, the indication for surgical intervention was undoubted. We sought both to improve the patient’s baseline symptoms and to prevent further damage to the spinal cord.
This study had its limitations. First, its retrospective design predisposed it to a higher degree of bias. Second, because CAPDF is not commonly performed, the sample size was relatively small. Third, although it provided a descriptive analysis of CAPDF for CSM, the study did not use a direct comparison group to establish whether treatment within a single day or staged treatment was more beneficial for our cohort in particular. On the basis of prior experience and observation, we think performing the operation within a single day is much more beneficial for the patient. Our discussion of studies that have compared same-day and staged surgery supports this observation. Therefore, staged treatment was not recommended to our patients.
Conclusion
Few descriptive studies have explored CAPDF for CSM. Our study’s results showed the procedure was associated with minor complications and provided symptomatic relief for a majority of patients as early as 3 months after surgery. In addition, CAPDF can be successfully performed sequentially within a single day. As such, it represents an excellent option for treating multilevel symptomatic CSM cases that require more extensive spinal decompression and more stability.
Am J Orthop. 2017;46(2):E97-E104. Copyright Frontline Medical Communications Inc. 2017. All rights reserved.
1. Baptiste DC, Fehlings MG. Pathophysiology of cervical myelopathy. Spine J. 2006;6(6 suppl):190S-197S.
2. Kalsi-Ryan S, Karadimas SK, Fehlings MG. Cervical spondylotic myelopathy: the clinical phenomenon and the current pathobiology of an increasingly prevalent and devastating disorder. Neuroscientist. 2013;19(4):409-421.
3. Sasso RC, Ruggiero RA Jr, Reilly TM, Hall PV. Early reconstruction failures after multilevel cervical corpectomy. Spine. 2003;28(2):140-142.
4. Zdeblick TA, Hughes SS, Riew KD, Bohlman HH. Failed anterior cervical discectomy and arthrodesis. Analysis and treatment of thirty-five patients. J Bone Joint Surg Am. 1997;79(4):523-532.
5. Zhu B, Xu Y, Liu X, Liu Z, Dang G. Anterior approach versus posterior approach for the treatment of multilevel cervical spondylotic myelopathy: a systemic review and meta-analysis. Eur Spine J. 2013;22(7):1583-1593.
6. Cabraja M, Abbushi A, Koeppen D, Kroppenstedt S, Woiciechowsky C. Comparison between anterior and posterior decompression with instrumentation for cervical spondylotic myelopathy: sagittal alignment and clinical outcome. Neurosurg Focus. 2010;28(3):E15.
7. Kim PK, Alexander JT. Indications for circumferential surgery for cervical spondylotic myelopathy. Spine J. 2006;6(6 suppl):299S-307S.
8. König SA, Ranguis S, Spetzger U. Management of complex cervical instability. J Neurol Surg A Cent Eur Neurosurg. 2015;76(2):119-125.
9. König SA, Spetzger U. Surgical management of cervical spondylotic myelopathy—indications for anterior, posterior or combined procedures for decompression and stabilisation. Acta Neurochir. 2014;156(2):253-258.
10. Harel R, Hwang R, Fakhar M, et al. Circumferential cervical surgery: to stage or not to stage? J Spinal Disord Tech. 2013;26(4):183-188.
11. Siemionow K, Tyrakowski M, Patel K, Neckrysh S. Comparison of perioperative complications following staged versus one-day anterior and posterior cervical decompression and fusion crossing the cervico-thoracic junction. Neurol Neurochir Pol. 2014;48(6):403-409.
12. Nurick S. The pathogenesis of the spinal cord disorder associated with cervical spondylosis. Brain. 1972;95(1):87-100.
13. Chen CJ, Saulle D, Fu KM, Smith JS, Shaffrey CI. Dysphagia following combined anterior-posterior cervical spine surgeries. J Neurosurg Spine. 2013;19(3):279-287.
14. Boden SD, McCowin PR, Davis DO, Dina TS, Mark AS, Wiesel S. Abnormal magnetic-resonance scans of the cervical spine in asymptomatic subjects. A prospective investigation. J Bone Joint Surg Am. 1990;72(8):1178-1184.
15. Gore DR, Sepic SB, Gardner GM. Roentgenographic findings of the cervical spine in asymptomatic people. Spine. 1986;11(6):521-524.
16. Law MD Jr, Bernhardt M, White AA 3rd. Cervical spondylotic myelopathy: a review of surgical indications and decision making. Yale J Biol Med. 1993;66(3):165-177.
17. Kelly JC, Groarke PJ, Butler JS, Poynton AR, O’Byrne JM. The natural history and clinical syndromes of degenerative cervical spondylosis. Adv Orthop. 2012;(2012):393642.
18. Baron EM, Young WF. Cervical spondylotic myelopathy: a brief review of its pathophysiology, clinical course, and diagnosis. Neurosurgery. 2007;60(1 suppl 1):S35-S41.
19. Kadanka Z, Mares M, Bednarik J, et al. Approaches to spondylotic cervical myelopathy: conservative versus surgical results in a 3-year follow-up study. Spine. 2002;27(20):2205-2210.
20. Sampath P, Bendebba M, Davis JD, Ducker TB. Outcome of patients treated for cervical myelopathy. A prospective, multicenter study with independent clinical review. Spine. 2000;25(6):670-676.
21. Scardino FB, Rocha LP, Barcelos AC, Rotta JM, Botelho RV. Is there a benefit to operating on patients (bedridden or in wheelchairs) with advanced stage cervical spondylotic myelopathy? Eur Spine J. 2010;19(5):699-705.
22. Edwards CC 2nd, Riew KD, Anderson PA, Hilibrand AS, Vaccaro AF. Cervical myelopathy. Current diagnostic and treatment strategies. Spine J. 2003;3(1):68-81.
23. Herkowitz HN. A comparison of anterior cervical fusion, cervical laminectomy, and cervical laminoplasty for the surgical management of multiple level spondylotic radiculopathy. Spine. 1988;13(7):774-780.
24. Hukuda S, Mochizuki T, Ogata M, Shichikawa K, Shimomura Y. Operations for cervical spondylotic myelopathy. A comparison of the results of anterior and posterior procedures. J Bone Joint Surg Br. 1985;67(4):609-615.
25. Fernyhough JC, White JI, LaRocca H. Fusion rates in multilevel cervical spondylosis comparing allograft fibula with autograft fibula in 126 patients. Spine. 1991;16(10 suppl):S561-S564.
26. Macdonald RL, Fehlings MG, Tator CH, et al. Multilevel anterior cervical corpectomy and fibular allograft fusion for cervical myelopathy. J Neurosurg. 1997;86(6):990-997.
27. Mayr MT, Subach BR, Comey CH, Rodts GE, Haid RW Jr. Cervical spinal stenosis: outcome after anterior corpectomy, allograft reconstruction, and instrumentation. J Neurosurg. 2002;96(1 suppl):10-16.
28. Swank ML, Lowery GL, Bhat AL, McDonough RF. Anterior cervical allograft arthrodesis and instrumentation: multilevel interbody grafting or strut graft reconstruction. Eur Spine J. 1997;6(2):138-143.
29. Böhm H, Harms J, Donk R, Zielke K. Correction and stabilization of angular kyphosis. Clin Orthop Relat Res. 1990;(258):56-61.
30. Spencer DL, DeWald RL. Simultaneous anterior and posterior surgical approach to the thoracic and lumbar spine. Spine. 1979;4(1):29-36.
31. Whitesides TE Jr, Shah SGA. On the management of unstable fractures of the thoracolumbar spine: rationale for use of anterior decompression and fusion and posterior stabilization. Spine. 1976;1(2):99-107.
32. Gok B, Sciubba DM, McLoughlin GS, et al. Surgical treatment of cervical spondylotic myelopathy with anterior compression: a review of 67 cases. J Neurosurg Spine. 2008;9(2):152-157.
33. Song KJ, Johnson JS, Choi BR, Wang JC, Lee KB. Anterior fusion alone compared with combined anterior and posterior fusion for the treatment of degenerative cervical kyphosis. J Bone Joint Surg Br. 2010;92(11):1548-1552.
34. McAfee PC, Bohlman HH, Ducker TB, Zeidman SM, Goldstein JA. One-stage anterior cervical decompression and posterior stabilization. A study of one hundred patients with a minimum of two years of follow-up. J Bone Joint Surg Am. 1995;77(12):1791-1800.
35. Schultz KD Jr, McLaughlin MR, Haid RW Jr, Comey CH, Rodts GE Jr, Alexander J. Single-stage anterior-posterior decompression and stabilization for complex cervical spine disorders. J Neurosurg. 2000;93(2 suppl):214-221.
36. Konya D, Ozgen S, Gercek A, Pamir MN. Outcomes for combined anterior and posterior surgical approaches for patients with multisegmental cervical spondylotic myelopathy. J Clin Neurosci. 2009;16(3):404-409.
37. Shufflebarger HL, Grimm JO, Bui V, Thomson JD. Anterior and posterior spinal fusion. Staged versus same-day surgery. Spine. 1991;16(8):930-933.
38. Ozturk C, Aydinli U, Vural R, Sehirlioglu A, Mutlu M. Simultaneous versus sequential one-stage combined anterior and posterior spinal surgery for spinal infections (outcomes and complications). Int Orthop. 2007;31(3):363-366.
39. Aryan HE, Sanchez-Mejia RO, Ben-Haim S, Ames CP. Successful treatment of cervical myelopathy with minimal morbidity by circumferential decompression and fusion. Eur Spine J. 2007;16(9):1401-1409.
40. Steinmetz MP, Miller J, Warbel A, Krishnaney AA, Bingaman W, Benzel EC. Regional instability following cervicothoracic junction surgery. J Neurosurg Spine. 2006;4(4):278-284.
Tree nut allergy responds to immunotherapy
AT 2017 AAAAI ANNUAL MEETING
ATLANTA – Long-term walnut oral immunotherapy induces clinically relevant treatment response in children with tree nut allergy, results from a small ongoing study showed.
“Tree nut allergy is a generally life-long and potentially life-threatening disorder without an active therapy,” study author Amy M. Scurlock, MD, said in an interview in advance of the annual meeting of the American Academy of Allergy, Asthma, and Immunology. “Significant clinical, immunologic, and serologic cross reactivity has been described among tree nut families. Multi–tree nut allergen sensitization is common with 46% reporting allergy to more than one tree nut.”
Dr. Scurlock reported on results from 9 of 14 children with allergy to walnuts and another test tree nut (pecans, cashews, hazelnuts, or pistachios) who received open-label walnut oral immunotherapy after completing 38 weeks of blinded, placebo-controlled treatment. Walnut and test tree nut desensitization oral food challenges were performed by 142 weeks. If they passed, the subjects stopped their treatment for four weeks. Next, they underwent another oral food challenge to determine if they continued to be sensitized or if they had developed sustained unresponsiveness.
The median age of the 14 randomized subjects was 9 years, 75% were male, and 9 (64%) underwent an oral food challenge by week 142. (Two subjects dropped out after randomization, and three have yet to reach the week 142 time point.) Desensitization to both walnut and a test tree nut was observed in seven out of the nine subjects (78%). After 4 weeks off of walnut oral immunotherapy, four out of those seven patients who were desensitized (57%) also demonstrated sustained unresponsiveness to both walnuts and test tree nuts, and six out of seven subjects (86%) had sustained unresponsiveness to just walnuts.
“I am always amazed by the commitment of our food allergic subjects and their families in immunotherapy trials, and this study is no exception,” Dr. Scurlock commented. “Subjects had to undergo an increased number of oral food challenges (walnut, test tree nut, placebo) at protocol-specified time points in addition to daily home dosing. While walnut oral immunotherapy was generally well tolerated, we frequently observed oral allergy/itching associated with dosing in our cohort, which was an atopic group (75% allergic rhinitis). These symptoms can complicate assessment during dosing and oral food challenges. We observed that, with long-term therapy, there were some subjects who developed ‘dosing fatigue’ that could adversely affect adherence. Future studies will need to focus on strategies that optimize long-term sustainability/tolerability of dosing.”
She acknowledged certain limitations of the study, including its single-center design and small sample size. “While the findings are encouraging and similar to outcomes observed in other oral immunotherapy trials, further study in larger cohorts is critical before advancing toward broad clinical implementation. Specific issues regarding complexity of cross-reactivity and the efficacy of specific tree nuts to induce immunomodulation across tree nut families require future study. In addition, improving the long-term sustainability/tolerability of dosing and examining novel approaches is important.”
Dr. Scurlock disclosed that she has received funding from National Institutes of Health/National Institute of Allergy and Infectious Diseases and Food Allergy Research and Education (FARE). She is also medical director for the FARE Clinical Network Center of Excellence at Arkansas Children’s Hospital.
Key clinical point:
Major finding: Of nine subjects who underwent walnut and test tree nut desensitization oral food challenges by week 142, desensitization to both was observed in seven (78%).
Data source: A review of 14 children with allergy to walnuts and another test tree nut who received open-label walnut oral immunotherapy after completing 38 weeks of blinded, placebo-controlled treatment.
Disclosures: Dr. Scurlock disclosed that she has received funding from National Institutes of Health/National Institute of Allergy and Infectious Diseases and Food Allergy Research and Education (FARE). She is also medical director for the FARE Clinical Network Center of Excellence at Arkansas Children’s Hospital.
Post-transplant drug combo eyed for high-risk AML
ORLANDO – Azacitadine and valproic acid can be safely coadministered as maintenance therapy after allogeneic stem cell transplantation in patients with high-risk acute myelogenous leukemia (AML), according to interim findings from an investigator-initiated phase II study.
One-year relapse-free and overall survival rates were about 80%, and no significant toxicities were reported in 28 such patients who began the treatment at least 40 days after transplant and were treated for 4 months, Patrick A. Hagen, MD, reported at the combined annual meetings of the Center for International Blood & Marrow Transplant Research and the American Society for Blood and Marrow Transplantation.
“As we all know, relapse after allogeneic transplant for AML is a huge and ongoing problem. It’s the primary cause of death following transplant, and unfortunately it really hasn’t decreased over the past couple decades,” Dr. Hagen said, adding that relapse is of increasing concern for biologically high-risk patients and is a “pretty ripe area for improved methodologies or approaches.” The decision to pursue maintenance therapy after transplant is complicated: It’s a good opportunity to improve outcomes, but there are many challenges, including problems with drug interactions and myelosuppression, he said.
The study was undertaken based in part on previously reported findings of synergism of a demethylating agent and a histone dacetylase inhibitor in patients with AML, he said.
The maintenance therapy included up to four 28-day cycles of azacitadine at 40 mg/m2 daily on days 1-5, along with oral valproic acid daily throughout the cycle at a 15-mg/kg dose adjusted to achieve a 100-mcg/mL trough level of bound valproic acid as tolerated. Nineteen patients completed all four cycles of treatment.
“The regimen was pretty well tolerated. The vast majority of the toxicities were grade I/II – 70%. The only grade-4 toxicities were cytopenia related and did not lead to a delay in treatment,” he said.
No patients developed acute graft-versus-host disease after therapy, although 11 (39%) developed chronic GVHD, which was extensive in 8, Dr. Hagen said.
Study participants were adults with high-risk AML with no grade 3-4 acute GVHD. All had adequate organ function after allogeneic stem cell transplantation (allo-SCT) performed 40-60 days prior to the start of maintenance therapy. Those with active or uncontrolled infections, low-risk AML in first relapse, neutrophil counts below 1,500, and platelets below 50,000 were excluded, he said.
The patients’ median age was 44 years, they had a median of two prior chemotherapy regimens, and their median Sorror Comorbidity Index was 2.5. Cytogenetics were mostly intermediate and adverse; only one patient had favorable cytogenetics.
Graft type was mixed, with most patients having matched unrelated donors. Conditioning regimens also were mixed, although they “skewed toward myeloablative,” he said. GVHD prophylaxis was standard for the institution and included tacrolimus and methotrexate.
The promising 1-year overall survival and relapse rate without significant dose-limiting toxicities warrants further evaluation in a phase III trial, Dr. Hagen concluded.
He reported having no disclosures.
AT THE 2017 BMT TANDEM MEETINGS
Key clinical point:
Major finding: 1-year relapse-free survival and 1-year overall survival were about 80%.
Data source: An interim analysis of data from 28 patients in a phase II study.
Disclosures: Dr. Hagen reported having no disclosures.
Hearing Loss in People With Good Hearing
About 1 in 4 American adults who say they have good or excellent hearing has hearing damage. According to a Vital Signs report, much of the damage is due to everyday loud sounds, such as leaf blowers, concerts, even portable devices. The rumble of a washing machine approaches the 85 decibels at which extended exposure can cause hearing damage. Sixty seconds of listening to a nearby siren (120 dB) also can cause hearing damage.
CDC researchers analyzed > 3,500 hearing tests conducted on adult participants in the 2012 National Health and Nutrition Examination Survey. Of those participants, 20% who reported no job-related noise exposure nonetheless had hearing damage in a pattern usually caused by noise.
People may delay reporting hearing loss because they don’t know or won’t admit they have a problem, the CDC says. Only 46% of adults who reported having trouble hearing saw a health care provider (HCP) for their hearing in the past 5 years. But chronic noise exposure has been associated with worsening heart disease, increased blood pressure, and other adverse health effects.
The CDC suggests HCPs ask patients (even those as young as 20) about their hearing. For instance, they can ask, “Do you find it difficult to follow a conversation if there is background noise?” and “Can you usually hear and understand what someone says in a normal tone of voice when you can’t see that person’s face?”
At routine health care visits, the CDC suggests HCPs explain to patients how noise exposure can permanently damage hearing. They also suggest recommending earplugs or noise-canceling headphones. About 70% of people exposed to loud noise never or seldom wear hearing protection, CDC says. The CDC suggests advising patients to turn down the volume when watching TV, listening to music, and using earbuds or headphones, as well as asking whether patients are taking medicines that increase the risk of hearing damage. If patients show or report hearing problems, the CDC suggests HCPs examine their hearing or refer them to a hearing specialist.
Long-term safety, efficacy of hemophilia B therapy
Interim results from the B-YOND trial suggest prophylactic treatment with a recombinant factor IX Fc fusion protein (rFIXFc) can provide long-term safety and efficacy, according to researchers.
B-YOND is an extension study for adults and adolescents who completed the B-LONG study and children who completed the Kids B-LONG study.
In both trials, researchers tested rFIXFc in patients with hemophilia B.
The median duration of rFIXFc treatment has surpassed 3 years for the adults and adolescents enrolled in B-YOND and exceeded 1.5 years for children in this trial.
Researchers said the median annualized bleeding rates (ABRs) have been low in these patients, and none of the patients have developed inhibitors.
“The interim data from B-YOND confirm the safety profile of [rFIXFc] and show that adult, adolescent, and pediatric subjects maintained low annual bleed rates with prophylactic dosing of [rFIXFc] every 1 to 2 weeks,” said principal investigator John Pasi, MD, PhD, of Barts and the London School of Medicine and Dentistry in London, UK.
“These results come from the longest-term study of an extended half-life therapy for hemophilia B and provide physicians across the globe with important insights and information about the treatment of hemophilia B.”
The results were published in Thrombosis and Haemostasis.
The research was sponsored by Bioverativ Therapeutics Inc., the company developing rFIXFc (also known as eftrenonacog alfa and by the brand name Alprolix) in collaboration with Sobi. rFIXFc is approved to treat hemophilia B in the US, European Union, and other countries.
Treatment
B-YOND has enrolled 116 patients with hemophilia B who completed B-LONG (n=93) or Kids B-LONG (n=23). The patients were placed in 1 of 4 treatment groups (but could change at any point):
- Weekly prophylaxis—20 to 100 IU/kg every 7 days (50 adults/adolescents, 19 children)
- Individualized prophylaxis—100 IU/kg every 8 to 16 days (30 adults/adolescents, 5 children)
- Modified prophylaxis, which was defined as further dosing personalization to optimize prophylaxis (13 adults/adolescents, 1 child)
- Episodic treatment, which was available only to adults and adolescents (n=15).
In the weekly prophylaxis group, the median dosing interval was 7.0 days for adults, adolescents, and children. The average weekly prophylactic dose was 49.5 IU/kg in adults/adolescents, 64.4 IU/kg in kids younger than 6, and 63.1 IU/kg in kids ages 6 to 11.
In the individualized prophylaxis group, the median dosing interval was 13.7 days for adults and adolescents and 10.0 days in pediatric patients (ages 6 to 11 only). The average weekly prophylactic dose was 50.2 IU/kg in adults/adolescents, and 66.6 IU/kg in kids ages 6 to 11.
In the modified prophylaxis group, the median dosing interval was 6.9 days for adults and adolescents and 4.1 days in the single pediatric patient (who was older than 6). The average weekly prophylactic dose was 61.7 IU/kg in adults/adolescents and 157.9 IU/kg in the pediatric patient.
From the start of B-LONG to the B-YOND interim data cut, adults/adolescents had a median of 39.5 months of cumulative rFIXFc treatment and a median of 162 cumulative exposure days.
From the start of Kids B-LONG to the data cut, pediatric patients had a median of 21.9 months of cumulative rFIXFc treatment and a median of 94 cumulative exposure days.
ABRs
As of the interim data cut, the overall median ABR was 2.3 for adults/adolescents in both the weekly and individualized prophylaxis groups.
The median ABR was 2.4 for adults/adolescents in the modified prophylaxis group and 11.3 for those receiving on-demand treatment.
Among children under age 6 (n=9), the median ABR in the weekly prophylaxis group was 0. (None of the younger children had individualized or modified prophylaxis.)
For children ages 6 to 11, the median ABR was 2.7 in the weekly prophylaxis group (n=10) and 2.4 in the individualized prophylaxis group (n=5). The patient in the modified prophylaxis group had an ABR of 3.1.
Safety
The researchers said rFIXFc was well-tolerated, and the adverse events (AEs) reported were typical of the population studied.
AEs were reported in 75.9% of patients. The most common were headache (n=14, 12.1%) and common cold (n=13, 11.2%), and the majority of AEs were considered unrelated to rFIXFc.
Three adult/adolescent patients experienced AEs during B-YOND that were considered treatment-related, including noncardiac chest pain, hematuria, and obstructive uropathy. All 3 events resolved.
One patient experienced breath odor during B-LONG that was considered treatment-related. And 1 patient reported decreased appetite during Kids B-LONG that was considered treatment-related. Neither of these events resolved.
There were 39 serious AEs in 23 patients (19.8%). All but 1 of these events were considered unrelated to rFIXFc.
The treatment-related serious AE was renal colic in a patient originally enrolled in the B-LONG study. The patient had a medical history of previous clot colic. The event resolved and did not lead to study discontinuation.
There have been no reports of serious allergic reactions or anaphylaxis associated with rFIXFc, no vascular thrombotic events, and no deaths. ![]()
Group reports rejuvenation of aging HSCs
Preclinical research suggests osteopontin, a protein made by osteoblasts, plays a role in hematopoietic stem cell (HSC) aging.
Experiments in mice revealed that, with age, there is a reduction in the expression of osteopontin in the bone marrow stroma.
A lack of osteopontin induced young HSCs to “act” older, while treating older HSCs with recombinant osteopontin restored youthful properties.
Hartmut Geiger, PhD, of the University of Ulm in Germany, and his colleagues reported these findings in EMBO.
“We show that the place where HSCs form in the bone marrow loses osteopontin upon aging, but if you give back the missing protein to the blood-forming cells, they suddenly rejuvenate and act younger,” Dr Geiger said.
“Our study points to exciting, novel ways to have a better immune system and possibly less blood cancer upon aging by therapeutically targeting the place where blood stem cells form.”
The researchers conducted a number of experiments to test the formation and vitality of cells in and near the bone marrow microenvironment.
The team looked at the formation of endosteum stroma cells in aging mice and monitored levels of osteopontin and other proteins linked to distinct cells in the bone marrow during the aging process.
The researchers said they observed reduced production of osteoblasts and other stroma cells in the endosteum of older mice. They also saw decreased osteopontin levels in the bone marrow of older animals, which was associated with reduced vigor and function of HSCs.
The team followed up these experiments by transplanting bone marrow cells from older mice (19 to 21 months) into young mice (8 to 10 weeks).
The researchers also transplanted aged HSCs from older mice into younger mice, and the team treated aged HSCs with a recombinant form of the osteopontin protein.
Transplantation into the younger animals caused HSCs to behave in a younger, more vital manner, the researchers said. This meant smaller numbers of HSCs with greater potential for forming different blood cells, which included larger populations of B and T cells and decreased production of myeloid cells.
The researchers also saw aged HSCs treated with recombinant osteopontin regain their youthful characteristics and capacity to form different blood cell types. Also observed was diminished signaling of Cdc42, a protein previously shown to cause aging in HSCs.
Osteopontin levels are not only low in the bone marrow niche but also in the blood upon aging. As a follow-up to the current study, the researchers are investigating the possibility of using osteopontin replacement therapy in mice to counter the influence of an aging niche directly in the animals. ![]()
Cell-free DNA mutational analysis in AITL

SAN FRANCISCO—An exploratory study suggests cell-free DNA from peripheral blood may be a viable alternative to tumor DNA for mutational profiling in angioimmunoblastic T-cell lymphoma (AITL).
Investigators sequenced cell-free DNA and tumor DNA collected from 13 patients with AITL and found that, in 85% of cases, there was concordance between the tumor mutational profile and the cell-free DNA mutational profile.
“The cell-free DNA mutational analysis seems to mirror the mutational analysis of the tumor in the majority of cases,” said Neha Mehta-Shah, MD, of Memorial Sloan Kettering Cancer Center in New York, New York.
“This may be particularly interesting when we don’t have very much tumor DNA available for sequencing, as occurs frequently in this patient population.”
Dr Mehta-Shah presented these findings at the 9th Annual T-cell Lymphoma Forum.
She said the primary objective of this study was to evaluate whether somatic mutation analysis of cell-free DNA for IDH2 correlates with tumor mutational profiling for IDH2.
The secondary objective was to evaluate whether somatic mutational analysis of cell-free DNA mirrors the mutational profile of the tumor.
So Dr Mehta-Shah and her colleagues sequenced various samples from 14 patients with AITL (4 who were newly diagnosed and 10 with relapsed disease).
The investigators compared cell-free DNA obtained from peripheral blood samples with genomic DNA obtained from primary tumor biopsies and with DNA from peripheral blood mononuclear cells (for germline comparison). One of the 14 patients didn’t have tumor tissue available, so 13 patients were included in the analysis.
The team performed targeted next-generation sequencing using Memorial Sloan Kettering Cancer Center’s IMPACT platform, which sequences 410 genes known to be recurrently mutated in cancer.
The investigators observed concordance between the tumor mutational profile and the cell-free DNA profile in 85% of cases (11/13).
Identical alterations in TET2, RHOA, IDH2, DNMT3A, and ROS1 were detected in cell-free DNA from peripheral blood and tumor genomic DNA, with a similar variant allele frequency.
On the other hand, mutational analysis of cell-free DNA obtained from urine samples from 2 of the patients did not correlate with somatic mutations from tumor DNA.
This research also revealed that some samples had multiple mutations in TET2, which are indicative of subclonal populations.
And sequential samples from 2 patients, collected at the start of salvage therapy and at subsequent relapse, showed the disappearance of mutations in RHOA, TET2, and IDH2. This observation has been attributed to clonal evolution and/or changes in overall disease burden. ![]()
MSC product granted fast track designation
The US Food and Drug Administration (FDA) has granted fast track designation to a mesenchymal stem cell (MSC) product, MSC-100-IV, as a treatment for children with steroid-refractory acute graft-vs-host disease (aGVHD).
MSC-100-IV consists of human MSCs derived from donor bone marrow and expanded in culture.
Fast track designation has the potential to shorten the time to FDA approval for MSC-100-IV through priority review, which reduces the FDA review process from 10 months to 6 months.
The designation also allows for a rolling review process, whereby completed sections of the Biologics License Application can be submitted for FDA review as they become available, instead of waiting for all sections to be completed.
In addition, fast track designation provides product developers with opportunities for more frequent meetings and written communications with the FDA.
MSC-100-IV is being developed by Mesoblast Limited in partnership with Mallinckrodt Pharmaceuticals.
Trial results
The application for fast track designation for MSC-100-IV was supported by a trial of 241 pediatric patients with steroid-refractory aGVHD. Results from this trial were presented at the 2016 BMT Tandem Meetings.
Patients initially received 2 million MSCs/kg twice a week for 4 weeks, at least 3 days apart. If they achieved a partial or mixed response (improvement in one organ with deterioration in another) at the day-28 assessment, patients then received 2 million MSCs/kg once a week for 4 weeks.
The patients received a total of 2434 infusions—a median of 11 (range, 1-24)—and had a median treatment duration of 46 days (range, 1-186).
Fifty-seven percent of patients (n=138) had at least 1 serious adverse event. About 5% (n=11) were considered treatment-related, and 1.7% (n=4) led to study discontinuation. There was 1 infusion reaction.
The overall response rate at day 28 was 65%, and the complete response rate was 14%. Responses were observed for all aGVHD grades and did not differ by baseline organ involvement.
Day 100 survival was significantly better in children who achieved a response at day 28—82%, compared to 39% for non-responders (P<0.0001).
In November 2016, Mesoblast reported success in an ongoing, phase 3 registration trial of MSC-100-IV in 60 children with steroid-refractory aGVHD.
The company said the trial was successful in a pre-specified interim futility analysis using the primary endpoint of day-28 overall response. Enrollment in this trial is expected to be complete in mid-2017. ![]()
Shedding Light on the Problem
A 49-year-old man presents to dermatology for evaluation of an itchy rash that manifested several months ago. Attempts to eradicate or ameliorate it—which have included topical and systemic steroids and oral antibiotics (minocycline)—have had no effect. A biopsy ordered by his primary care provider (PCP) showed nonspecific changes, termed “dermatitis” in the report.
The patient denies any history of atopy, such as seasonal allergies or eczema. His only medical problem is moderate hypertension, for which his PCP prescribed hydrochlorothiazide. He started taking the drug a few weeks before the rash appeared.
He claims to be in good health otherwise, with no weakness or weight loss. He has never smoked.
EXAMINATION
A bright red, blanchable, maculopapular rash is notably confined to the patient’s sun-exposed skin; it sharply spares the areas covered by clothing and the watch on his left wrist. His palms, soles, scalp, and face are also spared. No nail changes are noted.
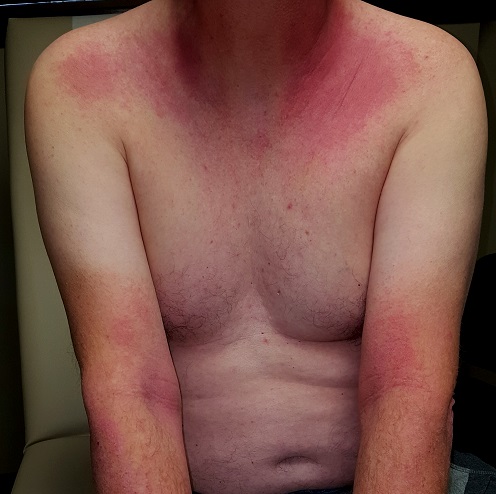
Otherwise, the patient appears well and is able to rise from a seated position without difficulty. No nodes are palpable in the head or neck, and there is no organomegaly detected on abdominal examination.
What is the diagnosis?
DISCUSSION
Photosensitivity to hydrochlorothiazide was the obvious culprit, so the patient was advised to stop using that product (after consulting his PCP). He’ll remain off the medication for at least two months, then present for follow-up.
There are some potentially troubling items in the differential, particularly dermatomyositis (DM). Patients with DM may exhibit a sunburn-like rash, but they will additionally demonstrate muscle weakness and chronic fatigue. A significant proportion of their complaints are driven by an occult carcinoma (eg, stomach, lung, colon, breast). While it’s doubtful that this patient has DM, his follow-up may include a fresh biopsy, blood work, anteroposterior and lateral chest films, and possibly a colonoscopy.
Another item in the differential is lupus. However, the original biopsy yielded no suggestive findings (eg, interface dermatitis), nor did the patient have any complaints referable to the disease.
This case nicely demonstrates the concept that it is equally important to note which areas are affected by and spared by a skin condition. With that in mind, we can at least establish that sunlight is a major factor in the genesis of this rash. Unfortunately, that still leaves room for conjecture as to the diagnosis.
TAKE-HOME LEARNING POINTS
- Rashes confined to sun-exposed skin can be a symptom of systemic disease, such as lupus or dermatomyositis.
- Various drugs—including hydrochlorothiazide, NSAIDs, sulfas, and certain tetracyclines—can also cause photosensitivity reactions.
- Hydrochlorothiazide is one of the more common drugs to cause such a rash, which may take weeks to clear after cessation of use.
- If terminating hydrochlorothiazide doesn’t help, skin biopsy and labs (especially creatine kinase and immunoglobulins) are the next step in determining the problem.
A 49-year-old man presents to dermatology for evaluation of an itchy rash that manifested several months ago. Attempts to eradicate or ameliorate it—which have included topical and systemic steroids and oral antibiotics (minocycline)—have had no effect. A biopsy ordered by his primary care provider (PCP) showed nonspecific changes, termed “dermatitis” in the report.
The patient denies any history of atopy, such as seasonal allergies or eczema. His only medical problem is moderate hypertension, for which his PCP prescribed hydrochlorothiazide. He started taking the drug a few weeks before the rash appeared.
He claims to be in good health otherwise, with no weakness or weight loss. He has never smoked.
EXAMINATION
A bright red, blanchable, maculopapular rash is notably confined to the patient’s sun-exposed skin; it sharply spares the areas covered by clothing and the watch on his left wrist. His palms, soles, scalp, and face are also spared. No nail changes are noted.
Otherwise, the patient appears well and is able to rise from a seated position without difficulty. No nodes are palpable in the head or neck, and there is no organomegaly detected on abdominal examination.
What is the diagnosis?
DISCUSSION
Photosensitivity to hydrochlorothiazide was the obvious culprit, so the patient was advised to stop using that product (after consulting his PCP). He’ll remain off the medication for at least two months, then present for follow-up.
There are some potentially troubling items in the differential, particularly dermatomyositis (DM). Patients with DM may exhibit a sunburn-like rash, but they will additionally demonstrate muscle weakness and chronic fatigue. A significant proportion of their complaints are driven by an occult carcinoma (eg, stomach, lung, colon, breast). While it’s doubtful that this patient has DM, his follow-up may include a fresh biopsy, blood work, anteroposterior and lateral chest films, and possibly a colonoscopy.
Another item in the differential is lupus. However, the original biopsy yielded no suggestive findings (eg, interface dermatitis), nor did the patient have any complaints referable to the disease.
This case nicely demonstrates the concept that it is equally important to note which areas are affected by and spared by a skin condition. With that in mind, we can at least establish that sunlight is a major factor in the genesis of this rash. Unfortunately, that still leaves room for conjecture as to the diagnosis.
TAKE-HOME LEARNING POINTS
- Rashes confined to sun-exposed skin can be a symptom of systemic disease, such as lupus or dermatomyositis.
- Various drugs—including hydrochlorothiazide, NSAIDs, sulfas, and certain tetracyclines—can also cause photosensitivity reactions.
- Hydrochlorothiazide is one of the more common drugs to cause such a rash, which may take weeks to clear after cessation of use.
- If terminating hydrochlorothiazide doesn’t help, skin biopsy and labs (especially creatine kinase and immunoglobulins) are the next step in determining the problem.

Rash around belly button
The family physician (FP) recognized that the patient’s new belly ring was the cause of this case of contact dermatitis. The FP suspected that the belly ring contained nickel—a common culprit in cases of allergic contact dermatitis (ACD).
ACD is a delayed-type hypersensitivity reaction that occurs when skin proteins form an antigen complex in reaction to a foreign substance. Upon reexposure of the epidermis to the antigen, the sensitized T cells initiate an inflammatory cascade, leading to the skin changes seen in ACD.
The FP told the patient that patch testing could be used to confirm her allergy, but it required wearing patches on her back for 3 days and involved 3 office visits to complete the testing. He also asked her if she wanted to have her jewelry tested for nickel content.
The patient removed the belly button jewelry and the FP used a nickel testing kit, which showed the jewelry was, in fact, positive for nickel. The patient asked if she could still wear the jewelry if she got medication to treat the allergy, but the FP explained that it was unlikely that the rash would go away completely with a topical cream if the jewelry remained in place. The FP prescribed 0.1% triamcinolone cream to be applied twice daily to the area. He also suggested that she look for a jewelry replacement that was nickel-free.
At a one-month follow-up visit, the patient acknowledged that the FP had been right: While she was able to wear the jewelry for another 2 weeks with decreased erythema and pruritus while using the triamcinolone cream, the rash never went away. The patient switched to a nickel-free belly button ring and her rash cleared completely.
Photos and text for Photo Rounds Friday courtesy of Richard P. Usatine, MD. This case was adapted from: Usatine R. Contact dermatitis. In: Usatine R, Smith M, Mayeaux EJ, et al, eds. Color Atlas of Family Medicine. 2nd ed. New York, NY: McGraw-Hill; 2013:591-596.
To learn more about the Color Atlas of Family Medicine, see: www.amazon.com/Color-Family-Medicine-Richard-Usatine/dp/0071769641/
You can now get the second edition of the Color Atlas of Family Medicine as an app by clicking on this link: usatinemedia.com