User login
Woman dies after robotic hysterectomy: $5M verdict
Woman dies after robotic hysterectomy: $5M verdict
When a 36-year-old woman underwent robotic hysterectomy, the gynecologist inserted a plastic trocar and sleeve through the patient's umbilicus to access the abdominal cavity at 7:30 am.
The certified registered nurse anesthetist (CRNA) noted a significant abnormality in the patient's vital signs at 8:07 am and administered medication and fluids to treat a suspected blood loss. When the patient's heart rate became extremely elevated at 8:25 am, the CRNA administered another drug, which failed to bring the patient's heart rate down. At 8:37 am, the monitoring machine could not record the patient's blood pressure. The CRNA informed the surgeon of the patient's condition. The supervising anesthesiologist was called; he arrived at 8:45 am and determined that the patient was bleeding internally. He asked the surgeon if he could visualize any bleeding; the surgeon could not.
The patient's condition continued to deteriorate. At 9:05 am, her blood pressure was still undetectable on the monitor. A Code Blue was called at 9:30 am. Exploratory surgery and blood transfusions begun at 9:43 am were not able to counteract the patient's massive blood loss. After cardiac arrest, she was pronounced dead at 11:18 am.
ESTATE'S CLAIM:
The surgeon was negligent in lacerating the left common iliac artery when inserting the trocar, and in not detecting the injury intraoperatively.
The anesthesia staff was negligent. The CRNA did not inform the surgeon until the situation was dire. A simple procedure could have been performed at any time to check the patient's hematocrit and hemoglobin levels, but that was not done until 9:30 am. If the severity of the patient's condition had been determined earlier, blood transfusions and further treatment could have saved her life.
DEFENDANTS' DEFENSE:
There was no negligence on the part of the surgeon or anesthesia team. The standard of care was met. Arterial laceration is a known risk of the surgery.
VERDICT:
A $5,008,922 Illinois verdict was returned against all defendants except the CRNA.
A woman with MS becomes incontinent after surgery
A 43-year-old woman with multiple sclerosis (MS) underwent a hysterectomy performed by a gynecologic surgeon. During surgery, the patient's ureter was injured, requiring additional surgery. The patient is now permanently incontinent.
PATIENT'S CLAIM:
During surgery, the surgeon constricted the ureter with stitches. A second surgery was needed to remove the stitches and reimplant the ureter. The second surgery left her permanently incontinent. Although incontinence is a known complication of the second surgery, the second surgery would not have been necessary if the surgeon had not injured the ureter during the first surgery. Incontinence was not a result of her MS as she was not incontinent before the second surgery.
DEFENDANTS' DEFENSE:
There was no deviation from the standard of care. There was no stitching around the ureter. The ureter was damaged by kinking, which was addressed during the second surgery. Incontinence was a result of her MS.
VERDICT:
A $700,000 South Carolina verdict was returned.
Bowel injury during robotic procedure: $6.25M settlement
A woman in her late 60s reported minor urinary incontinence to her gynecologist. She underwent robot-assisted laparoscopic hysterectomy with a sling procedure for pelvic prolapse. During the sling procedure, the transverse colon was injured. The patient developed sepsis, requiring multiple attempts at surgical repair, including colostomy. The patient requires a permanent colostomy. She has a malabsorption disorder and needs frequent intravenous treatment for dehydration.
PATIENT'S CLAIM:
The surgeon failed to properly control the robotic device, causing injury to the patient's bowel. The surgeon deviated from the standard of care by failing to convert from the robot-assisted laparoscopic procedure to an open procedure when complications arose. The injury was not properly treated before the surgeon closed the initial surgery, causing the patient to develop sepsis.
PHYSICIAN'S DEFENSE:
The surgeon claimed that the injuries and resulting sepsis were the fault of other physicians and hospital staff. The case settled during trial.
VERDICT:
A $6.25 million New Jersey settlement was reached.
Hydrothermal ablation led to genital burns
A woman SAW AN OBGYN on October 2 to report menorrhagia. She had been treated for uterine fibroids with a Mirena intrauterine device and hydrothermal ablation. Another physician had suggested hysterectomy, which she declined.
When the ObGyn found that the patient had an enlarged uterus, he ordered ultrasonography and an endometrial biopsy. On follow-up, the ObGyn provided options of robotic hysterectomy or operative hysteroscopy with hydrothermal ablation. The patient chose hysteroscopy and the procedure was scheduled for December 28.
During surgery, an improper seal to the cervix around the hydrothermal ablation sheath was detected before heating the fluid. A tenaculum and 2 sponges were placed on the cervix to help form a seal and the fluid was heated for 4 minutes. The procedure was aborted when fluid was seen to be leaking again. Instruments were removed after a cooling period. The patient was discharged from the surgery center the same day with a prescription for oral hydrocodone bitartrate and acetaminophen for pain.
On January 4, the patient reported severe vulvar pain. The ObGyn found thermal burns on both labia with possible cellulitis. He prescribed silver sulfadiazine cream twice daily, levofloxacin 500 mg for 7 days, and warm-water soaks. When the patient called to report continued pain on January 7, the hydrocodone and acetaminophen prescription was renewed. On January 8, the ObGyn found continued evidence of labia and introitus burns with no signs of infection. The patient was told to continue taking the oral pain medication and to apply topical lidocaine gel and silver sulfadiazine cream.
Examinations on January 11, 17, 24, and 31 showed continued evidence of active healing. When new evidence of vulvar ulceration with inflammation and infection appeared, supportive care and antibiotics were given. On February 7, granulation tissue had developed at the introitus with continued healing.
On March 27, she saw a gynecologist for dyspareunia. The skin was healed but a tender band of scar tissue was noted at the burn site. She was referred for physical therapy and given estradiol vaginal cream.
On December 11, the patient reported dyspareunia and depression to the gynecologist, who prescribed medication for depression and referred her to counseling.
PATIENT'S CLAIM:
The ObGyn was negligent in failing to maintain a proper seal around the hydrothermal ablation shield. The patient sustained second-degree burns to her genital area from the hot saline solution that leaked from the uterus. The injury caused lasting dyspareunia and depression.
PHYSICIAN'S DEFENSE:
There was no negligence. Once the ObGyn realized that the seal was incomplete, the procedure was stopped and the fluid cooled before being released. Burns were treated within the standard of care.
VERDICT:
A Texas defense verdict was returned based on a no- evidence partial summary judgment: neither the patient nor the expert witness supplied evidence to support the claims of gross negligence or exemplary damages against the ObGyn.
These cases were selected by the editors of OBG Management from Medical Malpractice Verdicts, Settlements & Experts, with permission of the editor, Lewis Laska (www.verdictslaska.com). The information available to the editors about the cases presented here is sometimes incomplete. Moreover, the cases may or may not have merit. Nevertheless, these cases represent the types of clinical situations that typically result in litigation and are meant to illustrate nationwide variation in jury verdicts and awards.
Share your thoughts! Send your Letter to the Editor to [email protected]. Please include your name and the city and state in which you practice.
VIDEO: Large distal nongranular colorectal polyps were most likely to contain occult invasive cancers
Large sessile or flat colorectal polyps or laterally spreading lesions were most likely to contain covert malignancies when their location was rectosigmoid, their Paris classification was 0-Is or 0-IIa+Is, and they were nongranular, according to the results of a multicenter prospective cohort study of 2,106 consecutive patients reported in the September issue of Gastroenterology (doi: 10.1053/j.gastro.2017.05.047).
“Distal nongranular lesions have a high risk of occult SMIC [submucosal invasive cancer], whereas proximal, granular 0-IIa lesions, after a careful assessment for features associated with SMIC, have a very low risk,” wrote Nicholas G. Burgess, MD, of Westmead Hospital, Sydney, with his associates. “These findings can be used to inform decisions [about] which patients should undergo endoscopic submucosal dissection, endoscopic mucosal resection, or surgery.”
Source: American Gastroenterological Association
Many studies of colonic lesions have examined predictors of SMIC. Nonetheless, clinicians need more information on factors that improve clinical decision making, especially as colonic endoscopic submucosal dissection becomes more accessible, the researchers said. Large colonic lesions can contain submucosal invasive SMICs that are not visible on endoscopy, and characterizing predictors of this occurrence could help patients and clinicians decide between endoscopic submucosal dissection and endoscopic mucosal resection. To do so, the researchers analyzed histologic specimens from 2,277 colonic lesions above 20 mm (average size, 37 mm) that lacked overt endoscopic high-risk features. The study ran from 2008 through 2016, study participants averaged 68 years of age, and 53% were male. A total of 171 lesions (8%) had evidence of SMIC on pathologic review, and 138 lesions had covert SMIC. Predictors of overt and occult SMIC included Kudo pit pattern V, a depressed component (0-IIc), rectosigmoid location, 0-Is or 0-IIa+Is Paris classification, nongranular surface morphology, and larger size. After excluding lesions with obvious SMIC features – including serrated lesions and those with depressed components (Kudo pit pattern of V and Paris 0-IIc) – the strongest predictors of occult SMIC included Paris classification, surface morphology, size, and location.
“Proximal 0-IIa G or 0-Is granular lesions had the lowest risk of SMIC (0.7% and 2.3%), whereas distal 0-Is nongranular lesions had the highest risk (21.4%),” the investigators added. Lesion location, size, and combined Paris classification and surface topography showed the best fit in a multivariable model. Notably, rectosigmoid lesions had nearly twice the odds of containing covert SMIC, compared with proximal lesions (odds ratio, 1.9; 95% confidence interval, 1.2-3.0; P = .01). Other significant predictors of covert SMIC in the multivariable model included combined Paris classification, surface morphology (OR, 4.0; 95% CI, 1.2-12.7; P = .02), and increasing size (OR, 1.2 per 10-mm increase; 95% CI, 1.04-1.3; P = .01). Increased size showed an even greater effect in lesions exceeding 50 mm.
Clinicians can use these factors to help evaluate risk of invasive cancer in lesions without overt SMIC, the researchers said. “One lesion type that differs from the pattern is 0-IIa nongranular lesions,” they noted. “Once lesions with overt evidence of SMIC are excluded, these lesions have a low risk (4.2%) of harboring underlying cancer.” Although 42% of lesions with covert SMIC were SM1 (potentially curable by endoscopic resection), no predictor of covert SMIC also predicted SMI status.
Funders included Cancer Institute of New South Wales and Gallipoli Medical Research Foundation. The investigators had no conflicts of interest.
In recent years, substantial efforts have been made to improve both colonoscopy preparation and endoscopic image quality to achieve improved polyp detection. In addition, while large, complex colon polyps (typically greater than 20 mm in size) previously were often referred for surgical resection, improved polyp resection techniques and equipment have led to the ability to remove many such lesions in a piecemeal fashion or en bloc via endoscopic mucosal resection (EMR) and endoscopic submucosal dissection (ESD).

The authors are to be congratulated for their meticulous and sustained efforts in acquiring and analyzing this data. These results provide endoscopists with some important, practical, and entirely visual criteria to assess upon identification of large colon polyps that can aid in determining which type of endoscopy therapy, if any, to embark upon. Avoiding EMR when there is a reasonably high probability of invasive disease will allow for choosing a more appropriate technique such as ESD (which is becoming increasingly available in the West) or surgery. In addition, patients can avoid the unnecessary EMR-related risks of bleeding and perforation when this technique is likely to result in an inadequate resection. Future work should assess whether this information can be widely adopted and utilized to achieve similar predictive accuracy in nonexpert settings.
V. Raman Muthusamy, MD, is director, interventional and general endoscopy, clinical professor of medicine, digestive diseases/gastroenterology, University of California, Los Angeles School of Medicine. He is a consultant for Medtronic and Boston Scientific.
In recent years, substantial efforts have been made to improve both colonoscopy preparation and endoscopic image quality to achieve improved polyp detection. In addition, while large, complex colon polyps (typically greater than 20 mm in size) previously were often referred for surgical resection, improved polyp resection techniques and equipment have led to the ability to remove many such lesions in a piecemeal fashion or en bloc via endoscopic mucosal resection (EMR) and endoscopic submucosal dissection (ESD).
The authors are to be congratulated for their meticulous and sustained efforts in acquiring and analyzing this data. These results provide endoscopists with some important, practical, and entirely visual criteria to assess upon identification of large colon polyps that can aid in determining which type of endoscopy therapy, if any, to embark upon. Avoiding EMR when there is a reasonably high probability of invasive disease will allow for choosing a more appropriate technique such as ESD (which is becoming increasingly available in the West) or surgery. In addition, patients can avoid the unnecessary EMR-related risks of bleeding and perforation when this technique is likely to result in an inadequate resection. Future work should assess whether this information can be widely adopted and utilized to achieve similar predictive accuracy in nonexpert settings.
V. Raman Muthusamy, MD, is director, interventional and general endoscopy, clinical professor of medicine, digestive diseases/gastroenterology, University of California, Los Angeles School of Medicine. He is a consultant for Medtronic and Boston Scientific.
Large sessile or flat colorectal polyps or laterally spreading lesions were most likely to contain covert malignancies when their location was rectosigmoid, their Paris classification was 0-Is or 0-IIa+Is, and they were nongranular, according to the results of a multicenter prospective cohort study of 2,106 consecutive patients reported in the September issue of Gastroenterology (doi: 10.1053/j.gastro.2017.05.047).
“Distal nongranular lesions have a high risk of occult SMIC [submucosal invasive cancer], whereas proximal, granular 0-IIa lesions, after a careful assessment for features associated with SMIC, have a very low risk,” wrote Nicholas G. Burgess, MD, of Westmead Hospital, Sydney, with his associates. “These findings can be used to inform decisions [about] which patients should undergo endoscopic submucosal dissection, endoscopic mucosal resection, or surgery.”
Source: American Gastroenterological Association
Many studies of colonic lesions have examined predictors of SMIC. Nonetheless, clinicians need more information on factors that improve clinical decision making, especially as colonic endoscopic submucosal dissection becomes more accessible, the researchers said. Large colonic lesions can contain submucosal invasive SMICs that are not visible on endoscopy, and characterizing predictors of this occurrence could help patients and clinicians decide between endoscopic submucosal dissection and endoscopic mucosal resection. To do so, the researchers analyzed histologic specimens from 2,277 colonic lesions above 20 mm (average size, 37 mm) that lacked overt endoscopic high-risk features. The study ran from 2008 through 2016, study participants averaged 68 years of age, and 53% were male. A total of 171 lesions (8%) had evidence of SMIC on pathologic review, and 138 lesions had covert SMIC. Predictors of overt and occult SMIC included Kudo pit pattern V, a depressed component (0-IIc), rectosigmoid location, 0-Is or 0-IIa+Is Paris classification, nongranular surface morphology, and larger size. After excluding lesions with obvious SMIC features – including serrated lesions and those with depressed components (Kudo pit pattern of V and Paris 0-IIc) – the strongest predictors of occult SMIC included Paris classification, surface morphology, size, and location.
“Proximal 0-IIa G or 0-Is granular lesions had the lowest risk of SMIC (0.7% and 2.3%), whereas distal 0-Is nongranular lesions had the highest risk (21.4%),” the investigators added. Lesion location, size, and combined Paris classification and surface topography showed the best fit in a multivariable model. Notably, rectosigmoid lesions had nearly twice the odds of containing covert SMIC, compared with proximal lesions (odds ratio, 1.9; 95% confidence interval, 1.2-3.0; P = .01). Other significant predictors of covert SMIC in the multivariable model included combined Paris classification, surface morphology (OR, 4.0; 95% CI, 1.2-12.7; P = .02), and increasing size (OR, 1.2 per 10-mm increase; 95% CI, 1.04-1.3; P = .01). Increased size showed an even greater effect in lesions exceeding 50 mm.
Clinicians can use these factors to help evaluate risk of invasive cancer in lesions without overt SMIC, the researchers said. “One lesion type that differs from the pattern is 0-IIa nongranular lesions,” they noted. “Once lesions with overt evidence of SMIC are excluded, these lesions have a low risk (4.2%) of harboring underlying cancer.” Although 42% of lesions with covert SMIC were SM1 (potentially curable by endoscopic resection), no predictor of covert SMIC also predicted SMI status.
Funders included Cancer Institute of New South Wales and Gallipoli Medical Research Foundation. The investigators had no conflicts of interest.
FROM GASTROENTEROLOGY
Key clinical point: Large sessile or flat colorectal polyps or laterally spreading lesions had the highest risk of occult malignancy when they were distal 0-Is or 0–IIa+Is nongranular lesions. Proximally located 0-Is or 0-IIa granular lesions had the lowest risk.
Major finding: Only 0.7% of proximal 0-IIa granular lesions and 2.3% of 0-Is granular lesions contained occult submucosal invasive malignancies, compared with 21% of distal 0-Is nongranular lesions.
Data source: A multicenter prospective cohort study of 2,277 large colonic lesions from 2,106 consecutive patients.
Disclosures: Funders included Cancer Institute of New South Wales and Gallipoli Medical Research Foundation. The investigators had no conflicts of interest.
Enasidenib gets FDA approval for AML with IDH2 mutations
Enasidenib has been approved for the treatment of adult patients with relapsed or refractory acute myeloid leukemia (AML) and specific mutations in the IDH2 gene, the U.S. Food and Drug Administration announced on Aug. 1.
The drug is approved for use with a companion diagnostic, the RealTime IDH2 Assay, which is used to detect IDH2 gene mutations. The FDA granted the approval of enasidenib (Idhifa) to the Celgene Corp. and the approval of the companion RealTime IDH2 Assay to Abbott Laboratories. Idhifa had Priority Review and Orphan Drug designations.
In data reported at the annual congress of the European Hematology Association, the overall response rate to enasidenib among 214 patients with IDH2 gene mutations treated at the 100-mg/day dose was 37%. This included 20.1% with a complete remission, 7.9% with complete remission with incomplete recovery of platelets or incomplete hematologic recovery, 3.7% with partial responses, and 5.1% with a morphologic leukemia-free state, according to Eytan M. Stein, MD, an internist and hematologic oncologist at the Memorial Sloan Kettering Cancer Center in New York.
According to an FDA press release, 34% of 157 patients who required transfusions of blood or platelets at the start of the study no longer required transfusions after treatment.
For 8%-19% of AML patients, the mutated IDH2 enzyme blocks normal blood cell development and results in an overabundance of immature blood cells, Celgene said in an announcement.
Common side effects of enasidenib, an isocitrate dehydrogenase-2 inhibitor, include nausea, vomiting, diarrhea, hyperbilirubinemia, and decreased appetite.
Fatal differentiation syndrome can occur and is treated with corticosteroids. The prescribing information for Idhifa includes a boxed warning regarding that risk. Symptoms of differentiation syndrome may include fever, dyspnea, acute respiratory distress, radiographic pulmonary infiltrates, pleural or pericardial effusions, rapid weight gain, peripheral edema, or hepatic, renal or multi-organ dysfunction, according to a press release issued by the FDA.
[email protected]
On Twitter @maryjodales
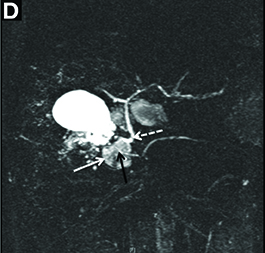
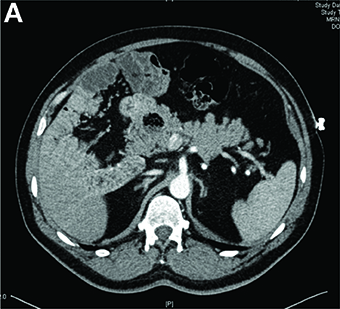
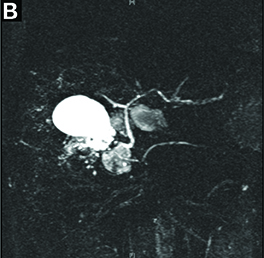
Clinical Challenges - August 2017 What is the likely diagnosis and pathogenetic mechanisms?
The diagnosis
Answer to “What’s your diagnosis?” on page 2: Lemmel’s syndrome

References
1. Egawa, N., Anjiki, H., Takuma, K., et al. Juxtapapillary duodenal diverticula and pancreatobiliary disease. Dig Surg. 2010;27:105-9.
2. Lobo, D.N., Balfour, T.W., Iftikhar, S.Y. Periampullary diverticula: consequences of failed ERCP. Ann Royal Coll Surg. 1998;80:326-31.
3. Lemmel, G. Die klinische Bedeutung der Duodenaldivertikel. Archiv fur Verdauungskrankheiten. 1934;56:59-70.
The diagnosis
Answer to “What’s your diagnosis?” on page 2: Lemmel’s syndrome
References
1. Egawa, N., Anjiki, H., Takuma, K., et al. Juxtapapillary duodenal diverticula and pancreatobiliary disease. Dig Surg. 2010;27:105-9.
2. Lobo, D.N., Balfour, T.W., Iftikhar, S.Y. Periampullary diverticula: consequences of failed ERCP. Ann Royal Coll Surg. 1998;80:326-31.
3. Lemmel, G. Die klinische Bedeutung der Duodenaldivertikel. Archiv fur Verdauungskrankheiten. 1934;56:59-70.
By Crispin Musumba, MBChB, PhD, Edward Britton, MBBS, MRCP, and Howard Smart, MBBS, DM. Published previously in Gastroenterology (2013;144:274, 468-469).
Effect of frailty on HF readmissions
Title: Frailty is an independent risk factor for short-term mortality in older patients hospitalized with acute decompensated heart failure
Clinical Question: What is the effect of frailty on 30-day mortality in non–severely disabled older patients with acute decompensated heart failure?
Study Design: Retrospective secondary analysis of a prospective observational multicenter cohort study.
Setting: Three Spanish EDs.
Synopsis: In 465 patients age 65 and older with acute decompensated heart failure who did not have an ST-segment elevation myocardial infarction, severe functional dependence, or dementia, 36.3% were categorized as frail on a validated performance status scoring system. Frail patients had a higher 30-day mortality rate than did non-frail patients (13.0% versus 4.1% in non-frail patients). Frailty was independently associated with a 30-day mortality (hazard ratio = 2.5, P = .047).
The major limitations of this study are that the researchers did not report how many patients were discharged versus admitted from the ED and they did not stratify short-term mortality attributable to frailty by degree of medical comorbidity.
Bottom Line: Frailty is common in older patients with acute decompensated heart failure and is also an independent risk factor for short-term mortality.
Citation: Martin-Sanchez FJ, Rodriguez-Adrada E, Mueller C, et al. The effect of frailty on 30-day mortality risk in older patients with acute heart failure attended in the emergency department. Acad Em Med. 2017;24(3):298-307.
Dr. Barrett is assistant professor in the division of hospital medicine at the University of New Mexico.
HM17 session summary: Updates in Antibiotics – Determining duration and when to switch to PO
Presenters
Samir Shah, MD, MSCE
Session summary
Antibiotic stewardship is more than narrowing coverage once susceptibilities are available. It also means conversion of antibiotics to oral therapy when clinically appropriate.
Previously, many childhood infections were treated with IV therapy due to severity or concern that oral absorption delayed or limited response. Multiple studies have shown that early conversion is not only safe, but safer than prolonging IV therapy. At HM 17, we had the opportunity to hear from Samir Shah, MD, about the current literature that supports safe transitions to oral therapy, including the “when” and the “how.”
Terminology for conversion to oral therapy should not state that it is “step-down” therapy, but rather switch therapy or sequential therapy. This conversion reduces likelihood of treatment complications, reduces length of hospital stay, reduces nursing and pharmacy time, decreases discomfort for the patient, and reduces cost.
Antibiotics such as levofloxacin, clindamycin, ciprofloxacin, and metronidazole have excellent bioavailability when taken orally. Other commonly used IV medications such as ampicillin, ampicillin-sulbactam, and cefazolin can be substituted with amoxicillin, amoxicillin-clavulanate, and cephalexin, which have similar penetration characteristics.
In general, unless there are serious complications, such as endocarditis and meningitis, most patients should be switched to oral therapy as soon as clinically warranted to complete therapy. For example, the incidence of meningitis in patients less than 1 month of age with UTI is 1%-2% and the incidence of meningitis in those 1-2 months of age is 0.3%-0.5%. Therefore, these patients can be treated with oral therapy earlier in their course when meningitis is not suspected. The likelihood of endocarditis in a pediatric patient without a known heart lesion is very low, even in patients with repeat positive blood cultures, unlike our adult colleagues who have much higher incidence of endocarditis in bacteremic patients.
Further studies are emerging to help reduce total length of therapy for many bacterial infections. For example, good evidence now exists that skin and soft tissue infections can now be treated safely with 5-day courses.

Key takeaways for HM
• Transition to oral therapy earlier in the hospital course is justified and much safer than IV therapy.
• Conversion to oral antibiotic therapy reduces the likelihood of treatment complications, length of hospital stay, nursing time, pharmacy time, discomfort to the patient, and costs.
• Do not use the term “step-down” when referencing a transition to oral therapy.
• Oral therapy is effective in most bacterial infections in children except for meningitis and endocarditis.
• Levofloxacin, clindamycin, ciprofloxacin, and metronidazole have excellent bioavailability when taken orally and can be easily swapped for IV therapy.
Dr. Schwenk is a pediatric hospitalist at Norton Children’s Hospital and associate professor of pediatrics at the University of Louisville (Ky.), and a member of the Pediatrics Committee for SHM.
Presenters
Samir Shah, MD, MSCE
Session summary
Antibiotic stewardship is more than narrowing coverage once susceptibilities are available. It also means conversion of antibiotics to oral therapy when clinically appropriate.
Previously, many childhood infections were treated with IV therapy due to severity or concern that oral absorption delayed or limited response. Multiple studies have shown that early conversion is not only safe, but safer than prolonging IV therapy. At HM 17, we had the opportunity to hear from Samir Shah, MD, about the current literature that supports safe transitions to oral therapy, including the “when” and the “how.”
Terminology for conversion to oral therapy should not state that it is “step-down” therapy, but rather switch therapy or sequential therapy. This conversion reduces likelihood of treatment complications, reduces length of hospital stay, reduces nursing and pharmacy time, decreases discomfort for the patient, and reduces cost.
Antibiotics such as levofloxacin, clindamycin, ciprofloxacin, and metronidazole have excellent bioavailability when taken orally. Other commonly used IV medications such as ampicillin, ampicillin-sulbactam, and cefazolin can be substituted with amoxicillin, amoxicillin-clavulanate, and cephalexin, which have similar penetration characteristics.
In general, unless there are serious complications, such as endocarditis and meningitis, most patients should be switched to oral therapy as soon as clinically warranted to complete therapy. For example, the incidence of meningitis in patients less than 1 month of age with UTI is 1%-2% and the incidence of meningitis in those 1-2 months of age is 0.3%-0.5%. Therefore, these patients can be treated with oral therapy earlier in their course when meningitis is not suspected. The likelihood of endocarditis in a pediatric patient without a known heart lesion is very low, even in patients with repeat positive blood cultures, unlike our adult colleagues who have much higher incidence of endocarditis in bacteremic patients.
Further studies are emerging to help reduce total length of therapy for many bacterial infections. For example, good evidence now exists that skin and soft tissue infections can now be treated safely with 5-day courses.
Key takeaways for HM
• Transition to oral therapy earlier in the hospital course is justified and much safer than IV therapy.
• Conversion to oral antibiotic therapy reduces the likelihood of treatment complications, length of hospital stay, nursing time, pharmacy time, discomfort to the patient, and costs.
• Do not use the term “step-down” when referencing a transition to oral therapy.
• Oral therapy is effective in most bacterial infections in children except for meningitis and endocarditis.
• Levofloxacin, clindamycin, ciprofloxacin, and metronidazole have excellent bioavailability when taken orally and can be easily swapped for IV therapy.
Dr. Schwenk is a pediatric hospitalist at Norton Children’s Hospital and associate professor of pediatrics at the University of Louisville (Ky.), and a member of the Pediatrics Committee for SHM.
VIDEO: High myristic acid intake linked to relapse in ulcerative colitis
High intake of myristic acid approximately tripled the odds of relapse in patients with ulcerative colitis (UC), compared with low intake, according to the results of a 12-month multicenter, prospective, observational study reported in the September 2017 issue of Clinical Gastroenterology and Hepatology (doi: 10.1016/j.cgh.2016.12.036).
Relapsers consumed an average of 2.2 g of this saturated fatty acid daily from sources such as palm and coconut oils, as well as dairy fats, reported Edward L. Barnes, MD, MPH, and his associates at Brigham and Women’s Hospital, Boston, on behalf of the DREAM (Diet’s Role in Exacerbations of Mesalamine Maintenance) investigators. Nonrelapsers averaged 1.4 g/day. “Our broader goal is to determine how alterations in diet can improve the care of people with IBD [inflammatory bowel disease],” the researchers wrote. “These findings can help design interventional dietary studies to determine if supplementation or avoidance of certain compounds might reduce the risk of a flare for patients with ulcerative colitis in remission.”
Dietary factors are thought to underlie relapse in ulcerative colitis, but specific culprits are poorly defined, the investigators said. Therefore, the DREAM study prospectively tracked dietary intake and flares among a homogeneous group of 412 patients with UC from 25 academic and community gastroenterology practices in the United States. Between 2007 and 2014, patients were interviewed by telephone every 3 months for 1 year or until they reported a flare, defined as a Simple Clinical Colitis Activity Index score of at least 5 or a change in disease activity that entailed a change in medication.
Source: American Gastroenterological Association
A total of 34 patients were lost to follow-up, and 45 (11% of those remaining) flared within a year of study enrollment. “When analyzed in tertiles, increasing intake of multiple fatty acids was associated with increasing odds of relapse,” the researchers wrote. Predictors of flare in the univariate analysis included high intake of myristic acid, oleic acid, eicosenoic acid, palmitelaidic acid, total translinoleic acid, saturated fat, monounsaturated fat, and omega-3 fatty acids. These predictors also included moderate or high intake of alpha-linolenic acid. Only high intake of myristic acid maintained a significant dose-response relationship in the multivariable analysis (odds ratio, 3.0; 95% confidence interval, 1.2-7.7; P = .02 for high vs. low intake). Moderate intake of alpha-linolenic acid predicted flare (OR, 5.5; CI, 95%, 1.6-19.3; P = .001) in the multivariable analysis, but high intake did not (OR, 1.3; CI, 95%, 0.3-7.0; P = .4). “Other foods previously implicated in flares of UC, such as processed meat, alcohol, and foods high in sulfur, were not associated with an increased risk of flare,” the researchers wrote.
Study participants were generally in their mid- to late 40s, white, and not current smokers. More than half were male. Most had proctitis or left-sided colitis, not pancolitis. Relapsers averaged 2.4 flares in the 18 months before enrollment (standard deviation, 1.9), compared with 1.8 flares for nonrelapsers (SD, 2.4; P = .003).
This observational study not only was subject to unmeasured confounding, but also excluded many types of patients. Among those excluded were anyone with a history of allergy to salicylates, aminosalicylates, or mesalamine tablets. Also excluded were those who had recent exposure to NSAIDs, oral or parenteral antibiotics, antidiarrheals, antispasmodics, immunosuppressives, biologics, or corticosteroids (except budesonide). Requiring monotherapy with an aminosalicylate might limit the generalizability of the findings, the investigators noted. Patients also were on variable doses of aminosalicylates, and higher doses might have helped inhibit flares.
Actavis and the National Institutes of Health provided funding. The investigators reported having no relevant financial conflicts.
Patients with inflammatory bowel disease commonly ask their physicians if dietary modifications can be made to control their disease. Despite the interest from patients, we have limited data to provide informed recommendations.

These results provide additional information to better guide our discussions with patients regarding diet and disease activity. However, the overall body of information remains sparse, and we should reinforce that dietary manipulation is an adjunct measure, at best, to our current medical therapies.
Rajesh Rasik Shah, MD, is an assistant professor of internal medicine and gastroenterology at Baylor College of Medicine, Houston. He has no conflicts of interest.
Patients with inflammatory bowel disease commonly ask their physicians if dietary modifications can be made to control their disease. Despite the interest from patients, we have limited data to provide informed recommendations.
These results provide additional information to better guide our discussions with patients regarding diet and disease activity. However, the overall body of information remains sparse, and we should reinforce that dietary manipulation is an adjunct measure, at best, to our current medical therapies.
Rajesh Rasik Shah, MD, is an assistant professor of internal medicine and gastroenterology at Baylor College of Medicine, Houston. He has no conflicts of interest.
High intake of myristic acid approximately tripled the odds of relapse in patients with ulcerative colitis (UC), compared with low intake, according to the results of a 12-month multicenter, prospective, observational study reported in the September 2017 issue of Clinical Gastroenterology and Hepatology (doi: 10.1016/j.cgh.2016.12.036).
Relapsers consumed an average of 2.2 g of this saturated fatty acid daily from sources such as palm and coconut oils, as well as dairy fats, reported Edward L. Barnes, MD, MPH, and his associates at Brigham and Women’s Hospital, Boston, on behalf of the DREAM (Diet’s Role in Exacerbations of Mesalamine Maintenance) investigators. Nonrelapsers averaged 1.4 g/day. “Our broader goal is to determine how alterations in diet can improve the care of people with IBD [inflammatory bowel disease],” the researchers wrote. “These findings can help design interventional dietary studies to determine if supplementation or avoidance of certain compounds might reduce the risk of a flare for patients with ulcerative colitis in remission.”
Dietary factors are thought to underlie relapse in ulcerative colitis, but specific culprits are poorly defined, the investigators said. Therefore, the DREAM study prospectively tracked dietary intake and flares among a homogeneous group of 412 patients with UC from 25 academic and community gastroenterology practices in the United States. Between 2007 and 2014, patients were interviewed by telephone every 3 months for 1 year or until they reported a flare, defined as a Simple Clinical Colitis Activity Index score of at least 5 or a change in disease activity that entailed a change in medication.
Source: American Gastroenterological Association
A total of 34 patients were lost to follow-up, and 45 (11% of those remaining) flared within a year of study enrollment. “When analyzed in tertiles, increasing intake of multiple fatty acids was associated with increasing odds of relapse,” the researchers wrote. Predictors of flare in the univariate analysis included high intake of myristic acid, oleic acid, eicosenoic acid, palmitelaidic acid, total translinoleic acid, saturated fat, monounsaturated fat, and omega-3 fatty acids. These predictors also included moderate or high intake of alpha-linolenic acid. Only high intake of myristic acid maintained a significant dose-response relationship in the multivariable analysis (odds ratio, 3.0; 95% confidence interval, 1.2-7.7; P = .02 for high vs. low intake). Moderate intake of alpha-linolenic acid predicted flare (OR, 5.5; CI, 95%, 1.6-19.3; P = .001) in the multivariable analysis, but high intake did not (OR, 1.3; CI, 95%, 0.3-7.0; P = .4). “Other foods previously implicated in flares of UC, such as processed meat, alcohol, and foods high in sulfur, were not associated with an increased risk of flare,” the researchers wrote.
Study participants were generally in their mid- to late 40s, white, and not current smokers. More than half were male. Most had proctitis or left-sided colitis, not pancolitis. Relapsers averaged 2.4 flares in the 18 months before enrollment (standard deviation, 1.9), compared with 1.8 flares for nonrelapsers (SD, 2.4; P = .003).
This observational study not only was subject to unmeasured confounding, but also excluded many types of patients. Among those excluded were anyone with a history of allergy to salicylates, aminosalicylates, or mesalamine tablets. Also excluded were those who had recent exposure to NSAIDs, oral or parenteral antibiotics, antidiarrheals, antispasmodics, immunosuppressives, biologics, or corticosteroids (except budesonide). Requiring monotherapy with an aminosalicylate might limit the generalizability of the findings, the investigators noted. Patients also were on variable doses of aminosalicylates, and higher doses might have helped inhibit flares.
Actavis and the National Institutes of Health provided funding. The investigators reported having no relevant financial conflicts.
FROM CLINICAL GASTROENTEROLOGY AND HEPATOLOGY
Key clinical point: High intake of myristic acid tripled the odds of relapse in patients with ulcerative colitis.
Major finding: Protein, processed meat, alcohol, and sulfur intake were not linked to UC relapse.
Data source: A multicenter prospective study of 412 patients with UC.
Disclosures: Actavis and the National Institutes of Health provided funding. The investigators reported having no relevant financial conflicts.

New SU2C translational team aims to apply CAR T-cell therapy to pancreatic cancer
Stand Up To Cancer (SU2C) is supporting a new translational research team to explore how chimeric antigen receptor T-cell (CAR T-cell) therapy can be applied to pancreatic cancer.
The Stand Up To Cancer–Lustgarten Foundation CAR T Translational Research Team will be directed by three investigators at the University of Pennsylvania’s Perelman School of Medicine who have been pioneers in CAR T-cell therapy development: Carl H. June, MD, the Richard W. Vague professor in immunotherapy; Shelley L. Berger, PhD, the Daniel S. Och university professor; and E. John Wherry, PhD, Richard and Barbara Schiffrin president’s distinguished professor of microbiology, and director, Institute for Immunology, according to a press release from the American Association for Cancer Research, SU2C’s Scientific Partner.
The team, which will receive a total of $2 million in funding from both SU2C and the Lustgarten Foundation for Pancreatic Cancer Research, will focus on epigenetics; a phase 1 trial will help identify epigenetic changes that are common to patients who don’t respond to immunotherapy, compared to those who do.
The team will also explore the use of CAR T cells to target mesothelin, a protein that is overexpressed in pancreatic cancer, according to the press release.
The Food and Drug Administration’s Oncologic Drugs Advisory Committee recently gave a thumbs up to a version of CAR T-cell therapy for the treatment of advanced acute lymphoblastic leukemia.This new SU2C translational research team will meet twice a year with the three other SU2C-sponsored research teams addressing pancreatic cancer to share progress and data.
Short Sleep Duration Is Associated With Greater Brain Atrophy
BOSTON—Compared with intermediate sleep duration, shorter sleep is associated with greater brain atrophy among community-dwelling older adults, according to a study presented at the 31st Annual Meeting of the Associated Professional Sleep Societies. Sleep duration appears to have no association with hippocampal volume, however.
More than 80% of older adults have sleep complaints, and research indicating an association between disturbed sleep and poor cognitive outcomes is accumulating. Sleep could be a crucial modifiable risk factor for cognitive outcomes, but few studies have examined the association between nonrespiratory sleep measures and brain volume, said Adam Spira, PhD, Associate Professor of Mental Health at Johns Hopkins Bloomberg School of Public Health in Baltimore.

Participants Underwent MRI and Actigraphy
Dr. Spira and his colleagues at the National Institute on Aging Intramural Research Program and Johns Hopkins University studied adults without dementia enrolled in the ongoing Baltimore Longitudinal Study of Aging. To be eligible for the study, participants could not have cognitive impairment, functional limitations, or chronic medical conditions besides controlled hypertension.
Dr. Spira and colleagues examined the 183 participants for whom wrist actigraphy and MRI data from the same study visit were available. The sample’s mean age was 75. About 57% of the sample was female, and 28% were racial or ethnic minorities (mostly African American). Approximately 84% of the sample had 16 or more years of education.
Participants completed an average of 6.8 nights of actigraphy. The actigraph unit was worn on the nondominant wrist. The study’s primary actigraphy variables were total sleep time (TST), wake after sleep onset (WASO), and average wake bout length. Participants also underwent 3-T MRI, and the researchers’ main imaging variables were ventricular volume and hippocampal volume. Dr. Spira and colleagues adjusted their analyses for age, sex, education, race, depressive symptomatology, and the log of the intracranial volume.
Links Between Sleep and Brain Volumes
The population’s mean TST was 6.6 hours, and the investigators divided the TST data into tertiles. The mean TST for tertile 1 was 5.4 hours, the mean TST for tertile 2 was 6.6 hours, and the mean TST for tertile 3 was 7.7 hours. Mean WASO was 53 minutes, and mean wake bout length was 2.5 minutes.
Dr. Spira’s group found a statistically significant 0.17-unit increase in ventricular volume in tertile 1, compared with tertile 2. They also found a 0.12-unit increase in ventricular volume in tertile 3, compared with tertile 2, but the difference did not reach statistical significance. WASO was not associated with ventricular volume, but the investigators found a statistically significant 0.06-unit increase in ventricular volume for every standard deviation increase in average wake bout length.
There was no significant association between TST and hippocampal volume. Every standard deviation increase in WASO, however, was associated with decrease in hippocampal volume that was not statistically significant. Wake bout length was not associated with hippocampal volume.
Because it is a cross sectional study, the researchers cannot examine the temporal associations that would support the possibility of a causal effect of sleep on brain atrophy, said Dr. Spira. “It could also be that brain atrophy is linked to disturbed sleep,” he added. The investigators did not screen participants for sleep apnea or adjust the data for BMI.
The findings are consistent, however, with longitudinal results of studies with self-report measures of sleep duration or quality, and with cross sectional associations between actigraphic fragmentation indices and lower brain volumes.
“Longitudinal studies with larger samples are needed,” said Dr. Spira. “Ultimately, trials will be needed to examine the effects of optimizing sleep on cognitive and neuroimaging outcomes.”
—Erik Greb
Suggested Reading
Branger P, Arenaza-Urquijo EM, Tomadesso C, et al. Relationships between sleep quality and brain volume, metabolism, and amyloid deposition in late adulthood. Neurobiol Aging. 2016;41:107-114.
Koo DL, Shin JH, Lim JS, et al. Changes in subcortical shape and cognitive function in patients with chronic insomnia. Sleep Med. 2017;35:23-26.
BOSTON—Compared with intermediate sleep duration, shorter sleep is associated with greater brain atrophy among community-dwelling older adults, according to a study presented at the 31st Annual Meeting of the Associated Professional Sleep Societies. Sleep duration appears to have no association with hippocampal volume, however.
More than 80% of older adults have sleep complaints, and research indicating an association between disturbed sleep and poor cognitive outcomes is accumulating. Sleep could be a crucial modifiable risk factor for cognitive outcomes, but few studies have examined the association between nonrespiratory sleep measures and brain volume, said Adam Spira, PhD, Associate Professor of Mental Health at Johns Hopkins Bloomberg School of Public Health in Baltimore.
Participants Underwent MRI and Actigraphy
Dr. Spira and his colleagues at the National Institute on Aging Intramural Research Program and Johns Hopkins University studied adults without dementia enrolled in the ongoing Baltimore Longitudinal Study of Aging. To be eligible for the study, participants could not have cognitive impairment, functional limitations, or chronic medical conditions besides controlled hypertension.
Dr. Spira and colleagues examined the 183 participants for whom wrist actigraphy and MRI data from the same study visit were available. The sample’s mean age was 75. About 57% of the sample was female, and 28% were racial or ethnic minorities (mostly African American). Approximately 84% of the sample had 16 or more years of education.
Participants completed an average of 6.8 nights of actigraphy. The actigraph unit was worn on the nondominant wrist. The study’s primary actigraphy variables were total sleep time (TST), wake after sleep onset (WASO), and average wake bout length. Participants also underwent 3-T MRI, and the researchers’ main imaging variables were ventricular volume and hippocampal volume. Dr. Spira and colleagues adjusted their analyses for age, sex, education, race, depressive symptomatology, and the log of the intracranial volume.
Links Between Sleep and Brain Volumes
The population’s mean TST was 6.6 hours, and the investigators divided the TST data into tertiles. The mean TST for tertile 1 was 5.4 hours, the mean TST for tertile 2 was 6.6 hours, and the mean TST for tertile 3 was 7.7 hours. Mean WASO was 53 minutes, and mean wake bout length was 2.5 minutes.
Dr. Spira’s group found a statistically significant 0.17-unit increase in ventricular volume in tertile 1, compared with tertile 2. They also found a 0.12-unit increase in ventricular volume in tertile 3, compared with tertile 2, but the difference did not reach statistical significance. WASO was not associated with ventricular volume, but the investigators found a statistically significant 0.06-unit increase in ventricular volume for every standard deviation increase in average wake bout length.
There was no significant association between TST and hippocampal volume. Every standard deviation increase in WASO, however, was associated with decrease in hippocampal volume that was not statistically significant. Wake bout length was not associated with hippocampal volume.
Because it is a cross sectional study, the researchers cannot examine the temporal associations that would support the possibility of a causal effect of sleep on brain atrophy, said Dr. Spira. “It could also be that brain atrophy is linked to disturbed sleep,” he added. The investigators did not screen participants for sleep apnea or adjust the data for BMI.
The findings are consistent, however, with longitudinal results of studies with self-report measures of sleep duration or quality, and with cross sectional associations between actigraphic fragmentation indices and lower brain volumes.
“Longitudinal studies with larger samples are needed,” said Dr. Spira. “Ultimately, trials will be needed to examine the effects of optimizing sleep on cognitive and neuroimaging outcomes.”
—Erik Greb
Suggested Reading
Branger P, Arenaza-Urquijo EM, Tomadesso C, et al. Relationships between sleep quality and brain volume, metabolism, and amyloid deposition in late adulthood. Neurobiol Aging. 2016;41:107-114.
Koo DL, Shin JH, Lim JS, et al. Changes in subcortical shape and cognitive function in patients with chronic insomnia. Sleep Med. 2017;35:23-26.