User login
Soccer-playing girls 5 times more likely to return to same-day play after concussion
CHICAGO – , according to a study presented at the annual meeting of the American Academy of Pediatrics.
Records from 87 soccer players aged 7-18 years (median, 14 years) were examined in a retrospective review of patients seen over a 2-year period by a single physician at a pediatric sports medicine center. Of these, two thirds (n = 58) were girls.

The soccer players included children participating in recreational, club, and school-sponsored soccer, said senior author Shane M. Miller, MD, in an interview. All patients were assessed according to a standardized concussion protocol that involved a neurologic exam and validated concussion evaluation testing, including the ImPACT and the Sports Concussion Assessment Tool (SCAT) tests.
As soccer has grown in popularity as a youth sport, so has the number of reported concussions. “The incidence of reported concussions has increased 1,600% from 1990 to 2014,” wrote Dr. Miller and his coauthors in the abstract accompanying the presentation. Dr. Miller said that girls are 1.5 times more likely than boys to sustain a concussion while playing soccer.
While seeing the patients who were the subject of the study, Dr. Miller realized that most of the soccer players had not come out of play for evaluation after the head impact. Rather, they had continued to play, only later reporting concussion symptoms to coaches, trainers, or parents.
“The athletes may have chosen not to say anything because they didn’t want to come out of the game,” said Dr. Miller, a sports medicine physician at Texas Scottish Rite Hospital for Children, Dallas.
“I was surprised by the significant degree of difference” between male and female soccer players, said Dr. Miller. The study was not designed to get at the reason for the discrepancy, so Dr. Miller could not say with certainty whether awareness of concussion symptoms is significantly lower for female athletes, or whether the athletic culture more strongly encourages minimization of symptoms for girls than boys. In any case, he said, there is room for education of players, coaches, and families to raise awareness of the importance to recognize and report concussion, and then remove the affected athlete from play,
Dr. Miller said that future research directions include collaboration with other facilities to conduct prospective research using a concussion registry. This will allow more robust statistical analysis, and help ascertain the degree of regional variation in pediatric sports concussion management.
“Current education efforts may not be enough to help athletes, parents, and coaches identify concussion symptoms, know the guidelines for immediate removal from play, and understand the risks of returning to play after an injury. More research is needed on how to better spread this message intended to protect the health of young athletes…” Aaron Zynda, the study’s first author and clinical research coordinator at Texas Scottish Rite, said in a press release accompanying the abstract. “Concussion recognition and identification is a team effort,” he said.
Neither Mr. Zynda nor Dr. Miller had any relevant conflicts of interest.
[email protected]
CHICAGO – , according to a study presented at the annual meeting of the American Academy of Pediatrics.
Records from 87 soccer players aged 7-18 years (median, 14 years) were examined in a retrospective review of patients seen over a 2-year period by a single physician at a pediatric sports medicine center. Of these, two thirds (n = 58) were girls.
The soccer players included children participating in recreational, club, and school-sponsored soccer, said senior author Shane M. Miller, MD, in an interview. All patients were assessed according to a standardized concussion protocol that involved a neurologic exam and validated concussion evaluation testing, including the ImPACT and the Sports Concussion Assessment Tool (SCAT) tests.
As soccer has grown in popularity as a youth sport, so has the number of reported concussions. “The incidence of reported concussions has increased 1,600% from 1990 to 2014,” wrote Dr. Miller and his coauthors in the abstract accompanying the presentation. Dr. Miller said that girls are 1.5 times more likely than boys to sustain a concussion while playing soccer.
While seeing the patients who were the subject of the study, Dr. Miller realized that most of the soccer players had not come out of play for evaluation after the head impact. Rather, they had continued to play, only later reporting concussion symptoms to coaches, trainers, or parents.
“The athletes may have chosen not to say anything because they didn’t want to come out of the game,” said Dr. Miller, a sports medicine physician at Texas Scottish Rite Hospital for Children, Dallas.
“I was surprised by the significant degree of difference” between male and female soccer players, said Dr. Miller. The study was not designed to get at the reason for the discrepancy, so Dr. Miller could not say with certainty whether awareness of concussion symptoms is significantly lower for female athletes, or whether the athletic culture more strongly encourages minimization of symptoms for girls than boys. In any case, he said, there is room for education of players, coaches, and families to raise awareness of the importance to recognize and report concussion, and then remove the affected athlete from play,
Dr. Miller said that future research directions include collaboration with other facilities to conduct prospective research using a concussion registry. This will allow more robust statistical analysis, and help ascertain the degree of regional variation in pediatric sports concussion management.
“Current education efforts may not be enough to help athletes, parents, and coaches identify concussion symptoms, know the guidelines for immediate removal from play, and understand the risks of returning to play after an injury. More research is needed on how to better spread this message intended to protect the health of young athletes…” Aaron Zynda, the study’s first author and clinical research coordinator at Texas Scottish Rite, said in a press release accompanying the abstract. “Concussion recognition and identification is a team effort,” he said.
Neither Mr. Zynda nor Dr. Miller had any relevant conflicts of interest.
[email protected]
At AAP 2017
Key clinical point: Girls who played soccer were five times as likely as boys to return to play on the same day of concussion.
Major finding: Thirty of 58 girls with concussion returned to same-day play, compared with 5 of 29 boys.
Study details: Retrospective single-site study of 87 soccer players with concussion, median age 14 years.
Disclosures: None of the study authors had relevant conflicts of interest.
Application for pegfilgrastim biosimilar withdrawn

Mylan S.A.S. has withdrawn the European marketing authorization application for its pegfilgrastim biosimilar Fulphila, according to the European Medicines Agency’s Committee for Medicinal Products for Human Use (CHMP).
Fulphila was intended to be used to reduce the duration of neutropenia and the incidence of febrile neutropenia in adults receiving cytotoxic therapy for malignancy (except chronic myeloid leukemia and myelodysplastic syndromes).
Fulphila was intended to be highly similar to Neulasta, a solution for injection that contains the active substance pegfilgrastim.
To support the application for Fulphila, Mylan S.A.S. presented results of studies designed to show that Fulphila is highly similar to Neulasta in terms of chemical structure, purity, mechanism, safety, effectiveness, and immunogenicity.
Mylan S.A.S withdrew the application for Fulphila after the CHMP had evaluated the initial documentation the company provided on the drug and formulated a list of questions. The CHMP was assessing the company’s responses to the questions when the application was withdrawn.
At the time of the withdrawal, the CHMP had some concerns and was of the provisional opinion that Fulphila could not have been approved.
One of the CHMP’s main concerns was the lack of a certificate of Good Manufacturing Practice for the manufacturing site of the product. Other concerns related to the description of the manufacturing process, the control of impurities in the active substance, and the sterilization of the final product.
In a letter to the European Medicines Agency, Mylan S.A.S said it withdrew the application for Fulphila because a Good Manufacturing Practice certificate for the manufacturing site could not be obtained in the time available.
The application withdrawal does not impact ongoing clinical trials of Fulphila, and there are no compassionate use programs for the drug.
Mylan S.A.S said it plans to resubmit the application for Fulphila as soon as possible. The company is working to ensure “inspection readiness” at the Fulphila manufacturing site by October 2017. ![]()
Duke’s Criteria help guide echocardiography decision in suspected infective endocarditis
CHICAGO – In screening children with suspected endocarditis, clinicians should first apply Duke’s Criteria to assess risk and guide the decision of whether to order an echocardiogram.
Nancy Hua, DO, a first-year pediatric cardiology fellow at Doernbecher Children’s Hospital/ Oregon Health & Science University in Portland, and fellow researchers evaluated the appropriateness and effectiveness of 300 echocardiograms ordered at their institution over 10 years for suspected infective endocarditis in pediatric patients. Patients were younger than 21 years and all had structurally normal hearts. “We did notice there have been a lot of people ordering echocardiograms because of a concern about infective endocarditis,” Dr. Hua said. “But echocardiograms are expensive and require the patients to lay still for half an hour to an hour with a probe on their chest to obtain the images.”

A total of 10, or 3%, of echocardiograms were positive for a mass, abscess, thrombus, or new valve regurgitation consistent with infective endocarditis. Eight of the 300 patients screened with echocardiography were diagnosed with infective endocarditis. Of the two remaining patients, one had negative blood cultures, so clinicians did not administer antibiotics or diagnose infective endocarditis. The other patient presented with a new, mild mitral valve regurgitation; however, the echocardiography results appeared within normal limits, according to a cardiology consultation. This patient was ultimately treated for bacteremia.
“If the patient doesn’t really have the appropriate risk factors [for infective endocarditis], do they really need to go for this echo?” Dr. Hua asked here at the annual meeting of the American Academy of Pediatrics. The researchers suggest considering an echocardiogram when a patient has two or more persistent positive blood cultures, persistent fever on antibiotic therapy, and/or a new pathologic murmur.
Dr. Hua and her colleagues plan to launch a quality improvement project to target more appropriate echocardiogram use. Specifically, they are developing an elecronic health record order set to remind clinicians about appropriate criteria for ordering the imaging when they suspect infective endocarditis. “Does the patient fulfill the criteria? If the answer is no, they can reconsider if they want to order the echo at that point. Or if they are still worried for any reason at all, they can consult pediatric cardiology.” She added, “If we think it’s still warranted, we’ll order the echo ourselves.”
Dr. Hua reported having no financial disclosures.
CHICAGO – In screening children with suspected endocarditis, clinicians should first apply Duke’s Criteria to assess risk and guide the decision of whether to order an echocardiogram.
Nancy Hua, DO, a first-year pediatric cardiology fellow at Doernbecher Children’s Hospital/ Oregon Health & Science University in Portland, and fellow researchers evaluated the appropriateness and effectiveness of 300 echocardiograms ordered at their institution over 10 years for suspected infective endocarditis in pediatric patients. Patients were younger than 21 years and all had structurally normal hearts. “We did notice there have been a lot of people ordering echocardiograms because of a concern about infective endocarditis,” Dr. Hua said. “But echocardiograms are expensive and require the patients to lay still for half an hour to an hour with a probe on their chest to obtain the images.”
A total of 10, or 3%, of echocardiograms were positive for a mass, abscess, thrombus, or new valve regurgitation consistent with infective endocarditis. Eight of the 300 patients screened with echocardiography were diagnosed with infective endocarditis. Of the two remaining patients, one had negative blood cultures, so clinicians did not administer antibiotics or diagnose infective endocarditis. The other patient presented with a new, mild mitral valve regurgitation; however, the echocardiography results appeared within normal limits, according to a cardiology consultation. This patient was ultimately treated for bacteremia.
“If the patient doesn’t really have the appropriate risk factors [for infective endocarditis], do they really need to go for this echo?” Dr. Hua asked here at the annual meeting of the American Academy of Pediatrics. The researchers suggest considering an echocardiogram when a patient has two or more persistent positive blood cultures, persistent fever on antibiotic therapy, and/or a new pathologic murmur.
Dr. Hua and her colleagues plan to launch a quality improvement project to target more appropriate echocardiogram use. Specifically, they are developing an elecronic health record order set to remind clinicians about appropriate criteria for ordering the imaging when they suspect infective endocarditis. “Does the patient fulfill the criteria? If the answer is no, they can reconsider if they want to order the echo at that point. Or if they are still worried for any reason at all, they can consult pediatric cardiology.” She added, “If we think it’s still warranted, we’ll order the echo ourselves.”
Dr. Hua reported having no financial disclosures.
AT AAP 2017
Key clinical point: Duke’s Criteria should be used to establish whether echocardiograms is needed to screen for infective endocarditis.
Major finding: A total 3% of echocardiograms were positive for mass, abscess, thrombus, or new valve regurgitation consistent with infective endocarditis.
Data source: Review of 300 patients who had an echocardiogram for suspected infective endocarditis between 2005 and 2015.
Disclosures: Dr. Hua reported having no financial disclosures.

How would you treat ... recurrent pre-B ALL in a 24-year-old woman?
Welcome to our new online feature, "How would you treat?"
This new item seeks to stimulate a lively conversation around cases that address the "art of medicine," in which there are no right or wrong ways to treat a specific patient. Instead, we posit to you "if this was your patient, how would you treat her?" The goal is to offer each other our thoughts on how we view treatment options from the perspectives of potential for cure and quality of life for a specific patient given his or her unique treatment history.
Our first case for your consideration will examine perspectives on the treatment of recurrent acute lymphoblastic leukemia, a condition with increasing therapeutic options.
A 24-year-old female was diagnosed with pre-B Acute Lymphoblastic Leukemia. She achieved complete remission on a standard chemotherapy protocol that included L-asparaginase and completed maintenance therapy 1 year ago, but no tests for MRD were performed. Routine surveillance blood counts worsened and a bone marrow biopsy confirms relapse. She feels well. There is no detectable BCR/ABL, but the leukemic blasts express CD19, CD20, and CD22. She has an HLA-matched sibling donor. Her exam is normal with WBC 23,000 (76% Blasts), Hgb 10.3, Plt 32K.

The Inflection Point
In the early 1600s, the French playwright Molière wrote one of the great satires of all time, “The Doctor in Spite of Himself.” In that play the main character, Sganarelle, is a woodcutter who wastes all his money on alcohol, so his wife Martine decides she will teach him a lesson. As she is plotting her revenge, Martine overhears two peasants discussing how they have been trying to find a doctor for their rich employer’s daughter, who has become suddenly mute. Martine seizes the opportunity to tell the peasants that her husband is a brilliant – though eccentric – doctor who usually hides his identity. Learning this, the peasants find Sganarelle and beg him to see their master’s daughter. Though he initially refuses, they berate him until he can take it no more, and he finally says that he is a doctor and agrees to assess the ill young woman.

Sganarelle does his best to impersonate a doctor while examining the young woman, and as he is doing so it becomes apparent even to him that she is not truly ill. She is pretending to be mute because she’s being forced to marry a wealthy man she does not love. Sganarelle discusses the diagnosis with her father, stating, “this impediment to the action of the tongue is caused by certain humors.” He goes on to say that her muteness was triggered by, “the vapors that pass from the left side, where the liver resides, to the right side, where the heart dwells.” The rich aristocrat listens intently and accepts the diagnosis, though he seems puzzled about one thing. “Isn’t the heart on the left side of the chest?” he asks. To this insightful and obvious question Sganarelle replies, “Yes, that used to be true; but we’ve changed all that, and we practice medicine now according to a whole new method.”
It is astonishing that Molière, in a farcical comedy written in the 1600s, could have anticipated the dizzying rate of change in modern medicine. While the heart and liver have not changed sides, the ways we are practicing medicine have undergone landmark shifts over the past 10 years. Just look at the new ways in which we record documentation, learn new information, send in prescriptions, manage populations in addition to individual patients, and so many other aspects of care. At times this evolution has its own satirical feel to it. For example, the notion that refusing to refill an opioid prescription for a patient that broke their opioid contract could lead to a bad review on Yelp or points off on a Press Ganey satisfaction survey does not seem reasonable, but it is real.
When we started this column about 10 years ago, we regularly received emails (and even letters written in fine penmanship and mailed in envelopes) from physicians who felt that the EHR was ruining their practice and their lives. Many of the letters talked about early retirement. Some physicians ended up retiring early. Many of these physicians were smart, able people who we believe took great care of patients. But as Leon C. Megginson, interpreting the work of Darwin, observed, “It is not the strongest of the species that survives, nor the most intelligent, but the one most responsive to change.” Adaptability favors the young; the young have fewer habits to break, few preconceived ideas of how things should be, and perhaps more energy to give to new tasks.
We believe we have now reached the inflection point – a time in the history of an industry where an event (in this case the advent of the EHR) so fundamentally impacts the industry that the industry is changed from that point forward. The industry, and more importantly those who work in the industry, must adopt new approaches and attitudes in order to survive in the changed environment. Andrew Grove, the former CEO of Intel, talked about Strategic Inflection Points in a keynote address to the Academy of Management: “…what is common to [inflection points] and what is key is that they require a fundamental change in business strategy.” Grove also said, “That change can mean an opportunity to rise to new heights. But it may just as likely signal the beginning of the end.”
Up until recently, the introduction of the EHR lead to discussions about what was good and what was bad about the advent of EHRs. That time is past. We no longer receive letters from physicians expressing their concerns about the EHR, as many of those physicians have taken the change as a signal of the end of their careers, and chosen to retire. The rest have adapted to a new world. And in this new world we are certainly rising to new heights. We are forward-focused and looking at the multi-fold ways that our new technologies can accomplish their many missions – to improve the health of the population, to serve as a source of data to assess the real-world effectiveness of novel therapies, to evaluate and affect the quality of care given by practices and individual physicians, and to take excellent personalized care of individual patients. While we are physicians, not wood cutters as in Molière’s play, it remains incumbent upon us never to stop listening to our patients’ hearts, and to interpret their symptoms and signs with common sense, empathy and even humor when appropriate, all the while embracing approaches that move the health care of our patients forward to new heights.
Dr. Skolnik is professor of family and community medicine at Sidney Kimmel Medical College, Thomas Jefferson University, Philadelphia, and associate director of the family medicine residency program at Abington Jefferson Health. Dr. Notte is a family physician and clinical informaticist for Abington (Pa.) Memorial Hospital. He is also a partner in EHR Practice Consultants, a firm that aids physicians in adopting electronic health records.
In the early 1600s, the French playwright Molière wrote one of the great satires of all time, “The Doctor in Spite of Himself.” In that play the main character, Sganarelle, is a woodcutter who wastes all his money on alcohol, so his wife Martine decides she will teach him a lesson. As she is plotting her revenge, Martine overhears two peasants discussing how they have been trying to find a doctor for their rich employer’s daughter, who has become suddenly mute. Martine seizes the opportunity to tell the peasants that her husband is a brilliant – though eccentric – doctor who usually hides his identity. Learning this, the peasants find Sganarelle and beg him to see their master’s daughter. Though he initially refuses, they berate him until he can take it no more, and he finally says that he is a doctor and agrees to assess the ill young woman.
Sganarelle does his best to impersonate a doctor while examining the young woman, and as he is doing so it becomes apparent even to him that she is not truly ill. She is pretending to be mute because she’s being forced to marry a wealthy man she does not love. Sganarelle discusses the diagnosis with her father, stating, “this impediment to the action of the tongue is caused by certain humors.” He goes on to say that her muteness was triggered by, “the vapors that pass from the left side, where the liver resides, to the right side, where the heart dwells.” The rich aristocrat listens intently and accepts the diagnosis, though he seems puzzled about one thing. “Isn’t the heart on the left side of the chest?” he asks. To this insightful and obvious question Sganarelle replies, “Yes, that used to be true; but we’ve changed all that, and we practice medicine now according to a whole new method.”
It is astonishing that Molière, in a farcical comedy written in the 1600s, could have anticipated the dizzying rate of change in modern medicine. While the heart and liver have not changed sides, the ways we are practicing medicine have undergone landmark shifts over the past 10 years. Just look at the new ways in which we record documentation, learn new information, send in prescriptions, manage populations in addition to individual patients, and so many other aspects of care. At times this evolution has its own satirical feel to it. For example, the notion that refusing to refill an opioid prescription for a patient that broke their opioid contract could lead to a bad review on Yelp or points off on a Press Ganey satisfaction survey does not seem reasonable, but it is real.
When we started this column about 10 years ago, we regularly received emails (and even letters written in fine penmanship and mailed in envelopes) from physicians who felt that the EHR was ruining their practice and their lives. Many of the letters talked about early retirement. Some physicians ended up retiring early. Many of these physicians were smart, able people who we believe took great care of patients. But as Leon C. Megginson, interpreting the work of Darwin, observed, “It is not the strongest of the species that survives, nor the most intelligent, but the one most responsive to change.” Adaptability favors the young; the young have fewer habits to break, few preconceived ideas of how things should be, and perhaps more energy to give to new tasks.
We believe we have now reached the inflection point – a time in the history of an industry where an event (in this case the advent of the EHR) so fundamentally impacts the industry that the industry is changed from that point forward. The industry, and more importantly those who work in the industry, must adopt new approaches and attitudes in order to survive in the changed environment. Andrew Grove, the former CEO of Intel, talked about Strategic Inflection Points in a keynote address to the Academy of Management: “…what is common to [inflection points] and what is key is that they require a fundamental change in business strategy.” Grove also said, “That change can mean an opportunity to rise to new heights. But it may just as likely signal the beginning of the end.”
Up until recently, the introduction of the EHR lead to discussions about what was good and what was bad about the advent of EHRs. That time is past. We no longer receive letters from physicians expressing their concerns about the EHR, as many of those physicians have taken the change as a signal of the end of their careers, and chosen to retire. The rest have adapted to a new world. And in this new world we are certainly rising to new heights. We are forward-focused and looking at the multi-fold ways that our new technologies can accomplish their many missions – to improve the health of the population, to serve as a source of data to assess the real-world effectiveness of novel therapies, to evaluate and affect the quality of care given by practices and individual physicians, and to take excellent personalized care of individual patients. While we are physicians, not wood cutters as in Molière’s play, it remains incumbent upon us never to stop listening to our patients’ hearts, and to interpret their symptoms and signs with common sense, empathy and even humor when appropriate, all the while embracing approaches that move the health care of our patients forward to new heights.
Dr. Skolnik is professor of family and community medicine at Sidney Kimmel Medical College, Thomas Jefferson University, Philadelphia, and associate director of the family medicine residency program at Abington Jefferson Health. Dr. Notte is a family physician and clinical informaticist for Abington (Pa.) Memorial Hospital. He is also a partner in EHR Practice Consultants, a firm that aids physicians in adopting electronic health records.
Buprenorphine linked to less neonatal abstinence syndrome than methadone
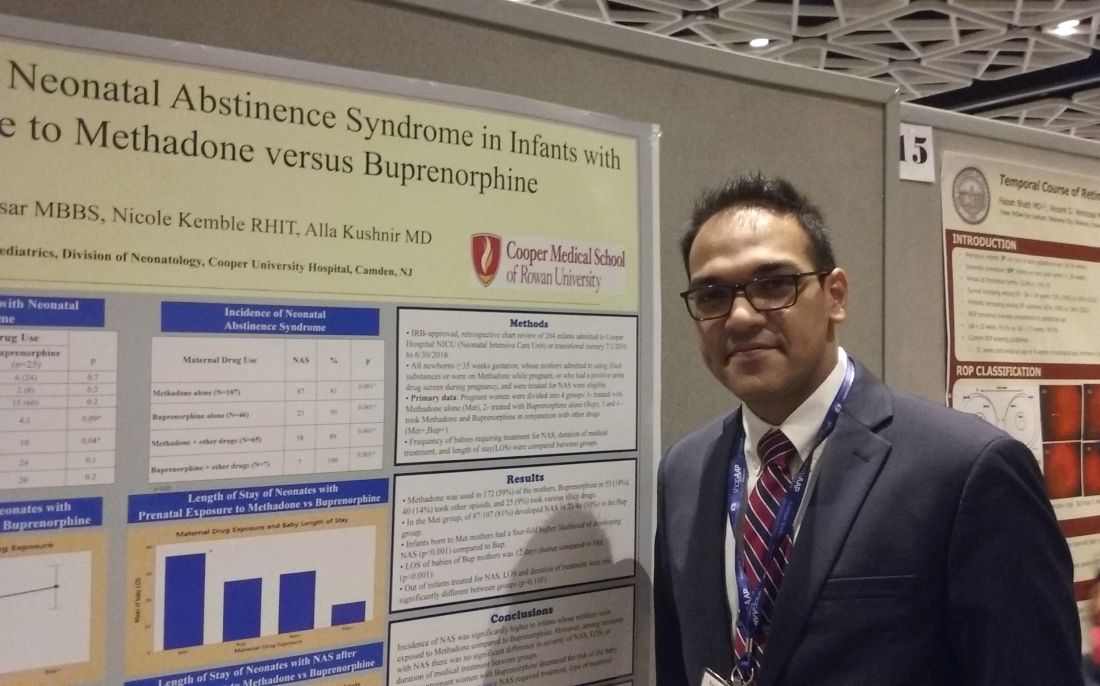
CHICAGO – Methadone was associated with a significantly higher incidence of neonatal abstinence syndrome (NAS), compared with babies born to mothers who took buprenorphine for opioid maintenance therapy during pregnancy, a retrospective study of 204 neonates revealed.
Interestingly, among babies who developed the syndrome, the duration of treatment and length of stay did not differ significantly between groups.
“We found buprenorphine decreases [the incidence of] NAS,” said Alla Kushnir, MD, an attending neonatologist at Cooper University Hospital in Camden, N.J. The findings also demonstrate that physicians can expect to see “about the same withdrawal once they withdraw,” regardless of whether the mother took methadone or buprenorphine during pregnancy.
“We can’t make it better, but we can prevent some neonatal abstinence syndrome,” Dr. Kushnir said in an interview at the annual meeting of the American Academy of Pediatrics.
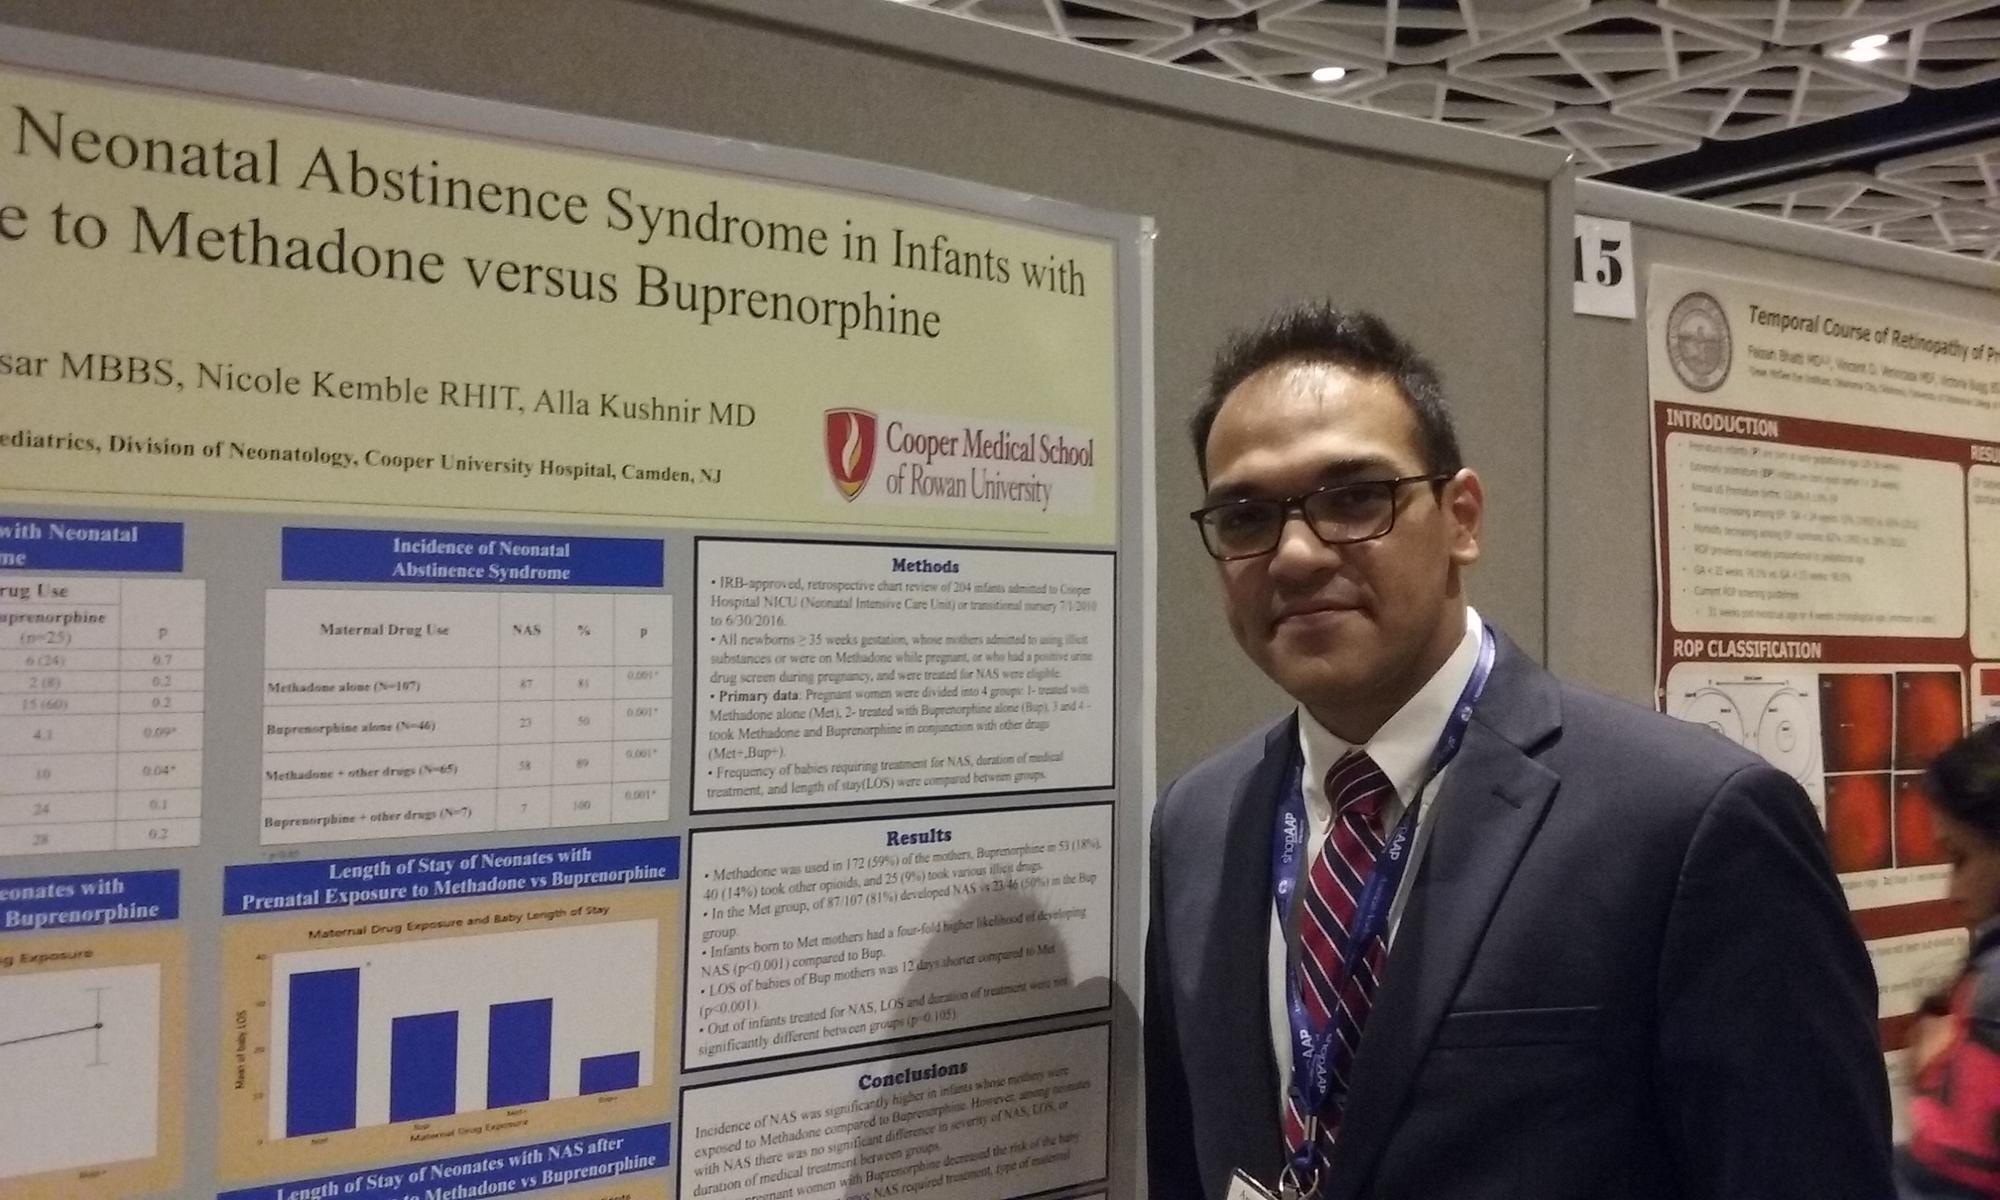
The infants in the study were admitted to the neonatal ICU between July 2010 and June 2016. The mothers self-reported prenatal use of methadone, buprenorphine, other opioids and/or various illicit drugs, or tested positive on a urine screen during pregnancy. In the methadone group, 81% of infants developed NAS, compared with 50% of those in the buprenorphine group. The higher likelihood of developing NAS from methadone-treated mothers was statistically significant (P less than .001).
The study population included some women who reported taking additional drugs. Among 65 infants born to women who combined methadone with other agents, 58 (89%) developed NAS. In addition, all seven infants (100%) born to women who took buprenorphine and other drugs developed the syndrome.
“Methadone was the clear bad guy in terms of incidence” between the two drugs, said Ravi Bhavsar, MBBS, a research assistant at the hospital.
Among the infants who developed NAS symptoms, the hospital length of stay and duration of medical treatment – indicators of syndrome severity – did not differ significantly (P = .015).
“This study also tells us that more research needs to be done,” Dr. Bhavsar said. Methadone is a mainstay of opioid maintenance therapy, he added, and additional evidence is warranted before shifting recommendations toward buprenorphine.
Dr. Kushnir and Dr. Bhavsar reported having no relevant financial disclosures.
CHICAGO – Methadone was associated with a significantly higher incidence of neonatal abstinence syndrome (NAS), compared with babies born to mothers who took buprenorphine for opioid maintenance therapy during pregnancy, a retrospective study of 204 neonates revealed.
Interestingly, among babies who developed the syndrome, the duration of treatment and length of stay did not differ significantly between groups.
“We found buprenorphine decreases [the incidence of] NAS,” said Alla Kushnir, MD, an attending neonatologist at Cooper University Hospital in Camden, N.J. The findings also demonstrate that physicians can expect to see “about the same withdrawal once they withdraw,” regardless of whether the mother took methadone or buprenorphine during pregnancy.
“We can’t make it better, but we can prevent some neonatal abstinence syndrome,” Dr. Kushnir said in an interview at the annual meeting of the American Academy of Pediatrics.
The infants in the study were admitted to the neonatal ICU between July 2010 and June 2016. The mothers self-reported prenatal use of methadone, buprenorphine, other opioids and/or various illicit drugs, or tested positive on a urine screen during pregnancy. In the methadone group, 81% of infants developed NAS, compared with 50% of those in the buprenorphine group. The higher likelihood of developing NAS from methadone-treated mothers was statistically significant (P less than .001).
The study population included some women who reported taking additional drugs. Among 65 infants born to women who combined methadone with other agents, 58 (89%) developed NAS. In addition, all seven infants (100%) born to women who took buprenorphine and other drugs developed the syndrome.
“Methadone was the clear bad guy in terms of incidence” between the two drugs, said Ravi Bhavsar, MBBS, a research assistant at the hospital.
Among the infants who developed NAS symptoms, the hospital length of stay and duration of medical treatment – indicators of syndrome severity – did not differ significantly (P = .015).
“This study also tells us that more research needs to be done,” Dr. Bhavsar said. Methadone is a mainstay of opioid maintenance therapy, he added, and additional evidence is warranted before shifting recommendations toward buprenorphine.
Dr. Kushnir and Dr. Bhavsar reported having no relevant financial disclosures.
AT AAP 2017
Key clinical point: .
Major finding: 81% of infants in the methadone group developed NAS, compared with 50% of the buprenorphine group.
Data source: Retrospective study of 204 babies admitted to a NICU between July 2010 to June 2016 whose mothers admitted or tested positive for opioid maintenance therapy.
Disclosures: Dr. Kushnir and Dr. Bhaysar reported having no relevant financial disclosures.
EVAR registry results show equivalence between the sexes
A global registry showed that men and women had equivalent outcomes after endovascular abdominal aortic aneurysm repair (EVAR) despite significant differences in baseline characteristics, anatomy, and off-instruction stent use.
The 5-year ENGAGE (Endurant Stent Graft Natural Selection Global Postmarket Registry) data were presented by Marc Schermerhorn, MD, chief, division of vascular and endovascular surgery, Beth Israel Deaconess Medical Center, Boston, in a late-breaking clinical trial at the Vascular Interventional Advances (VIVA) 2017 conference in Las Vegas.
The registry comprises data from 1,263 patients (133 women and 1,130 men) in 30 countries who received the Endurant II stent graft during for endovascular repair of the abdominal aortic aneurysm. ENGAGE participants are consecutively enrolled, and have 30-day and subsequent yearly evaluations, with independent data monitoring and event adjudication.

Despite many other equivalent demographic and clinical characteristics, including smoking status, hypertension, diabetes, and pulmonary disease, overall women were statistically significantly older, had less cardiac disease, had shorter and more angulated aneurysm necks, and had smaller iliac arteries. In addition they were more likely to be treated outside of the Endurant II instructions for use (IFU), according to Dr. Schemerhorn.
Women also had significantly longer hospital stays than men (7.9 days vs. 6.4 days), respectively, but had equivalent procedure duration, ICU times, and similarly successful stent delivery and deployment (99%).
But despite these differences in baseline characteristics and anatomy, the 5-year data showed equivalent outcomes between women and men at 30 days, and 1 year, and through 5 years. There were no significant differences across these periods in freedom from all-cause mortality (67.5% in men, 65.6% in women, P = 0.87), 5-year freedom from aneurysm-related mortality (97.5% men, 100% women, P = .09), 5-year freedom from rupture (98.4% men, 100% women, P = .23), and 5-year freedom from conversion (97.8% men, 99.2% women, P = .48). There were also no significant differences in type 1 endoleaks, 5-year freedom from conversion, and sac diameter changes, Dr. Schermerhorn concluded.
The ENGAGE registry is sponsored by Medtronic. Dr. Schermerhorn disclosed that he was a consultant for several medical device companies and a shareholder and owner of a health care company, but that he did not have any potential conflicts of interest for this particular study.
[email protected]
A global registry showed that men and women had equivalent outcomes after endovascular abdominal aortic aneurysm repair (EVAR) despite significant differences in baseline characteristics, anatomy, and off-instruction stent use.
The 5-year ENGAGE (Endurant Stent Graft Natural Selection Global Postmarket Registry) data were presented by Marc Schermerhorn, MD, chief, division of vascular and endovascular surgery, Beth Israel Deaconess Medical Center, Boston, in a late-breaking clinical trial at the Vascular Interventional Advances (VIVA) 2017 conference in Las Vegas.
The registry comprises data from 1,263 patients (133 women and 1,130 men) in 30 countries who received the Endurant II stent graft during for endovascular repair of the abdominal aortic aneurysm. ENGAGE participants are consecutively enrolled, and have 30-day and subsequent yearly evaluations, with independent data monitoring and event adjudication.
Despite many other equivalent demographic and clinical characteristics, including smoking status, hypertension, diabetes, and pulmonary disease, overall women were statistically significantly older, had less cardiac disease, had shorter and more angulated aneurysm necks, and had smaller iliac arteries. In addition they were more likely to be treated outside of the Endurant II instructions for use (IFU), according to Dr. Schemerhorn.
Women also had significantly longer hospital stays than men (7.9 days vs. 6.4 days), respectively, but had equivalent procedure duration, ICU times, and similarly successful stent delivery and deployment (99%).
But despite these differences in baseline characteristics and anatomy, the 5-year data showed equivalent outcomes between women and men at 30 days, and 1 year, and through 5 years. There were no significant differences across these periods in freedom from all-cause mortality (67.5% in men, 65.6% in women, P = 0.87), 5-year freedom from aneurysm-related mortality (97.5% men, 100% women, P = .09), 5-year freedom from rupture (98.4% men, 100% women, P = .23), and 5-year freedom from conversion (97.8% men, 99.2% women, P = .48). There were also no significant differences in type 1 endoleaks, 5-year freedom from conversion, and sac diameter changes, Dr. Schermerhorn concluded.
The ENGAGE registry is sponsored by Medtronic. Dr. Schermerhorn disclosed that he was a consultant for several medical device companies and a shareholder and owner of a health care company, but that he did not have any potential conflicts of interest for this particular study.
[email protected]
FROM VIVA 17
Key clinical point:
Major finding: The 5-year data showed equivalent outcomes between women and men at 30 days, and 1 year, and through 5 years.
Data source: ENGAGE global registry data from 1,263 patients (133 women and 1,130 men).
Disclosures: The ENGAGE registry is sponsored by Medtronic. Dr. Schermerhorn reported that he had no potential conflicts of interest for this study.
Can We Trust the Data?
In his thought provoking keynote address at the annual Association of VA Hematology and Oncology meeting in Denver on September 15, 2017, John P.A. Ioannidis, MD, DSc, of Stanford University challenged the current reliance on clinical trial research and meta-analyses. Ioannidis has published numerous examinations of medical literature and found significant biases and potential limitations, and as he noted, few health care providers are aware of the poor quality of the research and its limitations.
Ioannidis’ studies contend that in most medical research “there is no evidence to build our decision making,” although he acknowledged that hematology and oncology research is a little better than other parts of the medical research. In a study of indexed articles, for example, just 19% had at least one outcome with high quality evidence. He attributes this to a number of types of flaws, including bias, an increase in research conducted in regions without a strong tradition, and degrees of freedom to conduct research, even in clinical trials.
Complicating matters even further, Ioannidis pointed out that many of the most highly cited studies were later refuted in other studies. In a re-examination of study data made available by researchers publishing in BMJ and PLoS Medicine, Ioannidis and his colleagues found that they could reproduce a fraction of the results. Moreover, he argued, “even when we can trust the data, most clinical research is not useful for making decisions.”
To measure the usefulness of a study, Ioannidis and his colleagues noted 8 different quality measures:
- Problem base;
- Context placement;
- Information gain;
- Pragmatism;
- Patient-centeredness;
- Value for money;
- Feasibility; and
- Transparency.
According to Ioannidis, few trials or studies hit 5 of 8 measures, and he has yet to find a study that incorporates all 8. Even articles in the most prestigious journals tend to score fairly low, he noted.
Meta-analyses are not immune to these structural problems, according to Ioannidis. Close to 100,000 meta-analysis have been published, with nearly 1,000 new studies published each month. Some, he noted, have been “hijacked to serve other agendas,” while many others simply summarized biased information.
Despite these concerns, Ioannidis remains optimistic. “We need to maximize diversity, minimize co-occurrence and incoherence” in the medical literature he argued.
The Top Abstracts Awarded at the 2017 Annual AVAHO Meeting
Of the 55 accepted posters and abstracts presented at the 2017 Association of VA Hematology/Oncology Annual Meeting, 3 were recognized for their innovation and importance. A panel of judges examined each abstract and poster and talked to the presenter before recognizing the 3 winners.
In addition, AVAHO also recognized Katherine Faricy-Anderson, MD, MPH, of the Providence VAMC as the recipient of the inaugural AVAHO Research Schoalrship Award for her submission titled, “Optimization of Palliative Oncology Care within the VA Healthcare System – Assessing the Availability of Outpatient Palliative Care within VA Oncology Clinics.” This $10,000 scholarship challenges applicants to develop research initiatives that foster collaboration across multiple medical facilities. Five reviewers evaluated submissions for “the merits of (1) innovation, (2) likelihood that findings will improve patient outcomes, (3) relevance to veterans and the VHA, (4) subject matter expertise (or available mentorship), (5) likelihood of collaboration with other VA investigators, and (6) opportunity to support the pursuit of future funding.” AVAHO announced plans to continue this scholarship program next year and increase the award to $25,000.
The abstract award winners were:
1. Staging and Survival of Colorectal Cancer in Octogenarians: Nationwide Study of U.S. Veterans
Virk G, Jafri M, Ashley C, Mehdi S
Awarded $1,000
2. National Comprehensive Cancer Network Distress Thermometer Versus Veteran Symptom Assessment Screen: Year in Review at the Cleveland VAMC
Smith J, Arfons L, Cmolik B, Fox D, Dimick J, Berman S, Woods K, Simon J
Awarded $500
3. Hypertension Among Veterans Affairs Colorectal Cancer Survivors: A Matched Case-Control Analysis
Zullig LL, Lindquist J, Smith VA, Williams CD, Weinberger M, Povenzale D, Jackson GL, Kelley MJ, Danus S, Bosworth HB
Awarded $250
Click here to view all the 2017 abstracts.
Becoming the Authoritative Expert on Cancer Care for Veterans
In their addresses to the assembly, both the outgoing and incoming Association of VA Hematology and Oncology (AVAHO) presidents laid out the challenges and opportunities for the growing organization. Nearly 500 people attended the meeting, which was held in Denver, Colorado September 15 to September 17. Next year the meeting will be held in the Chicago area September 28 to 30, 2018.
As Mary Thomas, MS, CNS, AOCN noted, it is a challenging time to provide care at the VA. Public scrutiny and criticism, coupled with both understaffing and difficulties in employee retention at most facilities has left many health care providers feeling overwhelmed. Amid the challenges of working within the VA and for vulnerable veteran patients AVAHO provides its members an "essential opportunity to support each other" Thomas insisted in her farewell address. "One of our strategic goals is to enhance the value of the group for our members and to broaden our base by offering other functions and activities," Thomas added. "There is something for everyone.
Over the past year AVAHO has hired a part-time executive director to focus on the business and operations of the organization, proactively hired an accounting firm to ensure that the financial processes are done properly, and developed a formal relationship with the National Association of Veterans Research to increase access to clinical trials to improve clinical research. Thomas also highlighted a new relationship between AVAHO and an organization that develops continuing education programs. These programs will be available at VA hospitals throughout the country. "As a result of these relationships," Thomas told Federal Practitioner, "we have the ability to step up to the plate to assist the VA to be a more active partner in clinical research--that's really, really exciting."
Russell "Rusty" Crawford, B Pharm, BCOP, struck an upbeat note as he closed the meeting. Noting the significant progress made during Thomas' tenure, Crawford also laid out a more ambitious goal to "make AVAHO the authoritative expert on cancer care for veterans," he said "Our patients are unique and don't fit into a National Comprehensive Cancer Network box."
Mark Klein, MD, an oncologist at the Minneapolis VA Health Care System and an assistant professor of medicine at the University of Minnesota, in Minneapolis was named president elect.