User login
Atypical Fibroxanthoma Arising Within Erosive Pustular Dermatosis of the Scalp
Atypical fibroxanthoma (AFX) is a low-grade dermal malignancy comprised of atypical spindle cells.1 Classified as a superficial fibrohistiocytic tumor with intermediate malignant potential, AFX has an incidence of approximately 0.24% worldwide.2 The tumor appears mainly on the head and neck in sun-exposed areas but can occur less frequently on the trunk and limbs in non–sun-exposed areas. There is a 70% to 80% predominance in men aged 69 to 77 years, with lesions primarily occurring in sun-exposed areas of the head and neck.3 A median period of 4 months between time of onset and time of diagnosis has been previously established.4
When AFX does occur in non–sun-exposed areas, it tends to be in a younger patient population. Clinically, it presents as a rather nondescript, firm, erythematous papule or nodule less than 2 cm in diameter. Atypical fibroxanthoma most often presents asymptomatically, but the tumor may ulcerate and bleed, though pain and pruritus are uncommon.5 Findings are nonspecific, and the diagnosis must be confirmed with biopsy, as it can resemble other common dermatological lesions. The pathogenesis of AFX has been controversial. Two different studies looked at AFX using electron microscopy and concluded that the tumor most closely resembled a myofibroblast,6,7 which is consistent with current thinking today.
Atypical fibroxanthoma is believed to be associated with p53 mutation and is closely linked with exposure to UV radiation due to its predominance in sun-exposed areas. Other predisposing factors may include prior exposure to UV radiation, history of organ transplantation, immunosuppression, advanced age in men, and xeroderma pigmentosum. The differential diagnosis for AFX encompasses basal cell carcinoma, squamous cell carcinoma, Merkel cell carcinoma, adnexal tumor, and pyogenic granuloma.
Case Report
On physical examination, the lesions appeared erosive with crusting and granulation tissue (Figure 1A). The presentation was consistent with erosive pustular dermatosis of the scalp. Biopsy revealed granulation tissue. The patient underwent PDT and prednisone treatment with improvement. Additional biopsies revealed AKs. His condition improved with 2 PDT sessions but never fully cleared. During the PDT sessions, the patient reported intense unilateral headaches without visual changes. The headaches were intermittent and not apparently related to the treatments. He was referred for a temporal artery biopsy and rebiopsy of the remaining lesion on the scalp. The temporal artery biopsy was negative. The lesion that remained was a large nodule on the vertex scalp, and biopsy revealed AFX.
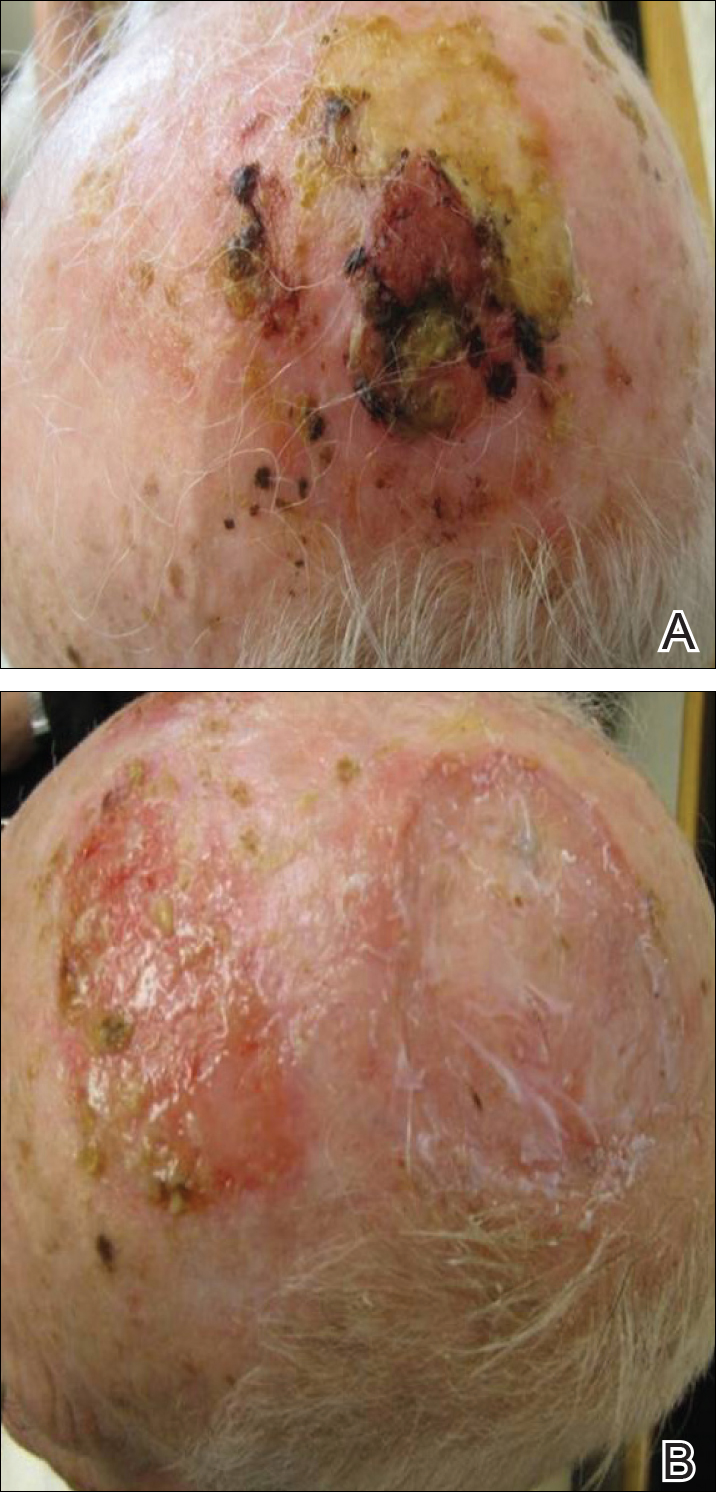
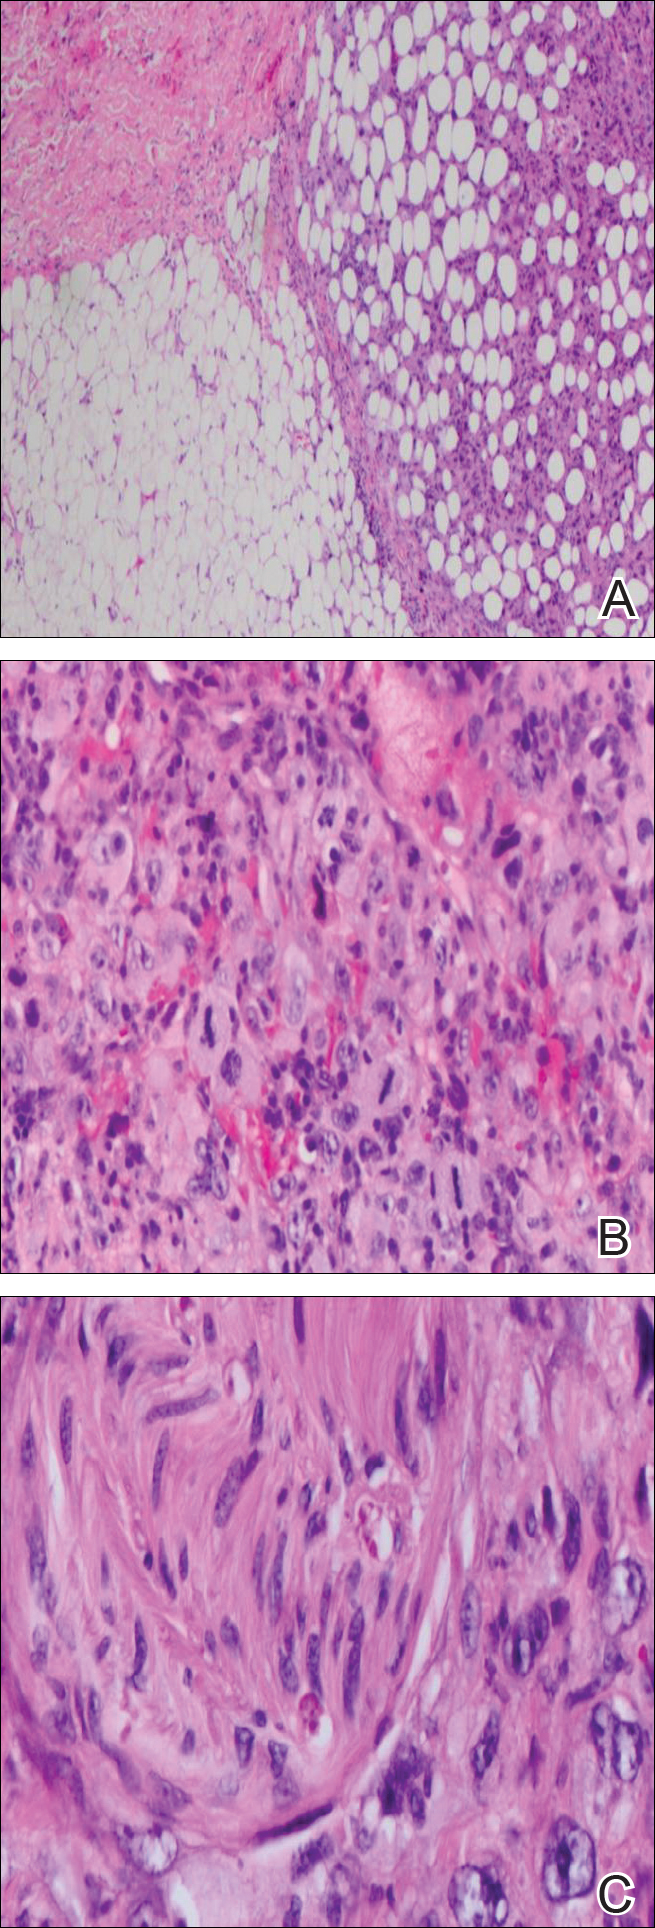
Immunohistochemical marker studies for S-100 and cytokeratin were negative. Invasion into subcutaneous fat was encountered (Figure 2A). Highly atypical spindle cells and mitoses were present (Figure 2B). Neoplastic cells were noted adjacent to nerve (Figure 2C). Excision of the lesion was curative, and his symptoms of pain and erosive pustular dermatosis resolved weeks thereafter (Figure 1B). The area of erosive pustular dermatosis was not excised, but symptoms resolved weeks following excision of the AFX.
Comment
Our case of AFX is unique due to the patient’s atypical presentation of severe pain. Because AFX usually presents asymptomatically, pain is an uncommon symptom. Based on the histologic findings in our case, we suspected that neural involvement of the tumor most likely explained the intense pain that our patient experienced.
The presence of erosive pustular dermatosis of the scalp also is interesting in our case. This elderly man had an extensive history of actinic damage and had reported pustules, scaling, itching, and scabbing of the scalp. It is possible that erosive pustular dermatosis was superimposed over the tumor and could have been the reason that multiple biopsies were needed to eventually arrive at a diagnosis. The coexistence of the 2 entities suggests that the chronic actinic damage played a role in the etiology of both.
Classification
There is a question regarding nomenclature when discussing AFX. Atypical fibroxanthoma has been referred to as a variant of undifferentiated pleomorphic sarcoma, which is a type of soft tissue sarcoma. Atypical fibroxanthoma can be referred to as undifferentiated pleomorphic sarcoma if it is more than 2 cm in diameter, if it involves the fascia or subcutaneous tissue, or if there is evidence of necrosis.3 Atypical fibroxanthoma generally is confined to the head and neck region and usually is less than 2 cm in diameter. In this patient, the presentation was consistent with AFX, as there was evidence of necrosis and invasion into the subcutaneous fat. The fact that the lesion also appeared on the scalp further supported the diagnosis of AFX.
Pathology
Biopsy of AFX typically reveals a spindle cell proliferation that usually arises in the setting of profound actinic damage. The epidermis may or may not be ulcerated, and in most cases, it is seen in close proximity to the overlying epidermis but not arising from it.8 Classic AFX is composed of highly atypical histiocytelike (epithelioid) cells admixed with pleomorphic spindle cells and giant cells, all showing frequent mitoses including atypical ones.9 Several histologic subtypes of AFX have been described, including clear cell, granular cell, pigmented cell, chondroid, osteoid, osteoclastic, and the most common spindle cell subtype.9 Features that indicate potential aggressive behavior include infiltration into the subcutaneous tissue, vascular invasion, and presence of necrosis. A diagnosis of AFX is made by exclusion of other malignant neoplasms with similar morphology, namely spindle cell squamous cell carcinoma, spindle cell melanoma, and leiomyoscarcoma.9 As such, immunohistochemistry plays a critical role in distinguishing these lesions, as they arise as part of the differential diagnosis. A panel of immunohistochemical stains is helpful for diagnosis and commonly includes but is not limited to S-100, Melan-A, smooth muscle actin, desmin, and cytokeratin.
Sampling error is an inherent flaw in any biopsy specimen. The eventual diagnosis of AFX in our case supports the argument for multiple biopsies of an unknown lesion, seeing as the affected area was interpreted as both granulation tissue and AK prior to the eventual diagnosis. Repeat biopsies, especially if a lesion is nonhealing, often can help clinicians arrive at a definitive diagnosis.
Treatment
Different treatment options have been used to manage AFX. Mohs micrographic surgery is most often used because of its tissue-sparing potential, often giving the most cosmetically appealing result. Wide local excision is another surgical technique utilized, generally with fixed margins of at least 1 cm.10 Radiation at the tumor site is used as a treatment method but most often during cases of reoccurrence. Cryotherapy as well as electrodesiccation and curettage are possible treatment options but are not the standard of care.
- Helwig EB. Atypical fibroxanthoma, in tumor seminar. proceedings of 18th Annual Seminar of San Antonio Society of Pathologists, 1961. Tex State J Med. 1963;59:664-667.
- Anderson HL, Joseph AK. A pilot feasibility study of a rare skin tumor database. Dermatol Surg. 2007;33:693-696.
- Iorizzo LJ 3rd, Brown MD. Atypical fibroxanthoma: a review of the literature. Dermatol Surg. 2011;37:146-157.
- Fretzin DF, Helwig EB. Atypical fibroxanthoma of the skin. a clinicopathologic study of 140 cases. Cancer. 1973;31:1541-1552.
- Vandergriff TW, Reed JA, Orengo IF. An unusual presentation of atypical fibroxanthoma. Dermatol Online J. 2008;14:6.
- Weedon D, Kerr JF. Atypical fibroxanthoma of skin: an electron microscope study. Pathology. 1975;7:173-177.
- Woyke S, Domagala W, Olszewski W, et al. Pseudosarcoma of the skin. an electron microscopic study and comparison with the fine structure of spindle-cell variant of squamous carcinoma. Cancer. 1974;33:970-980.
- Edward S, Yung A. Essential Dermatopathology. Philadelphia, PA: Lippincott Williams & Wilkins; 2012.
- Luzar B, Calonje E. Morphologic and immunohistochemical characteristics of atypical fibroxanthoma with a special emphasis on potential diagnostic pitfalls: a review. J Cutan Pathol. 2010;37:301-309.
- González-García R, Nam-Cha SH, Muñoz-Guerra MF, et al. Atypical fibroxanthoma of the head and neck: report of 5 cases. J Oral Maxillofac Surg. 2007;65:526-531.
Atypical fibroxanthoma (AFX) is a low-grade dermal malignancy comprised of atypical spindle cells.1 Classified as a superficial fibrohistiocytic tumor with intermediate malignant potential, AFX has an incidence of approximately 0.24% worldwide.2 The tumor appears mainly on the head and neck in sun-exposed areas but can occur less frequently on the trunk and limbs in non–sun-exposed areas. There is a 70% to 80% predominance in men aged 69 to 77 years, with lesions primarily occurring in sun-exposed areas of the head and neck.3 A median period of 4 months between time of onset and time of diagnosis has been previously established.4
When AFX does occur in non–sun-exposed areas, it tends to be in a younger patient population. Clinically, it presents as a rather nondescript, firm, erythematous papule or nodule less than 2 cm in diameter. Atypical fibroxanthoma most often presents asymptomatically, but the tumor may ulcerate and bleed, though pain and pruritus are uncommon.5 Findings are nonspecific, and the diagnosis must be confirmed with biopsy, as it can resemble other common dermatological lesions. The pathogenesis of AFX has been controversial. Two different studies looked at AFX using electron microscopy and concluded that the tumor most closely resembled a myofibroblast,6,7 which is consistent with current thinking today.
Atypical fibroxanthoma is believed to be associated with p53 mutation and is closely linked with exposure to UV radiation due to its predominance in sun-exposed areas. Other predisposing factors may include prior exposure to UV radiation, history of organ transplantation, immunosuppression, advanced age in men, and xeroderma pigmentosum. The differential diagnosis for AFX encompasses basal cell carcinoma, squamous cell carcinoma, Merkel cell carcinoma, adnexal tumor, and pyogenic granuloma.
Case Report
On physical examination, the lesions appeared erosive with crusting and granulation tissue (Figure 1A). The presentation was consistent with erosive pustular dermatosis of the scalp. Biopsy revealed granulation tissue. The patient underwent PDT and prednisone treatment with improvement. Additional biopsies revealed AKs. His condition improved with 2 PDT sessions but never fully cleared. During the PDT sessions, the patient reported intense unilateral headaches without visual changes. The headaches were intermittent and not apparently related to the treatments. He was referred for a temporal artery biopsy and rebiopsy of the remaining lesion on the scalp. The temporal artery biopsy was negative. The lesion that remained was a large nodule on the vertex scalp, and biopsy revealed AFX.
Immunohistochemical marker studies for S-100 and cytokeratin were negative. Invasion into subcutaneous fat was encountered (Figure 2A). Highly atypical spindle cells and mitoses were present (Figure 2B). Neoplastic cells were noted adjacent to nerve (Figure 2C). Excision of the lesion was curative, and his symptoms of pain and erosive pustular dermatosis resolved weeks thereafter (Figure 1B). The area of erosive pustular dermatosis was not excised, but symptoms resolved weeks following excision of the AFX.
Comment
Our case of AFX is unique due to the patient’s atypical presentation of severe pain. Because AFX usually presents asymptomatically, pain is an uncommon symptom. Based on the histologic findings in our case, we suspected that neural involvement of the tumor most likely explained the intense pain that our patient experienced.
The presence of erosive pustular dermatosis of the scalp also is interesting in our case. This elderly man had an extensive history of actinic damage and had reported pustules, scaling, itching, and scabbing of the scalp. It is possible that erosive pustular dermatosis was superimposed over the tumor and could have been the reason that multiple biopsies were needed to eventually arrive at a diagnosis. The coexistence of the 2 entities suggests that the chronic actinic damage played a role in the etiology of both.
Classification
There is a question regarding nomenclature when discussing AFX. Atypical fibroxanthoma has been referred to as a variant of undifferentiated pleomorphic sarcoma, which is a type of soft tissue sarcoma. Atypical fibroxanthoma can be referred to as undifferentiated pleomorphic sarcoma if it is more than 2 cm in diameter, if it involves the fascia or subcutaneous tissue, or if there is evidence of necrosis.3 Atypical fibroxanthoma generally is confined to the head and neck region and usually is less than 2 cm in diameter. In this patient, the presentation was consistent with AFX, as there was evidence of necrosis and invasion into the subcutaneous fat. The fact that the lesion also appeared on the scalp further supported the diagnosis of AFX.
Pathology
Biopsy of AFX typically reveals a spindle cell proliferation that usually arises in the setting of profound actinic damage. The epidermis may or may not be ulcerated, and in most cases, it is seen in close proximity to the overlying epidermis but not arising from it.8 Classic AFX is composed of highly atypical histiocytelike (epithelioid) cells admixed with pleomorphic spindle cells and giant cells, all showing frequent mitoses including atypical ones.9 Several histologic subtypes of AFX have been described, including clear cell, granular cell, pigmented cell, chondroid, osteoid, osteoclastic, and the most common spindle cell subtype.9 Features that indicate potential aggressive behavior include infiltration into the subcutaneous tissue, vascular invasion, and presence of necrosis. A diagnosis of AFX is made by exclusion of other malignant neoplasms with similar morphology, namely spindle cell squamous cell carcinoma, spindle cell melanoma, and leiomyoscarcoma.9 As such, immunohistochemistry plays a critical role in distinguishing these lesions, as they arise as part of the differential diagnosis. A panel of immunohistochemical stains is helpful for diagnosis and commonly includes but is not limited to S-100, Melan-A, smooth muscle actin, desmin, and cytokeratin.
Sampling error is an inherent flaw in any biopsy specimen. The eventual diagnosis of AFX in our case supports the argument for multiple biopsies of an unknown lesion, seeing as the affected area was interpreted as both granulation tissue and AK prior to the eventual diagnosis. Repeat biopsies, especially if a lesion is nonhealing, often can help clinicians arrive at a definitive diagnosis.
Treatment
Different treatment options have been used to manage AFX. Mohs micrographic surgery is most often used because of its tissue-sparing potential, often giving the most cosmetically appealing result. Wide local excision is another surgical technique utilized, generally with fixed margins of at least 1 cm.10 Radiation at the tumor site is used as a treatment method but most often during cases of reoccurrence. Cryotherapy as well as electrodesiccation and curettage are possible treatment options but are not the standard of care.
- Helwig EB. Atypical fibroxanthoma, in tumor seminar. proceedings of 18th Annual Seminar of San Antonio Society of Pathologists, 1961. Tex State J Med. 1963;59:664-667.
- Anderson HL, Joseph AK. A pilot feasibility study of a rare skin tumor database. Dermatol Surg. 2007;33:693-696.
- Iorizzo LJ 3rd, Brown MD. Atypical fibroxanthoma: a review of the literature. Dermatol Surg. 2011;37:146-157.
- Fretzin DF, Helwig EB. Atypical fibroxanthoma of the skin. a clinicopathologic study of 140 cases. Cancer. 1973;31:1541-1552.
- Vandergriff TW, Reed JA, Orengo IF. An unusual presentation of atypical fibroxanthoma. Dermatol Online J. 2008;14:6.
- Weedon D, Kerr JF. Atypical fibroxanthoma of skin: an electron microscope study. Pathology. 1975;7:173-177.
- Woyke S, Domagala W, Olszewski W, et al. Pseudosarcoma of the skin. an electron microscopic study and comparison with the fine structure of spindle-cell variant of squamous carcinoma. Cancer. 1974;33:970-980.
- Edward S, Yung A. Essential Dermatopathology. Philadelphia, PA: Lippincott Williams & Wilkins; 2012.
- Luzar B, Calonje E. Morphologic and immunohistochemical characteristics of atypical fibroxanthoma with a special emphasis on potential diagnostic pitfalls: a review. J Cutan Pathol. 2010;37:301-309.
- González-García R, Nam-Cha SH, Muñoz-Guerra MF, et al. Atypical fibroxanthoma of the head and neck: report of 5 cases. J Oral Maxillofac Surg. 2007;65:526-531.
Practice Points
- Atypical fibroxanthoma predominantly occurs in older men on the head and neck.
- Erosive pustular dermatosis may be a benign entity, but if it does not resolve, continue to rebiopsy, as rare tumors may mimic this condition.
Clinicians: Be clear about flu vaccine’s value
WASHINGTON – Flu vaccination rates remain below the 70% Healthy People 2020 goal for most of the U.S. population, but data show that a recommendation from a clinician can encourage individuals to get vaccinated and to vaccinate their children, according to a panel of experts who spoke at a press briefing sponsored by the National Foundation for Infectious Diseases.
“Annual vaccination is our first line of defense against the flu,” William Schaffner, MD, of Vanderbilt University, Nashville, Tenn., said at the briefing. The unpredictable nature of the flu makes annual vaccination even more important – and the earlier, the better, said Dr. Schaffner. “If you have seen one flu season, you have seen ... one flu season.”
In a video interview at the briefing, experts emphasized the safety and effectiveness of the flu vaccine for a range of populations, including children, pregnant women, and older adults. And they offered tips to convince patients of the importance of vaccination, as well as the need to make sure health care staff are protected.
Briefing participants included former Department of Health and Human Services Secretary Thomas A. Price, MD; Patricia A. Stinchfield, RN, MS, CPNP, CIC of Children’s Hospitals and Clinics of Minnesota, St. Paul; Kathleen M. Neuzil, MD, of the University of Maryland; and Daniel B. Jernigan, MD, of the Centers for Disease Control and Prevention.
The clinicians interviewed had no financial conflicts to disclose.
AT A PRESS BRIEFING BY THE NATIONAL FOUNDATION FOR INFECTIOUS DISEASES

Deep brain stimulation shows promise in treating Tourette syndrome
Deep brain stimulation (DBS) showed promise in improving tic severity in patients with Tourette syndrome in a prospective, open-label registry study, but the treatment was associated with adverse events in a substantial number of patients.
“The first-year results of this multinational electronic collaboration strengthen the notion that DBS could be a potential surgical treatment for select patients with Tourette syndrome,” Daniel Martinez-Ramirez, MD, of the University of Florida, Gainesville, and his colleagues wrote in their study published online Jan. 16 in JAMA Neurology. “Practitioners should be aware of the high number of stimulation-related adverse events and that these are likely reversible.”
The research team studied data from 185 patients with bilateral Tourette syndrome in 10 countries who had undergone DBS implantation between Jan. 1, 2012, and Dec. 31, 2016, and found that DBS significantly improved the Yale Global Tic Severity Scale scores of patients in the study for both motor and phonic tics. Mean motor tic scores improved 38.2% at 6 months, compared with baseline, and 38.5% at 12 months. A similar effect was observed for phonic tic scores, with improvements of 44.2% and 42.7% at 6 and 12 months, compared with baseline, respectively. While there was slight variation between the 6- and 12-month follow-ups for both phonic and motor tic scores, these changes were not statistically significant.
Despite the improvement of Yale Global Tic Severity Scale scores, adverse events were prevalent among patients in the study. Of 158 patients, 56 (35.4%) reported a total of 160 adverse events during the first follow-up year. Of those events reported, 48 (30.8%) were stimulation related, while 6 (3.8%) were surgically related, and 2 (1.3%) were related to issues with the device. The most common adverse events were dysarthria, reported by 10 patients (6.3%), and paresthesias, reported by 13 patients (8.2%). These events were not permanent and did not involve any major complications.
There are a number of limitations when using data from a multinational registry and database, according to the authors. Using information from different sites may affect results because surgical and treatment techniques may differ by location. Additionally, the lack of standardized inclusion criteria for the registry may have affected the results.
Despite the study’s limitations and the adverse events were observed, DBS still appeared effective in improving motor and phonic tics in Tourette syndrome patients. With these results, Dr. Martinez-Ramirez and his associates recommended what needs to be done to further research into DBS.
“Larger numbers of patients will need to receive DBS implants across multiple targets, and comparison of center-to-center outcomes could help refine the therapy,” they wrote. “Publishing multiyear outcomes to a public website (https://tourettedeepbrainstimulationregistry.ese.ufhealth.org) will improve access to information, improve data sharing, and, we hope, contribute to improvement in outcomes.”
Two investigators reported receiving grants from various pharmaceutical companies, government agencies, and foundations. Both also served as consultants to major pharmaceutical companies. All other researchers had no relevant financial conflicts to disclose.
SOURCE: Martinez-Ramirez D et al. JAMA Neurol. 2018 Jan 16. doi: 10.1001/jamaneurol.2017.4317.
FROM JAMA NEUROLOGY
Key clinical point: Deep brain stimulation improved motor and phonic tics in Tourette syndrome patients but may come with a substantial number of reversible adverse events.
Major finding: At a 6-month follow-up, motor and phonic Yale Global Tic Severity Scale scores improved 38.2% and 44.2%, respectively.
Study details: Analysis of 185 patients with medically refractory Tourette syndrome who underwent deep brain stimulation implantation between Jan. 1, 2012, and Dec. 31, 2016, at 31 sites in 10 countries.
Disclosures: Two investigators reported receiving grants from various pharmaceutical companies, government agencies, and foundations. Both also served as consultants to major pharmaceutical companies. All other researchers reported no relevant financial disclosures.
Source: Martinez-Ramirez D et al. JAMA Neurol. 2018 Jan 16. doi: 10.1001/jamaneurol.2017.4317.
Swedish study finds low risk of developing psoriasis in bariatric surgery patients
Obese patients who undergo bariatric surgery have a lower risk of later developing psoriasis, according to results of nonrandomized, longitudinal intervention trial.
Cristina Maglio, MD, of the University of Gothenburg, Sweden, and her associates found that over a 26-year follow-up period, the adjusted hazard ratio (HR) of developing psoriasis was 0.65 (95% confidence interval [CI], 0.47-0.89; P = .008) for patients who underwent bariatric surgery, compared with those who received conventional, nonsurgical obesity treatments. Psoriasis developed in 3.6% of 1,991 patients in the surgery group during follow-up and in 5.1% of 2,018 control patients during follow-up.
Conversely, the difference in the risk of developing psoriatic arthritis (PsA), experienced by up to one-third of patients with psoriasis, was not statistically significant (HR, 0.77; 95% CI, 0.43-1.37; P = .287). PsA developed in 1% of subjects from the surgery group and 1.3% from the control group.
To understand how surgery affected the development of psoriasis or psoriatic arthritis, the researchers conducted a trial with a control group and surgery group. In the control group, 2,018 patients received standard obesity treatments that included recommendations on eating behavior, food selection, and physical activity. The 1,991 patients in the surgery group underwent gastric banding (375), vertical banded gastroplasty (1,354), or gastric bypass (262). At the start of the study, patients were evaluated for baseline measurements, then again at 6 months. After the 6-month mark, patients were reevaluated at 1, 2, 3, 4, 6, 8, 10, 15, and 20 years, respectively. All study participants, regardless of trial group, were examined and presented patient health questionnaires at each follow-up. The endpoint for this study was the first diagnosis of either psoriasis or PsA. Body mass index decreased significantly in the surgery group, compared with virtually no change in the control group.
Vertical banded gastroplasty was found to significantly lower the incidence of psoriasis, compared with usual treatment. But using gastric banding as a reference, vertical banded gastroplasty (HR, 0.80; 95% CI, 0.46-1.39; P = .418) and gastric bypass (HR, 0.71; 95% CI, 0.29-1.71; P = 0.439) were found to have similar effects on the prevention of psoriasis.
The researchers also identified several risk factors that significantly increased the risk of developing psoriasis. Smoking (HR, 1.75; 95% CI, 1.26-2.42; P = .001), a known risk factor in the development of psoriasis, and the length of time a patient had been obese (HR, 1.28; 95% CI, 1.05-1.55; P = .014) were found to be independently associated with an increased risk of psoriasis.
As part of their risk analysis, Dr. Maglio and her colleagues analyzed the interactions of baseline risk factors such as BMI and obesity duration with the bariatric surgery. This analysis found no significant interactions between baseline risk factors and bariatric surgery. It did reveal that patients who were older at baseline evaluation had slightly better responses to bariatric surgery with lower incidences of psoriasis, compared with younger patients, but the differences were not statistically significant.
“The preventive role of bariatric surgery on the risk of psoriasis has been recently highlighted by a retrospective Danish study (JAMA Surg. 2017 Apr 1;152[4]:344-9),” noted Dr. Maglio and her colleagues. “However, we lent strength to the previous results by confirming this association in a large prospective intervention trial designed to examine the effect of bariatric surgery on obesity-related comorbidities in comparison with usual obesity care.
This study was funded in part by the National Institutes of Diabetes and Digestive and Kidney Diseases, the Swedish Rheumatism association, the Swedish Research Council, the University of Gothenburg, and the Swedish federal government. Dr. Anna Rudin reported that part of her salary at Sahlgrenska University is supported by a grant from AstraZeneca. Dr. Lena M.S. Carlsson has received lecture fees from AstraZeneca, Johnson & Johnson, and Merck Sharp and Dohme. Dr. Maglio and Dr. Markku Peltonen had no relevant financial disclosures.
SOURCE: Maglio et al. Obesity. 2017. Dec; 25[12]:2068-73.
FROM OBESITY
Key clinical point:
Major finding: Obese patients who underwent bariatric surgery had a lower incidence of psoriasis over a 26-year period (HR, 0.65; 95% CI: 0.47-0.89; P = .008), compared with usual care.
Study details: Swedish Obese Subjects study, a longitudinal, nonrandomized intervention trial comprising 1,991 surgery group patients and 2,018 control patients.
Disclosures: This study was funded in part by the National Institutes of Diabetes and Digestive and Kidney Diseases, the Swedish Rheumatism association, the Swedish Research Council, the University of Gothenburg, and the Swedish federal government. Dr. Anna Rudin reported that part of her salary at Sahlgrenska University is supported by a grant from AstraZeneca. Dr. Lena M.S. Carlsson has received lecture fees from AstraZeneca, Johnson & Johnson, and Merck Sharp and Dohme. Dr. Maglio and Dr. Markku Peltonen had no relevant financial disclosures.
Source: Maglio et al. Obesity. 2017. Dec; 25[12]:2068-2073.
Early start to puberty increases likelihood of depression in girls
, a prospective study found
“Earlier pubertal timing in girls is often accompanied by distinct rises in the prevalence, severity, and onset of psychopathology,” wrote Jane Mendle, PhD, of Cornell University, Ithaca, N.Y., and her associates. “It is difficult to know whether, when, and on what processes to intervene if we cannot establish how much pubertal timing matters for well-being later in life.”
Patients were evaluated in four waves, with average ages of 15.8 years, 16.1 years, 21.7 years, and 28.7 years for waves one through four, respectively.
Symptoms for depression and antisocial behavior were evaluated using the Center for Epidemiologic Studies Depression Scale, a self-reported survey, and a self-reported questionnaire on recent antisocial behaviors including theft, property damage, and selling drugs. The youngest girls also were asked about running away from home, lying to parents, shoplifting, and driving a car without the owner’s permission, while the oldest participants were asked about deliberately writing a bad check, using someone else’s debit card without permission, and buying or selling stolen property. Those participating were mostly white (66%) and on average experienced menarche at age 12 years.
Older age at menarche was significantly associated with lower levels of symptoms of depression (b = –0.87, P less than .05), when data were analyzed in a proximal influences model.
“To illustrate, a girl who reached menarche at age 10 years (approximately 2 years earlier than the mean) would have depressive symptoms 8% of 1 SD [standard deviation] greater in adolescence, whereas a girl who reached menarche at age 8 years would have depressive symptoms 25% of 1 SD greater,” the investigators wrote.
A linear and quadratic association between early menarche and depressive symptoms persisted as patients reached their 30s, suggesting girls who matured earlier are more likely to display symptoms of depression as an adult because they became depressed as teenagers and they remain vulnerable, Dr. Mendle and her colleagues reported.
Early maturation also was associated with a higher frequency of antisocial behavior in both proximal (b = –.009, P less than .05) and lingering (b = –0.02, P less than .05) models.
Dr. Mendle and her colleagues found the gap in antisocial activity between those who matured early and those who did not was more pronounced in adulthood than adolescence, and the effects of antisocial behavior were smaller than the effects of depressive symptoms.
The investigators said they were limited by an incomplete understanding of why these longitudinal effects continue. Also, because they used age at menarche as an indicator of pubertal timing, the investigators said they could not capture the social, emotional, or hormonal processes present earlier in puberty.
“Results from the current study suggest that girls who experienced earlier menarche continued to report elevated psychopathology in early-to-middle adulthood even after accounting for demographic and contextual variables commonly associated with vulnerability for mental health. These findings align with the broad body of work linking early puberty with higher psychopathology during adolescence as well as with the few studies showing longer-term associations with mental health in adulthood,” Dr. Mendle and her associates wrote.
“Understanding the longevity of these associations offers new challenges to researchers, [and] practical information for pediatricians and adolescent health care providers, and highlights that the emotional sequelae of puberty may endure well past the proximal period of adolescence,” they concluded. There also may be other disorders beyond depression and antisocial behavior associated with early puberty, which should be explored.
This study was funded by the National Institutes of Health. The investigators reported no relevant financial disclosures.
SOURCE: Mendle J et al. Pediatrics. 2017 Dec 26. doi: 10.1542/peds.2017-1703.
Puberty is a complex time for teenagers, especially young girls, and biological factors and chronic stress such as early childhood abuse or neglect can lead to the early onset of puberty, and subsequently depression and antisocial behavior. A link between obesity and an early start to puberty has been established in previous studies as well.
Adding poor body image and possible bullying to the stresses of puberty can create an increased risk for mental health problems. There are also the added pressures of looking older physically, but socially not having matured enough; young girls may seek out friends who are older than them to fit in with peers who look like them, and then feel pressured to engage in risky activities to fit in.
It is important for us as pediatricians to intervene when these situations arise. Having a thorough history of trauma when counseling patients on their pubescent time line can be essential. Screen for depression and antisocial behavior in girls with early puberty, and refer to developmentally appropriate community and mental health resources for additional support if necessary. Talk with parents about close monitoring of friend groups and about encouraging their children to spend time with age-appropriate friends. Our mission is to guide children and adolescents into healthy adulthood.
Ellen Selkie, MD, MPH, is an adolescent medicine specialist at the University of Michigan, Ann Arbor. She commented on the article by Mendle et al. in an accompanying editorial (Pediatrics. 2017 Jan 1. doi: 10.1542/peds.2017-3460 .) She had no relevant financial disclosures.
, a prospective study found
“Earlier pubertal timing in girls is often accompanied by distinct rises in the prevalence, severity, and onset of psychopathology,” wrote Jane Mendle, PhD, of Cornell University, Ithaca, N.Y., and her associates. “It is difficult to know whether, when, and on what processes to intervene if we cannot establish how much pubertal timing matters for well-being later in life.”
Patients were evaluated in four waves, with average ages of 15.8 years, 16.1 years, 21.7 years, and 28.7 years for waves one through four, respectively.
Symptoms for depression and antisocial behavior were evaluated using the Center for Epidemiologic Studies Depression Scale, a self-reported survey, and a self-reported questionnaire on recent antisocial behaviors including theft, property damage, and selling drugs. The youngest girls also were asked about running away from home, lying to parents, shoplifting, and driving a car without the owner’s permission, while the oldest participants were asked about deliberately writing a bad check, using someone else’s debit card without permission, and buying or selling stolen property. Those participating were mostly white (66%) and on average experienced menarche at age 12 years.
Older age at menarche was significantly associated with lower levels of symptoms of depression (b = –0.87, P less than .05), when data were analyzed in a proximal influences model.
“To illustrate, a girl who reached menarche at age 10 years (approximately 2 years earlier than the mean) would have depressive symptoms 8% of 1 SD [standard deviation] greater in adolescence, whereas a girl who reached menarche at age 8 years would have depressive symptoms 25% of 1 SD greater,” the investigators wrote.
A linear and quadratic association between early menarche and depressive symptoms persisted as patients reached their 30s, suggesting girls who matured earlier are more likely to display symptoms of depression as an adult because they became depressed as teenagers and they remain vulnerable, Dr. Mendle and her colleagues reported.
Early maturation also was associated with a higher frequency of antisocial behavior in both proximal (b = –.009, P less than .05) and lingering (b = –0.02, P less than .05) models.
Dr. Mendle and her colleagues found the gap in antisocial activity between those who matured early and those who did not was more pronounced in adulthood than adolescence, and the effects of antisocial behavior were smaller than the effects of depressive symptoms.
The investigators said they were limited by an incomplete understanding of why these longitudinal effects continue. Also, because they used age at menarche as an indicator of pubertal timing, the investigators said they could not capture the social, emotional, or hormonal processes present earlier in puberty.
“Results from the current study suggest that girls who experienced earlier menarche continued to report elevated psychopathology in early-to-middle adulthood even after accounting for demographic and contextual variables commonly associated with vulnerability for mental health. These findings align with the broad body of work linking early puberty with higher psychopathology during adolescence as well as with the few studies showing longer-term associations with mental health in adulthood,” Dr. Mendle and her associates wrote.
“Understanding the longevity of these associations offers new challenges to researchers, [and] practical information for pediatricians and adolescent health care providers, and highlights that the emotional sequelae of puberty may endure well past the proximal period of adolescence,” they concluded. There also may be other disorders beyond depression and antisocial behavior associated with early puberty, which should be explored.
This study was funded by the National Institutes of Health. The investigators reported no relevant financial disclosures.
SOURCE: Mendle J et al. Pediatrics. 2017 Dec 26. doi: 10.1542/peds.2017-1703.
FROM PEDIATRICS
Key clinical point: Girls who start puberty earlier are more likely to develop depression or antisocial behavior.
Major finding: Patients who reached menarche at 8 years of age showed depressive symptoms 25% of 1 standard deviation greater than those at 12 years of age.
Study details: A prospective study of 7,802 women gathered from the National Longitudinal Study of Adolescent Health between 1994 and 2008.
Disclosures: The investigators reported no relevant financial disclosures. This study was funded by the National Institutes of Health.Source: Mendle J et al. Pediatrics. 2017 Dec 26. doi: 10.1542/peds.2017-1703.

The cost of leadership
Do you practice as a team member? How is your team defined? Is it made up solely of physicians? Does it include mid-level providers? Does it extend to mental health and social service providers in your office? Do you consider nonproviders such as receptionists as team members? Do you consider the whole office “your team”? Or, is it a smaller team with just yourself and one or two other physicians along with a mid-level provider or two?
There has been a lot written about primary care teams as a natural consequence of the medical home model. In an article in AAP News, Gonzalo J. Paz-Soldán, MD, a member of the American Academy of Pediatrics Council on Community Pediatrics and regional executive medical director, pediatrics, at Reliant Medical Group, Worcester, Mass., suggests that pediatricians should be taking on leadership roles in directing these teams. He claims that in addition to improving the “quality, value, patient experience,” our leadership also will benefit “provider and staff wellness and engagement.” In other words, taking charge will return the joy of pediatrics, and make us more resilient in the face of burnout.
It’s hard to argue with the notion that having more control improves our chances of satisfaction. Most of us who owned and ran our own small practices will tell you that when we were captains of the ship, those were our most rewarding and productive years.
However, assuming a leadership in a large multilevel team of providers and support staff is another story. As Dr. Paz-Soldán observes, most of us were not trained for leadership roles. I would add that the path to medical school does not select for those skills or interest. In addition to requiring a certain set of skill and aptitudes that we may not have, leadership demands a substantial time commitment.
Leading means attending what are often poorly conceived meetings (the topic for a future Letters from Maine), and receiving and writing emails – none of which involve actually taking care of patients. Like it or not, the ugly truth is that seeing patients is what generates our bottom lines. Time spent going to meetings and communicating with your teams members cannot be considered “billable hours.”
So here is our dilemma: Do we abandon the solo and small group practice model, sell out to large entities, lose control of our professional destiny, and spend our time grousing about it? Or
There are a few saintly and gifted physicians who have the skills, energy, and commitment to become leaders and still spend enough time seeing patients to satisfy both their emotional and financial professional needs. However, in my experience, when physicians move into leadership roles, the additional responsibilities cannibalize their commitment to patient care and the skills that made them talented physicians.

Given my aversion to meetings and my disinterest in organization on a large scale, I think if I were a college student considering a career taking care of children, I would take a hard look at becoming a nurse practitioner or physician’s assistant. I might not make as much money, nor would my parents be able to introduce me as their “son the doctor.” But I would be content spending more time doing what I enjoyed.
Dr. Wilkoff practiced primary care pediatrics in Brunswick, Maine, for nearly 40 years. He has authored several books on behavioral pediatrics, including “How to Say No to Your Toddler.” Email him at [email protected].
Do you practice as a team member? How is your team defined? Is it made up solely of physicians? Does it include mid-level providers? Does it extend to mental health and social service providers in your office? Do you consider nonproviders such as receptionists as team members? Do you consider the whole office “your team”? Or, is it a smaller team with just yourself and one or two other physicians along with a mid-level provider or two?
There has been a lot written about primary care teams as a natural consequence of the medical home model. In an article in AAP News, Gonzalo J. Paz-Soldán, MD, a member of the American Academy of Pediatrics Council on Community Pediatrics and regional executive medical director, pediatrics, at Reliant Medical Group, Worcester, Mass., suggests that pediatricians should be taking on leadership roles in directing these teams. He claims that in addition to improving the “quality, value, patient experience,” our leadership also will benefit “provider and staff wellness and engagement.” In other words, taking charge will return the joy of pediatrics, and make us more resilient in the face of burnout.
It’s hard to argue with the notion that having more control improves our chances of satisfaction. Most of us who owned and ran our own small practices will tell you that when we were captains of the ship, those were our most rewarding and productive years.
However, assuming a leadership in a large multilevel team of providers and support staff is another story. As Dr. Paz-Soldán observes, most of us were not trained for leadership roles. I would add that the path to medical school does not select for those skills or interest. In addition to requiring a certain set of skill and aptitudes that we may not have, leadership demands a substantial time commitment.
Leading means attending what are often poorly conceived meetings (the topic for a future Letters from Maine), and receiving and writing emails – none of which involve actually taking care of patients. Like it or not, the ugly truth is that seeing patients is what generates our bottom lines. Time spent going to meetings and communicating with your teams members cannot be considered “billable hours.”
So here is our dilemma: Do we abandon the solo and small group practice model, sell out to large entities, lose control of our professional destiny, and spend our time grousing about it? Or
There are a few saintly and gifted physicians who have the skills, energy, and commitment to become leaders and still spend enough time seeing patients to satisfy both their emotional and financial professional needs. However, in my experience, when physicians move into leadership roles, the additional responsibilities cannibalize their commitment to patient care and the skills that made them talented physicians.
Given my aversion to meetings and my disinterest in organization on a large scale, I think if I were a college student considering a career taking care of children, I would take a hard look at becoming a nurse practitioner or physician’s assistant. I might not make as much money, nor would my parents be able to introduce me as their “son the doctor.” But I would be content spending more time doing what I enjoyed.
Dr. Wilkoff practiced primary care pediatrics in Brunswick, Maine, for nearly 40 years. He has authored several books on behavioral pediatrics, including “How to Say No to Your Toddler.” Email him at [email protected].
Long-term specialist care reduces post-RYGB anemia risk
Patients who underwent Roux-en-Y gastric bypass surgery (RYGB) without long-term bariatric specialist follow-up experienced a significantly higher rate of anemia at 10 years than did patients who had such specialist follow-up, according to findings from a database review.
Among 74 patients available for analysis – 58 men and 16 women with a mean age of 51 years who underwent RYGB at a single Veterans Affairs medical center between 2002 and 2006 – the mean rate of preoperative anemia was 20% (15 patients). The rate increased to 28% (21 patients) at 1 year, 31% (23 patients) at 5 years, and 47% (35 patients) at 10 years, according to a research letter by Gao Linda Chen, MD, and her colleagues in the surgical service of the VA Palo Alto (Calif.) Health Care System (JAMA Surg. 2017. Sep 20. doi: 10.1001/jamasurg.2017.3158).
Among 58 patients with no bariatric specialist follow-up after 5 years, the anemia rate increased from 22% (13 patients) before surgery to 57% (33 patients) at 10 years, while the corresponding rates for those with specialty follow-up were 19% (3 patients) and 13% (2 patients). After adjustment for preoperative anemia, those without specialist follow-up had significantly higher odds of anemia at 10 years (odds ratio, 6.1).
“Long-term complications of RYGB, such as anemia, may go unrecognized by nonbariatric specialists,” the investigators wrote, noting that the high rates of anemia at 10 years “may reflect a mixed vitamin and mineral deficiency, because patients had normocytic anemia.
“Our study suggests that follow-up with bariatric specialists more than 5 years after surgery, rather than with specialists with no bariatric expertise, can decrease long-term anemia risk,” they continued. “This finding may demonstrate the bariatric specialist’s specific understanding of the long-term risk for nutritional deficiency after RYGB and the importance of vitamin and mineral supplementation.”
The findings suggest a bariatric team approach with planning for long-term follow-up. “We implemented a hub-and-spoke model for bariatric care, including health care specialist education, in which the bariatric team communicates regularly with the patient’s primary care clinician before and after surgery.”
Although the study is limited by small sample size, the findings nevertheless underscore that “long-term follow-up should be an integral part of bariatric programs, and additional studies are needed to identify potential barriers to successful follow-up,” they concluded.
The authors reported having no disclosures.
FROM JAMA SURGERY
Key clinical point:
Major finding: RYGB patients without specialist follow-up had significantly higher odds of anemia at 10 years (adjusted odds ratio, 6.1).
Data source: A retrospective review of 74 patients from a prospective 10-year database.
Disclosures: The authors reported having no disclosures.
Pediatric Dermatology Consult - October 2017
Pyogenic granuloma
BY ALLISON HAN AND LAWRENCE F. EICHENFIELD, MD
Frontline Medical News
Pyogenic granuloma (PG), also known as lobular capillary hemangioma, is a benign, acquired vascular neoplasm of the skin and mucous membranes, and is fairly commonly found in children.1 Though most variants are superficial, PGs rarely may be discovered in subcutaneous, dermal, or satellite locations as well.2 Despite its name, no infectious or granulomatous disorder association with the vascular tumor has been discovered.
PGs are characterized by small, erythematous to purple papules that rapidly grow to become pedunculated or sessile within weeks, and then stabilize. They may bleed profusely because of their friable vascular nature, ulcerate, and crust.3 They rarely resolve on their own, thus, removal frequently is sought.4 PGs most commonly develop on the head and neck, and slightly less commonly on the fingers, periungual areas, upper extremities, lips, gingiva, and conjunctiva. Most PGs grow to about 1 to 10 mm.5
Histologically, PGs are organized in a characteristic lobular pattern of hyperplastic capillary clusters after which they are named (lobular capillary hemangioma). Fibrous bands separate the lobules. Mitotic activity is often seen, likely reflecting the rapid growth of the tumor.2 Immunohistochemistry staining is notably negative for glucose transporter 1 (GLUT-1), unlike hemangiomas, which aids in differentiating the two lesions.6
The pathogenesis of PGs is poorly understood; some hypothesize that a traumatic event, such as an insect bite, may trigger aberrant overgrowth of granulation tissue, but this theory is contested as many PGs appear to arise de novo.5 PGs have a tendency to develop within vascular lesions, suggesting an angiogenic stimuli of development, and increased expression of angiogenic growth factors (vascular endothelial growth factor and mitogen-activated protein kinase pathways) have been found in PGs.7,8
PGs also arise frequently during pregnancy and resolve after childbirth, leading many to support a causal role of estrogen in PG development. A link between both steroid hormone and angiogenesis may exist, as a beta isoform of estrogen receptor has been discovered to have consistent expression in a variety of vascular proliferations, possibly underlying PG pathogenesis.2
Drug-induced cases of PGs have been reported as well, with use of systemic medications such as acitretin, human immunodeficiency virus protease inhibitors, and epidermal growth factor receptor inhibitors.9
Diagnosis and differential
The diagnosis of PGs is based on the characteristic history of a rapidly growing, red to purple nodule that frequently bleeds and often ulcerates, accompanied by the physical findings of a typical exophytic, friable, vascular lesion. Patients often present with the “band aid sign,” an irritated portion of skin from the adhesive of bandages worn to protect the bleeding lesion.
The classic history of profuse and recurrent bleeding with little agitation often enables differentiation of PG from other disorders. In young infants, PGs may look similar to infantile hemangiomas, however hemangiomas regress and involute spontaneously unlike PGs.10 Other disorders that may be differentiated from PGs by history include Spitz nevi, glomus tumors, and warts. Melanoma in children may be amelanotic and present as red papules or nodules as well.11 An association between Bartonella infection and PGs had been questioned in the past because of reported increased rates of Bartonella seropositivity in patients, but this has since been debunked.12
Treatment
Almost all PGs undergo treatment; 85%-90% of PGs are treated by localized numbing, followed by superficial excision and electrodessication of the base.13 This technique allows the PG to be removed in less than 5 minutes and avoids suture use. Alternative treatments include surgical excision, pulsed dye laser, cryotherapy with liquid nitrogen, timolol solution, imiquimod, or a combination of methods.3,4,5 Methods that produce tissue for histopathologic analysis are ideal to rule out malignancy or other lesions that may mimic PGs such as Spitz nevi. Pulsed dye laser offers low recurrence, but often requires multiple treatments, and young children may not tolerate the treatment well. Cryotherapy has few side effects, but has higher recurrence rates and requires multiple treatment sessions.14
Dr. Eichenfield is chief of pediatric and adolescent dermatology at Rady Children’s Hospital-San Diego, as well as vice chair of the department of dermatology and professor of dermatology and pediatrics at the University of California, San Diego. Allison Han is a medical student at the university. Neither Dr. Eichenfield nor Ms. Han have any relevant financial disclosures. Email them at [email protected].
References
1. Br J Dermatol. 2014;171(3):466-73.
2. Am J Dermatopathol. 2007;29(4):408-11.
3. J Plast Reconstr Aesthet Surg. 2011;64(9):1216-20.
4. Br J Dermatol. 2014;171(6):1537-8.
5. Pediatr Dermatol. 2004;21(1):10-3.
6. Pediatr Dermatol. 2009;26(3):323-7.
7. J Am Acad Dermatol. 2000;42(2 Pt 1):275-9.
8. J Am Acad Dermatol. 2001;44(2):193-7.
9. Br J Dermatol. 2010;163(5):941-53.
10. Pediatrics. 1992;90(6):989-91.
11. J Am Acad Dermatol. 2013;68(6):913-25.
12. J Am Acad Dermatol. 2005;53(6):1065-6.
13. “Hurwitz Clinical Pediatric Dermatology,” 4th Edition: A Textbook of Skin Disorders of Childhood and Adolescence (New York: Elsevier Health Sciences, 2011).
14. Dermatol Surg. 2013;39(8):1137-46.
A 7-year-old healthy female presents to the dermatology clinic for evaluation of a bump on her lower lip that has been present for 3 months. It started as a small red papule and within a couple months rapidly increased in size, but now has stabilized. She denies pain and itching, but she notes that it frequently bleeds, and that the bleeding can be difficult to stop. She denies any trauma to the area. Review of systems was otherwise negative.
On examination, the patient is a well-developed, healthy appearing female. In the middle of her lower lip, there is a 1-cm pedunculated, raspberry-like exophytic nodule. It is reddish-purple with slight ulceration at the surface. There is no active bleeding. The remainder of the physical examination is normal.
Adding bortezomib to R-CHOP didn’t improve survival in diffuse large B-cell lymphoma
, findings from the phase-2 PYRAMID trial showed.
When the proteasome inhibitor bortezomib was combined with rituximab, cyclophosphamide, doxorubicin, vincristine, and prednisone (R-CHOP) in patients with previously untreated non–germinal center B-cell–like (non-GCB) DLBCL, a significant improvement in progression-free survival (PFS) was not observed.
There also was no increase in 2-year PFS among patients treated with the combination of bortezomib plus R-CHOP (VR-CHOP), according to findings from the open-label, randomized study published in the Journal of Clinical Oncology (2017 Sep 1. doi: 10.1200/JCO.2017.73.2784).

“A potential reason for the lack of benefit with VR-CHOP was that only two doses of bortezomib were given per 21-day cycle, whereas the standard schedule for bortezomib in multiple myeloma is four doses per cycle on days 1, 4, 8, and 11,” wrote John P. Leonard, MD, of Weill Cornell Medicine and New York Presbyterian Hospital, New York, and his colleagues. “In this study, treatment duration was limited to six 21-day cycles of R-CHOP.”
The authors noted that previous research has demonstrated the feasibility of using VR-CHOP and similar immunochemotherapy regimens in DLBCL. In the current PYRAMID (Personalized Lymphoma Therapy: Randomized Study of Proteasome Inhibition in Non-GCB DLBCL) phase 2 trial, VR-CHOP was compared with R-CHOP in 206 patients with previously untreated non-GCB DLBCL who were selected by real-time subtyping conducted or confirmed at a central laboratory that used the Hans algorithm.
The cohort was randomized to receive six 21-day cycles of standard R-CHOP alone or R-CHOP plus bortezomib 1.3 mg/m2 intravenously on days 1 and 4, and the primary endpoint was PFS.
The hazard ratio (HR) for PFS was 0.73 (90% confidence interval, 0.43-1.24) and favored VR-CHOP (P = .611), while the median PFS was not reached in either group. At 2 years, PFS was 77.6% with R-CHOP, versus 82.0% with VR-CHOP.
Among patients with high-intermediate/high International Prognostic Index (IPI) risk, those rates were 65.1% with R-CHOP, versus 72.4% with VR-CHOP (HR, 0.67; 90% CI, 0.34-1.29; P = .606). For those patients at low/low-intermediate IPI risk, the rates were 90.0% for R-CHOP, versus 88.9% for VR-CHOP (HR, 0.85; 90% CI, 0.35-2.10; P = .958).
The overall response rate was 98% for R-CHOP patients and 96% for VR-CHOP, with complete response rates of 49% and 56%, respectively.
Time to progression rates at 2 years were 79.8% for R-CHOP, versus 83.0% with VR-CHOP (HR, 0.79; 90% CI, 0.45-1.37; P = .767). While median overall survival was not reached in either arm, the HR for the entire cohort was 0.75 (90% CI, 0.38-1.45; P = .763). Two-year overall survival was 88.4% and 93.0%, respectively.
In the high-intermediate/high IPI score group, 2-year overall survival was 79.2% with R-CHOP, versus 92.1% with VR-CHOP (HR, 0.62; 90% CI, 0.25-1.42; P = .638), and for those with low/low-intermediate IPI risk scores, 97.7% versus 93.8% (HR, 1.02; 90% CI, 0.34-3.27; P = .999).
Millennium Pharmaceuticals supported the study. Dr. Leonard and several of the coauthors reported relationships with industry.
, findings from the phase-2 PYRAMID trial showed.
When the proteasome inhibitor bortezomib was combined with rituximab, cyclophosphamide, doxorubicin, vincristine, and prednisone (R-CHOP) in patients with previously untreated non–germinal center B-cell–like (non-GCB) DLBCL, a significant improvement in progression-free survival (PFS) was not observed.
There also was no increase in 2-year PFS among patients treated with the combination of bortezomib plus R-CHOP (VR-CHOP), according to findings from the open-label, randomized study published in the Journal of Clinical Oncology (2017 Sep 1. doi: 10.1200/JCO.2017.73.2784).
“A potential reason for the lack of benefit with VR-CHOP was that only two doses of bortezomib were given per 21-day cycle, whereas the standard schedule for bortezomib in multiple myeloma is four doses per cycle on days 1, 4, 8, and 11,” wrote John P. Leonard, MD, of Weill Cornell Medicine and New York Presbyterian Hospital, New York, and his colleagues. “In this study, treatment duration was limited to six 21-day cycles of R-CHOP.”
The authors noted that previous research has demonstrated the feasibility of using VR-CHOP and similar immunochemotherapy regimens in DLBCL. In the current PYRAMID (Personalized Lymphoma Therapy: Randomized Study of Proteasome Inhibition in Non-GCB DLBCL) phase 2 trial, VR-CHOP was compared with R-CHOP in 206 patients with previously untreated non-GCB DLBCL who were selected by real-time subtyping conducted or confirmed at a central laboratory that used the Hans algorithm.
The cohort was randomized to receive six 21-day cycles of standard R-CHOP alone or R-CHOP plus bortezomib 1.3 mg/m2 intravenously on days 1 and 4, and the primary endpoint was PFS.
The hazard ratio (HR) for PFS was 0.73 (90% confidence interval, 0.43-1.24) and favored VR-CHOP (P = .611), while the median PFS was not reached in either group. At 2 years, PFS was 77.6% with R-CHOP, versus 82.0% with VR-CHOP.
Among patients with high-intermediate/high International Prognostic Index (IPI) risk, those rates were 65.1% with R-CHOP, versus 72.4% with VR-CHOP (HR, 0.67; 90% CI, 0.34-1.29; P = .606). For those patients at low/low-intermediate IPI risk, the rates were 90.0% for R-CHOP, versus 88.9% for VR-CHOP (HR, 0.85; 90% CI, 0.35-2.10; P = .958).
The overall response rate was 98% for R-CHOP patients and 96% for VR-CHOP, with complete response rates of 49% and 56%, respectively.
Time to progression rates at 2 years were 79.8% for R-CHOP, versus 83.0% with VR-CHOP (HR, 0.79; 90% CI, 0.45-1.37; P = .767). While median overall survival was not reached in either arm, the HR for the entire cohort was 0.75 (90% CI, 0.38-1.45; P = .763). Two-year overall survival was 88.4% and 93.0%, respectively.
In the high-intermediate/high IPI score group, 2-year overall survival was 79.2% with R-CHOP, versus 92.1% with VR-CHOP (HR, 0.62; 90% CI, 0.25-1.42; P = .638), and for those with low/low-intermediate IPI risk scores, 97.7% versus 93.8% (HR, 1.02; 90% CI, 0.34-3.27; P = .999).
Millennium Pharmaceuticals supported the study. Dr. Leonard and several of the coauthors reported relationships with industry.
FROM THE JOURNAL OF CLINICAL ONCOLOGY
Key clinical point: Bortezomib combined with R-CHOP did not improve outcomes significantly in diffuse large B-cell lymphoma.
Major finding: Two-year progression-free survival was 77.6% with R-CHOP, compared with 82.0% with VR-CHOP, a nonsignificant difference.
Data source: An open-label, randomized, phase 2 trial that compared VR-CHOP to R-CHOP in 206 patients with previously untreated non-GCB DLBCL.
Disclosures: Millennium Pharmaceuticals funded the study. Dr. Leonard and several of the coauthors reported relationships with industry.
Proposed MACRA participation threshold gets mixed reviews
Proposed changes to the Quality Payment Program (QPP) – the value-based payment program established by the Medicare Access and CHIP Reauthorization Act (MACRA) – are drawing mixed reactions from physicians.
A key component of the proposed update to the QPP is an expansion of the exemption threshold for the Merit-based Incentive Payment System (MIPS). Currently, physicians are exempt from MIPS if they bill $30,000 or less in Medicare Part B charges or have 100 or fewer Medicare patients. The proposal would increase the number of exempt physicians by raising the threshold to $90,000 or less in Part B charges or 200 or fewer Medicare patients.
Eligible clinicians and group practices that fall below the threshold can still voluntarily submit data, but they will not be scored for their participation in MIPS and will not be eligible for bonuses or face penalties for not meeting goals.
The expanded threshold proposal drew praise from the American Medical Association for exempting many small and rural practices from the requirements, but they also called on the agency to move more quickly in notifying physicians if they fall into the exempt category.
The American College of Surgeons expressed support for the changes to the threshold, adding that going forward the threshold should “be maintained at numbers no lower than that proposed for the 2018 performance period so that providers may have certainty of the criteria and their participation responsibilities from year to year.”
The American College of Cardiology supported the expansion of the low-volume threshold and encouraged the agency to review the levels annually.
But the Association of American Physicians & Surgeons suggested the volume threshold didn’t go far enough. “We ask that CMS consider a further widening of the threshold to all practices with 18 or fewer clinicians,” the group said in its comments on the proposal. “A threshold in terms of billing amounts and the number of patients creates an unhelpful incentive for physicians to turn away Medicare patients in order to qualify for the exemption.”
The group argued that larger practices can better absorb the cost of complying with MACRA regulations and basing participation on billing could create uncertainty due to fluctuations in billing from year-to-year.
Opt in option?
Several other groups sought a pathway for exempt physicians to opt into the program and take advantage of bonuses, especially those who had already prepared for the program based on the lower initial threshold.
“By raising the low-volume threshold and not offering an opt-in ability, CMS is further and needlessly delaying practices from payment based on value over volume, as well as the intent behind the establishment of virtual groups,” the American Academy of Family Physicians wrote in comments to the CMS.
The American Gastroenterological Association voiced its support for expanding the exclusion threshold and supported the idea of an opt-in, but called on the CMS to hold harmless those practices that opted in. “Clinicians and groups opting-in to the QPP should not be subject to negative payment adjustments,” AGA said in its comments to the CMS.
The American Academy of Dermatology Association supports the proposed low-volume threshold and called upon the CMS to allow those who want to participate to create a path to opt into MIPS.
The Endocrine Society supports the expansion of the threshold, but called on the CMS to provide a pathway for those who want to participate if they are otherwise excluded.
The American Osteopathic Association also called for a pathway for exempted physicians to opt in. And they cited two negative effects of expanding the threshold to a wider group of physicians. “First, it will result in wasted resources from practices that prepared for MIPS participation and are now unable to participate,” the association said in comments to the CMS. “Second, it will have the effect of dividing all practices into two levels: those that are incentivized to provide value-based care, and a significant number that are not eligible for such incentives.”
Individuals vs. groups
The American Congress of Obstetricians and Gynecologists (ACOG) supports the proposed threshold for individuals, but suggested changes for groups. “ACOG continues to believe that the threshold should only apply to individual clinicians and that CMS should develop a new, separate definition if the agency believes that groups should also have a low-volume threshold,” ACOG said in comments to the CMS. “Setting the low-volume threshold at both the individual and group level introduces unnecessary complexity into the program because other exclusions for MIPS only apply to individual clinicians.”
The Medical Group Management Association (MGMA), while supporting the general goal of reducing burden on small and solo practices, suggested it needed to be tweaked for the group setting.
“MGMA continues to question CMS’ application of the same threshold at both the clinician and group practice level,” the association said in its comments to the CMS. “This approach significantly disadvantages groups of clinicians who, in the aggregate, rarely care for Medicare patients, but include one or two members that actively participate in the program. MGMA urges CMS to extend its own logic behind setting a group practice equivalent for the non-patient-facing definition by exempting group practices when 75% or more of the national provider identifiers who bill under the group’s tax identification number meet the threshold on an individual basis.”
Expansion goes too far
But the AMGA, which represents group practices, called the new threshold “counterproductive” in its comment letter and suggested that the CMS should be lowering the threshold, not raising it.
AMGA noted that eligible clinicians who do not meet the threshold, but who are providing high-value care as defined by the QPP, are “forced to leave higher reimbursement rates on the table; these could be considerable over time.”
In addition, AMGA said that expanding the exemption decreases the money available for those who are required to participate. The CMS estimates in the proposed rule that in payment year 2019, $1.333 billion would be paid to top performers (including $500 million in exceptional performance bonus payments), but under the newest proposal, that number drops to $673 million (including $500 million in exceptional performance bonus payments). This will translate to a 0.3% bump in payment in 2020.
“The effect of eliminating of two-thirds of eligible clinicians from the MIPS formula is to financially undermine participating clinicians,” AMGA said in comments to the CMS. “They effectively lose by winning.”