User login
Lithium may reduce melanoma risk
Adults with a history of lithium exposure had a 32% lower risk of melanoma than did those who were not exposed in an unadjusted analysis of data from more than 2 million patients.
Microarray gene profiling techniques suggest that Wnt genes, which “encode a family of secreted glycoproteins that activate cellular signaling pathways to control cell differentiation, proliferation, and motility,” may be involved in melanoma development, wrote Maryam M. Asgari, MD, of the department of dermatology at Massachusetts General Hospital and the department of population medicine at Harvard University, both in Boston, and her colleagues. In particular, “transcriptional profiling of melanoma cell lines has suggested that Wnt/beta-catenin signaling regulates a transcriptional signature predictive of less aggressive melanoma,” they wrote.
The psychiatric medication lithium activates the Wnt/beta-catenin signaling pathway and has shown an ability to inhibit the proliferation of melanoma cells in a mouse model, but “to our knowledge, no published epidemiologic studies have examined the association of melanoma risk with lithium exposure,” they wrote.
The researchers reviewed data from the Kaiser Permanente Northern California database of 2,213,848 adult white patients who were members during 1997-2012, which included 11,317 with lithium exposure. They evaluated the association between lithium exposure and both incident melanoma risk and melanoma-associated mortality (J Invest Dermatol. 2017 Oct;137[10]:2087-91.).
Individuals exposed to lithium had a 32% reduced risk of melanoma in an unadjusted analysis; in an adjusted analysis, the reduced risk was 23% and was not significant.
However, there was a significant difference in melanoma incidence per 100,000 person-years in lithium-exposed individuals, compared with unexposed individuals (67.4 vs. 92.5, respectively; P = .027).
Among patients with melanoma, those with exposure to lithium had a lower mortality rate than those not exposed (4.68 vs. 7.21 per 1,000 person-years, respectively), but the sample size for this subgroup was too small to determine statistical significance. In addition, lithium exposure was associated with reduced likelihood of developing skin tumors greater than 4 mm and of presenting with extensive disease. Among those exposed to lithium, none presented with a thick tumor (Breslow depth greater than 4 mm), and none had regional or distant disease when they were diagnosed, compared with 2.8% and 6.3%, respectively, of those not exposed to lithium.
The findings were limited by several factors, including reliance on prescription information to determine lithium exposure, a homogeneous study population, and confounding variables, such as sun exposure behaviors, the researchers noted. However, the large study population adds strength to the results, and “our conclusions provide evidence that lithium, a relatively inexpensive and readily available drug, warrants further study in melanoma,” they said.
Lead author Dr. Asgari and one of the other four authors disclosed serving as investigators for studies funded by Valeant Pharmaceuticals and Pfizer. This study was supported by the National Cancer Institute. Dr. Asgari is principal investigator in the Patient-Oriented Research in the Epidemiology of Skin Diseases lab at Massachusetts General Hospital, Boston.
FROM THE JOURNAL OF INVESTIGATIVE DERMATOLOGY
Key clinical point: Lithium may reduce the risk of melanoma and melanoma mortality.
Major finding: The incidence of melanoma was significantly lower among adults exposed to lithium (67/100,000 person-years) than those not exposed (93/100,000 person-years).
Data source: The data come from a population-based, retrospective cohort study of 11,317 white adults in Northern California.
Disclosures: The lead author and one of the other four authors disclosed serving as investigators for studies funded by Valeant Pharmaceuticals and Pfizer. The study was supported by the National Cancer Institute.
FDA offers 2 tools to snuff out risk for e-cigarette fires and explosions
The Food and Drug Administration is concerned about incidents of overheating, fires, and explosions of e-cigarettes, or “vapes,” which in some cases have resulted in serious injuries. The agency is reviewing these types of incidents and has taken steps to protect the public.
The FDA recently developed resources for consumers, including tips to help avoid e-cigarette overheating and explosions, as well as social media tools to help spread the word about protective steps. The agency also has a reporting system to collect information about adverse experiences associated with e-cigarettes and other tobacco products. Comprehensive and accurate reports could provide evidence to help inform future actions to protect the public.
For e-cigarette users: Tips to help prevent fires and explosions
Learn about your device.
The best protection against battery explosions may be knowing about your device and how to handle and charge its batteries appropriately. Read and follow the manufacturer’s use and care recommendations. If the e-cigarette did not come with instructions or you have additional questions, contact the manufacturer.
Consider using e-cigarettes with protective features.
Some e-cigarettes have features such as firing button locks, vent holes, and protection against overcharging. These features are designed to prevent battery overheating and explosions, so do not remove or disable them.
Choose batteries carefully and replace them if necessary:
• Use only the batteries recommended for your device. Do not mix different brands, different charge levels, or old and new batteries in the same device.
• Replace the batteries if they get damaged or wet. If your e-cigarette is damaged and the batteries are not replaceable, contact the manufacturer.
• Stop using the device under certain circumstances. Although battery explosions can occur with no warning, you should immediately stop using your e-cigarette and get a safe distance from it if you notice any of these during use or while charging: strange noises; unusual smells; a leaking battery; the e-cigarette becoming unusually hot; or the device beginning to smoke, spark, emit flashes, or catch fire.
Be aware when charging your e-cigarette:
• Use only the charger that came with your device, and never charge it with a phone or tablet charger.
• Charge the device on a clean, flat surface, in a place you can clearly see it, and away from anything that can easily catch fire. Do not leave the e-cigarette charging on a surface such as a couch or pillow, where it may be more likely to overheat or turn on unintentionally.
• Do not charge the device overnight or leave it charging unattended.
Know this about carrying and storing your e-cigarette:
• Keep your e-cigarette covered. If you are carrying it in your pocket, avoid having it come in contact with coins or loose batteries.
• Protect the e-cigarette from extreme temperatures. Do not leave it in direct sunlight or in your car in extremely cold or hot temperatures.
Report any problems.
If something goes wrong with an e-cigarette, please submit a report to https://www.safetyreporting.hhs.gov
To make it easy to share the FDA’s top tips, the agency has developed a 5 Tips to Help Avoid “Vape” Battery Explosion infographic.
This infographic and other public-health resources can be found on a dedicated CTP webpage, which offers shareable and downloadable content to help spread the word about e-cigarette battery issues, as well as a video on how to report adverse experiences related to tobacco products to the FDA.
When a fire or explosion does occur: The Safety Reporting Portal
The CTP identified 143 reported incidents of e-cigarette overheating, fires, and explosions during 2009-2015, and 20 additional reports during 2016. Based on the FDA’s experience with underreporting of adverse events for other regulated products, the number of actual events is probably higher.
The FDA is working to collect more information to identify the true number of events and why these incidents are occurring. The agency has a Safety Reporting Portal (SRP) dedicated to receiving reports of issues associated with FDA-regulated products, including e-cigarettes and other tobacco products.
The FDA strongly encourages any physicians, other health care professionals, or those with firsthand knowledge about an unexpected e-cigarette incident to report it through the SRP. Family physicians can play a valuable reporting role by informing patients about the reporting system, helping people submit complete information about incidents related to e-cigarettes, or providing information about an incident on a patient’s behalf.
To report an e-cigarette failure or other tobacco-related adverse event, please go to the SRP and follow the instructions in each section. Those unable to use the SRP to submit a report can call 877-CTP-1373 or email [email protected].
The more complete and accurate a report is, the more helpful it can be to the FDA and, in turn, to public health. When submitting a report about an e-cigarette, please include:
• E-cigarette manufacturer’s name.
• E-cigarette’s brand name, model, and serial number.
• Battery’s brand name and model.
• Place the e-cigarette was purchased.
• Whether, and how, the product was being used at the time of the incident.
• Whether the product was used differently than intended by the manufacturer.
• Whether the product was modified in any way.
To collect as much detail as possible, the FDA encourages those submitting reports to upload photos or other files, such as police or hospital reports. They also appreciate submission of contact information, such as a phone number or email address, which will help the agency follow up with any questions related to the report. Personal information will not be shared or used for any additional matter and is protected by security practices. The HHS Privacy Policy contains more information.
Ongoing public health protection efforts
The FDA continues to evaluate possible ways to protect the public from device-related fires and explosions. During a public workshop in April, the FDA heard from experts including scientists, engineers, and e-cigarette manufacturers and retailers, as well as from the general public, about hazards and possible solutions related to batteries in e-cigarettes and other electronic nicotine delivery systems. Also, the agency’s premarket review process for electronic nicotine delivery systems includes an assessment of device operation and any features that may reduce the risks associated with product use, including testing related to overheating and exploding batteries.
Through these and other measures, the FDA is committed to identifying and addressing factors leading to e-cigarette overheating and any subsequent injuries. Health care professionals can help by spreading the word about the agency’s user tips and reporting portal.
To learn more broadly about the FDA’s ongoing efforts to protect the public health by regulating the manufacture, marketing, and distribution of tobacco products, please visit the Center for Tobacco Products website.
Dr. Holman is director of the office of science at the FDA’s Center for Tobacco Products.
PRIDE study supports novel approach to ECT for geriatric depression
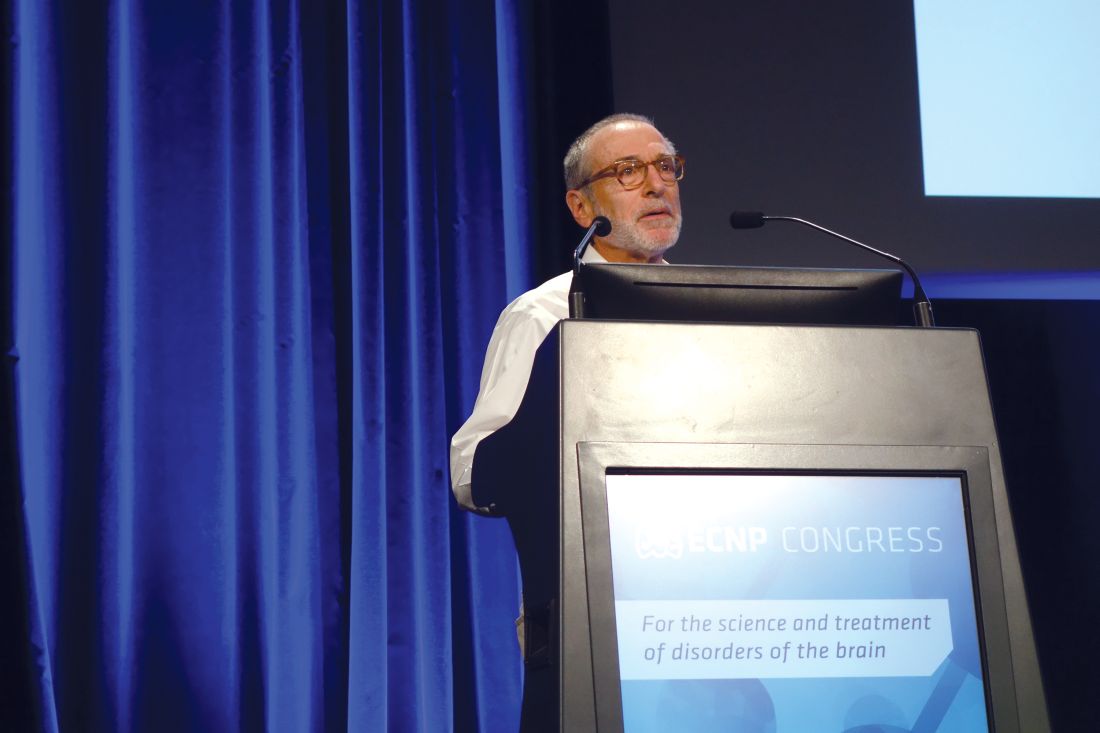
PARIS – Results of the randomized phase 2 portion of the landmark PRIDE study of electroconvulsive therapy for severe unipolar depression in geriatric patients hold a key message for clinicians, according to Charles H. Kellner, MD.
“The clinical take-home message is that practitioners should be liberal in prescribing additional ECT past the acute course. So our recommendation is that tapering ECT courses and being liberal with continuation and maintenance ECT should be adopted in clinical practice more widely with the aim of preventing full syndromic relapse and its catastrophic consequences,” Dr. Kellner said at the annual congress of the European College of Neuropsychopharmacology.
PRIDE (Prolonging Remission in Depressed Elderly) was a National Institute of Mental Health–sponsored nine-center study of right unilateral ultrabrief pulse ECT at 0.25 msec plus supportive pharmacotherapy for treatment of geriatric depression.
Phase 1 of the study involved 240 affected patients, 62% of whom achieved remission after receiving this form of ECT at six times the seizure threshold thrice weekly for up to 1 month coupled with low- or medium-dose venlafaxine. A mean of 7.3 ECT sessions were needed to attain remission as defined by a score of 10 or less on the Hamilton Rating Scale for Depression (HAM-D24) on two consecutive occasions, down from a mean baseline score of 31.2. The scale was administered three times per week. Safety and tolerability of the ECT regimen were excellent, according to Dr. Kellner, chief of electroconvulsive therapy at New York Community Hospital and a psychiatrist at Mount Sinai School of Medicine in New York.
The PRIDE phase 1 data confirmed several points previously made in earlier studies. One is that the older patients are, the more ECT-responsive they are, even within an all-geriatric cohort such as PRIDE. Indeed, the remission rate was 55% in the 60- to 69-year-olds, compared with 72% in the 70- to 79-year-olds.
Another finding consistent with other studies: Patients with psychotic depression do particularly well with ECT. All PRIDE participants with psychotic depression achieved remission.
Also, ECT had a very rapid antisuicidal effect. At baseline, 24% of patients had a score of 1 on HAM-D24 item 3, which rates suicidality. An additional 34% had a baseline score of 2, 14% scored 3, and only 23% had a score of 0. After only a few weeks of ECT, however, 84% of patients had a score of 0 and 9% scored a 1.
“That’s one of the compelling clinical reasons to refer patients for ECT: This type of ECT is really good for treating suicidality,” Dr. Kellner noted.
Phase 2 was the more interesting part of the PRIDE study, he continued, because it evaluated in randomized fashion the efficacy and tolerability of a novel flexible, individualized strategy for as-needed maintenance ECT to sustain the mood improvement once remission was achieved. Dr. Kellner stressed that some form of maintenance therapy is essential post ECT-induced remission.
“It’s unreasonable to expect that ECT could cure the patients’ underlying illness and protect them from getting sick again for the rest of their lives. One has to understand this is a recurrent episodic illness that we’re treating. What ECT does is treat the current episode, and it does it better and more thoroughly than any other treatment in psychiatry,” Dr. Kellner said.
Post-ECT relapse rates are clearly higher in the modern era, which makes a compelling case for developing safe and effective maintenance strategies.
“We don’t quite understand why relapse rates are higher today. My belief is that for patients who come to ECT, their illness has been destabilized by having been on multiple trials of antidepressant medications beforehand. It may also be that the forms of ECT that we’re using today are somewhat less potent than the ones used in previous decades,” Dr. Kellner conceded.
He and his coinvestigators named their investigational maintenance ECT strategy STABLE, for Symptom-Titrated, Algorithm-Based Longitudinal ECT. It’s a complex algorithm described in detail in a published report (Am J Psychiatry. 2016 Nov 1; 173[11]:1110-18). Basically, it consisted of four mandatory additional ECT sessions administered once weekly for the first month post remission, followed by either one, two, or no ECT sessions per week based upon evidence of deterioration as expressed in HAM-D24 scores.
In phase 2 of PRIDE, 128 remitters from phase 1 were continued on venlafaxine at a mean dose of 192 mg/day. In addition, they were placed on lithium, achieving a mean lithium level of 0.53 mEq/L, which Dr. Kellner deemed “low but reasonable.” These 128 patients were then randomized to the STABLE arm of flexibly administered ECT or to medication only and were followed prospectively for 6 months.
The primary endpoint was change in HAM-D24 score over the course of 6 months. From a baseline mean total score of 6, the mean score climbed to 8.4 in the medication-only group while dropping to 4.2 in the STABLE arm.
“At every time point along the way in the 6-month course of phase 2 of the illness, patients who were in the STABLE arm were less symptomatic and doing better than patients in the medication-only arm,” Dr. Kellner observed.
The key secondary efficacy outcome was change in the Clinical Global Impressions Severity scale. At follow-up, the patients in the flexible ECT plus medication arm were 5.2 times more likely to be rated “not ill at all” than were those on pharmacotherapy only.
In addition, relapse occurred in 20% of the medication-only group versus 13% in the STABLE group.
Global cognitive functioning as assessed by the Mini-Mental State Examination – crudely, in Dr. Kellner’s view – did not differ between the two groups at follow-up. Results of more sophisticated tests of multiple specific domains of cognition will be forthcoming.
Of note, two-thirds of patients in the STABLE arm required no additional ECT after their four continuation ECTs during the first month.
A swipe at ECT’s critics
Dr. Kellner called ECT “a fabulous therapy,” albeit one with a serious image problem.
“I think the problem with ECT is not that we don’t know all the details of how it works or what it does clinically, it’s really a sociopolitical issue about ECT not being adequately accepted. I break down this lack of acceptance into two forms: The first is passive lack of acceptance based on our profession not having embraced ECT and continuing to fail to embrace it. The other is the active propaganda against ECT that is promulgated by the Church of Scientology, which has taken on a life of its own now because of the Internet. ECT is still fought by the Church of Scientology. They fund lots of people to say incorrect nasty things about ECT to inappropriately frighten our patients,” Dr. Kellner charged.
He cautioned that proposed new Food and Drug Administration regulations governing ECT devices would greatly limit the use of ECT, restricting it to adults with treatment-resistant major depressive disorder or bipolar disorder or who require a rapid response. Other currently cleared indications would become off-label uses.
“With off-label ECT, the potential problem is practitioners may not be covered by their malpractice insurance. And the bigger issue is health insurers may not pay for it unless the ECT is for an on-label indication,” Dr. Kellner said.
He shared that he has found extremely helpful a colleague’s advice to demystify ECT by inviting a family member to witness a patient’s treatment session. That witness can then testify to others that what goes on bears no resemblance to what happens to Jack Nicholson in the classic film “One Flew Over the Cuckoo’s Nest.”
The PRIDE study was funded by the National Institute of Mental Health. Dr. Kellner reported having no financial conflicts of interest.
AT THE ECNP CONGRESS
Key clinical point:
Major finding: At 6 months follow-up, the mean score on the Hamilton Rating Scale for Depression was 4.2 points lower in the flexible maintenance ECT group than in the medication-only group, from a baseline score of 6.
Data source: Phase 2 of the PRIDE study randomized 128 elderly patients whose severe depression remitted in response to ECT to one of two maintenance treatment strategies.
Disclosures: The PRIDE study was funded by the National Institute of Mental Health. The presenter reported having no financial conflicts of interest.
FDA approves first non–finger-stick glucose monitoring system
The Food and Drug Administration has approved the FreeStyle Libre Flash Glucose Monitoring System for the continuous monitoring of glucose in adults with diabetes, the first system of its type that does not require blood samples for calibration, according to a press release.
Instead of using a more standard finger stick with which patients must draw blood samples multiple times a day to measure glucose levels, the FreeStyle Libre Flash Glucose Monitoring System uses a thin wire less than 0.4-mm thick inserted underneath the skin in the back of the upper arm to continually monitor glucose. Blood glucose levels are read by swiping a mobile reader over the wire. After a 12-hour start-up period, the wire can be worn for 10 days.
FDA approval was based on results from a study of diabetes patients older than 18 years, as well as a performance review comparing readings obtained by the device with readings obtained in a traditional laboratory method utilizing blood samples.
“This system allows people with diabetes to avoid the additional step of finger-stick calibration, which can sometimes be painful, but still provides necessary information for treating their diabetes – with a wave of the mobile reader,” Donald St. Pierre, acting director of the Office of In Vitro Diagnostics and Radiological Health and deputy director of new product evaluation in the FDA’s Center for Devices and Radiological Health, said in the press release.
Find the full press release on the FDA website.
A spike in syphilis puts prenatal care in focus
Fifteen years ago, reported cases of syphilis in the United States were so infrequent that public health officials thought it might join the ranks of malaria, polio, and smallpox as an eradicated disease. That turned out to be wishful thinking.
According to data from the Centers for Disease Control and Prevention, between 2012 and 2015, the overall rates of syphilis in the United States increased by 48%, while the rates of primary and secondary infection among women spiked by 56%. That was a compelling enough rise, but fresh data from the agency indicate that the overall rates of syphilis increased by 17.6% between 2015 and 2016, and by 74% between 2012 and 2016. 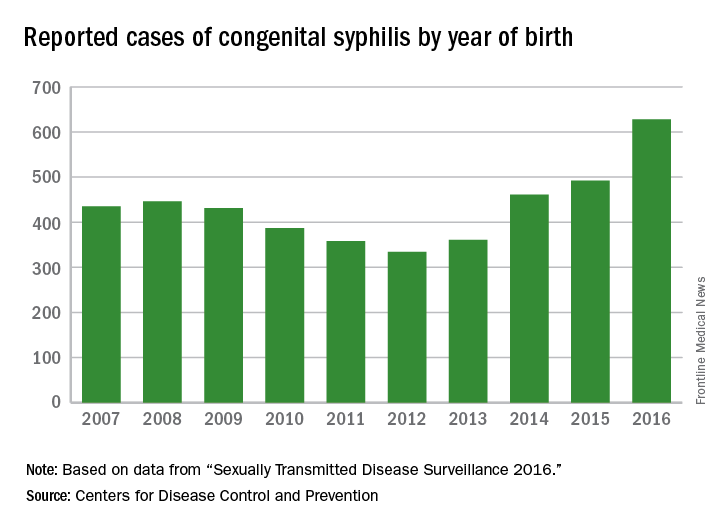
These trends prompted the CDC to launch a “call to action” educational campaign in an effort to curb the rising syphilis rates. The United States Preventive Services Task Force also is taking action. It recently posted a research plan on screening pregnant women for syphilis that will form the basis of a forthcoming evidence review and, potentially, new recommendations.

observed in all regions of the United States during the same time period, said Dr. Kidd, who coauthored a 2015 Morbidity and Mortality Weekly Report on the topic (MMWR. 2015 Nov 13;64[44]:1241-5). That analysis found that during 2012-2014, the number of reported CS cases in the United States increased from 334 to 458, which represents a rate increase from 8.4 to 11.6 cases per 100,000 live births. This contrasted with earlier data, which found that the overall rate of reported CS had decreased from 10.5 to 8.4 cases per 100,000 live births during 2008-2012.
In 2016, there were 628 reported cases of CS, including 41 syphilitic stillbirths, according to the CDC.
“Congenital syphilis rates tend to track female syphilis rates; so as female rates go up, we know we’re going to see a rise in congenital syphilis rates,” Dr. Kidd said. “One way to prevent syphilis is to prevent female syphilis altogether. Another way is to prevent the transmission from mother to infant when you have a pregnant woman with syphilis.”
Lack of prenatal care
CDC guidelines recommend that all pregnant women undergo routine serologic screening for syphilis during their first prenatal visit. Additional testing at 28 weeks’ gestation and again at delivery is warranted for women who are at increased risk or live in communities with increased prevalence of syphilis infection. That approach may seem sensible, but such prevention measures are ineffective when mothers don’t receive any prenatal care or receive it late, which happens in about half of all CS cases, Dr. Kidd said.
Inconsistent, inadequate, or a total absence of prenatal care is “probably the biggest risk factor for vertical transmission, especially among high-risk populations, where there is an increased background prevalence of syphilis in childbearing women,” said Robert Maupin, MD, professor of clinical obstetrics and gynecology in the section of maternal-fetal medicine at Louisiana State University Health Sciences Center, New Orleans.

To complicate matters, women who receive no or inconsistent prenatal care face an increased risk for preterm birth, Dr. Maupin noted. So while a clinician might follow CDC recommendations that pregnant women with confirmed or suspected syphilis complete a course of long-acting penicillin G for at least 30 days or longer before the child is born, “the timing of being able to implement effective prevention and treatment prior to that 30-day window can sometimes be compromised by the fact that she ends up delivering prematurely,” he said. “If someone’s not adequately linked to consistent prenatal care, she may not complete that full course of prevention. Additionally, patterns of care are often fragmented, meaning that patients may go to one clinic or one provider, may not return, and may end up switching to a different clinic. That translates into a potential lag in implementing treatment or making a diagnosis in the first place, and that may be disruptive in the context of our attempted prevention measures.”
Precise reasons why some pregnant women in the United States receive no or inadequate prenatal care remain unclear.
“Anecdotally, in the West, I hear that women with drug abuse histories or drug abuse issues [are vulnerable], or they may be homeless or have mental health issues,” Dr. Kidd said. “In other areas of the country, people feel that it’s more of an insurance or access to care issue, but we don’t have data on that here at the CDC.”
Repeat screening
In 2015, a large analysis of women who were commercially-insured or Medicaid-insured found that more than 95% who received prenatal care were screened for syphilis at least once during pregnancy (Obstet Gynecol. 2015;125[5]:1211-6). However, CDC data of CS cases shows that about 15% of their mothers are infected during pregnancy, which would occur after that first screening test.
“That’s where the repeat screening early in the third trimester and at delivery becomes the real issue,” Dr. Kidd said. “For high-risk women, including those who live in the high morbidity areas, they should be screened again later in pregnancy. Many ob.gyns. may not be aware of that recommendation, or may not be aware they’re in an area that does have a high syphilis morbidity, and that the pregnant women who are seeing them may be at increased risk of syphilis.”
Dr. Maupin, who is associate dean of diversity and community engagement at LSU Health Sciences Center, advised clinicians to view CS with the same sense of urgency that existed in previous years with perinatal HIV transmission.
“In the last decade and a half we’ve seen a substantial decline in perinatal HIV transmission because of intensive efforts on the public health side in terms of both screening and use of treatment,” he said. “If we look at this with a similar level of contemporary urgency, it will bear similar fruit over time. Additionally, from a maternal-fetal medicine standpoint, the more effectively we treat and/or control diseases and comorbidities prior to pregnancy, the less likely those things will have an adverse impact on the health and well-being of the newborn.”
Steps you can take to curb CS
In its “call to action” on syphilis, the Centers for Disease Control and Prevention cited several practical ways that clinicians can combat the spread of congenital syphilis (CS).
1. Complete a sexual history for your patients. The CDC recommends following this with STD counseling for those at risk and contraception counseling for women at risk of unintended pregnancy.
2. Test all pregnant women for syphilis. This should be done at the first prenatal visit, with repeat screening for pregnant women at high risk and in areas of high prevalence at the beginning of the third trimester and again at delivery.
3. Treat women infected with syphilis immediately. If a woman has syphilis or suspected syphilis, she should be treated with long-acting penicillin G, especially if she is pregnant. CDC also calls for testing and treating the infected woman’s sex partner(s) to avoid reinfection.
4. Confirm syphilis testing at delivery. Before discharging the mother or infant from the hospital, check that the mother has been tested for syphilis at least once during pregnancy or at delivery. All women who deliver a stillborn infant should be tested for syphilis.
5. Report CS cases to the local or state health department within 24 hours.
Fifteen years ago, reported cases of syphilis in the United States were so infrequent that public health officials thought it might join the ranks of malaria, polio, and smallpox as an eradicated disease. That turned out to be wishful thinking.
According to data from the Centers for Disease Control and Prevention, between 2012 and 2015, the overall rates of syphilis in the United States increased by 48%, while the rates of primary and secondary infection among women spiked by 56%. That was a compelling enough rise, but fresh data from the agency indicate that the overall rates of syphilis increased by 17.6% between 2015 and 2016, and by 74% between 2012 and 2016.
These trends prompted the CDC to launch a “call to action” educational campaign in an effort to curb the rising syphilis rates. The United States Preventive Services Task Force also is taking action. It recently posted a research plan on screening pregnant women for syphilis that will form the basis of a forthcoming evidence review and, potentially, new recommendations.
observed in all regions of the United States during the same time period, said Dr. Kidd, who coauthored a 2015 Morbidity and Mortality Weekly Report on the topic (MMWR. 2015 Nov 13;64[44]:1241-5). That analysis found that during 2012-2014, the number of reported CS cases in the United States increased from 334 to 458, which represents a rate increase from 8.4 to 11.6 cases per 100,000 live births. This contrasted with earlier data, which found that the overall rate of reported CS had decreased from 10.5 to 8.4 cases per 100,000 live births during 2008-2012.
In 2016, there were 628 reported cases of CS, including 41 syphilitic stillbirths, according to the CDC.
“Congenital syphilis rates tend to track female syphilis rates; so as female rates go up, we know we’re going to see a rise in congenital syphilis rates,” Dr. Kidd said. “One way to prevent syphilis is to prevent female syphilis altogether. Another way is to prevent the transmission from mother to infant when you have a pregnant woman with syphilis.”
Lack of prenatal care
CDC guidelines recommend that all pregnant women undergo routine serologic screening for syphilis during their first prenatal visit. Additional testing at 28 weeks’ gestation and again at delivery is warranted for women who are at increased risk or live in communities with increased prevalence of syphilis infection. That approach may seem sensible, but such prevention measures are ineffective when mothers don’t receive any prenatal care or receive it late, which happens in about half of all CS cases, Dr. Kidd said.
Inconsistent, inadequate, or a total absence of prenatal care is “probably the biggest risk factor for vertical transmission, especially among high-risk populations, where there is an increased background prevalence of syphilis in childbearing women,” said Robert Maupin, MD, professor of clinical obstetrics and gynecology in the section of maternal-fetal medicine at Louisiana State University Health Sciences Center, New Orleans.
To complicate matters, women who receive no or inconsistent prenatal care face an increased risk for preterm birth, Dr. Maupin noted. So while a clinician might follow CDC recommendations that pregnant women with confirmed or suspected syphilis complete a course of long-acting penicillin G for at least 30 days or longer before the child is born, “the timing of being able to implement effective prevention and treatment prior to that 30-day window can sometimes be compromised by the fact that she ends up delivering prematurely,” he said. “If someone’s not adequately linked to consistent prenatal care, she may not complete that full course of prevention. Additionally, patterns of care are often fragmented, meaning that patients may go to one clinic or one provider, may not return, and may end up switching to a different clinic. That translates into a potential lag in implementing treatment or making a diagnosis in the first place, and that may be disruptive in the context of our attempted prevention measures.”
Precise reasons why some pregnant women in the United States receive no or inadequate prenatal care remain unclear.
“Anecdotally, in the West, I hear that women with drug abuse histories or drug abuse issues [are vulnerable], or they may be homeless or have mental health issues,” Dr. Kidd said. “In other areas of the country, people feel that it’s more of an insurance or access to care issue, but we don’t have data on that here at the CDC.”
Repeat screening
In 2015, a large analysis of women who were commercially-insured or Medicaid-insured found that more than 95% who received prenatal care were screened for syphilis at least once during pregnancy (Obstet Gynecol. 2015;125[5]:1211-6). However, CDC data of CS cases shows that about 15% of their mothers are infected during pregnancy, which would occur after that first screening test.
“That’s where the repeat screening early in the third trimester and at delivery becomes the real issue,” Dr. Kidd said. “For high-risk women, including those who live in the high morbidity areas, they should be screened again later in pregnancy. Many ob.gyns. may not be aware of that recommendation, or may not be aware they’re in an area that does have a high syphilis morbidity, and that the pregnant women who are seeing them may be at increased risk of syphilis.”
Dr. Maupin, who is associate dean of diversity and community engagement at LSU Health Sciences Center, advised clinicians to view CS with the same sense of urgency that existed in previous years with perinatal HIV transmission.
“In the last decade and a half we’ve seen a substantial decline in perinatal HIV transmission because of intensive efforts on the public health side in terms of both screening and use of treatment,” he said. “If we look at this with a similar level of contemporary urgency, it will bear similar fruit over time. Additionally, from a maternal-fetal medicine standpoint, the more effectively we treat and/or control diseases and comorbidities prior to pregnancy, the less likely those things will have an adverse impact on the health and well-being of the newborn.”
Steps you can take to curb CS
In its “call to action” on syphilis, the Centers for Disease Control and Prevention cited several practical ways that clinicians can combat the spread of congenital syphilis (CS).
1. Complete a sexual history for your patients. The CDC recommends following this with STD counseling for those at risk and contraception counseling for women at risk of unintended pregnancy.
2. Test all pregnant women for syphilis. This should be done at the first prenatal visit, with repeat screening for pregnant women at high risk and in areas of high prevalence at the beginning of the third trimester and again at delivery.
3. Treat women infected with syphilis immediately. If a woman has syphilis or suspected syphilis, she should be treated with long-acting penicillin G, especially if she is pregnant. CDC also calls for testing and treating the infected woman’s sex partner(s) to avoid reinfection.
4. Confirm syphilis testing at delivery. Before discharging the mother or infant from the hospital, check that the mother has been tested for syphilis at least once during pregnancy or at delivery. All women who deliver a stillborn infant should be tested for syphilis.
5. Report CS cases to the local or state health department within 24 hours.
Advanced Stage and Relapsed/Refractory Hodgkin Lymphoma
INTRODUCTION
Hodgkin lymphoma, previously known as Hodgkin’s disease, is a B-cell lymphoproliferative disease characterized by a unique set of pathologic and epidemiologic features. The disease is characterized by the presence of multinucleate giant cells called Hodgkin Reed-Sternberg (HRS) cells.1 Hodgkin lymphoma is unique compared to other B-cell lymphomas because of the relative rarity of the malignant cells within affected tissues. The HRS cells, which usually account for only 0.1% to 10% of the cells, induce accumulation of nonmalignant lymphocytes, macrophages, granulocytes, eosinophils, plasma cells, and histiocytes, which then constitute the majority of tumor cellularity.2 Although the disease was first described by Sir Thomas Hodgkin in 1832, in part because of this unique histopathology, it was not until the 1990s that it was conclusively demonstrated that HRS cells are in fact monoclonal germinal center–derived B cells.
Due to the development of highly effective therapies for Hodgkin lymphoma, cure is a reasonable goal for most patients. Because of the high cure rate, late complications of therapy must be considered when selecting treatment. This article reviews the clinical features and treatment options for advanced stage and relapsed/refractory Hodgkin lymphoma. A previously published article reviewed the epidemiology, etiology/pathogenesis, pathologic classification, initial workup, and staging evaluation of Hodgkin lymphoma, as well as the prognostic stratification and treatment of patients with early-stage Hodgkin lymphoma.3
PRESENTATION, INITIAL EVALUATION, AND PROGNOSIS
Overall, classical Hodgkin lymphoma (cHL) usually presents with asymptomatic mediastinal or cervical lymphadenopathy. At least 50% of patients will have stage I or II disease.4 A mediastinal mass is seen in most patients with nodular sclerosis cHL, at times showing the characteristics of bulky (> 10 cm) disease. Constitutional, or B, symptoms (fever, night sweats, and weight loss) are present in approximately 25% of all patients with cHL, but 50% of advanced stage patients. Between 10% and 15% of patients will have extranodal disease, most commonly involving lung, bone, and liver. Lymphocyte-predominant Hodgkin lymphoma (LPHL) is a rare histological subtype of Hodgkin lymphoma that is differentiated from cHL by distinct clinicopathological features. The clinical course and treatment approach for LPHL are dependent upon the stage of disease. The clinicopathological features of LPHL are discussed in the early-stage Hodgkin lymphoma article.3
For the purposes of prognosis and selection of treatment, Hodgkin lymphoma is commonly classified as early stage favorable, early stage unfavorable, and advanced stage. For advanced stage Hodgkin lymphoma patients, prognosis can be defined using a tool commonly referred to as the International Prognostic Score (IPS). This index consists of 7 factors: male gender, age 45 years or older, stage IV disease, hemoglobin < 10.5 g/dL, white blood cell (WBC) count > 15,000/μL, lymphopenia (absolute lymphocyte count < 600 cells/μL or lymphocytes < 8% of WBC count), and serum albumin < 4 g/dL.5 In the original study by Hasenclever et al,5 the 5-year freedom from progression (FFP) ranged from 42% to 84% and the 5-year overall survival (OS) ranged from 56% to 90%, depending on the number of factors present. This scoring system, however, was developed using a patient population treated prior to 1992. Using a more recently treated patient population, the British Columbia Cancer Agency (BCCA) found that the IPS is still valid for prognostication, but outcomes have improved across all IPS groups, with 5-year FFP now ranging from 62% to 88% and 5-year OS ranging from 67% to 98%.6 This improvement is likely a reflection of improved therapy and supportive care. Table 1 shows the PFS and OS within each IPS group, comparing the data from the German Hodgkin Study Group (GHSG) and BCCA group.5,6 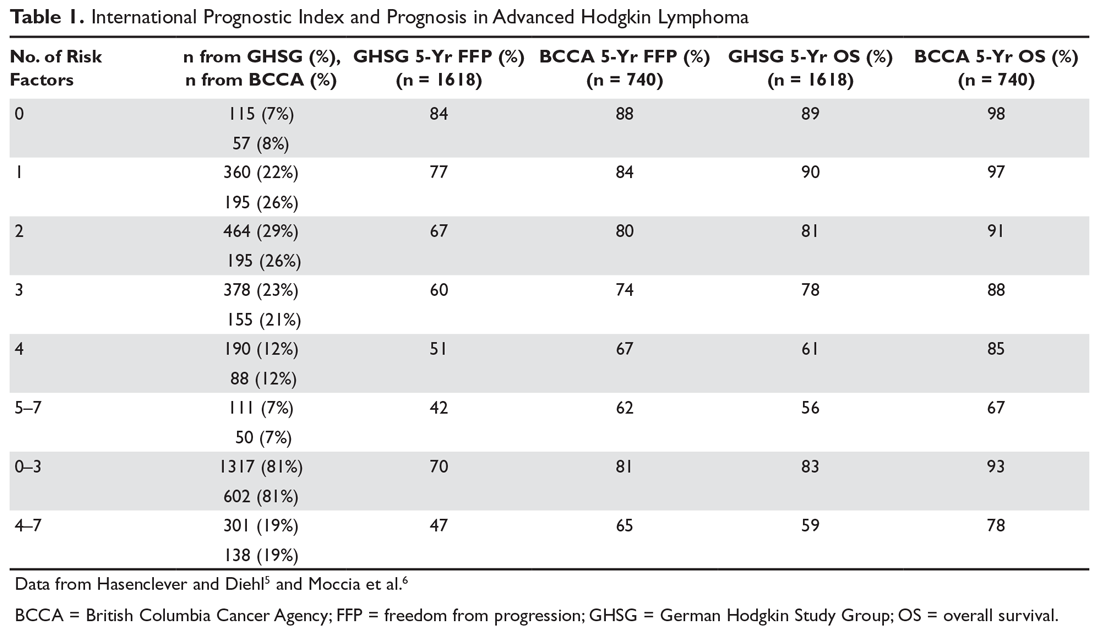
High expression of CD68 is associated with adverse outcomes, whereas high FOXP3 and CD20 expression on tumor cells are predictors of superior outcomes.8 A recent study found that CD68 expression was associated with OS. Five-year OS was 88% in those with less than 25% CD68 expression, versus 63% in those with greater than 25% CD68 expression.9
Roemer and colleagues evaluated 108 newly diagnosed cHL biopsy specimens and found that almost all cHL patients had concordant alteration of PD-L1 (programmed death ligand-1) and PD-L2 loci, with a spectrum of 9p24.1 alterations ranging from low level polysomy to near uniform 9p24.1 amplification. PD-L1/PD-L2 copy number alterations are therefore a defining pathobiological feature of cHL.10 PFS was significantly shorter for patients with 9p24.1 amplification, and those patients were likely to have advanced disease suggesting that 9p24.1 amplification is associated with less favorable prognosis.10 This may change with the increasing use of PD-1 inhibitors in the treatment of cHL.
High baseline metabolic tumor volume and total lesion glycolysis have also been associated with adverse outcomes in cHL. While not routinely assessed in practice currently, these tools may ultimately be used to assess prognosis and guide therapy in clinical practice.11
ADVANCED STAGE HODGKIN LYMPHOMA
FRONTLINE THERAPY
First-line Chemotherapy
Chemotherapy plays an essential role in the treatment of advanced stage Hodgkin lymphoma. In the 1960s, the MOPP regimen (nitrogen mustard, vincristine, procarbazine, prednisone) was developed, with a 10-year OS of 50% and a progression-free survival (PFS) of 52% reported in advanced stage patients. The complete remission (CR) rate was 81%, and 36% of patients who achieved CR relapsed later.12 This chemotherapy regimen is associated with a significant rate of myelosuppression and infertility as well as long-term risk of secondary myelodysplasia and acute leukemias.13,14 This led to the development of newer regimens such as ABVD (doxorubicin, bleomycin, vinblastine, dacarbazine).15 In a randomized trial, ABVD showed improved failure-free survival (FFS) over MOPP (61% versus 50% at 5 years) but similar OS (66%–73%).16 In light of these findings, and considering the lower rate of infertility and myelotoxicity, ABVD became the standard of care for advanced stage cHL in the United States.
The Stanford V regimen was developed in an attempt to further minimize toxicity.17 Stanford V is a condensed, 12-week chemotherapy regimen that includes mechlorethamine, doxorubicin, vinblastine, etoposide, prednisone, vincristine, and bleomycin, followed by involved-field radiation therapy (IFRT). Subsequent trials compared the Stanford V and ABVD regimens and showed similar OS, freedom from treatment failure (FFTF), and response rates.18,19 The ABVD regimen was noted to have higher pulmonary toxicity, while other toxicities such as lymphopenia and neuropathy were higher with the Stanford V regimen. In addition, Stanford V requires patients to receive radiation therapy (RT) to original sites of disease larger than 5 cm in size and contiguous sites.
Another regimen which has been studied extensively for advanced stage Hodgkin lymphoma, and is considered a standard of care in some parts of the world, is escalated BEACOPP (bleomycin, etoposide, doxorubicin, cyclophosphamide, vincristine, procarbazine, prednisone). In the HD9 study (n = 1196), the GHSG evaluated BEACOPP, escalated BEACOPP, and COPP/ABVD in advanced stage Hodgkin lymphoma.20 All arms of the study included 30 Gy RT to sites of bulky disease or residual disease. This study showed improved OS and FFTF with escalated BEACOPP, but at the cost of higher rates of toxicity. At 10 years, FFTF was 64%, 70%, and 82% with OS rates of 75%, 80%, and 86% for COPP/ABVD, baseline BEACOPP, and escalated BEACOPP, respectively (P < 0.001). The rate of secondary acute leukemia 10 years after treatment was 0.4% for COPP/ABVD, 1.5% for BEACOPP, and 3.0% for escalated BEACOPP. However, 3 subsequent randomized trials did not confirm a survival benefit with escalated BEACOPP relative to ABVD. In the HD 2000 trial (n = 295)21 and in a trial by Viviani and colleagues (n = 331),22 an improvement in OS was not demonstrated in favor of escalated BEACOPP. These studies also confirmed a higher rate of toxicities as well as secondary malignancies associated with the escalated BEACOPP regimen. In the EORTC20012 Intergroup trial (n = 549), 8 cycles of ABVD was compared with 4 cycles of escalated BEACOPP followed by 4 cycles of baseline BEACOPP, without radiation, in patients with clinical stage III or IV Hodgkin lymphoma with IPS score ≥ 3. Both regimens resulted in statistically similar FFS (63.7% in ABVD × 8 versus 69.3% in BEACOPP 4+4) and OS (86.7% in ABVD × 8 vs 90.3% in BEACOPP 4+4).23
In the United States, ABVD (6–8 cycles) is commonly used, although escalated BEACOPP (particularly for patients with an IPS of 4 or higher) and Stanford V are considered appropriate as well.24 In the North American Intergroup study comparing ABVD to Stanford V, and in the trial by Viviani et al, ABVD was associated with a 5- to 7-year FFS of 73% to 79% and OS of 84% to 92%.19,22 Given these excellent results, as well as the potential to cure patients with second-line therapy consisting of autologous hematopoietic cell transplantation (auto-HCT), the general consensus among most U.S. hematologists and oncologists is that ABVD remains the treatment of choice, and that the improved FFS/PFS with escalated BEACOPP is not outweighed by the additional toxicity associated with the regimen. There may, however, be a role for escalated BEACOPP in select patients who have a suboptimal response to ABVD as defined by interim positron emission tomography (iPET) scan (see below).
Brentuximab vedotin is an anti-CD30 antibody-drug conjugate (ADC) consisting of an anti-CD30 antibody linked to monomethyl auristatin E (MMAE), a potent antitubulin agent. CD30 is highly expressed on HRS cells and also in anaplastic large cell lymphoma. Upon binding to CD30, the ADC/CD30 complex is then internalized and directed to the lysosome, where the ADC is proteolytically cleaved, releasing MMAE from the antibody. MMAE then disrupts microtubule networks within the cell, leading to G2/M cycle arrest and apoptosis. CD30 is consistently expressed on HRS cells. In addition to being studied in the relapsed/refractory setting (described below), brentuximab has been studied in the first-line setting. In a phase 1 trial, brentuximab combined with ABVD was associated with increased pulmonary toxicity, while brentuximab + AVD had no significant pulmonary toxicity, with an excellent CR rate (96%), suggesting that substituting brentuximab for bleomycin may be an effective strategy. In addition to possibly being more efficacious, this strategy would also have the benefit of eliminating the risk of bleomycin pulmonary toxicity.25 Based on this data, a large international phase 3 study (the ECHELON-1 trial) comparing ABVD versus brentuximab + AVD in advanced stage cHL patients was recently completed. This study enrolled 1334 patients, and preliminary results were recently announced. With a median follow-up of 24 months, the brentuximab + AVD arm had a 4.9% absolute improvement in PFS relative to the ABVD arm (82.1% versus 77.2%). The brentuximab + AVD arm had an increased incidence of febrile neutropenia, managed with growth factors and peripheral neuropathy requiring dose adjustments, whereas the ABVD arm had an increased rate and severity of pulmonary toxicity.26 Further follow-up will be required to determine whether this will translate into a survival benefit. See Table 2 for a summary of recent large randomized prospective phase 3 trials in advanced stage Hodgkin lymphoma. 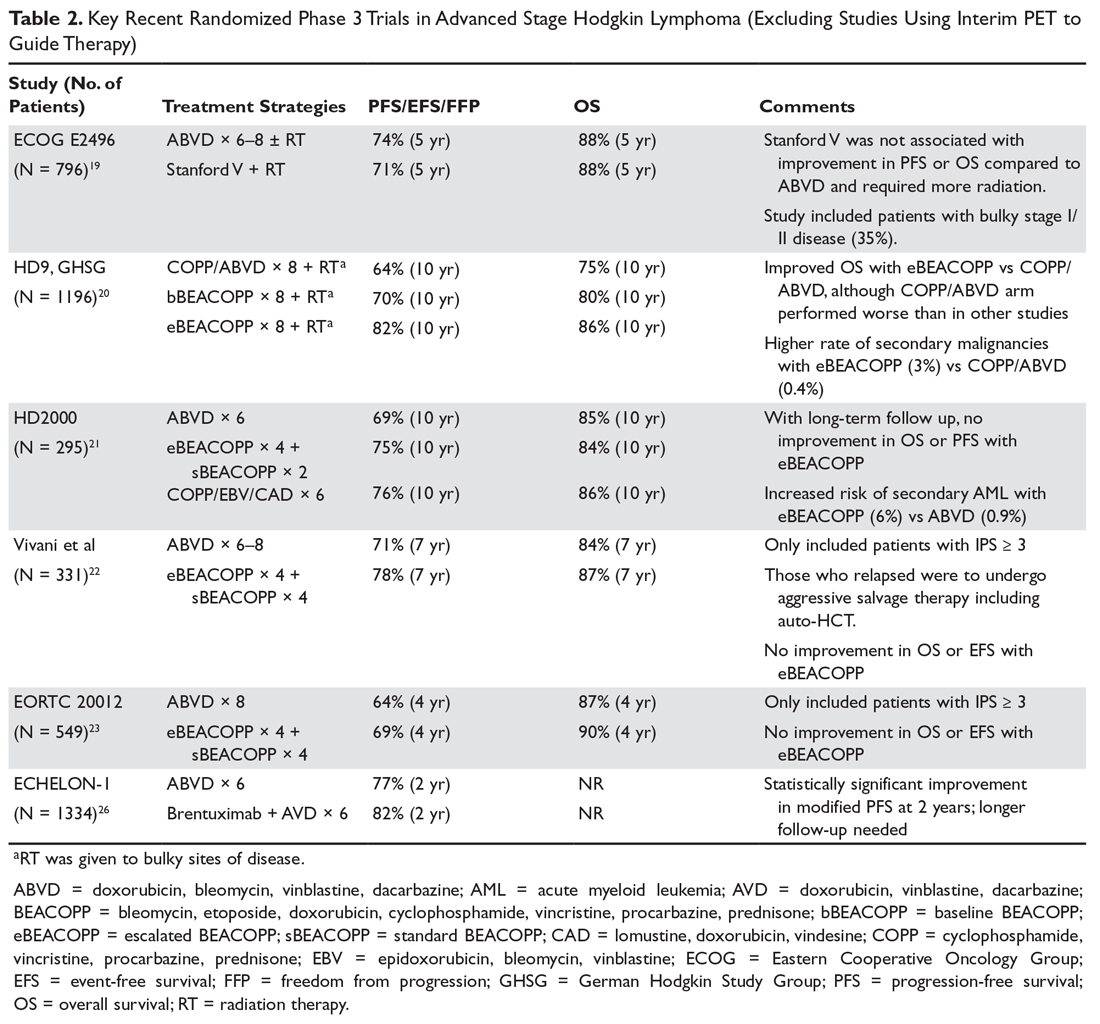
Alternative Regimens in Older Patients
Patients older than 60 years of age often have poor tolerance for ABVD and especially escalated BEACOPP. This results in increased treatment-related mortality and reduced overall dose intensity, with higher relapse rates and poor OS. In an attempt to improve on the results of treatment of elderly patients with Hodgkin lymphoma, alternative regimens have been explored. One example is PVAG (prednisone, vinblastine, doxorubicin, gemcitabine). With this regimen, the 3-year OS was 66% and PFS was 58%. One patient out of 59 died from treatment-related toxicity, which is much improved over the historical figures for elderly patients with Hodgkin lymphoma.27 Another commonly used approach in practice is to simply omit bleomycin from ABVD. In the early-stage setting (GHSG HD-13 trial), this regimen (referred to as AVD) led to 89.6% PFS at 5 years, compared to 93.5% with ABVD.28 It therefore stands to reason that this should be a reasonable option in older or more frail advanced stage cHL patients as well.
Brentuximab has been evaluated as a single-agent therapy for first-line therapy of elderly patients with Hodgkin lymphoma. In a phase 2 study, 27 patients (63% with advanced stage disease) were treated, with a 92% overall response rate and 73% CR rate. However the median duration of remission was disappointing at only 9.1 months.29 Based on this data, single-agent brentuximab appears to be a reasonable and well tolerated option for frail or elderly patients, although with the caveat that long-term disease control is relatively uncommon.
RESPONSE-ADAPTED FRONTLINE THERAPY USING INTERIM PET SCAN
In recent years, response-adapted treatment approaches have been extensively researched in cHL using iPET. The goal is to reduce toxicity by minimizing therapy in those who achieve negative iPET and/or to intensify treatment for patients with suboptimal response on iPET. Gallamini et al evaluated the prognostic role of an early iPET scan in advanced Hodgkin lymphoma patients (n = 190) treated with ABVD. This study found that patients with positive iPET had a 2-year PFS of 12.8% versus 95.0% in patients with negative iPET. This result was highly statistically significant (P < 0.0001). This study also showed that PET-2 (iPET after 2 cycles of ABVD) superseded the prognostic value of the IPS at diagnosis.30 As a result, numerous subsequent studies have been pursued using iPET for risk-adapted treatment in cHL.
A critical element to the conduct of iPET risk-adapted treatment for cHL is the interpretation of the iPET. In hopes of standardizing iPET interpretation in clinical trials, a scoring system called the Deauville score was developed. The Deauville score ranges from 1 to 5 (Table 3). 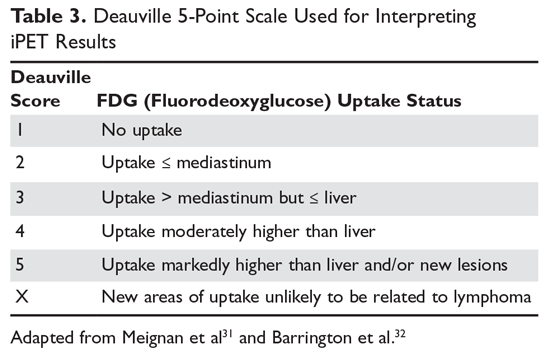
The SWOG (Southwest Oncology Group) S0816 trial (n = 358) evaluated iPET-adapted treatment after 2 cycles of ABVD in stage III or IV Hodgkin lymphoma patients. Patients with positive iPET (Deauville score 4 to 5; n = 60) received escalated BEACOPP for 6 cycles, whereas iPET-negative (Deauville score 1 to 3; n = 271) patients continued to receive 4 more cycles of ABVD. The 2-year PFS was 64% for iPET-positive patients.33 This PFS was much higher than the expected 15% to 30% from prior studies such as Gallamini et al,30 suggesting that the treatment intensification may have been of benefit.
In the HD0801 study (n = 519), newly diagnosed advanced Hodgkin lymphoma patients with positive iPET after 2 cycles of ABVD (n = 103) received early ifosfamide-containing salvage therapy followed by high-dose therapy with autologous stem cell rescue. The 2-year PFS was 76% for PET-2–positive patients, comparable with PET-2–negative patients who had PFS of 81%.34 Again, this result for iPET-positive patients was much better than expected based on the historical control from Gallamini et al, suggesting that the treatment intensification may have been beneficial. It should be emphasized, however, that neither HD0801 nor S0816 were randomized prospective trials; rather, all iPET-positive patients were assigned to an intensified treatment approach.
In the HD18 trial (n = 1100), patients with advanced stage cHL started therapy with escalated BEACOPP and underwent an iPET after 2 cycles. For those with a positive iPET, rituximab was added to escalated BEACOPP in the experimental arm (n = 220) for cycles 3 through 8. The control group (n = 220) continued to receive 6 more cycles of escalated BEACOPP. In the 2 groups, the 3-year PFS was similar (91.4% in escalated BEACOPP, 93% in rituximab + escalated BEACOPP), suggesting no significant benefit with addition of rituximab.35 This study also calls into question whether iPET provides useful information for patients receiving intensive therapy such as escalated BEACOPP, and indicates that the historical control data for iPET-positive patients from Gallamini et al may not be consistently reproduced in other prospective trials. As a result, nonrandomized trials that implement an iPET risk-adapted approach should be interpreted with caution. See Table 4 for a summary of recent trials in advanced stage Hodgkin lymphoma using iPET scan to guide therapy. 
RADIATION THERAPY IN FRONTLINE TREATMENT
In patients with advanced stage Hodgkin lymphoma, IFRT to initial bulky sites of disease may be incorporated into frontline therapy to improve local control. However, whether this provides a survival benefit and which patients benefit most from consolidative RT remain unclear.
The European Organization for Research and Treatment of Cancer (EORTC) completed a randomized study in advanced stage Hodgkin lymphoma patients who achieved complete or partial remission after MOPP-ABV.36 Patients in CR were randomly assigned to receive no further treatment versus IFRT (24 Gy to all initially involved nodal areas and 16 to 24 Gy to all initially involved extranodal sites). Patients in partial remission (PR) were treated with 30 Gy to nodal areas and 18 to 24 Gy to extranodal sites. Among the CR patients, the 5-year event-free survival (EFS) was 79% to 84% and did not differ for those who received radiation versus those who did not. Five-year OS was 85% to 91% and also did not differ between the 2 groups. However, among the patients in PR after chemotherapy, the 5-year EFS was 79% and the 5-year OS was 87%, which is better than expected for PR patients, indicating a possible benefit to RT in patients with a partial response after chemotherapy. In the GHSG HD12 trial, patients with advanced stage Hodgkin lymphoma who had a residual lesion by computed tomography (CT) (but not analyzed by PET) had a very subtle improvement in FFTF (90% versus 87%) in favor of consolidation with IFRT, but again no survival benefit was seen.37
The EORTC and HD12 studies described above utilized CT scan for assigning remission status following chemotherapy, and it is now well known that many patients with residual masses (by CT) after chemotherapy may in fact be cured, as such residual radiographic abnormalities may simply be composed of fibrosis. PET scan is more accurate than CT in identifying patients who truly have residual active disease following chemotherapy. As a result, the EORTC study discussed above and the GHSG HD12 trial are of limited relevance in the modern era, in which patients routinely undergo PET scan at the end of therapy. Restricting IFRT to sites that remain PET-positive after completing chemotherapy may be a reasonable strategy that would allow for the avoidance of RT in many patients, and may obviate the need for aggressive second-line therapy (eg, high-dose therapy and autologous hematopoietic cell transplant [auto-HCT]). This approach was taken in the GHSG HD15 trial (n = 2182) in which advanced stage patients were treated with 3 variations on the BEACOPP regimen (8 cycles of escalated BEACOPP, 6 cycles of escalated BEACOPP, or 8 cycles of baseline BEACOPP, randomized in a 1:1:1 ratio). Patients with a residual mass of 2.5 cm or greater on CT scan then underwent a PET scan; if the lesion was PET positive, it was treated with 30 Gy of IFRT. This overall strategy was very effective, with 5-year FFTF rates of 84.4%, 89.3%, and 85.4%, respectively. The OS rates were 91.9%, 95.3%, and 94.5%, respectively. For patients with lesions that remained PET positive after chemotherapy, the PFS rate was 86.2% at 48 months, whereas patients in PR with persistent mass ≥ 2.5 cm but with negative PET had a PFS of 92.6%, similar to that of patients in CR.38 With this approach of BEACOPP followed by PET-guided radiation, the proportion of patients receiving RT was reduced from 71% (in the HD9 study) to only 11% in the HD15 study,38 with no apparent loss in overall efficacy when comparing the results of the 2 studies.
UPFRONT STEM CELL TRANSPLANTATION
To further improve outcomes of patients with advanced Hodgkin lymphoma with high-risk disease, high-dose therapy with auto-HCT has been explored as part of frontline therapy. While this has been shown to be feasible in such patients,39 randomized trials have not shown a clear benefit in terms of FFS or OS with upfront auto-HCT. 40,41 Therefore, auto-HCT is not considered a standard component of frontline therapy for cHL patients who achieve CR by PET/CT scan.
RELAPSED AND REFRACTORY HODGKIN LYMPHOMA
Depending on the stage, risk factors, and frontline regimen utilized, between 5% and 40% of patients with Hodgkin lymphoma can be expected to experience either primary induction failure or a relapse after attaining remission with frontline therapy.3 Primary refractory Hodgkin lymphoma, which occurs in up to 5% to 10% of patients, is defined as progression or no response during induction treatment or within 90 days of completing treatment. In cases where remission status is in question, an updated tissue biopsy is recommended. Biopsy is also recommended in cases in which new sites of disease have appeared or if relapse has occurred after a durable period of remission. Restaging is recommended at the time of relapse.
For younger patients with relapsed/refractory Hodgkin lymphoma, the standard of care in most cases is second-line (or salvage) chemotherapy followed by high-dose therapy and auto-HCT. For patients not felt to be candidates for auto-HCT, options include conventional second-line chemotherapy alone, salvage radiotherapy, novel agents such as brentuximab or immune checkpoint inhibitors, and/or participation in clinical trials.
CONVENTIONAL MULTI-AGENT CHEMOTHERAPY REGIMENS
Numerous conventional regimens have been shown in phase 2 studies to be active in relapsed and refractory Hodgkin lymphoma. These include platinum-based regimens, gemcitabine-based regimens, and alkylator-based regimens. No randomized trials in Hodgkin lymphoma have been conducted comparing these regimens. In general, regimens are chosen based on the patient’s age, performance status, comorbidities, and whether auto-HCT is being considered.
In the United States, platinum-based regimens such as ICE (ifosfamide, carboplatin, etoposide),42 DHAP (dexamethasone, cisplatin, high-dose cytarabine),43 ESHAP (etoposide, methylprednisolone, high-dose cytarabine, cisplatin),44 GDP (gemcitabine, cisplatin, dexamethasone),45 and GCD (gemcitabine, carboplatin, dexamethasone)46 are all considered appropriate second-line therapy options for patients being considered for auto-HCT, due to their high response rates and because autologous hematopoietic stem cell collection remains feasible after these regimens. Response rates range from 60% to 88%, with CR rates between 17% and 41%, and toxic death rates generally well below 5%.
Other gemcitabine-based regimens such as IGEV (ifosfamide, gemcitabine, vinorelbine) and GVD (gemcitabine, vinorelbine, liposomal doxorubicin) are also effective.47,48 GVD is an excellent choice since it is a generally well-tolerated outpatient regimen with a 60% response rate even in heavily pretreated patients.48 Stem cell collection remains feasible after both IGEV and GVD as well. ABVD can produce CR in approximately 20% to 50% of patients initially treated with MOPP.49–51 In practice, however, most patients today with relapsed or refractory Hodgkin lymphoma have already received ABVD as part of their first-line therapy, and retreatment with ABVD is not a good option because it would be associated with prohibitively high cumulative doses of doxorubicin.
These multi-agent chemotherapy regimens may not be tolerated well in patients over age 65 to 70 years or those with significant underlying comorbidities. In recent years, bendamustine has emerged as one of the most active conventional agents for cHL, with overall response rates of 53% to 58% in heavily pre-treated patients.52,53 Bendamustine can generally be tolerated even in elderly patients as well.
Some centers, particularly in Europe, investigated aggressive salvage regimens such as mini-BEAM (carmustine, etoposide, cytarabine, melphalan)54 or dexa-BEAM (BEAM plus dexamethasone).55 These regimens, however, are associated with significant hematologic toxicity and high (2%–5%) treatment-related mortality. As a result, these are rarely used in the United States.
For patients who have progressed after (or are not candidates for) platinum- and/or gemcitabine-based therapy, older alkylator-based regimens such as MOPP, C-MOPP, or ChlVPP (chlorambucil, vinblastine, procarbazine, prednisone) can be considered.56–58 However, these regimens are associated with significant bone marrow suppression, and autologous hematopoietic stem cell collection may no longer be feasible after such regimens. Therefore, these regimens should only be given to patients not felt to be auto-HCT candidates, or patients for whom autologous hematopoietic stem cell collection has already been completed. Weekly vinblastine or single-agent gemcitabine are palliative chemotherapy options, with response rates in the 60% to 80% range. Patients can sometimes be maintained on such low-intensity palliative regimens for 6 to 12 months or longer.59,60
BRENTUXIMAB VEDOTIN
Several trials are evaluating incorporation of brentuximab into second-line therapy in transplant-eligible patients. These approaches have used brentuximab prior to, concurrent with, or following platinum-based chemotherapy.61 While there is currently no consensus on the optimal way to incorporate brentuximab into salvage therapy, it is possible that the use of brentuximab or other novel agents in salvage therapy may allow for avoidance of conventional chemotherapy in some patients. In addition, this may translate into more patients proceeding to auto-HCT in a PET negative state. PET negativity prior to auto-HCT is a powerful predictor of long-term remission after auto-HCT, so any intervention that increases the rate of PET negativity prior to auto-HCT would be expected to improve outcomes with auto-HCT.62–65
For patients not being considered for autoHCT, or those for whom platinum-based salvage therapy was ineffective, single-agent brentuximab is an excellent option. In 2 phase 2 studies, an overall response rate (ORR) of 60% to 75% (including a CR rate of 22%–34%) was seen in relapsed and refractory Hodgkin lymphoma patients.66 The US Food and Drug Administration (FDA) approved brentuximab vedotin in August 2011 for treatment of relapsed and refractory Hodgkin lymphoma, after a failed auto-HCT, or in patients who are not auto-HCT candidates and who have received at least 2 prior chemotherapy regimens. With more extended follow-up, it has become clear that a proportion of patients who achieve CR to brentuximab may maintain remission long-term—58% at 3 years and 38% at 5 years.67 These patients may in fact be cured, in many cases without having undergone allogeneic HCT (allo-HCT) after brentuximab.
PD-1 (IMMUNE CHECKPOINT) INHIBITORS
As discussed earlier, PD-L1/PD-L2 copy number alterations represent a disease-defining feature of cHL. Alterations in chromosome 9p24.1 increase the expression of PD-1 ligands PD-L1 and PD-L2. Nivolumab and pembrolizumab are PD-1-blocking antibodies, which have recently been FDA approved for relapsed and refractory cHL. In a study with 23 patients, with 78% of them relapsing after auto-HCT and 78% relapsing after brentuximab, nivolumab produced an objective response in 87% of the patients, with 17% achieving CR and 70% achieving PR. The rate of PFS was 86% at 24 weeks.68 Pembrolizumab, another PD-1 antagonist, was also tested in relapsed and refractory Hodgkin lymphoma. In the KEYNOTE-087 study (n = 210), pembrolizumab produced an ORR of 64% to 70% in 3 different cohorts of relapsed and refractory cHL patients. Overall CR rate was 22%.69 In general, these agents are well tolerated, although patients must be monitored closely for
inflammatory/autoimmune-type toxicities including skin rash, diarrhea/colitis, transaminitis, endocrine abnormalities, and pneumonitis. Prompt recognition and initiation of corticosteroids is essential in managing these toxicities. Of note, PD-1 inhibitors should be given very cautiously to patients with a prior history of allo-HCT, since 30% to 55% of such patients will experience acute graft-versus-host disease (GVHD) in this setting. In 2 retrospective studies, the response rate was very high at 77% to 95%; however, 10% to 26% of all patients treated with PD-1 inhibitors post-allo-HCT died from GVHD induced by PD-1 inhibition.70,71 These risks and benefits therefore need to be carefully weighed in the post-allo-HCT setting. In another recent study, the outcomes were reported for 39 patients who underwent allo-HCT after prior therapy with a PD-1 inhibitor. Three patients (7.7%) developed lethal acute GVHD, suggesting there may be an increased risk of GVHD in patients undergoing allo-HCT after prior PD-1 inhibitor therapy.72
AUTOLOGOUS STEM CELL TRANSPLANTATION
Several studies have shown an improved disease-free survival (DFS) or FFS in patients with relapsed cHL treated by auto-HCT as compared to those receiving conventional chemotherapy alone.55,73,74 Overall, for relapsed disease, one can expect an approximately 50% to 60% chance for DFS at 5 years post-transplant. In a retrospective, matched-pair analysis, FFP was 62% for auto-HCT patients, compared to 32% for conventional chemotherapy patients. OS, however, was similar for the 2 groups (47%–54%). Patients failing induction therapy or relapsing within 1 year were seen to benefit the most from auto-HCT, including an OS benefit.74
A European prospective randomized trial was conducted comparing conventional salvage therapy to auto-HCT. In this study, 161 patients with relapsed Hodgkin lymphoma were treated with 2 cycles of dexa-BEAM. Those with chemo-sensitive disease were then randomized to either 2 more cycles of dexa-BEAM or high-dose BEAM with auto-HCT. Auto-HCT was associated with an approximately 55% FFTF at 3 years, versus 34% with conventional chemotherapy alone.55 This benefit again was most apparent for patients relapsing within 1 year of completion of primary therapy, although an OS benefit was not seen with auto-HCT. For patients with late relapse (>1 year after completion of primary therapy), auto-HCT was associated with an approximately 75% FFTF at 3 years, versus 50% with chemotherapy alone. One other small randomized trial of auto-HCT in relapsed and refractory Hodgkin lymphoma also showed an improved 3-year EFS in favor of auto-HCT (53% versus 10%), again with no difference in OS.73
The lack of OS benefit seen in these studies suggests that auto-HCT at first or second relapse provides comparable outcomes. Auto-HCT offers the benefit of avoiding the long-term toxicities associated with multiple salvage regimens and the anxiety associated with multiple relapses. In addition, the treatment-related mortality with auto-HCT is now in the 1% to 2% range in younger patients, at centers that perform the procedure routinely. For all of these reasons, auto-HCT is commonly recommended by physicians for Hodgkin lymphoma patients in first or second relapse. In most cases, transplant is favored in first relapse, since waiting until second relapse may be associated with a lower chance of achieving CR and difficulty collecting sufficient hematopoietic stem cells. For patients with early relapse or primary refractory disease, an even stronger case can be made for auto-HCT as the best option to achieve sustained control of the disease. For patients with late relapse, conventional salvage therapy alone may be a reasonable option, particularly in older or frail patients, or those with significant comorbid conditions.
The optimal conditioning regimen for autoHCT for relapsed and refractory Hodgkin lymphoma remains undefined. No randomized trials have been performed comparing conditioning regimens for relapsed and refractory Hodgkin lymphoma. One retrospective study compared 92 patients with Hodgkin lymphoma who underwent auto-HCT using a total-body irradiation (TBI) regimen versus a chemotherapy-alone regimen. No difference in 5-year OS or EFS was seen.75 Given the lack of benefit seen with TBI, along with reports of increased rates of secondary malignancies and myelodysplasia with TBI,76 chemotherapy-alone conditioning regimens are most widely employed. For example, in the United States, either the BEAM or CBV (cyclophosphamide, carmustine, etoposide) regimens are used in over 80% of cases.77 This practice was justified in a Center for International Blood and Marrow Transplant Research (CIBMTR) retrospective study comparing outcomes by conditioning regimens, in which no regimen performed better than BEAM or CBV.78
IFRT is often given as an adjunctive therapy to sites of initial and/or relapsed disease following auto-HCT. Although a relatively common practice, whether this truly enhances outcomes beyond that obtained with auto-HCT alone is unclear. Two retrospective studies have shown some benefit in terms of improvement in OS at 3 to 5 years in the group that received IFRT (70%–73% versus 40%–56%).79,80 Given the retrospective nature and small size of these studies, a prospective study would be needed to properly define the potential role for IFRT following auto-HCT in relapsed/refractory Hodgkin lymphoma. Another retrospective study (n = 73) that evaluated peri-transplant IFRT in Hodgkin lymphoma patients receiving auto transplant found no improvement in survival for patients who received peri-transplant IFRT. This study, however, did show a survival benefit in the subgroup of patients with limited stage disease.81
Prognostic Factors Associated with Outcome with Auto-HCT
The factor most consistently associated with improved outcome for patients with relapsed and refractory Hodgkin lymphoma who undergo auto-HCT is the disease status at transplant.63,77 Those in a second CR, versus a chemo-sensitive relapse (but not CR), versus a chemo-refractory relapse have DFS rates of 60% to 70%, 30% to 40%, and 10% to 20%, respectively.63 The duration between remission and relapse also has important prognostic significance. Late relapse (> 1 year after completion of frontline therapy) is associated with better outcomes as compared to early relapse.55 Other factors with prognostic significance at relapse include anemia, time to relapse and clinical stage, B symptoms, extranodal disease, number of prior chemotherapy regimens, and performance status.42,82 The prognostic impact of pretransplant disease status has been confirmed by studies using functional imaging (eg, FDG-PET or gallium scans). In a report by Moskowitz et al, patients with negative functional imaging following second-line therapy had a 77% EFS post-auto-HCT versus 33% in those whose functional imaging remained positive.62 Very similar findings have been reported by other groups.63–65
Post-Auto-HCT Brentuximab Maintenance
In the multicenter, randomized, double-blinded phase 3 AETHERA trial (n = 329), brentuximab (n = 165) was compared with placebo (n = 164) in patients with unfavorable risk relapsed or primary refractory cHL who had undergone autologous transplant. Eligible patients had at least 1 of the following risk factors for progression after auto-HCT: primary refractory Hodgkin lymphoma (failure to achieve complete remission), relapsed Hodgkin lymphoma with an initial remission duration of less than 12 months, or extranodal involvement at the start of pre-transplantation salvage chemotherapy. Patients were required to have CR, PR, or stable disease after pretransplant salvage chemotherapy with adequate kidney, liver, and bone marrow function. Patients who previously received brentuximab were excluded. Patients received 16 cycles of brentuximab or placebo once every 3 weeks starting 30 to 45 days after transplant. The PFS was significantly improved in the brentuximab group when compared to the placebo group (hazard ratio 0.57; P = 0.0013) after a median observation time of 30 months. Median PFS was 42.9 months in the brentuximab group versus 24.1 months in the placebo group; estimated 2-year PFS rates were 63% in the brentuximab group and 51% in the placebo group. OS was not significantly different between the study groups (~85%), presumably due to the fact that patients in the control group who relapsed likely went on to receive brentuximab as a subsequent therapy.83
PRIMARY REFRACTORY HODGKIN LYMPHOMA
Patients with primary refractory Hodgkin lymphoma have a poor outcome. Salvage therapy using conventional chemotherapy and/or RT results in long-term DFS in 10% or fewer of such patients.13,84 Given these poor outcomes with conventional salvage therapy, auto-HCT is considered to be the standard of care for this subset of patients. The GHSG retrospectively analyzed the prognostic factors and outcomes of patients with primary refractory Hodgkin lymphoma. The 5-year freedom-from-second-failure and the 5-year OS were reported to be 31% and 43%, respectively, for those patients treated with auto-HCT. Patients with poor functional status at time of transplant, age greater than 50 years, and failure to attain a temporary remission had a 0% 5-year OS, as compared to 55% in patients without any of these risk factors.85 A large retrospective European study showed that patients with chemo-resistant disease who underwent transplant had a 19% survival at 5 years.63 Hence, even patients with primary refractory Hodgkin lymphoma have some chance of achieving long-term survival following auto-HCT.
SALVAGE RADIOTHERAPY
The GHSG performed a retrospective analysis of the efficacy of salvage RT in patients with refractory or first-relapsed Hodgkin lymphoma. Five-year FFTF and OS rates were 28% and 51%, respectively. Patients with a limited-stage relapse and without B symptoms were more likely to benefit from salvage RT.86 Campbell et al reported on 81 patients undergoing salvage RT for persistent or recurrent Hodgkin lymphoma after chemotherapy. The 10-year FFTF and OS rates were 33% and 46%, respectively.87 Similarly, Wirth et al reported a 5-year FFS of 26% and 5-year OS of 57%. These figures were 36% and 75%, respectively, in patients whose relapse was limited to supradiaphragmatic nodal sites without B symptoms.88 RT therefore may be a useful strategy for a subset of patients who relapse following chemotherapy, particularly those with a limited-stage relapse, without B symptoms, and those with relapsed disease after a CR, as opposed to those with a partial response or lack of response to the prior chemotherapy regimen.
INVESTIGATIONAL AGENTS AND NOVEL COMBINATIONS
Several biological therapies are emerging as options for the treatment of refractory or relapsed disease. These therapies consist of monoclonal antibodies and ADCs that target cell surface antigens, or small molecules that inhibit key intracellular pathways within neoplastic cells.
Rituximab
Rituximab is a chimeric anti-CD20 monoclonal antibody used widely in B-cell non-Hodgkin lymphomas. The CD20 molecule is typically highly expressed in nodular lymphocyte-predominant Hodgkin lymphoma (NLPHL). Two studies (one in relapsed patients, the other in a mixture of relapsed and previously untreated patients) showed significant activity of rituximab in relapsed NLPHL, with ORRs ranging from 94% to 100%, CR rates ranging from 41% to 53%, and median duration of remission in the 10- to 33-month range.89,90 In cHL, CD20 is expressed in HRS cells in 20% to 30% of cases. In such cases, single-agent rituximab has also shown activity. There is also evidence that rituximab may be effective even in cases in which the HRS cells are CD20-negative, presumably by virtue of depleting reactive B lymphocytes from the microenvironment, which may enhance anti-tumor immunity, or by eliminating a putative CD20-expressing Hodgkin lymphoma stem cell.91,92
Lenalidomide
Lenalidomide is an immunomodulatory drug that has multiple modes of action, including direct induction of apoptosis in tumor cells, antiangiogenic effects, and the activation of immune cells, such as natural killer cells and T cells. Lenalidomide has been shown to modify many features of the microenvironment of HRS cells and has demonstrated activity in other B-cell neoplasms. As a result, lenalidomide has been evaluated in relapsed and refractory Hodgkin lymphoma patients. A multicenter phase 2 study by Fehniger et al included 35 patients, 87% of whom had previously undergone HCT and 55% of whom were refractory to the last therapy.93 All patients were given lenalidomide 25 mg/day from days 1 to 21 of a 28-day cycle until disease progression. One patient was noted to achieve CR, 6 achieved PR, and 5 had stable disease lasting more than 6 months, for an ORR of 19% and a “cytostatic overall response rate” of 33%. The median duration of CR/partial remission was 6 months, with the median time-to-treatment failure in responders (including those with stable disease > 6 months) being 15 months. Similarly, in another study, Böll et al evaluated 12 patients across 4 German centers with relapsed or refractory disease who were treated with oral lenalidomide for 21 days in a 28-day cycle. No radiological evidence of disease progression after 2 cycles of lenalidomide was seen in any of the enrolled patients. ORR was noted to be 50%, with 6 patients with stable disease and 5 patients achieving PR after 2 cycles.94
Novel Brentuximab Combination Therapies
Brentuximab plus bendamustine. The combination of brentuximab and bendamustine was tested as an outpatient regimen in a phase 1/2 study (n = 55) in primary refractory Hodgkin lymphoma or after first relapse. The CR rate of the combination was 74%, with an overall objective response (CR + PR) of 93%. The CR rates were 64% and 84%, respectively, for refractory and relapsed patients. The PFS at 12 months was 80%, establishing this combination therapy as an effective salvage regimen with durable response.95
Brentuximab plus nivolumab. Preliminary results have recently been presented from 2 studies96,97 evaluating the combination of brentuximab and nivolumab. While this combination would still be considered investigational, these studies showed very encouraging ORRs of 90% to 100% and a CR rate of 62% to 66%. Longer follow-up is needed to determine whether these responses are durable and to document the toxicity profile of this combination.
Mammalian Target of Rapamycin Inhibitors
Two mammalian target of rapamycin (mTOR) inhibitors, everolimus and temsirolimus, are currently available in the United States. While neither drug currently has FDA approval for Hodgkin lymphoma, everolimus was evaluated in a phase 2 trial in a heavily pretreated group of relapsed/refractory patients. An ORR of 47% was seen, with a median time to progression of 7.2 months.98
ALLOGENEIC STEM CELL TRANSPLANTATION
Historically, patients who relapse after having an auto-HCT generally had a poor outcome, with a median survival of 2 to 3 years after failure of auto-HCT.99 These patients may be offered palliative chemotherapy (see above), treatment with novel agents (see above), or enrollment in a clinical trial. Select patients may benefit from a second hematopoietic stem cell transplant, most commonly an allo-HCT. However, rare patients with late relapse after auto-HCT may be considered for a second auto-HCT, with a minority of such patients achieving a durable remission after the second auto-HCT.100,101 Because relapse or progressive disease occurs most commonly in the first several months following auto-HCT, patients are more often considered for allo-HCT than a second auto-HCT. In addition, a second auto-HCT may not be feasible due to impaired bone marrow reserve and/or concerns for development of secondary myelodysplasia or acute myeloid leukemia.
Several studies have evaluated allo-HCT in relapsed/ refractory Hodgkin lymphoma. Early studies evaluating myeloablative allo-HCT for Hodgkin lymphoma showed excessive treatment-related mortality (up to 50%) and disappointingly low rates of long-term survival (< 25%).102,103 This was likely related to the fact that, in that era, most of the patients with Hodgkin lymphoma evaluated for allo-HCT were heavily pretreated and therefore at a higher risk for toxicity as well as lymphoma progression.
More recently, several studies have focused on the use of reduced-intensity conditioning (RIC) allo-HCT for relapsed and refractory Hodgkin lymphoma. This approach relies more on a “graft-versus-lymphoma” effect, the existence of which has been debated in Hodgkin lymphoma. Three single-center studies of RIC allo-HCT in patients with multiply recurrent Hodgkin lymphoma showed improved rates of treatment-related mortality (8%–16%) but still relatively low rates of long-term PFS (23%–39% at 2 to 4 years).104–106 Interestingly, in one of these studies the outcomes were more favorable for patients who underwent haploidentical (versus matched sibling or matched unrelated donor) transplants.105
Two large registry studies have also reported on the outcomes of RIC allo-HCT in patients with relapsed and refractory Hodgkin lymphoma.107,108 These studies also confirmed a modest improvement in outcomes compared with those seen historically with myeloablative transplants. Treatment-related mortality at 1 to 2 years was 23% to 33%, depending on whether a matched sibling donor versus an unrelated donor was used. However, long-term PFS (18%–20% at 2 to 5 years) and OS (28%–37% at 2 to 5 years) remained poor, primarily due to high rates of progressive lymphoma post-transplant. In both of these studies, patients were heavily pretreated (84%–96% had received 3 or more prior lines of chemotherapy, and 62%–89% received a prior auto-HCT), with 47% to 55% of patients chemo-resistant prior to transplant. Of note, both of these registry studies reflect patients who underwent transplant prior to the widespread use of brentuximab and PD-1 inhibitors.
Based on the single-center and registry data above, a prospective multicenter European phase 2 trial was conducted to evaluate the benefit of RIC allo-HCT in Hodgkin lymphoma.109 Ninety-two patients (86% with prior auto-HCT, 90% with 3 or more prior lines of therapy) were enrolled and given salvage therapy. Those who had stable disease or better following salvage therapy remained on protocol (n = 78) and underwent RIC with fludarabine and melphalan, followed by allo-HCT (70% with matched sibling donors). Treatment-related mortality was 15% at 1 year. Relapse or progression occurred in 49% at 2 years (35% if chemo-sensitive prior to transplant). Chronic GVHD was associated with a decreased rate of relapse, supporting the existence of a graft-versus-lymphoma effect in Hodgkin lymphoma. Unfortunately, PFS among all allografted patients was still relatively poor (24% at 4 years). However, among patients in CR prior to allo-HCT, a 50% PFS was seen at 4 years. Therefore, even in a prospective multicenter study, RIC allo-HCT offered significant benefit with manageable toxicity in relapsed and refractory Hodgkin lymphoma patients with chemo-sensitive disease.
These studies suggest that outcomes with allo-HCT would improve further if implemented earlier in the course of disease and/or with a lower burden of disease at transplant. It has therefore been suggested that allo-HCT should be considered soon after failure of auto-HCT is documented. In a retrospective study by Sarina et al, 185 Hodgkin lymphoma patients who relapsed following auto-HCT were then immediately considered for reduced-intensity allo-HCT.110 Of these, 122 had a donor identified, and 104 (85%) actually underwent allo-HCT. These 104 patients were then compared to the other 81 patients who either had no donor identified or had a donor but did not receive the planned allo-HCT. Two-year PFS and OS were superior in the patients undergoing allo-HCT (39% versus 14% and 66% versus 42%, respectively, P < 0.001), with a median follow-up of 4 years. The presence of chronic GVHD again was associated with improved PFS and OS. Disease status prior to transplant remained highly predictive of PFS and OS by multivariate analysis. Two other smaller retrospective studies similarly found a survival benefit associated with allo-HCT compared with patients who underwent conventional salvage therapies alone.111,112 These studies, although subject to the usual limitations of retrospective analyses, suggest that the results with reduced-intensity allo-HCT are in fact enhanced if applied earlier in the disease course, and are superior to those with conventional therapy alone.
Currently, the exact role of allo-HSCT, including the optimal timing and optimal donor source (matched sibling versus haploidentical sibling versus matched unrelated donor), remain undefined for relapsed and refractory Hodgkin lymphoma. As discussed earlier, brentuximab is highly active in relapsed Hodgkin lymphoma patients, with a subset of patients still in CR at 5 years.67 For such patients, avoiding the risks of allo-HCT is a desirable goal.
For those who relapse or progress after auto-HCT, a reasonable strategy therefore is to treat initially with brentuximab, unless the patient is already known to have responded poorly to brentuximab, or already has significant neuropathy. Those who achieve a CR to brentuximab are then observed. A subset of those patients will remain in remission at 5 years without further therapy. For those who relapse, or who achieve less than a CR to brentuximab, additional treatment (with brentuximab re-treatment being one option) followed by a reduced-intensity allo-HCT is a reasonable consideration. This approach has the theoretical advantages of (1) avoiding the risk of allo-HCT in the subset potentially cured by brentuximab, (2) getting patients to allo-HCT with fewer comorbidities (due to a lower total exposure to conventional chemotherapy pre-transplant), and (3) applying allo-HCT in the setting of sensitive disease/lower disease burden (due to the high efficacy of brentuximab). The results of a small study suggest that brentuximab may in fact be a very effective “bridge” to allotransplant. Chen et al113 reported on 18 patients with relapsed/refractory Hodgkin lymphoma (17 of whom had previously undergone auto-HCT) who were treated on brentuximab vedotin clinical trials. The data were retrospectively evaluated to determine the efficacy and safety of subsequent reduced-intensity allo-HCT. Remarkably, at 1 year the OS was 100%, PFS was 92%, and nonrelapse mortality was 0% with a median follow-up of 14 months. Hence, brentuximab is safe for use prior to reduced-intensity allo-HCT in heavily pre-treated patients and appears to be associated with very favorable post-transplant outcomes, particularly in comparison to older studies of allo-HCT in the era prior to brentuximab.
SUMMARY
Currently, cure is possible for the majority of patients diagnosed with advanced stage Hodgkin lymphoma. The challenge to the clinician is to provide curative treatment with the lowest risk of serious toxicities. Which regimen will best provide this balance of risk and benefit needs to be assessed based on the relapse risk, age, frailty, and comorbidity profile for an individual patient. For many patients with relapsed or refractory Hodgkin lymphoma, cure remains possible using approaches based on hematopoietic stem cell transplantation, RT, and/or brentuximab. In addition, there are now numerous conventional chemotherapy agents, RT strategies, and exciting newer agents such as PD-1 inhibitors, that can provide significant clinical benefit even when cure is not feasible.
1. Kuppers R, Rajewsky K, Zhao M, et al. Hodgkin disease: Hodgkin and Reed-Sternberg cells picked from histological sections show clonal immunoglobulin gene rearrangements and appear to be derived from B cells at various stages of development. Proc Natl Acad Sci U S A 1994;91:10962–6.
2. Kuppers R. The biology of Hodgkin’s lymphoma. Nature Rev Cancer 2009;9:15–27.
3. Narra RK, Pingali SR, Fenske TS. Early-stage Hodgkin’s lymphoma. Hospital Physician Hematology-Oncology Board Review Manual. 2017;12(Part 3).
4. Mauch PM, Kalish LA, Kadin M, et al. Patterns of presentation of Hodgkin disease. Implications for etiology and pathogenesis. Cancer 1993;71:2062–71.
5. Hasenclever D, Diehl V. A prognostic score for advanced Hodgkin’s disease. International Prognostic Factors Project on Advanced Hodgkin’s Disease. N Engl J Med 1998;339:1506–14.
6. Moccia AA, Donaldson J, Chhanabhai M, et al. International Prognostic Score in advanced-stage Hodgkin’s lymphoma: altered utility in the modern era. J Clin Oncol 2012;30:3383–8.
7. Diefenbach CS, Li H, Hong F, et al. Evaluation of the International Prognostic Score (IPS-7) and a Simpler Prognostic Score (IPS-3) for advanced Hodgkin lymphoma in the modern era. Br J Haematol 2015;171:530–8.
8. Greaves P, Clear A, Coutinho R, et al. Expression of FOXP3, CD68, and CD20 at diagnosis in the microenvironment of cassical hodgkin lymphoma is predictive of outcome. J Clin Oncol 2013;31:256–62.
9. Touati M, Delage-Corre M, Monteil J, et al. CD68-positive tumor-associated macrophages predict unfavorable treatment outcomes in classical Hodgkin lymphoma in correlation with interim fluorodeoxyglucose-positron emission tomography assessment. Leuk Lymphoma 2015;56:332–41.
10. Roemer MG, Advani RH, Ligon AH, et al. PD-L1 and PD-L2 genetic alterations define classical Hodgkin lymphoma and predict outcome. J Clin Oncol 2016;34:2690–7.
11. Pike LC, Kirkwood AA, Patrick P, et al. Can baseline PET-CT features predict outcomes in advanced hodgkin lymphoma? A prospective evaluation of UK patients in The RATHL Trial (CRUK/07/033). Hematological Oncology 2017;35(Supplement S2):37–8.
12. DeVita VT Jr, Simon RM, Hubbard SM, et al. Curability of advanced Hodgkin’s disease with chemotherapy. Long-term follow-up of MOPP-treated patients at the National Cancer Institute. Ann Intern Med 1980;92:587–95.
13. Longo DL, Duffey PL, Young RC, et al. Conventional-dose salvage combination chemotherapy in patients relapsing with Hodgkin’s disease after combination chemotherapy: the low probability for cure. J Clin Oncol 1992;10:210–8.
14. Kaldor JM, Day NE, Clarke EA, et al. Leukemia following Hodgkin’s disease. N Engl J Med 1990;322:7–13.
15. Bonadonna G, Zucali R, Monfardini S, et al. Combination chemotherapy of Hodgkin’s disease with adriamycin, bleomycin, vinblastine, and imidazole carboxamide versus MOPP. Cancer 1975;36:252–9.
16. Canellos GP, Anderson JR, Propert KJ, et al. Chemotherapy of advanced Hodgkin’s disease with MOPP, ABVD, or MOPP alternating with ABVD. N Engl J Med 1992;327:1478–84.
17. Horning SJ, Williams J, Bartlett NL, et al. Assessment of the stanford V regimen and consolidative radiotherapy for bulky and advanced Hodgkin’s disease: Eastern Cooperative Oncology Group pilot study E1492. J Clin Oncol 2000;18:972–80.
18. Hoskin PJ, Lowry L, Horwich A, et al. Randomized comparison of the stanford V regimen and ABVD in the treatment of advanced Hodgkin’s Lymphoma: United Kingdom National Cancer Research Institute Lymphoma Group Study ISRCTN 64141244. J Clin Oncol 2009;27:5390–6.
19. Gordon LI, Hong F, Fisher RI, et al. Randomized phase III trial of ABVD versus Stanford V with or without radiation therapy in locally extensive and advanced-stage Hodgkin lymphoma: an intergroup study coordinated by the Eastern Cooperative Oncology Group (E2496). J Clin Oncol 2013;31:684–91.
20. Engert A, Diehl V, Franklin J, et al. Escalated-dose BEACOPP in the treatment of patients with advanced-stage Hodgkin’s lymphoma: 10 years of follow-up of the GHSG HD9 study. J Clin Oncol 2009;27:4548–54.
21. Merli F, Luminari S, Gobbi PG, et al. Long-term results of the HD2000 trial comparing ABVD versus BEACOPP versus COPP-EBV-CAD in untreated patients with advanced Hodgkin lymphoma: a study by Fondazione Italiana Linfomi. J Clin Oncol 2016;34:1175–81.
22. Viviani S, Zinzani PL, Rambaldi A, et al. ABVD versus BEACOPP for Hodgkin’s lymphoma when high-dose salvage is planned. N Engl J Med 2011;365:203–12.
23. Carde P, Karrasch M, Fortpied C, et al. Eight cycles of ABVD versus four cycles of BEACOPPescalated plus four cycles of BEACOPPbaseline in stage III to IV, International Prognostic Score >/= 3, high-risk Hodgkin lymphoma: first results of the phase III EORTC 20012 intergroup trial. J Clin Oncol 2016;34:2028–36.
24. National Comprehensive Cancer Network I. NCCN Guidelines Version 1.2017 Hodgkin Lymphoma. Accessed July 20, 2017.
25. Younes A, Connors JM, Park SI, et al. Brentuximab vedotin combined with ABVD or AVD for patients with newly diagnosed Hodgkin’s lymphoma: a phase 1, open-label, dose-escalation study. Lancet Oncology 2013;14:1348–56.
26. Takeda and Seattle Genetics announce positive results from phase 3 ECHELON-1 clinical trial evaluating ADCETRIS® (brentuximab vedotin) in frontline advanced Hodgkin lymphoma [press release]. Cambridge, MA: Takeda Oncology; June 26, 2017.
27. Boll B, Bredenfeld H, Gorgen H, et al. Phase 2 study of PVAG (prednisone, vinblastine, doxorubicin, gemcitabine) in elderly patients with early unfavorable or advanced stage Hodgkin lymphoma. Blood 2011;118:6292–8.
28. Behringer K, Goergen H, Hitz F, et al. Omission of dacarbazine or bleomycin, or both, from the ABVD regimen in treatment of early-stage favourable Hodgkin’s lymphoma (GHSG HD13): an open-label, randomised, non-inferiority trial. Lancet 2015;385:1418–27.
29. Forero-Torres A, Holkova B, Goldschmidt J, et al. Phase 2 study of frontline brentuximab vedotin monotherapy in Hodgkin lymphoma patients aged 60 years and older. Blood 2015;126:2798–804.
30. Gallamini A, Hutchings M, Rigacci L, et al. Early interim 2-[18F]fluoro-2-deoxy-D-glucose positron emission tomography is prognostically superior to international prognostic score in advanced-stage Hodgkin’s lymphoma: a report from a joint Italian-Danish study. J Clin Oncol 2007;25:3746–52.
31. Meignan M, Gallamini A, Meignan M, et al. Report on the First International Workshop on Interim-PET-Scan in Lymphoma. Leuk Lymphoma 2009;50:1257–60.
32. Barrington SF, Mikhaeel NG, Kostakoglu L, et al. Role of Imaging in the Staging and Response Assessment of Lymphoma: Consensus of the International Conference on Malignant Lymphomas Imaging Working Group. J Clin Oncol 2014;32:3048–58.
33. Press OW, Li H, Schoder H, et al. US Intergroup trial of response-adapted therapy for stage III to IV Hodgkin lymphoma using early interim fluorodeoxyglucose-positron emission tomography imaging: Southwest Oncology Group S0816. J Clin Oncol 2016;34:2020–7.
34. Zinzani PL, Broccoli A, Gioia DM, et al. Interim positron emission tomography response-adapted therapy in advanced-stage Hodgkin lymphoma: final results of the pPhase II part of the HD0801 study. J Clin Oncol 2016;34:1376–85.
35. Borchmann P, Haverkamp H, Lohri A, et al. Progression-free survival of early interim PET-positive patients with advanced stage Hodgkin’s lymphoma treated with BEACOPPescalated alone or in combination with rituximab (HD18): an open-label, international, randomised phase 3 study by the German Hodgkin Study Group. Lancet Oncology 2017;18:454–63.
36. Aleman BM, Raemaekers JM, Tirelli U, et al. Involved-field radiotherapy for advanced Hodgkin’s lymphoma. N Engl J Med 2003;348:2396–406.
37. Borchmann P, Haverkamp H, Diehl V, et al. Eight cycles of escalated-dose BEACOPP compared with four cycles of escalated-dose BEACOPP followed by four cycles of baseline-dose BEACOPP with or without radiotherapy in patients with advanced-stage hodgkin’s lymphoma: final analysis of the HD12 trial of the German Hodgkin Study Group. J Clin Oncol 2011;29:4234–42.
38. Engert A, Haverkamp H, Kobe C, et al. Reduced-intensity chemotherapy and PET-guided radiotherapy in patients with advanced stage Hodgkin’s lymphoma (HD15 trial): a randomised, open-label, phase 3 non-inferiority trial. Lancet 2012;379:1791–9.
39. Nademanee A, Molina A, Fung H, et al. High-dose chemo/radiotherapy and autologous bone marrow or stem cell transplantation for poor-risk advanced-stage Hodgkin’s disease during first partial or complete remission. Biol Blood Marrow Transplant 1999;5:292–8.
40. Federico M, Bellei M, Brice P, et al. High-dose therapy and autologous stem-cell transplantation versus conventional therapy for patients with advanced Hodgkin’s lymphoma responding to front-line therapy. J Clin Oncol 2003;21:2320–5.
41. Arakelyan N, Berthou C, Desablens B, et al. Early versus late intensification for patients with high-risk Hodgkin lymphoma-3 cycles of intensive chemotherapy plus low-dose lymph node radiation therapy versus 4 cycles of combined doxorubicin, bleomycin, vinblastine, and dacarbazine plus myeloablative chemotherapy with autologous stem cell transplantation: five-year results of a randomized trial on behalf of the GOELAMS Group. Cancer 2008;113:3323–30.
42. Moskowitz CH, Nimer SD, Zelenetz AD, et al. A 2-step comprehensive high-dose chemoradiotherapy second-line program for relapsed and refractory Hodgkin disease: analysis by intent to treat and development of a prognostic model. Blood 2001;97:616–23.
43. Josting A, Rudolph C, Reiser M, et al. Time-intensified dexamethasone/cisplatin/cytarabine: an effective salvage therapy with low toxicity in patients with relapsed and refractory Hodgkin’s disease. Ann Oncol 2002;13:1628–35.
44. Aparicio J, Segura A, Garcera S, et al. ESHAP is an active regimen for relapsing Hodgkin’s disease. Ann Oncol 1999;10:593–5.
45. Baetz T, Belch A, Couban S, et al. Gemcitabine, dexamethasone and cisplatin is an active and non-toxic chemotherapy regimen in relapsed or refractory Hodgkin’s disease: a phase II study by the National Cancer Institute of Canada Clinical Trials Group. Ann Oncol 2003;14:1762–7.
46. Gopal AK, Press OW, Shustov AR, et al. Efficacy and safety of gemcitabine, carboplatin, dexamethasone, and rituximab in patients with relapsed/refractory lymphoma: a prospective multi-center phase II study by the Puget Sound Oncology Consortium. Leuk Lymphoma 2010;51:1523–9.
47. Santoro A, Magagnoli M, Spina M, et al. Ifosfamide, gemcitabine, and vinorelbine: a new induction regimen for refractory and relapsed Hodgkin’s lymphoma. Haematologica 2007;92:35–41.
48. Bartlett NL, Niedzwiecki D, Johnson JL, et al. Gemcitabine, vinorelbine, and pegylated liposomal doxorubicin (GVD), a salvage regimen in relapsed Hodgkin’s lymphoma: CALGB 59804. Ann Oncol 2007;18:1071–9.
49. Santoro A, Bonadonna G. Prolonged disease-free survival in MOPP-resistant Hodgkin’s disease after treatment with adriamycin, bleomycin, vinblastine and dacarbazine (ABVD). Cancer Chemother Pharmacol 1979;2:101–5.
50. Krikorian JG, Portlock CS, Rosenberg SA. Treatment of advanced Hodgkin’s disease with adriamycin, bleomycin, vinblastine, and imidazole carboxamide (ABVD) after failure of MOPP therapy. Cancer 1978;41:2107–11.
51. Piga A, Ambrosetti A, Todeschini G, et al. Doxorubicin, bleomycin, vinblastine, and dacarbazine (ABVD) salvage of mechlorethamine, vincristine, prednisone, and procarbazine (MOPP)-resistant advanced Hodgkin’s disease. Cancer Treat Rep 1984;68:947–51.
52. Moskowitz AJ, Hamlin PA Jr, Perales MA, et al. Phase II study of bendamustine in relapsed and refractory Hodgkin lymphoma. J Clin Oncol 2013;31:456–60.
53. Anastasia A, Carlo-Stella C, Corradini P, et al. Bendamustine for relapsed/refractory classical Hodgkin lymphoma after high dose chemotherapy and or allogeneic transplant: a study of Fondazione Italiana Linfomi (FIL). Blood 2012;120:3652.
54. Martin A, Fernandez-Jimenez MC, Caballero MD, et al. Long-term follow-up in patients treated with Mini-BEAM as salvage therapy for relapsed or refractory Hodgkin’s disease. Br J Haematol 2001;113:161–71.
55. Schmitz N, Pfistner B, Sextro M, et al. Aggressive conventional chemotherapy compared with high-dose chemotherapy with autologous haemopoietic stem-cell transplantation for relapsed chemosensitive Hodgkin’s disease: a randomised trial. Lancet 2002;359:2065–71.
56. Fisher RI, DeVita VT, Hubbard SP, et al. Prolonged disease-free survival in Hodgkin’s disease with MOPP reinduction after first relapse. Ann Intern Med 1979;90:761–3.
57. ChlVPP therapy for Hodgkin’s disease: experience of 960 patients. The International ChlVPP Treatment Group. Ann Oncol 1995;6:167–72.
58. Selby P, Patel P, Milan S, et al. ChlVPP combination chemotherapy for Hodgkin’s disease: long-term results. Br J Cancer 1990;62:279–85.
59. Santoro A, Bredenfeld H, Devizzi L, et al. Gemcitabine in the treatment of refractory Hodgkin’s disease: results of a multicenter phase II study. J Clin Oncol 2000;18:2615–9.
60. Little R, Wittes RE, Longo DL, Wilson WH. Vinblastine for recurrent Hodgkin’s disease following autologous bone marrow transplant. J Clin Oncol 1998;16:584–8.
61. Chen R, Palmer JM, Martin P, et al. Results of a multicenter phase II trial of brentuximab vedotin as second-line therapy before autologous transplantation in relapsed/refractory Hodgkin lymphoma. Biol Blood Marrow Transplant 2015;21:2136–40.
62. Moskowitz CH, Yahalom J, Zelenetz AD, et al. High-dose chemo-radiotherapy for relapsed or refractory Hodgkin lymphoma and the significance of pre-transplant functional imaging. Br J Haematol 2010;148:890–7.
63. Sureda A, Constans M, Iriondo A, et al. Prognostic factors affecting long-term outcome after stem cell transplantation in Hodgkin’s lymphoma autografted after a first relapse. Ann Oncol 2005;16:625–33.
64. Crocchiolo R, Canevari C, Assanelli A, et al. Pre-transplant 18FDG-PET predicts outcome in lymphoma patients treated with high-dose sequential chemotherapy followed by autologous stem cell transplantation. Leuk Lymphoma 2008;49:727–33.
65. Mocikova H, Pytlik R, Markova J, et al. Pre-transplant positron emission tomography in patients with relapsed Hodgkin lymphoma. Leuk Lymphoma 2011;52:1668–74.
66. Younes A, Gopal AK, Smith SE, et al. Results of a pivotal phase II study of brentuximab vedotin for patients with relapsed or refractory Hodgkin’s lymphoma. J Clin Oncol 2012;30:2183–9.
67. Gopal AK, Chen R, Smith SE, et al. Durable remissions in a pivotal phase 2 study of brentuximab vedotin in relapsed or refractory Hodgkin lymphoma. Blood 2015;125:1236–43.
68. Ansell SM, Lesokhin AM, Borrello I, et al. PD-1 blockade with nivolumab in relapsed or refractory Hodgkin’s lymphoma.N Engl J Med 2015;372:311–9.
69. Chen R, Zinzani PL, Fanale MA, et al. Phase II study of the efficacy and safety of pembrolizumab for relapsed/refractory classic Hodgkin lymphoma. J Clin Oncol 2017;35:2125–32.
70. Haverkos BM, Abbott D, Hamadani M, et al. PD-1 blockade for relapsed lymphoma post-allogeneic hematopoietic cell transplant: high response rate but frequent GVHD. Blood 2017;130:221–8.
71. Herbaux C, Gauthier J, Brice P, et al. Efficacy and tolerability of nivolumab after allogeneic transplantation for relapsed Hodgkin lymphoma. Blood 2017;129:2471–8.
72. Merryman RW, Kim HT, Zinzani PL et al. Safety and efficacy of allogeneic hematopoietic stem cell transplant after PD-1 blockage in relapsed/refractory lymphoma. Blood 2017;129:1380–8.
73. Linch DC, Winfield D, Goldstone AH, et al. Dose intensification with autologous bone-marrow transplantation in relapsed and resistant Hodgkin’s disease: results of a BNLI randomised trial. Lancet 1993;341:1051–4.
74. Yuen AR, Rosenberg SA, Hoppe RT, et al. Comparison between conventional salvage therapy and high-dose therapy with autografting for recurrent or refractory Hodgkin’s disease. Blood 1997;89:814–22.
75. Gutierrez-Delgado F, Holmberg L, Hooper H, et al. Autologous stem cell transplantation for Hodgkin’s disease: busulfan, melphalan and thiotepa compared to a radiation-based regimen. Bone Marrow Transplant 2003;32:279–85.
76. Hake CR, Graubert TA, Fenske TS. Does autologous transplantation directly increase the risk of secondary leukemia in lymphoma patients? Bone Marrow Transplant 2007;39:59–70.
77. Hahn T, McCarthy PL, Carreras J, et al. Comparison of prognostic models for autologous hematopoietic stem cell transplantation (AHCT) for relapsed Hodgkin lymphoma. Blood 2009;114:1215.
78. Chen Y-B, Lane AA, Logan BR, et al. Impact of conditioning regimen on outcomes for patients with lymphoma undergoing high-dose therapy with autologous hematopoietic cell transplantation. Biology Blood Marrow Transplant 2015;21:1046–53.
79. Wendland MM, Asch JD, Pulsipher MA, et al. The impact of involved field radiation therapy for patients receiving high-dose chemotherapy followed by hematopoietic progenitor cell transplant for the treatment of relapsed or refractory Hodgkin disease. Am J Clin Oncol 2006;29:189–95.
80. Biswas T, Culakova E, Friedberg JW, et al. Involved field radiation therapy following high dose chemotherapy and autologous stem cell transplant benefits local control and survival in refractory or recurrent Hodgkin lymphoma. Radiother Oncol 2012;103:367–72.
81. Levis M, Piva C, Filippi AR, et al. Potential benefit of involved-field radiotherapy for patients with Relapsed-refractory Hodgkin’s lymphoma with incomplete response before autologous stem cell transplantation. Clin Lymphoma Myeloma Leuk 2017;17:14–22.
82. Josting A, Franklin J, May M, et al. New prognostic score based on treatment outcome of patients with relapsed Hodgkin’s lymphoma registered in the database of the German Hodgkin’s lymphoma study group. J Clin Oncol 2002;20:221–30.
83. Moskowitz CH, Nademanee A, Masszi T, et al. Brentuximab vedotin as consolidation therapy after autologous stem-cell transplantation in patients with Hodgkin’s lymphoma at risk of relapse or progression (AETHERA): a randomised, double-blind, placebo-controlled, phase 3 trial. Lancet 2015;385:1853–62.
84. Bonfante V, Santoro A, Viviani S, et al. Outcome of patients with Hodgkin’s disease failing after primary MOPP-ABVD. J Clin Oncol 1997;15:528–34.
85. Josting A, Rueffer U, Franklin J, et al. Prognostic factors and treatment outcome in primary progressive Hodgkin lymphoma: a report from the German Hodgkin Lymphoma Study Group. Blood 2000;96:1280–6.
86. Josting A, Nogova L, Franklin J, et al. Salvage radiotherapy in patients with relapsed and refractory Hodgkin’s lymphoma: a retrospective analysis from the German Hodgkin Lymphoma Study Group. J Clin Oncol 2005;23:1522–9.
87. Campbell B WA, Milner A, Di Iulio J, et al. Long-term follow-up of salvage radiotherapy in Hodgkin’s lymphoma after chemotherapy failure. Int J Radiat Oncol Biol Phys 2005;63:1538–45.
88. Wirth A, Corry J, Laidlaw C, et al. Salvage radiotherapy for Hodgkin’s disease following chemotherapy failure. Int J Radiat Oncol Biol Phys 1997;39:599–607.
89. Schulz H, Rehwald U, Morschhauser F, et al. Rituximab in relapsed lymphocyte-predominant Hodgkin lymphoma: long-term results of a phase 2 trial by the German Hodgkin Lymphoma Study Group (GHSG). Blood 2008;111:109–11.
90. Ekstrand BC, Lucas JB, Horwitz SM, et al. Rituximab in lymphocyte-predominant Hodgkin disease: results of a phase 2 trial. Blood 2003;101:4285–9.
91. Younes A, Romaguera J, Hagemeister F, et al. A pilot study of rituximab in patients with recurrent, classic Hodgkin disease. Cancer 2003;98:310–4.
92. Rehwald U, Schulz H, Reiser M, et al. Treatment of relapsed CD20+ Hodgkin lymphoma with the monoclonal antibody rituximab is effective and well tolerated: results of a phase 2 trial of the German Hodgkin Lymphoma Study Group. Blood 2003;101:420–4.
93. Fehniger TA, Larson S, Trinkaus K, et al. A phase 2 multicenter study of lenalidomide in relapsed or refractory classical Hodgkin lymphoma. Blood 2011;118:5119–25.
94. Boll B, Borchmann P, Topp MS, et al. Lenalidomide in patients with refractory or multiple relapsed Hodgkin lymphoma. Br J Haematol 2010;148:480–2.
95. LaCasce AS, Bociek G, Sawas A, et al. Brentuximab vedotin plus bendamustine: a highly active salvage treatment regimen for patients with relapsed or refractory Hodgkin lymphoma. Blood 2015;126:3982.
96. Diefenbach CS, Hong F, David KA, et al. A phase I study with an expansion cohort of the combination of ipilimumab and nivolumab and brentuximab vedotin in patients with relapsed/refractory Hodgkin lymphoma: A trial of the ECOG-ACRIN Cancer Research Group (E4412 Arms D and E). Blood 2016;128:1106.
97. Herrera AF, Bartlett NL, Ramchandren R, et al. Preliminary results from a phase 1/2 study of brentuximab vedotin in combination with nivolumab in patients with relapsed or refractory Hodgkin lymphoma. Blood 2016;128:1105.
98. Johnston PB, Inwards DJ, Colgan JP, et al. A phase II trial of the oral mTOR inhibitor everolimus in relapsed Hodgkin lymphoma. Am J Hematol 2010;85:320–4.
99. Kewalramani T, Nimer SD, Zelenetz AD, et al. Progressive disease following autologous transplantation in patients with chemosensitive relapsed or primary refractory Hodgkin’s disease or aggressive non-Hodgkin’s lymphoma. Bone Marrow Transplant 2003;32:673–9.
100. Lin TS, Avalos BR, Penza SL, et al. Second autologous stem cell transplant for multiply relapsed Hodgkin’s disease. Bone Marrow Transplant 2002;29:763–7.
101. Smith SM, van Besien K, Carreras J, et al. Second autologous stem cell transplantation for relapsed lymphoma after a prior autologous transplant. Biol Blood Marrow Transplant 2008;14:904–12.
102. Gajewski JL, Phillips GL, Sobocinski KA, et al. Bone marrow transplants from HLA-identical siblings in advanced Hodgkin’s disease. J Clin Oncol 1996;14:572–8.
103. Peniket AJ, Ruiz de Elvira MC, Taghipour G, et al. An EBMT registry matched study of allogeneic stem cell transplants for lymphoma: allogeneic transplantation is associated with a lower relapse rate but a higher procedure-related mortality rate than autologous transplantation. Bone Marrow Transplant 2003;31:667–78.
104. Anderlini P, Saliba R, Acholonu S, et al. Fludarabine-melphalan as a preparative regimen for reduced-intensity conditioning allogeneic stem cell transplantation in relapsed and refractory Hodgkin’s lymphoma: the updated M.D. Anderson Cancer Center experience. Haematologica 2008;93:257–64.
105. Burroughs LM, O’Donnell PV, Sandmaier BM, et al. Comparison of outcomes of HLA-matched related, unrelated, or HLA-haploidentical related hematopoietic cell transplantation following nonmyeloablative conditioning for relapsed or refractory Hodgkin lymphoma. Biol Blood Marrow Transplant 2008;14:1279–87.
106. Peggs KS, Hunter A, Chopra R, et al. Clinical evidence of a graft-versus-Hodgkin’s-lymphoma effect after reduced-intensity allogeneic transplantation. Lancet 2005;365:1934–41.
107. Sureda A, Robinson S, Canals C, et al. Reduced-intensity conditioning compared with conventional allogeneic stem-cell transplantation in relapsed or refractory Hodgkin’s lymphoma: an analysis from the Lymphoma Working Party of the European Group for Blood and Marrow Transplantation. J Clin Oncol 2008;26:455–62.
108. Devetten MP, Hari PN, Carreras J, et al. Unrelated donor reduced-intensity allogeneic hematopoietic stem cell transplantation for relapsed and refractory Hodgkin lymphoma. Biol Blood Marrow Transplant 2009;15:109–17.
109. Sureda A, Canals C, Arranz R, et al. Allogeneic stem cell transplantation after reduced intensity conditioning in patients with relapsed or refractory Hodgkin’s lymphoma. Results of the HDR-ALLO study - a prospective clinical trial by the Grupo Espanol de Linfomas/Trasplante de Medula Osea (GEL/TAMO) and the Lymphoma Working Party of the European Group for Blood and Marrow Transplantation. Haematologica 2012;97:310–7.
110. Sarina B, Castagna L, Farina L, et al. Allogeneic transplantation improves the overall and progression-free survival of Hodgkin lymphoma patients relapsing after autologous transplantation: a retrospective study based on the time of HLA typing and donor availability. Blood 2010;115:3671–7.
111. Castagna L, Sarina B, Todisco E, et al. Allogeneic stem cell transplantation compared with chemotherapy for poor-risk Hodgkin lymphoma. Biol Blood Marrow Transplant 2009;15:432–8.
112. Thomson KJ, Peggs KS, Smith P, et al. Superiority of reduced-intensity allogeneic transplantation over conventional treatment for relapse of Hodgkin’s lymphoma following autologous stem cell transplantation. Bone Marrow Transplant 2008;41:765–70.
113. Chen R, Palmer JM, Thomas SH, et al. Brentuximab vedotin enables successful reduced-intensity allogeneic hematopoietic cell transplantation in patients with relapsed or refractory Hodgkin lymphoma. Blood 2012;119:6379–81.
INTRODUCTION
Hodgkin lymphoma, previously known as Hodgkin’s disease, is a B-cell lymphoproliferative disease characterized by a unique set of pathologic and epidemiologic features. The disease is characterized by the presence of multinucleate giant cells called Hodgkin Reed-Sternberg (HRS) cells.1 Hodgkin lymphoma is unique compared to other B-cell lymphomas because of the relative rarity of the malignant cells within affected tissues. The HRS cells, which usually account for only 0.1% to 10% of the cells, induce accumulation of nonmalignant lymphocytes, macrophages, granulocytes, eosinophils, plasma cells, and histiocytes, which then constitute the majority of tumor cellularity.2 Although the disease was first described by Sir Thomas Hodgkin in 1832, in part because of this unique histopathology, it was not until the 1990s that it was conclusively demonstrated that HRS cells are in fact monoclonal germinal center–derived B cells.
Due to the development of highly effective therapies for Hodgkin lymphoma, cure is a reasonable goal for most patients. Because of the high cure rate, late complications of therapy must be considered when selecting treatment. This article reviews the clinical features and treatment options for advanced stage and relapsed/refractory Hodgkin lymphoma. A previously published article reviewed the epidemiology, etiology/pathogenesis, pathologic classification, initial workup, and staging evaluation of Hodgkin lymphoma, as well as the prognostic stratification and treatment of patients with early-stage Hodgkin lymphoma.3
PRESENTATION, INITIAL EVALUATION, AND PROGNOSIS
Overall, classical Hodgkin lymphoma (cHL) usually presents with asymptomatic mediastinal or cervical lymphadenopathy. At least 50% of patients will have stage I or II disease.4 A mediastinal mass is seen in most patients with nodular sclerosis cHL, at times showing the characteristics of bulky (> 10 cm) disease. Constitutional, or B, symptoms (fever, night sweats, and weight loss) are present in approximately 25% of all patients with cHL, but 50% of advanced stage patients. Between 10% and 15% of patients will have extranodal disease, most commonly involving lung, bone, and liver. Lymphocyte-predominant Hodgkin lymphoma (LPHL) is a rare histological subtype of Hodgkin lymphoma that is differentiated from cHL by distinct clinicopathological features. The clinical course and treatment approach for LPHL are dependent upon the stage of disease. The clinicopathological features of LPHL are discussed in the early-stage Hodgkin lymphoma article.3
For the purposes of prognosis and selection of treatment, Hodgkin lymphoma is commonly classified as early stage favorable, early stage unfavorable, and advanced stage. For advanced stage Hodgkin lymphoma patients, prognosis can be defined using a tool commonly referred to as the International Prognostic Score (IPS). This index consists of 7 factors: male gender, age 45 years or older, stage IV disease, hemoglobin < 10.5 g/dL, white blood cell (WBC) count > 15,000/μL, lymphopenia (absolute lymphocyte count < 600 cells/μL or lymphocytes < 8% of WBC count), and serum albumin < 4 g/dL.5 In the original study by Hasenclever et al,5 the 5-year freedom from progression (FFP) ranged from 42% to 84% and the 5-year overall survival (OS) ranged from 56% to 90%, depending on the number of factors present. This scoring system, however, was developed using a patient population treated prior to 1992. Using a more recently treated patient population, the British Columbia Cancer Agency (BCCA) found that the IPS is still valid for prognostication, but outcomes have improved across all IPS groups, with 5-year FFP now ranging from 62% to 88% and 5-year OS ranging from 67% to 98%.6 This improvement is likely a reflection of improved therapy and supportive care. Table 1 shows the PFS and OS within each IPS group, comparing the data from the German Hodgkin Study Group (GHSG) and BCCA group.5,6
High expression of CD68 is associated with adverse outcomes, whereas high FOXP3 and CD20 expression on tumor cells are predictors of superior outcomes.8 A recent study found that CD68 expression was associated with OS. Five-year OS was 88% in those with less than 25% CD68 expression, versus 63% in those with greater than 25% CD68 expression.9
Roemer and colleagues evaluated 108 newly diagnosed cHL biopsy specimens and found that almost all cHL patients had concordant alteration of PD-L1 (programmed death ligand-1) and PD-L2 loci, with a spectrum of 9p24.1 alterations ranging from low level polysomy to near uniform 9p24.1 amplification. PD-L1/PD-L2 copy number alterations are therefore a defining pathobiological feature of cHL.10 PFS was significantly shorter for patients with 9p24.1 amplification, and those patients were likely to have advanced disease suggesting that 9p24.1 amplification is associated with less favorable prognosis.10 This may change with the increasing use of PD-1 inhibitors in the treatment of cHL.
High baseline metabolic tumor volume and total lesion glycolysis have also been associated with adverse outcomes in cHL. While not routinely assessed in practice currently, these tools may ultimately be used to assess prognosis and guide therapy in clinical practice.11
ADVANCED STAGE HODGKIN LYMPHOMA
FRONTLINE THERAPY
First-line Chemotherapy
Chemotherapy plays an essential role in the treatment of advanced stage Hodgkin lymphoma. In the 1960s, the MOPP regimen (nitrogen mustard, vincristine, procarbazine, prednisone) was developed, with a 10-year OS of 50% and a progression-free survival (PFS) of 52% reported in advanced stage patients. The complete remission (CR) rate was 81%, and 36% of patients who achieved CR relapsed later.12 This chemotherapy regimen is associated with a significant rate of myelosuppression and infertility as well as long-term risk of secondary myelodysplasia and acute leukemias.13,14 This led to the development of newer regimens such as ABVD (doxorubicin, bleomycin, vinblastine, dacarbazine).15 In a randomized trial, ABVD showed improved failure-free survival (FFS) over MOPP (61% versus 50% at 5 years) but similar OS (66%–73%).16 In light of these findings, and considering the lower rate of infertility and myelotoxicity, ABVD became the standard of care for advanced stage cHL in the United States.
The Stanford V regimen was developed in an attempt to further minimize toxicity.17 Stanford V is a condensed, 12-week chemotherapy regimen that includes mechlorethamine, doxorubicin, vinblastine, etoposide, prednisone, vincristine, and bleomycin, followed by involved-field radiation therapy (IFRT). Subsequent trials compared the Stanford V and ABVD regimens and showed similar OS, freedom from treatment failure (FFTF), and response rates.18,19 The ABVD regimen was noted to have higher pulmonary toxicity, while other toxicities such as lymphopenia and neuropathy were higher with the Stanford V regimen. In addition, Stanford V requires patients to receive radiation therapy (RT) to original sites of disease larger than 5 cm in size and contiguous sites.
Another regimen which has been studied extensively for advanced stage Hodgkin lymphoma, and is considered a standard of care in some parts of the world, is escalated BEACOPP (bleomycin, etoposide, doxorubicin, cyclophosphamide, vincristine, procarbazine, prednisone). In the HD9 study (n = 1196), the GHSG evaluated BEACOPP, escalated BEACOPP, and COPP/ABVD in advanced stage Hodgkin lymphoma.20 All arms of the study included 30 Gy RT to sites of bulky disease or residual disease. This study showed improved OS and FFTF with escalated BEACOPP, but at the cost of higher rates of toxicity. At 10 years, FFTF was 64%, 70%, and 82% with OS rates of 75%, 80%, and 86% for COPP/ABVD, baseline BEACOPP, and escalated BEACOPP, respectively (P < 0.001). The rate of secondary acute leukemia 10 years after treatment was 0.4% for COPP/ABVD, 1.5% for BEACOPP, and 3.0% for escalated BEACOPP. However, 3 subsequent randomized trials did not confirm a survival benefit with escalated BEACOPP relative to ABVD. In the HD 2000 trial (n = 295)21 and in a trial by Viviani and colleagues (n = 331),22 an improvement in OS was not demonstrated in favor of escalated BEACOPP. These studies also confirmed a higher rate of toxicities as well as secondary malignancies associated with the escalated BEACOPP regimen. In the EORTC20012 Intergroup trial (n = 549), 8 cycles of ABVD was compared with 4 cycles of escalated BEACOPP followed by 4 cycles of baseline BEACOPP, without radiation, in patients with clinical stage III or IV Hodgkin lymphoma with IPS score ≥ 3. Both regimens resulted in statistically similar FFS (63.7% in ABVD × 8 versus 69.3% in BEACOPP 4+4) and OS (86.7% in ABVD × 8 vs 90.3% in BEACOPP 4+4).23
In the United States, ABVD (6–8 cycles) is commonly used, although escalated BEACOPP (particularly for patients with an IPS of 4 or higher) and Stanford V are considered appropriate as well.24 In the North American Intergroup study comparing ABVD to Stanford V, and in the trial by Viviani et al, ABVD was associated with a 5- to 7-year FFS of 73% to 79% and OS of 84% to 92%.19,22 Given these excellent results, as well as the potential to cure patients with second-line therapy consisting of autologous hematopoietic cell transplantation (auto-HCT), the general consensus among most U.S. hematologists and oncologists is that ABVD remains the treatment of choice, and that the improved FFS/PFS with escalated BEACOPP is not outweighed by the additional toxicity associated with the regimen. There may, however, be a role for escalated BEACOPP in select patients who have a suboptimal response to ABVD as defined by interim positron emission tomography (iPET) scan (see below).
Brentuximab vedotin is an anti-CD30 antibody-drug conjugate (ADC) consisting of an anti-CD30 antibody linked to monomethyl auristatin E (MMAE), a potent antitubulin agent. CD30 is highly expressed on HRS cells and also in anaplastic large cell lymphoma. Upon binding to CD30, the ADC/CD30 complex is then internalized and directed to the lysosome, where the ADC is proteolytically cleaved, releasing MMAE from the antibody. MMAE then disrupts microtubule networks within the cell, leading to G2/M cycle arrest and apoptosis. CD30 is consistently expressed on HRS cells. In addition to being studied in the relapsed/refractory setting (described below), brentuximab has been studied in the first-line setting. In a phase 1 trial, brentuximab combined with ABVD was associated with increased pulmonary toxicity, while brentuximab + AVD had no significant pulmonary toxicity, with an excellent CR rate (96%), suggesting that substituting brentuximab for bleomycin may be an effective strategy. In addition to possibly being more efficacious, this strategy would also have the benefit of eliminating the risk of bleomycin pulmonary toxicity.25 Based on this data, a large international phase 3 study (the ECHELON-1 trial) comparing ABVD versus brentuximab + AVD in advanced stage cHL patients was recently completed. This study enrolled 1334 patients, and preliminary results were recently announced. With a median follow-up of 24 months, the brentuximab + AVD arm had a 4.9% absolute improvement in PFS relative to the ABVD arm (82.1% versus 77.2%). The brentuximab + AVD arm had an increased incidence of febrile neutropenia, managed with growth factors and peripheral neuropathy requiring dose adjustments, whereas the ABVD arm had an increased rate and severity of pulmonary toxicity.26 Further follow-up will be required to determine whether this will translate into a survival benefit. See Table 2 for a summary of recent large randomized prospective phase 3 trials in advanced stage Hodgkin lymphoma.
Alternative Regimens in Older Patients
Patients older than 60 years of age often have poor tolerance for ABVD and especially escalated BEACOPP. This results in increased treatment-related mortality and reduced overall dose intensity, with higher relapse rates and poor OS. In an attempt to improve on the results of treatment of elderly patients with Hodgkin lymphoma, alternative regimens have been explored. One example is PVAG (prednisone, vinblastine, doxorubicin, gemcitabine). With this regimen, the 3-year OS was 66% and PFS was 58%. One patient out of 59 died from treatment-related toxicity, which is much improved over the historical figures for elderly patients with Hodgkin lymphoma.27 Another commonly used approach in practice is to simply omit bleomycin from ABVD. In the early-stage setting (GHSG HD-13 trial), this regimen (referred to as AVD) led to 89.6% PFS at 5 years, compared to 93.5% with ABVD.28 It therefore stands to reason that this should be a reasonable option in older or more frail advanced stage cHL patients as well.
Brentuximab has been evaluated as a single-agent therapy for first-line therapy of elderly patients with Hodgkin lymphoma. In a phase 2 study, 27 patients (63% with advanced stage disease) were treated, with a 92% overall response rate and 73% CR rate. However the median duration of remission was disappointing at only 9.1 months.29 Based on this data, single-agent brentuximab appears to be a reasonable and well tolerated option for frail or elderly patients, although with the caveat that long-term disease control is relatively uncommon.
RESPONSE-ADAPTED FRONTLINE THERAPY USING INTERIM PET SCAN
In recent years, response-adapted treatment approaches have been extensively researched in cHL using iPET. The goal is to reduce toxicity by minimizing therapy in those who achieve negative iPET and/or to intensify treatment for patients with suboptimal response on iPET. Gallamini et al evaluated the prognostic role of an early iPET scan in advanced Hodgkin lymphoma patients (n = 190) treated with ABVD. This study found that patients with positive iPET had a 2-year PFS of 12.8% versus 95.0% in patients with negative iPET. This result was highly statistically significant (P < 0.0001). This study also showed that PET-2 (iPET after 2 cycles of ABVD) superseded the prognostic value of the IPS at diagnosis.30 As a result, numerous subsequent studies have been pursued using iPET for risk-adapted treatment in cHL.
A critical element to the conduct of iPET risk-adapted treatment for cHL is the interpretation of the iPET. In hopes of standardizing iPET interpretation in clinical trials, a scoring system called the Deauville score was developed. The Deauville score ranges from 1 to 5 (Table 3).
The SWOG (Southwest Oncology Group) S0816 trial (n = 358) evaluated iPET-adapted treatment after 2 cycles of ABVD in stage III or IV Hodgkin lymphoma patients. Patients with positive iPET (Deauville score 4 to 5; n = 60) received escalated BEACOPP for 6 cycles, whereas iPET-negative (Deauville score 1 to 3; n = 271) patients continued to receive 4 more cycles of ABVD. The 2-year PFS was 64% for iPET-positive patients.33 This PFS was much higher than the expected 15% to 30% from prior studies such as Gallamini et al,30 suggesting that the treatment intensification may have been of benefit.
In the HD0801 study (n = 519), newly diagnosed advanced Hodgkin lymphoma patients with positive iPET after 2 cycles of ABVD (n = 103) received early ifosfamide-containing salvage therapy followed by high-dose therapy with autologous stem cell rescue. The 2-year PFS was 76% for PET-2–positive patients, comparable with PET-2–negative patients who had PFS of 81%.34 Again, this result for iPET-positive patients was much better than expected based on the historical control from Gallamini et al, suggesting that the treatment intensification may have been beneficial. It should be emphasized, however, that neither HD0801 nor S0816 were randomized prospective trials; rather, all iPET-positive patients were assigned to an intensified treatment approach.
In the HD18 trial (n = 1100), patients with advanced stage cHL started therapy with escalated BEACOPP and underwent an iPET after 2 cycles. For those with a positive iPET, rituximab was added to escalated BEACOPP in the experimental arm (n = 220) for cycles 3 through 8. The control group (n = 220) continued to receive 6 more cycles of escalated BEACOPP. In the 2 groups, the 3-year PFS was similar (91.4% in escalated BEACOPP, 93% in rituximab + escalated BEACOPP), suggesting no significant benefit with addition of rituximab.35 This study also calls into question whether iPET provides useful information for patients receiving intensive therapy such as escalated BEACOPP, and indicates that the historical control data for iPET-positive patients from Gallamini et al may not be consistently reproduced in other prospective trials. As a result, nonrandomized trials that implement an iPET risk-adapted approach should be interpreted with caution. See Table 4 for a summary of recent trials in advanced stage Hodgkin lymphoma using iPET scan to guide therapy.
RADIATION THERAPY IN FRONTLINE TREATMENT
In patients with advanced stage Hodgkin lymphoma, IFRT to initial bulky sites of disease may be incorporated into frontline therapy to improve local control. However, whether this provides a survival benefit and which patients benefit most from consolidative RT remain unclear.
The European Organization for Research and Treatment of Cancer (EORTC) completed a randomized study in advanced stage Hodgkin lymphoma patients who achieved complete or partial remission after MOPP-ABV.36 Patients in CR were randomly assigned to receive no further treatment versus IFRT (24 Gy to all initially involved nodal areas and 16 to 24 Gy to all initially involved extranodal sites). Patients in partial remission (PR) were treated with 30 Gy to nodal areas and 18 to 24 Gy to extranodal sites. Among the CR patients, the 5-year event-free survival (EFS) was 79% to 84% and did not differ for those who received radiation versus those who did not. Five-year OS was 85% to 91% and also did not differ between the 2 groups. However, among the patients in PR after chemotherapy, the 5-year EFS was 79% and the 5-year OS was 87%, which is better than expected for PR patients, indicating a possible benefit to RT in patients with a partial response after chemotherapy. In the GHSG HD12 trial, patients with advanced stage Hodgkin lymphoma who had a residual lesion by computed tomography (CT) (but not analyzed by PET) had a very subtle improvement in FFTF (90% versus 87%) in favor of consolidation with IFRT, but again no survival benefit was seen.37
The EORTC and HD12 studies described above utilized CT scan for assigning remission status following chemotherapy, and it is now well known that many patients with residual masses (by CT) after chemotherapy may in fact be cured, as such residual radiographic abnormalities may simply be composed of fibrosis. PET scan is more accurate than CT in identifying patients who truly have residual active disease following chemotherapy. As a result, the EORTC study discussed above and the GHSG HD12 trial are of limited relevance in the modern era, in which patients routinely undergo PET scan at the end of therapy. Restricting IFRT to sites that remain PET-positive after completing chemotherapy may be a reasonable strategy that would allow for the avoidance of RT in many patients, and may obviate the need for aggressive second-line therapy (eg, high-dose therapy and autologous hematopoietic cell transplant [auto-HCT]). This approach was taken in the GHSG HD15 trial (n = 2182) in which advanced stage patients were treated with 3 variations on the BEACOPP regimen (8 cycles of escalated BEACOPP, 6 cycles of escalated BEACOPP, or 8 cycles of baseline BEACOPP, randomized in a 1:1:1 ratio). Patients with a residual mass of 2.5 cm or greater on CT scan then underwent a PET scan; if the lesion was PET positive, it was treated with 30 Gy of IFRT. This overall strategy was very effective, with 5-year FFTF rates of 84.4%, 89.3%, and 85.4%, respectively. The OS rates were 91.9%, 95.3%, and 94.5%, respectively. For patients with lesions that remained PET positive after chemotherapy, the PFS rate was 86.2% at 48 months, whereas patients in PR with persistent mass ≥ 2.5 cm but with negative PET had a PFS of 92.6%, similar to that of patients in CR.38 With this approach of BEACOPP followed by PET-guided radiation, the proportion of patients receiving RT was reduced from 71% (in the HD9 study) to only 11% in the HD15 study,38 with no apparent loss in overall efficacy when comparing the results of the 2 studies.
UPFRONT STEM CELL TRANSPLANTATION
To further improve outcomes of patients with advanced Hodgkin lymphoma with high-risk disease, high-dose therapy with auto-HCT has been explored as part of frontline therapy. While this has been shown to be feasible in such patients,39 randomized trials have not shown a clear benefit in terms of FFS or OS with upfront auto-HCT. 40,41 Therefore, auto-HCT is not considered a standard component of frontline therapy for cHL patients who achieve CR by PET/CT scan.
RELAPSED AND REFRACTORY HODGKIN LYMPHOMA
Depending on the stage, risk factors, and frontline regimen utilized, between 5% and 40% of patients with Hodgkin lymphoma can be expected to experience either primary induction failure or a relapse after attaining remission with frontline therapy.3 Primary refractory Hodgkin lymphoma, which occurs in up to 5% to 10% of patients, is defined as progression or no response during induction treatment or within 90 days of completing treatment. In cases where remission status is in question, an updated tissue biopsy is recommended. Biopsy is also recommended in cases in which new sites of disease have appeared or if relapse has occurred after a durable period of remission. Restaging is recommended at the time of relapse.
For younger patients with relapsed/refractory Hodgkin lymphoma, the standard of care in most cases is second-line (or salvage) chemotherapy followed by high-dose therapy and auto-HCT. For patients not felt to be candidates for auto-HCT, options include conventional second-line chemotherapy alone, salvage radiotherapy, novel agents such as brentuximab or immune checkpoint inhibitors, and/or participation in clinical trials.
CONVENTIONAL MULTI-AGENT CHEMOTHERAPY REGIMENS
Numerous conventional regimens have been shown in phase 2 studies to be active in relapsed and refractory Hodgkin lymphoma. These include platinum-based regimens, gemcitabine-based regimens, and alkylator-based regimens. No randomized trials in Hodgkin lymphoma have been conducted comparing these regimens. In general, regimens are chosen based on the patient’s age, performance status, comorbidities, and whether auto-HCT is being considered.
In the United States, platinum-based regimens such as ICE (ifosfamide, carboplatin, etoposide),42 DHAP (dexamethasone, cisplatin, high-dose cytarabine),43 ESHAP (etoposide, methylprednisolone, high-dose cytarabine, cisplatin),44 GDP (gemcitabine, cisplatin, dexamethasone),45 and GCD (gemcitabine, carboplatin, dexamethasone)46 are all considered appropriate second-line therapy options for patients being considered for auto-HCT, due to their high response rates and because autologous hematopoietic stem cell collection remains feasible after these regimens. Response rates range from 60% to 88%, with CR rates between 17% and 41%, and toxic death rates generally well below 5%.
Other gemcitabine-based regimens such as IGEV (ifosfamide, gemcitabine, vinorelbine) and GVD (gemcitabine, vinorelbine, liposomal doxorubicin) are also effective.47,48 GVD is an excellent choice since it is a generally well-tolerated outpatient regimen with a 60% response rate even in heavily pretreated patients.48 Stem cell collection remains feasible after both IGEV and GVD as well. ABVD can produce CR in approximately 20% to 50% of patients initially treated with MOPP.49–51 In practice, however, most patients today with relapsed or refractory Hodgkin lymphoma have already received ABVD as part of their first-line therapy, and retreatment with ABVD is not a good option because it would be associated with prohibitively high cumulative doses of doxorubicin.
These multi-agent chemotherapy regimens may not be tolerated well in patients over age 65 to 70 years or those with significant underlying comorbidities. In recent years, bendamustine has emerged as one of the most active conventional agents for cHL, with overall response rates of 53% to 58% in heavily pre-treated patients.52,53 Bendamustine can generally be tolerated even in elderly patients as well.
Some centers, particularly in Europe, investigated aggressive salvage regimens such as mini-BEAM (carmustine, etoposide, cytarabine, melphalan)54 or dexa-BEAM (BEAM plus dexamethasone).55 These regimens, however, are associated with significant hematologic toxicity and high (2%–5%) treatment-related mortality. As a result, these are rarely used in the United States.
For patients who have progressed after (or are not candidates for) platinum- and/or gemcitabine-based therapy, older alkylator-based regimens such as MOPP, C-MOPP, or ChlVPP (chlorambucil, vinblastine, procarbazine, prednisone) can be considered.56–58 However, these regimens are associated with significant bone marrow suppression, and autologous hematopoietic stem cell collection may no longer be feasible after such regimens. Therefore, these regimens should only be given to patients not felt to be auto-HCT candidates, or patients for whom autologous hematopoietic stem cell collection has already been completed. Weekly vinblastine or single-agent gemcitabine are palliative chemotherapy options, with response rates in the 60% to 80% range. Patients can sometimes be maintained on such low-intensity palliative regimens for 6 to 12 months or longer.59,60
BRENTUXIMAB VEDOTIN
Several trials are evaluating incorporation of brentuximab into second-line therapy in transplant-eligible patients. These approaches have used brentuximab prior to, concurrent with, or following platinum-based chemotherapy.61 While there is currently no consensus on the optimal way to incorporate brentuximab into salvage therapy, it is possible that the use of brentuximab or other novel agents in salvage therapy may allow for avoidance of conventional chemotherapy in some patients. In addition, this may translate into more patients proceeding to auto-HCT in a PET negative state. PET negativity prior to auto-HCT is a powerful predictor of long-term remission after auto-HCT, so any intervention that increases the rate of PET negativity prior to auto-HCT would be expected to improve outcomes with auto-HCT.62–65
For patients not being considered for autoHCT, or those for whom platinum-based salvage therapy was ineffective, single-agent brentuximab is an excellent option. In 2 phase 2 studies, an overall response rate (ORR) of 60% to 75% (including a CR rate of 22%–34%) was seen in relapsed and refractory Hodgkin lymphoma patients.66 The US Food and Drug Administration (FDA) approved brentuximab vedotin in August 2011 for treatment of relapsed and refractory Hodgkin lymphoma, after a failed auto-HCT, or in patients who are not auto-HCT candidates and who have received at least 2 prior chemotherapy regimens. With more extended follow-up, it has become clear that a proportion of patients who achieve CR to brentuximab may maintain remission long-term—58% at 3 years and 38% at 5 years.67 These patients may in fact be cured, in many cases without having undergone allogeneic HCT (allo-HCT) after brentuximab.
PD-1 (IMMUNE CHECKPOINT) INHIBITORS
As discussed earlier, PD-L1/PD-L2 copy number alterations represent a disease-defining feature of cHL. Alterations in chromosome 9p24.1 increase the expression of PD-1 ligands PD-L1 and PD-L2. Nivolumab and pembrolizumab are PD-1-blocking antibodies, which have recently been FDA approved for relapsed and refractory cHL. In a study with 23 patients, with 78% of them relapsing after auto-HCT and 78% relapsing after brentuximab, nivolumab produced an objective response in 87% of the patients, with 17% achieving CR and 70% achieving PR. The rate of PFS was 86% at 24 weeks.68 Pembrolizumab, another PD-1 antagonist, was also tested in relapsed and refractory Hodgkin lymphoma. In the KEYNOTE-087 study (n = 210), pembrolizumab produced an ORR of 64% to 70% in 3 different cohorts of relapsed and refractory cHL patients. Overall CR rate was 22%.69 In general, these agents are well tolerated, although patients must be monitored closely for
inflammatory/autoimmune-type toxicities including skin rash, diarrhea/colitis, transaminitis, endocrine abnormalities, and pneumonitis. Prompt recognition and initiation of corticosteroids is essential in managing these toxicities. Of note, PD-1 inhibitors should be given very cautiously to patients with a prior history of allo-HCT, since 30% to 55% of such patients will experience acute graft-versus-host disease (GVHD) in this setting. In 2 retrospective studies, the response rate was very high at 77% to 95%; however, 10% to 26% of all patients treated with PD-1 inhibitors post-allo-HCT died from GVHD induced by PD-1 inhibition.70,71 These risks and benefits therefore need to be carefully weighed in the post-allo-HCT setting. In another recent study, the outcomes were reported for 39 patients who underwent allo-HCT after prior therapy with a PD-1 inhibitor. Three patients (7.7%) developed lethal acute GVHD, suggesting there may be an increased risk of GVHD in patients undergoing allo-HCT after prior PD-1 inhibitor therapy.72
AUTOLOGOUS STEM CELL TRANSPLANTATION
Several studies have shown an improved disease-free survival (DFS) or FFS in patients with relapsed cHL treated by auto-HCT as compared to those receiving conventional chemotherapy alone.55,73,74 Overall, for relapsed disease, one can expect an approximately 50% to 60% chance for DFS at 5 years post-transplant. In a retrospective, matched-pair analysis, FFP was 62% for auto-HCT patients, compared to 32% for conventional chemotherapy patients. OS, however, was similar for the 2 groups (47%–54%). Patients failing induction therapy or relapsing within 1 year were seen to benefit the most from auto-HCT, including an OS benefit.74
A European prospective randomized trial was conducted comparing conventional salvage therapy to auto-HCT. In this study, 161 patients with relapsed Hodgkin lymphoma were treated with 2 cycles of dexa-BEAM. Those with chemo-sensitive disease were then randomized to either 2 more cycles of dexa-BEAM or high-dose BEAM with auto-HCT. Auto-HCT was associated with an approximately 55% FFTF at 3 years, versus 34% with conventional chemotherapy alone.55 This benefit again was most apparent for patients relapsing within 1 year of completion of primary therapy, although an OS benefit was not seen with auto-HCT. For patients with late relapse (>1 year after completion of primary therapy), auto-HCT was associated with an approximately 75% FFTF at 3 years, versus 50% with chemotherapy alone. One other small randomized trial of auto-HCT in relapsed and refractory Hodgkin lymphoma also showed an improved 3-year EFS in favor of auto-HCT (53% versus 10%), again with no difference in OS.73
The lack of OS benefit seen in these studies suggests that auto-HCT at first or second relapse provides comparable outcomes. Auto-HCT offers the benefit of avoiding the long-term toxicities associated with multiple salvage regimens and the anxiety associated with multiple relapses. In addition, the treatment-related mortality with auto-HCT is now in the 1% to 2% range in younger patients, at centers that perform the procedure routinely. For all of these reasons, auto-HCT is commonly recommended by physicians for Hodgkin lymphoma patients in first or second relapse. In most cases, transplant is favored in first relapse, since waiting until second relapse may be associated with a lower chance of achieving CR and difficulty collecting sufficient hematopoietic stem cells. For patients with early relapse or primary refractory disease, an even stronger case can be made for auto-HCT as the best option to achieve sustained control of the disease. For patients with late relapse, conventional salvage therapy alone may be a reasonable option, particularly in older or frail patients, or those with significant comorbid conditions.
The optimal conditioning regimen for autoHCT for relapsed and refractory Hodgkin lymphoma remains undefined. No randomized trials have been performed comparing conditioning regimens for relapsed and refractory Hodgkin lymphoma. One retrospective study compared 92 patients with Hodgkin lymphoma who underwent auto-HCT using a total-body irradiation (TBI) regimen versus a chemotherapy-alone regimen. No difference in 5-year OS or EFS was seen.75 Given the lack of benefit seen with TBI, along with reports of increased rates of secondary malignancies and myelodysplasia with TBI,76 chemotherapy-alone conditioning regimens are most widely employed. For example, in the United States, either the BEAM or CBV (cyclophosphamide, carmustine, etoposide) regimens are used in over 80% of cases.77 This practice was justified in a Center for International Blood and Marrow Transplant Research (CIBMTR) retrospective study comparing outcomes by conditioning regimens, in which no regimen performed better than BEAM or CBV.78
IFRT is often given as an adjunctive therapy to sites of initial and/or relapsed disease following auto-HCT. Although a relatively common practice, whether this truly enhances outcomes beyond that obtained with auto-HCT alone is unclear. Two retrospective studies have shown some benefit in terms of improvement in OS at 3 to 5 years in the group that received IFRT (70%–73% versus 40%–56%).79,80 Given the retrospective nature and small size of these studies, a prospective study would be needed to properly define the potential role for IFRT following auto-HCT in relapsed/refractory Hodgkin lymphoma. Another retrospective study (n = 73) that evaluated peri-transplant IFRT in Hodgkin lymphoma patients receiving auto transplant found no improvement in survival for patients who received peri-transplant IFRT. This study, however, did show a survival benefit in the subgroup of patients with limited stage disease.81
Prognostic Factors Associated with Outcome with Auto-HCT
The factor most consistently associated with improved outcome for patients with relapsed and refractory Hodgkin lymphoma who undergo auto-HCT is the disease status at transplant.63,77 Those in a second CR, versus a chemo-sensitive relapse (but not CR), versus a chemo-refractory relapse have DFS rates of 60% to 70%, 30% to 40%, and 10% to 20%, respectively.63 The duration between remission and relapse also has important prognostic significance. Late relapse (> 1 year after completion of frontline therapy) is associated with better outcomes as compared to early relapse.55 Other factors with prognostic significance at relapse include anemia, time to relapse and clinical stage, B symptoms, extranodal disease, number of prior chemotherapy regimens, and performance status.42,82 The prognostic impact of pretransplant disease status has been confirmed by studies using functional imaging (eg, FDG-PET or gallium scans). In a report by Moskowitz et al, patients with negative functional imaging following second-line therapy had a 77% EFS post-auto-HCT versus 33% in those whose functional imaging remained positive.62 Very similar findings have been reported by other groups.63–65
Post-Auto-HCT Brentuximab Maintenance
In the multicenter, randomized, double-blinded phase 3 AETHERA trial (n = 329), brentuximab (n = 165) was compared with placebo (n = 164) in patients with unfavorable risk relapsed or primary refractory cHL who had undergone autologous transplant. Eligible patients had at least 1 of the following risk factors for progression after auto-HCT: primary refractory Hodgkin lymphoma (failure to achieve complete remission), relapsed Hodgkin lymphoma with an initial remission duration of less than 12 months, or extranodal involvement at the start of pre-transplantation salvage chemotherapy. Patients were required to have CR, PR, or stable disease after pretransplant salvage chemotherapy with adequate kidney, liver, and bone marrow function. Patients who previously received brentuximab were excluded. Patients received 16 cycles of brentuximab or placebo once every 3 weeks starting 30 to 45 days after transplant. The PFS was significantly improved in the brentuximab group when compared to the placebo group (hazard ratio 0.57; P = 0.0013) after a median observation time of 30 months. Median PFS was 42.9 months in the brentuximab group versus 24.1 months in the placebo group; estimated 2-year PFS rates were 63% in the brentuximab group and 51% in the placebo group. OS was not significantly different between the study groups (~85%), presumably due to the fact that patients in the control group who relapsed likely went on to receive brentuximab as a subsequent therapy.83
PRIMARY REFRACTORY HODGKIN LYMPHOMA
Patients with primary refractory Hodgkin lymphoma have a poor outcome. Salvage therapy using conventional chemotherapy and/or RT results in long-term DFS in 10% or fewer of such patients.13,84 Given these poor outcomes with conventional salvage therapy, auto-HCT is considered to be the standard of care for this subset of patients. The GHSG retrospectively analyzed the prognostic factors and outcomes of patients with primary refractory Hodgkin lymphoma. The 5-year freedom-from-second-failure and the 5-year OS were reported to be 31% and 43%, respectively, for those patients treated with auto-HCT. Patients with poor functional status at time of transplant, age greater than 50 years, and failure to attain a temporary remission had a 0% 5-year OS, as compared to 55% in patients without any of these risk factors.85 A large retrospective European study showed that patients with chemo-resistant disease who underwent transplant had a 19% survival at 5 years.63 Hence, even patients with primary refractory Hodgkin lymphoma have some chance of achieving long-term survival following auto-HCT.
SALVAGE RADIOTHERAPY
The GHSG performed a retrospective analysis of the efficacy of salvage RT in patients with refractory or first-relapsed Hodgkin lymphoma. Five-year FFTF and OS rates were 28% and 51%, respectively. Patients with a limited-stage relapse and without B symptoms were more likely to benefit from salvage RT.86 Campbell et al reported on 81 patients undergoing salvage RT for persistent or recurrent Hodgkin lymphoma after chemotherapy. The 10-year FFTF and OS rates were 33% and 46%, respectively.87 Similarly, Wirth et al reported a 5-year FFS of 26% and 5-year OS of 57%. These figures were 36% and 75%, respectively, in patients whose relapse was limited to supradiaphragmatic nodal sites without B symptoms.88 RT therefore may be a useful strategy for a subset of patients who relapse following chemotherapy, particularly those with a limited-stage relapse, without B symptoms, and those with relapsed disease after a CR, as opposed to those with a partial response or lack of response to the prior chemotherapy regimen.
INVESTIGATIONAL AGENTS AND NOVEL COMBINATIONS
Several biological therapies are emerging as options for the treatment of refractory or relapsed disease. These therapies consist of monoclonal antibodies and ADCs that target cell surface antigens, or small molecules that inhibit key intracellular pathways within neoplastic cells.
Rituximab
Rituximab is a chimeric anti-CD20 monoclonal antibody used widely in B-cell non-Hodgkin lymphomas. The CD20 molecule is typically highly expressed in nodular lymphocyte-predominant Hodgkin lymphoma (NLPHL). Two studies (one in relapsed patients, the other in a mixture of relapsed and previously untreated patients) showed significant activity of rituximab in relapsed NLPHL, with ORRs ranging from 94% to 100%, CR rates ranging from 41% to 53%, and median duration of remission in the 10- to 33-month range.89,90 In cHL, CD20 is expressed in HRS cells in 20% to 30% of cases. In such cases, single-agent rituximab has also shown activity. There is also evidence that rituximab may be effective even in cases in which the HRS cells are CD20-negative, presumably by virtue of depleting reactive B lymphocytes from the microenvironment, which may enhance anti-tumor immunity, or by eliminating a putative CD20-expressing Hodgkin lymphoma stem cell.91,92
Lenalidomide
Lenalidomide is an immunomodulatory drug that has multiple modes of action, including direct induction of apoptosis in tumor cells, antiangiogenic effects, and the activation of immune cells, such as natural killer cells and T cells. Lenalidomide has been shown to modify many features of the microenvironment of HRS cells and has demonstrated activity in other B-cell neoplasms. As a result, lenalidomide has been evaluated in relapsed and refractory Hodgkin lymphoma patients. A multicenter phase 2 study by Fehniger et al included 35 patients, 87% of whom had previously undergone HCT and 55% of whom were refractory to the last therapy.93 All patients were given lenalidomide 25 mg/day from days 1 to 21 of a 28-day cycle until disease progression. One patient was noted to achieve CR, 6 achieved PR, and 5 had stable disease lasting more than 6 months, for an ORR of 19% and a “cytostatic overall response rate” of 33%. The median duration of CR/partial remission was 6 months, with the median time-to-treatment failure in responders (including those with stable disease > 6 months) being 15 months. Similarly, in another study, Böll et al evaluated 12 patients across 4 German centers with relapsed or refractory disease who were treated with oral lenalidomide for 21 days in a 28-day cycle. No radiological evidence of disease progression after 2 cycles of lenalidomide was seen in any of the enrolled patients. ORR was noted to be 50%, with 6 patients with stable disease and 5 patients achieving PR after 2 cycles.94
Novel Brentuximab Combination Therapies
Brentuximab plus bendamustine. The combination of brentuximab and bendamustine was tested as an outpatient regimen in a phase 1/2 study (n = 55) in primary refractory Hodgkin lymphoma or after first relapse. The CR rate of the combination was 74%, with an overall objective response (CR + PR) of 93%. The CR rates were 64% and 84%, respectively, for refractory and relapsed patients. The PFS at 12 months was 80%, establishing this combination therapy as an effective salvage regimen with durable response.95
Brentuximab plus nivolumab. Preliminary results have recently been presented from 2 studies96,97 evaluating the combination of brentuximab and nivolumab. While this combination would still be considered investigational, these studies showed very encouraging ORRs of 90% to 100% and a CR rate of 62% to 66%. Longer follow-up is needed to determine whether these responses are durable and to document the toxicity profile of this combination.
Mammalian Target of Rapamycin Inhibitors
Two mammalian target of rapamycin (mTOR) inhibitors, everolimus and temsirolimus, are currently available in the United States. While neither drug currently has FDA approval for Hodgkin lymphoma, everolimus was evaluated in a phase 2 trial in a heavily pretreated group of relapsed/refractory patients. An ORR of 47% was seen, with a median time to progression of 7.2 months.98
ALLOGENEIC STEM CELL TRANSPLANTATION
Historically, patients who relapse after having an auto-HCT generally had a poor outcome, with a median survival of 2 to 3 years after failure of auto-HCT.99 These patients may be offered palliative chemotherapy (see above), treatment with novel agents (see above), or enrollment in a clinical trial. Select patients may benefit from a second hematopoietic stem cell transplant, most commonly an allo-HCT. However, rare patients with late relapse after auto-HCT may be considered for a second auto-HCT, with a minority of such patients achieving a durable remission after the second auto-HCT.100,101 Because relapse or progressive disease occurs most commonly in the first several months following auto-HCT, patients are more often considered for allo-HCT than a second auto-HCT. In addition, a second auto-HCT may not be feasible due to impaired bone marrow reserve and/or concerns for development of secondary myelodysplasia or acute myeloid leukemia.
Several studies have evaluated allo-HCT in relapsed/ refractory Hodgkin lymphoma. Early studies evaluating myeloablative allo-HCT for Hodgkin lymphoma showed excessive treatment-related mortality (up to 50%) and disappointingly low rates of long-term survival (< 25%).102,103 This was likely related to the fact that, in that era, most of the patients with Hodgkin lymphoma evaluated for allo-HCT were heavily pretreated and therefore at a higher risk for toxicity as well as lymphoma progression.
More recently, several studies have focused on the use of reduced-intensity conditioning (RIC) allo-HCT for relapsed and refractory Hodgkin lymphoma. This approach relies more on a “graft-versus-lymphoma” effect, the existence of which has been debated in Hodgkin lymphoma. Three single-center studies of RIC allo-HCT in patients with multiply recurrent Hodgkin lymphoma showed improved rates of treatment-related mortality (8%–16%) but still relatively low rates of long-term PFS (23%–39% at 2 to 4 years).104–106 Interestingly, in one of these studies the outcomes were more favorable for patients who underwent haploidentical (versus matched sibling or matched unrelated donor) transplants.105
Two large registry studies have also reported on the outcomes of RIC allo-HCT in patients with relapsed and refractory Hodgkin lymphoma.107,108 These studies also confirmed a modest improvement in outcomes compared with those seen historically with myeloablative transplants. Treatment-related mortality at 1 to 2 years was 23% to 33%, depending on whether a matched sibling donor versus an unrelated donor was used. However, long-term PFS (18%–20% at 2 to 5 years) and OS (28%–37% at 2 to 5 years) remained poor, primarily due to high rates of progressive lymphoma post-transplant. In both of these studies, patients were heavily pretreated (84%–96% had received 3 or more prior lines of chemotherapy, and 62%–89% received a prior auto-HCT), with 47% to 55% of patients chemo-resistant prior to transplant. Of note, both of these registry studies reflect patients who underwent transplant prior to the widespread use of brentuximab and PD-1 inhibitors.
Based on the single-center and registry data above, a prospective multicenter European phase 2 trial was conducted to evaluate the benefit of RIC allo-HCT in Hodgkin lymphoma.109 Ninety-two patients (86% with prior auto-HCT, 90% with 3 or more prior lines of therapy) were enrolled and given salvage therapy. Those who had stable disease or better following salvage therapy remained on protocol (n = 78) and underwent RIC with fludarabine and melphalan, followed by allo-HCT (70% with matched sibling donors). Treatment-related mortality was 15% at 1 year. Relapse or progression occurred in 49% at 2 years (35% if chemo-sensitive prior to transplant). Chronic GVHD was associated with a decreased rate of relapse, supporting the existence of a graft-versus-lymphoma effect in Hodgkin lymphoma. Unfortunately, PFS among all allografted patients was still relatively poor (24% at 4 years). However, among patients in CR prior to allo-HCT, a 50% PFS was seen at 4 years. Therefore, even in a prospective multicenter study, RIC allo-HCT offered significant benefit with manageable toxicity in relapsed and refractory Hodgkin lymphoma patients with chemo-sensitive disease.
These studies suggest that outcomes with allo-HCT would improve further if implemented earlier in the course of disease and/or with a lower burden of disease at transplant. It has therefore been suggested that allo-HCT should be considered soon after failure of auto-HCT is documented. In a retrospective study by Sarina et al, 185 Hodgkin lymphoma patients who relapsed following auto-HCT were then immediately considered for reduced-intensity allo-HCT.110 Of these, 122 had a donor identified, and 104 (85%) actually underwent allo-HCT. These 104 patients were then compared to the other 81 patients who either had no donor identified or had a donor but did not receive the planned allo-HCT. Two-year PFS and OS were superior in the patients undergoing allo-HCT (39% versus 14% and 66% versus 42%, respectively, P < 0.001), with a median follow-up of 4 years. The presence of chronic GVHD again was associated with improved PFS and OS. Disease status prior to transplant remained highly predictive of PFS and OS by multivariate analysis. Two other smaller retrospective studies similarly found a survival benefit associated with allo-HCT compared with patients who underwent conventional salvage therapies alone.111,112 These studies, although subject to the usual limitations of retrospective analyses, suggest that the results with reduced-intensity allo-HCT are in fact enhanced if applied earlier in the disease course, and are superior to those with conventional therapy alone.
Currently, the exact role of allo-HSCT, including the optimal timing and optimal donor source (matched sibling versus haploidentical sibling versus matched unrelated donor), remain undefined for relapsed and refractory Hodgkin lymphoma. As discussed earlier, brentuximab is highly active in relapsed Hodgkin lymphoma patients, with a subset of patients still in CR at 5 years.67 For such patients, avoiding the risks of allo-HCT is a desirable goal.
For those who relapse or progress after auto-HCT, a reasonable strategy therefore is to treat initially with brentuximab, unless the patient is already known to have responded poorly to brentuximab, or already has significant neuropathy. Those who achieve a CR to brentuximab are then observed. A subset of those patients will remain in remission at 5 years without further therapy. For those who relapse, or who achieve less than a CR to brentuximab, additional treatment (with brentuximab re-treatment being one option) followed by a reduced-intensity allo-HCT is a reasonable consideration. This approach has the theoretical advantages of (1) avoiding the risk of allo-HCT in the subset potentially cured by brentuximab, (2) getting patients to allo-HCT with fewer comorbidities (due to a lower total exposure to conventional chemotherapy pre-transplant), and (3) applying allo-HCT in the setting of sensitive disease/lower disease burden (due to the high efficacy of brentuximab). The results of a small study suggest that brentuximab may in fact be a very effective “bridge” to allotransplant. Chen et al113 reported on 18 patients with relapsed/refractory Hodgkin lymphoma (17 of whom had previously undergone auto-HCT) who were treated on brentuximab vedotin clinical trials. The data were retrospectively evaluated to determine the efficacy and safety of subsequent reduced-intensity allo-HCT. Remarkably, at 1 year the OS was 100%, PFS was 92%, and nonrelapse mortality was 0% with a median follow-up of 14 months. Hence, brentuximab is safe for use prior to reduced-intensity allo-HCT in heavily pre-treated patients and appears to be associated with very favorable post-transplant outcomes, particularly in comparison to older studies of allo-HCT in the era prior to brentuximab.
SUMMARY
Currently, cure is possible for the majority of patients diagnosed with advanced stage Hodgkin lymphoma. The challenge to the clinician is to provide curative treatment with the lowest risk of serious toxicities. Which regimen will best provide this balance of risk and benefit needs to be assessed based on the relapse risk, age, frailty, and comorbidity profile for an individual patient. For many patients with relapsed or refractory Hodgkin lymphoma, cure remains possible using approaches based on hematopoietic stem cell transplantation, RT, and/or brentuximab. In addition, there are now numerous conventional chemotherapy agents, RT strategies, and exciting newer agents such as PD-1 inhibitors, that can provide significant clinical benefit even when cure is not feasible.
1. Kuppers R, Rajewsky K, Zhao M, et al. Hodgkin disease: Hodgkin and Reed-Sternberg cells picked from histological sections show clonal immunoglobulin gene rearrangements and appear to be derived from B cells at various stages of development. Proc Natl Acad Sci U S A 1994;91:10962–6.
2. Kuppers R. The biology of Hodgkin’s lymphoma. Nature Rev Cancer 2009;9:15–27.
3. Narra RK, Pingali SR, Fenske TS. Early-stage Hodgkin’s lymphoma. Hospital Physician Hematology-Oncology Board Review Manual. 2017;12(Part 3).
4. Mauch PM, Kalish LA, Kadin M, et al. Patterns of presentation of Hodgkin disease. Implications for etiology and pathogenesis. Cancer 1993;71:2062–71.
5. Hasenclever D, Diehl V. A prognostic score for advanced Hodgkin’s disease. International Prognostic Factors Project on Advanced Hodgkin’s Disease. N Engl J Med 1998;339:1506–14.
6. Moccia AA, Donaldson J, Chhanabhai M, et al. International Prognostic Score in advanced-stage Hodgkin’s lymphoma: altered utility in the modern era. J Clin Oncol 2012;30:3383–8.
7. Diefenbach CS, Li H, Hong F, et al. Evaluation of the International Prognostic Score (IPS-7) and a Simpler Prognostic Score (IPS-3) for advanced Hodgkin lymphoma in the modern era. Br J Haematol 2015;171:530–8.
8. Greaves P, Clear A, Coutinho R, et al. Expression of FOXP3, CD68, and CD20 at diagnosis in the microenvironment of cassical hodgkin lymphoma is predictive of outcome. J Clin Oncol 2013;31:256–62.
9. Touati M, Delage-Corre M, Monteil J, et al. CD68-positive tumor-associated macrophages predict unfavorable treatment outcomes in classical Hodgkin lymphoma in correlation with interim fluorodeoxyglucose-positron emission tomography assessment. Leuk Lymphoma 2015;56:332–41.
10. Roemer MG, Advani RH, Ligon AH, et al. PD-L1 and PD-L2 genetic alterations define classical Hodgkin lymphoma and predict outcome. J Clin Oncol 2016;34:2690–7.
11. Pike LC, Kirkwood AA, Patrick P, et al. Can baseline PET-CT features predict outcomes in advanced hodgkin lymphoma? A prospective evaluation of UK patients in The RATHL Trial (CRUK/07/033). Hematological Oncology 2017;35(Supplement S2):37–8.
12. DeVita VT Jr, Simon RM, Hubbard SM, et al. Curability of advanced Hodgkin’s disease with chemotherapy. Long-term follow-up of MOPP-treated patients at the National Cancer Institute. Ann Intern Med 1980;92:587–95.
13. Longo DL, Duffey PL, Young RC, et al. Conventional-dose salvage combination chemotherapy in patients relapsing with Hodgkin’s disease after combination chemotherapy: the low probability for cure. J Clin Oncol 1992;10:210–8.
14. Kaldor JM, Day NE, Clarke EA, et al. Leukemia following Hodgkin’s disease. N Engl J Med 1990;322:7–13.
15. Bonadonna G, Zucali R, Monfardini S, et al. Combination chemotherapy of Hodgkin’s disease with adriamycin, bleomycin, vinblastine, and imidazole carboxamide versus MOPP. Cancer 1975;36:252–9.
16. Canellos GP, Anderson JR, Propert KJ, et al. Chemotherapy of advanced Hodgkin’s disease with MOPP, ABVD, or MOPP alternating with ABVD. N Engl J Med 1992;327:1478–84.
17. Horning SJ, Williams J, Bartlett NL, et al. Assessment of the stanford V regimen and consolidative radiotherapy for bulky and advanced Hodgkin’s disease: Eastern Cooperative Oncology Group pilot study E1492. J Clin Oncol 2000;18:972–80.
18. Hoskin PJ, Lowry L, Horwich A, et al. Randomized comparison of the stanford V regimen and ABVD in the treatment of advanced Hodgkin’s Lymphoma: United Kingdom National Cancer Research Institute Lymphoma Group Study ISRCTN 64141244. J Clin Oncol 2009;27:5390–6.
19. Gordon LI, Hong F, Fisher RI, et al. Randomized phase III trial of ABVD versus Stanford V with or without radiation therapy in locally extensive and advanced-stage Hodgkin lymphoma: an intergroup study coordinated by the Eastern Cooperative Oncology Group (E2496). J Clin Oncol 2013;31:684–91.
20. Engert A, Diehl V, Franklin J, et al. Escalated-dose BEACOPP in the treatment of patients with advanced-stage Hodgkin’s lymphoma: 10 years of follow-up of the GHSG HD9 study. J Clin Oncol 2009;27:4548–54.
21. Merli F, Luminari S, Gobbi PG, et al. Long-term results of the HD2000 trial comparing ABVD versus BEACOPP versus COPP-EBV-CAD in untreated patients with advanced Hodgkin lymphoma: a study by Fondazione Italiana Linfomi. J Clin Oncol 2016;34:1175–81.
22. Viviani S, Zinzani PL, Rambaldi A, et al. ABVD versus BEACOPP for Hodgkin’s lymphoma when high-dose salvage is planned. N Engl J Med 2011;365:203–12.
23. Carde P, Karrasch M, Fortpied C, et al. Eight cycles of ABVD versus four cycles of BEACOPPescalated plus four cycles of BEACOPPbaseline in stage III to IV, International Prognostic Score >/= 3, high-risk Hodgkin lymphoma: first results of the phase III EORTC 20012 intergroup trial. J Clin Oncol 2016;34:2028–36.
24. National Comprehensive Cancer Network I. NCCN Guidelines Version 1.2017 Hodgkin Lymphoma. Accessed July 20, 2017.
25. Younes A, Connors JM, Park SI, et al. Brentuximab vedotin combined with ABVD or AVD for patients with newly diagnosed Hodgkin’s lymphoma: a phase 1, open-label, dose-escalation study. Lancet Oncology 2013;14:1348–56.
26. Takeda and Seattle Genetics announce positive results from phase 3 ECHELON-1 clinical trial evaluating ADCETRIS® (brentuximab vedotin) in frontline advanced Hodgkin lymphoma [press release]. Cambridge, MA: Takeda Oncology; June 26, 2017.
27. Boll B, Bredenfeld H, Gorgen H, et al. Phase 2 study of PVAG (prednisone, vinblastine, doxorubicin, gemcitabine) in elderly patients with early unfavorable or advanced stage Hodgkin lymphoma. Blood 2011;118:6292–8.
28. Behringer K, Goergen H, Hitz F, et al. Omission of dacarbazine or bleomycin, or both, from the ABVD regimen in treatment of early-stage favourable Hodgkin’s lymphoma (GHSG HD13): an open-label, randomised, non-inferiority trial. Lancet 2015;385:1418–27.
29. Forero-Torres A, Holkova B, Goldschmidt J, et al. Phase 2 study of frontline brentuximab vedotin monotherapy in Hodgkin lymphoma patients aged 60 years and older. Blood 2015;126:2798–804.
30. Gallamini A, Hutchings M, Rigacci L, et al. Early interim 2-[18F]fluoro-2-deoxy-D-glucose positron emission tomography is prognostically superior to international prognostic score in advanced-stage Hodgkin’s lymphoma: a report from a joint Italian-Danish study. J Clin Oncol 2007;25:3746–52.
31. Meignan M, Gallamini A, Meignan M, et al. Report on the First International Workshop on Interim-PET-Scan in Lymphoma. Leuk Lymphoma 2009;50:1257–60.
32. Barrington SF, Mikhaeel NG, Kostakoglu L, et al. Role of Imaging in the Staging and Response Assessment of Lymphoma: Consensus of the International Conference on Malignant Lymphomas Imaging Working Group. J Clin Oncol 2014;32:3048–58.
33. Press OW, Li H, Schoder H, et al. US Intergroup trial of response-adapted therapy for stage III to IV Hodgkin lymphoma using early interim fluorodeoxyglucose-positron emission tomography imaging: Southwest Oncology Group S0816. J Clin Oncol 2016;34:2020–7.
34. Zinzani PL, Broccoli A, Gioia DM, et al. Interim positron emission tomography response-adapted therapy in advanced-stage Hodgkin lymphoma: final results of the pPhase II part of the HD0801 study. J Clin Oncol 2016;34:1376–85.
35. Borchmann P, Haverkamp H, Lohri A, et al. Progression-free survival of early interim PET-positive patients with advanced stage Hodgkin’s lymphoma treated with BEACOPPescalated alone or in combination with rituximab (HD18): an open-label, international, randomised phase 3 study by the German Hodgkin Study Group. Lancet Oncology 2017;18:454–63.
36. Aleman BM, Raemaekers JM, Tirelli U, et al. Involved-field radiotherapy for advanced Hodgkin’s lymphoma. N Engl J Med 2003;348:2396–406.
37. Borchmann P, Haverkamp H, Diehl V, et al. Eight cycles of escalated-dose BEACOPP compared with four cycles of escalated-dose BEACOPP followed by four cycles of baseline-dose BEACOPP with or without radiotherapy in patients with advanced-stage hodgkin’s lymphoma: final analysis of the HD12 trial of the German Hodgkin Study Group. J Clin Oncol 2011;29:4234–42.
38. Engert A, Haverkamp H, Kobe C, et al. Reduced-intensity chemotherapy and PET-guided radiotherapy in patients with advanced stage Hodgkin’s lymphoma (HD15 trial): a randomised, open-label, phase 3 non-inferiority trial. Lancet 2012;379:1791–9.
39. Nademanee A, Molina A, Fung H, et al. High-dose chemo/radiotherapy and autologous bone marrow or stem cell transplantation for poor-risk advanced-stage Hodgkin’s disease during first partial or complete remission. Biol Blood Marrow Transplant 1999;5:292–8.
40. Federico M, Bellei M, Brice P, et al. High-dose therapy and autologous stem-cell transplantation versus conventional therapy for patients with advanced Hodgkin’s lymphoma responding to front-line therapy. J Clin Oncol 2003;21:2320–5.
41. Arakelyan N, Berthou C, Desablens B, et al. Early versus late intensification for patients with high-risk Hodgkin lymphoma-3 cycles of intensive chemotherapy plus low-dose lymph node radiation therapy versus 4 cycles of combined doxorubicin, bleomycin, vinblastine, and dacarbazine plus myeloablative chemotherapy with autologous stem cell transplantation: five-year results of a randomized trial on behalf of the GOELAMS Group. Cancer 2008;113:3323–30.
42. Moskowitz CH, Nimer SD, Zelenetz AD, et al. A 2-step comprehensive high-dose chemoradiotherapy second-line program for relapsed and refractory Hodgkin disease: analysis by intent to treat and development of a prognostic model. Blood 2001;97:616–23.
43. Josting A, Rudolph C, Reiser M, et al. Time-intensified dexamethasone/cisplatin/cytarabine: an effective salvage therapy with low toxicity in patients with relapsed and refractory Hodgkin’s disease. Ann Oncol 2002;13:1628–35.
44. Aparicio J, Segura A, Garcera S, et al. ESHAP is an active regimen for relapsing Hodgkin’s disease. Ann Oncol 1999;10:593–5.
45. Baetz T, Belch A, Couban S, et al. Gemcitabine, dexamethasone and cisplatin is an active and non-toxic chemotherapy regimen in relapsed or refractory Hodgkin’s disease: a phase II study by the National Cancer Institute of Canada Clinical Trials Group. Ann Oncol 2003;14:1762–7.
46. Gopal AK, Press OW, Shustov AR, et al. Efficacy and safety of gemcitabine, carboplatin, dexamethasone, and rituximab in patients with relapsed/refractory lymphoma: a prospective multi-center phase II study by the Puget Sound Oncology Consortium. Leuk Lymphoma 2010;51:1523–9.
47. Santoro A, Magagnoli M, Spina M, et al. Ifosfamide, gemcitabine, and vinorelbine: a new induction regimen for refractory and relapsed Hodgkin’s lymphoma. Haematologica 2007;92:35–41.
48. Bartlett NL, Niedzwiecki D, Johnson JL, et al. Gemcitabine, vinorelbine, and pegylated liposomal doxorubicin (GVD), a salvage regimen in relapsed Hodgkin’s lymphoma: CALGB 59804. Ann Oncol 2007;18:1071–9.
49. Santoro A, Bonadonna G. Prolonged disease-free survival in MOPP-resistant Hodgkin’s disease after treatment with adriamycin, bleomycin, vinblastine and dacarbazine (ABVD). Cancer Chemother Pharmacol 1979;2:101–5.
50. Krikorian JG, Portlock CS, Rosenberg SA. Treatment of advanced Hodgkin’s disease with adriamycin, bleomycin, vinblastine, and imidazole carboxamide (ABVD) after failure of MOPP therapy. Cancer 1978;41:2107–11.
51. Piga A, Ambrosetti A, Todeschini G, et al. Doxorubicin, bleomycin, vinblastine, and dacarbazine (ABVD) salvage of mechlorethamine, vincristine, prednisone, and procarbazine (MOPP)-resistant advanced Hodgkin’s disease. Cancer Treat Rep 1984;68:947–51.
52. Moskowitz AJ, Hamlin PA Jr, Perales MA, et al. Phase II study of bendamustine in relapsed and refractory Hodgkin lymphoma. J Clin Oncol 2013;31:456–60.
53. Anastasia A, Carlo-Stella C, Corradini P, et al. Bendamustine for relapsed/refractory classical Hodgkin lymphoma after high dose chemotherapy and or allogeneic transplant: a study of Fondazione Italiana Linfomi (FIL). Blood 2012;120:3652.
54. Martin A, Fernandez-Jimenez MC, Caballero MD, et al. Long-term follow-up in patients treated with Mini-BEAM as salvage therapy for relapsed or refractory Hodgkin’s disease. Br J Haematol 2001;113:161–71.
55. Schmitz N, Pfistner B, Sextro M, et al. Aggressive conventional chemotherapy compared with high-dose chemotherapy with autologous haemopoietic stem-cell transplantation for relapsed chemosensitive Hodgkin’s disease: a randomised trial. Lancet 2002;359:2065–71.
56. Fisher RI, DeVita VT, Hubbard SP, et al. Prolonged disease-free survival in Hodgkin’s disease with MOPP reinduction after first relapse. Ann Intern Med 1979;90:761–3.
57. ChlVPP therapy for Hodgkin’s disease: experience of 960 patients. The International ChlVPP Treatment Group. Ann Oncol 1995;6:167–72.
58. Selby P, Patel P, Milan S, et al. ChlVPP combination chemotherapy for Hodgkin’s disease: long-term results. Br J Cancer 1990;62:279–85.
59. Santoro A, Bredenfeld H, Devizzi L, et al. Gemcitabine in the treatment of refractory Hodgkin’s disease: results of a multicenter phase II study. J Clin Oncol 2000;18:2615–9.
60. Little R, Wittes RE, Longo DL, Wilson WH. Vinblastine for recurrent Hodgkin’s disease following autologous bone marrow transplant. J Clin Oncol 1998;16:584–8.
61. Chen R, Palmer JM, Martin P, et al. Results of a multicenter phase II trial of brentuximab vedotin as second-line therapy before autologous transplantation in relapsed/refractory Hodgkin lymphoma. Biol Blood Marrow Transplant 2015;21:2136–40.
62. Moskowitz CH, Yahalom J, Zelenetz AD, et al. High-dose chemo-radiotherapy for relapsed or refractory Hodgkin lymphoma and the significance of pre-transplant functional imaging. Br J Haematol 2010;148:890–7.
63. Sureda A, Constans M, Iriondo A, et al. Prognostic factors affecting long-term outcome after stem cell transplantation in Hodgkin’s lymphoma autografted after a first relapse. Ann Oncol 2005;16:625–33.
64. Crocchiolo R, Canevari C, Assanelli A, et al. Pre-transplant 18FDG-PET predicts outcome in lymphoma patients treated with high-dose sequential chemotherapy followed by autologous stem cell transplantation. Leuk Lymphoma 2008;49:727–33.
65. Mocikova H, Pytlik R, Markova J, et al. Pre-transplant positron emission tomography in patients with relapsed Hodgkin lymphoma. Leuk Lymphoma 2011;52:1668–74.
66. Younes A, Gopal AK, Smith SE, et al. Results of a pivotal phase II study of brentuximab vedotin for patients with relapsed or refractory Hodgkin’s lymphoma. J Clin Oncol 2012;30:2183–9.
67. Gopal AK, Chen R, Smith SE, et al. Durable remissions in a pivotal phase 2 study of brentuximab vedotin in relapsed or refractory Hodgkin lymphoma. Blood 2015;125:1236–43.
68. Ansell SM, Lesokhin AM, Borrello I, et al. PD-1 blockade with nivolumab in relapsed or refractory Hodgkin’s lymphoma.N Engl J Med 2015;372:311–9.
69. Chen R, Zinzani PL, Fanale MA, et al. Phase II study of the efficacy and safety of pembrolizumab for relapsed/refractory classic Hodgkin lymphoma. J Clin Oncol 2017;35:2125–32.
70. Haverkos BM, Abbott D, Hamadani M, et al. PD-1 blockade for relapsed lymphoma post-allogeneic hematopoietic cell transplant: high response rate but frequent GVHD. Blood 2017;130:221–8.
71. Herbaux C, Gauthier J, Brice P, et al. Efficacy and tolerability of nivolumab after allogeneic transplantation for relapsed Hodgkin lymphoma. Blood 2017;129:2471–8.
72. Merryman RW, Kim HT, Zinzani PL et al. Safety and efficacy of allogeneic hematopoietic stem cell transplant after PD-1 blockage in relapsed/refractory lymphoma. Blood 2017;129:1380–8.
73. Linch DC, Winfield D, Goldstone AH, et al. Dose intensification with autologous bone-marrow transplantation in relapsed and resistant Hodgkin’s disease: results of a BNLI randomised trial. Lancet 1993;341:1051–4.
74. Yuen AR, Rosenberg SA, Hoppe RT, et al. Comparison between conventional salvage therapy and high-dose therapy with autografting for recurrent or refractory Hodgkin’s disease. Blood 1997;89:814–22.
75. Gutierrez-Delgado F, Holmberg L, Hooper H, et al. Autologous stem cell transplantation for Hodgkin’s disease: busulfan, melphalan and thiotepa compared to a radiation-based regimen. Bone Marrow Transplant 2003;32:279–85.
76. Hake CR, Graubert TA, Fenske TS. Does autologous transplantation directly increase the risk of secondary leukemia in lymphoma patients? Bone Marrow Transplant 2007;39:59–70.
77. Hahn T, McCarthy PL, Carreras J, et al. Comparison of prognostic models for autologous hematopoietic stem cell transplantation (AHCT) for relapsed Hodgkin lymphoma. Blood 2009;114:1215.
78. Chen Y-B, Lane AA, Logan BR, et al. Impact of conditioning regimen on outcomes for patients with lymphoma undergoing high-dose therapy with autologous hematopoietic cell transplantation. Biology Blood Marrow Transplant 2015;21:1046–53.
79. Wendland MM, Asch JD, Pulsipher MA, et al. The impact of involved field radiation therapy for patients receiving high-dose chemotherapy followed by hematopoietic progenitor cell transplant for the treatment of relapsed or refractory Hodgkin disease. Am J Clin Oncol 2006;29:189–95.
80. Biswas T, Culakova E, Friedberg JW, et al. Involved field radiation therapy following high dose chemotherapy and autologous stem cell transplant benefits local control and survival in refractory or recurrent Hodgkin lymphoma. Radiother Oncol 2012;103:367–72.
81. Levis M, Piva C, Filippi AR, et al. Potential benefit of involved-field radiotherapy for patients with Relapsed-refractory Hodgkin’s lymphoma with incomplete response before autologous stem cell transplantation. Clin Lymphoma Myeloma Leuk 2017;17:14–22.
82. Josting A, Franklin J, May M, et al. New prognostic score based on treatment outcome of patients with relapsed Hodgkin’s lymphoma registered in the database of the German Hodgkin’s lymphoma study group. J Clin Oncol 2002;20:221–30.
83. Moskowitz CH, Nademanee A, Masszi T, et al. Brentuximab vedotin as consolidation therapy after autologous stem-cell transplantation in patients with Hodgkin’s lymphoma at risk of relapse or progression (AETHERA): a randomised, double-blind, placebo-controlled, phase 3 trial. Lancet 2015;385:1853–62.
84. Bonfante V, Santoro A, Viviani S, et al. Outcome of patients with Hodgkin’s disease failing after primary MOPP-ABVD. J Clin Oncol 1997;15:528–34.
85. Josting A, Rueffer U, Franklin J, et al. Prognostic factors and treatment outcome in primary progressive Hodgkin lymphoma: a report from the German Hodgkin Lymphoma Study Group. Blood 2000;96:1280–6.
86. Josting A, Nogova L, Franklin J, et al. Salvage radiotherapy in patients with relapsed and refractory Hodgkin’s lymphoma: a retrospective analysis from the German Hodgkin Lymphoma Study Group. J Clin Oncol 2005;23:1522–9.
87. Campbell B WA, Milner A, Di Iulio J, et al. Long-term follow-up of salvage radiotherapy in Hodgkin’s lymphoma after chemotherapy failure. Int J Radiat Oncol Biol Phys 2005;63:1538–45.
88. Wirth A, Corry J, Laidlaw C, et al. Salvage radiotherapy for Hodgkin’s disease following chemotherapy failure. Int J Radiat Oncol Biol Phys 1997;39:599–607.
89. Schulz H, Rehwald U, Morschhauser F, et al. Rituximab in relapsed lymphocyte-predominant Hodgkin lymphoma: long-term results of a phase 2 trial by the German Hodgkin Lymphoma Study Group (GHSG). Blood 2008;111:109–11.
90. Ekstrand BC, Lucas JB, Horwitz SM, et al. Rituximab in lymphocyte-predominant Hodgkin disease: results of a phase 2 trial. Blood 2003;101:4285–9.
91. Younes A, Romaguera J, Hagemeister F, et al. A pilot study of rituximab in patients with recurrent, classic Hodgkin disease. Cancer 2003;98:310–4.
92. Rehwald U, Schulz H, Reiser M, et al. Treatment of relapsed CD20+ Hodgkin lymphoma with the monoclonal antibody rituximab is effective and well tolerated: results of a phase 2 trial of the German Hodgkin Lymphoma Study Group. Blood 2003;101:420–4.
93. Fehniger TA, Larson S, Trinkaus K, et al. A phase 2 multicenter study of lenalidomide in relapsed or refractory classical Hodgkin lymphoma. Blood 2011;118:5119–25.
94. Boll B, Borchmann P, Topp MS, et al. Lenalidomide in patients with refractory or multiple relapsed Hodgkin lymphoma. Br J Haematol 2010;148:480–2.
95. LaCasce AS, Bociek G, Sawas A, et al. Brentuximab vedotin plus bendamustine: a highly active salvage treatment regimen for patients with relapsed or refractory Hodgkin lymphoma. Blood 2015;126:3982.
96. Diefenbach CS, Hong F, David KA, et al. A phase I study with an expansion cohort of the combination of ipilimumab and nivolumab and brentuximab vedotin in patients with relapsed/refractory Hodgkin lymphoma: A trial of the ECOG-ACRIN Cancer Research Group (E4412 Arms D and E). Blood 2016;128:1106.
97. Herrera AF, Bartlett NL, Ramchandren R, et al. Preliminary results from a phase 1/2 study of brentuximab vedotin in combination with nivolumab in patients with relapsed or refractory Hodgkin lymphoma. Blood 2016;128:1105.
98. Johnston PB, Inwards DJ, Colgan JP, et al. A phase II trial of the oral mTOR inhibitor everolimus in relapsed Hodgkin lymphoma. Am J Hematol 2010;85:320–4.
99. Kewalramani T, Nimer SD, Zelenetz AD, et al. Progressive disease following autologous transplantation in patients with chemosensitive relapsed or primary refractory Hodgkin’s disease or aggressive non-Hodgkin’s lymphoma. Bone Marrow Transplant 2003;32:673–9.
100. Lin TS, Avalos BR, Penza SL, et al. Second autologous stem cell transplant for multiply relapsed Hodgkin’s disease. Bone Marrow Transplant 2002;29:763–7.
101. Smith SM, van Besien K, Carreras J, et al. Second autologous stem cell transplantation for relapsed lymphoma after a prior autologous transplant. Biol Blood Marrow Transplant 2008;14:904–12.
102. Gajewski JL, Phillips GL, Sobocinski KA, et al. Bone marrow transplants from HLA-identical siblings in advanced Hodgkin’s disease. J Clin Oncol 1996;14:572–8.
103. Peniket AJ, Ruiz de Elvira MC, Taghipour G, et al. An EBMT registry matched study of allogeneic stem cell transplants for lymphoma: allogeneic transplantation is associated with a lower relapse rate but a higher procedure-related mortality rate than autologous transplantation. Bone Marrow Transplant 2003;31:667–78.
104. Anderlini P, Saliba R, Acholonu S, et al. Fludarabine-melphalan as a preparative regimen for reduced-intensity conditioning allogeneic stem cell transplantation in relapsed and refractory Hodgkin’s lymphoma: the updated M.D. Anderson Cancer Center experience. Haematologica 2008;93:257–64.
105. Burroughs LM, O’Donnell PV, Sandmaier BM, et al. Comparison of outcomes of HLA-matched related, unrelated, or HLA-haploidentical related hematopoietic cell transplantation following nonmyeloablative conditioning for relapsed or refractory Hodgkin lymphoma. Biol Blood Marrow Transplant 2008;14:1279–87.
106. Peggs KS, Hunter A, Chopra R, et al. Clinical evidence of a graft-versus-Hodgkin’s-lymphoma effect after reduced-intensity allogeneic transplantation. Lancet 2005;365:1934–41.
107. Sureda A, Robinson S, Canals C, et al. Reduced-intensity conditioning compared with conventional allogeneic stem-cell transplantation in relapsed or refractory Hodgkin’s lymphoma: an analysis from the Lymphoma Working Party of the European Group for Blood and Marrow Transplantation. J Clin Oncol 2008;26:455–62.
108. Devetten MP, Hari PN, Carreras J, et al. Unrelated donor reduced-intensity allogeneic hematopoietic stem cell transplantation for relapsed and refractory Hodgkin lymphoma. Biol Blood Marrow Transplant 2009;15:109–17.
109. Sureda A, Canals C, Arranz R, et al. Allogeneic stem cell transplantation after reduced intensity conditioning in patients with relapsed or refractory Hodgkin’s lymphoma. Results of the HDR-ALLO study - a prospective clinical trial by the Grupo Espanol de Linfomas/Trasplante de Medula Osea (GEL/TAMO) and the Lymphoma Working Party of the European Group for Blood and Marrow Transplantation. Haematologica 2012;97:310–7.
110. Sarina B, Castagna L, Farina L, et al. Allogeneic transplantation improves the overall and progression-free survival of Hodgkin lymphoma patients relapsing after autologous transplantation: a retrospective study based on the time of HLA typing and donor availability. Blood 2010;115:3671–7.
111. Castagna L, Sarina B, Todisco E, et al. Allogeneic stem cell transplantation compared with chemotherapy for poor-risk Hodgkin lymphoma. Biol Blood Marrow Transplant 2009;15:432–8.
112. Thomson KJ, Peggs KS, Smith P, et al. Superiority of reduced-intensity allogeneic transplantation over conventional treatment for relapse of Hodgkin’s lymphoma following autologous stem cell transplantation. Bone Marrow Transplant 2008;41:765–70.
113. Chen R, Palmer JM, Thomas SH, et al. Brentuximab vedotin enables successful reduced-intensity allogeneic hematopoietic cell transplantation in patients with relapsed or refractory Hodgkin lymphoma. Blood 2012;119:6379–81.
ACP osteoporosis treatment guideline debated
DENVER – In May, the American College of Physicians released updated recommendations for treatment of low bone density and osteoporosis, but they have sparked criticism from endocrinologists, though they lauded efforts by the ACP to clarify matters for generalists.
“I think with just a bit of nuance, some of these recommendations could be changed in a way that makes them more consistent with our understanding of the pathophysiology of osteoporosis,” Benjamin Leder, MD, an endocrinologist at Massachusetts General Hospital, Boston, and chair of the American Society for Bone and Mineral Research Professional Practice Committee, said during a session at the society’s annual meeting.
The guideline arrives at a time of increasing concern that osteoporosis is undertreated. Many older women with fractures and low bone mineral density (BMD) do not go on to receive osteoporosis medication, despite a range of effective therapies, and the rate of BMD scans has declined.
In that context, the ACP guideline has the potential to improve treatment uptake, especially since primary care providers are often at the front lines of osteoporosis diagnosis and treatment.
However, the guideline’s recommendations were a subject of pointed debate at the session. The ACP’s update of the guideline has “helped clarify what many view as a murky and complicated area of medicine, but the guidance needs to be balanced with consideration of the wide range of patient presentations in osteoporosis and the different properties of osteoporosis therapies,” said Dr. Leder, who delivered a point-by-point critique of the guideline’s six main points.
The guideline recommends the use of alendronate, risedronate, zoledronic acid, or denosumab to reduce the risk of hip and vertebral fractures in women with osteoporosis. Dr. Leder noted that the guideline omitted anabolic agents, including teriparatide and abaloparatide. There also are no recommendations regarding sequential therapy, which is increasingly viewed as an important therapeutic strategy. “We know that when we switch from teriparatide to a bisphosphonate or another antiresorptive agent, bone density increases as well or better than in patients treated de novo with bisphosphonates. When switching from bisphosphonates to teriparatide, bone mineral density increases are blunted compared to de novo teriparatide treatment,” Dr. Leder noted.
Other criticism of this first point, pointed out in an editorial by Liron Caplan, MD, of the University of Colorado at Denver, Aurora, and his colleagues, took issue with its exclusion of raloxifene, ibandronate, and teriparatide as first-line therapies, given that clinical trials have shown they reduce some types of fractures (Arthritis Rheumatol. 2017 Sep 7. doi: 10.1002/art.40305). The authors of the editorial also worried that insurers may use these limited recommendations as an excuse to limit reimbursement for anabolic agents, which may be the best first-line choice in some high-risk patients.
The guideline also recommends limiting osteoporosis treatment to a 5-year duration, which Dr. Leder criticized as arbitrary. “It doesn’t reflect the wide range of disease severity,” he said. He was particularly critical of the recommendation in the context of denosumab. Studies have shown that the drug continues to increase bone density for many years, with no apparent plateauing effect. “The recommendation of 5 years of therapy may benefit from some more nuance,” Dr. Leder said.
He also sharply criticized one omission. “Denosumab cannot be stopped or switched to teriparatide without a transition to bisphosphonates. This is one of the most crucial missing pieces of the guidelines, and it could potentially harm patients,” he said.
The editorial writers also felt that the 5-year treatment window was oversimplified. They noted that a shorter-than-5-year period may be appropriate for intravenous zoledronate, oral bisphosphonates, and teriparatide.
The guideline also advised against bone density monitoring during the suggested 5-year treatment window. Dr. Leder disagreed. “I don’t know if it’s feasible to start a patient on a medication and then communicate that you’re not going to monitor the effectiveness of that medication. That would be a tough sell for a hypertension drug, or a cholesterol lowering agent,” he said.
The guideline also provides useful information on the rate of adverse events. For example, it notes that atypical femur fractures occur in 1.78 out of 100,000 women taking bisphosphonates for 2 years. That information is useful, according to Dr. Crandall, but she took issue with the fact that the guideline described osteonecrosis of the jaw as rare. “As a primary care provider, I need to know how rare a side effect is, and primary care providers often don’t know that. When I do osteoporosis consultations, I often see patients who believe that osteonecrosis of the jaw occurs in nearly all patients who take bisphosphonates. If PCPs don’t know how rare ONJ is, how can they confront media reports?” Dr. Crandall said.
Overall, Dr. Crandall praised the recommendations as an important step forward. “I think they’re going to move us in the right direction, because primary care physicians read ACP guidelines. They answer key primary care provider questions. The guidelines are clear. PCPs need clear and easy to understand guidelines,” she said.
Dr. Crandall also made a pitch for more research, especially to determine the optimal duration of therapy and fracture reduction in patients with osteopenia. “PCPs need that evidence,” she said.
Dr. Leder has consulted for and received research funding from Amgen, Lilly, and Merck. Dr. Crandall reported having no financial disclosures.
AT ASBMR
IncobotulinumtoxinA May Benefit Patients With Sialorrhea
VANCOUVER—IncobotulinumtoxinA may help treat sialorrhea in patients with Parkinson’s disease or other neurologic conditions, according to a study presented at the 21st International Congress of Parkinson’s Disease and Movement Disorders.
“Results of this large controlled study confirm the efficacy and safety of incobotulinumtoxinA for the treatment of sialorrhea due to Parkinson’s disease and other etiologies,” said Andrew Blitzer, MD, DDS, an otolaryngologist at the Icahn School of Medicine at Mt. Sinai in New York City.

Sialorrhea, or excessive drooling, is a disabling symptom of Parkinson’s disease, cerebral palsy, or other neurologic disorders. The prevalence of sialorrhea ranges from 32% to 74% in patients with Parkinson’s disease. This condition can cause social isolation and is associated with an increased risk of morbidity and mortality associated with perioral skin breakdown, aspiration pneumonia, choking, and dehydration. Previous studies have indicated that botulinum neurotoxin may be useful for treating sialorrhea. However, no formulations have been approved to treat this condition in adults.
To investigate the efficacy and safety of incobotulinumtoxinA for the treatment of sialorrhea, Dr. Blitzer and colleagues conducted a prospective, randomized, double-blind, placebo-controlled study at 33 sites (12 sites in Germa
Eligible participants were adults with chronic sialorrhea related to Parkinson’s disease, atypical Parkinson syndromes, stroke, or traumatic brain injury. They had had sialorrhea for three or more months prior to screening. Patients that had non-neurologic secondary causes of sialorrhea were excluded.
Participants received either 75 U or 100 U of incobotulinumtoxinA or placebo. Dosing and injection sites were 15 U or 20 U into each submandibular gland and 22.5 U or 30 U into each parotid gland in the lower dose group and the higher dose group, respectively. Investigators followed subjects for approximately 16 weeks after injection. Primary outcomes included unstimulated salivary flow rate (USFR) at week 4, compared with baseline, and Global Impression of Change Scale (GICS) at week 4 post injection. Secondary outcomes included change in USFR from baseline to weeks 8 and 12, and GICS at weeks 1, 2, 8, and 12.
Among 184 participants included in the study, 54 were women, and the mean age was 65.2. Sialorrhea etiologies included Parkinson’s disease (70.6%), atypical Parkinson syndromes (8.7%), stroke (17.9%), and traumatic brain injury (2.7%). At baseline, the mean USFR was 0.40 g/min, and the mean Drooling Severity and Frequency Scale score was 6.86.
From baseline to four weeks post treatment, the mean change in USFR was –0.03 g/min in the placebo group, –0.07 g/min in the 75-U incobotulinumtoxinA group, and –0.12 g/min in the 100-U incobotulinumtoxinA group. In addition, secondary analyses indicated significant improvement in the USFR and GICS at week 8 and week 12 post injection in both active treatment groups. Researchers also found that improvement in the USFR was maintained in both dose groups at the last observation point at week 16.Overall, incobotulinumtoxinA was well tolerated. Eight patients withdrew from the study. Three participants discontinued treatment because of adverse events not related to treatment, and two because of a physician decision. One participant was lost to follow-up. The two most frequent treatment-related adverse events were dry mouth and dysphagia. No deaths were reported.
This study was sponsored by Merz Pharmaceuticals, which is headquartered in Raleigh, North Carolina.
—Erica Tricarico
VANCOUVER—IncobotulinumtoxinA may help treat sialorrhea in patients with Parkinson’s disease or other neurologic conditions, according to a study presented at the 21st International Congress of Parkinson’s Disease and Movement Disorders.
“Results of this large controlled study confirm the efficacy and safety of incobotulinumtoxinA for the treatment of sialorrhea due to Parkinson’s disease and other etiologies,” said Andrew Blitzer, MD, DDS, an otolaryngologist at the Icahn School of Medicine at Mt. Sinai in New York City.
Sialorrhea, or excessive drooling, is a disabling symptom of Parkinson’s disease, cerebral palsy, or other neurologic disorders. The prevalence of sialorrhea ranges from 32% to 74% in patients with Parkinson’s disease. This condition can cause social isolation and is associated with an increased risk of morbidity and mortality associated with perioral skin breakdown, aspiration pneumonia, choking, and dehydration. Previous studies have indicated that botulinum neurotoxin may be useful for treating sialorrhea. However, no formulations have been approved to treat this condition in adults.
To investigate the efficacy and safety of incobotulinumtoxinA for the treatment of sialorrhea, Dr. Blitzer and colleagues conducted a prospective, randomized, double-blind, placebo-controlled study at 33 sites (12 sites in Germa
Eligible participants were adults with chronic sialorrhea related to Parkinson’s disease, atypical Parkinson syndromes, stroke, or traumatic brain injury. They had had sialorrhea for three or more months prior to screening. Patients that had non-neurologic secondary causes of sialorrhea were excluded.
Participants received either 75 U or 100 U of incobotulinumtoxinA or placebo. Dosing and injection sites were 15 U or 20 U into each submandibular gland and 22.5 U or 30 U into each parotid gland in the lower dose group and the higher dose group, respectively. Investigators followed subjects for approximately 16 weeks after injection. Primary outcomes included unstimulated salivary flow rate (USFR) at week 4, compared with baseline, and Global Impression of Change Scale (GICS) at week 4 post injection. Secondary outcomes included change in USFR from baseline to weeks 8 and 12, and GICS at weeks 1, 2, 8, and 12.
Among 184 participants included in the study, 54 were women, and the mean age was 65.2. Sialorrhea etiologies included Parkinson’s disease (70.6%), atypical Parkinson syndromes (8.7%), stroke (17.9%), and traumatic brain injury (2.7%). At baseline, the mean USFR was 0.40 g/min, and the mean Drooling Severity and Frequency Scale score was 6.86.
From baseline to four weeks post treatment, the mean change in USFR was –0.03 g/min in the placebo group, –0.07 g/min in the 75-U incobotulinumtoxinA group, and –0.12 g/min in the 100-U incobotulinumtoxinA group. In addition, secondary analyses indicated significant improvement in the USFR and GICS at week 8 and week 12 post injection in both active treatment groups. Researchers also found that improvement in the USFR was maintained in both dose groups at the last observation point at week 16.Overall, incobotulinumtoxinA was well tolerated. Eight patients withdrew from the study. Three participants discontinued treatment because of adverse events not related to treatment, and two because of a physician decision. One participant was lost to follow-up. The two most frequent treatment-related adverse events were dry mouth and dysphagia. No deaths were reported.
This study was sponsored by Merz Pharmaceuticals, which is headquartered in Raleigh, North Carolina.
—Erica Tricarico
Which Interventions Can Slow Cognitive Decline or Prevent Dementia?
LONDON—Cognitive training, blood pressure management, and increased physical activity could slow or delay cognitive decline, according to a new report by the National Academies of Science, Engineering, and Medicine (NASEM). The evidence is insufficient to justify a major public health campaign to encourage the adoption of these interventions, however, according to the organization.
“All the information taken together suggests that there is something that we can do to slow cognitive decline,” said Ronald C. Petersen, MD, PhD, Consultant to the Department of Neurology at the Mayo Clinic in Rochester, Minnesota, and member of the NASEM Committee on Preventing Cognitive Decline. “As these interventions have minimal risk and may be helpful for other conditions, the possible benefits are worthy of comment to the medical community.” In addition, NASEM identified areas for future research in this field, Dr. Petersen noted at the 2017 Alzheimer’s Association International Conference.
The NASEM review committee looked at the following three categories of cognitive decline: age-related cognitive decline, which can be a normal part of aging; mild cognitive impairment (MCI), which does not significantly impair function in daily activities; and clinical Alzheimer’s-type dementia, which denotes severe impairment and loss of functional independence. “With regard to public health messaging, it is unlikely that the general population will recognize these fine distinctions,” Dr. Petersen said.
For its report, NASEM examined a systematic review of randomized controlled trials by the Agency for Healthcare Research and Quality. For a more complete overview on which to base its recommendations, NASEM also analyzed supplementary sources, including prospective cohort studies and observational studies.
Cognitive Training
Evidence from randomized controlled trials shows that cognitive training can delay or slow age-related cognitive decline. “One study in particular, the Advanced Cognitive Training for Independent and Vital Elderly (ACTIVE) trial, showed moderate-strength evidence of benefits,” Dr. Petersen said. “Certainly the data look good out to two years.”
The 10-year ACTIVE trial involved 2,832 subjects age 65 and older who did not have significant cognitive, physical, or functional decline at baseline. Participants were randomized to one of three 10-session training interventions (ie, for memory, reasoning, or speed of information processing) or to no contact. Each intervention improved function in the corresponding cognitive domain, but not necessarily in the other cognitive domains, the researchers found.
The study had certain limitations, however, said Dr. Petersen. “The evidence was of low strength at five years and at 10 years due to attrition and a variety of other factors. Also, there was some selection bias as to who among the study participants would receive additional booster sessions.” Other limitations were the use of no-contact controls and the lack of comparison between treatment arms. “Nevertheless, these were longitudinal data, which are uncommon for a study with these types of interventions.”
These findings may not translate to benefits for commercially available computer-based brain games, Dr. Petersen added. “In the ACTIVE study, there was a social factor, as well. These people did not just sit down at a computer screen, but they were in a group being taught various techniques.” As for supplementary evidence, NASEM identified no observational studies of cognitive training, and it found no evidence that cognitive training has a beneficial effect on MCI or Alzheimer’s-type dementia.
Blood Pressure Management
Randomized controlled trial data were inconsistent with regard to the effects of blood pressure management on the incidence of Alzheimer’s-type dementia. One of four trials, the Systolic Hypertension in Europe (Syst-Eur) trial, showed benefits of this approach.
In this study, eligible patients had no dementia, were at least age 60, and had isolated systolic hypertension. Median follow-up by intention to treat was 2.0 years. Compared with placebo (n = 1,180), active treatment (n = 1,238) reduced the incidence of dementia by 50%. The Syst-Eur trial was stopped after the second of four planned interim analyses because active treatment had reduced stroke incidence, which was the primary end point. Because of ethical issues, however, the NASEM committee questioned whether it is possible or practical to reach a definitive conclusion about the benefits of blood pressure management for dementia using randomized controlled trial data.
Supplementary evidence in favor of blood pressure management includes the link between cerebrovascular disease and dementia, Dr. Petersen said, coupled with the fact that antihypertensive drugs reduce stroke risk and subclinical cerebrovascular disease. Prospective cohort studies more consistently show an association between blood pressure lowering and improved cognitive outcomes. Furthermore, in studies that were not randomized controlled trials, NASEM’s analyses using the Bradford Hill criteria suggested a causal relationship between blood pressure management and decreased incidence of Alzheimer’s-type dementia.
Physical Activity
Although the randomized controlled trial data on the benefits of physical activity were mixed, the results suggested that physical activity could reduce the risk of age-related cognitive decline. Data on the effect of physical activity on the risks of MCI and Alzheimer’s-type dementia were insufficient, Dr. Petersen said. Generally, follow-up periods were too short to assess long-term effects, and MCI and Alzheimer’s-type dementia incidence were rarely measured as outcomes.
“Findings from studies that compared the difference between aerobic training and resistance training were somewhat inconsistent,” Dr. Petersen said. “Some people believe that a mixture of both may in fact be beneficial.” In the largest randomized controlled trial examined, the Lifestyle Interventions and Independence for Elders Pilot study, evidence was insufficient to support conclusions regarding a multicomponent intervention.
“There were observational studies and a variety of longitudinal prospective studies that would suggest that physical activity may have a positive effect on cognitive performance and dementia incidence,” Dr. Petersen said. “It could also have an impact on other conditions that may affect cognitive function, such as hypertension, depression, and diabetes.”
Future Directions for Research
While the NASEM committee recommends more research on the benefits of cognitive training, blood pressure management, and exercise training, it also urges the NIH and other organizations to support studies with improved methodologies. Such improvements include identifying patients at higher risk of cognitive decline or dementia, increasing participation of underrepresented populations, beginning interventions at younger ages, and establishing longer follow-up periods.
The committee also suggests that trials with other primary purposes measure cognitive outcomes. “For instance, if there is an ongoing study on prostate cancer, and the researchers decide midway to add some cognitive measure, that is useful,” Dr. Petersen said. “But it is not as strong as if the study had been prospectively designed to look at cognitive end points at the baseline.”
Other interventions that should be examined are new antidementia treatments; treatments for diabetes and depression; dietary, lipid-lowering, and sleep-quality interventions; social engagement interventions; and supplementation with vitamin B12 plus folic acid, said Dr. Petersen.
—Adriene Marshall
Suggested Reading
Forette F, Seux ML, Staessen JA, et al. Prevention of dementia in randomised double-blind placebo-controlled Systolic Hypertension in Europe (Syst-Eur) trial. Lancet. 1998;352(9137):1347-1351.
Jobe JB, Smith DM, Ball K, et al. ACTIVE: a cognitive intervention trial to promote independence in older adults. Control Clin Trials. 2001;22(4):453-479.
LIFE Study Investigators, Pahor M, Blair SN, et al. Effects of a physical activity intervention on measures of physical performance: Results of the Lifestyle Interventions and Independence for Elders Pilot (LIFE-P) study. J Gerontol A Biol Sci Med Sci. 2006;61(11):1157-1165.
National Academies of Sciences, Engineering, and Medicine. 2017. Preventing Cognitive Decline and Dementia: A Way Forward. Washington, DC: The National Academies Press; 2017.
Staessen JA, Thijs L, Birkenhäger WH, et al. Update on the systolic hypertension in Europe (Syst-Eur) trial. The Syst-Eur Investigators. Hypertension. 1999;33(6):1476-1477.
Combination of Rivaroxaban and Aspirin Improves Cardiovascular Outcomes
Compared with aspirin alone, a regimen of rivaroxaban plus aspirin is associated with better cardiovascular outcomes among patients with stable atherosclerotic vascular disease, according to research published August 27 in the New England Journal of Medicine. Although the combination increases the risk of major bleeding events, it has greater net clinical benefit than aspirin alone, said the investigators.
COMPASS: An International Trial
“Efforts to improve aspirin have focused primarily on combining aspirin with another antiplatelet drug or replacing aspirin with another antiplatelet drug, but this [tactic] has had only limited success,” said Dr. Eikelboom. He and his colleagues conducted the Cardiovascular Outcomes for People Using Anticoagulation Strategies (COMPASS) trial, a double-blind study to evaluate whether rivaroxaban, a selective direct factor Xa inhibitor, either alone or in combination with aspirin, would be more effective than aspirin alone for secondary cardiovascular prevention.
The study took place at 602 centers in 33 countries. Eligible patients met the criteria for coronary artery disease, peripheral arterial disease, or both. Among the exclusion criteria were high bleeding risk, recent stroke or previous hemorrhagic or lacunar stroke, severe heart failure, and advanced stable kidney disease. During a run-in phase, participants received a rivaroxaban-matched placebo twice daily and aspirin (100 mg/day). Participants who adhered to this regimen were randomized in equal groups to rivaroxaban (2.5 mg bid) plus aspirin (100 mg/day), rivaroxaban (5 mg bid) plus placebo once daily, or aspirin (100 mg/day) plus placebo twice daily.
The primary efficacy outcome was the composite of cardiovascular death, stroke, or myocardial infarction. The main safety outcome was a modification of the International Society on Thrombosis and Hemostasis criteria for major bleeding. The investigators intended to continue the trial until at least 2,200 participants had a confirmed primary efficacy outcome. They planned formal interim analyses of efficacy for when 50% and 75% of primary efficacy events had occurred.
Study Was Stopped Early for Efficacy
The investigators enrolled 27,395 participants into the trial. The population’s mean age was 68.2, and 22.0% of participants were women. The mean systolic blood pressure was 136 mm Hg, the mean diastolic blood pressure was 78 mm Hg, and the mean total cholesterol level was 4.2 mmol/L. Having observed a consistent difference in the primary efficacy outcome in favor of rivaroxaban plus aspirin, the independent data and safety monitoring board recommended early termination of the study at the first formal interim analysis for efficacy.
The rate of primary outcome events was 4.1% (379 patients) in the rivaroxaban-plus-aspirin group, 4.9% (448 patients) in the rivaroxaban group, and 5.4% (496 patients) in the aspirin group. Compared with aspirin alone, rivaroxaban plus aspirin reduced the risk of the primary outcome by 24%. Rivaroxaban alone reduced the risk of the primary outcome by 10%, compared with aspirin alone, but this result was not statistically significant.
The rate of major bleeding events was 3.1% (288 patients) in the rivaroxaban-plus-aspirin group and 1.9% (170 patients) in the aspirin-alone group. Compared with aspirin alone, rivaroxaban plus aspirin increased the risk of major bleeding by 70%. Most of the excess major bleeding occurred in the gastrointestinal tract. The researchers saw no significant between-group difference in the rates of fatal bleeding, intracranial bleeding, or symptomatic bleeding into a critical organ. The rate of serious adverse events was 7.9% (721 patients) in the rivaroxaban-plus-aspirin group, 7.7% (702 patients) in the rivaroxaban group, and 7.3% (662 patients) in the aspirin group.
The risk of the net-clinical-benefit outcome (ie, a composite of cardiovascular death, stroke, myocardial infarction, fatal bleeding, or symptomatic bleeding into a critical organ) was 20% lower with rivaroxaban plus aspirin than with aspirin alone. The risk of the net-clinical-benefit outcome was not significantly lower with rivaroxaban alone than with aspirin alone.
Could Practice Guidelines Change?
Although the rate of stroke was lower among patients receiving rivaroxaban plus aspirin than among patients receiving aspirin alone, the researchers found no statistically significant difference between groups in the rate of myocardial infarction, said Eugene Braunwald, MD, Professor of Cardiovascular Medicine at Brigham and Women’s Hospital in Boston, in an accompanying editorial. Nevertheless, “this trial represents an important step forward in thrombocardiology, and it is likely to change practice guidelines,” he added.
Future clinical investigation in this field could pursue several paths. For example, a head-to-head comparison between aspirin plus a second antiplatelet drug and a low dose of a factor Xa inhibitor could be of great interest, said Dr. Braunwald. “Perhaps substituting a P2Y12 inhibitor or thrombin-receptor antagonist for aspirin, together with a very low dose of a factor Xa inhibitor, might lead to even greater efficacy by reducing myocardial infarction,” he added. Also, different subgroups of patients with stable ischemic heart disease may respond differently to these various drug combinations, and these different responses could enable a personalized approach to patients with stable ischemic heart disease, he concluded.
—Erik Greb
Suggested Reading
Braunwald E. An important step for thrombocardiology. N Engl J Med. 2017 Aug 27 [Epub ahead of print].
Eikelboom JW, Connolly SJ, Bosch J, et al. Rivaroxaban with or without aspirin in stable cardiovascular disease. N Engl J Med. 2017 Aug 27 [Epub ahead of print].
