User login
GIs should be able to prescribe the most beneficial treatments
Appealing step therapy protocols can be time consuming and burdensome for physicians and patients, and can takes months to resolve. The Restoring the Patient’s Voice Act (HR 2077), introduced by physicians Reps. Brad Wenstrup, R-OH, and Raul Ruiz, D-CA, would provide a clear and timely appeals process when a patient has been subjected to step therapy by their insurance provider.
AGA endorsed this legislation to provide patients with a clear, equitable and fair appeals process when subjected to step therapy protocols. AGA is working with patient advocacy groups, like the Crohn’s and Colitis Foundation, provider, and professional societies to educate members of Congress on this issue and the implications it has for patients being able to access the right treatment at the right time.
AGA remembers former AGA President Marvin Sleisenger, MD, AGAF
Marvin H. Sleisenger, MD, AGAF, of Kentfield, Calif., died at age 93 on Thursday, Oct. 19, 2017. Sleisenger served as editor of Gastroenterology from 1965 to 1970, and as president of AGA in 1976.
Sleisenger attended Harvard College and Harvard Medical School. He trained at Harvard, the University of Pennsylvania, and Cornell Medical School. During the Korean War, he served in the U.S. Naval Medical Corps. He was a member of the faculty at Cornell Medical School and in 1954, was appointed as chief of the division of gastroenterology. In 1968, he became professor and vice chairman of the department of medicine of the University of California, San Francisco and chief of the medical service at the Veterans Administration Hospital. His achievements as an outstanding educator were recognized in 1994 when he became the recipient of the AGA Distinguished Educator Award.
Sleisenger’s full obituary was published in the SFGate. Members, colleagues, and friends posted remembrances in the Community.
Memorial services were held on Sunday, Oct. 29, 2017, at 11 a.m., at the Chapel of the Mt. Tamalpais Cemetery, 2500 Fifth Avenue, San Rafael, Calif.
Clinical Challenges - December 2017 What's your diagnosis?
The diagnosis
Answer: Hydrogen peroxide ingestion causing significant portal venous gas and stomach wall thickening
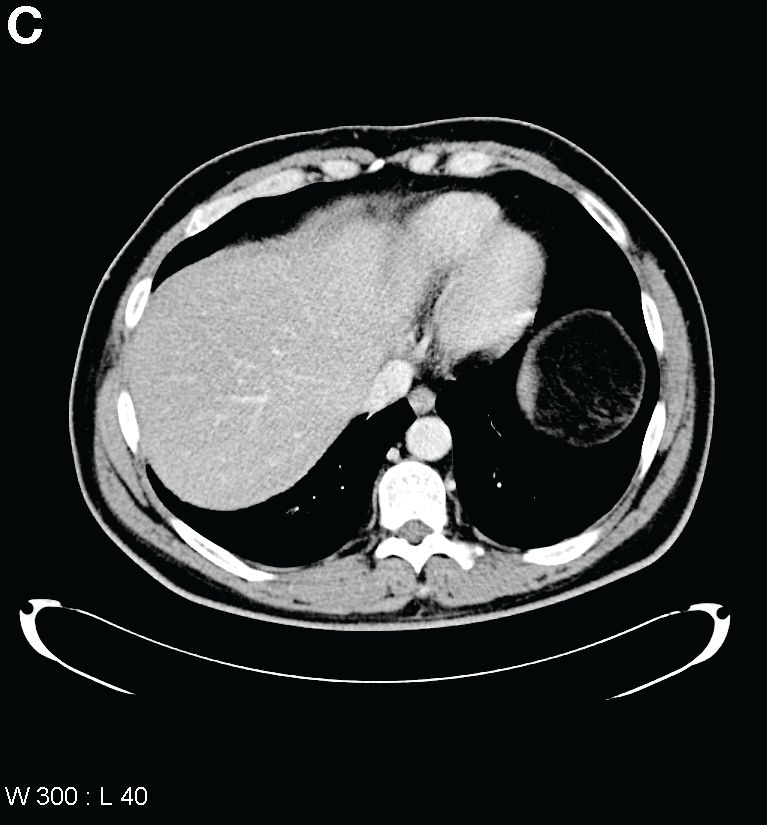
Upon further questioning, it was found that the patient accidentally ingested approximately 50 mL of concentrated 35% hydrogen peroxide (H2O2) solution, which he was using in diluted form as a naturopathic treatment for his diabetes mellitus. He was admitted to our institution and closely monitored for evidence of perforation and respiratory distress. Given the extent of portal venous gas, he was promptly treated with hyperbaric oxygen to prevent cerebral gas embolism. Clinically, he remained stable over the next 24 hours and repeat imaging the next day revealed dramatic improvement of the portal venous gas (Figure C). He was discharged on day 4 of hospitalization with no obvious clinical sequelae. Outpatient gastroscopy was arranged to assess any further potential damage, but he was lost to follow-up.
References
1. Watt, B.E., Proudfoot, A.T., Vale, J.A. Hydrogen peroxide poisoning. Toxicol Rev. 2004;23:51-7.
2. French, L.K., Horowitz, B.Z., McKeown, N.J. Hydrogen peroxide ingestion associated with portal venous gas and treatment with hyperbaric oxygen: a case series and review of the literature. Clin Toxicol. 2010;48:533-8.
The diagnosis
Answer: Hydrogen peroxide ingestion causing significant portal venous gas and stomach wall thickening
Upon further questioning, it was found that the patient accidentally ingested approximately 50 mL of concentrated 35% hydrogen peroxide (H2O2) solution, which he was using in diluted form as a naturopathic treatment for his diabetes mellitus. He was admitted to our institution and closely monitored for evidence of perforation and respiratory distress. Given the extent of portal venous gas, he was promptly treated with hyperbaric oxygen to prevent cerebral gas embolism. Clinically, he remained stable over the next 24 hours and repeat imaging the next day revealed dramatic improvement of the portal venous gas (Figure C). He was discharged on day 4 of hospitalization with no obvious clinical sequelae. Outpatient gastroscopy was arranged to assess any further potential damage, but he was lost to follow-up.
References
1. Watt, B.E., Proudfoot, A.T., Vale, J.A. Hydrogen peroxide poisoning. Toxicol Rev. 2004;23:51-7.
2. French, L.K., Horowitz, B.Z., McKeown, N.J. Hydrogen peroxide ingestion associated with portal venous gas and treatment with hyperbaric oxygen: a case series and review of the literature. Clin Toxicol. 2010;48:533-8.
By Mark C. Fok, BScPharm, Charles Zwirewich, MD, and Baljinder S. Salh, MBChB. Published previously in Gastroenterology (2013;144[3]:509, 658-9).
A 49-year-old man presented with severe epigastric pain and nonbloody emesis after ingestion of a naturopathic treatment for type 2 diabetes mellitus.
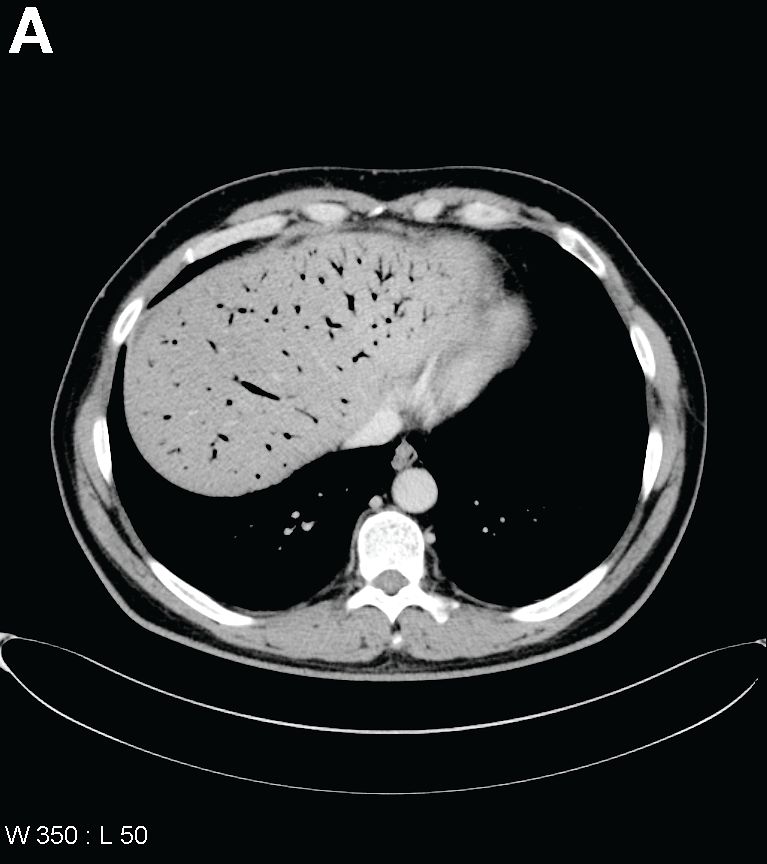
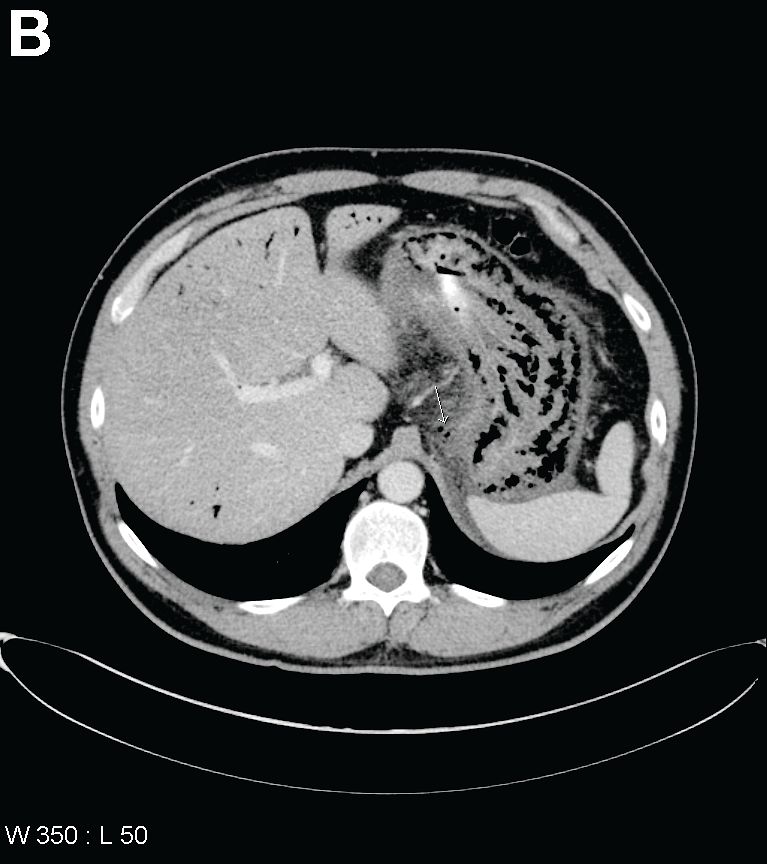
Urgent abdominal computed tomography was performed, which revealed extensive portal venous gas throughout the liver (Figure A) and pneumatosis with thickening of the stomach wall (Figure B).
What is your diagnosis and treatment?
Clinical implications of cesarean-induced isthmoceles
In a presentation of the Golden Hysteroscope Award Best Paper on Hysteroscopy at the 46th AAGL Global Congress on Minimally Invasive Surgery in National Harbor, Maryland, James Coad, MD, described a study that he and colleagues from West Virginia University School of Medicine in Morgantown, and Universidad Autónoma de Nuevo León in Monterrey, Mexico, conducted concerning the healing differences of cesarean incisions and the development of isthmoceles (cesarean scar defects).1
Detecting isthmoceles
Isthmoceles are variably sized evaginations into the anterior lower uterine segment at a previous cesarean delivery incision due to suboptimal myometrium healing. This leads to thinning of the anterior uterine wall, which creates an indentation and fluid-filled pouch at the cesarean scar site.1,2
Recent findings, say Coad and colleagues, associate isthmoceles with adverse reproductive and gynecologic conditions such as infertility, postmenstrual spotting, dysmenorrhea, and chronic pelvic pain. Patients who have undergone multiple cesarean deliveries tend to have larger isthmoceles with widths correlating to increased symptoms.1
While the presence of inner nonunion healing can be hysteroscopically visualized, it is difficult to detect outer nonunion healing. The reported incidence of isthmoceles differs by imaging technique used: up to 70% are found with transvaginal ultrasound, and up to 84% are detected by sonohysterography.3,4 This study found that 98% of isthomoceles can be detected by gross examination.1
Related article:
Cesarean scar defect: What is it and how should it be treated?
Study details
Researchers designed a prospective de-identified anatomic pathology study to evaluate the anatomy of uteri from 204 premenopausal women who underwent hysterectomy for benign disease due to abnormal uterine bleeding, fibroids, and/or adenomyosis. Uteri were midline sagittally sectioned and the area of cesarean section anatomy was documented, including the presence of inner and outer nonunion healing.1
Of the 204 uteri, 134 (66%) had at least 1 identifiable cesarean scar (22% had 1 scar, 19% had 2 scars, and 25% had 3 or more scars). Of these, 2 uteri (1.5%) had intact incisional healing with minimal wall narrowing showing complete union healing. Isolated inner nonunion healing with the formation of prominent isthmoceles was found in 111 uteri (82.8%). Five uteri (3.7%) showed isolated outer nonunion healing without the formation of isthmoceles. Fourteen uteri (10.5%) had both inner and outer nonunion healing. Two uteri (1.5%) had complete transmural union healing with localized loss of anterior lower segment wall integrity. No isthmoceles were detected in women who had not undergone cesarean delivery.1
Study results
When present, inner nonunion healing involved a mean (SD) 39% (23%; range, 5% – 90%) of the wall thickness and outer nonunion healing involved a mean (SD) 27% (17%; range, 10% – 60%). Due to nonunion healing, the resultant wall thicknesses at cesarean scar site were a mean (SD) 5.6 mm ( 2.60 mm; range, 0.0 mm – 14.2 mm). When compared with the adjacent uterine wall, the nonunion healing resulted in an approximate mean (SD) of 70% (16%) thinner wall. 1
Conclusions and a warning
The authors concluded that, following cesarean delivery, there is a high incidence of architectural healing–related change, including significant inner and outer wall thinning. While inner nonunion healing can be hysteroscopically visualized, outer-wall healing cannot be visualized and may result in finding a thinner wall than expected during procedures in this region, including isthmocele repairs.1
Share your thoughts! Send your Letter to the Editor to [email protected]. Please include your name and the city and state in which you practice.
- Coad JE, Fugett II JH, Wolfe T, et al. Anatomy of cesarean-induced isthmoceles: Clinical implications [abstract 159]. In: Abstracts of the 46th AAGL Global Congress on Minimally Invasive Surgery. JMIG. 2017;24(7 suppl):S64.
- Nezhat C, Grace L, Soliemannjad R, Razavi GM, Nezhat A. Cesarean scar defect: What is it and how should it be treated? OBG Manag. 2016;28(4):32,34,36,38–39,53.
- Bij de Vaate AJ, van der Voet LF, Naji O, et al. Prevalenc, potential risk factors for development and symptoms related to the presence of uterine niches following Cesarean section: systematic review. Ultrasound Obstet Gynecol. 2014;43(4):372–382.
- Osser OV, Jokubkiene L, Valentin L. High prevalence of defects in Cesarean section scars at transvaginal ultrasound examination. Ultrasound Obstet Gynecol. 2009;34(1):90–97.
In a presentation of the Golden Hysteroscope Award Best Paper on Hysteroscopy at the 46th AAGL Global Congress on Minimally Invasive Surgery in National Harbor, Maryland, James Coad, MD, described a study that he and colleagues from West Virginia University School of Medicine in Morgantown, and Universidad Autónoma de Nuevo León in Monterrey, Mexico, conducted concerning the healing differences of cesarean incisions and the development of isthmoceles (cesarean scar defects).1
Detecting isthmoceles
Isthmoceles are variably sized evaginations into the anterior lower uterine segment at a previous cesarean delivery incision due to suboptimal myometrium healing. This leads to thinning of the anterior uterine wall, which creates an indentation and fluid-filled pouch at the cesarean scar site.1,2
Recent findings, say Coad and colleagues, associate isthmoceles with adverse reproductive and gynecologic conditions such as infertility, postmenstrual spotting, dysmenorrhea, and chronic pelvic pain. Patients who have undergone multiple cesarean deliveries tend to have larger isthmoceles with widths correlating to increased symptoms.1
While the presence of inner nonunion healing can be hysteroscopically visualized, it is difficult to detect outer nonunion healing. The reported incidence of isthmoceles differs by imaging technique used: up to 70% are found with transvaginal ultrasound, and up to 84% are detected by sonohysterography.3,4 This study found that 98% of isthomoceles can be detected by gross examination.1
Related article:
Cesarean scar defect: What is it and how should it be treated?
Study details
Researchers designed a prospective de-identified anatomic pathology study to evaluate the anatomy of uteri from 204 premenopausal women who underwent hysterectomy for benign disease due to abnormal uterine bleeding, fibroids, and/or adenomyosis. Uteri were midline sagittally sectioned and the area of cesarean section anatomy was documented, including the presence of inner and outer nonunion healing.1
Of the 204 uteri, 134 (66%) had at least 1 identifiable cesarean scar (22% had 1 scar, 19% had 2 scars, and 25% had 3 or more scars). Of these, 2 uteri (1.5%) had intact incisional healing with minimal wall narrowing showing complete union healing. Isolated inner nonunion healing with the formation of prominent isthmoceles was found in 111 uteri (82.8%). Five uteri (3.7%) showed isolated outer nonunion healing without the formation of isthmoceles. Fourteen uteri (10.5%) had both inner and outer nonunion healing. Two uteri (1.5%) had complete transmural union healing with localized loss of anterior lower segment wall integrity. No isthmoceles were detected in women who had not undergone cesarean delivery.1
Study results
When present, inner nonunion healing involved a mean (SD) 39% (23%; range, 5% – 90%) of the wall thickness and outer nonunion healing involved a mean (SD) 27% (17%; range, 10% – 60%). Due to nonunion healing, the resultant wall thicknesses at cesarean scar site were a mean (SD) 5.6 mm ( 2.60 mm; range, 0.0 mm – 14.2 mm). When compared with the adjacent uterine wall, the nonunion healing resulted in an approximate mean (SD) of 70% (16%) thinner wall. 1
Conclusions and a warning
The authors concluded that, following cesarean delivery, there is a high incidence of architectural healing–related change, including significant inner and outer wall thinning. While inner nonunion healing can be hysteroscopically visualized, outer-wall healing cannot be visualized and may result in finding a thinner wall than expected during procedures in this region, including isthmocele repairs.1
Share your thoughts! Send your Letter to the Editor to [email protected]. Please include your name and the city and state in which you practice.
- Coad JE, Fugett II JH, Wolfe T, et al. Anatomy of cesarean-induced isthmoceles: Clinical implications [abstract 159]. In: Abstracts of the 46th AAGL Global Congress on Minimally Invasive Surgery. JMIG. 2017;24(7 suppl):S64.
- Nezhat C, Grace L, Soliemannjad R, Razavi GM, Nezhat A. Cesarean scar defect: What is it and how should it be treated? OBG Manag. 2016;28(4):32,34,36,38–39,53.
- Bij de Vaate AJ, van der Voet LF, Naji O, et al. Prevalenc, potential risk factors for development and symptoms related to the presence of uterine niches following Cesarean section: systematic review. Ultrasound Obstet Gynecol. 2014;43(4):372–382.
- Osser OV, Jokubkiene L, Valentin L. High prevalence of defects in Cesarean section scars at transvaginal ultrasound examination. Ultrasound Obstet Gynecol. 2009;34(1):90–97.
FDA approves sunitinib malate as adjuvant treatment for RCC
The Food and Drug Administration has approved sunitinib malate for the adjuvant treatment of adult patients at high risk of recurrent renal cell carcinoma (RCC) following nephrectomy.
“This is the first adjuvant treatment approved for patients with renal cell carcinoma, which is significant because patients with this disease who have a nephrectomy are often at high risk of the cancer returning,” Richard Pazdur, MD, director of the FDA’s Oncology Center of Excellence and acting director of the Office of Hematology and Oncology Products in the FDA’s Center for Drug Evaluation and Research, said in a written statement.

Approval for adjuvant treatment of RCC was based on median disease-free survival of 6.8 years for patients receiving sunitinib malate, compared with 5.6 years for patients receiving placebo in S-TRAC, a phase III trial of 615 patients with high risk of recurrent RCC following nephrectomy. In the trial, presented at the European Society for Medical Oncology Congress in 2016 and published in the New England Journal of Medicine, patients were randomized 1:1 to receive either 50 mg sunitinib malate once daily, 4 weeks on treatment followed by 2 weeks off, or placebo. Overall survival data were not mature at the time of data analysis.
The most common adverse reactions to sunitinib in the trial were fatigue/asthenia, diarrhea, mucositis/stomatitis, nausea, decreased appetite/anorexia, vomiting, abdominal pain, hand-foot syndrome, hypertension, bleeding events, dysgeusia, dyspepsia, and thrombocytopenia.
Severe side effects included hepatotoxicity, low left ventricular ejection fraction, myocardial ischemia/infarction, prolonged QT intervals/torsade de pointes, hypertension, hemorrhagic events, tumor lysis syndrome, thrombotic microangiopathy (including thrombotic thrombocytopenic purpura and hemolytic uremic syndrome), proteinuria, thyroid dysfunction, hypoglycemia, osteonecrosis, and wound-healing complications. A boxed warning alerts health care professionals and patients about the risk of hepatoxicity, which may result in liver failure or death.
Sunitinib malate is marketed as Sutent by Pfizer. The recommended dose for the adjuvant treatment of RCC is 50 mg orally once daily, with or without food, 4 weeks on treatment followed by 2 weeks off for nine 6-week cycles.
Full prescribing information is available here.
The Food and Drug Administration has approved sunitinib malate for the adjuvant treatment of adult patients at high risk of recurrent renal cell carcinoma (RCC) following nephrectomy.
“This is the first adjuvant treatment approved for patients with renal cell carcinoma, which is significant because patients with this disease who have a nephrectomy are often at high risk of the cancer returning,” Richard Pazdur, MD, director of the FDA’s Oncology Center of Excellence and acting director of the Office of Hematology and Oncology Products in the FDA’s Center for Drug Evaluation and Research, said in a written statement.
Approval for adjuvant treatment of RCC was based on median disease-free survival of 6.8 years for patients receiving sunitinib malate, compared with 5.6 years for patients receiving placebo in S-TRAC, a phase III trial of 615 patients with high risk of recurrent RCC following nephrectomy. In the trial, presented at the European Society for Medical Oncology Congress in 2016 and published in the New England Journal of Medicine, patients were randomized 1:1 to receive either 50 mg sunitinib malate once daily, 4 weeks on treatment followed by 2 weeks off, or placebo. Overall survival data were not mature at the time of data analysis.
The most common adverse reactions to sunitinib in the trial were fatigue/asthenia, diarrhea, mucositis/stomatitis, nausea, decreased appetite/anorexia, vomiting, abdominal pain, hand-foot syndrome, hypertension, bleeding events, dysgeusia, dyspepsia, and thrombocytopenia.
Severe side effects included hepatotoxicity, low left ventricular ejection fraction, myocardial ischemia/infarction, prolonged QT intervals/torsade de pointes, hypertension, hemorrhagic events, tumor lysis syndrome, thrombotic microangiopathy (including thrombotic thrombocytopenic purpura and hemolytic uremic syndrome), proteinuria, thyroid dysfunction, hypoglycemia, osteonecrosis, and wound-healing complications. A boxed warning alerts health care professionals and patients about the risk of hepatoxicity, which may result in liver failure or death.
Sunitinib malate is marketed as Sutent by Pfizer. The recommended dose for the adjuvant treatment of RCC is 50 mg orally once daily, with or without food, 4 weeks on treatment followed by 2 weeks off for nine 6-week cycles.
Full prescribing information is available here.
A letter from Dr. Robert S. Sandler, MPH, AGAF
Dear Colleagues,
Where would clinical practice be today without GI research?
The way we diagnose and treat patients is thanks to years of research. But as you know, federal research funding is at risk. Promising, early-stage investigators find it increasingly difficult to secure funding and many leave the field because they are unable to sustain a research career.
This is bad news for digestive health patients and the clinicians who care for them.
As a member of the GI community, you understand the need to continually advance the science and practice of gastroenterology. You understand the physical, emotional, and financial costs of digestive diseases. And you understand the tremendous value of research to advance patient care.
At a time when we are on the brink of major scientific breakthroughs, there is a growing gap in federal funding for research. Many well-qualified young investigators cannot get government funding. Gifts to the AGA Research Foundation this year directly supported 52 talented investigators. Despite this success, over 200 other innovative and promising research ideas went unfunded.
I am asking you to support a cause important to me and equally important to you. You can help fill the funding gap and protect the next generation of investigators by joining me in supporting the AGA Research Foundation through a personal gift.
Every dollar is a step forward...to new treatments. To cures impacting patients’ lives. To new generations of talented investigators in digestive disease research.
Please help us continue our efforts by making your tax-deductible donation. Donate today at www.gastro.org/donate.
Thank you in advance for your support and best wishes for a happy, healthy holiday season and successful New Year.
Three easy ways to give
Online: www.gastro.org/donateThrough the mail:
AGA Research Foundation
4930 Del Ray Avenue
Bethesda, MD 20814
Over the phone: 301-222-4002
All gifts are tax-deductible to the fullest extent of U.S. law.
FDA authorizes next-generation sequencing test for tumor profiling
The Food and Drug Administration has authorized a new tumor profiling test that can identify a larger number of genetic mutations than available in any other test previously reviewed, the agency has announced.
The tumor profiling test, developed at Memorial Sloan Kettering Cancer Center and known as MSK-IMPACT (Integrated Mutation Profiling of Actionable Cancer Targets), is a custom targeted sequencing platform that uses exon capture and sequencing, so-called next-generation sequencing, to identify point mutations, small insertions and deletions, and microsatellite instability in tumor specimens. The assay involves hybridization capture and deep sequencing of all protein coding exons of 468 cancer-associated genes, as well as molecular changes in a tumor’s genomic makeup, according to the FDA announcement.
Unlike cancer diagnostic tests designed to determine the presence of one cancer biomarker for use with a single drug, the IMPACT test compares tumor tissue to a “normal” tissue or cell sample from the same patient to find genetic alterations that could potentially guide treatment options. However, the FDA said, the results of IMPACT are “not conclusive” for choosing a corresponding treatment.
Next-generation sequencing technologies can examine “hundreds, if not millions, of DNA variants at a time,” Jeffrey Shuren, MD, director of the FDA’s Center for Devices and Radiological Health, said in the announcement. “We are only at the beginning of realizing the true potential for these devices to assist patients and their health care providers in learning about the genetic underpinnings of their disease.”
Evaluations of IMPACT suggest the assay is “highly accurate” with a greater than 99% capability of detecting a mutation at a frequency of approximately 5%, according to the FDA.
In addition, detection of molecular changes, including microsatellite instability, were concordant more than 92% of the time when compared with traditional detection methods, the agency said.
Along with the marketing authorization for IMPACT, which was granted to Memorial Sloan Kettering Cancer Center, the agency announced that the New York State Department of Health has been accredited as an FDA third-party reviewer of in vitro diagnostics similar to IMPACT.
That action “paves the way” for efficient review and availability of other next-generation sequencing–based cancer profiling tools.
Allowing third parties to review next-generation sequencing–based tumor profiling tests will “reduce the burden on test developers and streamline the regulatory assessment of these types of innovative products,” FDA Commissioner Scott Gottlieb, MD, said in the announcement.
MMR vaccine coverage at 94% in kindergartners
, according to the Centers for Disease Control and Prevention.
A look at the map shows that state coverage of required MMR doses varied considerably. Mississippi (99.4%), Maryland (99.3%), Delaware (98.5%), California (97.3%), New York (97.3%), Texas (97.3%), and Louisiana (97.1%) were the furthest above the national median. Occupying the low end of the range were the District of Columbia (85.6%), Colorado (87.3%), Indiana (88.9%), Alaska (89.0%), Kansas (89.5%), and Idaho (89.9%), reported Ranee Seither, MPH, of the National Center for Immunization and Respiratory Disease, and associates at the CDC, Atlanta (MMWR 2017 Oct 13;66[40]:1073-80).
The data for the CDC analysis, which included 3,973,172 kindergartners for the 2016-2017 school year, were collected by federally funded immunization programs in the 50 states and D.C.
FROM MMWR
Well, I figured it out ... I owe my soul to the company store
Going to sell you your practice?
You know I am certain that we physicians are never going to be paid much more than we get paid right now. Now we may get occasional 0.5% increases from Medicare, but after no pay increase for 15 years and with the new unachievable payments for quality, I am not optimistic. So, I have been talking to corporate physician buyout companies, specifically amalgamators of dermatologists. I mean, in the words of the “Fat Man” in “The House of God,” who wants to pass up a “fortuna”?
In June 2017, as far as I can tell, there were 17 corporate dermatology groups out there employing about 1,200 “providers” which includes extenders, and there are several “models” of assimilation.
There are extremes on either end. The least invasive is the group that buys you for a dollar, hopefully has better insurance contracts, and charges you a percentage for billing and management of your practice. If you want, you can buy yourself back for a dollar. In this setting, you just have to keep a close eye on how expenses are calculated. And there is no guarantee that this group won’t sell out to venture capital in the future, so you have to be prepared to reassume control of your practice if you don’t want to be acquired along with the group.
Another category is what I call the bottom feeders, who set up multiple dermatology shopfronts manned by nurse practitioners and physician assistants, who are loosely supervised by a physician, often remotely, who may not even be a dermatologist. The only requirement is that they have a medical license in that state. This group will come to town and bid for all the dermatology work from managed care companies. Typically, they are happy to settle for 85% of Medicare payments.
The more common model is based on acquiring practices, then selling them to other venture capital groups for a return to other venture capital groups. Venture capital groups are behind all the corporate practice acquisitions except for one, which funds out of a personal fortune. They all view medicine, particularly dermatology, as a fragmented industry that they can consolidate for a profit.
The basic plan of these groups is to pay you five to eight times EBITDA (earnings before interest, taxes, depreciation, and amortization) up front, which works out to be about 2 or 3 years net profits. Usually, they want you to take at least 40% of your “buyout” as company stock, which they promise may appreciate greatly, but has no liquidity until they sell to another venture capital group and maybe not even then. The cash you receive can mostly be treated as capital gains if you negotiate it correctly, which will be taxed at 23.8% (the 20% tax rate plus the Affordable Care Act 3.8% supplemental tax, instead of 39.6%, the top current federal bracket.
Generally, their expectations are that you will get 40% of the practice income as salary, overhead will be 40%, and their profit is 20%. So their buyout is really a loan from them, which will be paid off in 5 years. Admittedly, the buyout will be taxed less than your current income, with a possible equity kicker when they flip the practice, which they hope to do three or four times! Also, be aware, the physicians who got in early and represent them get a piece of what you would have been paid (usually $50,000-$100,000 in stock) for recruiting you. There is a reason they are working the company booth at meetings! It’s “Amway for Dermatologists.”
The company then owns your practice, you are an employee, and you owe them at least 5 years of service. They put you on a salary, which is less than you made previously – and interestingly, the difference again usually pays their original investment off in 5 years, usually with some interest. If you are a younger physician who owns the practice, with a longer practice future, you should receive a higher percentage of your former income. If the company can “boost” your practice income, you could make as much as or more than you did before, but most of these outfits do not have better insurance contracts. Their “boost” is based on hiring more physician assistants or nurse practitioners, and having you supervise them.
Once you sell and are owned by the company, they strongly suggest (but do not require, which is illegal) that you send your dermatopathology to your fellow employee, in another state, whom you have never met and probably never will. They will also suggest you send your Mohs cases to a fellow employee you’ve never heard of, who comes to town a couple of days a month to perform the surgeries. They take over your human resources, including your policies and payroll, which may be good if you have overpaid cranky employees you just can’t bear to fire because they have been with you so long. They will standardize everyone’s pay and benefits. They take over your billing, and may be able to get you more reasonable health insurance, and will have a standardized benefit plan. If you need to buy anything for the practice, you will fill out a requisition form. Major capital purchases must be approved in advance.
Your contract will specify that you have to work, on average, at least as many days per year as you have the last 3 years. If you leave early, you will have to pay the money you received, plus penalties. In addition, you may have a 2-year, 20-mile noncompete agreement clause (although this is negotiable) around all sites they operate, anywhere in the United States. If you die, they have an insurance policy on you.
Young employed doctors don’t get the “buy out” or the equity, although they can “buy in” later. They become cogs in the wheel.
The groups then try to roll up as many practices as possible so they can resell the amalgamation to a larger private equity fund eventually for 10-15 times EBITDA if the group is large enough. Maybe so, maybe not, but I have a strong feeling this is not going to end well. These equity funds work with borrowed money, and want double their investment and profit in 5 years or less.

The biggest losers, however, are the patients. They become a commodity, to be pushed through the office, and will not enjoy the benefits of the best consultants, but instead will have to select from the employees of the company store.
Dr. Coldiron is in private practice but maintains a clinical assistant professorship at the University of Cincinnati. He cares for patients, teaches medical students and residents, and has several active clinical research projects. Dr. Coldiron is the author of more than 80 scientific letters, papers, and several book chapters, and he speaks frequently on a variety of topics. He is a past president of the American Academy of Dermatology. Write to him at [email protected].
Going to sell you your practice?
You know I am certain that we physicians are never going to be paid much more than we get paid right now. Now we may get occasional 0.5% increases from Medicare, but after no pay increase for 15 years and with the new unachievable payments for quality, I am not optimistic. So, I have been talking to corporate physician buyout companies, specifically amalgamators of dermatologists. I mean, in the words of the “Fat Man” in “The House of God,” who wants to pass up a “fortuna”?
In June 2017, as far as I can tell, there were 17 corporate dermatology groups out there employing about 1,200 “providers” which includes extenders, and there are several “models” of assimilation.
There are extremes on either end. The least invasive is the group that buys you for a dollar, hopefully has better insurance contracts, and charges you a percentage for billing and management of your practice. If you want, you can buy yourself back for a dollar. In this setting, you just have to keep a close eye on how expenses are calculated. And there is no guarantee that this group won’t sell out to venture capital in the future, so you have to be prepared to reassume control of your practice if you don’t want to be acquired along with the group.
Another category is what I call the bottom feeders, who set up multiple dermatology shopfronts manned by nurse practitioners and physician assistants, who are loosely supervised by a physician, often remotely, who may not even be a dermatologist. The only requirement is that they have a medical license in that state. This group will come to town and bid for all the dermatology work from managed care companies. Typically, they are happy to settle for 85% of Medicare payments.
The more common model is based on acquiring practices, then selling them to other venture capital groups for a return to other venture capital groups. Venture capital groups are behind all the corporate practice acquisitions except for one, which funds out of a personal fortune. They all view medicine, particularly dermatology, as a fragmented industry that they can consolidate for a profit.
The basic plan of these groups is to pay you five to eight times EBITDA (earnings before interest, taxes, depreciation, and amortization) up front, which works out to be about 2 or 3 years net profits. Usually, they want you to take at least 40% of your “buyout” as company stock, which they promise may appreciate greatly, but has no liquidity until they sell to another venture capital group and maybe not even then. The cash you receive can mostly be treated as capital gains if you negotiate it correctly, which will be taxed at 23.8% (the 20% tax rate plus the Affordable Care Act 3.8% supplemental tax, instead of 39.6%, the top current federal bracket.
Generally, their expectations are that you will get 40% of the practice income as salary, overhead will be 40%, and their profit is 20%. So their buyout is really a loan from them, which will be paid off in 5 years. Admittedly, the buyout will be taxed less than your current income, with a possible equity kicker when they flip the practice, which they hope to do three or four times! Also, be aware, the physicians who got in early and represent them get a piece of what you would have been paid (usually $50,000-$100,000 in stock) for recruiting you. There is a reason they are working the company booth at meetings! It’s “Amway for Dermatologists.”
The company then owns your practice, you are an employee, and you owe them at least 5 years of service. They put you on a salary, which is less than you made previously – and interestingly, the difference again usually pays their original investment off in 5 years, usually with some interest. If you are a younger physician who owns the practice, with a longer practice future, you should receive a higher percentage of your former income. If the company can “boost” your practice income, you could make as much as or more than you did before, but most of these outfits do not have better insurance contracts. Their “boost” is based on hiring more physician assistants or nurse practitioners, and having you supervise them.
Once you sell and are owned by the company, they strongly suggest (but do not require, which is illegal) that you send your dermatopathology to your fellow employee, in another state, whom you have never met and probably never will. They will also suggest you send your Mohs cases to a fellow employee you’ve never heard of, who comes to town a couple of days a month to perform the surgeries. They take over your human resources, including your policies and payroll, which may be good if you have overpaid cranky employees you just can’t bear to fire because they have been with you so long. They will standardize everyone’s pay and benefits. They take over your billing, and may be able to get you more reasonable health insurance, and will have a standardized benefit plan. If you need to buy anything for the practice, you will fill out a requisition form. Major capital purchases must be approved in advance.
Your contract will specify that you have to work, on average, at least as many days per year as you have the last 3 years. If you leave early, you will have to pay the money you received, plus penalties. In addition, you may have a 2-year, 20-mile noncompete agreement clause (although this is negotiable) around all sites they operate, anywhere in the United States. If you die, they have an insurance policy on you.
Young employed doctors don’t get the “buy out” or the equity, although they can “buy in” later. They become cogs in the wheel.
The groups then try to roll up as many practices as possible so they can resell the amalgamation to a larger private equity fund eventually for 10-15 times EBITDA if the group is large enough. Maybe so, maybe not, but I have a strong feeling this is not going to end well. These equity funds work with borrowed money, and want double their investment and profit in 5 years or less.
The biggest losers, however, are the patients. They become a commodity, to be pushed through the office, and will not enjoy the benefits of the best consultants, but instead will have to select from the employees of the company store.
Dr. Coldiron is in private practice but maintains a clinical assistant professorship at the University of Cincinnati. He cares for patients, teaches medical students and residents, and has several active clinical research projects. Dr. Coldiron is the author of more than 80 scientific letters, papers, and several book chapters, and he speaks frequently on a variety of topics. He is a past president of the American Academy of Dermatology. Write to him at [email protected].

Women with adult acne need more treatment options and support
Adult women with acne need to be taken more seriously and offered more treatment options, according to Hilary Baldwin, MD, clinical associate professor of dermatology at Robert Wood Johnson Medical School, New Brunswick, N.J.
In a presentation on adult acne in women at Skin Disease Education Foundation’s Women’s & Pediatric Dermatology Seminar, Dr. Baldwin said that while acne in females typically peaks between ages 14 and 17 years, many women in the United States are experiencing adult-onset acne that can persist late into adulthood. “The adult female has been ignored in the past, when we’ve been concentrating primarily on teenagers with acne,” Dr. Baldwin explained in an interview. Women are the second most commonly population affected by acne, with an estimated prevalence in up to 50% of women in their 20s, 30% of women in their 30s, and 25% in their 40s, she added.
“It may ‘just be’ acne at 16 when it’s going to go away at 17, but it’s not ‘just acne’ in a 23-year-old who’s going to have it until menopause,” she said.
Three subtypes of acne have been described in adult women: Persistent acne, a continuation of acne from adolescence to adulthood; late onset acne, the development of acne in patients after age 25 years; and relapsing acne, the return of acne later in life in a patient who had acne as an adolescent. In adults, about 80% of acne is the persistent type.
More study is needed to determine the prevalence of the relapsing subtype, which is not well described in the literature, Dr. Baldwin noted.
Two types of acne in adult women have been described, and they may have different responses to treatment, she said. The “U zone” form is characterized by inflammatory papules and nodules – and no comedones – that primarily affect the lower third of the face, jawline, and neck, typically sparing the back and shoulders, she said. Conversely, the diffuse form is characterized by numerous comedones and inflammatory lesions, which may produce scarring.
Dr. Baldwin said that acne can have a greater impact on women than on adolescents, with a greater impact on quality of life – and emotional effects that are “similar to patients with psoriasis.”
In a survey of 128 women with acne who were asked about what they expect from their dermatologists, 56% said they felt examination with their dermatologists was too quick, and 44% said that they felt that their skin was not looked at meticulously enough. And almost half said that the discussion of different treatment options was not detailed enough, and was too short.
Most dermatologists can evaluate the severity of a patient’s acne without bringing out a magnifying glass, but for the sake of the patient’s trust, taking the time to check “more meticulously” may help the patient mentally and physically, she said. Taking this time, as well as involving patients in treatment decisions, may also improve treatment adherence, she added.
“You are more likely, if you made a decision or helped to make a decision ... to use the product,” Dr. Baldwin said about working with patients.
Dr. Baldwin disclosed serving as a speaker, adviser, and/or investigator for Allergan, Bayer, BioPharmX, Dermira, Encore, La Roche-Posay, Mayne, Novan, Johnson & Johnson, Sun, Valeant, and Galderma.
SDEF and this news organization are owned by Frontline Medical Communications.
[email protected]
On Twitter @eaztweets
FROM SDEF WOMEN’S & PEDIATRIC DERMATOLOGY SEMINAR