User login
Update reveals ongoing responses in ZUMA-1

ATLANTA—The chimeric antigen receptor (CAR) T-cell therapy axicabtagene ciloleucel (axi-cel; KTE-C19) is showing consistent, ongoing responses more than a year after infusion.
An updated analysis of the phase 1/2 ZUMA-1 trial showed that 42% of patients who received axi-cel maintained an objective response at a median follow-up of 15.4 months.
Forty percent of patients have maintained a complete response (CR).
This compares with a 44% objective response rate and a 39% CR rate in the primary analysis of phase 2 ZUMA-1 data, when the median follow-up was 8.7 months.
Sattva S. Neelapu, MD, of MD Anderson Cancer Center in Houston, Texas, reported the long-term results from ZUMA-1 at the 2017 ASH Annual Meeting (abstract 578). The findings were published simultaneously in NEJM.
The primary phase 2 analysis was previously presented at the AACR Annual Meeting 2017.
At ASH 2017, Dr Neelapu disclosed that he has received research funding and served as a consultant for Kite Pharma, the developer of axi-cel. Kite Pharma and the Leukemia & Lymphoma Society Therapy Acceleration Program supported ZUMA-1.
Study schema and patient characteristics
Phase 1 of ZUMA-1 enrolled 7 patients with diffuse large B-cell lymphoma (DLBCL), primary mediastinal B-cell lymphoma (PMBCL), or transformed follicular lymphoma (TFL).
In phase 2, 101 patients were grouped into 2 cohorts—77 with refractory DLBCL and 24 with refractory PMBCL/TFL.
A total of 108 patients were treated in phases 1 and 2 and were included in the long-term pooled analysis.
Patients received a conditioning regimen of cyclophosphamide and fludarabine and, 2 days later, a fixed dose of axi-cel at 2 x 10⁶ CAR T cells/kg.
“Importantly, the product could be manufactured for 99% of enrolled patients,” Dr Neelapu said. “Moreover, 91% of the enrolled patients were dosed with axi-cel, and there were no patients lost to follow-up.”
Patients in the pooled analysis were a median age of 58 (range, 23–76), and 27 (25%) were 65 or older.
Seventy-three patients (68%) were male, 62 (57%) had an ECOG status of 1, 90 (83%) had stage III or IV disease, and 48 (44%) had an IPI score of 3 to 4.
Seventy-six patients (70%) had received 3 or more prior therapies.
Eighty patients (74%) were refractory to their second or later line of therapy, and 70 (65%) had progressive disease as their best response to their last prior therapy. Twenty-five patients (23%) had relapsed after autologous stem cell transplant.
Response
The data cutoff for the long-term analysis was August 11, 2017.
In addition to the ongoing responses mentioned above, the best objective response was 82% in both the phase 2 primary analysis and the long-term analysis for phases 1 and 2.
CR as the best objective response increased from 54% in the primary analysis to 58% at the longer follow-up.
“We did observe deepening of the responses over time,” Dr Neelapu said. “At the time of the first tumor assessment, 60 patients had either partial remission or stable disease. But 23 of those 60 eventually achieved a complete remission up to 15 months post-infusion without any additional therapy.”
The median time to conversion from partial response to CR was 64 days (range, 49–242).
“The durability of these responses was observed consistently across key covariates,” Dr Neelapu added, “including the refractory subgroups, the disease stage groups, IPI risk groups. The CD19 status at baseline did not matter, nor did the cell of origin, or the CD4/CD8 ratio of the product.”
Furthermore, the investigators observed no differences in patients who received tocilizumab or corticosteroids.
The median duration of response for all patients was 11.1 months. For those who achieved CR, the median duration of response has not yet been reached.
Three of the 7 patients (43%) in the phase 1 part of the trial had an ongoing CR at 24 months.
At the median follow-up of 15.4 months, 42% of patients were progression-free, and 56% were alive.
The median overall survival has not been reached. Investigators estimated the 18-month overall survival to be 52%.
Safety
Adverse events (AEs) of grade 3 or higher occurred in 97% of patients, and serious AEs of grade 3 or higher occurred in 46% of patients in the updated analysis.
No new axi-cel-related AEs of cytokine release syndrome, neurologic events, or grade 5 AEs have arisen since the primary analysis.
There were four grade 5 events, 2 of which were related to axi-cel.
“All these four grade 5 events were previously reported—three in the phase 2 and one in the phase 1 trial,” Dr Neelapu said.
Most patients experienced hypogammaglobulinemia and B-cell aplasia. Eight percent of patients had IVIG support during the study.
Infections, such as pneumonia, influenza, and viral infection, were the most common new-onset treatment-emergent serious AEs occurring after 6 months in 10 patients. All were manageable and resolved prior to the data cut-off.
Persistence and resistance
“We observed long-term persistence of the CAR T cells,” Dr Neelapu said.
CAR T cells persisted in 71% of patients still responding at 1 year. And durable responses were observed in patients with and without detectable CAR T cells.
A central review committee analyzed biopsies of 21 evaluable patients at progression to try to determine the mechanism of resistance.
Fourteen of 21 (67%) biopsies were CD19-positive. Of these, 9 were PD-L1-positive, 4 were PD-L1-negative, and 1 was not evaluable.
Seven patients (33%) were CD19-negative compared to baseline. Of these, 4 were PD-L1-positive, 2 were PD-L1-negative, and 1 was not evaluable.
“This PD-L1 expression was observed in both CD19-positive relapses and CD19-negative relapses,” Dr Neelapu emphasized.
Of the 21 patients, 62% were PD-L1-positive.
Investigators hypothesize that 2 potential mechanisms could contribute to relapse: loss of CD19 and expression of PD-L1.
Axi-cel (Yescarta™) was approved by the US Food and Drug Administration in October for the treatment of adults with relapsed or refractory large B-cell lymphoma. ![]()
AAP adds peramivir to influenza recommendations
The American Academy of Pediatrics Committee on Infectious Diseases has added information on peramivir, a recently approved antiviral medication, to its Recommendations for Prevention and Control of Influenza in Children for 2017-2018.
Peramivir (Rapivab) was approved by the Food and Drug Administration in September 2017, as an intravenous treatment for acute, uncomplicated influenza in nonhospitalized children aged 2 years and older who have been symptomatic for no more than 2 days, according to the update.
Peramivir is given to 2-12 year olds as a single infusion at 12 mg/kg, with a maximum dose of 600 mg, according to the guideline update (Pediatrics. 2017 Oct;140[4]:e20172550). Patients 13 years and older should receive the 600-mg dose.
“Rapivab is a great addition to our armamentarium of antiviral agents to combat influenza,” John A. Vanchiere, MD, PhD, chief of the section of pediatric infectious diseases at LSU Health Sciences Center, Shreveport. said in a press release from the drug’s manufacturer, BioCryst Pharmaceuticals. “It will be especially helpful for patients who cannot tolerate oral medications. In addition, the long half-life allows for one-time dosing, which will improve compliance.”
Dr. Vanchiere is the lead author in a study of peramivir’s effectiveness against pediatric influenza that was presented as a poster at ID Week 2017.
The phase 3, randomized, control trial included 122 patients, ranging in age from newborns to 18-year-olds, with acute uncomplicated influenza symptoms.
Investigators gave 92 patients peramivir, while the remaining 23 received oral oseltamivir (Tamiflu).
Nearly all (93%) of the patients were white; 61% had an influenza A strain infection, and there were comparable numbers of male and female study subjects.
Vomiting, fever, and tympanic membrane erythema were the most common adverse effects specifically reported in the study, which was funded by BioCryst.
Peramivir is the third neuraminidase inhibitor (NAI) to be approved; other approved NAIs include oral oseltamivir and inhaled zanamivir.
A fourth NAI, intravenous zanamivir, is still investigational in the United States.
Peramivir, like other antiviral drugs, may interfere with a live attenuated influenza vaccine and should not be used within 2 weeks after or 48 hours before the use of an LAIV.
While the AAP’s recommendations highlight the antiviral’s effectiveness in controlling influenza, the Academy warns that antivirals are not a substitute for influenza vaccination.
Common skin diseases of the vulva: Red down there

Visit the Society of Gynecologic Surgeons online: sgsonline.org
Additional videos from SGS are available here, including these recent offerings:
Visit the Society of Gynecologic Surgeons online: sgsonline.org
Additional videos from SGS are available here, including these recent offerings:
Visit the Society of Gynecologic Surgeons online: sgsonline.org
Additional videos from SGS are available here, including these recent offerings:
This video is brought to you by![]()

ACC guidance addresses newer HFrEF options
It might be prudent to , according to a new expert consensus document from the American College of Cardiology on managing heart failure with reduced ejection fraction.
“While rising natriuretic peptide concentrations are correlated with adverse outcomes, this relationship can be confounded with the use of sacubitril/valsartan. Due to neprilysin inhibition, concentrations of BNP rise in patients treated with sacubitril/valsartan and tend not to return to baseline despite chronic therapy. In contrast, NT-proBNP concentrations typically decrease, as NT-proBNP is not a substrate for neprilysin,” explained authors led by heart failure pathway writing committee chairman Clyde W. Yancy, MD, chief of cardiology at Northwestern University in Chicago (J Am Coll Cardiol. 2017 Dec 22. doi: 10.1016/j.jacc.2017.11.025).

Treatment of heart failure with reduced ejection fraction (HFrEF) “can feel overwhelming, and many opportunities to improve patient outcomes are being missed; hopefully, this Expert Consensus Decision Pathway may streamline care to realize best possible patient outcomes,” the authors wrote.
The 10 issues and their detailed answers address therapeutic options, adherence, treatment barriers, drug costs, special populations, and palliative care. The document is full of tables and figures of treatment algorithms, drug doses, and other matters.
There’s a good deal of advice about using two newer HFrEF options: sacubitril/valsartan and ivabradine (Corlanor). Sacubitril/valsartan, an angiotensin receptor-neprilysin inhibitor (ANRI), is a switch agent for patients who tolerate but remain symptomatic on ACE inhibitors (ACEIs) or angiotensin II receptor blockers (ARB). Moving over to sacubitril/valsartan has been shown to decrease the risk of hospitalization and death.
Switching from an ACEI requires a 36-hour washout period to avoid angdioedema; no washout is needed for ARB switches. Sacubitril/valsartan doses can be increased every 2-4 weeks to allow time for adjustment to vasodilatory effects. In one study, gradual titration over about 6 weeks maximized attainment of target dosages. As with ACEIs and ARBs, titration might require lowering loop diuretic doses, with careful attention paid to potassium concentrations.
“The committee is aware that clinicians may occasionally consider initiating ANRI in patients who have not previously been treated with an ACEI or ARB. To be explicitly clear, no predicate data supports this approach,” but it “might be considered” if patients are well informed of the risks, including angioedema and hypotension, the committee wrote.
Ivabradine is for patients whose resting heart rate is at or above 70 bpm despite maximal beta-blocker treatment. “It is important to emphasize that ivabradine is indicated only for patients in sinus rhythm, not in those with atrial fibrillation, patients who are 100% atrially paced, or unstable patients. From a safety standpoint, patients treated with ivabradine had more bradycardia and developed more atrial fibrillation as well as transient blurring of vision,” according to the consensus document.
Turning to wireless implantable pulmonary artery pressure monitoring, another newer approach, the group noted that, compared with standard care, it reduced hospitalization and led to more frequent adjustment of diuretic doses, suggesting a benefit “in well-selected patients with recurrent congestion. … The impact on mortality is unknown.”
“For a number of reasons,” hydralazine/isosorbide dinitrate “is often neglected in eligible patients. However, given the benefits of this combination (43% relative reduction in mortality and 33% relative reduction in HF hospitalization), African-American patients should receive these drugs once target or maximally tolerated doses of beta-blocker and ACEI/ ARB/ARNI are achieved. This is especially important for those patients with [New York Heart Association] class III to IV symptoms,” the committee members said.
Regarding treatment adherence, the group noted that “monetary incentives or other rewards for adherence to medications may be cost saving for highly efficacious and inexpensive drugs such as beta-blockers.”
The work was supported by the ACC with no industry funding. Dr. Yancy had no disclosures.
SOURCE: Yancy C et. al. J Am Coll Cardiol. 2017 Dec 22. doi: 10.1016/j.jacc.2017.11.025
It might be prudent to , according to a new expert consensus document from the American College of Cardiology on managing heart failure with reduced ejection fraction.
“While rising natriuretic peptide concentrations are correlated with adverse outcomes, this relationship can be confounded with the use of sacubitril/valsartan. Due to neprilysin inhibition, concentrations of BNP rise in patients treated with sacubitril/valsartan and tend not to return to baseline despite chronic therapy. In contrast, NT-proBNP concentrations typically decrease, as NT-proBNP is not a substrate for neprilysin,” explained authors led by heart failure pathway writing committee chairman Clyde W. Yancy, MD, chief of cardiology at Northwestern University in Chicago (J Am Coll Cardiol. 2017 Dec 22. doi: 10.1016/j.jacc.2017.11.025).
Treatment of heart failure with reduced ejection fraction (HFrEF) “can feel overwhelming, and many opportunities to improve patient outcomes are being missed; hopefully, this Expert Consensus Decision Pathway may streamline care to realize best possible patient outcomes,” the authors wrote.
The 10 issues and their detailed answers address therapeutic options, adherence, treatment barriers, drug costs, special populations, and palliative care. The document is full of tables and figures of treatment algorithms, drug doses, and other matters.
There’s a good deal of advice about using two newer HFrEF options: sacubitril/valsartan and ivabradine (Corlanor). Sacubitril/valsartan, an angiotensin receptor-neprilysin inhibitor (ANRI), is a switch agent for patients who tolerate but remain symptomatic on ACE inhibitors (ACEIs) or angiotensin II receptor blockers (ARB). Moving over to sacubitril/valsartan has been shown to decrease the risk of hospitalization and death.
Switching from an ACEI requires a 36-hour washout period to avoid angdioedema; no washout is needed for ARB switches. Sacubitril/valsartan doses can be increased every 2-4 weeks to allow time for adjustment to vasodilatory effects. In one study, gradual titration over about 6 weeks maximized attainment of target dosages. As with ACEIs and ARBs, titration might require lowering loop diuretic doses, with careful attention paid to potassium concentrations.
“The committee is aware that clinicians may occasionally consider initiating ANRI in patients who have not previously been treated with an ACEI or ARB. To be explicitly clear, no predicate data supports this approach,” but it “might be considered” if patients are well informed of the risks, including angioedema and hypotension, the committee wrote.
Ivabradine is for patients whose resting heart rate is at or above 70 bpm despite maximal beta-blocker treatment. “It is important to emphasize that ivabradine is indicated only for patients in sinus rhythm, not in those with atrial fibrillation, patients who are 100% atrially paced, or unstable patients. From a safety standpoint, patients treated with ivabradine had more bradycardia and developed more atrial fibrillation as well as transient blurring of vision,” according to the consensus document.
Turning to wireless implantable pulmonary artery pressure monitoring, another newer approach, the group noted that, compared with standard care, it reduced hospitalization and led to more frequent adjustment of diuretic doses, suggesting a benefit “in well-selected patients with recurrent congestion. … The impact on mortality is unknown.”
“For a number of reasons,” hydralazine/isosorbide dinitrate “is often neglected in eligible patients. However, given the benefits of this combination (43% relative reduction in mortality and 33% relative reduction in HF hospitalization), African-American patients should receive these drugs once target or maximally tolerated doses of beta-blocker and ACEI/ ARB/ARNI are achieved. This is especially important for those patients with [New York Heart Association] class III to IV symptoms,” the committee members said.
Regarding treatment adherence, the group noted that “monetary incentives or other rewards for adherence to medications may be cost saving for highly efficacious and inexpensive drugs such as beta-blockers.”
The work was supported by the ACC with no industry funding. Dr. Yancy had no disclosures.
SOURCE: Yancy C et. al. J Am Coll Cardiol. 2017 Dec 22. doi: 10.1016/j.jacc.2017.11.025
FROM THE JOURNAL OF THE AMERICAN COLLEGE OF CARDIOLOGY
Unplanned cesareans more common with excess gestational weight gain
MONTREAL – The risk for unplanned cesarean delivery is increased when maternal gestational weight gain exceeds the recommended amount – as it does in almost half of pregnancies in the United States.
In a new analysis of data from the Infant Feeding Practices Study II (IFPS II), women with excessive gestational weight gain (GWG) were found to have an adjusted odds ratio of 1.61 for unplanned cesarean delivery, compared with women with adequate GWG (95% confidence interval, 1.11-2.33; P = .013).

Maternal obesity is known to be a risk factor for cesarean delivery, at least in part because excess adipose tissue may interfere with the normal ability of the cervix to thin and dilate with contractions, said Mr. Francescon, a medical student at Ohio University Heritage College of Osteopathic Medicine, Athens. Labor can be prolonged, and it’s often difficult to monitor fetal activity with external activity, he said.
To see whether unplanned cesarean deliveries were associated with excess GWG, Mr. Francescon and his collaborators included data from 2,107 of the 3,033 respondents to the IFPS II, excluding those with missing data and those with planned cesarean deliveries.
Weight gain was grouped into three categories – adequate, inadequate, and excessive – according to guidelines set by the Institute of Medicine. The odds of an unplanned cesarean delivery were adjusted by using multivariable analysis that took into account ethnicity, education, poverty status, parity, and previous obstetric history. The statistical analysis also accounted for the presence of gestational diabetes and the type of birth attendant.
A total of 1,038 women (49.3%) had excessive GWG according to the IOM guidelines, and 287 women (13.6%) overall had an unplanned cesarean delivery. After adjusting for the potentially confounding variables, only excessive weight gain was significantly associated with the risk for unplanned cesarean delivery; those with inadequate weight gain had an odds ratio of 1.03 (95% CI, 0.63-1.69; not significant).
, but rather were attended by a nonobstetrician physician or a midwife, said Mr. Francescon. After excluding patients who planned to have cesarean deliveries, 257 of 1,385 (15.6%) of patients seeing obstetricians had unplanned cesarean deliveries; this figure was 9% for nonobstetrician physicians and 4.1% for midwives/nurse midwives.
“This finding suggests that psychosocial factors, such as the bond formed between caregiver and patient, could also potentially influence birthing patterns,” wrote Mr. Francescon and his collaborators.
“Our study findings are supported by previous studies that found increased likelihood of cesarean delivery among women with excessive GWG,” said the investigators.
The study had a large sample size, used well-tested survey instruments, and could include many variables in statistical analysis, all strengths, wrote Mr. Francescon and his coauthors. However, there remained the potential for volunteer bias and recall bias. In addition, weight gain carries social stigma, which could have influence the self-reported results.
“Gestational weight gain is a modifiable risk factor for unplanned cesarean delivery,” Mr. Francescon said. He and his collaborators propose that a comprehensive plan of dietary and lifestyle modifications beginning pre-conception, together with enhanced patient and provider awareness of the risk of unplanned cesarean deliveries with excess gestational weight gain, could help reduce the number of unplanned cesarean deliveries.
The data for the study were provided by the Centers for Disease Control and Prevention. Mr. Francescon reported no conflicts of interest.
SOURCE: Francescon J. NAPCRG 2017 Abstract P495.
MONTREAL – The risk for unplanned cesarean delivery is increased when maternal gestational weight gain exceeds the recommended amount – as it does in almost half of pregnancies in the United States.
In a new analysis of data from the Infant Feeding Practices Study II (IFPS II), women with excessive gestational weight gain (GWG) were found to have an adjusted odds ratio of 1.61 for unplanned cesarean delivery, compared with women with adequate GWG (95% confidence interval, 1.11-2.33; P = .013).
Maternal obesity is known to be a risk factor for cesarean delivery, at least in part because excess adipose tissue may interfere with the normal ability of the cervix to thin and dilate with contractions, said Mr. Francescon, a medical student at Ohio University Heritage College of Osteopathic Medicine, Athens. Labor can be prolonged, and it’s often difficult to monitor fetal activity with external activity, he said.
To see whether unplanned cesarean deliveries were associated with excess GWG, Mr. Francescon and his collaborators included data from 2,107 of the 3,033 respondents to the IFPS II, excluding those with missing data and those with planned cesarean deliveries.
Weight gain was grouped into three categories – adequate, inadequate, and excessive – according to guidelines set by the Institute of Medicine. The odds of an unplanned cesarean delivery were adjusted by using multivariable analysis that took into account ethnicity, education, poverty status, parity, and previous obstetric history. The statistical analysis also accounted for the presence of gestational diabetes and the type of birth attendant.
A total of 1,038 women (49.3%) had excessive GWG according to the IOM guidelines, and 287 women (13.6%) overall had an unplanned cesarean delivery. After adjusting for the potentially confounding variables, only excessive weight gain was significantly associated with the risk for unplanned cesarean delivery; those with inadequate weight gain had an odds ratio of 1.03 (95% CI, 0.63-1.69; not significant).
, but rather were attended by a nonobstetrician physician or a midwife, said Mr. Francescon. After excluding patients who planned to have cesarean deliveries, 257 of 1,385 (15.6%) of patients seeing obstetricians had unplanned cesarean deliveries; this figure was 9% for nonobstetrician physicians and 4.1% for midwives/nurse midwives.
“This finding suggests that psychosocial factors, such as the bond formed between caregiver and patient, could also potentially influence birthing patterns,” wrote Mr. Francescon and his collaborators.
“Our study findings are supported by previous studies that found increased likelihood of cesarean delivery among women with excessive GWG,” said the investigators.
The study had a large sample size, used well-tested survey instruments, and could include many variables in statistical analysis, all strengths, wrote Mr. Francescon and his coauthors. However, there remained the potential for volunteer bias and recall bias. In addition, weight gain carries social stigma, which could have influence the self-reported results.
“Gestational weight gain is a modifiable risk factor for unplanned cesarean delivery,” Mr. Francescon said. He and his collaborators propose that a comprehensive plan of dietary and lifestyle modifications beginning pre-conception, together with enhanced patient and provider awareness of the risk of unplanned cesarean deliveries with excess gestational weight gain, could help reduce the number of unplanned cesarean deliveries.
The data for the study were provided by the Centers for Disease Control and Prevention. Mr. Francescon reported no conflicts of interest.
SOURCE: Francescon J. NAPCRG 2017 Abstract P495.
REPORTING FROM NAPCRG 2017
Key clinical point: The risk for an unplanned cesarean delivery rose with excess gestational weight gain.
Major finding: The adjusted odds ratio for unplanned cesarean was 1.61 for those with excess GWG (P = .013).
Study details: Retrospective analysis of 2,107 responses to the Infant Feeding Practices Study II (IFPSII).
Disclosures: Study data were provided by the Centers for Disease Control and Prevention. Mr. Francescon reported no conflicts of interest.
Source: Francescon J. NAPCRG 2017 Abstract P495.
Pemphigus associated with higher risk of hematologic malignancies
, based on the findings of a retrospective study conducted at the Rambam Health Care Campus, Haifa, Israel.
Although the findings are preliminary, the possible associations should be considered when treating pemphigus patients, the investigators reported in the Journal of the American Academy of Dermatology.
Khalaf Kridin, MD, of the Rambam Health Care Campus department of dermatology and his fellow investigators conducted a cross-sectional, retrospective, controlled study of 11,859 patients gathered from the Clait Health Services computerized database. A total of 1,985 pemphigus patients and 9,874 control patients were included. Patients were 72 years old on average, and most were female (60%) and Jewish (90%).
Dr. Kridin and his colleagues measured the prevalence of acute and chronic leukemia, Hodgkin and non-Hodgkin lymphoma, multiple myeloma, and polycythemia vera.
The pemphigus patients, compared with the control group, had a significantly higher prevalence of chronic leukemia (0.9% vs 0.4% [P = .007]), multiple myeloma (0.8% vs 0.4% [P = .009]), and non-Hodgkin lymphoma (1.8% vs 1.2% [P = .040]).
In a sensitivity analysis, patients with pemphigus were twice as likely to have chronic leukemia (odds ratio = 2.1; 95% confidence interval, 1.2-3.6) and multiple myeloma (OR = 2.2; 95% CI, 1.2-3.9) and were one and a half times as likely to have non-Hodgkin lymphoma (OR = 1.5; 95% CI, 1.0-2.2).
Dr. Kridin and his fellow investigators hypothesized that the risks may be related to some pemphigus treatments.
“Certain immunosuppressive treatments for pemphigus, such as azathioprine, could increase the risk of developing hematologic malignancies,” they wrote. “Controlling for immunosuppressive agents attenuated the association of pemphigus with non-Hodgkin lymphoma and multiple myeloma, hinting that they play a role in the higher prevalence.”
Chronic immune stimulation also may be influencing a higher prevalence of hematologic cancers in pemphigus patients “by randomly introducing pro-oncogenic mutations in rapidly dividing cells,” they said.
Investigators were limited by a lack of data on patients’ immunopathological subtype, clinical features, severity of pemphigus, and precise histological type of leukemia and lymphoma.
Dr. Kridin and his fellow investigators reported no relevant financial disclosures.
SOURCE: Kridin K et al. J Am Acad Dermatol. 2017 Dec 2. doi:10.1016/j.jaad.2017.11.039.
FROM THE JOURNAL OF THE AMERICAN ACADEMY OF DERMATOLOGY
Key clinical point: There may be an association between pemphigus and developing certain cancers.
Major finding: Prevalence of chronic leukemia, multiple myeloma, and non-Hodgkin lymphoma was 0.9%, 0.8%, and 1.8%, respectively. The prevalence in controls was 0.4%, 0.4%, and 1.2%, respectively.
Study details: Cross-sectional study of 1,985 pemphigus patients and 9,874 control subjects gathered from the Clait Health Services computerized database.
Disclosures: The investigators reported no relevant disclosures.
Source: Kridin K et al. J Am Acad Dermatol. 2017 Dec 2. doi: 10.1016/j.jaad.2017.11.039.
Fetal alcohol spectrum disorders and suicidality
As psychiatrists, we understand that behavior is complex and determined by multiple factors. However, despite our understanding that behavior is cultural, sociological, psychological, and biological, we often lose sight of the biological perspective because the brain is such a complex organ and because we are inundated with psychological theories of behavior. As I have said before, we cannot abdicate our role of being biologists in the reflection of mental health and wellness.
Accordingly, I feel it is my duty to bring our attention to a biologic etiology of suicidal behavior. I came across an article on the life expectancy of individuals afflicted with fetal alcohol syndrome in the Journal of Population Therapeutics and Clinical Pharmacology (2016;23[1]:e53-9). The findings were astonishing. As it turns out, the life expectancy of people with fetal alcohol syndrome is 34 years of age on average, and the leading causes of death were “external causes,” which accounted for 44% of the deaths. Suicide was responsible for 15% of those deaths, accidents for 14%, poisoning by illegal drugs or alcohol for 7%, and other external causes for another 7%, according to the article.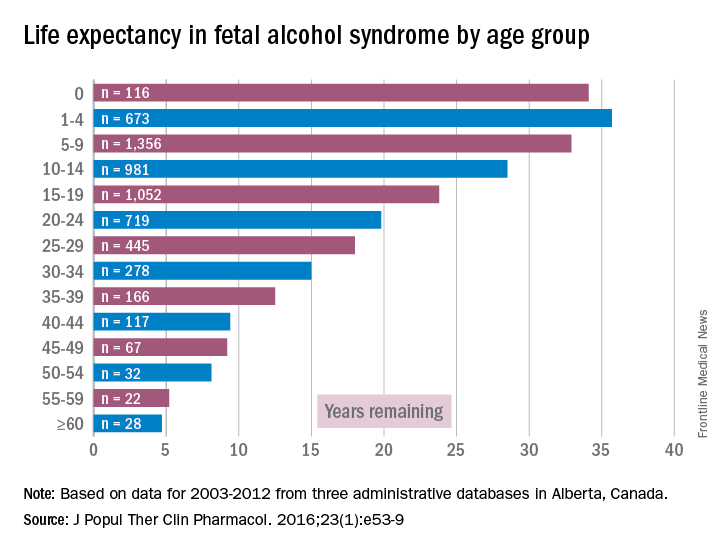
While working in a general hospital in a low-income African American environment where there are high rates of fetal alcohol exposure, I see at least 3-4 suicide attempts a week on the medical-surgical/psychiatric inpatient units where I serve. I am always looking for patients who have ND-PAE because determining such a diagnosis is critical to those patients’ medical-surgical care. For example, there was one woman with ND-PAE who had operable breast carcinoma but did not come in for a return visit until after her carcinoma had become inoperable (she forgot how important it was to get timely treatment). There was a patient who always had out-of-control diabetes because he did not know how to use his glucometer. There was a patient who was taking his antipsychotic medication during the day instead of as prescribed – at bedtime – because he could not read the instructions on his medication bottle. (I have altered several key aspects of my patients’ stories to protect their confidentiality.)
However, until I read that suicide was responsible for 15% of deaths with external causes among patients with fetal alcohol syndrome – patients whose life expectancy averages only 34 years – it did not occur to me that affect dysregulation also was likely to lead to suicide attempts among patients with ND-PAE.

When several of us who were working on the issue of suicide prevention while part of the Committee on Psychopathology & Prevention of Adolescent & Adult Suicide produced our report called “Reducing Suicide: A National Perspective” in 2002, the idea that paying attention to fetal environments and birth outcomes could inform the area of suicide prevention was an alien one. Now, it is a serious consideration because this dynamic just might explain part of the complex phenomena of some suicidal behaviors.
Dr. Bell is a staff psychiatrist at Jackson Park Hospital Family Medicine Clinic in Chicago; clinical psychiatrist emeritus in the department of psychiatry at the University of Illinois at Chicago; former president/CEO of Community Mental Health Council; and former director of the Institute for Juvenile Research (birthplace of child psychiatry), also in Chicago.
As psychiatrists, we understand that behavior is complex and determined by multiple factors. However, despite our understanding that behavior is cultural, sociological, psychological, and biological, we often lose sight of the biological perspective because the brain is such a complex organ and because we are inundated with psychological theories of behavior. As I have said before, we cannot abdicate our role of being biologists in the reflection of mental health and wellness.
Accordingly, I feel it is my duty to bring our attention to a biologic etiology of suicidal behavior. I came across an article on the life expectancy of individuals afflicted with fetal alcohol syndrome in the Journal of Population Therapeutics and Clinical Pharmacology (2016;23[1]:e53-9). The findings were astonishing. As it turns out, the life expectancy of people with fetal alcohol syndrome is 34 years of age on average, and the leading causes of death were “external causes,” which accounted for 44% of the deaths. Suicide was responsible for 15% of those deaths, accidents for 14%, poisoning by illegal drugs or alcohol for 7%, and other external causes for another 7%, according to the article.
While working in a general hospital in a low-income African American environment where there are high rates of fetal alcohol exposure, I see at least 3-4 suicide attempts a week on the medical-surgical/psychiatric inpatient units where I serve. I am always looking for patients who have ND-PAE because determining such a diagnosis is critical to those patients’ medical-surgical care. For example, there was one woman with ND-PAE who had operable breast carcinoma but did not come in for a return visit until after her carcinoma had become inoperable (she forgot how important it was to get timely treatment). There was a patient who always had out-of-control diabetes because he did not know how to use his glucometer. There was a patient who was taking his antipsychotic medication during the day instead of as prescribed – at bedtime – because he could not read the instructions on his medication bottle. (I have altered several key aspects of my patients’ stories to protect their confidentiality.)
However, until I read that suicide was responsible for 15% of deaths with external causes among patients with fetal alcohol syndrome – patients whose life expectancy averages only 34 years – it did not occur to me that affect dysregulation also was likely to lead to suicide attempts among patients with ND-PAE.
When several of us who were working on the issue of suicide prevention while part of the Committee on Psychopathology & Prevention of Adolescent & Adult Suicide produced our report called “Reducing Suicide: A National Perspective” in 2002, the idea that paying attention to fetal environments and birth outcomes could inform the area of suicide prevention was an alien one. Now, it is a serious consideration because this dynamic just might explain part of the complex phenomena of some suicidal behaviors.
Dr. Bell is a staff psychiatrist at Jackson Park Hospital Family Medicine Clinic in Chicago; clinical psychiatrist emeritus in the department of psychiatry at the University of Illinois at Chicago; former president/CEO of Community Mental Health Council; and former director of the Institute for Juvenile Research (birthplace of child psychiatry), also in Chicago.
Pertuzumab approved for HER2-positive breast cancer
, according to the Food and Drug Administration.
The approval was based on results from the APHINITY trial, which included 4,804 patients who had HER2-positive early breast cancers that were excised prior to the study. After a median follow-up period of 45.4 months, an invasive disease event occurred in 7.1% of all patients who received pertuzumab (Perjeta) and in 8.7% of patients who received placebo. In patients with hormone receptor–negative disease, invasive events occurred in 8.2% of the pertuzumab group and in 10.6% of the placebo group. In patients with node-positive disease, the invasive event rate was 9.2% in the pertuzumab group and 12.1% in the placebo group.

“The initial pertuzumab dose is 840 mg administered as a 60-minute intravenous infusion, followed every 3 weeks thereafter by 420 mg administered as a 30- to 60-minute intravenous infusion,” the FDA said in the statement.
Find the full statement on the FDA website.
, according to the Food and Drug Administration.
The approval was based on results from the APHINITY trial, which included 4,804 patients who had HER2-positive early breast cancers that were excised prior to the study. After a median follow-up period of 45.4 months, an invasive disease event occurred in 7.1% of all patients who received pertuzumab (Perjeta) and in 8.7% of patients who received placebo. In patients with hormone receptor–negative disease, invasive events occurred in 8.2% of the pertuzumab group and in 10.6% of the placebo group. In patients with node-positive disease, the invasive event rate was 9.2% in the pertuzumab group and 12.1% in the placebo group.
“The initial pertuzumab dose is 840 mg administered as a 60-minute intravenous infusion, followed every 3 weeks thereafter by 420 mg administered as a 30- to 60-minute intravenous infusion,” the FDA said in the statement.
Find the full statement on the FDA website.
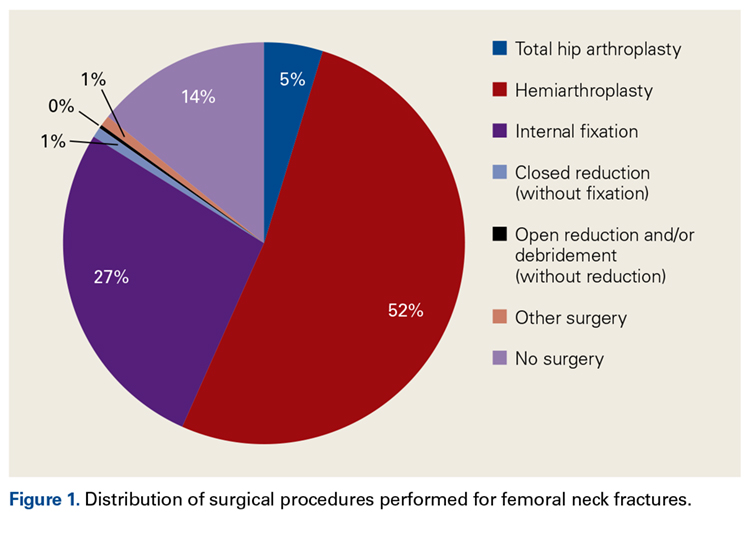
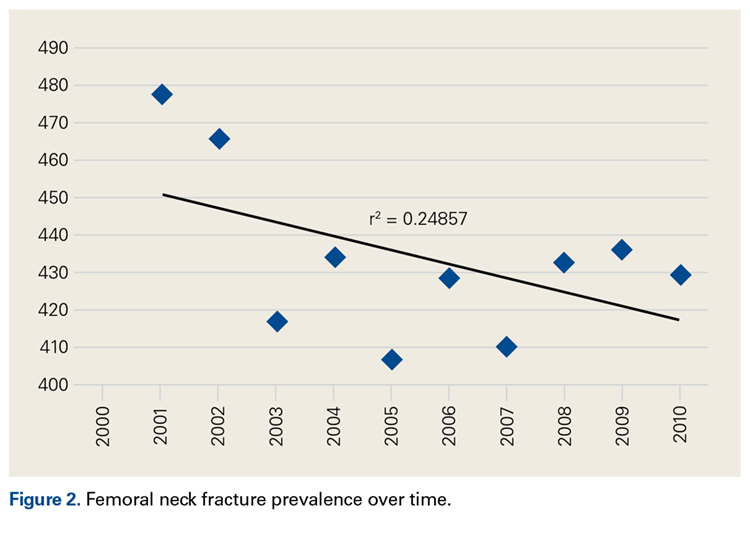
Total Hip Arthroplasty and Hemiarthroplasty: US National Trends in the Treatment of Femoral Neck Fractures
Take-Home Points
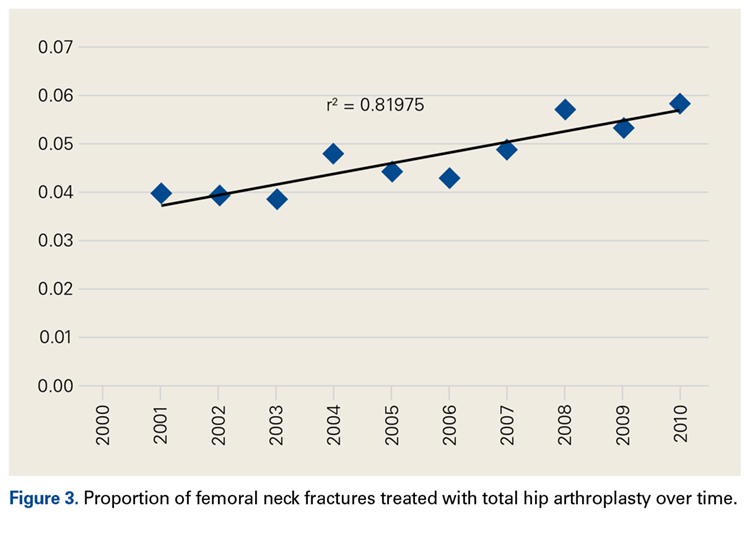
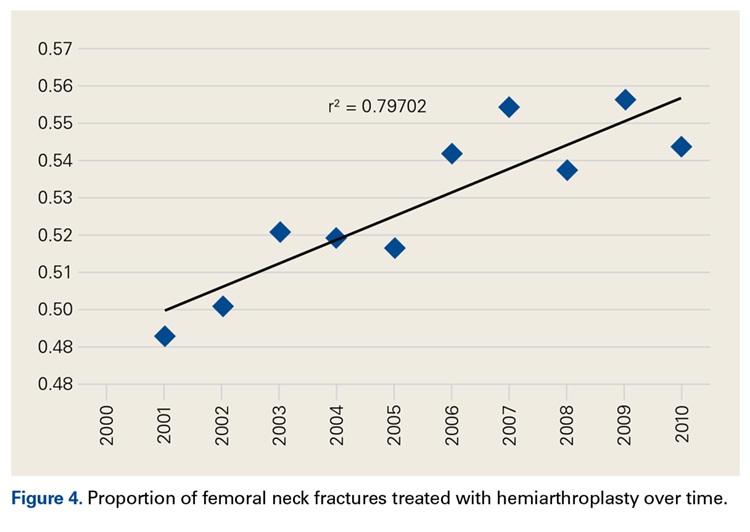
- An increasing number of THAs and HAs were performed over time for FNF.
- HA patients tended to be older.
- Hospitalization and blood transfusion rates were higher for THA.
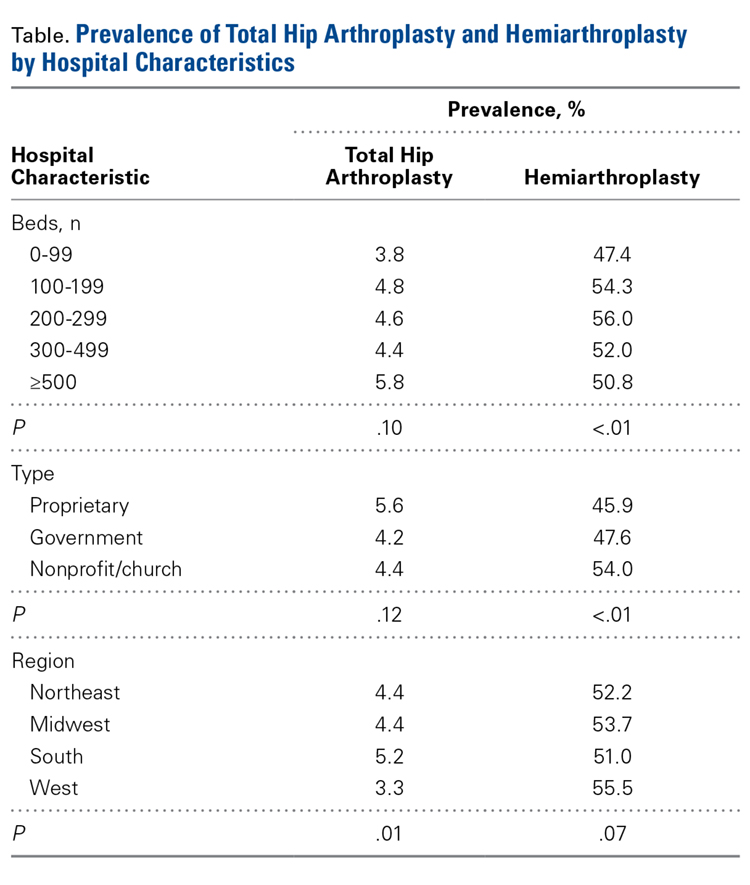
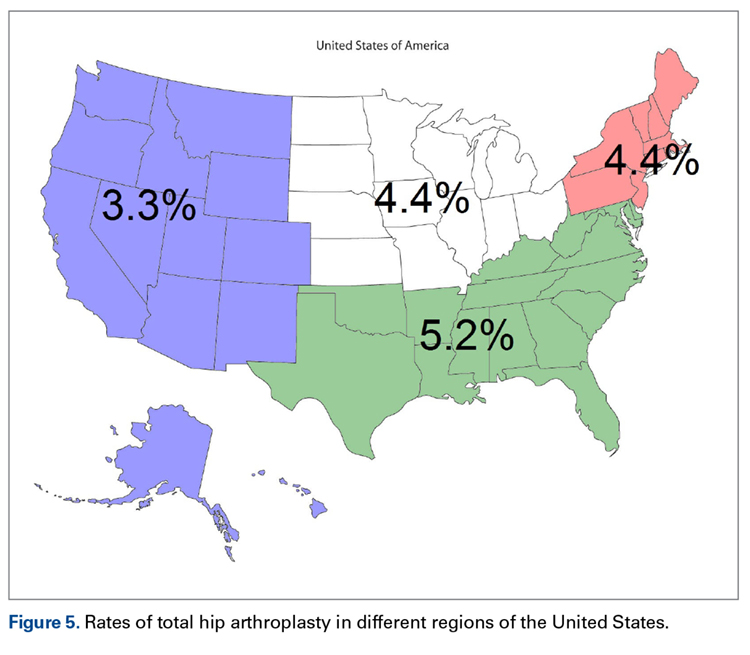
- Hospital size affected the rate of HAs, while hospital location affected the rate of THAs.
- A larger proportion of THA patients had private insurance.
Femoral neck fractures (FNFs) are a common source of morbidity and mortality worldwide. The increasing number of FNFs in the United States is attributed to increases in number of US residents >65 years old, the average life span, and the incidence of osteoporosis.1 Three hundred forty thousand hip fractures occurred in the United States in 1996, and the number is expected to double by 2050.2 By that year, an estimated 6.3 million hip fractures will occur worldwide.3 Given the 1-year mortality rate of 14% to 36%, optimizing the management of these fractures is an important public health issue that must be addressed.4
Treatment is based on preoperative ambulatory status, cognitive function, comorbidities, fracture type and displacement, and other factors. In physiologically elderly patients with displaced fractures, surgical treatment usually involves either hemiarthroplasty (HA) or total hip arthroplasty (THA). There is controversy regarding which modality is the preferred treatment.
Proponents of HA point to a higher rate of dislocation for FNFs treated with THAs,5,6 attributed to increased range of motion.7 Proponents of THA point to superior short-term clinical results and fewer complications, especially in mobile, independent patients.8
We conducted a study to assess recent US national trends in performing THA and HA for FNFs and to evaluate perioperative outcomes for each treatment group.
Materials and Methods
Data for this study were obtained from the National Center for Health Statistics (NCHS) National Hospital Discharge Survey (NHDS) and were imported into Microsoft Office Excel 2010.9 The NHDS examines patient discharges from various hospitals across the US, including federal, military, and Veterans Administration hospitals.9 Only short-stay hospitals (mean stay, <30 days) and hospitals with a general specialty are included in the survey. Each year, about 1% of all hospital admissions from across the US are abstracted and weighted to provide nationwide estimates. The information collected from each hospital record includes age, sex, race, marital status, discharge month, discharge status, days of care, hospital location, hospital size (number of beds), hospital type (proprietary or for-profit, government, nonprofit/church), and up to 15 discharge diagnoses and 8 procedures performed during admission.9
International Classification of Diseases, Ninth Revision (ICD-9) procedure codes were used to search the NHDS for patients admitted after FNF for each year from 2001 through 2010. These codes were then used to identify patients within this group who underwent THA or HA. We also collected data on patient demographics, hospitalization duration, discharge disposition, in-hospital adverse events (deep vein thrombosis [DVT], pulmonary embolism [PE], blood transfusion, mortality), form of primary medical insurance, number of hospital beds (0-99, 100-199, 200-299, 300-499, ≥500), hospital type (proprietary, government, nonprofit/church), and hospital region (Northeast, Midwest, South, West).
Trends were evaluated by linear regression with the Pearson correlation coefficient (r). Statistical comparisons were made using the Student t test for continuous data, and both the Fisher exact test and the χ2 test for categorical variables. Significance level was set at P < .05. All analyses were performed with IBM SPSS Statistics 22.
Results
Hospital stay was longer (P < .01) for THA patients (7.7 days; range, 1-312 days) than for HA patients (6.7 days; range, 1-118 days), and blood transfusion rate was higher (P = .02) for THA patients (30.4%) than for HA patients (25.7%), but the groups did not differ in their rates of DVT (THA, 1.2%; HA, 0.80%, P = .50), PE (THA, 0.52%; HA, 0.72%, P = .52), or mortality (THA, 1.8%; HA, 2.9%; P = .16). Discharge disposition varied with surgical status (P < .01): 23.2% of THA patients and 11.6% of HA patients were discharged directly home after their inpatient stay, and 76.8% of THA patients and 88.4% of HA patients were discharged or transferred to a short- or long-term care facility.
Private medical insurance provided coverage for 14.3% of THAs and 9.1% of HAs, and Medicare provided coverage for 80.9% of THAs and 86.0% of HAs (P < .01).
Discussion
The NHDS data showed a preference for HA over THA in the treatment of FNFs and suggested THA was favored for younger, healthier patients while HA was reserved for older patients with more comorbidities. Despite being younger and healthier, the THA group had higher transfusion rates and longer hospitalizations, possibly because of the increased complexity of THA procedures, which generally involve more operative time and increased blood loss. The resultant higher transfusion rate for THAs likely contributed to longer hospitalizations for FNFs. However, the THA and HA groups did not differ in their rates of DVT, PE, or mortality.
Multiple studies have noted no differences in mortality, infection, or general complications between THA and HA for FNF.8,10,11 THA patients have better functional outcomes, including Harris and Oxford hip scores and walking distance, but higher dislocation rates,8,10-12 and HA patients are at higher risk for reoperation because of progressive acetabular erosion.8,10,11
We noted an increase in use of both THA and HA for FNF over the study period (2001-2010). In a review of operative treatment for FNF by surgeons applying for the American Board of Orthopaedic Surgery certification between 1999 and 2011, Miller and colleagues13 found a similar increase in the THA rate over time, but decreases in the HA and internal fixation rates, with candidates in the “adult reconstruction” subspecialty showing a particularly strong trend toward THA use.
These findings reflect a general propensity toward femoral head replacement rather than preservation through open reduction and internal fixation (ORIF). Recent studies have found that ORIF carries a 39% to 43% rate of fixation failure and need for secondary revision, as well as risks of avascular necrosis, malunion, and nonunion.1,14-16 This need for secondary surgery makes ORIF ultimately less cost-effective than either THA or HA.16,17 Most authors would recommend arthroplasty for FNF in elderly patients with normal mental function1,16,18 and would reserve ORIF for young patients with good bone stock, joint space preservation, and reducible noncomminuted fractures.1,19
Our study results suggest that smaller hospitals (<100 beds) tend to have lower rates of HA (P < .01, significant) and THA (P = .10, not significant; Table), possibly because FNF patients who present to these hospitals may be referred elsewhere because of regional differences in the availability of orthopedic traumatologists and arthroplasty subspecialists. Surgeon volume affects postoperative outcomes and may play a role in referral patterns.20 Ames and colleagues20 found that HA performed for FNF by surgeons with high-volume THA experience (vs non-hip-arthroplasty surgeons) had lower rates of dislocation, superficial infection, and mortality.
Regional differences were significant for THA alone, with the highest THA rates in the South (5.2%) and the lowest in the West (3.3%; Figure 5). There were no clear regional trends for HA. Possible explanations include a propensity toward a more aggressive approach in these regions, increased regional prevalence of acetabular disease, regional surgeon preferences, and regional differences in patient characteristics (eg, increased prevalence of obesity in the South).21
HA rates were highest for nonprofit/church hospitals and lowest for proprietary hospitals, whereas THA rates did not differ by hospital type. Possible explanations include an older, less mobile nonprofit/church patient cohort that is more amenable to HA, and surgeon preference.
THA patients were more likely to be covered by private medical insurance than by Medicare—a finding in agreement with Hochfelder and colleagues,22 who found that, compared with federal insurance and self-pay patients, private insurance patients were 41% more likely to undergo THA than HA or internal fixation for FNF. We think that the age difference between our THA and HA groups contributed to the insurance variability in our study.
Our study had several limitations. It was conducted to examine the rates of THA and HA after FNF, not to survey treatment types, including ORIF and nonoperative management. The NHDS database does not provide information on HA implant type (unipolar, bipolar), use or nonuse of cement with HA, or surgical approach. Surgical approach could influence the rate of postoperative dislocation, an outcome measure that was not examined in this study. Last, the NHDS database tracks admissions and discharges, not patients. When a patient is discharged, collection of information on the patient’s postoperative course stops; a patient who returns even only 1 day later is recorded as a new or unique patient. Therefore, intermediate or long-term outcome information is unavailable, which likely led to an underrepresentation of DVT, PE, and mortality after these THA and HA procedures.
There was a trend toward femoral head replacement rather than ORIF in the treatment of FNF. Cognitively functional and independent elderly patients, and patients with osteoarthritis or rheumatoid arthritis, may benefit from THA, whereas HA may be better suited to cognitively dysfunctional patients.23,24 The NHDS reflects an increasing trend toward arthroplasty over ORIF, but the exact treatment choice is affected by hospital type, size, location and surgeon preference, training, and subspecialization.
1. Macaulay W, Pagnotto MR, Iorio R, Mont MA, Saleh KJ. Displaced femoral neck fractures in the elderly: hemiarthroplasty versus total hip arthroplasty. J Am Acad Orthop Surg. 2006;14(5):287-293.
2. Miyamoto RG, Kaplan KM, Levine BR, Egol KA, Zuckerman JD. Surgical management of hip fractures: an evidence-based review of the literature. I: femoral neck fractures. J Am Acad Orthop Surg. 2008;16(10):596-607.
3. Kannus P, Parkkari J, Sievänen H, Heinonen A, Vuori I, Järvinen M. Epidemiology of hip fractures. Bone. 1996;18(1 suppl):57S-63S.
4. Zuckerman JD. Hip fracture. N Engl J Med. 1996;334(23):1519-1525.
5. Papandrea RF, Froimson MI. Total hip arthroplasty after acute displaced femoral neck fractures. Am J Orthop. 1996;25(2):85-88.
6. Burgers PT, Van Geene AR, Van den Bekerom MP, et al. Total hip arthroplasty versus hemiarthroplasty for displaced femoral neck fractures in the healthy elderly: a meta-analysis and systematic review of randomized trials. Int Orthop. 2012;36(8):1549-1560.
7. Skinner P, Riley D, Ellery J, Beaumont A, Coumine R, Shafighian B. Displaced subcapital fractures of the femur: a prospective randomized comparison of internal fixation, hemiarthroplasty and total hip replacement. Injury. 1989;20(5):291-293.
8. Baker RP, Squires B, Gargan MF, Bannister GC. Total hip arthroplasty and hemiarthroplasty in mobile, independent patients with a displaced intracapsular fracture of the femoral neck. A randomized, controlled trial. J Bone Joint Surg Am. 2006;88(12):2583-2589.
9. Centers for Disease Control and Prevention, National Center for Health Statistics. National Hospital Discharge Survey. http://www.cdc.gov/nchs/nhds/about_nhds.htm. Last updated December 6, 2011. Accessed December 10, 2013.
10. Zi-Sheng A, You-Shui G, Zhi-Zhen J, Ting Y, Chang-Qing Z. Hemiarthroplasty vs primary total hip arthroplasty for displaced fractures of the femoral neck in the elderly: a meta-analysis. J Arthroplasty. 2012;27(4):583-590.
11. Yu L, Wang Y, Chen J. Total hip arthroplasty versus hemiarthroplasty for displaced femoral neck fractures: meta-analysis of randomized trials. Clin Orthop Relat Res. 2012;470(8):2235-2243.
12. Hopley C, Stengel D, Ekkernkamp A, Wich M. Primary total hip arthroplasty versus hemiarthroplasty for displaced intracapsular hip fractures in older patients: systematic review. BMJ. 2010;340:c2332.
13. Miller BJ, Callaghan JJ, Cram P, Karam M, Marsh JL, Noiseux NO. Changing trends in the treatment of femoral neck fractures: a review of the American Board of Orthopaedic Surgery database. J Bone Joint Surg Am. 2014;96(17):e149.
14. Rogmark C, Carlsson A, Johnell O, Sernbo I. A prospective randomised trial of internal fixation versus arthroplasty for displaced fractures of the neck of the femur. Functional outcome for 450 patients at two years. J Bone Joint Surg Br. 2002;84(2):183-188.
15. Bhandari M, Devereaux PJ, Swiontkowski MF, et al. Internal fixation compared with arthroplasty for displaced fractures of the femoral neck. A meta-analysis. J Bone Joint Surg Am. 2003;85(9):1673-1681.
16. Keating JF, Grant A, Masson M, Scott NW, Forbes JF. Randomized comparison of reduction and fixation, bipolar hemiarthroplasty, and total hip arthroplasty. Treatment of displaced intracapsular hip fractures in healthy older patients. J Bone Joint Surg Am. 2006;88(2):249-260.
17. Iorio R, Healy WL, Lemos DW, Appleby D, Lucchesi CA, Saleh KJ. Displaced femoral neck fractures in the elderly: outcomes and cost effectiveness. Clin Orthop Relat Res. 2001;(383):229-242.
18. Johansson T, Jacobsson SA, Ivarsson I, Knutsson A, Wahlström O. Internal fixation versus total hip arthroplasty in the treatment of displaced femoral neck fractures: a prospective randomized study of 100 hips. Acta Orthop Scand. 2000;71(6):597-602.
19. Shah AK, Eissler J, Radomisli T. Algorithms for the treatment of femoral neck fractures. Clin Orthop Relat Res. 2002;(399):28-34.
20. Ames JB, Lurie JD, Tomek IM, Zhou W, Koval KJ. Does surgeon volume for total hip arthroplasty affect outcomes after hemiarthroplasty for femoral neck fracture? Am J Orthop. 2010;39(8):E84-E89.
21. Le A, Judd SE, Allison DB, et al. The geographic distribution of obesity in the US and the potential regional differences in misreporting of obesity. Obesity. 2014;22(1):300-306.
22. Hochfelder JP, Khatib ON, Glait SA, Slover JD. Femoral neck fractures in New York state. Is the rate of THA increasing, and do race or payer influence decision making? J Orthop Trauma. 2014;28(7):422-426.
23. Lowe JA, Crist BD, Bhandari M, Ferguson TA. Optimal treatment of femoral neck fractures according to patient’s physiologic age: an evidence-based review. Orthop Clin North Am. 2010;41(2):157-166.
24. Callaghan JJ, Liu SS, Haidukewych GJ. Subcapital fractures: a changing paradigm. J Bone Joint Surg Br. 2012;94(11 suppl A):19-21.
Take-Home Points
- An increasing number of THAs and HAs were performed over time for FNF.
- HA patients tended to be older.
- Hospitalization and blood transfusion rates were higher for THA.
- Hospital size affected the rate of HAs, while hospital location affected the rate of THAs.
- A larger proportion of THA patients had private insurance.
Femoral neck fractures (FNFs) are a common source of morbidity and mortality worldwide. The increasing number of FNFs in the United States is attributed to increases in number of US residents >65 years old, the average life span, and the incidence of osteoporosis.1 Three hundred forty thousand hip fractures occurred in the United States in 1996, and the number is expected to double by 2050.2 By that year, an estimated 6.3 million hip fractures will occur worldwide.3 Given the 1-year mortality rate of 14% to 36%, optimizing the management of these fractures is an important public health issue that must be addressed.4
Treatment is based on preoperative ambulatory status, cognitive function, comorbidities, fracture type and displacement, and other factors. In physiologically elderly patients with displaced fractures, surgical treatment usually involves either hemiarthroplasty (HA) or total hip arthroplasty (THA). There is controversy regarding which modality is the preferred treatment.
Proponents of HA point to a higher rate of dislocation for FNFs treated with THAs,5,6 attributed to increased range of motion.7 Proponents of THA point to superior short-term clinical results and fewer complications, especially in mobile, independent patients.8
We conducted a study to assess recent US national trends in performing THA and HA for FNFs and to evaluate perioperative outcomes for each treatment group.
Materials and Methods
Data for this study were obtained from the National Center for Health Statistics (NCHS) National Hospital Discharge Survey (NHDS) and were imported into Microsoft Office Excel 2010.9 The NHDS examines patient discharges from various hospitals across the US, including federal, military, and Veterans Administration hospitals.9 Only short-stay hospitals (mean stay, <30 days) and hospitals with a general specialty are included in the survey. Each year, about 1% of all hospital admissions from across the US are abstracted and weighted to provide nationwide estimates. The information collected from each hospital record includes age, sex, race, marital status, discharge month, discharge status, days of care, hospital location, hospital size (number of beds), hospital type (proprietary or for-profit, government, nonprofit/church), and up to 15 discharge diagnoses and 8 procedures performed during admission.9
International Classification of Diseases, Ninth Revision (ICD-9) procedure codes were used to search the NHDS for patients admitted after FNF for each year from 2001 through 2010. These codes were then used to identify patients within this group who underwent THA or HA. We also collected data on patient demographics, hospitalization duration, discharge disposition, in-hospital adverse events (deep vein thrombosis [DVT], pulmonary embolism [PE], blood transfusion, mortality), form of primary medical insurance, number of hospital beds (0-99, 100-199, 200-299, 300-499, ≥500), hospital type (proprietary, government, nonprofit/church), and hospital region (Northeast, Midwest, South, West).
Trends were evaluated by linear regression with the Pearson correlation coefficient (r). Statistical comparisons were made using the Student t test for continuous data, and both the Fisher exact test and the χ2 test for categorical variables. Significance level was set at P < .05. All analyses were performed with IBM SPSS Statistics 22.
Results
Hospital stay was longer (P < .01) for THA patients (7.7 days; range, 1-312 days) than for HA patients (6.7 days; range, 1-118 days), and blood transfusion rate was higher (P = .02) for THA patients (30.4%) than for HA patients (25.7%), but the groups did not differ in their rates of DVT (THA, 1.2%; HA, 0.80%, P = .50), PE (THA, 0.52%; HA, 0.72%, P = .52), or mortality (THA, 1.8%; HA, 2.9%; P = .16). Discharge disposition varied with surgical status (P < .01): 23.2% of THA patients and 11.6% of HA patients were discharged directly home after their inpatient stay, and 76.8% of THA patients and 88.4% of HA patients were discharged or transferred to a short- or long-term care facility.
Private medical insurance provided coverage for 14.3% of THAs and 9.1% of HAs, and Medicare provided coverage for 80.9% of THAs and 86.0% of HAs (P < .01).
Discussion
The NHDS data showed a preference for HA over THA in the treatment of FNFs and suggested THA was favored for younger, healthier patients while HA was reserved for older patients with more comorbidities. Despite being younger and healthier, the THA group had higher transfusion rates and longer hospitalizations, possibly because of the increased complexity of THA procedures, which generally involve more operative time and increased blood loss. The resultant higher transfusion rate for THAs likely contributed to longer hospitalizations for FNFs. However, the THA and HA groups did not differ in their rates of DVT, PE, or mortality.
Multiple studies have noted no differences in mortality, infection, or general complications between THA and HA for FNF.8,10,11 THA patients have better functional outcomes, including Harris and Oxford hip scores and walking distance, but higher dislocation rates,8,10-12 and HA patients are at higher risk for reoperation because of progressive acetabular erosion.8,10,11
We noted an increase in use of both THA and HA for FNF over the study period (2001-2010). In a review of operative treatment for FNF by surgeons applying for the American Board of Orthopaedic Surgery certification between 1999 and 2011, Miller and colleagues13 found a similar increase in the THA rate over time, but decreases in the HA and internal fixation rates, with candidates in the “adult reconstruction” subspecialty showing a particularly strong trend toward THA use.
These findings reflect a general propensity toward femoral head replacement rather than preservation through open reduction and internal fixation (ORIF). Recent studies have found that ORIF carries a 39% to 43% rate of fixation failure and need for secondary revision, as well as risks of avascular necrosis, malunion, and nonunion.1,14-16 This need for secondary surgery makes ORIF ultimately less cost-effective than either THA or HA.16,17 Most authors would recommend arthroplasty for FNF in elderly patients with normal mental function1,16,18 and would reserve ORIF for young patients with good bone stock, joint space preservation, and reducible noncomminuted fractures.1,19
Our study results suggest that smaller hospitals (<100 beds) tend to have lower rates of HA (P < .01, significant) and THA (P = .10, not significant; Table), possibly because FNF patients who present to these hospitals may be referred elsewhere because of regional differences in the availability of orthopedic traumatologists and arthroplasty subspecialists. Surgeon volume affects postoperative outcomes and may play a role in referral patterns.20 Ames and colleagues20 found that HA performed for FNF by surgeons with high-volume THA experience (vs non-hip-arthroplasty surgeons) had lower rates of dislocation, superficial infection, and mortality.
Regional differences were significant for THA alone, with the highest THA rates in the South (5.2%) and the lowest in the West (3.3%; Figure 5). There were no clear regional trends for HA. Possible explanations include a propensity toward a more aggressive approach in these regions, increased regional prevalence of acetabular disease, regional surgeon preferences, and regional differences in patient characteristics (eg, increased prevalence of obesity in the South).21
HA rates were highest for nonprofit/church hospitals and lowest for proprietary hospitals, whereas THA rates did not differ by hospital type. Possible explanations include an older, less mobile nonprofit/church patient cohort that is more amenable to HA, and surgeon preference.
THA patients were more likely to be covered by private medical insurance than by Medicare—a finding in agreement with Hochfelder and colleagues,22 who found that, compared with federal insurance and self-pay patients, private insurance patients were 41% more likely to undergo THA than HA or internal fixation for FNF. We think that the age difference between our THA and HA groups contributed to the insurance variability in our study.
Our study had several limitations. It was conducted to examine the rates of THA and HA after FNF, not to survey treatment types, including ORIF and nonoperative management. The NHDS database does not provide information on HA implant type (unipolar, bipolar), use or nonuse of cement with HA, or surgical approach. Surgical approach could influence the rate of postoperative dislocation, an outcome measure that was not examined in this study. Last, the NHDS database tracks admissions and discharges, not patients. When a patient is discharged, collection of information on the patient’s postoperative course stops; a patient who returns even only 1 day later is recorded as a new or unique patient. Therefore, intermediate or long-term outcome information is unavailable, which likely led to an underrepresentation of DVT, PE, and mortality after these THA and HA procedures.
There was a trend toward femoral head replacement rather than ORIF in the treatment of FNF. Cognitively functional and independent elderly patients, and patients with osteoarthritis or rheumatoid arthritis, may benefit from THA, whereas HA may be better suited to cognitively dysfunctional patients.23,24 The NHDS reflects an increasing trend toward arthroplasty over ORIF, but the exact treatment choice is affected by hospital type, size, location and surgeon preference, training, and subspecialization.
1. Macaulay W, Pagnotto MR, Iorio R, Mont MA, Saleh KJ. Displaced femoral neck fractures in the elderly: hemiarthroplasty versus total hip arthroplasty. J Am Acad Orthop Surg. 2006;14(5):287-293.
2. Miyamoto RG, Kaplan KM, Levine BR, Egol KA, Zuckerman JD. Surgical management of hip fractures: an evidence-based review of the literature. I: femoral neck fractures. J Am Acad Orthop Surg. 2008;16(10):596-607.
3. Kannus P, Parkkari J, Sievänen H, Heinonen A, Vuori I, Järvinen M. Epidemiology of hip fractures. Bone. 1996;18(1 suppl):57S-63S.
4. Zuckerman JD. Hip fracture. N Engl J Med. 1996;334(23):1519-1525.
5. Papandrea RF, Froimson MI. Total hip arthroplasty after acute displaced femoral neck fractures. Am J Orthop. 1996;25(2):85-88.
6. Burgers PT, Van Geene AR, Van den Bekerom MP, et al. Total hip arthroplasty versus hemiarthroplasty for displaced femoral neck fractures in the healthy elderly: a meta-analysis and systematic review of randomized trials. Int Orthop. 2012;36(8):1549-1560.
7. Skinner P, Riley D, Ellery J, Beaumont A, Coumine R, Shafighian B. Displaced subcapital fractures of the femur: a prospective randomized comparison of internal fixation, hemiarthroplasty and total hip replacement. Injury. 1989;20(5):291-293.
8. Baker RP, Squires B, Gargan MF, Bannister GC. Total hip arthroplasty and hemiarthroplasty in mobile, independent patients with a displaced intracapsular fracture of the femoral neck. A randomized, controlled trial. J Bone Joint Surg Am. 2006;88(12):2583-2589.
9. Centers for Disease Control and Prevention, National Center for Health Statistics. National Hospital Discharge Survey. http://www.cdc.gov/nchs/nhds/about_nhds.htm. Last updated December 6, 2011. Accessed December 10, 2013.
10. Zi-Sheng A, You-Shui G, Zhi-Zhen J, Ting Y, Chang-Qing Z. Hemiarthroplasty vs primary total hip arthroplasty for displaced fractures of the femoral neck in the elderly: a meta-analysis. J Arthroplasty. 2012;27(4):583-590.
11. Yu L, Wang Y, Chen J. Total hip arthroplasty versus hemiarthroplasty for displaced femoral neck fractures: meta-analysis of randomized trials. Clin Orthop Relat Res. 2012;470(8):2235-2243.
12. Hopley C, Stengel D, Ekkernkamp A, Wich M. Primary total hip arthroplasty versus hemiarthroplasty for displaced intracapsular hip fractures in older patients: systematic review. BMJ. 2010;340:c2332.
13. Miller BJ, Callaghan JJ, Cram P, Karam M, Marsh JL, Noiseux NO. Changing trends in the treatment of femoral neck fractures: a review of the American Board of Orthopaedic Surgery database. J Bone Joint Surg Am. 2014;96(17):e149.
14. Rogmark C, Carlsson A, Johnell O, Sernbo I. A prospective randomised trial of internal fixation versus arthroplasty for displaced fractures of the neck of the femur. Functional outcome for 450 patients at two years. J Bone Joint Surg Br. 2002;84(2):183-188.
15. Bhandari M, Devereaux PJ, Swiontkowski MF, et al. Internal fixation compared with arthroplasty for displaced fractures of the femoral neck. A meta-analysis. J Bone Joint Surg Am. 2003;85(9):1673-1681.
16. Keating JF, Grant A, Masson M, Scott NW, Forbes JF. Randomized comparison of reduction and fixation, bipolar hemiarthroplasty, and total hip arthroplasty. Treatment of displaced intracapsular hip fractures in healthy older patients. J Bone Joint Surg Am. 2006;88(2):249-260.
17. Iorio R, Healy WL, Lemos DW, Appleby D, Lucchesi CA, Saleh KJ. Displaced femoral neck fractures in the elderly: outcomes and cost effectiveness. Clin Orthop Relat Res. 2001;(383):229-242.
18. Johansson T, Jacobsson SA, Ivarsson I, Knutsson A, Wahlström O. Internal fixation versus total hip arthroplasty in the treatment of displaced femoral neck fractures: a prospective randomized study of 100 hips. Acta Orthop Scand. 2000;71(6):597-602.
19. Shah AK, Eissler J, Radomisli T. Algorithms for the treatment of femoral neck fractures. Clin Orthop Relat Res. 2002;(399):28-34.
20. Ames JB, Lurie JD, Tomek IM, Zhou W, Koval KJ. Does surgeon volume for total hip arthroplasty affect outcomes after hemiarthroplasty for femoral neck fracture? Am J Orthop. 2010;39(8):E84-E89.
21. Le A, Judd SE, Allison DB, et al. The geographic distribution of obesity in the US and the potential regional differences in misreporting of obesity. Obesity. 2014;22(1):300-306.
22. Hochfelder JP, Khatib ON, Glait SA, Slover JD. Femoral neck fractures in New York state. Is the rate of THA increasing, and do race or payer influence decision making? J Orthop Trauma. 2014;28(7):422-426.
23. Lowe JA, Crist BD, Bhandari M, Ferguson TA. Optimal treatment of femoral neck fractures according to patient’s physiologic age: an evidence-based review. Orthop Clin North Am. 2010;41(2):157-166.
24. Callaghan JJ, Liu SS, Haidukewych GJ. Subcapital fractures: a changing paradigm. J Bone Joint Surg Br. 2012;94(11 suppl A):19-21.
FDA approves angiotensin II for shock patients
Angiotensin II has been approved for use in intravenous infusions to increase blood pressure in adults with septic or other distributive shock, the Food and Drug Administration announced.
Shock-related drops in blood pressure can restrict blood flow to vital organs and can result in organ failure and death. “There is a need for treatment options for critically ill hypotensive patients who do not adequately respond to available therapies,” Norman Stockbridge, MD, PhD, director of the division of cardiovascular and renal products in the FDA’s Center for Drug Evaluation and Research, said in a written statement.
The effectiveness of angiotensin II for treating critically low blood pressure was confirmed in a clinical trial of 321 patients who were in shock. A significant number of patients responded to angiotensin II treatment, compared with those given placebo. In combination with conventional treatments, angiotensin II increased blood pressure safely and effectively, according to the FDA statement.
Angiotensin II can cause serious blood clots, and prophylactic treatment for such issues is recommended.
The application for angiontensin II was received under Priority Review. The goal of Priority Review is for the FDA to take action on the application within 6 months if the agency determines that an approved drug would improve the safety and effectiveness of treating a serious medical condition.
Angiotensin II injections will be marketed as Giapreza by La Jolla Pharmaceutical Company.